Fairfax County Youth Survey School Year 2014-2015: Depression, Suicide and Unhealthy Weight Loss...
46
Fairfax County 2014 Youth Survey Updated October 2015 Fairfax County Youth Survey School Year 2014-2015 Depression, Suicide and Unhealthy Weight Loss Behaviors
-
Upload
fairfax-county -
Category
News & Politics
-
view
1.250 -
download
0
Transcript of Fairfax County Youth Survey School Year 2014-2015: Depression, Suicide and Unhealthy Weight Loss...
Fairfax County 2014 Youth Survey
Updated October 2015
Fairfax County Youth SurveySchool Year 2014-2015
Depression, Suicide and
Unhealthy Weight Loss Behaviors
Fairfax County 2014 Youth Survey
2
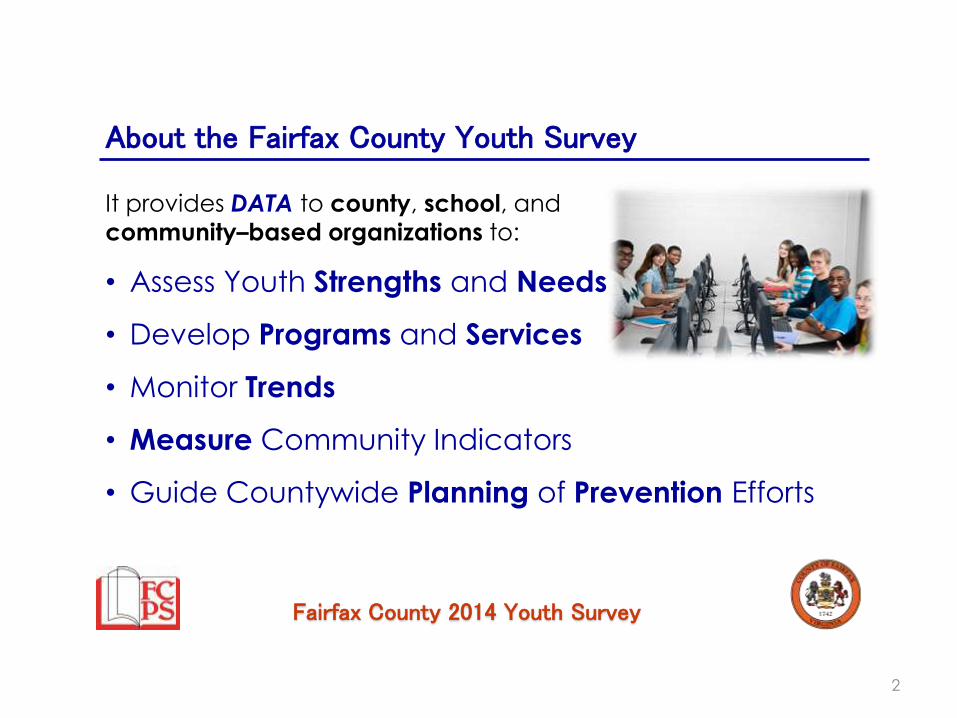
It provides DATA to county, school, and
community–based organizations to:
• Assess Youth Strengths and Needs
• Develop Programs and Services
• Monitor Trends
• Measure Community Indicators
• Guide Countywide Planning of Prevention Efforts
About the Fairfax County Youth Survey
Fairfax County 2014 Youth Survey
3
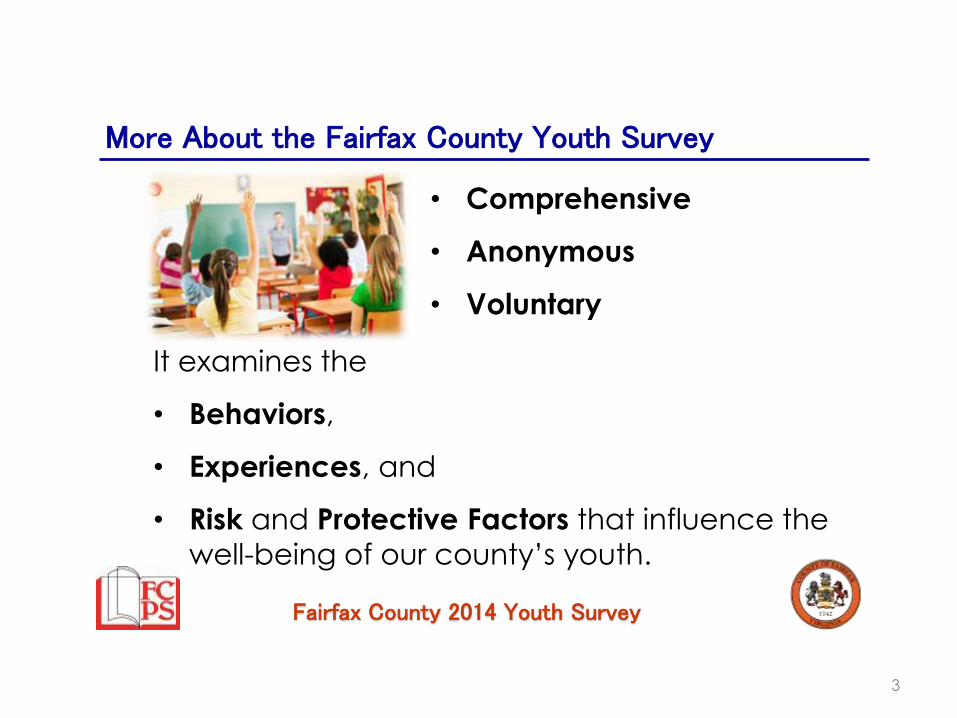
• Comprehensive
• Anonymous
• Voluntary
More About the Fairfax County Youth Survey
It examines the
• Behaviors,
• Experiences, and
• Risk and Protective Factors that influence the
well-being of our county’s youth.
Fairfax County 2014 Youth Survey
4
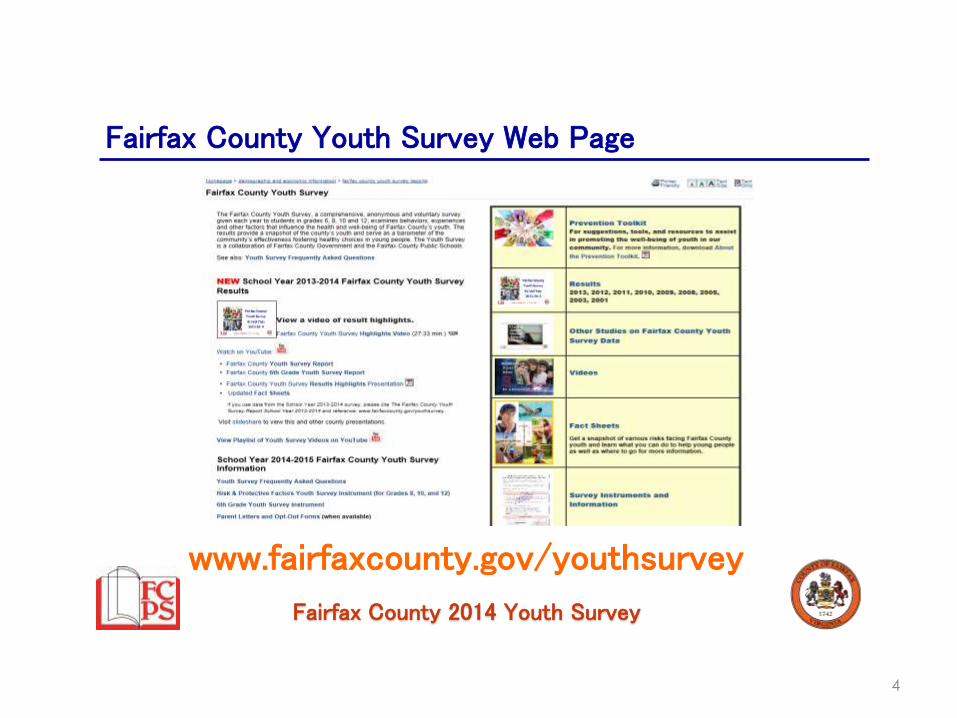
Fairfax County Youth Survey Web Page
www.fairfaxcounty.gov/youthsurvey
Fairfax County 2014 Youth Survey
5
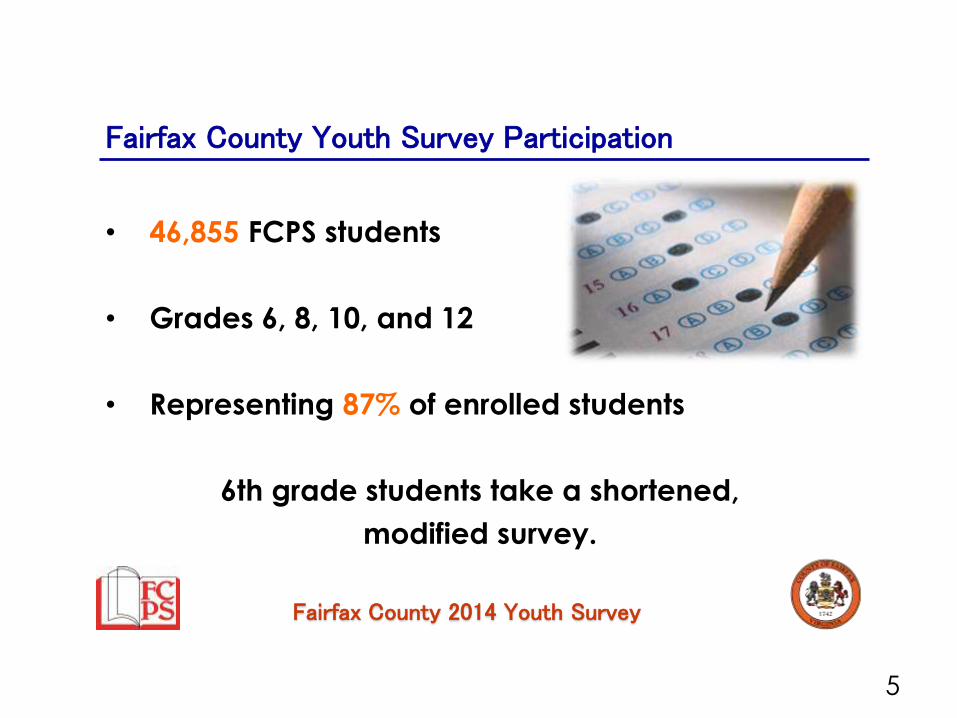
Fairfax County Youth Survey Participation
• 46,855 FCPS students
• Grades 6, 8, 10, and 12
• Representing 87% of enrolled students
6th grade students take a shortened,
modified survey.
Fairfax County 2014 Youth Survey
Three to Succeed
Fairfax County 2014 Youth Survey
7
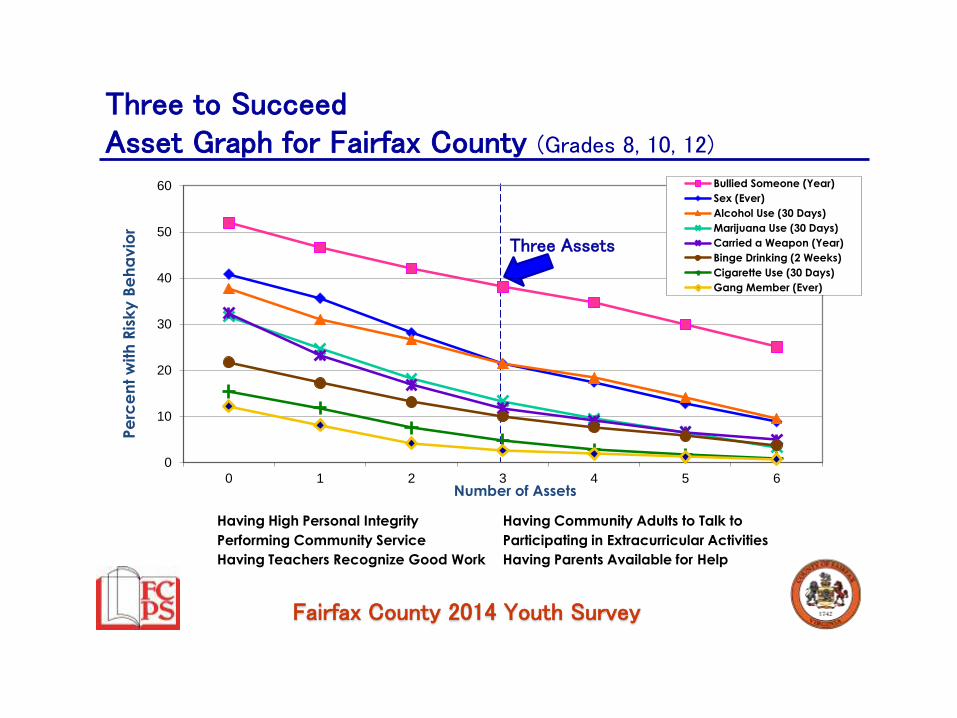
Three to Succeed
The Three to Succeed concept is based on the youth
survey analysis that shows how just having three assets (or
strengths) dramatically reduces risk behaviors and
promotes thriving youth.
Assets are strengths in young people, their families, schools
and communities that help them thrive in health, in school
and daily life, and in a safe environment. The more assets
an individual has in their lives, the fewer risk behaviors are
reported.
Fairfax County 2014 Youth Survey
Having High Personal Integrity
Performing Community Service
Having Teachers Recognize Good Work
Having Community Adults to Talk to
Participating in Extracurricular Activities
Having Parents Available for Help
Three to SucceedAsset Graph for Fairfax County (Grades 8, 10, 12)
Three Assets
0
10
20
30
40
50
60
0 1 2 3 4 5 6
Pe
rce
nt
with
Ris
ky
Be
ha
vio
r
Number of Assets
Bullied Someone (Year)
Sex (Ever)
Alcohol Use (30 Days)
Marijuana Use (30 Days)
Carried a Weapon (Year)
Binge Drinking (2 Weeks)
Cigarette Use (30 Days)
Gang Member (Ever)
Fairfax County 2014 Youth Survey
Mental Health:Depression, Suicide and Unhealthy Weight LossSurvey Questions and Results
Fairfax County 2014 Youth Survey
10
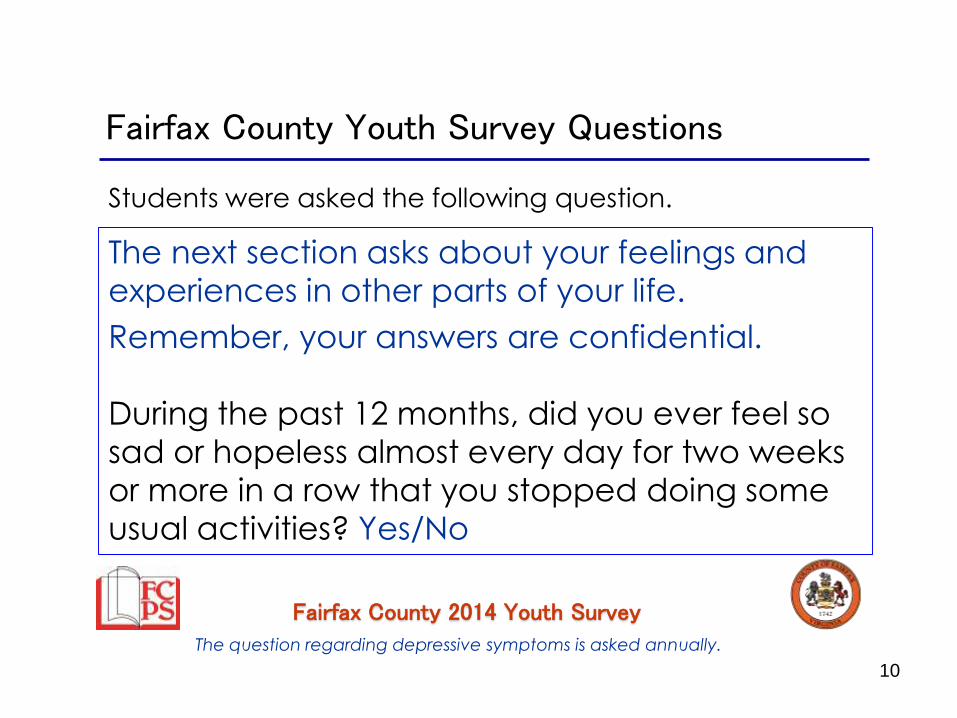
Students were asked the following question.
Fairfax County Youth Survey Questions
The next section asks about your feelings and
experiences in other parts of your life.
Remember, your answers are confidential.
During the past 12 months, did you ever feel so
sad or hopeless almost every day for two weeks
or more in a row that you stopped doing some
usual activities? Yes/No
The question regarding depressive symptoms is asked annually.
10
Fairfax County 2014 Youth Survey
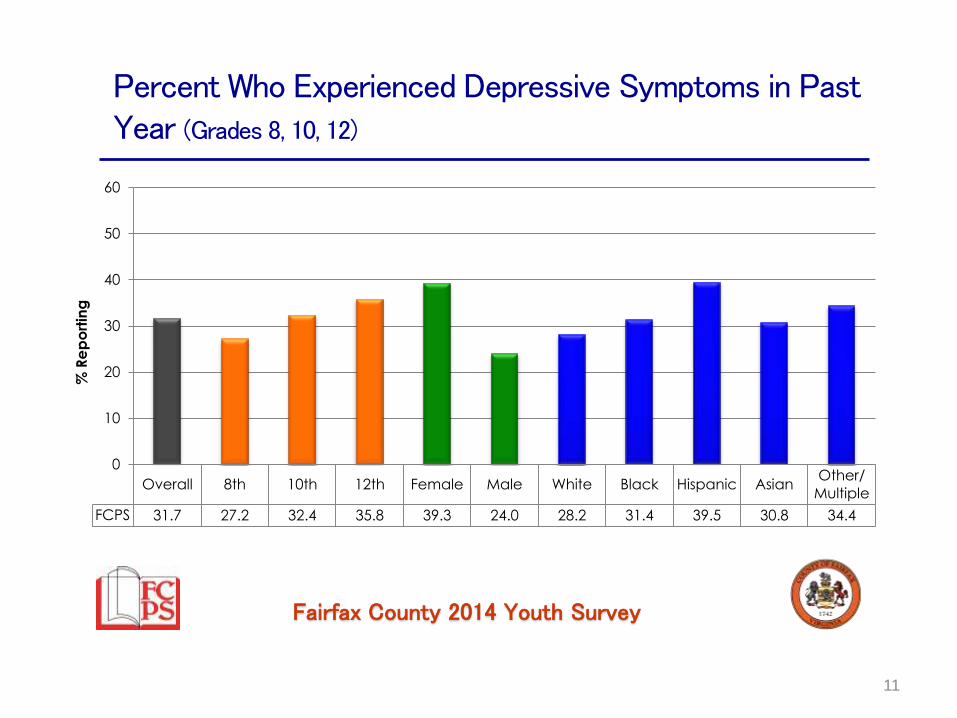
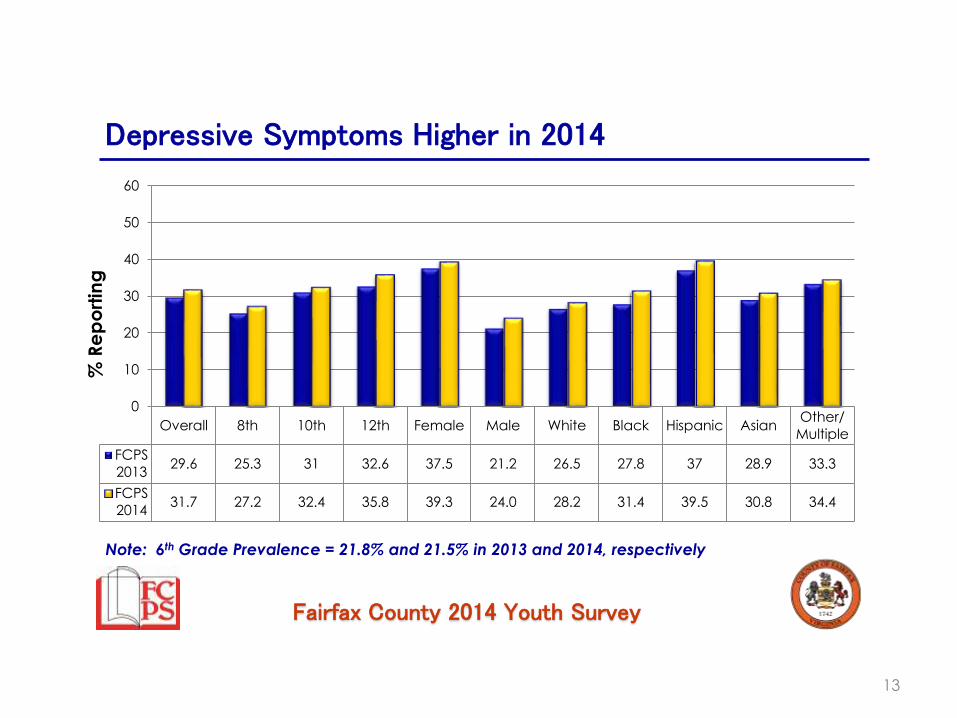
Percent Who Experienced Depressive Symptoms in Past Year (Grades 8, 10, 12)
11
Overall 8th 10th 12th Female Male White Black Hispanic AsianOther/
Multiple
FCPS 31.7 27.2 32.4 35.8 39.3 24.0 28.2 31.4 39.5 30.8 34.4
0
10
20
30
40
50
60
% R
ep
ort
ing
Fairfax County 2014 Youth Survey
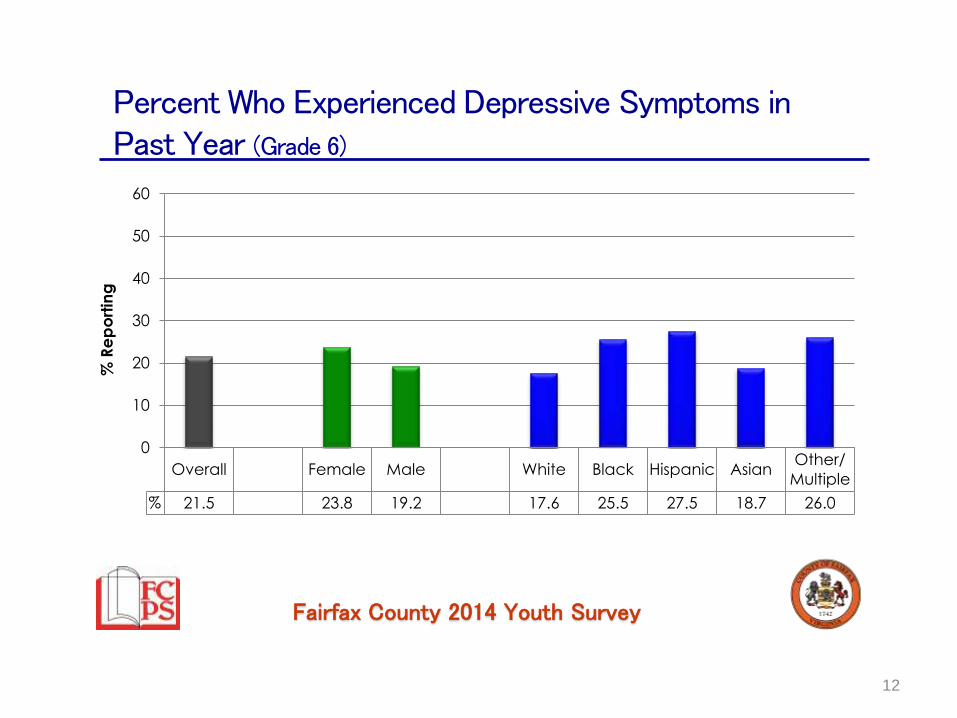
Percent Who Experienced Depressive Symptoms in Past Year (Grade 6)
12
Overall Female Male White Black Hispanic AsianOther/
Multiple
% 21.5 23.8 19.2 17.6 25.5 27.5 18.7 26.0
0
10
20
30
40
50
60
% R
ep
ort
ing
Fairfax County 2014 Youth Survey
Overall 8th 10th 12th Female Male White Black Hispanic AsianOther/
Multiple
FCPS
201329.6 25.3 31 32.6 37.5 21.2 26.5 27.8 37 28.9 33.3
FCPS
201431.7 27.2 32.4 35.8 39.3 24.0 28.2 31.4 39.5 30.8 34.4
0
10
20
30
40
50
60
% R
ep
ort
ing
13
Depressive Symptoms Higher in 2014
Note: 6th Grade Prevalence = 21.8% and 21.5% in 2013 and 2014, respectively
Fairfax County 2014 Youth Survey
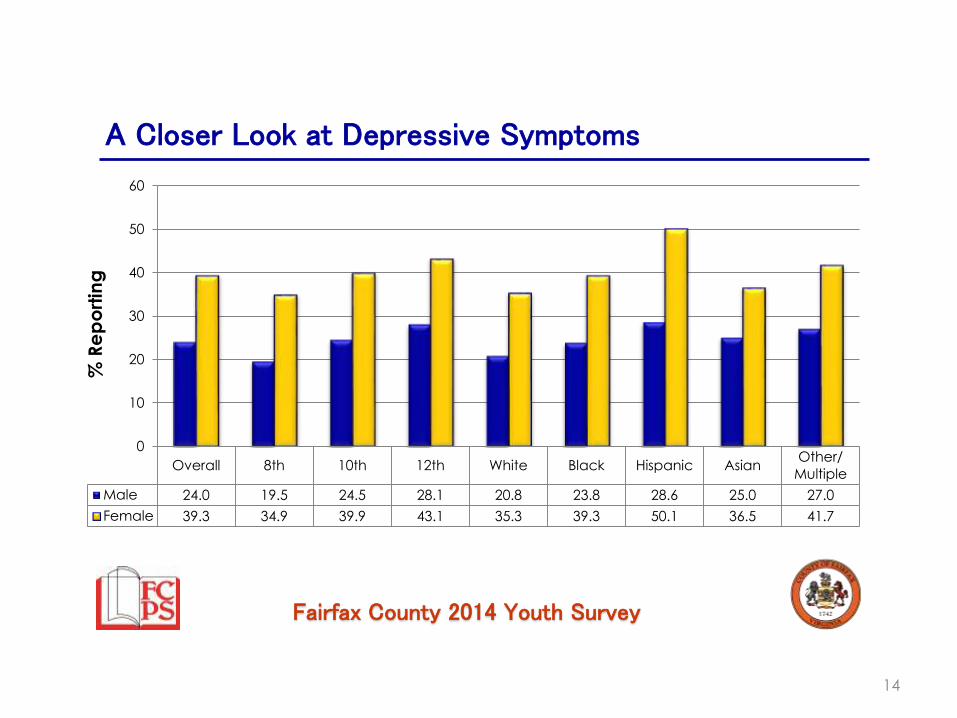
Overall 8th 10th 12th White Black Hispanic AsianOther/
Multiple
Male 24.0 19.5 24.5 28.1 20.8 23.8 28.6 25.0 27.0
Female 39.3 34.9 39.9 43.1 35.3 39.3 50.1 36.5 41.7
0
10
20
30
40
50
60
% R
ep
ort
ing
14
A Closer Look at Depressive Symptoms
Fairfax County 2014 Youth Survey
15
Fairfax County Youth Survey Questions
The next section asks about your feelings during the past 12
months.
Remember, your answers are confidential.
During the past 12 months, did you ever:
… seriously consider attempting suicide? Yes/No
… actually attempt suicide? Yes/No
The questions regarding suicide are asked biennially, and were not asked
on the 2014 survey. 15
On the 2013 Fairfax County Youth Survey, students were asked questions regarding suicide. These questions are only asked in odd years to keep
the survey at a length that can be completed during one class period
and to coincide with the administration of the YRBS to obtain a national
comparison.
Fairfax County 2014 Youth Survey
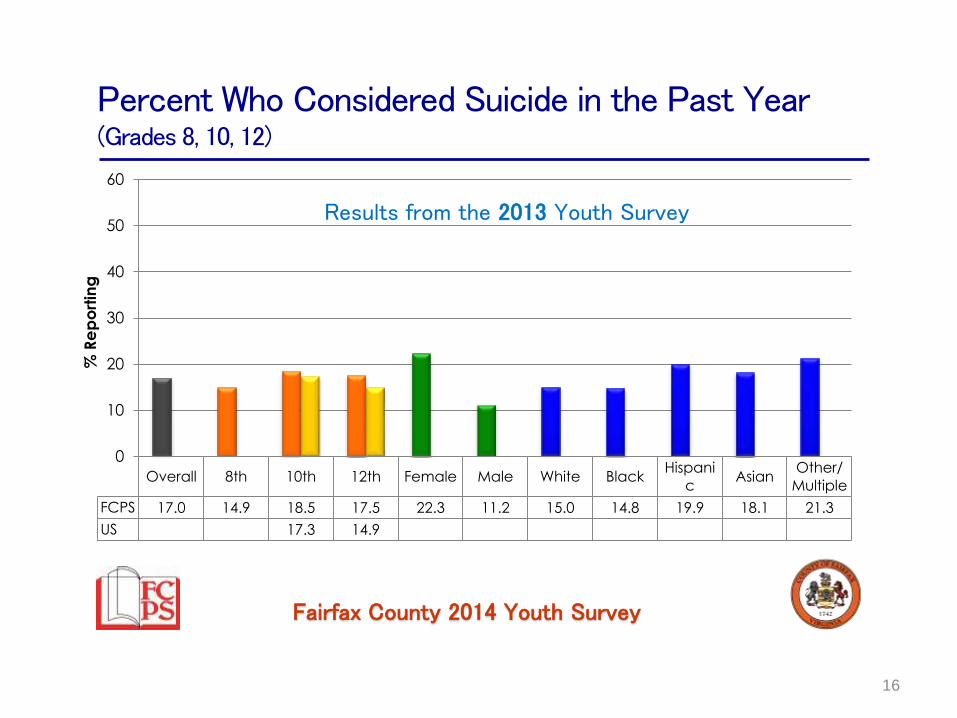
Percent Who Considered Suicide in the Past Year(Grades 8, 10, 12)
16
Overall 8th 10th 12th Female Male White BlackHispani
cAsian
Other/
Multiple
FCPS 17.0 14.9 18.5 17.5 22.3 11.2 15.0 14.8 19.9 18.1 21.3
US 17.3 14.9
0
10
20
30
40
50
60
% R
ep
ort
ing
Results from the 2013 Youth Survey

Fairfax County 2014 Youth Survey
Percent Who Attempted Suicide in the Past Year(Grades 8, 10, 12)
17
Overall 8th 10th 12th Female Male White BlackHispani
cAsian
Other/
Multiple
FCPS 4.4 3.8 4.8 4.6 6.3 2.4 3.6 3.6 7.0 3.8 5.5
US 8.6 6.2
0
10
20
30
40
50
60
% R
ep
ort
ing
Results from the 2013 Youth Survey
Fairfax County 2014 Youth Survey
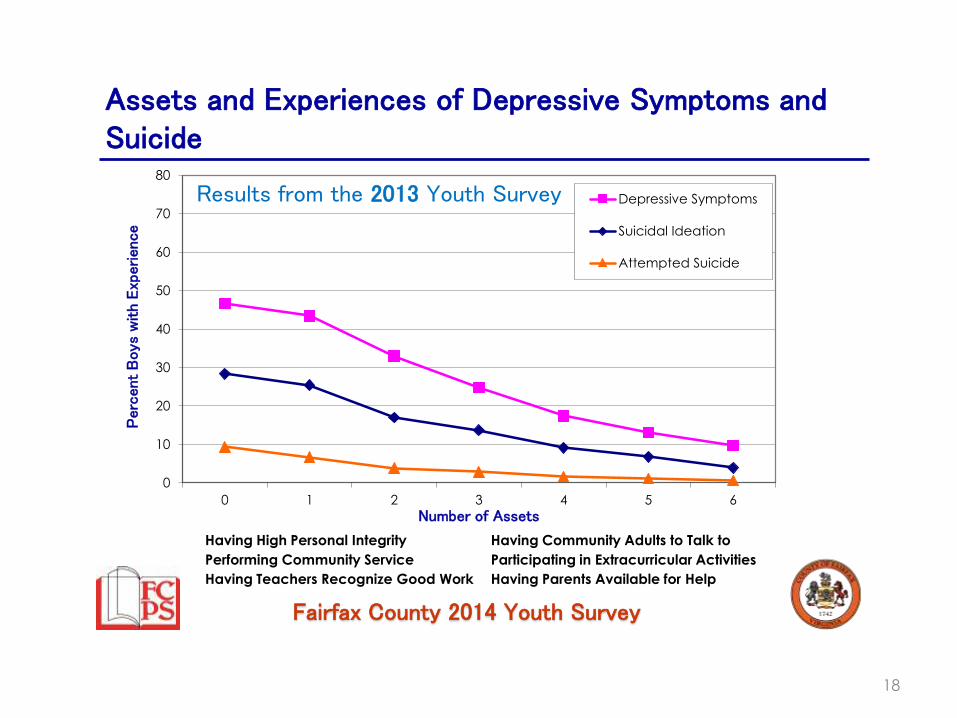
18
Having High Personal Integrity
Performing Community Service
Having Teachers Recognize Good Work
Having Community Adults to Talk to
Participating in Extracurricular Activities
Having Parents Available for Help
Assets and Experiences of Depressive Symptoms and Suicide
0
10
20
30
40
50
60
70
80
0 1 2 3 4 5 6
Perc
ent
Boys
with E
xperien
ce
Number of Assets
Depressive Symptoms
Suicidal Ideation
Attempted Suicide
Results from the 2013 Youth Survey
Fairfax County 2014 Youth Survey
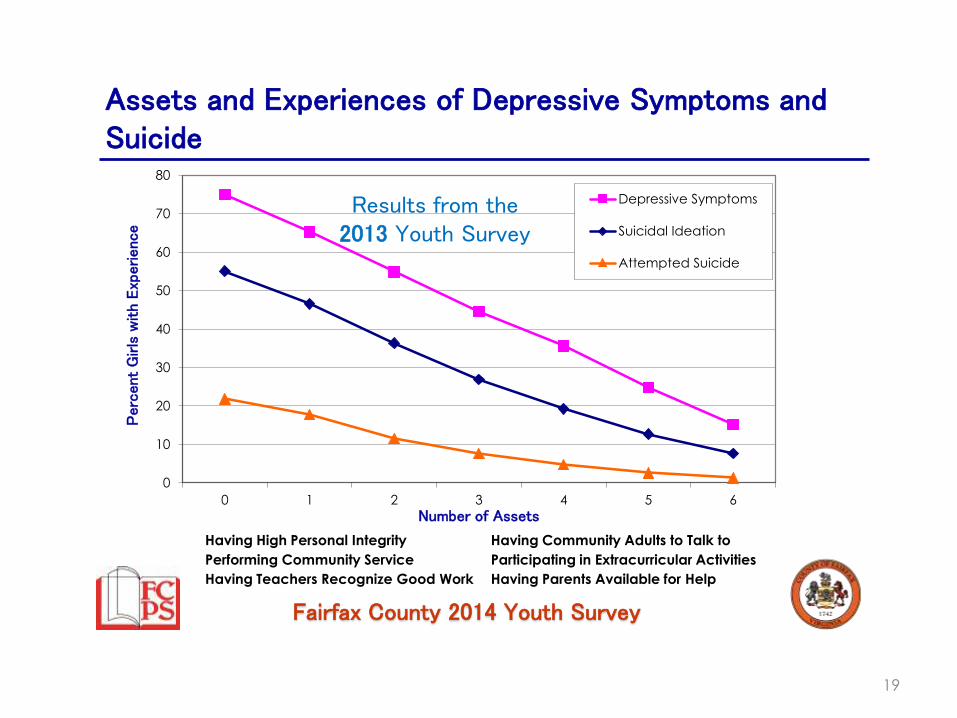
19
Having High Personal Integrity
Performing Community Service
Having Teachers Recognize Good Work
Having Community Adults to Talk to
Participating in Extracurricular Activities
Having Parents Available for Help
Assets and Experiences of Depressive Symptoms and Suicide
0
10
20
30
40
50
60
70
80
0 1 2 3 4 5 6
Perc
ent
Girls
with E
xperienc
e
Number of Assets
Depressive Symptoms
Suicidal Ideation
Attempted Suicide
Results from the2013 Youth Survey
Fairfax County 2014 Youth Survey
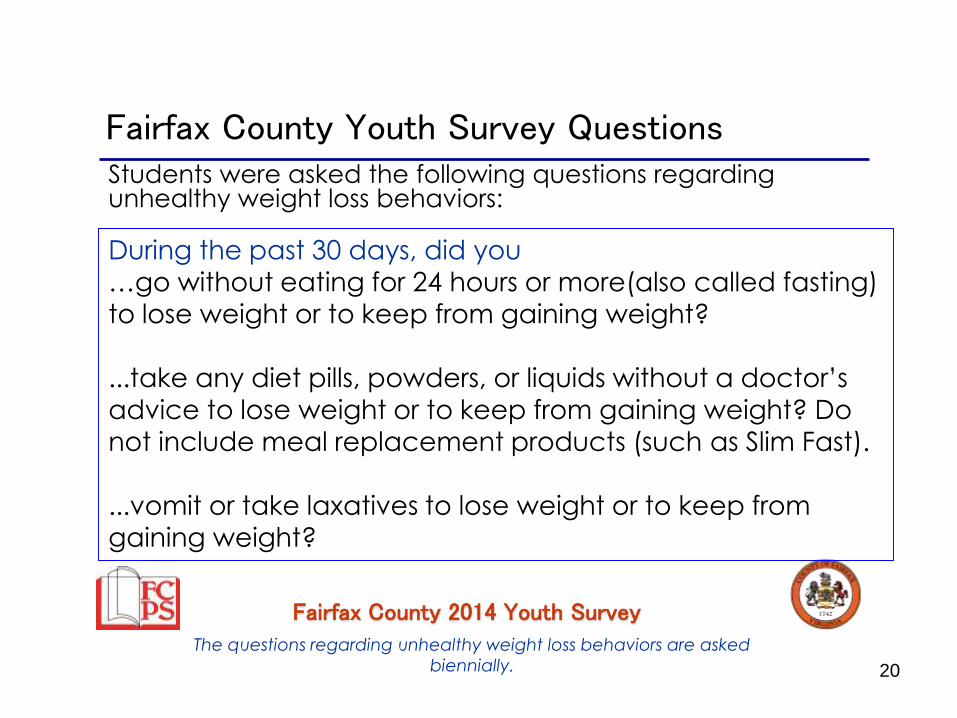
20
Students were asked the following questions regarding unhealthy weight loss behaviors:
Fairfax County Youth Survey Questions
During the past 30 days, did you
…go without eating for 24 hours or more(also called fasting)
to lose weight or to keep from gaining weight?
...take any diet pills, powders, or liquids without a doctor’s
advice to lose weight or to keep from gaining weight? Do
not include meal replacement products (such as Slim Fast).
...vomit or take laxatives to lose weight or to keep from
gaining weight?
The questions regarding unhealthy weight loss behaviors are asked
biennially. 20
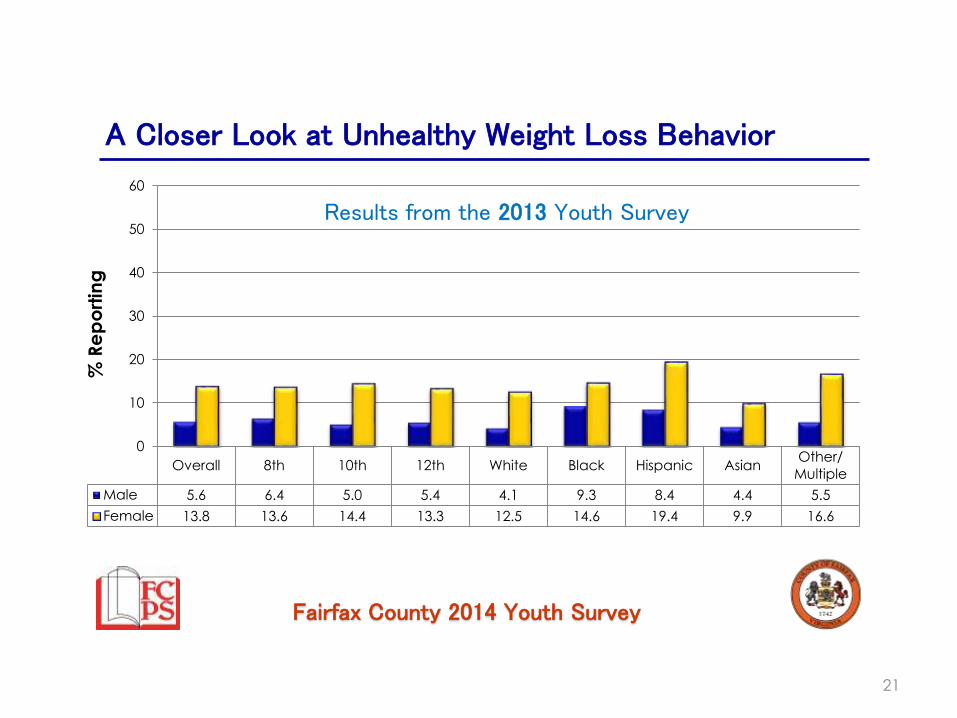
Fairfax County 2014 Youth Survey
21
A Closer Look at Unhealthy Weight Loss Behavior
Overall 8th 10th 12th White Black Hispanic AsianOther/
Multiple
Male 5.6 6.4 5.0 5.4 4.1 9.3 8.4 4.4 5.5
Female 13.8 13.6 14.4 13.3 12.5 14.6 19.4 9.9 16.6
0
10
20
30
40
50
60
% R
ep
ort
ing
Results from the 2013 Youth Survey
Fairfax County 2014 Youth Survey
Substance UseCorrelation to Depression
Fairfax County 2014 Youth Survey
23
Correlation Data
• Cross-tabulations are when we look at the
way students responded to multiple
questions, for example when we look at
results by demographics such as symptoms of
depression by gender or the cross of two
experiences such as symptoms of depression
by substance use.
Cross-tabulations of data do not imply cause
and effect.
23
Fairfax County 2014 Youth Survey
24
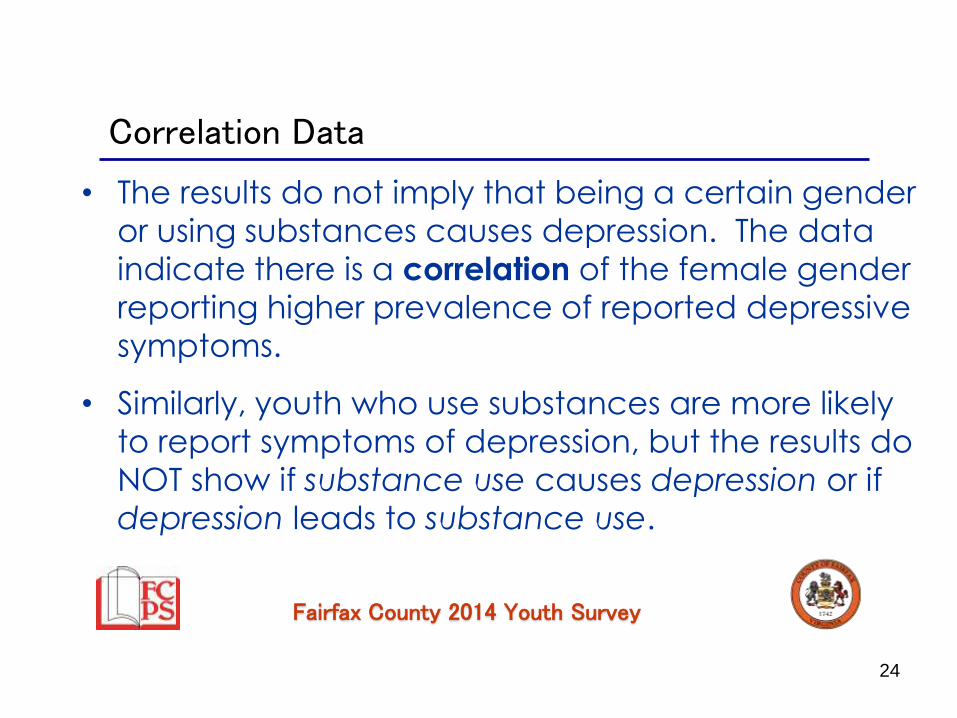
Correlation Data
• The results do not imply that being a certain gender
or using substances causes depression. The data
indicate there is a correlation of the female gender
reporting higher prevalence of reported depressive
symptoms.
• Similarly, youth who use substances are more likely
to report symptoms of depression, but the results do
NOT show if substance use causes depression or if
depression leads to substance use.
24
Fairfax County 2014 Youth Survey
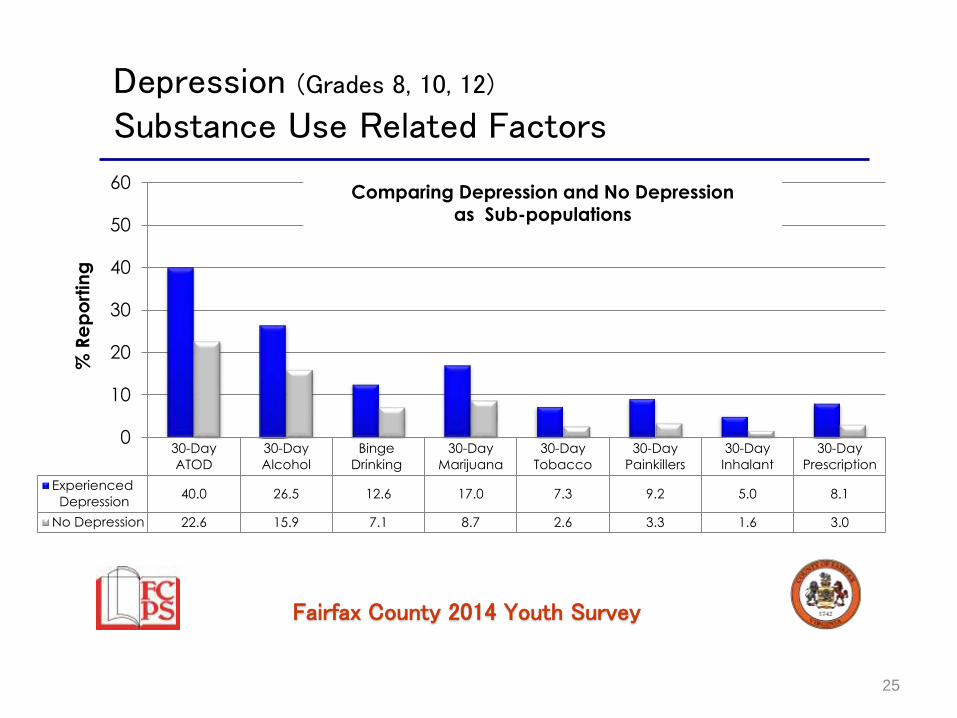
30-Day
ATOD
30-Day
Alcohol
Binge
Drinking
30-Day
Marijuana
30-Day
Tobacco
30-Day
Painkillers
30-Day
Inhalant
30-Day
Prescription
Experienced
Depression40.0 26.5 12.6 17.0 7.3 9.2 5.0 8.1
No Depression 22.6 15.9 7.1 8.7 2.6 3.3 1.6 3.0
0
10
20
30
40
50
60
% R
ep
ort
ing
25
Depression (Grades 8, 10, 12)
Substance Use Related Factors
Comparing Depression and No Depression as Sub-populations
Fairfax County 2014 Youth Survey
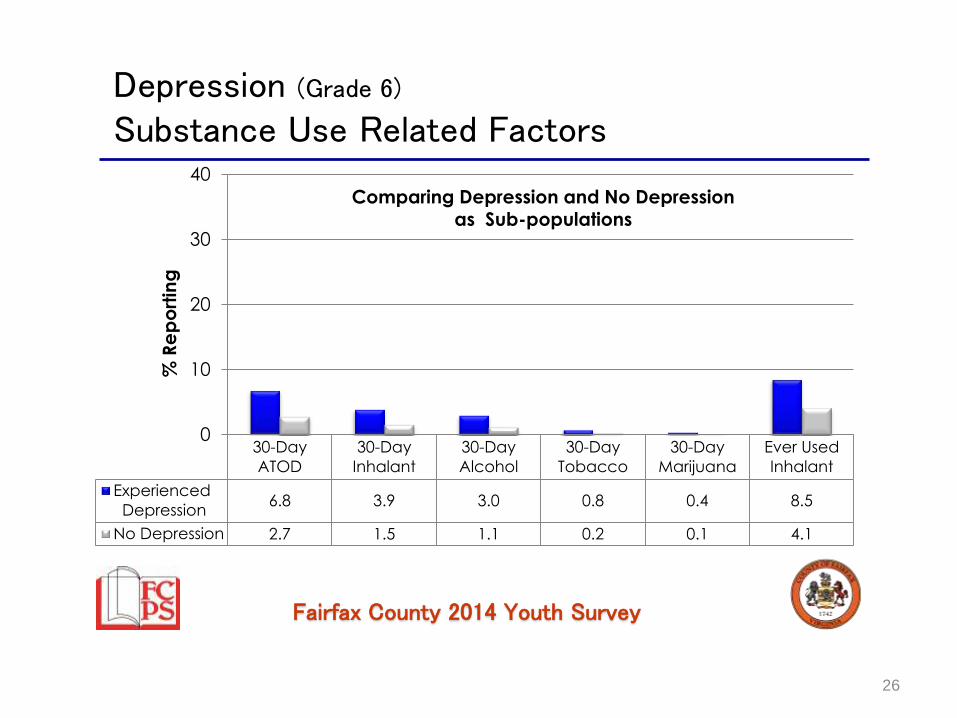
30-Day
ATOD
30-Day
Inhalant
30-Day
Alcohol
30-Day
Tobacco
30-Day
Marijuana
Ever Used
Inhalant
Experienced
Depression6.8 3.9 3.0 0.8 0.4 8.5
No Depression 2.7 1.5 1.1 0.2 0.1 4.1
0
10
20
30
40%
Re
po
rtin
g
26
Depression (Grade 6)
Substance Use Related Factors
Comparing Depression and No Depression as Sub-populations
Fairfax County 2014 Youth Survey
Aggression and VictimizationCorrelation to Depression
Fairfax County 2014 Youth Survey
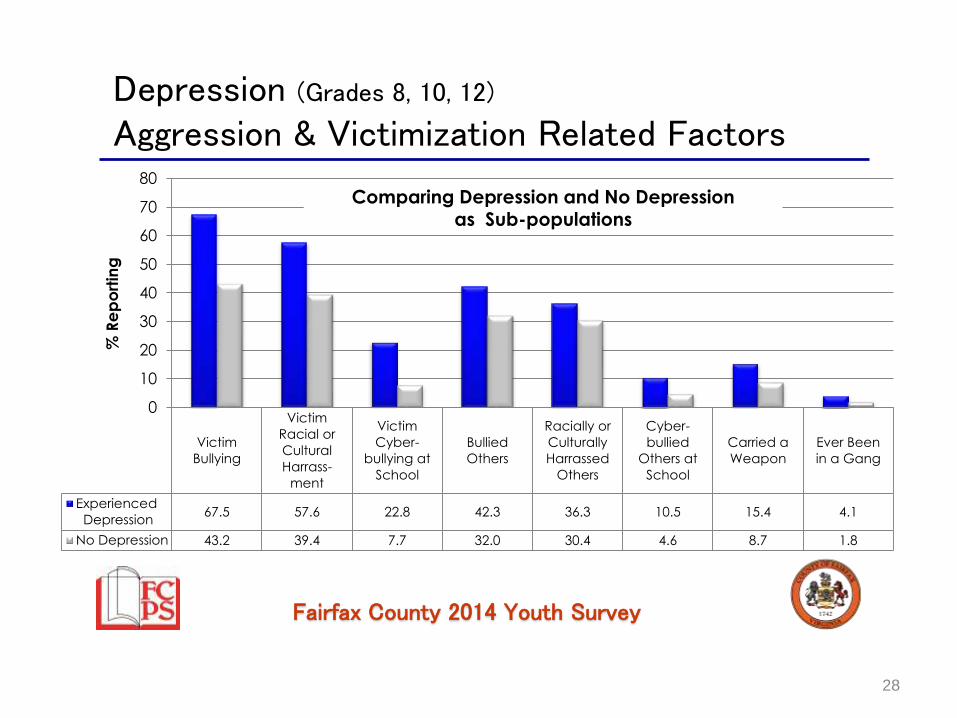
Victim
Bullying
Victim
Racial or
Cultural
Harrass-
ment
Victim
Cyber-
bullying at
School
Bullied
Others
Racially or
Culturally
Harrassed
Others
Cyber-
bullied
Others at
School
Carried a
Weapon
Ever Been
in a Gang
Experienced
Depression67.5 57.6 22.8 42.3 36.3 10.5 15.4 4.1
No Depression 43.2 39.4 7.7 32.0 30.4 4.6 8.7 1.8
0
10
20
30
40
50
60
70
80
% R
ep
ort
ing
28
Depression (Grades 8, 10, 12)
Aggression & Victimization Related Factors
Comparing Depression and No Depression as Sub-populations
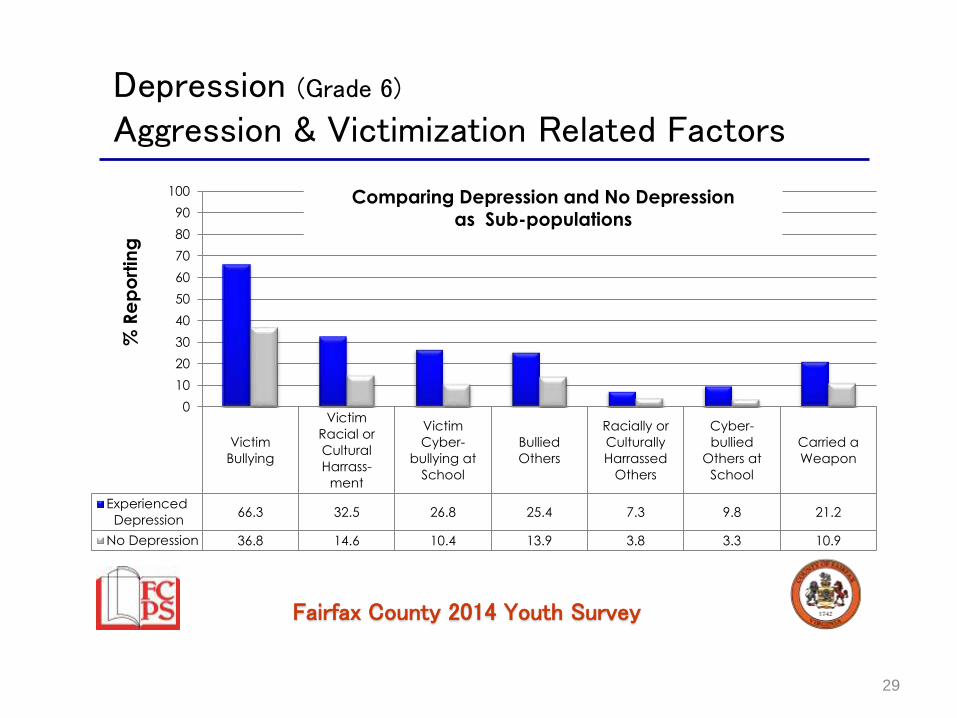
Fairfax County 2014 Youth Survey
Victim
Bullying
Victim
Racial or
Cultural
Harrass-
ment
Victim
Cyber-
bullying at
School
Bullied
Others
Racially or
Culturally
Harrassed
Others
Cyber-
bullied
Others at
School
Carried a
Weapon
Experienced
Depression66.3 32.5 26.8 25.4 7.3 9.8 21.2
No Depression 36.8 14.6 10.4 13.9 3.8 3.3 10.9
0
10
20
30
40
50
60
70
80
90
100
% R
ep
ort
ing
29
Depression (Grade 6)
Aggression & Victimization Related Factors
Comparing Depression and No Depression as Sub-populations
Fairfax County 2014 Youth Survey
Health and Well-BeingCorrelation to Depression
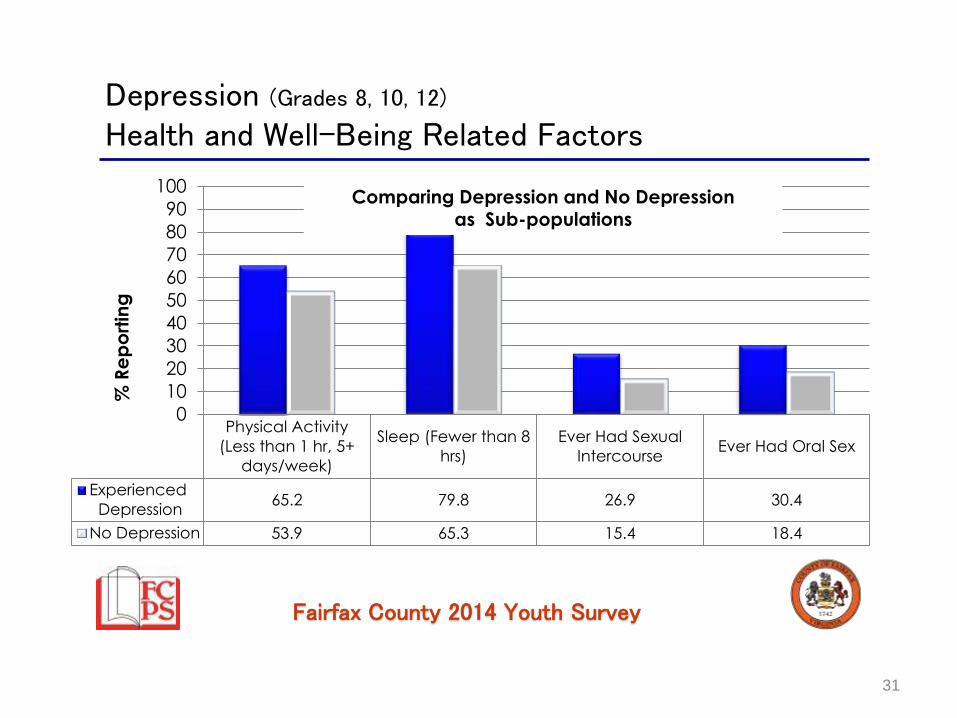
Fairfax County 2014 Youth Survey
Physical Activity
(Less than 1 hr, 5+
days/week)
Sleep (Fewer than 8
hrs)
Ever Had Sexual
IntercourseEver Had Oral Sex
Experienced
Depression65.2 79.8 26.9 30.4
No Depression 53.9 65.3 15.4 18.4
0
10
20
30
40
50
60
70
80
90
100
% R
ep
ort
ing
31
Depression (Grades 8, 10, 12)
Health and Well-Being Related Factors
Comparing Depression and No Depression as Sub-populations
Fairfax County 2014 Youth Survey
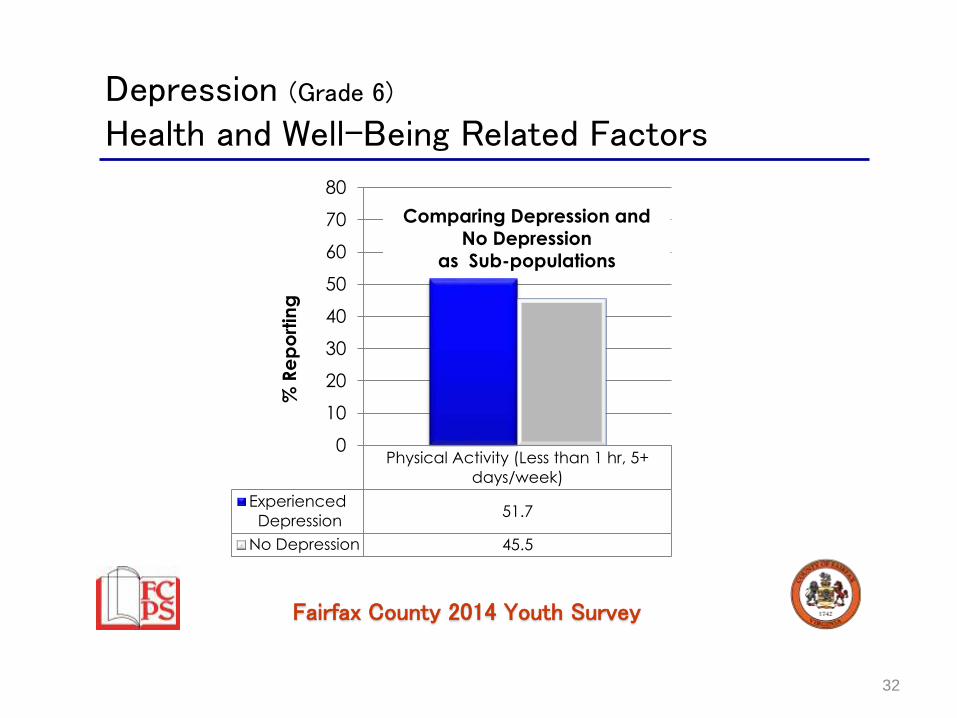
Physical Activity (Less than 1 hr, 5+
days/week)
Experienced
Depression51.7
No Depression 45.5
0
10
20
30
40
50
60
70
80
% R
ep
ort
ing
Comparing Depression and No Depression
as Sub-populations
32
Depression (Grade 6)
Health and Well-Being Related Factors
Fairfax County 2014 Youth Survey
School PerformanceCorrelation to Depression
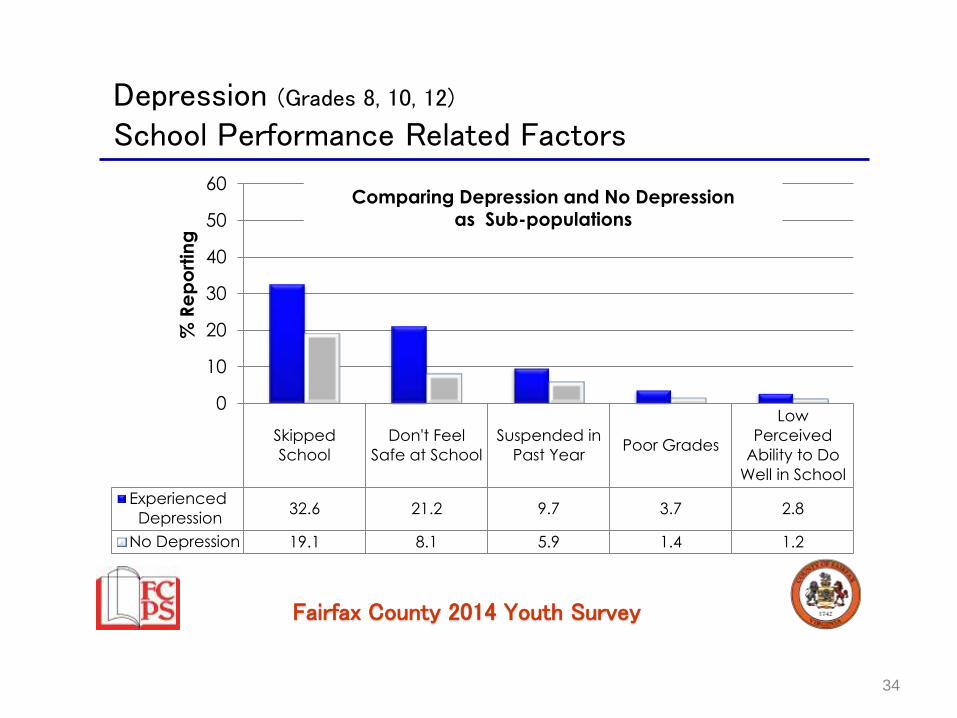
Fairfax County 2014 Youth Survey
Skipped
School
Don't Feel
Safe at School
Suspended in
Past YearPoor Grades
Low
Perceived
Ability to Do
Well in School
Experienced
Depression32.6 21.2 9.7 3.7 2.8
No Depression 19.1 8.1 5.9 1.4 1.2
0
10
20
30
40
50
60%
Re
po
rtin
g
34
Depression (Grades 8, 10, 12)
School Performance Related Factors
Comparing Depression and No Depression as Sub-populations
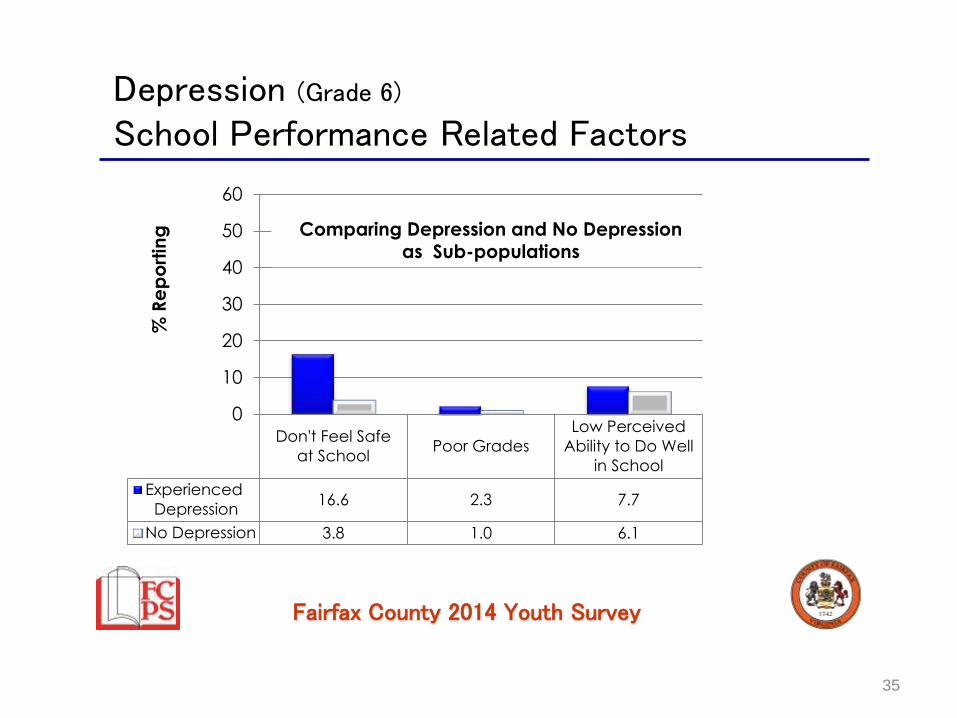
Fairfax County 2014 Youth Survey
Don't Feel Safe
at SchoolPoor Grades
Low Perceived
Ability to Do Well
in School
Experienced
Depression16.6 2.3 7.7
No Depression 3.8 1.0 6.1
0
10
20
30
40
50
60
% R
ep
ort
ing
35
Depression (Grade 6)
School Performance Related Factors
Comparing Depression and No Depression as Sub-populations
Fairfax County 2014 Youth Survey
Risk and Protective Factors
Fairfax County 2014 Youth Survey
37
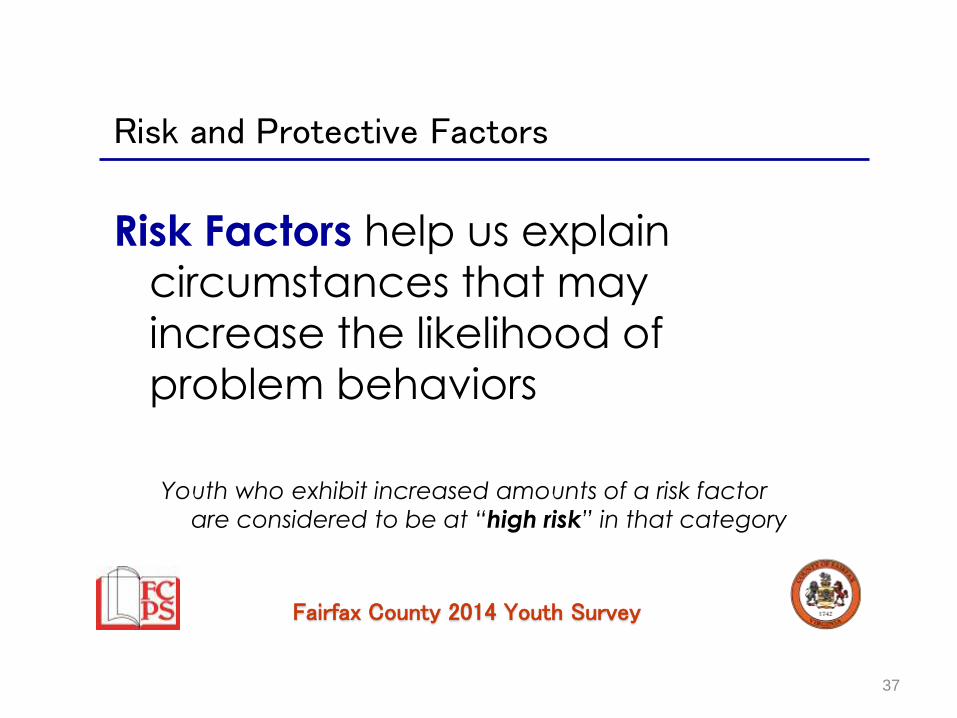
Risk and Protective Factors
Risk Factors help us explain
circumstances that may
increase the likelihood of
problem behaviors
Youth who exhibit increased amounts of a risk factor
are considered to be at “high risk” in that category
Fairfax County 2014 Youth Survey
38
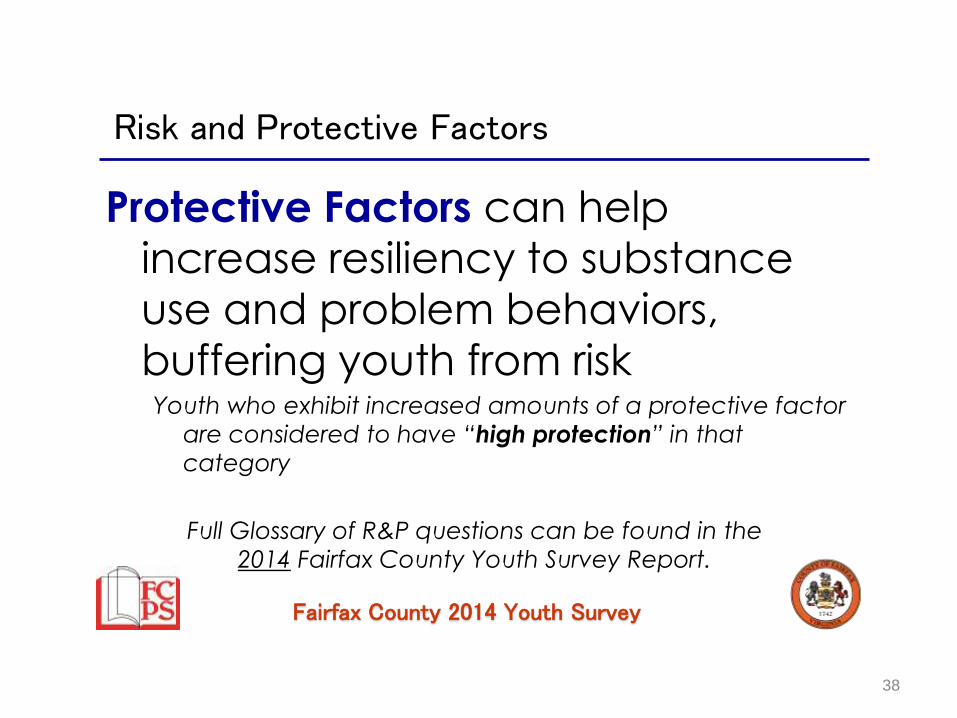
Risk and Protective Factors
Protective Factors can help
increase resiliency to substance
use and problem behaviors,
buffering youth from riskYouth who exhibit increased amounts of a protective factor
are considered to have “high protection” in that
category
Full Glossary of R&P questions can be found in the
2014 Fairfax County Youth Survey Report.
Fairfax County 2014 Youth Survey
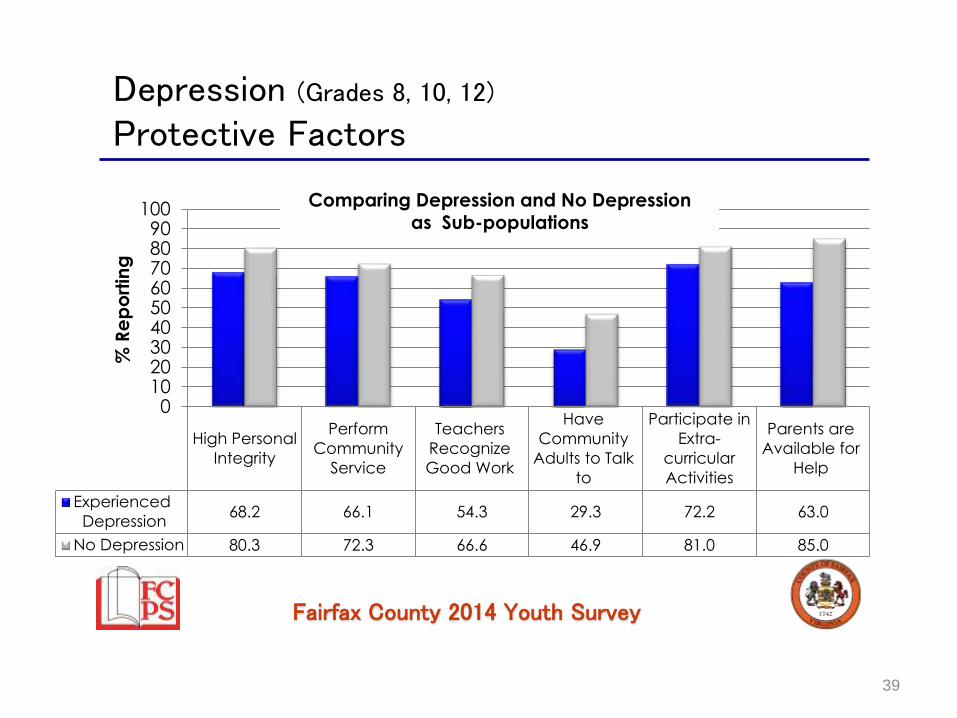
High Personal
Integrity
Perform
Community
Service
Teachers
Recognize
Good Work
Have
Community
Adults to Talk
to
Participate in
Extra-
curricular
Activities
Parents are
Available for
Help
Experienced
Depression68.2 66.1 54.3 29.3 72.2 63.0
No Depression 80.3 72.3 66.6 46.9 81.0 85.0
0102030405060708090
100
% R
ep
ort
ing
39
Depression (Grades 8, 10, 12)
Protective Factors
Comparing Depression and No Depression as Sub-populations
Fairfax County 2014 Youth Survey
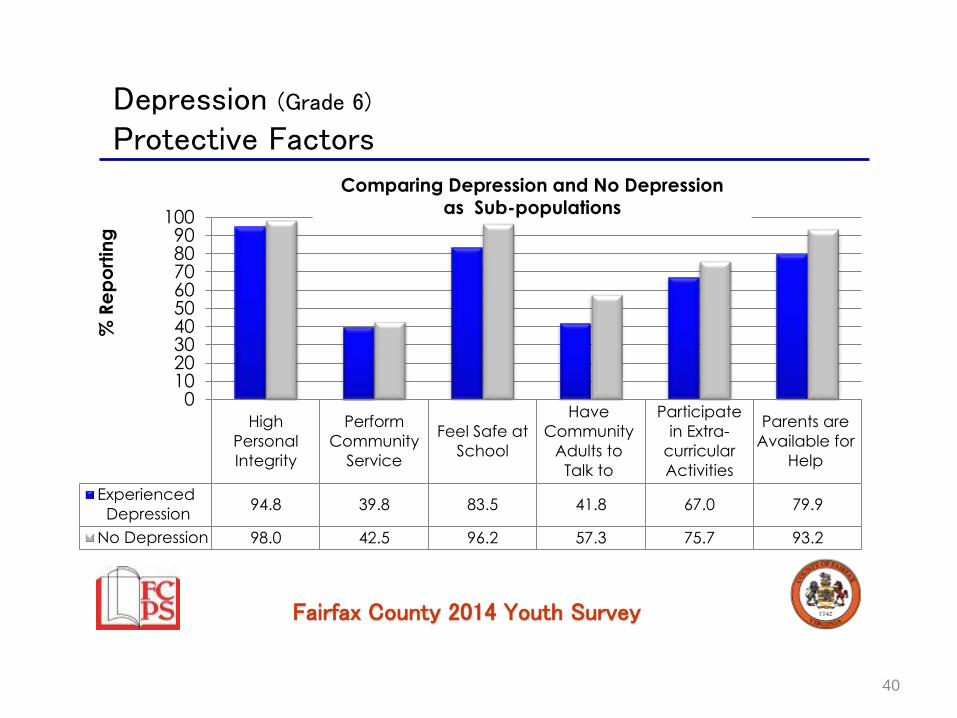
High
Personal
Integrity
Perform
Community
Service
Feel Safe at
School
Have
Community
Adults to
Talk to
Participate
in Extra-
curricular
Activities
Parents are
Available for
Help
Experienced
Depression94.8 39.8 83.5 41.8 67.0 79.9
No Depression 98.0 42.5 96.2 57.3 75.7 93.2
0102030405060708090
100
% R
ep
ort
ing
40
Depression (Grade 6)
Protective Factors
Comparing Depression and No Depression as Sub-populations

Fairfax County 2014 Youth Survey
41
Depressive Symptoms in Past YearRelated Factors
Bullied Others
(Past Year)
Racially/
Culturally
Harrassed
Others (Past
Year)
Cyberbullied
Others (Past
Year)
Sex (Ever)
ATOD
Depression
No Depression
0%
50%
Fairfax County 2014 Youth Survey
42
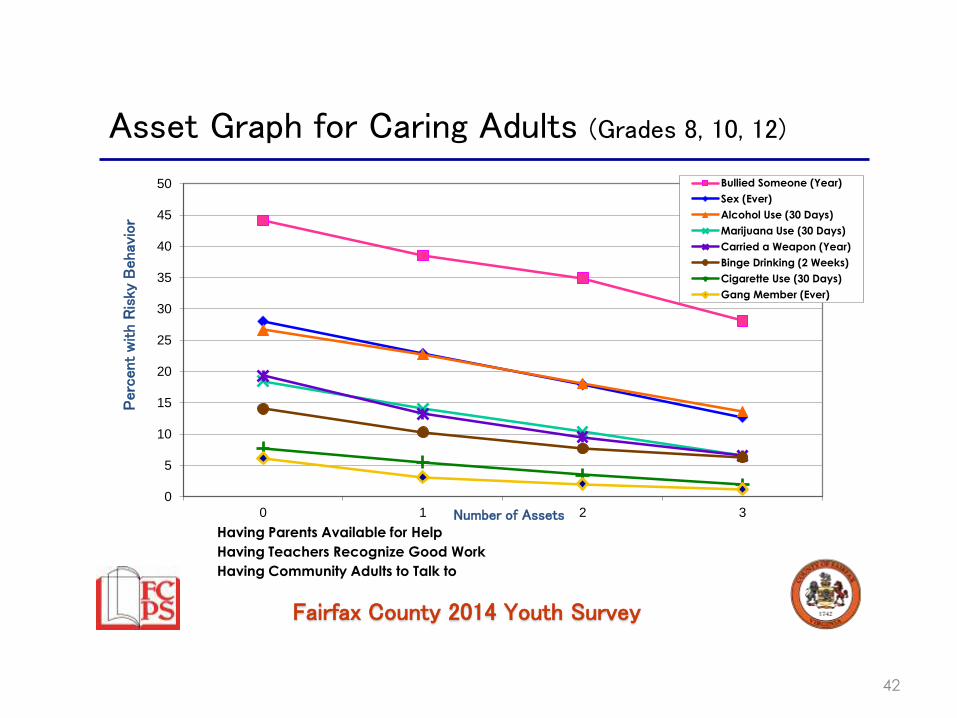
Asset Graph for Caring Adults (Grades 8, 10, 12)
Having Parents Available for Help
Having Teachers Recognize Good Work
Having Community Adults to Talk to
0
5
10
15
20
25
30
35
40
45
50
0 1 2 3
Perc
ent
with R
isky
Behav
ior
Number of Assets
Bullied Someone (Year)
Sex (Ever)
Alcohol Use (30 Days)
Marijuana Use (30 Days)
Carried a Weapon (Year)
Binge Drinking (2 Weeks)
Cigarette Use (30 Days)
Gang Member (Ever)
Fairfax County 2014 Youth Survey
43
The Prevention Toolkit provides access to presentations, videos, fact sheets, links to helpful organizations and resources, and ideas for taking action in your family and community to address Youth Survey related topics.
The Prevention Toolkit
The Prevention Toolkit Websitewww.fairfaxcounty.gov/ncs/prevention/toolkit.htm
Contact [email protected]
• Alcohol, Tobacco and Other Drugs
• Bullying and Cyberbullying• Depression, Suicide and
Unhealthy Weight Loss• Nutrition and Physical Activity• Teen Dating Abuse
Fairfax County 2014 Youth Survey
44
Find these and other organizations in the Prevention Toolkit as resources for help and more information.
• Crisislink Suicide Prevention Hotline: (703) 527-4077
• National Suicide Prevention Lifeline: (800) 273-TALK (8255)
• Fairfax-Falls Church Community Services Board (CSB) Mental
Health Services
24-Hour CSB Emergency Services Phone: 703-383-8500
TTY: 703-207-7737
Help and More Information
Fairfax County 2014 Youth Survey
45
Intervention and Prevention Services
School Psychology Services
School Social Work Services
Student Safety and Wellness
School Counseling Services
Help and More Information from Fairfax County Public Schools
Fairfax County 2014 Youth Survey
46
Questions? Contact Us!
Sophia Dutton
Countywide Service Integration and Planning Management
Strategic Planning, Communications, & Info Management
Dede Bailer
Fairfax County Public Schools
Office of Intervention and Prevention Services
www.fairfaxcounty.gov/youthsurvey