Fair Student Funding & School Budget Resource Guide
65
Fair Student Funding & School Budget Resource Guide FY 2013 New York City Department of Education Division of Finance May 2012 (Updated 1/15/13)
-
Upload
nguyenthien -
Category
Documents
-
view
216 -
download
1
Transcript of Fair Student Funding & School Budget Resource Guide

Fair Student Funding
& School Budget Resource Guide
FY 2013
New York City Department of Education Division of Finance May 2012 (Updated 1/15/13)
Resource Guide to School Budgets
i
TABLE OF CONTENTS PAGE
CHAPTER 1: PROCESS AND PLANNING 1
1.1. Fiduciary Responsibilities of the Principal
1.2. School Leadership Teams
1.3. Children First Network Support and Approval
1.4. Role of Superintendents
CHAPTER 2: THE DEPARTMENT OF EDUCATION’S OVERALL BUDGET 4
2.1. How are School Budgets Funded?
2.2. Children First Funds
2.3. Information on Other Funding Streams
CHAPTER 3: FAIR STUDENT FUNDING BACKGROUND 8
3.1. The Basics: A Fair and Transparent Way to Fund Schools
3.2. Gradual Implementation to Preserve Stability
CHAPTER 4: FAIR STUDENT FUNDING FORMULA 10
4.1. Foundation
4.2. Grade-Level Allocations
4.3. Needs-Based Allocations
4.4. High School Portfolio
4.5. How Students Are Counted
4.6. Mid-year Adjustments

Resource Guide to School Budgets
ii
4.7. Special Rules for New Schools, Transfer Schools, and Phase-Out Schools
CHAPTER 5: CONTINUING THE TRANSITION TO FAIR STUDENT FUNDING 37
5.1. Budget Reduction
5.2. Online Budget Reports
5.3. Galaxy Allocation Categories
CHAPTER 6: STAFFING 42
6.1. Background
6.2. Gradual Transition
6.3. Legacy Teacher Funding
6.4. The School-Wide Average Teacher Salary
6.5. Technical Notes on Staffing Non-Teacher Positions
6.6. Excessing
6.7 Other Tools for Staffing
CHAPTER 7: CONTRACTS FOR EXCELLENCE (C4E) 51
7.1. How Funds Should Be Spent
7.2. Guidance for FY 2013
CHAPTER 8: CONCEPTUAL CONSOLIDATION IN TITLE I SWP SCHOOLS 58
8.1 Overview/Background
8.2 Consolidating Funds in a School-wide Program
8.3 “Conceptual” Consolidation
8.4 What Does This Mean?
8.5 Galaxy Cost Factors for Conceptual Consolidation

Resource Guide to School Budgets
iii
8.6 Time and Effort Reporting
CHAPTER 9: ABSENT TEACHER RESERVE SUBSIDY FUNDING 61
9.1 Absent Teacher Reserve Subsidy Funding
Resource Guide to School Budgets
1
CHAPTER 1: PROCESS AND PLANNING
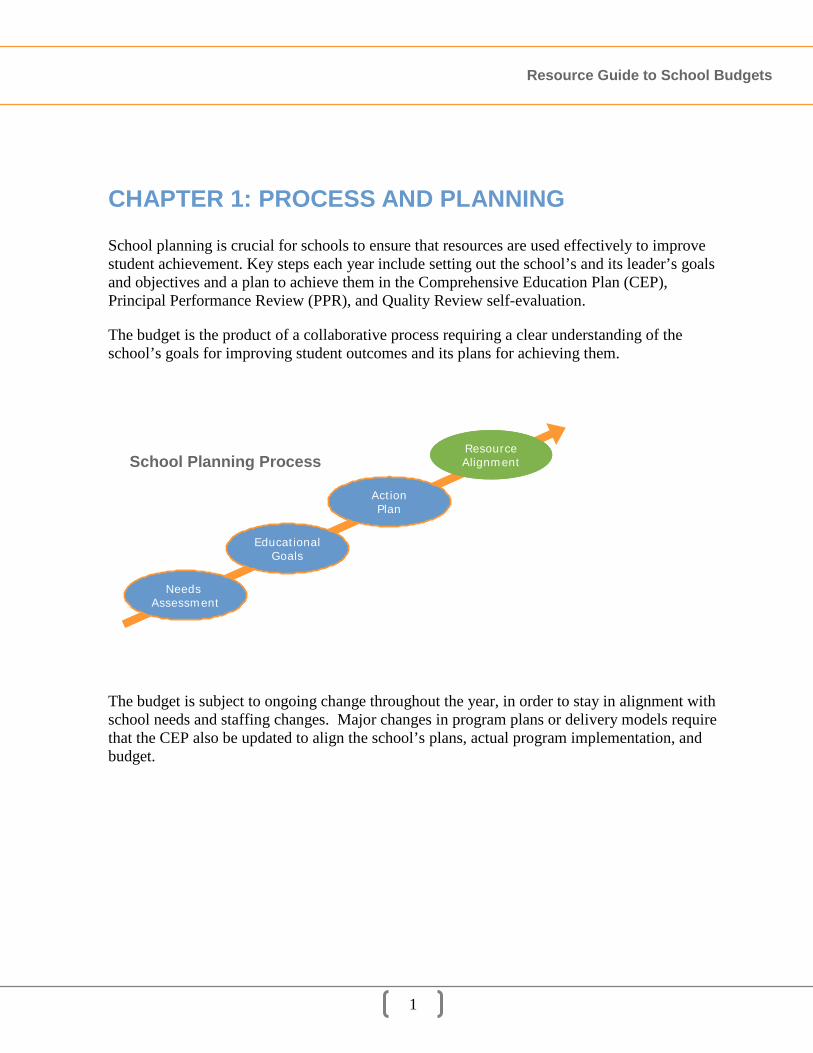
School planning is crucial for schools to ensure that resources are used effectively to improve student achievement. Key steps each year include setting out the school’s and its leader’s goals and objectives and a plan to achieve them in the Comprehensive Education Plan (CEP), Principal Performance Review (PPR), and Quality Review self-evaluation.
The budget is the product of a collaborative process requiring a clear understanding of the school’s goals for improving student outcomes and its plans for achieving them.
The budget is subject to ongoing change throughout the year, in order to stay in alignment with school needs and staffing changes. Major changes in program plans or delivery models require that the CEP also be updated to align the school’s plans, actual program implementation, and budget.
ResourceAlignment
Needs Assessment
ActionPlan
EducationalGoals
ResourceAlignment
Needs Assessment
ActionPlan
EducationalGoals
School Planning Process

Resource Guide to School Budgets
2
1.1. Fiduciary Responsibilities of the Principal
The principal is the authorizing official for all budget, payroll, and purchasing transactions for the school. It is the responsibility of the authorizing official to approve budget, payroll and purchases that support educational priorities or expenditures related to the “Business of Education.”
The principal must ensure that all expenditures are in alignment with allocated funding levels, and is responsible for resolving any over-expenditures and disallowances. Disallowances are expenditures which are not permitted under the guidelines of the program. When disallowances are identified, appropriate alternative funding must be identified within the school to pay for those costs. As the authorizing official, the principal must follow program guidelines and regulations, have strong internal controls in place, and when designating such authority to only trusted and trained staff, be aware that he or she is ultimately responsible for all actions taken on their behalf by their designees.
Internal control is broadly defined as a process to safeguard assets utilized by DOE schools to educate students. Management and other personnel use internal control procedures designed to provide reasonable assurance regarding the achievement of objectives in the following categories:
Safeguarding of assets; Effectiveness and efficiency of operations; Reliability of financial reporting; and Compliance with applicable laws and regulations.
Principals should refer to the Office of the Auditor General (OAG) website for guidance and training: (http://schools.nyc.gov/Offices/GeneralCounsel/OAG/TrainingProcess/default.htm)
All transactions should be fully documented and are subject to monitoring and audit by both internal and external control bodies such as the City and State Comptroller, State Education Department, Federal Department of Education, and private accounting firms contracted by the DOE or other oversight bodies to ensure proper controls. Principals are reminded that fiscal management is a priority and they will be held accountable for their budgetary decisions.

Resource Guide to School Budgets
3
1.1.2. Student Data Student data must be updated and maintained in all systems to ensure proper data for budget, accountability, and reporting purposes. Where student data is not updated in accordance with published deadlines, school funding may be at risk.
1.2. School Leadership Teams The principal is responsible for developing the school-based budget, after consulting with the School Leadership Team (SLT), and ensuring that it is aligned with the CEP. The SLT is responsible for developing the school’s CEP and ensuring that it is aligned with the school-based budget. SLTs must use a consensus-based decision-making process. For details and guidance, refer to Chancellor’s Regulation A-655 (http://schools.nyc.gov/NR/rdonlyres/381F4607-7841-4D28-B7D5-0F30DDB77DFA/82007/A655FINAL1.pdf). 1.3. Children First Network Support and Approval The Children First Network staff is ready to assist principals and their designees in the development of the initial budget and ongoing management of budget changes throughout the year. Children First Network budget liaisons are responsible for review and approval of all budget modifications submitted by principals or their designees on the Galaxy Table of Organization. 1.4. Role of Superintendents For each school in his or her jurisdiction, the community superintendent shall review the proposed school-based budget, the principal’s written justification demonstrating that the proposed school-based budget is aligned with the school’s CEP, and the SLT’s comments on the principal’s written justification, if any. For details and guidance, refer to Chancellor’s Regulation B-801 (http://schools.nyc.gov/NR/rdonlyres/381F4607-7841-4D28-B7D5-0F30DDB77DFA/97060/B8011202011FINAL.pdf).

Resource Guide to School Budgets
4
CHAPTER 2: THE DEPARTMENT’S OVERALL BUDGET
2.1. How Are School Budgets Funded? Below is a listing of major categories of school allocations. Each allocation is explained more fully in the School Allocation Memoranda (SAM) found on the Division of Finance’s website: http://schools.nyc.gov/Offices/DBOR/AM/default.htm. Fair Student Funding covers basic instructional needs and is allocated to each school based on the number and need-level attributes of students at the school, adjusted for the school’s funding percentage. All money allocated through FSF can be used at the principals’ discretion. See Chapter 3 and 4 for additional details.
Note: Schools in District 75 and programs in District 79 do not receive a Fair Student Funding allocation because of their differentiated models. They will continue to be funded under the previous methodology.
Funding Streams to Schools
Children First Network Support

Resource Guide to School Budgets
5
Categorical Allocations:
State and Federal Categorical programs are restricted by the State or Federal government on how they can be distributed to and used by schools. Examples include Title I, and other programs such as IDEA, Universal Pre-K, and Attendance Improvement/ Dropout Prevention. These programs are listed as Externally Restricted Programs in the SAMs.
Contracts for Excellence Funds come from the State as a result of its commitment to increase funding to New York City. However, the original planned phase-in of increased dollars has not been realized. These funds must be allocated according to the State’s indexing methodology. The funds must also be spent by schools according to the City’s Contract for Excellence with the State. Refer to Chapter 7 for more information.
Programmatic Allocations:
Programs Not Consolidated includes City initiatives that remain outside of Fair Student Funding because of their unique structure or priority, such as the parent coordinator initiative or new school start-up funds. These funds are often restricted and can only be spent on certain services. These programs are listed as Internally Restricted Programs in the SAMs.
Other Special Education Funds pay for mandated special education support that supplements core classroom instruction services. These dollars are allocated in addition to the funds students with disabilities receive as part of the Fair Student Funding allocation.
Children First Network Support Funds come from funds formerly controlled by field and central offices. These funds are allocated on a per-school basis. Schools will use these funds to purchase their Children First Network Support Team services each year. Any remaining funds can be used at the principals’ discretion to best meet the needs of students.
2.2. Children First Funds Schools are required to pay for services provided by their Children First Network. The level of support varies by network, but they all include instructional supports and coaching, help in using accountability tools, organizational and professional support, and other dimensions of support that relate to a school’s educational mission and goals. Each Children First Network offers schools one-stop assistance with mandated and operational services related to human resources, payroll, budget and procurement, transportation, food, facilities, safety, extended use, grant management, technology, health, youth services, student suspensions, and some elements of special education.

Resource Guide to School Budgets
6
Any remaining funding is flexible, and can be used by Principals to meet the needs of their students by buying academic intervention, professional development, textbooks, supplies, and other equipment.
The Department provides the following support services at no cost to the schools:
Accountability and performance evaluations: The Chancellor and his team, including community and high school superintendents, hire and fire Department of Education employees. Community superintendents and high school superintendents perform all statutory duties for the schools in their districts and geographic areas, respectively. This includes appointing principals, acting as the rating officer for principals, reviewing and approving school budgets, and performing all other duties and responsibilities conferred by law. They also play a vital role in the Department’s accountability initiative, working closely with the Division of Academic Performance and Support.
Compliance: The Department of Education monitors and supports schools in their efforts to comply with the myriad laws, regulations, and collective bargaining agreements to which all schools are subject. A compliance team, managed by the General Counsel’s Office, ensures that schools are in compliance through streamlined reporting and targeted support.
System-wide functions related to policy and resource allocation: The Department of
Education continues to make system-wide decisions, ensuring that all standards are rigorous and clear and services are of high quality. It also ensures that resources are allocated fairly and equitably, and implements student enrollment policies that are fair, in the best interest of students, and consistent citywide.
For a comprehensive list of services provided by the Department, please see the Principals Portal homepage of the DOE Intranet at the following link: http://intranet.nycboe.net/DOEPortal/Principals/default.htm
2.3. Information on Other Funding Streams 2.3.1. School Allocation Memoranda Detailed information on each funding stream’s purpose, allocation methodology and spending restrictions can be found online on the Department of Finance website under the School

Resource Guide to School Budgets
7
Allocation Memorandum (SAM) section: http://schools.nyc.gov/Offices/DBOR/AM/default.htm.
2.3.2. Reimbursable Handbook
The Reimbursable Handbook was designed as a tool to assist principals and School Leadership Teams in the appropriate use of reimbursable dollars. The overarching prerequisites of reimbursable funding are:
Expenditures must support the purpose for which the funding was allocated.
Funds must supplement, not supplant instruction. The Reimbursable Handbook can be found online at: http://intranet.nycboe.net/DOEPortal/Principals/MySchool/Financial/default.htm.

Resource Guide to School Budgets
8
CHAPTER 3: FAIR STUDENT FUNDING BACKGROUND
Fair Student Funding aims to achieve three major goals:
Improve student achievement: School leaders and communities know best what their schools need for their students to achieve. Fair Student Funding eliminates restrictions on dollars and gives schools more opportunity to make the best choices for their students. Fair Student Funding provides financial incentives for schools to enroll struggling students—and rewards schools when they succeed in improving student results by not taking away the funds that would otherwise be reduced due to student improvement.
Move toward equity: In order to give schools time to adapt to the revisions to the FSF formula in support of the Special Education Reform, schools relative position to the full FSF formula will not be changed in FY13.
Make school budgets more transparent: Fair Student Funding enabled the elimination of many complex funding streams, providing most funding to schools in a single, simplified budget allocation. While Fair Student Funding continues to be reviewed and updated as needed, it serves as a strong vehicle for improvement over time.
3.1. The Basics: A Fair and Transparent Way to Fund Schools
Fair Student Funding is based on simple principles:
School budgeting should fund students fairly and adequately, while preserving stability at all schools;
Different students have different educational needs, and funding levels should reflect those needs as best as possible;
School leaders, not central offices, are best positioned to decide how to improve achievement; and
School budgets should be as transparent as possible so that funding decisions are visible for all to see and evaluate.

Resource Guide to School Budgets
9
In keeping with these principles, Fair Student Funding means that:
Money will follow each student to the public school that he or she attends;
Each student will receive funding based on grade level;
Students may also receive additional dollars based on need;
Principals have greater flexibility about how to spend money on teachers and other investments—with greater responsibility for dollars and greater accountability for results; and.
Key funding decisions will be based on clear, public criteria.
3.2. Gradual Implementation to Preserve Stability
We need to drive more resources into schools that aren’t getting their fair share of funds and encourage all schools to perform better. However, we also need to protect what’s already working. That’s why changes to Fair Student Funding have continued to be implemented gradually.
Since its inception, Fair Student Funding continues to provide a flexible vehicle for public feedback and improvement over time. We have made tradeoffs and tough decisions transparent and have provided extensive data about schools’ funding in a more accessible form. We are committed to improving Fair Student Funding in the coming years through input from principals, teachers, parents, and school communities.
The realization of Fair Student Funding has been hampered by the recession and the unrealized promise of funds from the Campaign for Fiscal Equity. Looking ahead, all future plans and funding commitments continue to be contingent on adequate State and City funding.
Aside from formula changes, schools may still face funding reductions because of changes in programs outside Fair Student Funding, changes in enrollment, or loss of grant funding.

Resource Guide to School Budgets
10
CHAPTER 4: FAIR STUDENT FUNDING FORMULA
The Fair Student Funding formula allocates dollars to schools through four basic categories:
Foundation—a fixed sum of $225,000 for all schools;
Grade weights, based on student grade levels;
Needs weights, based on student needs; and
Enhanced weights for students in “portfolio” high schools.
Why These Weights?
Fair Student Funding weights are always adequate for schools to meet legal and policy requirements. Beyond that, these weights reflect evidence-based judgments about the fairest levels of funding for students across New York City. In particular, the weights are designed to do two things:
Meet the needs of students with higher grade weights and students who need the greatest support; and
Reflect fair, objective criteria that can be applied evenly across New York City. The weights are designed to provide the fairest level of funding for every child’s education.
4.1. Foundation
Foundation $225,000 per school

Resource Guide to School Budgets
11
Policy
All schools receiving Fair Student Funding, regardless of registers or type, will receive a lump-sum foundation of $225,000. The dollars are not tagged to particular positions so that schools, rather than central administration, determine whether they need more or less core administrative staff, teachers, or other services. Schools can finance additional administrative staff using resources from the per-student allocations, and other allocations, such as parent coordinators; and other programmatic supports provided on a per-school basis, such as IEP teachers.
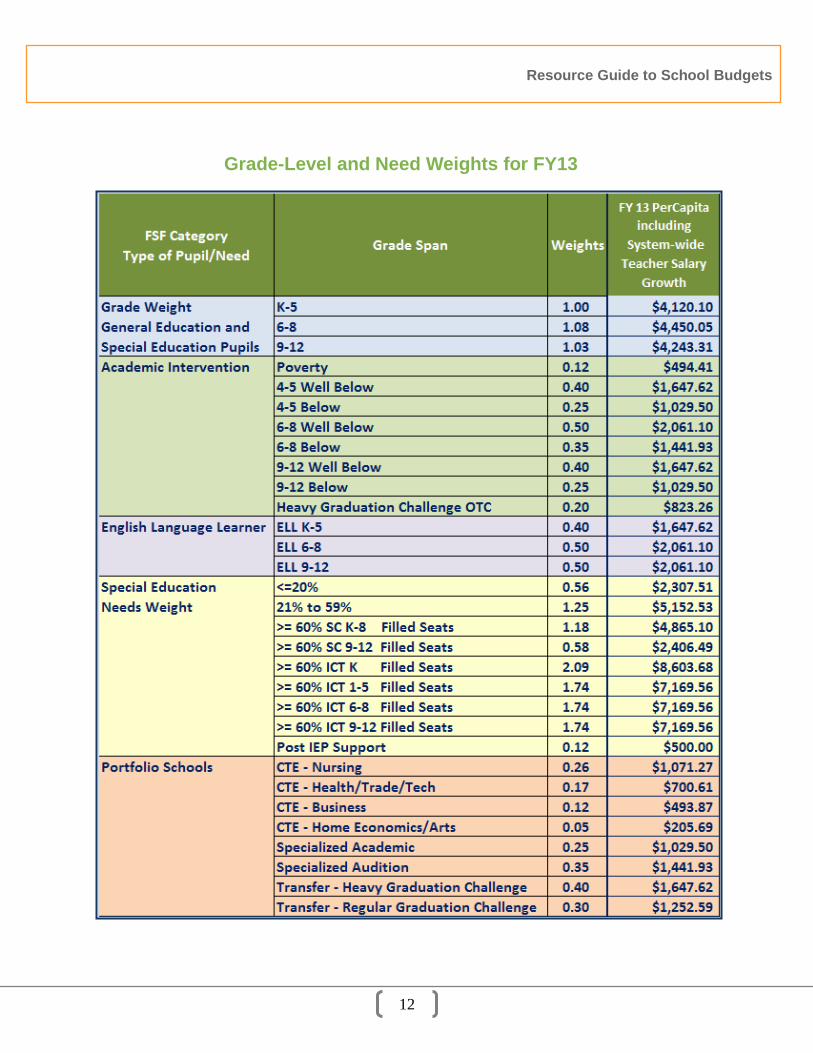
4.2. Grade-Level and Need Weights for FY13 The grade-level and need weights and associated per capita amounts for FY13 appear on the chart on the next page. For FY13, $34.80 is added per 1.00 student weight to the FY12 amounts, for teacher salary growth. Funding for teacher salary growth is added to the school’s formula calculation after all grade-level and need weights have been totaled.
Resource Guide to School Budgets
12
Grade-Level and Need Weights for FY13

Resource Guide to School Budgets
13
4.2.1. Grade-Level Allocations
Policy
Every student receives a grade weight determined by his or her grade level:
Elementary school students are the keystone to the Fair Student Funding formula, with the weight projected to cover the cost of basic school services. The elementary school weight is set at the primary weight of 1.00, and it serves as the starting point for the calculation of all of the subsequent Fair Student Funding weights.
Middle school students carry the largest weights due to their high drop-offs in student achievement, as well as higher teacher-cost factors. The percentage of students at or above grade level on the 2011 State ELA and Math exams was almost 22 percent lower for 8th graders than for 5th graders (44% dual subject passage rate for 8th graders vs. 56% dual subject passage rate for 5th graders). As middle schools program by subject area, 1.4 middle school teachers are needed to cover each class, compared to 1.2 for elementary school classes.
Students in grades 9–12 are weighted at a slightly higher level than grades K–5 for several reasons: older students tend to have higher costs for non-personnel (such as more costly science materials); they often take electives that break into smaller classes; and their schools often require more administrative personnel. This approach is consistent with our historic funding practices and with practices in other cities.
Eligibility
All students receive Fair Student Funding dollars through grade-level weights.
Schools with non-traditional grade configurations receive their base weight funding in more than one category. For example, a K–8 school receives the K–5 weight for the K–5 grades and a 6–8 weight for the 6–8 grades. A 6th grader carries the same weight whether at a 6–8, a K–8, or a 6–12 school.
9 to 12 1.03
K to 5 1.00
6 to 8 1.08

Resource Guide to School Budgets
14
4.3. Needs-Based Allocations
In addition, students are eligible for needs-based weights for the following characteristics:
Academic Intervention, based on: Poverty for schools beginning before 4th grade
Poverty is used to estimate academic need when test results are not available
Student achievement upon entry for schools beginning in 4th grade or later
Over-Age Under-Credited OTC status
English Language Learner status,
Special Education, and
High School Portfolio.
Incentives To Improve Achievement:
The FSF weights encourage success by allowing schools to get or keep resources when they are successful at improving student achievement: > The academic intervention weight gives more money for enrolling low-achieving students.
Schools keep weighted funds when students improve. > Funding generated by the ELL weight stays in the school the year a pupil scores at a
certain level of proficiency in English on the New York State English as a Second Language Achievement Test (NYSESLAT).

Resource Guide to School Budgets
15
4.3.1. Academic Intervention
Policy
Additional funds are targeted to students at the greatest risk of academic failure. This approach is consistent with a large body of research showing that students who are struggling in school require additional supports to succeed.
In general, we believe that the best way to identify students with greater need is to look at their past achievement. Therefore, to the extent possible, we will rely on student achievement data—State Math and English Language Arts exam results—to identify students eligible for additional funding. We will provide additional funding to schools with struggling students.
At the same time, funding students based on their test results could create unintended consequences. For example, if two schools enroll students with low levels of achievement, and one school achieves great results and the other does not, a system that bases funding on student test scores will cut funding for the school that achieved great results, which would be counter-productive.
Academic Intervention
Poverty Schools Beginning Before
Grade 4 0.12
Achievement Schools Beginning in
Grade 4 or Later
Well Below Standards
Grades 4-5: 0.40 Grades 6-8: 0.50 Grades 9-12: 0.40
Below Standards
Grades 4-5: 0.25 Grades 6-8: 0.35 Grades 9-12: 0.25
Heavy Graduation
Challenge OTC Grades 9-12: 0.20

Resource Guide to School Budgets
16
Based on these considerations, the Department has adopted the following policies:
Students receive additional weights based on their achievement at entry to a school. Based on this methodology, a school will receive additional funding for enrolling struggling students, but will not lose money for success in educating them.
Students who attend a school funded with the achievement weight (instead of the poverty weight), but did not enter the school with test score data (i.e., they transferred from another state or country), can receive the weight based on special “missing score” eligibility criteria.
As the regular citywide first testing occurs in 3rd grade, we can use test data only for schools starting after that grade (i.e., in 4th grade or later). As a proxy for low achievement, poverty is used for schools beginning before 4th grade, although it still is only an estimate of need.
Beginning in FY12, the Fair Student Funding Academic Intervention Poverty Weight changed from .24 to .12 and the methodology used to count pupils as proficient was revised to reflect New York State Education Department’s (NYSED) re-scaling of test scores. The current methodology looks at all students currently enrolled in a school and recalculates what their proficiency would have been at the time of entry using the new state rescaled cut-scores.
Eligibility for Poverty Weight
Students enrolled at schools that begin before grade 4 (e.g., all K–5, K–8, and K–12 schools) qualify for the poverty weight if they also qualify for free lunch (according to ATS lunch form data) and/or receive public assistance (according to data provided by New York City’s Human Resources Administration). These are also the criteria for Title I eligibility.
The poverty student count used in the FSF formula represents the previous year’s poverty data as of December 31, for the students on a school’s prior year register on October 31.
The poverty rate is based on the number of free lunch eligible pupils divided by student enrollment. Pupils are deemed free lunch eligible if there is a completed free lunch form for the child or the student is receiving public assistance that has the same or lower income requirement as free lunch (TANF and food stamps). Student enrollment is based on the October 31st register, which is audited by Office of the Auditor General. Data for such students can be updated through December 31.
At Universal Free Lunch (USM) schools, the poverty percentage for the school is established in the base year that the school enters the USM program. The school is locked into that percentage for the next three years. For these schools, that percentage is multiplied by the total number of students on the previous year’s school registers at the school by the school’s locked in poverty
Resource Guide to School Budgets
17
percentage. Schools receive the poverty weight for all eligible pupils regardless of whether the school meets the Title I cut-off.
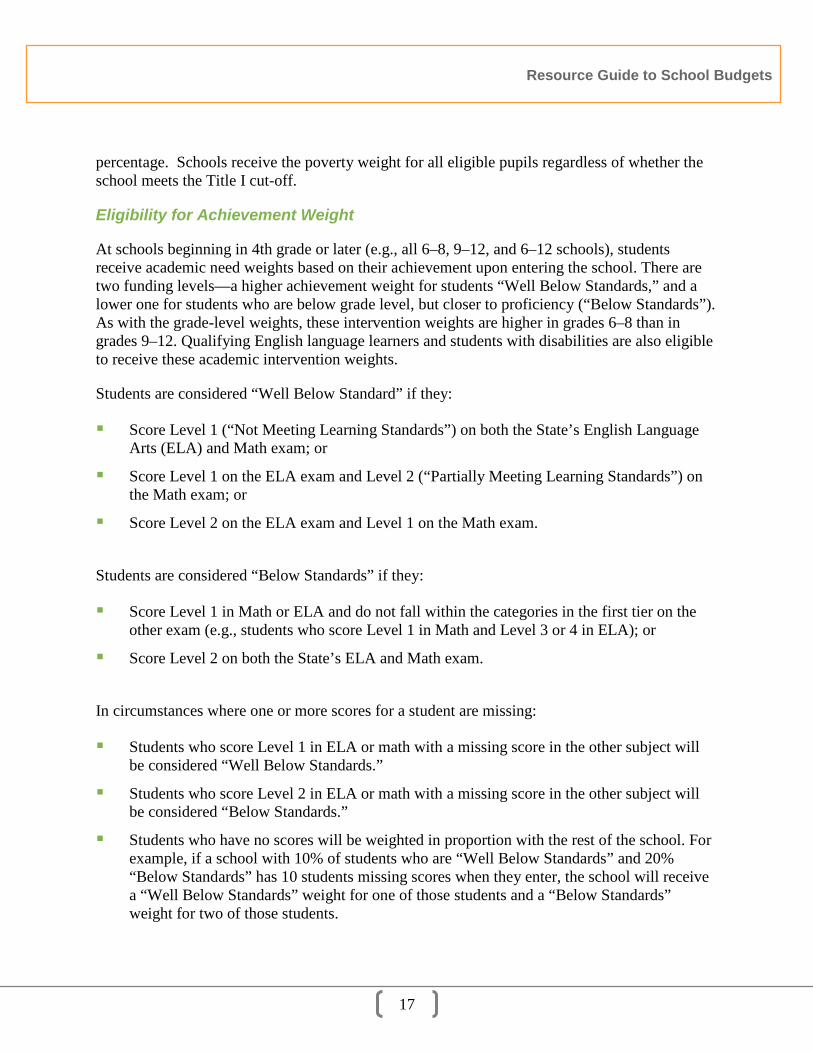
Eligibility for Achievement Weight
At schools beginning in 4th grade or later (e.g., all 6–8, 9–12, and 6–12 schools), students receive academic need weights based on their achievement upon entering the school. There are two funding levels—a higher achievement weight for students “Well Below Standards,” and a lower one for students who are below grade level, but closer to proficiency (“Below Standards”). As with the grade-level weights, these intervention weights are higher in grades 6–8 than in grades 9–12. Qualifying English language learners and students with disabilities are also eligible to receive these academic intervention weights.
Students are considered “Well Below Standard” if they:
Score Level 1 (“Not Meeting Learning Standards”) on both the State’s English Language Arts (ELA) and Math exam; or
Score Level 1 on the ELA exam and Level 2 (“Partially Meeting Learning Standards”) on the Math exam; or
Score Level 2 on the ELA exam and Level 1 on the Math exam.
Students are considered “Below Standards” if they:
Score Level 1 in Math or ELA and do not fall within the categories in the first tier on the other exam (e.g., students who score Level 1 in Math and Level 3 or 4 in ELA); or
Score Level 2 on both the State’s ELA and Math exam.
In circumstances where one or more scores for a student are missing:
Students who score Level 1 in ELA or math with a missing score in the other subject will be considered “Well Below Standards.”
Students who score Level 2 in ELA or math with a missing score in the other subject will be considered “Below Standards.”
Students who have no scores will be weighted in proportion with the rest of the school. For example, if a school with 10% of students who are “Well Below Standards” and 20% “Below Standards” has 10 students missing scores when they enter, the school will receive a “Well Below Standards” weight for one of those students and a “Below Standards” weight for two of those students.
Resource Guide to School Budgets
18
Scores are based on the last result before the student enters his/her current school.
New for FY13: Eligibility for Heavy Graduation Challenge OTC Weight To ensure college and career ready standards for all of our pupils, and in light of the phase-out of the local diploma option for general education students, changes to the Academic Needs Weights are as follows: New per capita allocation for non-transfer school pupils who demonstrate significant
credit accumulation challenges and who are admitted through the over-the-counter enrollment process.
4.3.2. English Language Learners
Policy
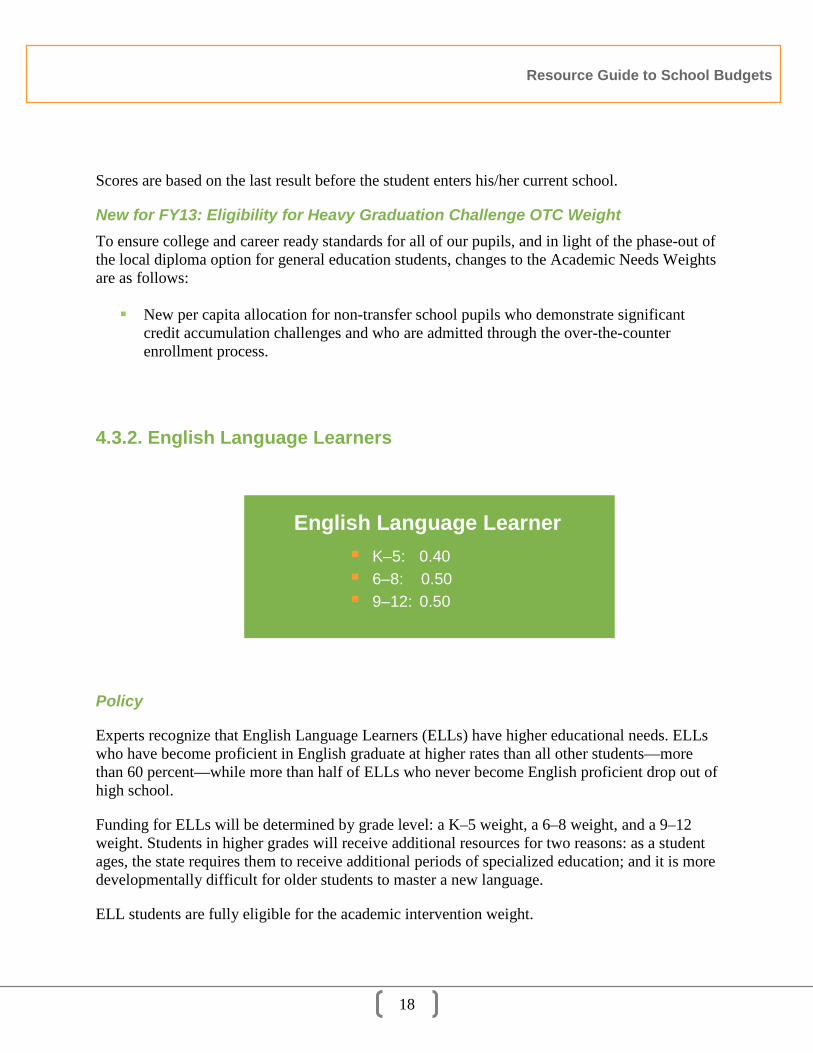
Experts recognize that English Language Learners (ELLs) have higher educational needs. ELLs who have become proficient in English graduate at higher rates than all other students—more than 60 percent—while more than half of ELLs who never become English proficient drop out of high school.
Funding for ELLs will be determined by grade level: a K–5 weight, a 6–8 weight, and a 9–12 weight. Students in higher grades will receive additional resources for two reasons: as a student ages, the state requires them to receive additional periods of specialized education; and it is more developmentally difficult for older students to master a new language.
ELL students are fully eligible for the academic intervention weight.
English Language Learner K–5: 0.40 6–8: 0.50 9–12: 0.50

Resource Guide to School Budgets
19
The current ELL weight incorporates the former state Limited English Proficiency Program.
Programming Considerations
In the New York City Department of Education there are three program options for ELLs: Transitional Bilingual Education (TBE), Dual Language, and freestanding English as a Second Language (ESL). In TBE and freestanding ESL programs, students exit when they reach English proficiency on the New York State English as a Second Language Achievement Test (NYSESLAT). ELLs in Dual Language programs are instructed in two languages from kindergarten through 12th grade. ELLs do not need to exit the program once they reach proficiency.
Transitional Bilingual Education: Standards-based subject matter instruction is provided in the student’s native language with intensive support in ESL. As English proficiency increases, so does the amount of time students are taught in English. English proficiency is accelerated through ESL, ELA, and NLA development.
Dual Language: Two-way DL programs integrate ELLs with native English speakers so that all students develop second-language skills while learning content knowledge in both languages. One-way DL programs afford students of one language group the opportunity to be bilingual.
English as a Second Language: Students in ESL are taught in English using ESL methodologies and native language support for a specific amount of time as determined by their New York State English as a Second Language Achievement Test (NYSESLAT) scores.
The charts below outline the units of instruction for each program.

Resource Guide to School Budgets
20
NYS CR Part 154 Mandated Number of Units of Support for ELLs, Grades K-8
Beginning Intermediate Advanced ESL instruction for all ELLs as required under CR Part 154
360 minutes per week
360 minutes per week
180 minutes per week
ELA instruction for all ELLs as required under CR Part 154
180 minutes per week
FOR TBE /DL PROGRAMS: Native Language Arts 60-90 minutes per day 45-60 minutes per day 45 minutes per day
NYS CR Part 154 Mandated Number of Units of Support for ELLs, Grades 9-12
Beginning Intermediate Advanced ESL instruction for all ELLs as required under CR Part 154
540 minutes per week
360 minutes per week
180 minutes per week
ELA instruction for all ELLs as required under CR Part 154
180 minutes per week
FOR TBE /DL PROGRAMS: Native Language Arts 45 minutes per day 45 minutes per day 45 minutes per day
Native Language Usage and Supports
The chart below is a visual representation designed to show the variation of native language usage and supports across the program models. Please note that native language support is never zero.
Native Language Usage/Support Transitional Bilingual Education (TBE)
100% 75% 50% 25%
Dual Language 100% 75% 50% 25%
Freestanding ESL 100% 75% 50% 25% TIME BEGINNERS INTERMEDIATE ADVANCED
TBE and dual language programs have both native language arts and subject areas taught in the native language; ESL has native language supports.

Resource Guide to School Budgets
21
Eligibility
Students who are identified as ELLs, as determined by the prior year’s Home Language Survey and LAB-R/NYSESLAT results, are eligible for this funding.
The February register data from BESIS survey (as of the October 31 audited data) generate the ELL funding for the initial budget release.
4.3.3. Special Education
Background
In September 2012, all DOE community schools will participate in the special education reform with policy changes to:
Ensure that every school educates and embraces the overwhelming majority of students with disabilities that they would serve if the students did not have IEPs1.
Special Education
Less than or equal to 20%
0.56
21% to 59% 1.25
Greater than or equal to 60% Special Class
K-8: 1.18 9-12: 0.58
Greater than or equal to 60%
Integrated Co-Teaching
K: 2.09 1-12: 1.74
Declassification Supplement
0.12

Resource Guide to School Budgets
22
Hold schools and students with disabilities accountable for goals that are standards-based and reflect Common Core Standards and long-term educational outcomes.
Leverage the full continuum of services and curricular, instructional and scheduling flexibility needed to meet the diverse needs of students with disabilities.
Align school accountability measures, funding formulas and enrollment policies and practices with these principles.
To learn more about the special education reform, please click on this link on the NYCDOE website to the FAQ section of the Raising the Bar for Students & Schools documents and publications.
Beginning in the 2012-13 school year, students who are entering school in an articulating grade or who are enrolled via the over-the-counter process will have the same access to schools as if they did not have an IEP. This means that schools will be required to serve students with IEP. As students will no longer be placed in schools due to program availability, Fair Student Funding is shifting funding for special education away from funding by class type and toward funding by student needs. In doing this, FSF aims to help reinforce that:
Students with disabilities are a wholly integral part of a school, not a separate subset of students. FSF supports the special education reform goal to eliminate the view of special education as strictly prescriptive, immovable, and segregated from the kinds of innovative thinking that occurs in general education.
Students with disabilities are also eligible for grade level, poverty, ELL and academic intervention weights. Funds generated from these weights should be used in addition to the special education weights to support the needs of the student.
_________________________________________________________ The full continuum of services is available to serve students: Schools receive per-student funding based on the number of periods a day that a student requires special education services, rather than funding based on a specific service delivery model. This supports the special education reform goal of increasing schools’ flexibility to develop service delivery models or a combination of models tailored to meet the individual needs of the students.

Resource Guide to School Budgets
23
Policy
Schools will receive per-student funding based on the number of periods a day that a student requires special education services. Fair Student Funding will cover only special education program recommendation services in non-District 75 schools.
While promoting innovation and flexibility, the Department is committed to providing all services required by a student’s Individualized Education Program (IEP). In addition, the Fair Student Funding allocation process provides for significant year-to-year fiscal stability for schools, while also supporting the goals of special education reform; this is because the FSF allocation process applies the FY13 formulas only to changes in each school’s pupil register. Consequently, school budgets are adjusted from year-to-year only for register changes in FSF categories (i.e. changes in the number of students in SC versus ICT). To the extent that a school’s FSF register stays stable; the FSF special education per capita budget will stay stable.
Since new special education enrollment policies in FY13 focus on pupils in articulating grades or entering schools “over-the-counter,” large scale changes in the special education per capita budgets for schools are unlikely in FY13.
Schools That Formerly Received “Class” Allocations
Beginning in FY13, all schools will be funded on a per capita basis for students with disabilities. Schools that received funding for unfilled special education seats in Integrated Co-Teaching (“ICT”) and Self-Contained (“SC”) classrooms in FY12 will receive a transitional support supplement in FY13, adjusted for changes in their filled seat register.
Schools with FY13 projected registers greater than or equal to their FY12 register (filled + unfilled seats) will not receive a supplement, as they will be funded through register growth.
Schools with FY13 projected registers less than their FY12 register (filled + unfilled seats) as of 12-31-2011 will receive a tranistional supplement for the difference between FY12 register and FY13 register, not to exceed the FY12 unfilled seats register.
NOTE: Fair Student Funding does not impact District 75, related services (including mandated speech and counseling services), IEP teachers, IEP paraprofessionals and adaptive physical education teachers, assistive technology, and other special education programmatic allocations. Schools are provided with additional allocations outside of FSF for these needs.
Resource Guide to School Budgets
24
Phase I schools that received a transitional supplement in FY12 will have their initial FY12 projections as the basis for the initial allocation for the FY13 transitional support supplement, and will be funded at the rates set in SAM #30 for FY12.
Non-Phase I schools will have the FY 12 register for special education (12/31) as the basis for the initial allocations of the FY13 supplement, and will receive the FY12 FSF rates multplied by the school’s FSF percentage of funding. All schools that receive the transitional supplement will be subject to an adjustment based on the 12-31-2012 register for students with disabilities.
The transitional supplement will be provided at 100% of the FY12 rates in FY13, and will be gradually phased down over ensuing years.
In conjunction with the FSF needs funding; the transitional supplement allocation will be adjusted for changes in register and IEP programs through December 31st.
The Fair Student Funding formula generates sufficient resources to support the classroom/basic paraprofessional in a 12:1:1 self-contained setting. No additional funding will be provided.
Students with disabilities also are eligible for the poverty, ELL, and academic intervention weights. Therefore, significant resources will be available to fund the needs of these students.
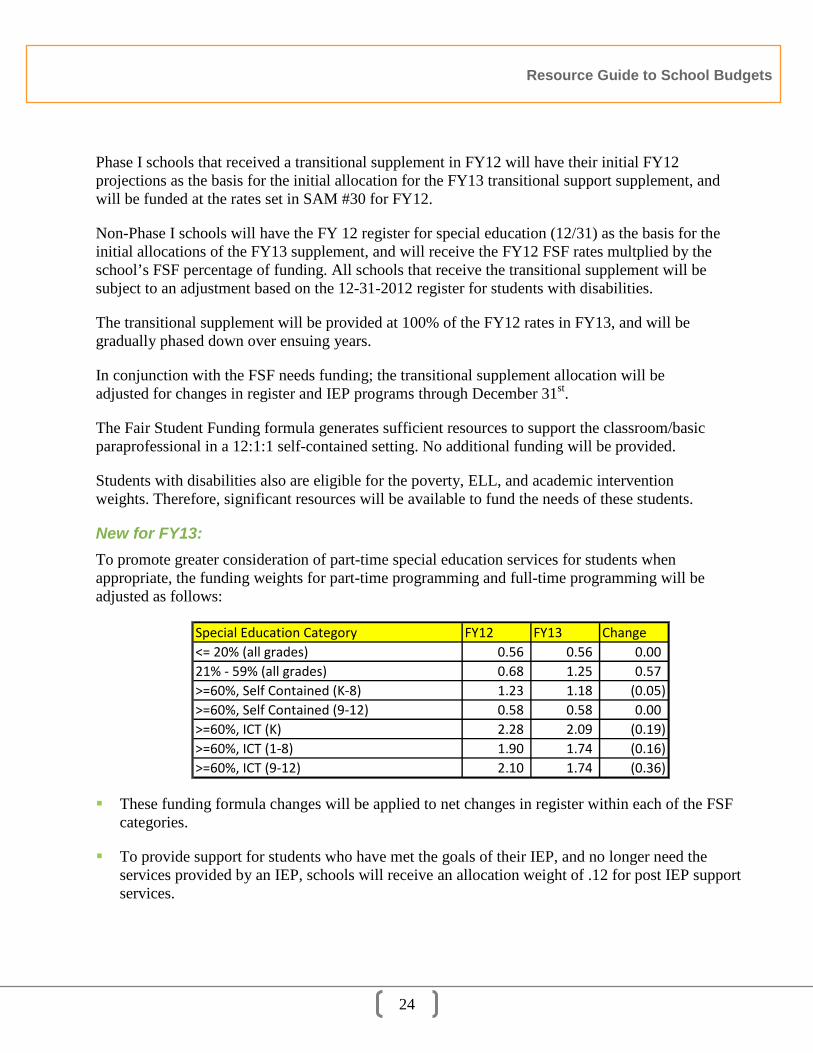
New for FY13: To promote greater consideration of part-time special education services for students when appropriate, the funding weights for part-time programming and full-time programming will be adjusted as follows:
Special Education Category FY12 FY13 Change<= 20% (all grades) 0.56 0.56 0.0021% - 59% (all grades) 0.68 1.25 0.57>=60%, Self Contained (K-8) 1.23 1.18 (0.05)>=60%, Self Contained (9-12) 0.58 0.58 0.00>=60%, ICT (K) 2.28 2.09 (0.19)>=60%, ICT (1-8) 1.90 1.74 (0.16)>=60%, ICT (9-12) 2.10 1.74 (0.36)
These funding formula changes will be applied to net changes in register within each of the FSF categories.
To provide support for students who have met the goals of their IEP, and no longer need the services provided by an IEP, schools will receive an allocation weight of .12 for post IEP support services.

Resource Guide to School Budgets
25
Eligibility
The table below provides a summary of the types of services that map to each category of special education funding:
FSF Category Examples of Services
Less than or equal to 20%
Special Education Teacher Support Services (SETSS) or any single period per day of Self-contained or Integrated Co-Teaching (ICT)
Between 21% and 59% Multiple SETSS, or multiple periods per day of Self-contained or Integrated Co-Teaching (ICT)
Greater than or equal to 60% Self-contained
Self-contained students including 12:1, 12:1:1 and 15:1
Greater than or equal to 60% Integrated ICT
The percent of time is determined as number of periods of special education instructional programming divided by the standard academic full-day academic program. Full-day academic program represents all periods excluding lunch. Please see the chart on the next page, which defines the criteria for FSF special education funding categories based on a 30 and a 35 period academic week.
Chart revised 1/15/13.

Resource Guide to School Budgets
26

Resource Guide to School Budgets
27
4.4. High School Portfolio
Policy
At the high school level, we provide students with a portfolio of different education models. Students attending these schools will continue to be eligible for additional funding. Portfolio categories for the 2012-2013 school year are:
Career and Technical Education;
Specialized Academic;
Specialized Audition; and
Transfer.
Eligibility
Career and Technical Education (CTE): All students are engaged in sequences of instruction that integrate rigorous academic study with workforce skills in specific career pathways. The weight does not include comprehensive high schools with CTE courses or career-themed schools with no formalized CTE programs.
Students will be funded according to a four-tier structure recommended by the Office of Career and Technical Education as follows (a more detailed listing appears on the next page):
Health (Nursing only)
Health / Trade & Industry / Technical Education
Business
Home Economics and Fine & Performing Arts The tiered structure of the CTE funding reflects the relative cost factors necessary to operate different CTE programs of study. The significant factors reflected in this structure are: class size requirements, equipment and materials, industry training for teachers, and start-up costs. Tier 1 and 2 programs require significantly lower class size, industry specific equipment and highly specialized and ongoing industry training.
The weights assigned to the remaining tiers account for the proportional class size requirements, the level and frequency of industry training required and the nature of the equipment and materials for the programs in each tier. The tier 3 and 4 programs do not have significant class

Resource Guide to School Budgets
28
size requirements, but still incur equipment and material costs, as well as ongoing industry training needs, that are more significant than traditional schools.
The simple Tier definition labels on the previous page do not adequately capture the range of program pathways encapsulated in each tier. Further explanation is summarized on the chart on the next page and detailed program level information can be provided by Office of Career and Technical Education.
CTE Program Tiers Tier 1
Programs Tier 2
Programs Tier 3
Programs Tier 4
Programs Nursing
Architecture & Construction: Technical pathways
Architecture & construction: pre-design and design pathways
Arts, AV, Technology & Communications pathways
Agriculture & Veterinary
Health Science (pathways other than nursing)
Commercial Arts Business pathways
Aviation Technology
Computer networking and repair
Engineering Management & Administration
Cosmetology Law enforcement Finance Automotive
technology and repair
Hospitality & Tourism Marketing, Sales, Services
Information Technology relating to business
Media & communications (including some graphics pathways)
Policy Education Journalism Law studies

Resource Guide to School Budgets
29
Specialized Academic: This category continues to capture academically challenging high schools that have been funded at a higher level in the past.
Specialized Audition: All students within the school participate in the equivalent of a five-year sequence through two double periods daily of study in their art form.
Students in these schools are admitted through a screening process that involves a performance audition or a portfolio review.
Students take and pass a Comprehensive Exit Exam in the art form of choice in grade 12 and receive the Arts Endorsed Diploma.
Transfer: Small high schools designed to re-engage students who have dropped out or are over-age and under-credited for grade, as identified by the Office of Post-Secondary Readiness.
Beginning in school year 2012-2013, the weight for transfer school pupils is revised to better align resources to student need. The single transfer weight is replaced by a two-tiered weight. The new weights apply to over-age and under-credited (OAUC) pupils based upon the combinations of pupils’ age and credits. Older pupils with fewer credits are classified as “heavy” graduation challenges and other OAUC pupils are classified as “regular” graduation challenges.
New for FY13: Two-Tiered Per Capita Funding for Transfer School Pupils To ensure college and career ready standards for all of our pupils, and in light of the phase-out of the local diploma option for general education students, changes to the Portfolio and Academic Needs Weights are as follows:
Two-tiered per capita funding for transfer school pupils based on level of graduation challenge
Note that in line with this change, there is also a new per capita allocation for non-transfer school pupils who demonstrate significant credit accumulation challenges and who are admitted through the over-the-counter enrollment process

Resource Guide to School Budgets
30
4.5. How Students Are Counted
4.5.1. Grade and Special Ed Weights: Projected Enrollment
Principals review the projected register developed for their schools by the Office of Student Enrollment (OSE), and have an opportunity to appeal the projected registers based on their own data, each spring. The projected registers and appeal process is done in a web-based register tool. The outcome of this annual process yields the register projections for each school that are the basis for funding of general education and students with disabilities.
4.5.2. Need Weight Registers
The Academic Intervention and ELL weight are based on test score data for pupils from the prior year. Principals expressed a strong preference for avoiding downward adjustments on difficult to predict characteristics.

Resource Guide to School Budgets
31
4.6. Mid-year adjustments
4.6.1. Final Mid-year Adjustments
Mid-year adjustments will be made for grade-level and portfolio weights based on audited October 31. For special education needs, December 31 data is used for all schools, as noted in the following chart:
The Additional Spending Authority (ASA) loan program for register growth and set aside process for register loss will continue in anticipation of this mid-year adjustment for general education and special education.
School Type
Based on Audited
10/31/2012 Registers
Based on 12/31/2012
Registers
Grade WeightElementary (Grades K-5) XMiddle School (Grades 6-8) XHigh School (Grades 9-12) X
Special Education Needs WeightLess than or equal to 20%
Elementary (Grades K-5) XMiddle School (Grades 6-8) XHigh School (Grades 9-12) X
Between 21% and 59%Elementary (Grades K-5) XMiddle School (Grades 6-8) XHigh School (Grades 9-12) X
Elementary (Grades K-5) XMiddle School (Grades 6-8) XHigh School (Grades 9-12) X
Post IEP Support X
Portfolio WeightHigh School X
DATA SOURCES for MID-YEAR ADJUSTMENT
FSF Category
Greater than or equal to 60% Integrated and Self-Contained
Registers used for the mid-year adjustment are net of long term absent pupils (LTAs).

Resource Guide to School Budgets
32
Adjustments are taken by multiplying the net change in register by the per capita associated with the weight, based on the FSF factor by which a school is funded:
At-formula and above schools: 100% up and down; and
Under-formula: 100% up and percentage under-formula down.
An example of the mid-year adjustment calculation for an under-formula elementary school losing register appears below.
Sample Mid-Year Adjustment Calculation for an Under-formula Elementary School Losing Register
Sample Weight Per Capita
Projected Register
Audited Register Change Net
Impact
K–5 grade 1.00 $4,120 700 688 –12 ($49,440)
SPED <=20% .56 $2,307 30 35 5 $11,535 SPED >=60%, ICT (Grades 1-5) 1.90 $7,170 40 36 -4 ($28,680)
FSF Mid-year Adjustment Subtotal = ($66,585)
Fair Student Funding Percentage 92%
Final Mid-year Adjustment = ($61,258
Note: The “Fair Student Funding Percentage” for your schools’ FY13 mid-year adjustment can be found on the Fair Student Funding School Overview page at http://schools.nyc.gov/AboutUs/BudgetsFairStudentFunding/YourSchoolBudget/default.htm.
Specifics on Special Education Adjustments
Less than or equal to 20% and between 21% and 59%:
Generally covers combinations of SETSS, Multiple-SETSS, part-time SC and part-time ICT services.
New for FY13: New Screen in ATS and Coding Requirements for Special Education Services for Students with Disabilities

Resource Guide to School Budgets
33
A new screen is in development in ATS in support of the Special Education reform that will allow schools to indicate services being provided to Students with Disabilities so that schools can be funded accordingly through Fair Student Funding. The new screen is tentatively scheduled to be operational in mid-July so that services to students can be captured for the coming school year. Pupil accounting staff should be alerted to this coming change. An announcement will appear in the Principals Weekly Newsletter when the new screen is available.
Data to compare projected register to data taken from Regional Net Register Report (RNRR) in ATS (using data captured from new screen noted above);
As of December 31; and
Difference between projected and actual multiplied by the associated per capita.
Greater than or equal to 60% integrated and self-contained:
Generally covers ICT and self-contained services received for 60% or more of the academic week;
ATS data will be used to report on registers as of December 31.
New schools’ Special Education weights (Per Capita Schools):
New elementary and middle schools, as well as high schools, are funded on a per-student basis for students with disabilities based on the following parameters:
Net register change multiplied by associated per capitas and school FSF funding percent.

Resource Guide to School Budgets
34
Specifics on academic intervention and ELL weights. Adjustments for need characteristics will not be made at the mid-year. As noted above, it is cost-prohibitive to provide for upward adjustments based on register changes without also providing for downward adjustments Principals have expressed a strong preference for avoiding downward adjustments. In addition, audited data present the most accurate basis for funding student needs.
4.6.2. Register Reserve Policies To decrease the risk of hiring more teachers than necessary, should enrollment increases not materialize, and to address unexpected enrollment increases, the following register reserve policies have been instituted in FY13.
School budgets will be monitored by the Office of the Chief Financial Officer to ensure sufficient funding is available to cover register loss in the event it should occur. Principals are reminded that fiscal management is a priority and they will be held accountable for their budgetary decisions. Register Gain Reserve To lessen the risk of hiring more teachers than necessary, should enrollment increases not materialize, and to address unexpected enrollment increases, funding for 50% of the projected register growth will be held in reserve on school budgets. Schools will work with their CFNs to release reserved register growth funds when actual register growth is evident. This policy applies only to currently open schools; new schools and phase-out schools are excluded. Once again this fall, a preliminary allocation adjustment for register loss will take place in advance of the audited register data. Further information about the register adjustment process will be issued before school starts in September. Final adjustments based on audited data will take place in February 2013.
Summary of Special Education Mid-Year Adjustment Process
FSF Special Education Category All Schools Per Capita Allocations
Less than or equal to 20% Yes Between 21% and 59% Yes Greater than or equal to 60% Self-contained Yes Greater than or equal to 60% Integrated Yes

Resource Guide to School Budgets
35
New Reserve for Register Loss Schools with register loss in at least two of the past five years, that have not been able to pay back owed funds or had an outstanding payback plan, will have a “Register Loss Reserve Set Aside” equivalent to a minimal percentage of their FY2013 TL FSF allocation. This amount will be automatically scheduled in their Galaxy Table of Organization. Schools will work with their CFNs to release reserved register loss funds when actual register growth is evident.
4.7. Special Rules for New Schools, Transfer Schools, and Phase-Out Schools
4.7.1. New schools
Schools opening in September 2012 do not have existing budgets and will receive their FSF Formula.
Poverty Weight. Year One new schools are funded using the citywide cutoff level of 60 percent except for sites where the actual poverty information is known, such as for program conversions.
Academic Intervention. Based on information on existing new schools, schools opening in September 2012 are funded based on the following assumptions of their entering students’ needs:
Well Below Standards:
High School—26%
Middle School—7%
Secondary—26% if only grades 9 to 12, 7% for grades 6 to 8
Elementary School— county based poverty threshold (if start before grade 4) Below Standards:
High Schools—34%
Middle School—12%

Resource Guide to School Budgets
36
Secondary Schools—34% if only grades 9 to 12, 12% for grades 6 to 8
Elementary Schools—county based poverty threshold (if start before grade 4)
ELL Weights. Based on information on existing new schools, schools opening in September 2012 are funded based on the following assumptions except for sites where the actual student information is known:
ELL focused schools—100% ELL population
Non-ELL focused schools—8% ELL population
4.7.2. New transfer schools
Academic. Based on historical information for existing transfer schools, new transfer schools’ academic weights are funded based on the following assumptions:
Well Below Standards—35% of the general education population
Below Standards—29% of the general education population ELL. Based on historical data for existing transfer schools, new transfer schools are funded with an assumption of having a population of three percent ELLs.
4.7.3. Phase-out schools
Poverty. The previous school year poverty percentage is applied to the schools projected enrollment to determine the poverty student count for schools that are phasing out.
Academic. The previous school year academic percentage is applied to the schools projected enrollment to determine the academic intervention student count for schools that are phasing out.
ELL. The previous school year ELL percentage is applied to the school’s projected enrollment to determine the ELL student count for schools that are phasing out.

Resource Guide to School Budgets
37
CHAPTER 5: CONTINUING THE TRANSITION TO FAIR STUDENT FUNDING
In order to balance the sometimes competing priorities of equity and stability, and due to successive years of budget reductions, we have not yet fully implemented Fair Student Funding for allocating resources. Rather, we are still gradually transitioning to a straight-formula system. Why?
Since FSF was implemented, the growth in salaries and the increases in mandated costs have exceeded the funding available for FSF due to Campaign for Fiscal Equity (CFE) dollars that DOE never received and budget cuts.
As a result, the Fair Student Funding budgets for a great number of schools are still below the “entitlement” amount based upon full application of the Fair Student Funding formula. When fiscal circumstances permit, DOE supplements allocations to the schools which have been receiving less than the full FSF-predicted amount of funding in order to improve equity among schools. For example, in school year 2011-2012, DOE applied funding provided by New York City to backfill the loss of federal America Recovery and Reinvestment Act (ARRA) funds, to FSF to move schools most below the FSF formula closer to the formula. In order to balance the often competing priorities of equity and stability, some schools will be over-funded. As started last year, each school’s relative position to the full Fair Student Funding formula is evaluated relative to 100% funding. Schools with funding percentages greater than 100% will receive the dollars greater that 100% in the allocation category “TL Funds Over Formula.”
We maintain our strong commitment to continuing our progress towards equitable funding for all schools. We will continue to value stability in the future while working to bring under-formula schools up to their fair funding level as the fiscal situation permits.
Resource Guide to School Budgets
38
5.1. Budget Reductions
For the first time since FY07, schools’ budgets will not sustain a year-over-year cut. After adding $2 billion last year to cover the loss of Federal stimulus funds and State budget cuts, this year the Mayor’s budget increases City funding for education, rising from $13.1 billion in FY12 to $13.4 billion in FY13. The DOE FY13 budget also includes a 3.9% increase of State funds. State education support, however, remains well below FY09 funding levels and continues to drop as a share of total DOE funds.
The increased revenue allows the City to restore general education teaching positions, previously slated for reduction through attrition, and to maintain overall funding levels to schools. System-wide rising costs, for items such as special education mandates, teacher compensation, and register changes, impose an additional burden on DOE’s overall budget. But the department has been working diligently to accommodate reductions in central and field budgets in order to absorb these rising costs and prevent school-level financial impact.
The FY13 budget relies on receiving $300 million of funding that will only be realized if the City and the United Federation of Teachers agree on a teacher evaluation system that meets State and Federal requirements no later than January 2013. If an agreement is not reached, the State will not be able to provide the $300 million to DOE, which is needed to maintain services in our schools.
The FY13 budget is also conditional on anticipated federal revenue. For all federal funding, final school allocations will be subject to final New York State Education Department allocations to Local Education Agencies and Congressional authorization.
5.2. Online Budget Reports
To increase transparency for principals, families, community members, and other key stakeholders, budget reports similar to the following samples are available for every school.
In response to feedback from schools and CFN staff, and in an effort to provide more transparency and clarity to the FSF budget process, the format of the web reports has been updated. Expandable and collapsible fields and enhanced help descriptions have been added to the online report with the hope that you find these pages easy to read and digest.
Fair Student Funding Overview
Fair Student Funding Details

Resource Guide to School Budgets
39
Samples appear on the following two pages.
Each report shows the school’s pure formula funding level and how it is achieved by displaying how many students receive each kind of weight. This year we are showing the detail behind their funding adjustment from last year to this year.
At the bottom of each report, the school’s total funding is shown by bringing in the other allocations that school receives in the initial allocation.
Reports are available at: http://schools.nyc.gov/AboutUs/BudgetsFairStudentFunding/YourSchoolBudget/default.htm.

Resource Guide to School Budgets
40
FAIR STUDENT FUNDING OVERVIEW SAMPLE REPORT

Resource Guide to School Budgets
41
FAIR STUDENT FUNDING DETAILS SAMPLE REPORT

Resource Guide to School Budgets
42
CHAPTER 6: STAFFING
6.1. Background
6.1.1. How Schools Pay for Teachers
Before Fair Student Funding, we used to fund schools based on the teachers hired. This meant that we gave more money to schools for having more experienced and, higher-paid teachers. The inevitable corollary was that we gave less money to schools for having lower-paid teachers who are less experienced.. At two schools with 100 teachers each, one with teachers earning an average of $70,000 and one with teachers earning an average of $80,000, the funding difference could reach $1 million. That difference was especially troubling when we knew that the school with lower-salaried teachers likely had greater needs.
The Funding Gap
School A School B
X School-wide average salary of $70,000
X School-wide average salary of $80,000
100 Teachers 100 Teachers
= $ 7,000,000 = $ 8,000,000
To address this inequity, under a policy announced by the Chancellor in May 2007, schools began to be funded based on the needs of their students, not the salaries of their teachers. Under this approach, a school no longer receives less money because it has less experienced teachers. Schools receive an allocation based on their students—their Fair Student Funding allocation—and schools are responsible for paying their teachers out of that allocation. This way of managing a budget is familiar to families, universities, and businesses.
6.1.2. Student Achievement Is the Bottom Line
We hold principals accountable for one thing above all: student achievement. Principals can never pocket financial “savings”; they can only spend resources on other supports they believe
Resource Guide to School Budgets
43
will better serve students. High-quality, experienced teachers contribute enormously to student achievement. In important ways, they can lower costs; rather than needing support themselves, these teachers can offer support to others. In fact, principals have been hiring experienced teachers through the Open Market system at the same or greater rates than newer teachers for just these reasons. The bottom line for a principal will always be simple: make the decision that will get the best results for your students.
6.1.3. Preserving Stability
Schools have not experienced radical changes due to the implementation of the Fair Student Funding formula. They have taken advantage of new opportunities and more flexibility through careful planning.
Throughout the transition to Fair Student Funding, the following policies preserve many key aspects of the previous approach to funding schools for teachers:
Through Fair Student Funding schools receive adequate funding for a mix of junior and senior teachers. Formula’s grade weights are built to allow a school to pay its base teachers at the Citywide Average, meaning the school’s teacher salary average can be made up of a mix of new and experienced teachers. Each year funds are added to school’s Fair Student Funding grade-level and need weights to compensate for growth in teacher salaries.
As the salaries of teachers on a school’s payroll prior to April 2007 increase, we continue to provide additional funding to cover their expense in accordance with the former policy to allocate funds for each school’s teacher salary growth for the base number of teachers. For “base” teachers (the number of teachers needed to meet contractual maximum class sizes), the Department has provided additional funding to cover increases in salary due to longevity, steps and differentials in the past. The additional funding is based on the number of base teachers who were on school budgets as of April 2007 for as long as they remain on those budgets. This protection is linked to specific staff members and funding is issued in the legacy teacher allocation.
We continue to charge schools for all teachers at a single rate, the school’s average teacher salary, which is held constant throughout the entire school year. Principals don’t have to worry about teacher salaries on a hire-by-hire, real-time basis. And as in previous years, we will adjust the average salary at which teachers are charged each year.
If schools so choose, they are able to replace departing senior teachers with other senior teachers. If a teacher with a $75,000 salary retires, then other things being equal, the school will be able to replace that teacher with another teacher earning roughly $75,000.

Resource Guide to School Budgets
44
6.2. Gradual Transition
6.2.1. Principals are responsible for costs of new hires
As of April 2007, in order to give principals greater control over their schools budgets, the Department no longer adjusts budgets based on the salaries of teachers newly hired into or leaving schools. Schools receive their money based on their students, through the FSF formula, and allocate it as they feel is most appropriate for the school’s bottom line: improving achievement.
With the greater control over budgets that this approach created, principals have both new opportunities and new responsibilities. Schools can choose how to combine their investments in different types of teachers, services, and supports to improve student achievement. Principals will invest in great staff, but will do so in a way that is realistic for their budget.
As an example, prior to Fair Student Funding, if a principal was choosing between a $60,000 teacher and an $80,000 teacher for a base teacher position, that principal’s decision changed the schools budget. Absent other salary changes or attrition, the budget rises $20,000 if the principal chooses the $80,000 teacher. Previously, the school was effectively not charged for the increased salary costs. In many ways, the school was also penalized for hiring a less experienced teacher.
Old Budgeting System Fair Student Funding
Budget: Base Teachers at SW Average (Positional) Charge: SW Average Salary of $70k Replacement hire: $60k
• Budget reduced by $10k • Expenses reduced by $10k • Effect: none
Or, Replacement hire: $80k
• Budget increased by $10k
Budget: Based on student mix Charge: SWA salary $70k Replacement hire made in FY12: $60k
• Budget is unchanged because of hire
• Expenses reduced by $10K in FY13 • Effect: Purchasing power increases
by $10k. Savings for FY13 can be used for other supports such as mentoring, extended day programs, supplies, and/or intervention
Or, Replacement hire made in FY12: $80k
• Budget is unchanged because of hire

Resource Guide to School Budgets
45
• Expenses increased by $10k • Effect: none
• Expenses increased by $10K in FY13
• Effect: Purchasing power
decreases: $10k. Additional cost for FY13 funded with tradeoffs made within the school budget
While there is no known collective bargaining increase for FY13, if an agreement is reached that includes raises for teachers, schools will be funded for increases in all teachers’ salaries due to collective bargaining (contractual raises) through the FSF weights.
The school is also accountable for funding any raises in future years for the teachers they hire. For base teachers on school budgets before April 2007 the department is providing funding to support salary increases. (See section 6.3. for more information.)
It is important to note that the Fair Student Funding formula provides schools with adequate funding for their teachers to have an average salary equal to the city-wide average salary. The grade weights that all students receive are structured to cover base teachers at the city-wide average, as well as cover core programming and other core schools costs.
6.2.2. A one-year lag for many decisions to take effect
When schools replace existing teachers, there will be a lag-time for the effect. Because we continue to charge schools at a fixed school-wide average teacher salary for the year, principals will not immediately feel the impact of replacing existing teachers. The effect of new hires on the school-wide average teacher salary will not be felt until a year later, when the school-wide average teacher salary is adjusted.
For example, if a school hired either a $60,000 teacher or an $80,000 teacher last school year, the school was charged the same amount, whatever its current average salary was last year. However, this school year, the school’s average salary will rise or fall based on the costs of the teachers hired this past year. The school will have roughly $20,000 more or less left to spend on other priorities this year, depending on whether the school hired the $60,000 or the $80,000 teacher.

Resource Guide to School Budgets
46
The policy of lagging the salary impact of hired, transferring, and exiting teachers was made in direct response to principals’ requests for planning time to manage the effects of their decisions. For example, if a principal wants to bring on a more experienced teacher, he or she will have a year to plan for any effect on their total cost.
The cost to the school remains unchanged in the current year only when the new hires are replacing existing positions. When schools add teaching positions that don’t currently exist, the school will pay for that teacher at the current school-wide average teacher salary, but the school’s overall expenses will increase due to the increase in overall teachers.
6.3. Legacy Teacher Funding In 2007, the Department committed to funding schools for the increasing costs of longevity, steps and differentials for their base teachers who were on the school’s budget as of April 2007. This funding will be given to schools as a separate allocation, the Legacy Teacher Supplement. It is intended to help ease the transition to charging actual salaries for teachers.
School A School B
February 2012 salary snapshot
50 teachers
Average salary through June 2012: $64,000
50 teachers
Average salary through June 2012: $68,000
June 2012–February 2013
5 teachers retire. Replaced with 5 relatively lower-salary teachers; school is charged
$64,000 for them.
5 teachers retire. Replaced with 5 relatively higher-salary
teachers; school is charged $68,000 for them.
February 2013 salary snapshot
50 teachers
New average salary charged for all teachers through June
2013: $61,000
50 teachers
New average salary charged for all teachers through June
2012: $71,000
June 2013–February 2014
3 relatively higher-salary teachers hired; no teachers
leave. School is charged $61,000 for them.
4 relatively lower-salary teachers hired; no teachers
leave. School is charged $71,000 for them.

Resource Guide to School Budgets
47
The Legacy Teacher Supplement is calculated the following way:
The total increase of legacy teachers’ salaries is divided by the number of legacy teachers to get the increase per legacy teacher.
To the extent that funds are allocated to each school through Fair Student Funding for the system-wide annual growth in teacher salaries for each of their teachers, these extra funds, per teacher are removed from the increase per legacy teacher.
The adjusted increase per legacy teacher is then multiplied by the number of remaining base teachers at the school to get the total supplement given to the school.
The number of remaining base teachers is calculated by subtracting the number of exits or transfers out of a school from an adjusted number of base teachers in FY08.
Note: If the number of base teachers calculated on the FY13 projected registers is lower than the FY08 base number of teachers less attrition, then the FY13 number is used instead.
Here is a sample school that, for the purposes of simplicity, has had the same five teachers since 2007. Also since 2007, this school has had a calculated base number of teachers equal to four, due to an unchanging student population. In the 2012 school year, one teacher left to be replaced by a new teacher, and four legacy-teachers remain.
.
Legacy Teacher Salary Supplement
Annual increases for all legacy teachers - Average Teacher Salary Increase for all legacy teachers (allocated separately)
÷ Lesser of [FY08 base teachers - exits and transfers] or FY 13 projected base teachers
$ 11,250=Total legacy teacher supplement$ 3,750 *Average salary increase
3=Number remaining base teachers
1–Exits and transfers
4Number base teachers*
$ 3,750 =Average salary increase
4/Number legacy teachers
$ 15,000Total salary increases
Legacy Teacher Supplement Calculation
$ 11,250=Total legacy teacher supplement$ 3,750 *Average salary increase
3=Number remaining base teachers
1–Exits and transfers
4Number base teachers*
$ 3,750 =Average salary increase
4/Number legacy teachers
$ 15,000Total salary increases
Legacy Teacher Supplement Calculation

Resource Guide to School Budgets
48
*In most cases this will be the FY07 base number of teachers (BNTCH). However , for schools where enrollment has dropped significantly, the FY13 base number may be used instead if it is less than the calculation above would be.
The salary increases due to longevity and differentials during 2011-2012 of the four teachers who were at the school prior to April 2007 total $15,000.
This total is divided by the number of legacy teachers at the school, to give an average increase of $3,750.
This average increase is then given to all base teachers according to the FY08 count, based on register at that time, which in this case is four, less the exits and transfers. In this school’s case, since one legacy teacher is leaving this year, the count of base teachers becomes three. Since this count of base teachers is lower than the FY13 count of projected base teachers, which is still four, then the FY08 count with adjustments is used.
The Legacy Supplement given to the school is the product of those three teachers times the average increase: $11,250.
6.4. The School-Wide Average Salary The school-wide average (SWA) salary is the amount schools are charged for the cost of every teacher for the entire year. It reflects the full savings (or cost) for teachers hired over the past year.
The school-wide average salary is calculated by taking a snapshot of all active teachers at a school as of February, 2012. The salaries of those teachers are forecasted for their amounts as of June 30, 2012 to capture longevity, differentials, and collective bargaining increases. The forecasted salaries for the teachers are totaled and then divided by the number of active teachers as of February 2012.
The only teachers not included in a school’s average teacher salary snapshot are those hired from the excess pool under a subsidy program whereby the central DOE will cover the difference between the teacher’s actual salary and the salary of a new hire for eight years (see CHAPTER 9: Absent Teacher Reserve Subsidy Funding). To ensure that schools are not charged for these teachers’ actual salaries for the eight years after they are hired, their salaries are not included in the average teacher salary calculation during the time that they are working under this agreement. Instead, the schools are granted a separate allocation for the difference between their average teacher salary (the amount schools are charged for each and every teacher) and the starting salary of a new teacher.
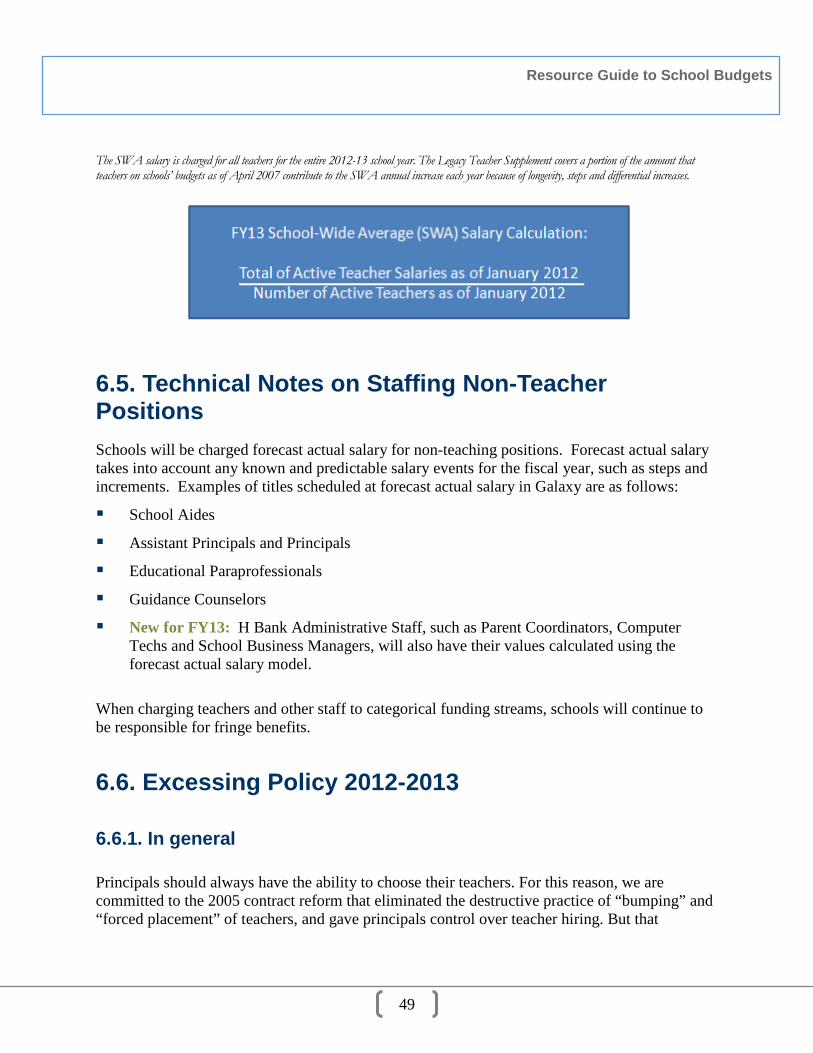
Resource Guide to School Budgets
49
The SWA salary is charged for all teachers for the entire 2012-13 school year. The Legacy Teacher Supplement covers a portion of the amount that teachers on schools’ budgets as of April 2007 contribute to the SWA annual increase each year because of longevity, steps and differential increases.
6.5. Technical Notes on Staffing Non-Teacher Positions Schools will be charged forecast actual salary for non-teaching positions. Forecast actual salary takes into account any known and predictable salary events for the fiscal year, such as steps and increments. Examples of titles scheduled at forecast actual salary in Galaxy are as follows:
School Aides
Assistant Principals and Principals
Educational Paraprofessionals
Guidance Counselors
New for FY13: H Bank Administrative Staff, such as Parent Coordinators, Computer Techs and School Business Managers, will also have their values calculated using the forecast actual salary model.
When charging teachers and other staff to categorical funding streams, schools will continue to be responsible for fringe benefits.
6.6. Excessing Policy 2012-2013
6.6.1. In general
Principals should always have the ability to choose their teachers. For this reason, we are committed to the 2005 contract reform that eliminated the destructive practice of “bumping” and “forced placement” of teachers, and gave principals control over teacher hiring. But that

Resource Guide to School Budgets
50
commitment has a corollary: once teachers are in a school, principals are responsible for them. If a principal has a poorly performing teacher, the principal has several appropriate options, but excessing is never one of them. Empowerment means principals bear the chief responsibility for the staff currently in their building.
Continuing last year’s policy, the Department will require schools to maintain all staff, absent the extraordinary circumstances defined below. Such staff must remain on the schools’ Table of Organization in Galaxy.
The Department will only centrally fund excess teachers when thresholds are met:
1. Register Loss: Schools experiencing a register loss of at least 3.5 percent when compared to the audited October 30, 2012 register for school year 2012-13;
2. Grant Funding: Schools which can demonstrate a significant unanticipated loss or reduction to grant funding (and confirmed by CFN);
3. Grade Loss: Schools experiencing loss of grade from prior year (and confirmed by CFN); or
4. In addition to the above, schools must demonstrate financial need under the criteria detailed in SAM #36.
The reason selected should appropriately describe the situation applicable to that person. Additionally, the excess reasons prefaced by letters “CFN” are for CFN use only—not schools’ use.
6.7. Other Tools for Staffing
There are several other tools to help principals manage their staffing responsibilities:
New Teacher Finder (NTF): Applications in the New Teacher Finder contain information about applicants’ teaching history and education experience, which can be used to help principals make optimal hiring decisions for their schools.
Open Market Transfer System (OM): Applications received through the OMTS contain information about the forecasted 2013 salary of the applicant.
Tenure Notification System (TNS): Principals receive notices and reminders of dates when teachers are scheduled to receive tenure.
Principals may wish to review the salary schedules under the current collective bargaining agreement, available at: http://schools.nyc.gov/Offices/DHR/TeacherPrincipalSchoolProfessionals/Salary/Salary+Step+and+Differential+Schedules.htm.

Resource Guide to School Budgets
51
CHAPTER 7: CONTRACT FOR EXCELLENCE (C4E) The Department of Education (DOE) receives a portion of its overall budget in the form of Foundation Aid from New York State. While the State allows some of the increase in year-over-year Foundation Aid funding to be used for growth in general operating costs and investment in ongoing programs, the majority of the increase is subject to the provisions of the “Contracts for Excellence.” New York City schools received Contracts for Excellence (C4E) funds for the first time in school year 2007-08.
The Governor's 2012-13 Approved Budget states that, “school districts that submitted a contract for excellence for the two thousand eleven - two thousand twelve school year, unless all schools in the district are identified as in good standing, shall submit a contract for excellence for the two thousand twelve-two thousand thirteen school year.” Funds are to be used to support C4E allowable programs, as approved by the Commissioner.
Please note that to date, SED has not issued official guidelines for the use of FY13 funds. Therefore these guidelines are subject to change when new information is released. Until that time, please follow the guidelines set forth below.
These guidelines only cover the discretionary allocations that schools first received in 2008-09 to spend subject to the Contracts for Excellence provisions. Other funds earmarked for Contracts for Excellence – including funds for increases in Collaborative Team Teaching (CTT) enrollment, Autism Spectrum Disorder (ASD) and full day Pre-Kindergarten classrooms, and English Language Learner (ELL) summer programs - are not covered in this guide and will be addressed in a separate document, which will be posted on the C4E website (http://schools.nyc.gov/AboutUs/funding/c4e/default.htm).
Discretionary allocations will be made through the “Contracts for Excellence FY09” or “Contracts for Excellence FY09 HS” allocation categories in Galaxy. 7.1. How Funds Should Be Spent All 2012-13 Contracts for Excellence discretionary funds are to be used to maintain effort for programs initiated using this funding source in 2011-12. It may be challenging for schools to maintain effort due to the overall budget reductions, and changes in its population may render a program unsustainable. As such, schools may choose to initiate a new program or expand an existing program using these funds. However, any program funded with Contracts for Excellence dollars – whether maintenance of effort or new/expanded – must adhere to the following provisions and is subject to State Education Department (SED) monitoring to ensure compliance.

Resource Guide to School Budgets
52
7.1.1. Program Area Requirements
C4E dollars must be spent to support programs and activities in the following six program areas:
Class Size Reduction;
Time on Task;
Teacher and Principal Quality Initiatives;
Middle School and High School Restructuring;
Full-Day Pre-Kindergarten; and
Model Programs for English Language Learners.
For more information on eligible program options within these six program areas, refer to section 7.2.1 “Appendix A” in this chapter.
7.1.2 Students with the Greatest Educational Need
C4E funds must be used to predominantly serve students with the greatest educational need, including: English Language Learners (ELLs);
Students with disabilities;
Students in poverty; and
Students with low academic achievement.
7.1.3. Supplement not Supplant
C4E funds are supplemental and generally may not be used to cover the costs of programs and personnel previously funded with tax levy dollars. However, there is an exception. C4E can be used to fund an expense if the school can document and demonstrate that due to cuts in tax levy funding, the programs or personnel would have been cut “if not for” the availability of C4E dollars. Note that even in this "if not for" situation, the expenditure still must meet all of the programmatic requirements of C4E.

Resource Guide to School Budgets
53
7.2. Guidance for FY13 Program Codes:
The “program” field drop-down menu in Galaxy displays the names of the program strategies (e.g., Reduced Class Size, Reduced PTR, Summer School) rather than the program areas. Please see Appendix A of this document for descriptions of C4E programs strategies as well as the Galaxy program codes assigned to each.
Required Documentation (Once SED releases official guidelines for FY13 funds, this section will be updated).
Schools may be required to provide additional information about proposed program impacts, targeted student populations, etc. at SED’s request.
7.2.1 Contracts for Excellence Program Strategies - Appendix A The following instructional strategies have been identified by SED as eligible for C4E funding within the six designated program areas. To get FY12 class size calculations, please refer to http://schools.nyc.gov/AboutUs/data/classsize/classsize.htm

Resource Guide to School Budgets
54
Program Strategy Galaxy Program
Description
Class Size Reduction
New Class Room/Reduce Overall Class Size: Hire an additional teacher relative to the student population, teaching independently, to achieve class size reduction at the aggregate school level over SY12 class size calculations.
Reduce Class Size
Additional Teacher in Existing Classroom: Add an additional Teacher relative to the student population, teaching collaboratively with another teacher, to achieve a reduction in student:teacher ratio at the aggregate school levels over FY12 class size calculations. Please note: Some schools may not have sufficient space to reduce class size through the creation of additional classrooms. In such cases, schools may elect instead to reduce pupil-teacher ratios using team teaching strategies. C4E funds may only be used for true co-teaching models and not for push-in teaching or paraprofessionals.
Reduce PTR
Maintain SY12 class size reductions: Successfully reduced class size at the aggregate school level in SY12, and continue to fund a teacher(s) necessary to maintain a similar class size in SY13. Note: This may not result in an additional class size reduction, but should result in a similar class size as calculated in SY12. This option is only applicable to schools that demonstrated a real class size reduction in SY12.
Maintain Class Size
Maintain SY12 Pupil Teacher Ratio reductions: Successfully reduced PTR at the aggregate school level in SY12 and continue to fund a teacher(s) necessary to maintain a similar PTR in SY13. Note: This may not result in an additional PTR reduction, but should result in a similar PTR as calculated in SY12. This option is only applicable to schools that demonstrated a real PTR reduction in SY12.
Maintain PTR
Minimize growth of class size in SY11 - fund a teacher to minimize the growth in class size that the school would have otherwise experienced given budget cuts. Note: School must demonstrate that these positions would have been cut in FY12. Teachers must be supplemental to the number required by contract.
Minimize Class Size growth

Resource Guide to School Budgets
55
Program Strategy Galaxy Program Description
Time on Task
Supplementary Before- or After-School Programs:
Additional instruction emphasizing learning standards/subjects required for graduation
New or expanded arts programs
New or expanded CTE programs
Student support services, including guidance, counseling, attendance, parent outreach, behavioral support, study skills
Before & After School
Lengthened School Year: Supplementary summer school, which may include:
Additional instruction emphasizing learning standards or subjects required for graduation
New or expanded arts programs
New or expanded CTE programs
Student support services, including guidance, counseling, attendance, parent outreach, behavioral support, study skills
Summer School
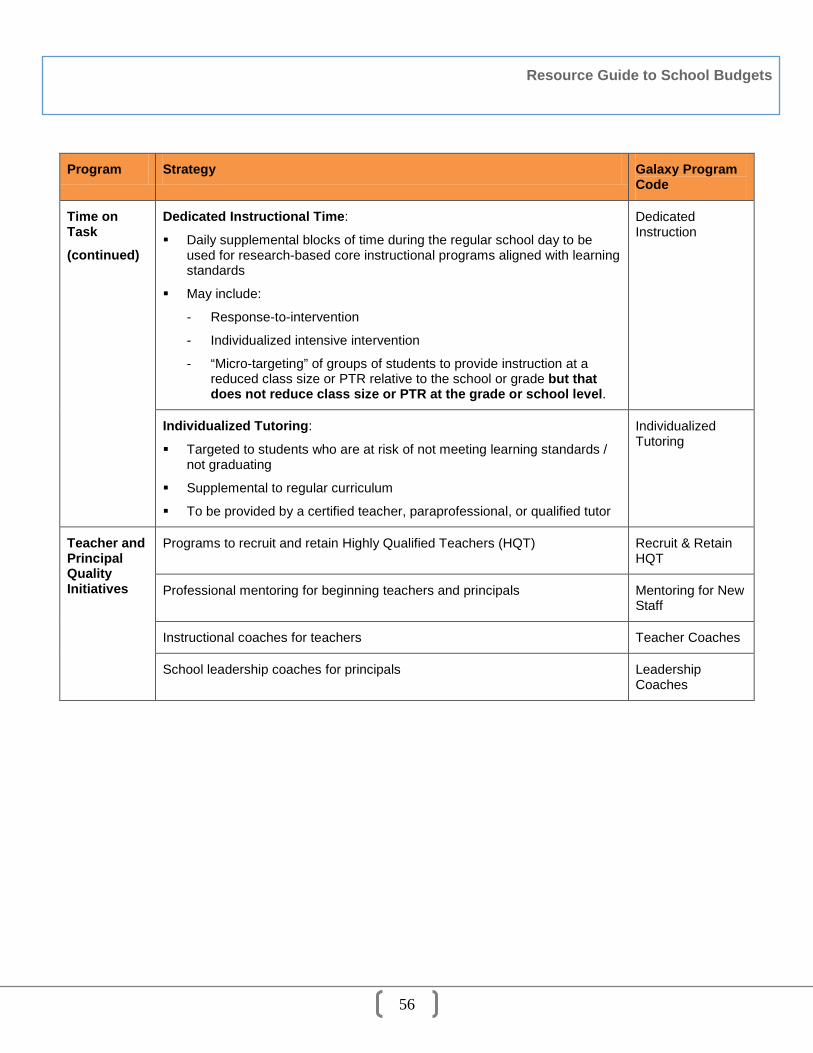
Resource Guide to School Budgets
56
Program Strategy Galaxy Program Code
Time on Task
(continued)
Dedicated Instructional Time:
Daily supplemental blocks of time during the regular school day to be used for research-based core instructional programs aligned with learning standards
May include:
- Response-to-intervention
- Individualized intensive intervention
- “Micro-targeting” of groups of students to provide instruction at a reduced class size or PTR relative to the school or grade but that does not reduce class size or PTR at the grade or school level.
Dedicated Instruction
Individualized Tutoring:
Targeted to students who are at risk of not meeting learning standards / not graduating
Supplemental to regular curriculum
To be provided by a certified teacher, paraprofessional, or qualified tutor
Individualized Tutoring
Teacher and Principal Quality Initiatives
Programs to recruit and retain Highly Qualified Teachers (HQT) Recruit & Retain HQT
Professional mentoring for beginning teachers and principals Mentoring for New Staff
Instructional coaches for teachers Teacher Coaches
School leadership coaches for principals Leadership Coaches

Resource Guide to School Budgets
57
Program Strategy Galaxy Program Code
Middle & High School Restructuring
For schools with middle or high school grades only.
Schools may allocate C4E funding to implement instructional changes that improve student achievement or instructional changes paired with structural changes to the school’s organization.
Instructional changes:
Designed to provide challenging academic and learning opportunities to students
May include implementation of academic intervention programs
MSHS Instruct Changes
Structural changes:
Examples: Changes to grade offerings, creation of “academies”, schools within schools, etc.
Please consult with your SSO team if you are interested in pursuing this option
MSHS Struct Changes
Full-Day Pre-Kindergarten
Expanding the instructional hours for existing pre Kindergarten programs from half-day to full school day (provided that the school has sufficient space)
Providing opportunities for the integration of students with disabilities into existing full-day pre-kindergarten programs.
Full Day Pre-K
Model Programs for English Language Learners (ELLs)
Please see SED guidance memo for more details about activities allowable under these strategies:
http://www.emsc.nysed.gov/mgtserv/C4E/ModelProgramsforLEP-ELLs-Rev7-28-08.htm
Innovative Programs for Underserved ELL Populations ELL Innovative Programs
Teacher Development, Recruitment, and Retention ELL Teacher Recruitment
Parental Involvement and Instruction ELL Parent Involvement
To review prior year State regulations and guidance, please visit http://www.p12.nysed.gov/mgtserv/C4E/11-12home.html

Resource Guide to School Budgets
58
CHAPTER 8: CONCEPTUAL CONSOLIDATION IN TITLE I SWP SCHOOLS 8.1. Overview/Background Title I School-wide Program (SWP) schools are expected to use the flexibility available to them to integrate services and programs with the aim of upgrading the entire educational program and helping all students reach proficient and advanced levels of achievement.
In addition to coordinating and integrating services, School-wide Program schools may combine most Federal, State, and local funds to provide those services.
By consolidating funds from Federal, State, and local sources, a School-wide Program school can address its needs using all of the resources available to it. This gives a school more flexibility in how it uses available resources to meet the identified needs of its students.
8.2. Consolidating Funds in a School-wide Program Consolidating funds in a School-wide Program means that a school treats the funds it is consolidating like they are a single “pool” of funds. The funds from the contributing programs lose their individual identity when they are combined into one flexible pool of funds. The school uses funds from this consolidated School-wide pool to support any activity of the Schoolwide Program without regard to which program contributed the specific funds used for a particular activity.
Consolidating Federal funds eases the requirements for accounting for funds from each specific program separately, because a School-wide Program school is not required to distinguish among funds received from different sources when accounting for their use.
A school that consolidates Federal funds in its School-wide Program is not required to meet most of the statutory and regulatory requirements of the specific Federal programs included in the consolidation (e.g., semi-annual time and effort reporting for Title I). However, the school must ensure that it meets the intent and purposes of the Federal programs included in the consolidation so that the needs of the intended beneficiaries are met.
8.3. “Conceptual” Consolidation To consolidate funding in a School-wide Program (SWP), the school does not literally need to combine funds in a single account or pool with its own accounting code. Rather, the word “pool” is used conceptually to convey that a School-wide Program school has the use of all consolidated

Resource Guide to School Budgets
59
funds available to it for the dedicated function of operating a School-wide Program without regard to the identity of those funds.
Most, if not all, School-wide Program (SWP) schools in NYC are already conceptually consolidating their Federal, State, and Local funds in support of school-wide achievement, even though the Galaxy system reports the allocations in separate accounting codes.
That is to say that School-wide Program schools receive Title I and other federal funds and use them to effectively improve the achievement of all students within their school. In many cases, however, principals and school leadership team members are not aware of the concept and language of conceptual consolidation, and therefore may not be realizing the full flexibility that consolidation of funding enables.
8.4. What Does That Mean?
If a school “opts in” to conceptual consolidation in their CEP application, they can use their Title I, Title IIA, and Title III funds for any purpose allowable under the cost factor, as long as they uphold the intent and purpose of each program.
For FY13, considering the reduction in budgets, the benefit of conceptual consolidation will be prominent in the ability to fund any title in the cost factor, regardless of what the person is actually doing on a day-to-day basis.
The flexibility of these funds will help ease the hardship of reduced funding. Having this flexibility in a fund source such as Title I SWP will be highly advantageous.
8.5. Galaxy Cost Factors for Conceptual Consolidation Conceptually Consolidated allocation categories will share one flexible cost factor and will not have filter rules.
It is expected that the six allocation categories below will be approved by SED to be included in conceptual consolidation. Schools and CFNs will be notified when final decisions are made.
Title I SWP
Title I SWP School Success
Title I Translation Services
Title IIA Supplemental
Title III Immigrant
Resource Guide to School Budgets
60
Title III LEP
8.6. Time and Effort Reporting In accordance with federal OMB Circular A-87, semi-annual and/or monthly time and effort reports are required from each school and central office.
What are the report criteria for federal-funded allocation categories that are conceptually consolidated? None – those allocation categories do not require Time and Effort Reports.
What are the report criteria for federal-funded allocation categories that are not conceptually consolidated?
o Must disclose staff names, FTE percentage, and salaries.
o Semi-annual reports are required for fully funded positions. The staff’s supervisor signature will suffice as long as that person can attest to the responsibilities of the individual in question.
o Monthly reports are required for split funded positions and each employee will need to sign the report.

Resource Guide to School Budgets
61
CHAPTER 9: ABSENT TEACHER RESERVE SUBSIDY FUNDING 9.1. Absent Teacher Reserve (“ATR”) Subsidy In November 2008, the Department of Education and United Federation of Teachers (UFT) agreed to a subsidy program that encouraged schools to hire centrally funded excess staff (CFES) by splitting the cost between central’s and schools’ budgets for 8 years. This agreement expired on December 1, 2010; and no newly hired excess staff will be eligible for any salary subsidy. The salary subsidy allocation continues to be issued for the 8 year period for previously hired eligible staff, based on the parameters outlined below. To be eligible, schools had to hire UFT staff excessed from phase-out schools, or hire excess staff from other locations on or after November 1 of the calendar year in which they were excessed. The subsidy does not apply to ATRs hired by the school from which they were excessed. The incentive initially consisted of two components: Incentive #1: School receives subsidy for difference between the school average teacher
salary and a starting teacher salary until 11/15/10. After 11/15/10 central will pay the difference between the average teacher salary and subsequent steps on the salary scale through year 8.
Incentive #2: For those hired on or before 11/10/2010, central provided an additional subsidy
of one-half of a starting teacher's salary, through 11/15/2010. Incentive #2 expired on 11/15/2010. No school should receive this funding in FY13.
The latest MOU with the UFT which allows the hiring of excessed staff on a provisional basis in FY11, without financial incentive, expired on June 30, 2011. New for FY13:
This year the subsidy has been allocated directly to schools, rather than passing through the Children First Networks via the Transfer Utility functionality in Galaxy. To streamline the process of adjusting the allocation for staffing changes to subsidized staff (i.e., for subsidized staff that return from leave, take a new leave, or transfer out of the school), central will also be modifying the allocation directly to schools periodically throughout FY13. Refer to School Allocation Memorandum #35 Salary Subsidy for Excess Staff Hired to Permanent Assignments