FAIR MARKET VALUE & COMMERCIAL REASONABLENESS
43
© Husch Blackwell LLP FAIR MARKET VALUE AND COMMERCIAL REASONABLENESS: What we have learned in the last decade from our role as Governments Consulting Experts and involvement in Hospital Transactions March 16, 2015 David Thompson, CPA Kevin Walker, CPA
-
Upload
cbiz-inc -
Category
Health & Medicine
-
view
242 -
download
4
Transcript of FAIR MARKET VALUE & COMMERCIAL REASONABLENESS

© Husch Blackwell LLP
FAIR MARKET VALUE AND COMMERCIAL REASONABLENESS:What we have learned in the last decade from our role as Governments Consulting Experts and
involvement in Hospital Transactions
March 16, 2015
David Thompson, CPA
Kevin Walker, CPA

GOALS
Understand the Fair Market Value and Commercial
Reasonableness issues from our experience as
consulting experts and hospital transaction consultants.
Understand the best practices in the roles we have on
Fair Market Value and Commercial Reasonableness
issues.
2
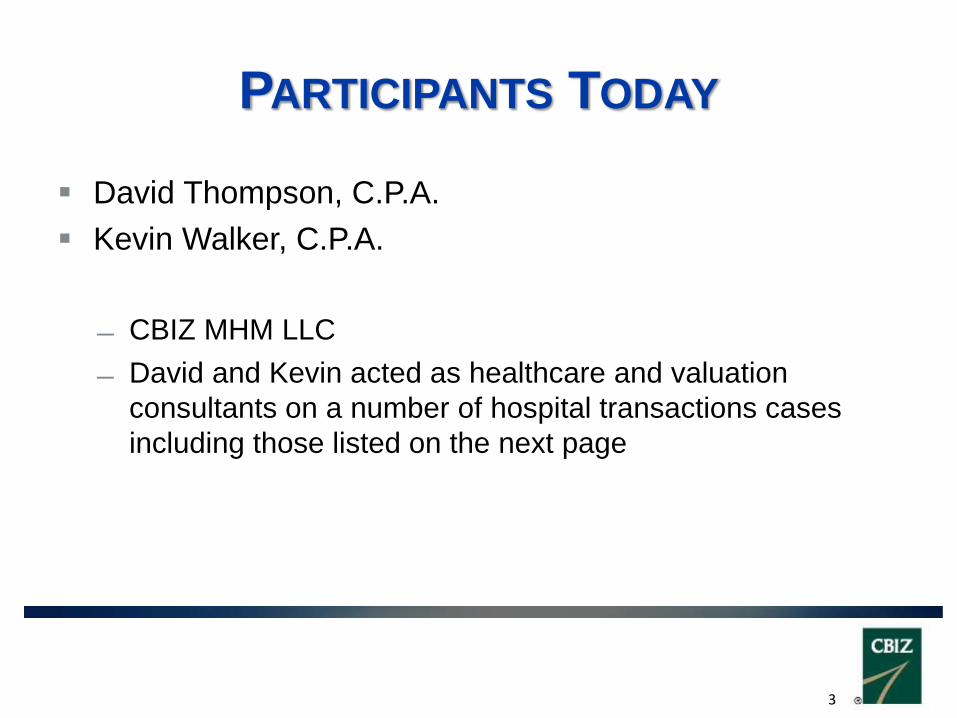
PARTICIPANTS TODAY
David Thompson, C.P.A.
Kevin Walker, C.P.A.
CBIZ MHM LLC
David and Kevin acted as healthcare and valuation
consultants on a number of hospital transactions cases
including those listed on the next page
3

EXPERIENCE
Have spent over sixty years in healthcare and business consulting performing hundreds of transaction and valuation engagements
Today we are interested primarily in our experience as consulting experts in a number of federal cases:
U.S. ex rel. Baklid-Kunz v. Halifax Med. Center et al. (M.D. Fla.)
U.S. ex rel. Drakeford v. Tuomey Healthcare System (D.S.C.)
U.S. ex rel. Simmons v. Meridian (M.D. TN)
Other settlements
4

THE THREE HATS
FOR ANALYZING TRANSACTIONS
Transaction Design and Implementation Best Practices
Risk Tolerance
Relative Benefits
Compliance Review Defensible Position
Appropriate Corrections
Litigation Defense Risk Tolerance
Reasonable Defenses
5

Transaction Responsibilities
Legal Counsel – Ensure transaction is set up in a legally
compliant fashion and can give guidance on commercial
reasonableness
Valuator – Ensuring that the amounts are Fair Market
Value and can give guidance on commercial
reasonableness
Hospital Health System Leadership – Responsible for its
decisions being commercially reasonable and should
rely on guidance from Legal Counsel and Valuator far a
legally compliant transaction at a fair market value rate.
6

Legal Perspectives
Hospital-Physician Transactions
A resulting legally compliant contract or transaction is the
part you can control
An ounce of prevention is worth a pound
of cure Getting the transaction done correctly up front is much
less costly than the costs of defense and/or settlement in
the future
7
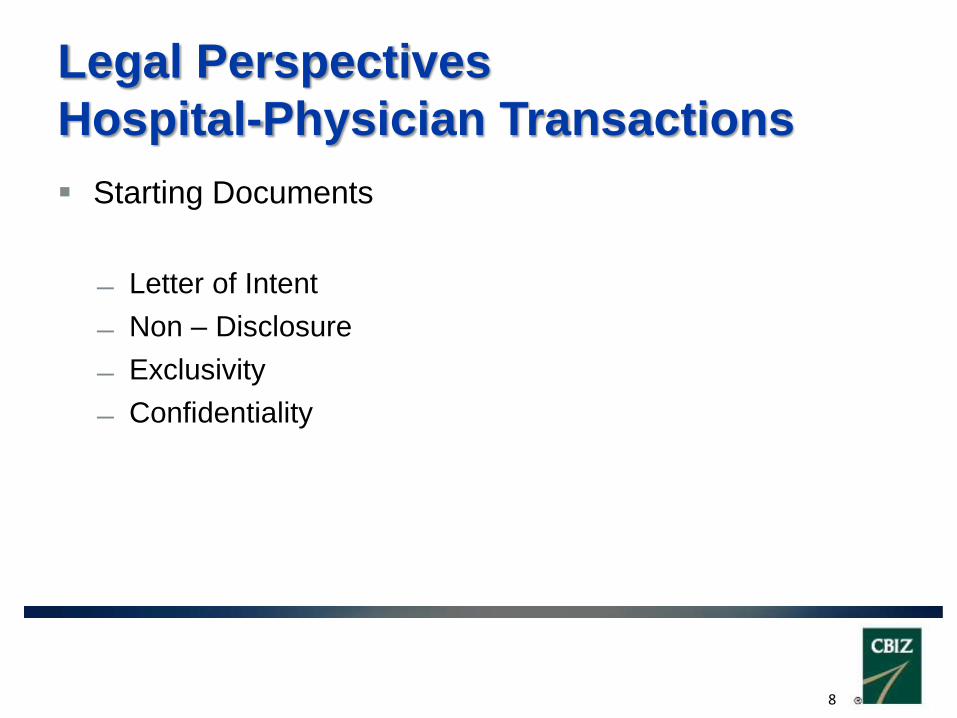
Legal Perspectives
Hospital-Physician Transactions
Starting Documents
Letter of Intent
Non – Disclosure
Exclusivity
Confidentiality
8

Legal Perspectives
Hospital-Physician Transactions
Commercially reasonable relationship and transaction
start at the beginning Are the right people at the table?
When is the right time to begin due diligence or accumulate documents?
When does a transaction require an outside valuator?
When is the right time to engage and outside valuator?
Who should engage and interact with the valuator?
What policies or protocols should a Hospital/Health System have in place as it
relates to physician transactions?
9
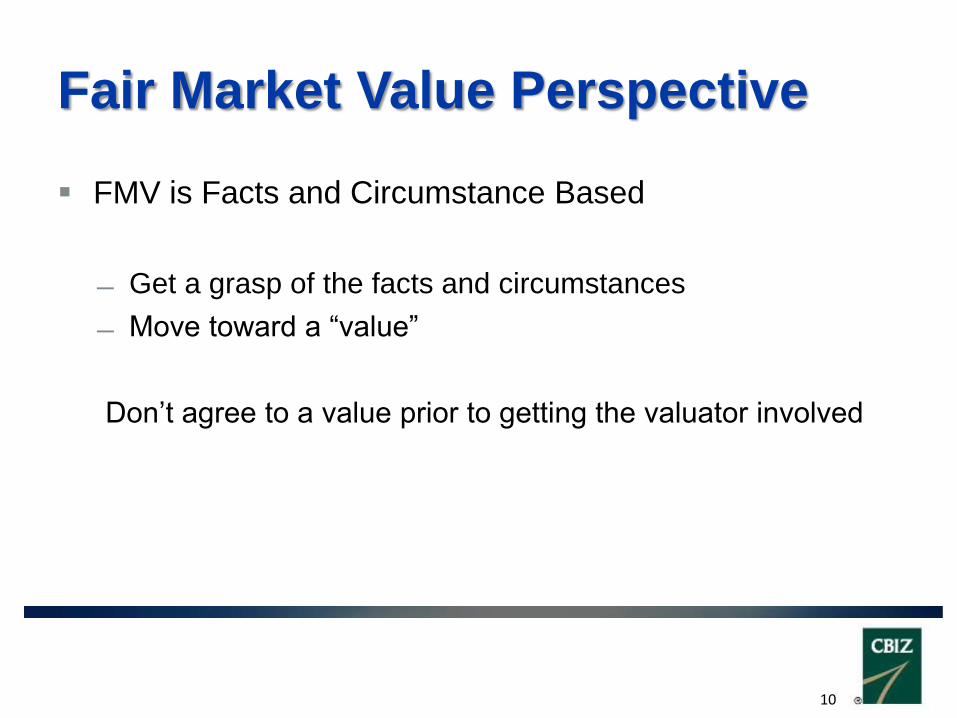
Fair Market Value Perspective
FMV is Facts and Circumstance Based
Get a grasp of the facts and circumstances
Move toward a “value”
Don’t agree to a value prior to getting the valuator involved
10

Fair Market Value Perspective
Fair Market Value is a defendable position
Valuator needs to be able to defend conclusions to all
parties, but ultimately to outside challenges
11

Fair Market Value Perspective
Each Transaction takes on a life of its own.
One Size Does Not Fit All
12

Fair Market Value Perspective
“Value” is a range, not an exact number. The higher a
hospital pays in the risk range, the more risk.
Commercial Reasonableness, Specific Market
considerations and Risk Tolerance impact where to pay
in the risk range
Higher risk transactions require greater “rigor”
13

Fair Market Value Perspective
Inappropriate reliance on market data can lead to
inappropriate conclusions. Ensure your valuator fully
understands the market data.
Ensure that a stacking review is performed
Such that the sum of all the parts In not greater than the
whole for all services
Such that a physician is not being paid twice for the same
service for doing tow things at once at full value for each.
14

Practical Valuation Issues
Who does the Valuator work for in a transaction?
Ideally, the Valuator is working for the transaction and to
ensure the amounts are defendable form all challenges
Practically, the Valuator is being paid for by one party
15

Practical Valuation Issues
Should both sides in a transaction get a valuation?
“Battle of the Valuators” does this facilitate a transaction that is FMV and Commercially Reasonable?
What to do when the physicians engage a non-healthcare (or non reputable) valuator? Specialization in healthcare, with its regulatory and compliance environment is a MUST
Ultimately, the Hospital has the greatest risk and will need to rely on the Valuator they trust
The existence of multiple valuation opinions can potentially later be looked at a “opinion shopping”
Ideally, the physicians anted their legal counsel need to “trust” the hospital and its valuator.
16

Practical Legal Counsel Issues
What should every file have at the conclusion of a
transaction
What needs to be in place prior to closing?
What can be rounded up post closing?
Options/Considerations if one of the parties “poisons the
well” during the negotiation?
17
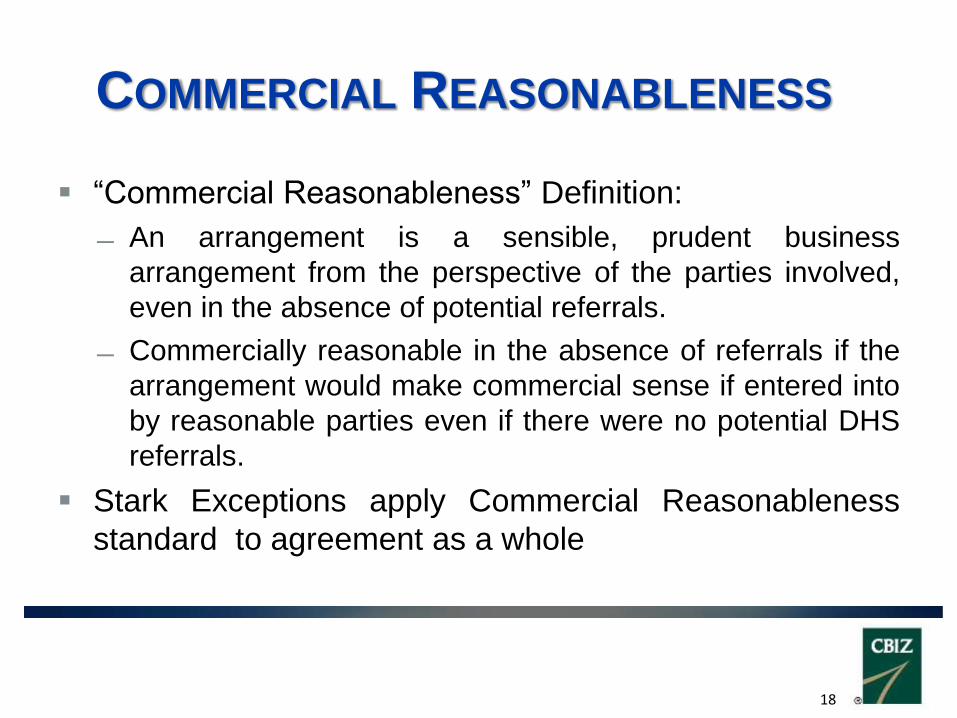
COMMERCIAL REASONABLENESS
“Commercial Reasonableness” Definition:
An arrangement is a sensible, prudent business
arrangement from the perspective of the parties involved,
even in the absence of potential referrals.
Commercially reasonable in the absence of referrals if the
arrangement would make commercial sense if entered into
by reasonable parties even if there were no potential DHS
referrals.
Stark Exceptions apply Commercial Reasonableness
standard to agreement as a whole
18

POTENTIAL FACTORSIMPACTING COMMERCIAL REASONABLENESS
Length of the term
Renewal/evergreen provisions
Termination for cause provisions
Termination without cause provisions
Full time/part-time employment
Compensation--fixed vs. production
Periodic review of compensation formula
Ability to adjust compensation/formula
Net cost of agreement to hospital
Eligibility for pension, welfare and fringe benefits
Scope of duties
Requirements for documentation (administrative vs. clinical time and amount of time expended)
Duplication of services (multiple agreements for same service)
Demonstrable need for service in community
Demonstrable need for service at hospital
Justification for non-standard provisions
(A non-exhaustive list)
19

COMMERCIAL REASONABLENESS
Conceptual Framework:
Potential referrals will always exist in a hospital/physician
transaction.
But, do the terms of the asset acquisition and/or
employment/independent contractor arrangement standing
alone make legitimate healthcare business sense, or does
the arrangement only make good business sense when
you consider the value of the referrals that the hospital will
be receiving from the physicians?
20

VALUATION PRINCIPLES
FMV Definition:
The value in arm’s-length transactions, consistent with the
compensation that would be included in a services
agreement as a result of bona fide bargaining between
well-informed parties to the agreement who are not
otherwise in a position to generate business for the other
party, at the time of the service agreement.
21

VALUATION PRINCIPLES
Cost Approach
Income Approach
Market Approach
How are these methods applied in the valuation of
physician compensation and practice acquisitions?
22

CASE STUDY
HALIFAX BACKGROUND
Initial Complaint filed under seal June 16, 2009 alleging
violations of the False Claims Act, including allegations
of claims resulting from improper admissions and claims
resulting from referrals from physicians whose
employment agreements were alleged to violate the
Stark Law and the Anti-Kickback Statute.
U.S. filed its Complaint in Intervention November 4, 2011
only with respect to the Stark Law/FCA allegations
involving the Medical Oncologists and the
Neurosurgeons
23

INTERVENED CLAIMS
MEDICAL ONCOLOGISTS AGREEMENTS
Numerous issues, none of which included FMV or
commercial reasonableness
Principal Stark Law issue:
Does the bona fide employee exception permit a bonus
pool that includes DHS revenue if allocated based on the
proportion of personally performed services of physicians
participating in the pool.
Held: No; employee exception only permits a bonus to a
physician based on his or her own personally performed
services.
24

NEUROSURGEONS AGREEMENTS
We will discuss the valuation principles in general terms,
then review the application of these principals to the 3
agreements both for Fair Market Value analysis and
Commercial Reasonableness analysis
25

COMMERCIAL REASONABLENESS ISSUES
For Most Years the Physicians’ Received 100% of their Collections
Derived from their Professional Services
Kuhn
Compensation & Profit Review Before and After Employment
Before Employment After Employment
1999 2000 2001 2002 2003 2004 2005 2006 2007 2008 2009 2010 2011
Practice Receipts 826,042 1,234,975 1,212,453 1,020,449 900,985 923,741 1,114,911 1,268,106 1,138,702 1,227,211 1,063,597 844,683 754,396
W-2-Compensation 150,000 160,000 187,021 185,898 587,173 1,078,793 1,032,523 1,253,335 1,217,137 1,154,989 1,154,921 1,186,346 1,086,541
Sub S Distribution 357,508 682,767 564,638 306,411
Total Compensation 507,508 842,767 751,659 492,309 587,173 1,078,793 1,032,523 1,253,335 1,217,137 1,154,989 1,154,921 1,186,346 1,086,541
Compensation as a % of Receipts 61.44% 68.24% 61.99% 48.24% 65.17% 116.8% 92.6% 98.8% 106.9% 94.1% 108.6% 140.4% 144.0%
Average Compensation % of receipts before employment 59.98% Average Compensation % of receipts after employment 107.50%
Average Compensation before employment 648,561$ Average Compensation after employment 1,083,529$
Average Collections before employment 1,073,480$ Average Collections after employment 1,026,259$
26

COMMERCIAL REASONABLENESS ISSUES
HSI Incurred Material Financial Losses related to the
Neurosurgeons’ Practices
Physician
Income (Loss) After
Physician's Salary
and Benefits
Practice
Expenses
Direct
Practice
(Loss)
Facility
Contributio
n Margin
Overall
Neurosurgeon
Margin
Khanna $(338,853) $ 220,663 $(559,516) $2,412,176 $1,852,660
Vinas $(413,013) $ 388,626 $(801,639) $2,797,650 $1,996,011
Kuhn $25,949 $ 437,717 $(411,768) $3,116,078 $2,704,310
Total $(725,917) $ 1,047,006 $(1,772,923) $8,325,904 $6,552,981
27
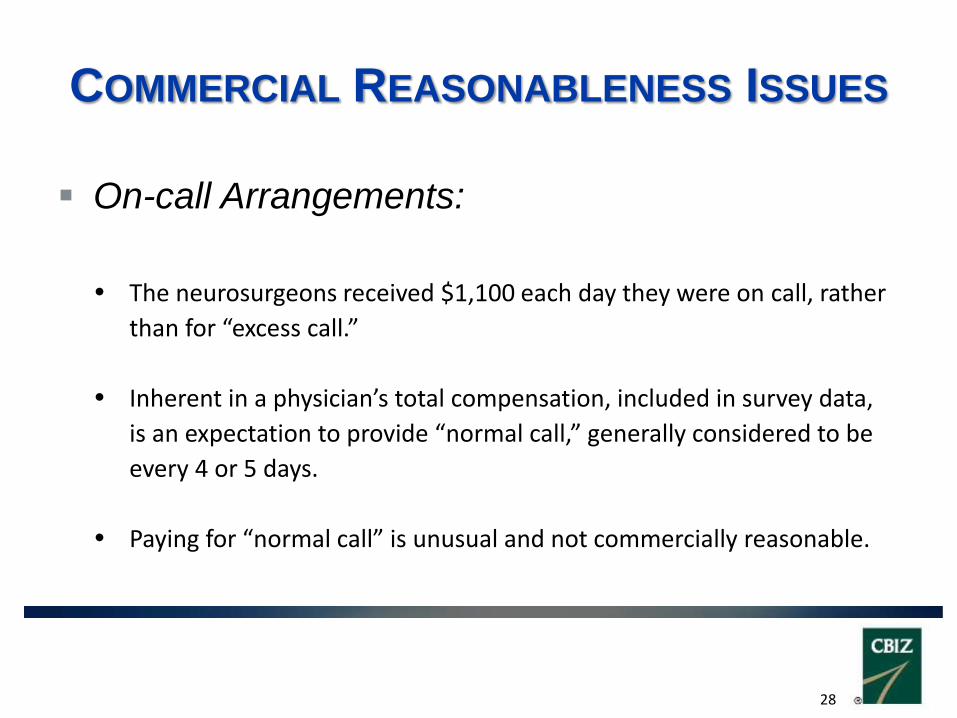
COMMERCIAL REASONABLENESS ISSUES
On-call Arrangements:
The neurosurgeons received $1,100 each day they were on call, rather
than for “excess call.”
Inherent in a physician’s total compensation, included in survey data,
is an expectation to provide “normal call,” generally considered to be
every 4 or 5 days.
Paying for “normal call” is unusual and not commercially reasonable.
28
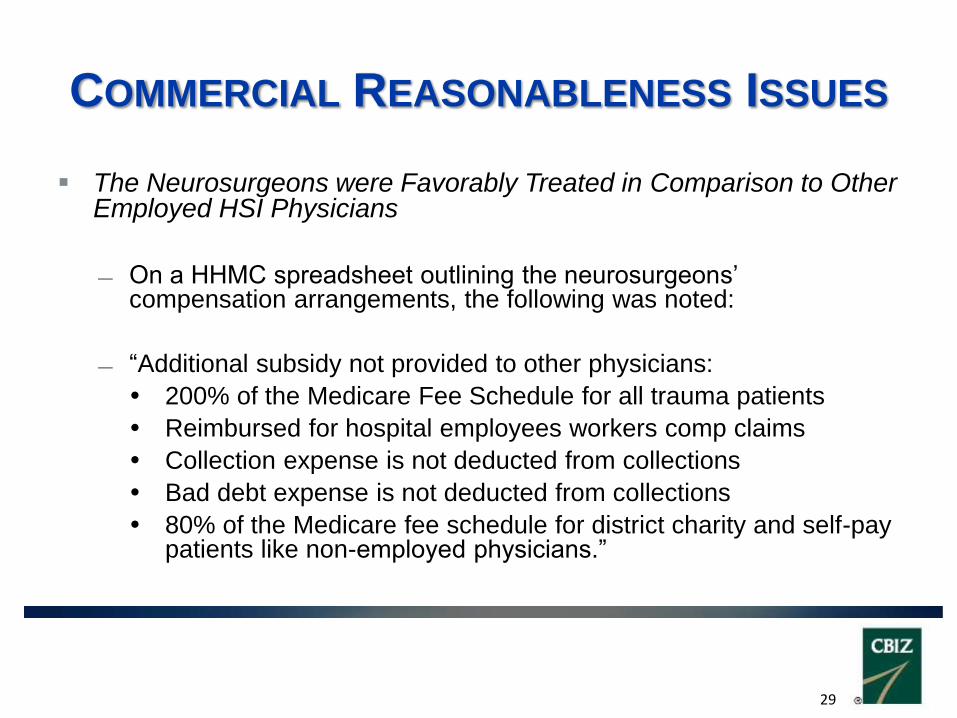
COMMERCIAL REASONABLENESS ISSUES
The Neurosurgeons were Favorably Treated in Comparison to Other Employed HSI Physicians
On a HHMC spreadsheet outlining the neurosurgeons’ compensation arrangements, the following was noted:
“Additional subsidy not provided to other physicians:
200% of the Medicare Fee Schedule for all trauma patients
Reimbursed for hospital employees workers comp claims
Collection expense is not deducted from collections
Bad debt expense is not deducted from collections
80% of the Medicare fee schedule for district charity and self-pay patients like non-employed physicians.”
29

COMMERCIAL REASONABLENESS ISSUES
The Neurosurgeons were Favorably Treated in Comparison to Other Employed HSI Physicians The neurosurgeons received a car allowance totaling $10,800
per year. No other HSI employed physician received any car allowance. When Dr. Kuhn practiced as an independent physician, his car expenses were much lower and ranged between $1,482 and $2,877 for the years 2000 through 2002. In later years Dr. Vinas’ car allowance was increased to $13,500 per year.
For those years that HHMC’s Federal Form 990s were produced, each 990 listed each of neurosurgeons as one of the five highest paid employees.
30

0
200000
400000
600000
800000
1000000
1200000
1400000
1600000
1800000
2000000
Dr. Khanna Dr. Kuhn Dr. Vinas MedicalOncology
RadiationOncology
GynecologyOncology
Urology Intensivist
Neurosurgeons Compared to Other Employed PhysiciansActual CY 2008 Compensation
Physician Group Compensation
is for highest paid physician
in the group.
MGMA 90th percentile for
Neurosurgery
With the exception of medical oncologists, the Neurosurgeons were the only employed specialist group who earn
compensation above or near the 90th percentile levels.
COMMERCIAL REASONABLENESS ISSUES
31

VALUATION PRINCIPALS
Market Approach
Industry Weighted Average Median 75th Percentile
Neurosurgery 2011 552 66.43$ 84.73$
Neurosurgery 2010 523 63.72$ 80.00$
Neurosurgery 2009 439 65.25$ 85.72$
Neurosurgery 2008 214 66.08$ 85.52$
Market Data-Compensation Per WRVU
Industry Weighted Average Median 75th Percentile
Neurosurgery 2011 353 75.4% 104.1%
Neurosurgery 2010 366 68.3% 97.5%
Neurosurgery 2009 314 52.1% 96.6%
Neurosurgery 2008 150 68.0% 81.4%
Market Data-Compensation as a % of Collections
32
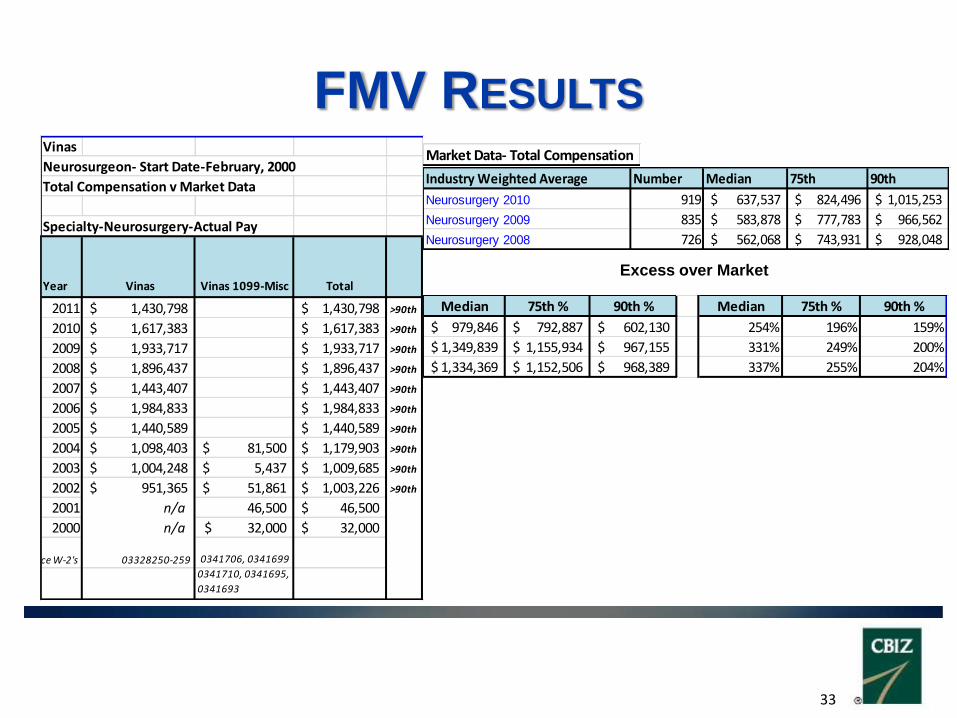
FMV RESULTSVinas
Neurosurgeon- Start Date-February, 2000
Total Compensation v Market Data
Specialty-Neurosurgery-Actual Pay
Year Vinas Vinas 1099-Misc Total
2011 1,430,798$ 1,430,798$ >90th
2010 1,617,383$ 1,617,383$ >90th
2009 1,933,717$ 1,933,717$ >90th
2008 1,896,437$ 1,896,437$ >90th
2007 1,443,407$ 1,443,407$ >90th
2006 1,984,833$ 1,984,833$ >90th
2005 1,440,589$ 1,440,589$ >90th
2004 1,098,403$ 81,500$ 1,179,903$ >90th
2003 1,004,248$ 5,437$ 1,009,685$ >90th
2002 951,365$ 51,861$ 1,003,226$ >90th
2001 n/a 46,500 46,500$
2000 n/a 32,000$ 32,000$
Source W-2's 03328250-259 0341706, 0341699
0341710, 0341695,
0341693
Median 75th % 90th % Median 75th % 90th %
979,846$ 792,887$ 602,130$ 254% 196% 159%
1,349,839$ 1,155,934$ 967,155$ 331% 249% 200%
1,334,369$ 1,152,506$ 968,389$ 337% 255% 204%
Industry Weighted Average Number Median 75th 90th
Neurosurgery 2010 919 637,537$ 824,496$ 1,015,253$
Neurosurgery 2009 835 583,878$ 777,783$ 966,562$
Neurosurgery 2008 726 562,068$ 743,931$ 928,048$
Market Data- Total Compensation
Excess over Market
33

FMV RESULTSKhanna
Neurosurgeon- Start Date-July 7, 2001
Total Compensation v Market Data
Specialty-Neurosurgery-Actual Pay
Year Khanna
Khanna 1099-
Misc Total
2011 1,134,951$ 1,134,951$ <90th
2010 1,107,519$ 1,107,519$ <90th
2009 1,506,217$ 1,506,217$ >90th
2008 1,724,600$ 1,724,600$ >90th
2007 1,714,064$ 1,714,064$ >90th
2006 1,910,913$ 1,910,913$ >90th
2005 1,709,902$ 1,709,902$ >90th
2004 1,302,879$ 49,000$ 1,351,879$ >90th
2003 1,466,661$ 22,000$ 1,488,661$ >90th
2002 780,186$ 43,500$ 823,686$ <90th
2001 n/a
2000 n/a 58,500$ 58,500$
Source W-2's 03328210-219
0341691,
0341702-3&
0341707
Median 75th % 90th % Median 75th % 90th %
469,982$ 283,023$ 92,266$ 178% 138% 112%
922,339$ 728,434$ 539,655$ 190% 142% 115%
1,162,532$ 980,669$ 796,552$ 268% 202% 162%
Market Data- Total Compensation
Industry Weighted Average Number Median 75th 90th
Neurosurgery 2010 919 637,537$ 824,496$ 1,015,253$
Neurosurgery 2009 835 583,878$ 777,783$ 966,562$
Neurosurgery 2008 726 562,068$ 743,931$ 928,048$
Excess over Market
34

FMV RESULTS
$ Compensation Over (Under)
Kuhn
Neurosurgeon- Start Date-February 14, 2003
Total Compensation v Market Data
Specialty-Neurosurgery-Actual Pay
Year Kuhn
Kuhn 1099-
Misc Total
2011 1,086,541$ 1,086,541$ <90th
2010 1,186,346$ 1,186,346$ <90th
2009 1,154,921$ 1,154,921$ >90th
2008 1,154,989$ 1,154,989$ >90th
2007 1,217,137$ 1,217,137$ >90th
2006 1,253,335$ 1,253,335$ >90th
2005 1,032,523$ 1,032,523$ >90th
2004 1,032,407$ 46,386$ 1,078,793$ >90th
2003 504,302$ 82,871$ 587,173$ <75th
2002 n/a 158,363$ 158,363$
Source W-2's 0338220-228
0341708,
0341701,034
1704
Median 75th % 90th % Median 75th % 90th %
548,809$ 361,850$ 171,093$ 170% 132% 107%
571,043$ 377,138$ 188,359$ 203% 153% 123%
592,921$ 411,058$ 226,941$ 205% 155% 124%
Actual Compensation % of Market
Market Data- Total Compensation
Industry Weighted Average Number Median 75th 90th
Neurosurgery 2010 919 637,537$ 824,496$ 1,015,253$
Neurosurgery 2009 835 583,878$ 777,783$ 966,562$
Neurosurgery 2008 726 562,068$ 743,931$ 928,048$
Excess over Market
35
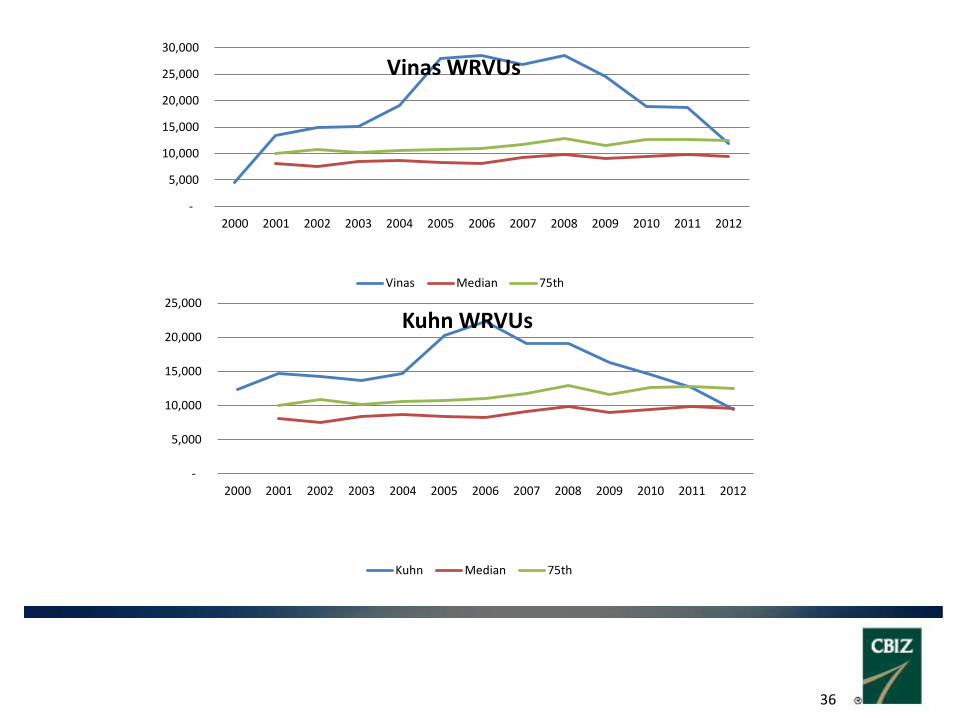
-
5,000
10,000
15,000
20,000
25,000
30,000
2000 2001 2002 2003 2004 2005 2006 2007 2008 2009 2010 2011 2012
Vinas WRVUs
Vinas Median 75th
-
5,000
10,000
15,000
20,000
25,000
2000 2001 2002 2003 2004 2005 2006 2007 2008 2009 2010 2011 2012
Kuhn WRVUs
Kuhn Median 75th
36

ADDITIONAL FACTORS
Physicians’ Time Analysis: E&M codes, for instance, critical care codes, are time based codes for which a physician’s time must be
documented in the medical record. Physicians routinely determine which level of E&M to code based on the amount of time they spend with a patient. Generally, more time spent with a patient equates to a higher level code, and higher reimbursement levels.
Neurosurgeons’ WRVUs associated with E&M services were compared to WRVUs reported by family practice physicians (because almost all of a family practice physicians’ work is associated with E&M services). Each of the neurosurgeon’s E&M services alone are positioned near or materially above the median levels reported by full time family practitioners. In 2007, Dr. Khanna’s WRVUs associated solely with his E&M services were 3.25 times higher than a full time family practice physician at the median level and more than 2 times higher than 90th percentile amounts. This means that even without accounting for all of the time he spent in surgery, Dr. Khanna billed over three times more for his E&M services than the median family practice physician.
HHMC engaged an independent consultant to perform a practice analysis for Dr. Vinas and Dr. Kuhn. After analyzing each of the physicians WRVUs by CPT code, one of the consultant’s findings was that Dr. Vinas was working an estimated 8,749 hours a year, and Dr. Kuhn 6,931 hours a year (there are 8,760 hours in a 365 day year). By using 2,080 hours to equate the consultant’s estimated hours to full time equivalents (“FTEs”), this equals 4.2 FTEs and 3.33 FTEs, respectively. An internal HHMC email showed that through August 2010, Dr. Khanna had taken 55 days off, Dr. Vinas 38 days and Dr. Kuhn 22 days off for the year.
37

ADDITIONAL FACTORS
Physicians' E&M Codes Only Market Data-Family Practice % of Market Median % to 75th Percentile
Vinas Kuhn Khanna Survey N Median 75th 90th Vinas Kuhn Khanna Vinas Kuhn Khanna
2011 4,588 4,971 3,424 Family Practice (without OB) MGMA 2012 4886 4,815 5,897 7,082 95.29% 103.24% 71.11% 77.80% 84.30% 58.06%
2010 4,506 5,714 3,542 Family Practice (without OB) MGMA 2011 4354 4,819 5,884 7,081 93.58% 118.57% 73.50% 76.58% 97.11% 60.20%
2009 5,206 5,406 4,316 Family Practice (without OB) MGMA 2010 4179 4,845 5,865 7,004 108.12% 111.58% 89.08% 88.77% 92.18% 73.59%
2008 5,323 6,296 4,164 Family Practice (without OB) MGMA 2009 3876 4,735 5,723 6,879 110.55% 132.97% 87.94% 93.01% 110.01% 72.76%
2007 6,554 5,476 14,944 Family Practice (without OB) MGMA 2008 3629 4,600 5,606 6,796 136.12% 119.04% 324.87% 116.91% 97.68% 266.57%
2006 6,452 4,360 8,463 Family Practice (without OB) MGMA 2007 2365 4,073 4,898 5,794 134.00% 107.05% 207.78% 131.73% 89.02% 172.78%
38

REPORT CONCLUSIONS
I believe that the compensation terms of the employment agreements and HSI’s business arrangements with the neurosurgeons were not commercially reasonable because absent the physicians’ referrals to HHMC, there does not appear to be a legitimate business purpose for entering into or maintaining the described physician employment agreements. In my opinion, the employment agreements do not make commercial sense, and would not have been entered into by a reasonable entity of similar type and size.
Based upon my findings I believe that HSI paid Drs. Vinas and Khanna in excess of fair market value for their services for each year examined. Except for the years 2003 and 2008, Dr. Kuhn’s compensation also appears to fall outside the fair market value range.
39

VALUATION CONCLUSION
Based upon my findings I believe that HSI paid Drs.
Vinas and Khanna in excess of fair market value for their
services for each year examined. Except for the years
2003 and 2008, Dr. Kuhn’s compensation also appears
to fall outside the fair market value range.
40

WRAP-UP
QUESTIONS
41

CONTACT INFO
CBIZ MHM, LLC
David W. Thompson | Managing Director
Kevin Walker | Managing Director
P: 913-234-1023
CBIZ MHM, LLC11440 Tomahawk Creek Parkway Leawood, KS 66211
42

DAVID W. THOMPSON, C.P.A.
KEVIN WALKER, C.P.A.
David Thompson: has over 35 years of healthcare experience and has
reviewed or prepared hundreds of healthcare valuations, including those for
hospital/physician acquisition, employment or professional services transactions,
surgical hospitals, ambulatory surgery centers, imaging centers, clinical and
pathology labs, cardiac cath labs and physician practices.
Kevin Walker: has over 25 years of healthcare experience has reviewed or
prepared hundreds of healthcare valuations, including those for hospital/physician
acquisition, employment or professional services transactions, surgical hospitals,
ambulatory surgery centers, imaging centers, clinical and pathology labs, cardiac cath
labs and physician practices.
43