Fair Housing Policy Effects on Housing Choice
43
Transcript of Fair Housing Policy Effects on Housing Choice

Fair Housing Policy Effects on Housing Choice Voucher Holder’s Spatial Integration
By Katharine “Annie” Baumann-Mitchell
Abstract Government policies and individual prejudices have created and perpetuated patterns of residential segregation in the United States. Continued inefficient policies and individual discrimination prevent programs intended to increase opportunities for integration, such as the Housing Choice Voucher (HCV) program, from reaching their goals. Landlord discrimination may prevent many HCV households from fully utilizing their vouchers to rent a unit in neighborhoods with lower poverty and higher opportunities. Such discrimination may be thwarted by local jurisdictions including source of income as a protected class in local fair housing laws. These laws increase the likelihood that HCV households have the opportunity to rent in any neighborhood they can afford. This paper reports on a study of the impacts of source of income protections on HCV household residential concentration. This study compares spatial dispersion of HCV households in four cities, two with source of income protections and two without. The findings show that the source of income laws did not appear to decrease concentration of HCV households.
Acknowledgements I would like to thank several people who were instrumental in the development of this project. My advisor, Dr. William Rohe, provided valuable and constructive guidance throughout the project. His willingness to provide consistent and clear feedback through regular meetings helped transform the final product. Professor Todd Bendor provided invaluable assistance with statistical analysis. His expertise with the statistical software allowed me to complete my analysis with confidence. Phillip McDaniel provided immeasurable support throughout the ArcGIS analysis. His suggestions and advice ensured an accurate geographic analysis. The student aids at the GIS Research Hub provided helpful and friendly assistance throughout the year. Additionally, I would like to thank Cathy Zimmer, Senior Statistical Consultant at the Odum Institute, and the student workers at the Odum Institute for their help with this project.

Table of Contents
Introduction................................................................................................................................1Source of Income Protection............................................................................................................1The Problem.........................................................................................................................................2
Literature Review......................................................................................................................3History of Segregation.......................................................................................................................3Housing & Urban Development and Segregation.......................................................................4The Housing Choice Voucher Program.........................................................................................4Housing Choice Voucher Segregation............................................................................................5Landlord Discrimination..................................................................................................................7Source of Income & Segregation.....................................................................................................8
Data............................................................................................................................................10Methodology............................................................................................................................11
Study City Selection Criteria.........................................................................................................11Grand Rapids & Chattanooga....................................................................................................................12Memphis & Milwaukee...............................................................................................................................13
Independent Variables.....................................................................................................................14Dependent Variable..........................................................................................................................15Data Analysis.....................................................................................................................................16
Results.......................................................................................................................................17Regression 1: Reduction in Percent of Vouchers Per Tract....................................................20Regression 2: Increase in Percent of Vouchers Per Tract.......................................................23
Interpretation..........................................................................................................................25Discussion & Policy Implications........................................................................................29Appendix...................................................................................................................................32
Estimator Equations........................................................................................................................32Fair Housing Ordinances................................................................................................................33
Memphis, Tennessee.....................................................................................................................................33Grand Rapids, Michigan..............................................................................................................................34Milwaukee, Wisconsin.................................................................................................................................35Chattanooga, Tennessee...............................................................................................................................36
References.................................................................................................................................37

1
Introduction For generations residential segregation has been a fact of life in many
communities. Personal discrimination and government policies and practices led to the
extreme concentration of racial and socioeconomic groups. Despite the U.S. Government
attempting to remedy long-term patterns of segregation, many households remain
confined.
To provide lower income households with greater residential choice, the
Department of Housing and Urban Development (HUD) created the Section 8 Program,
commonly referred to as the Housing Choice Voucher (HCV) program. The HCV
program provides low-income families the opportunity to rent in the private market with
rental assistance. The program emphasizes the ‘choice’ these individuals have when
selecting where to apply their vouchers. This theoretical choice, however, is not always a
reality.
A central barrier to the success of the program is the lack of legal protections
provided to HCV holders. Federally, HCV holders are not a protected class, allowing
landlords in most states to discriminate against individuals simply based on their source
of income, government rental assistance. While a few state municipalities have included
source of income as a protected class (specifically reliance on housing subsidies) in their
local fair housing policies, legal protections may still not significantly expand rental
opportunities to program participants. This paper will compare the spatial dispersion of
HCV holders in cities with and without source of income protections. I hypothesize HCV
holders in cities with source of income protections will have greater opportunities to
relocate from areas with high concentrations of poverty and voucher holders than in cities
without such protections.
Source of Income Protection Does including source of income as a protected class increase the rental
opportunities for HCV holders? HCV households face two main barriers to securing
affordable, integrated housing; racial discrimination and financial barriers. This paper
compares the spatial distribution of HCV holders in four cities, two with source of
income protections and two without. Grand Rapids, Michigan and Memphis, Tennessee
added source of income, specifically rental assistance, to their fair housing laws in 2000

2
and 2002 respectively.i Chattanooga, Tennessee and Milwaukee, Wisconsin were
selected as comparison cities because they had similar demographic and economic
characteristics but did not implement source of income protections for voucher holders.
The Problem The Federal Fair Housing Act (FFHA) protects individuals from housing
discrimination on the basis of seven protected classes: race, color, sex, national origin,
religion, handicap or familial status. While the federal law applies to the entire country,
states and local municipalities may include additional protected classes.ii Currently, nine
states, nine counties and 30 cities include ‘source of income’ as a protected class in their
local fair housing laws.iii For the purposes of this analysis, source of income will
specifically include any federal, state or local rental assistance. In three states -
California, Utah and Wisconsin - and several counties and cities, where source of income
is a protected class, rental assistance is explicitly excluded from the ‘source of income
category’. Other sources of income may include, social security, child support,
Temporary Assistance for Needy Families (TANF), etc.
In certain cities, landlords and other community groups oppose the addition of
source of income protections or at least laws that specifically include rental assistance.
For example, Baltimore, a city with almost 6,000 voucher holders, proposed a bill
deemed the “Home Act” that would include source of income as a protected class in its
fair housing laws.iv This act faced strong opposition from landlords and real estate agents
who argued they should be able to choose whether or not to rent to rent to voucher
holders.v In August 2016, the Baltimore City Council rejected the bill permitting the
continuation of discrimination against voucher holders.vi
The HCV program provides much needed rental assistance to millions of low-
income families in the U.S.vii However, this program is not welcomed in every
community.
“The Section 8 program’s minimal success in promoting integration is attributable to the wide-spread discrimination against prospective Section 8 tenants by private landlords, especially in largely white, middle-class communities. Such discrimination can create large concentrations of Section 8 recipients, often resulting in slum conditions and community resentment.” viii

3
Some landlords simply do not want to deal with the lengthy paperwork process
required for participation. Other landlords decide not to rent to HCV participants because
of preconceived negative stereotypes or perceptions of these individuals. In many cities,
HCV holders are predominately people of color and discrimination based on source of
income may be used as a proxy for racial discrimination.ix If HCV holders are prevented
from living in communities they choose, especially economically stable and diverse
areas, the negative consequences of segregation will be perpetuated. Fair housing laws
have the potential to protect HCV holders from direct discrimination but may not prevent
subversive discrimination, that is, subtle actions intended to undermine the application or
effects of fair housing laws.
Literature Review
History of Segregation The history of American segregation has been extensively studied. Ongoing
patterns of spatial segregation are closely tied with socioeconomic well-being.
“Opportunities and resources are unevenly distributed in space; some neighborhoods
have safe streets, higher home values, better services, more effective schools and more
supportive peer environments than others.”x According to Douglas Massesy, racial
minority groups have historically settled in areas close to urban centers with older
housing stock, fewer services and lower socioeconomic status. Some demographic groups
with upward socioeconomic mobility are able to move out of such neighborhoods.
However, prejudice and discriminatory policies have prevented Blacks and other
minority groups from gaining this upward mobility with similar ease.
“Discriminatory barriers in urban housing markets mean Black citizens are less able to capitalize on their hard-won achievements and achieve desirable residential locations. Compared with Whites of similar social status, Blacks tend to live in systematically disadvantaged neighborhoods, even within suburbs.”xi
While such mobility is not impossible, more barriers exist that prevent people of color
and other societal minorities from experiencing the same economic growth.

4
Housing & Urban Development and Segregation During the urban renewal process, public housing developments were often built
in existing high-poverty, high-crime neighborhoods. According to Stieles (1998), HUD
played “…a significant role in reinforcing the problems of housing segregation by
allowing intentional discrimination and courts found HUD liable on many occasions for
their overt racist policies in site selection and tenant housing procedures.”xii The Housing
and Community Development Act of 1974 created the Section 8 Housing Assistance
Payment Program, a rental certificate program.xiii This program allowed the tenant to
lease directly from a private landlord, rather than from the local public housing authority
(PHA). Section 8 was intended to offer low-income tenants a means to move from areas
of high concentrations of poverty. In 1998, the certificate program was transformed into
the Housing Choice Voucher program.xiv
“Despite its stated goals, the Section 8 program has not resulted in a decrease in segregation and concentration of poverty. Moreover, [a significant portion] of those applicants who are issued tenant-based subsidies are unable to find apartments in which to use them.”xv As a result, various housing authorities around the country have been sued for
perpetuating segregation of both public housing tenants and HCV holdersxvi.
The Housing Choice Voucher Program The Housing Choice Voucher Program provides housing subsidies to families and
individuals typically at or below 50% of the area median income (AMI). Usually, the
tenant households will pay 30% of their income on rent while the housing authority pays
the remaining 70%, ensuring these families are not overly cost burdenedxvii. However, if
the family has no income they are still required to pay the minimum rent established by
the individual housing authority that ranges from $0 to $50.xviii A family may pay up to
40% of their income if the unit they select has a contract rent which is more than the
public housing authority’s (PHA) payment standard, the maximum rent payment set forth
by each PHA.
The PHA, landlord and participant form a triangular relationship. The participant
signs a contract with the PHA to meet program requirements such as mandatory annual
income reexaminations to ensure continued income qualifications. The participant signs a
lease with the landlord like any other market rate tenant while the landlord signs a
contract called the Housing Assistance Payment (HAP) with the PHA. The HAP contract

5
requires the landlord to enforce the terms of their lease with the tenant and make certain
their property passes initial and regular inspection.xix
Housing Choice Voucher Segregation More recent research documents the difficulties HCV holders face moving out of
their racially and socioeconomically homogeneous neighborhoods. Studies have found
that only one in five voucher holders live in low-poverty neighborhoods and the rate has
remained approximately the same for many years.xx HUD conducted two studies of HCV
participant locational patterns over the course of 10 years. The initial 2003 study, which
served as a baseline for the evaluation in 2013, found that HCV participants lived in 83%
of tracts with affordable rental housing. According to McClure, voucher holders are
dispersed in many tracts, however, 50% of HCV participants live in tracts with more than
20% of the population living below the poverty threshold.xxi “… The trends over decade
from 2000 to 2010 indicate that the [HCV] program [in its current format] cannot be
depended upon to achieve the goal of poverty deconcentration.”xxii
The HUD study was duplicated in 2013 to examine where HCV participants lived
during and after the 2008-housing crisis. The more recent analysis showed a trend toward
increasing concentrations of HCV households. HCV households compose 1.8% of the all
occupied rental housing. However, the number of tracts with over 10% HCV households
appeared to be rising while the number of tracts with lower number of HCV participants
are declining.xxiii A study 2011 study conducted by Molly Metzger supported these
findings. Metzger concluded “…voucher households are in fact more economically and
racially segregated than an extremely low-income comparison group.”xxiv
HCV holders confront financial barriers when attempting to move to more
economically stable neighborhoods. Limited maximum rents capped by HUD’s
established Fair Market Rent (FMR), are often insufficient to allow families to find
housing in diverse neighborhoods. The FMR is based on the 40th percentile of the average
rental unit price occupied by recent movers in a metropolitan region which includes low-
rent outlying communities. For example, the FMR in New York City metropolitan area,
where affordable housing is a major concern, is only $1,249 for a one bedroom unit
which would restrict households to the “neighborhood of Brownsville in Brooklyn, one
of the most dangerous place in the city, and where most public housing is located.”xxv
6
For HCV holders, the costs of relocating (moving expenses, deposits for utility
accounts, etc.) may be beyond their financial means. “Because the income of families
who receive vouchers is at or below 50% of the area median income, these families
already face financial obstacles to obtaining needed goods and services. Housing
vouchers are supposed to enable these families to overcome financial obstacles….” but
they are not always able to do so.xxvi
Spatial segregation has perpetuated concentrated poverty. Even with the HCV
program, many participants are locating in neighborhoods with moderate or higher levels
of poverty. The percent of voucher holders in low-poverty areas decreased between 2000
and 2010 while the percent of HCV households in high-poverty areas increased,
indicating additional concentration of HCV households rather than the desired
deconcentration. Based on the number of low-poverty census tracts found in urban areas,
hypothetically it is possible for HCV participants to move out of high poverty
concentration areas.xxvii
Concentrated poverty is often associated with low-quality schools. HCV
households who remain in high-poverty, low-opportunity areas do not have access to
high performing schools for their children. “Compared with poor families in general and
those living in homes built with Low Income Housing Tax Credits (LIHTC), voucher
holders were living near lower-performing schools in 2008.”xxviii It appears either the
economic benefit provided by the voucher is not necessarily providing these low-income
families with access to better schools or some other barriers exists. Race also plays a
large role in determining the neighborhoods HCV participants reside in. Interestingly,
children in the HCV program were more likely than other low-income Black children to
live in neighborhoods with higher-quality schools.xxix
Living in neighborhoods with low-poverty and high economic opportunities is
crucial for HCV participants or any low-income households to work their way out of
poverty. For example, the Gautreaux program, established as a result of a discrimination
case against the Chicago Housing Authority, moved public housing participants into the
HCV program in the Chicago suburbs. Residing in these suburban neighborhoods they
experienced lower levels of poverty, low concentration of people of color and lower

7
levels of assisted housing. These families experience tangible improvements in their
employment and in the educational opportunities for their children.xxx
Residing in neighborhoods with low-poverty rates has many economic, social and
health benefits to HCV participants. Studies have found HCV participants living in such
neighborhoods experience an increase in mental and physical health, additional
educational opportunities, a reduction in crime and violence, and employment gains.xxxi
Not only do these neighborhood improvements benefit the HCV households but they also
benefit the larger community as well. If participants are able to secure employment, they
may need less financial assistance and, perhaps, be able to leave the HCV program
altogether.
Some individuals may choose to remain in neighborhoods with fewer economic
opportunities because they have strong social ties in the community or they may wish to
remain in an area that is familiar to them. Such choices are not to be ignored or
dismissed. If an HCV participant wishes to remain in their current neighborhood that is
their choice. However, it is vital they have the choice to stay or to leave. “Overall,
research suggests voucher holders would like to move to higher-opportunity
neighborhoods but are often unable to do so.”xxxii
Beyond economic impacts, cultural and ethnic separation of people furthers
mistrust of the “other” and reinforces negative stereotypesxxxiii. If landlords or
community members have deep-seated misconceptions about HCV participants and the
type of tenants or neighbors they might be, communities may be more inclined to prevent
HCV tenants from moving in. In order the fully understand the barriers HCV holders face
when seeking housing outside of their distressed communities, we first must understand
the discriminatory polices and practices that led to today’s severe residential segregation.
Landlord Discrimination As discussed above, HCV participants must overcome historic patterns of
segregation as well as financial barriers in order to secure housing outside of a low-
income, low-opportunity neighborhood. In addition to such obstacles, HCV households
must also cope with potential prejudice and discrimination. Landlords may treat voucher
holders in a variety of discriminatory ways from imposing additional criteria on their

8
applications to simply denying them any opportunity to apply for the apartment. The
Urban Institute discovered that some landlords use
“… rejection of HCVs as a proxy to discriminate against racial and ethnic minorities. Nationally, 41 percent of voucher holders are black and 16 percent are Hispanic…[Additionally,] local discrimination studies have found a subset of landlords that reject vouchers when offered by black or Hispanic families, but accept them for white families.”xxxiv
Discrimination against voucher holders not only disproportionately impacts
people of color but also limits the housing opportunities of disabled individuals and
single-parent households, many of whom rely on the HCV program to secure housing.xxxv
According to Pendall (2000), HCV program participants usually are not able to locate
housing in lower poverty areas. “In 1998, Section 8 users were 75 percent as likely as
other poor tenants to live in distressed neighborhoods but 150 percent more likely than all
renters to live in such tracts.”xxxvi A 2012 study conducted on the mobility of HCV
households in Austin, Texas discovered that only 6% of the 139,919 units surveyed were
available to HCV participants. Of the 78,217 units that qualified for the HCV program,
only 11% of those units actually accepted HCV participants.xxxviiSome landlords have
established no-voucher policies to prevent any voucher holder from renting their units in
municipalities where source of income is not a protected class.xxxviii
Source of Income & Segregation Erin Graves conducted research through the Regional and Community Outreach
Department of Federal Reserve Bank of Boston on the barriers HCV holders face when
moving to economically stable communities. Graves identified four central barriers:
limited transportation affordability and access; race and source of income discrimination;
insufficient subsidy amounts to meet housing costs; and constraints on when voucher
holders are allowed to move.xxxix “Racial discrimination generally discourages members
of low-income minorities from moving to predominately white or suburban
neighborhoods, even if affordable housing is located there.”xl In addition, negative
assumptions made about the voucher holders themselves and the inefficiency of the
housing authority’s lease-up process which includes additional inspections, lengthy
review processes and added paperwork, discourages landlords from leasing to HCV
participants.xli

9
Multiple studies have examined discrimination that HCV holders face and have
found source of income protections to be at least somewhat effective. After examining 48
PHAs, in a 2001 study, Finkel and Buron concluded “… the probability of successfully
using one’s voucher within the program time frame (their definition of program success)
was twelve percentage points higher in jurisdictions with a [source of income]
antidiscrimination law.”xlii
Lance Freeman examined the impacts source of income laws can have on the
utilization of vouchers. He studied HUD data on utilization rates from1995 to 2008.
Freeman concluded the presence of income protection laws has a positive impact on the
utilization of HCVs.xliii “Local source-of-income discrimination statutes increase the
availability of housing for low-income families.”xliv In jurisdictions with source of
income protections, the lease-up rate was 4% to 11% higher than other localities.xlv
In 2006, the District of Columbia added source of income to their fair housing
laws as a protected class. A study by the Equal Rights Center determined in 2005, 65% of
landlords in the D.C. area would not rent to HCV participants. After source of income
became a protected class discrimination was experienced by 45% of the HCV participants
in 2010 and in 2013 the discrimination rate dropped to 28%.xlvi Indicating that while
including source of income in the fair housing laws reduces incidences of landlord
discrimination it may not completely eliminate it.
Including source of income as a protected class does not completely prevent
discrimination against HCV holders.xlvii A 20002 study by the Lawyers Committee for
Better Housing conducted in Chicago, where source of income is protected, examined the
prevalence of landlord discrimination and its connection to race and voucher holder
status. Researchers found that despite protections, voucher holders still faced illegal
racial and source of income discrimination. In addition, voucher holders experienced
great difficulties when attempting to rent in “opportunity areas”. “These designated areas,
[census tracts with less than 20% poverty rate and few subsidized households,] have been
determined to be optimal area for relocation and integration of Housing Choice Voucher
families.”xlviii While discrimination based on source of income is not the only barrier to
using a voucher, it plays a role in limiting the neighborhoods available to HCV
participants.xlix

10
There are other methods landlords can use to turn away HCV applicants without
implementing a specific no-vouchers rental policy. Landlords can enforce stricter credit
check requirements or require a rental history with no blemishes, which may exclude
many low-income households. On average, low-income households face higher risks for
eviction and can have less consistent rental histories than other renters.
Even in cities with source of income protections, insufficient awareness of such
protections may prevent HCV participants from reporting any illegal discrimination.
Additionally, “… there is a concern that nonexistent or unequal policy enforcement tempers potential positive outcomes. Nonprofit and watchdog agencies find discrimination against voucher holders still exists in places like Washington, DC and Chicago even when there are local SOI antidiscrimination laws.”l However, the Equal Rights Center determined outreach to voucher holders to educate
them on their legal rights can reduce incidences of discrimination overtime.li While
immediate results may not occur, the value of the source of income laws is evident.lii
Data To determine the impacts of source of income protections on deconcentration of
HCV households, four cities were analyzed, two with source of income protections in
place and two without. Data on the movement patterns of individual HCV households is
provided by the Department of Housing and Urban Development (HUD). These data are
aggregated to the census tract level. Additionally, confidentiality requirements make it
nearly impossible to track the movement of individual households over time. Therefore,
this analysis will use HUD Picture of Subsidized Housing data for HCV households from
2000 and 2016. The data indicate the number of vouchers per census tract.
To provide a picture of the socioeconomic conditions in each census tract, U.S.
Census Bureau data were selected to examine neighborhood characteristics. American
Community Survey (ACS) 2015 data provided neighborhood characteristics which were
merged with the 2016 HUD data. The 2000 Decennial Census provided data on
socioeconomic characteristics of census tracts in 2000. 2000 and 2015-2016 data were
utilized to examine whether the distribution patterns of voucher holders changed in the
cities studied before and after implementation of source of income fair housing laws.
11
Methodology Study City Selection Criteria
In order to examine whether source of income antidiscrimination laws affected
the distribution of voucher holders four cities were selected as case studies. Two of the
cities, Memphis, Tennessee and Grand Rapids, Michigan, adopted source of income
protections within the study period. The other two cities, Chattanooga, Tennessee and
Milwaukee, Wisconsin, have not adopted source of income protections that specifically
include the Section 8 Housing Choice Voucher program as a ‘source of income’.
Selection of the treatment and comparison cities was based on a variety of criteria.
“Treatment” cities must have added a source of income policy to local fair housing laws
between 2000 and 2016. The 2000 data indicate voucher concentration patterns in a city
before the policy went into effect and the 2016 data represents changes what may have
occurred after the “treatment” was adopted. Selected cities must also have a sufficient
number of voucher holders to provide an adequate sample size.
The number of cities in which source of income protection policies were
implemented between 2000 and 2016 was limited; fewer than 10 cities met this criteria.
Memphis, however, adopted source of income protection in 2002 which specifically
included rental assistance.liii Similarly, Grand Rapids’ fair housing laws were modified in
2000 to include source of income as a protected class.liv
While the policy change in Grand Rapids may have occurred in 2000, the effects
of the law would not have been seen immediately. Time is required for individuals to
move. Also, landlords and tenants may not have immediately become aware of the new
legal requirements. Grand Rapids had over 2,000 voucher holders in 2000 and over 4,000
in 2016. Memphis had over 4,000 voucher holders in 2000 and over 8,000 in 2016. Both
cities had a significant number of voucher holders, providing a sufficient sample size to
conduct the analysis.
As detailed below, the two comparison cities, Chattanooga and Milwaukee, were
selected because their populations, projected population growths, and racial compositions
were similar to the “treatment” cities but had not adopted source of income ordinances.
Certain PHAs or local nonprofits provide specialized mobility programs that
assist participants in the HCV program find an affordable housing in more affluent

12
neighborhoods. These programs help voucher holders secure housing in neighborhoods
with higher-quality schools, increased job opportunities and additional amenities. Cities
with such mobility programs were specifically excluded from this study because
distinguishing between the impact of the mobility program and the effect of the fair
housing change on HCV holder mobility would be difficult.
Grand Rapids & Chattanooga In 2016, Grand Rapids had a population of 199,057. Ninety-four cities with
populations between 150,000 and 250,000 were examined as potential comparison cities
for Grand Rapids. Cities with source of income protections already in place at the local or
state level were eliminated. Cities with substantially different growth rates were also
eliminated from the pool of potential comparisons. Next, the racial composition of the
remaining cities were compared to the racial makeup of Grand Rapids. Selecting a
control city with similar racial populations was crucial due to the role race often plays in
housing discrimination. In cities where people of color compose the majority of the HCV
households, not only may they face financial limitations that reduce their ability of move,
but racial barriers as well. It was hypothesized that social dynamics in cities with
similarly sized racial groups may be comparable.
Chattanooga was found to be a good match with Grand Rapids as they have
similar populations, population growth projections and racial compositions. lv The
demographic statistics of Grand Rapids and Chattanooga can be seen in Table 1.
Additionally the Chattanooga Housing Authority does not have a significant mobility
assistance program which might influence the spatial distribution of HCV holders.
Table 1: Grand Rapids & Chattanooga Demographic Comparison
Grand Rapids Chattanooga 2016 Population 199,057 180,788 Anticipated Annual Population Growth
1.03% 0.93%
%White 62.7% 58.3% %Black or African American
21.3% 33.1%
13
Memphis & Milwaukee As a larger city, Memphis had fewer possible comparisons. In 2016, Memphis
had a population of 655,668.lvi Only 13 cities have populations between 600,000 and
700,000.lvii Of those, five were immediately eliminated because they have source of
income protection laws. The remaining cities were examined based on anticipated
population growth and racial composition. Baltimore, Maryland and Milwaukee,
Wisconsin most closely matched Memphis’ characteristics.
As discussed earlier, however, the Baltimore City Council recently rejected the
Home Act which would have added source of income protections, including rental
assistance, into the city’s fair housing laws. Due to the ongoing controversy over source
of income protections, Baltimore was eliminated from consideration.
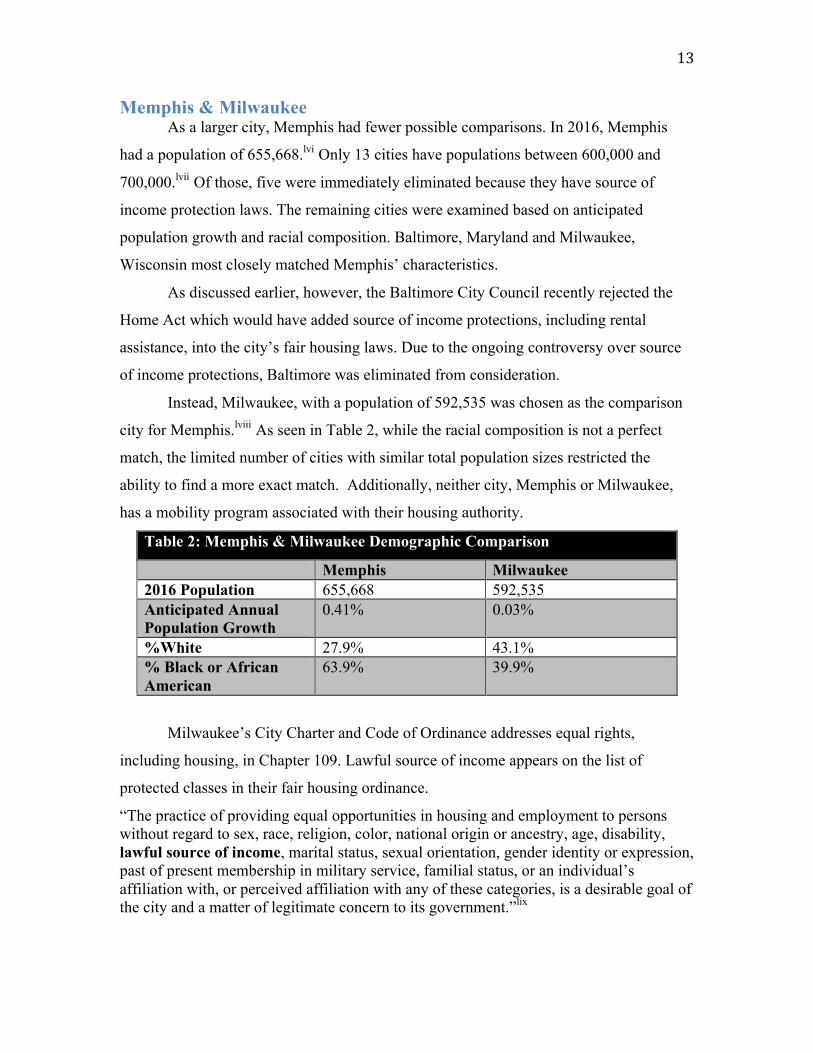
Instead, Milwaukee, with a population of 592,535 was chosen as the comparison
city for Memphis.lviii As seen in Table 2, while the racial composition is not a perfect
match, the limited number of cities with similar total population sizes restricted the
ability to find a more exact match. Additionally, neither city, Memphis or Milwaukee,
has a mobility program associated with their housing authority.
Table 2: Memphis & Milwaukee Demographic Comparison
Memphis Milwaukee 2016 Population 655,668 592,535 Anticipated Annual Population Growth
0.41% 0.03%
%White 27.9% 43.1% % Black or African American
63.9% 39.9%
Milwaukee’s City Charter and Code of Ordinance addresses equal rights,
including housing, in Chapter 109. Lawful source of income appears on the list of
protected classes in their fair housing ordinance.
“The practice of providing equal opportunities in housing and employment to persons without regard to sex, race, religion, color, national origin or ancestry, age, disability, lawful source of income, marital status, sexual orientation, gender identity or expression, past of present membership in military service, familial status, or an individual’s affiliation with, or perceived affiliation with any of these categories, is a desirable goal of the city and a matter of legitimate concern to its government.”lix
14
While the city ordinances include source of income, state law does not
specifically protect against source of income discrimination against individuals receiving
federal rental assistance such as the HCV participants. In 1995, the Knapp v. Eagle
Property Management Corporation Seventh Circuit Court of Appeals case ruled that
Section 8 vouchers (federal assistance) do not constitute lawful income.lx Additionally,
the Milwaukee City Ordinances do not specify rental assistance as a source of income
indicating that the source of income protections in Milwaukee do not apply to HCV
holders.
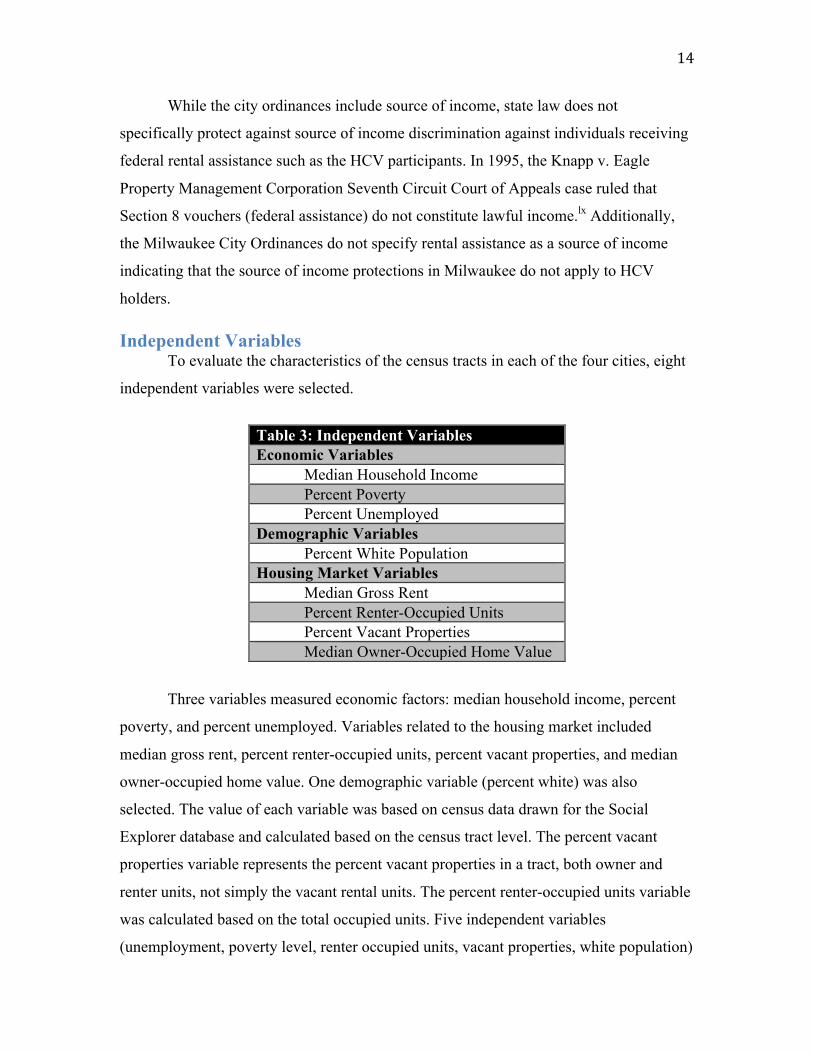
Independent Variables To evaluate the characteristics of the census tracts in each of the four cities, eight
independent variables were selected.
Table 3: Independent Variables Economic Variables Median Household Income Percent Poverty Percent Unemployed Demographic Variables Percent White Population Housing Market Variables Median Gross Rent Percent Renter-Occupied Units Percent Vacant Properties Median Owner-Occupied Home Value
Three variables measured economic factors: median household income, percent
poverty, and percent unemployed. Variables related to the housing market included
median gross rent, percent renter-occupied units, percent vacant properties, and median
owner-occupied home value. One demographic variable (percent white) was also
selected. The value of each variable was based on census data drawn for the Social
Explorer database and calculated based on the census tract level. The percent vacant
properties variable represents the percent vacant properties in a tract, both owner and
renter units, not simply the vacant rental units. The percent renter-occupied units variable
was calculated based on the total occupied units. Five independent variables
(unemployment, poverty level, renter occupied units, vacant properties, white population)
15
were measured as a percentage of the total respective population for each tract in the
sample. Median gross rent, median owner-occupied home value and median household
income were reported in dollars.
In addition to the eight economic, demographic and market independent variables,
presence or absence of source of income protections within the fair housing laws was
considered. If the city adopted source of income protection, the policy variable was coded
1. Otherwise, the variable was coded 0. Thus, Grand Rapids and Memphis received a 1
on this variable.
Dependent Variable The dependent variable is the change in percent voucher households per tract
between 2000 and 2016. However, it is important to note that one voucher may represent
an individual or a family of any size.lxi The data did not specify the size of each voucher
household. Therefore, the number of voucher holders per tract was compared to the
number of households in the tract to determine the percent of households that received
housing assistance vouchers. Thus, the dependent variable measures the concentration of
voucher holders. Tracts with high percentage of vouchers in 2000 and a lower percentage
in 2016 indicates some amount of dispersion of HCV participants, while an increased
percentage of voucher holders in 2016 would represent an increase in the concentration
of voucher households.
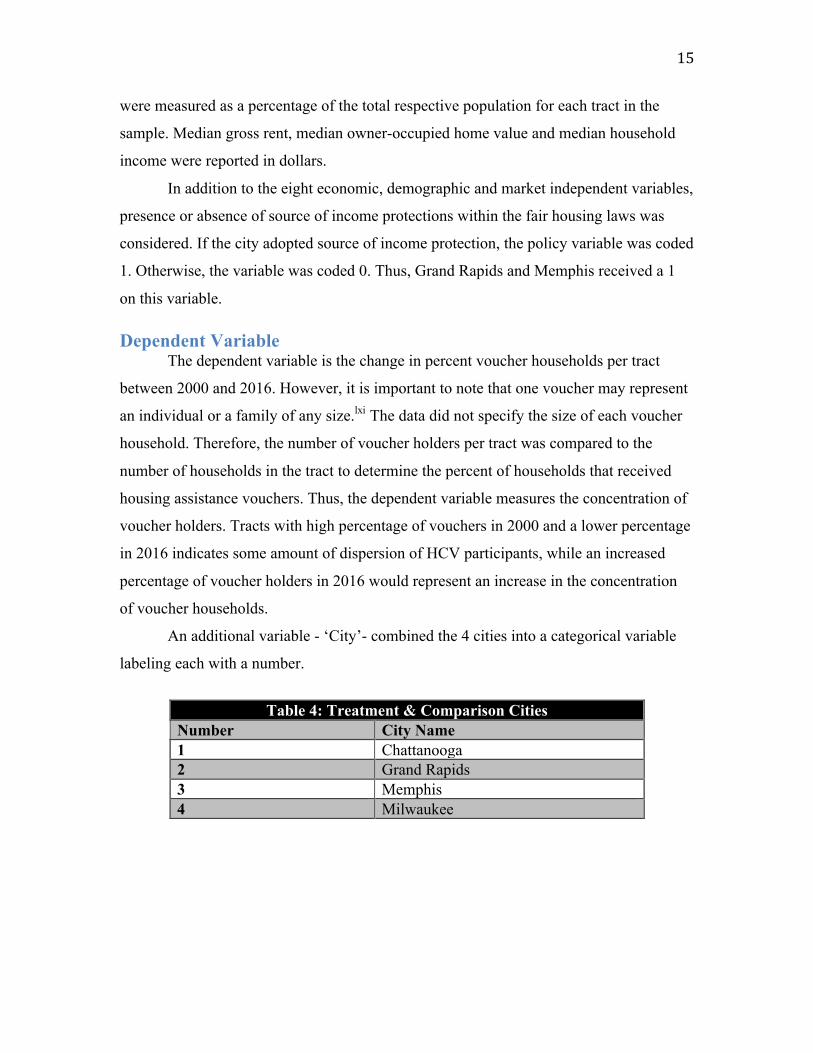
An additional variable - ‘City’- combined the 4 cities into a categorical variable
labeling each with a number.
Table 4: Treatment & Comparison Cities
Number City Name 1 Chattanooga 2 Grand Rapids 3 Memphis 4 Milwaukee

16
Data Analysis HUD data from 2000 and 2016 were joined with their respective census tract
boundaries. In this case, the 2016 data was joined to the 2010 tract boundaries while the
2000 HUD data was joined to the 2000 tract boundaries. In addition, the census data was
joined with the HUD data and census tract boundaries. The 2000 city boundaries were
used to select which census tracts belonged in the four cities. The 2000 city boundaries
were used for the 2000 and 2016 data to keep the city boundaries consistent.
However, census tract boundaries often change at each decennial census to adjust
for population movements and growth. Therefore, the census tract boundaries were not
exactly the same in 2000 and 2010. To address this issue, census tracts for both years
were broken into smaller geographic units to adjust for the overlapping and differing tract
boundaries. Utilizing an ArcGIS tool called “fishnet,” each year’s census tract boundaries
were divided into a grid and given the attributes of the two census tracts they fell within.
As a result multiple new geographic units contained the same information,
representing their original tract data from 2000 and 2016. For example, one census tract
in 2000 would have multiple fishnet geographic units with the same values for those
variables. In places where the tract boundaries overlapped, if the smaller geographic unit
fell within the 2000 boundary it would be given the value for that tract in 2000. If it fell
within a different tract in 2016, the new geographic unit would receive this tract’s
attributes for 2016. To avoid clustering in the statistical analysis, all non-unique
observations were removed. The final data set contained the value for each variable for
each tract in 2000 and 2016. In some cases, where census tracts boundaries moved or
additional tracts were added, some geographies have the characteristics of the 2000
census tract but a different 2016 tract to accommodate for the shifting boundaries.
The study used a multivariate multiple regression to determine the relationship
between the percent change in voucher holders per tract, the socioeconomic independent
variables and the presence of ‘source of income protections’. A multivariate multiple
regression allows multiple independent and dependent variables to be analyzed in a single
regression. This analysis produces the same individual coefficients and standards errors
as an Ordinary Least Squares (OLS) regression. However, the multivariate multiple

17
regression allows for testing coefficients across equations, which is not be possible in
OLS regression while also controlling for error.
The data are drawn from two different time periods but does not represent panel
data. Panel data follows specific individuals and records information about them over a
period of time. Instead, the 2000 and 2016 data used represent a cross-sectional snapshot
of each respective year and where HCV households are living at the time. The unit of
analysis is the census tract. The number of voucher holders is measured against the total
number of households in the tract to determine the percent of voucher holders per tract.
Without panel data it is impossible to determine where individuals are moving,
either within or out of a city. Instead, the analysis examines what changes occurred
within tracts where voucher holders are located. The relationship between increases and
decreases in the percent change of voucher holders per tract and the independent
socioeconomic variables are examined to understand whether source of income
protection laws affect the distribution of voucher holders.
Results To determine the impact of source of income protections on HCV holder
residential integration, a multivariate multiple regression was utilized. The multivariate
multiple regression includes the eight independent variables as well and the dependent
variable (percent housing voucher holders). In various statistical analyses, values for all
variables were measured in both 2000 and 2016. The full variable names and
explanations are presented in Table 5 below.

18
Table 5: STATA Output Key STATA Output Variable Name
% HCV 2000 Percent Voucher Holders per Tract 2000 % White 2000 Percent White Population per Tract 2000 % Unemployed 2000 Percent Unemployed Population per Tract 2000 Median Income 2000 Median Household Income per Tract 2000 % Poverty 2000 Percent Below Poverty per Tract 2000 % Vacant 2000 Percent Vacant Properties per Tract 2000 % Renter Occ 2000 Percent Renter-Occupied Units per Tract 2000 Median Rent 2000 Median Gross Rent per Tract 2000 Median Home 2000 Median Owner-Occupied Home Value per Tract 2000 % HCV 2016 Percent Voucher Holders per Tract 2016
2016 Variable Value minus 2000 Variable Value Change % HCV Change in Percent Voucher Holders per Tract
As noted above, the change in percent voucher holders per tract is calculated by
subtracting the 2000 value from the 2016 value. Therefore, a negative change would
indicate a decrease in the percentage of voucher holders in that tract while a positive
change represents an increase in the percent of voucher holders from 2000 to 2016.
To examine the census tract with an increase in percent voucher holders versus
tracts with a decrease in the percent voucher holders an additional variable titled
“tractchang” was created. This variable was added as an “if statement” so that separate
regression analyses could be computed for each of the subsamples. Separate statistical
analyses were conducted for a subsample of tracts identified with negative changes (that
is, a reduction in the percent of voucher holders in those tracts between 2000 and 2016)
and a subsample of tracts with positive change (that is, the percent of voucher holder
increased between 2000 and 2016). A decrease in percentage of voucher holders was
found in 160 tracts and an increase in the percent of voucher holders in 420 tracts.
Separating the dataset into two samples allowed the regression models to separately
represent what type of socioeconomic variables influence tracts with increased percent
HCV households versus tracts with a decrease in percent HCV holders. Essentially the
two subsamples allowed an examination of areas with increased concentration or
increased dispersal of HCV households.
A Variance Inflation Factor (VIF) test was conducted to test for extreme
correlation between independent variables that might skew the results. In the initial

19
regression concerning tracts with a decrease in percent voucher holders, the VIF score for
median household income was 10.34. While there is no established rule defining what
VIF scores indicate too great a level of correlation, the extreme difference between
median household income VIF score and the other variable VIF scores made it apparent a
strong correlation existed.lxii Therefore, the variable “median household income” was
removed from the regressions for both subsamples.
Table 6: VIF Table Variable VIF 1/VIF Policy 2.99 0.335 % HCV 2000 2.37 0.422 % White 2000 5.07 0.197 % Unemployed 2000 2.32 0.431 Median Income 2000 10.34 0.097 % Poverty 2000 6.06 0.165 % Vacant 20000 2.35 0.426 % Renter Occ 2000 3.67 0.272 Median Rent 2000 3.38 0.296 Median Home Val 2000 4.4 0.227 City Grand Rapids 1.31 0.762 Milwaukee 2.75 0.364 Mean VIF 3.92
As a result, two adjusted multivariate multiple regressions will be examined. The
first represents the tracts with a decrease in the percent of voucher holders per tract.
While the second regression examines only tracts with an increase in percent of voucher
holders.

20
Regression 1: Reduction in Percent of Vouchers Per Tract The results in Table 7 show the relationship between the negative change
(reduction) in percent voucher holders per tract and the independent variables. In
addition, the change in voucher holders is regressed on each city, the percent of voucher
holders per tract in 2000 and the policy variable. In this regression, only the subsample of
tracts where the percent of voucher holders decreased from 2000 to 2016 were examined.
A smaller percent of voucher holders in 2016 suggests the HCV households moved
elsewhere, thus, diversifying the tracts in which voucher holders are located.
Table 7: Negative Change Regression Change % HCV Coefficient Std. Err. t P>t 95% Conf. Interval Policy 0.212 0.290 0.73 0.468 -0.362 0.785 % HCV 2000 -0.394 0.041 -9.65 0.000** -0.476 -0.314 % White 2000 -0.007 0.005 -1.42 0.157 -0.017 0.003 % Unemployed 2000 0.006 0.026 0.21 0.833 -0.048 0.059 % Poverty 2000 0.008 0.013 0.60 0.547 -0.018 0.034 % Vacant 2000 0.025 0.027 0.95 0.344 -0.027 0.078 % Renter Occ 2000 -0.010 0.005 -1.89 0.061 -0.020 0.001 Median Rent 2000 0.002 0.001 1.4 0.165 -0.001 0.004 Median Home Val 2000 0.001 0.001 0.27 0.784 -0.001 0.001 city
Grand Rapids 0.504 0.465 1.08 0.280 -0.414 1.422 Memphis 0.000 (omitted)
Milwaukee 0.840 0.253 3.32 0.001* 0.340 1.341 Constant -0.893 0.756 -1.18 0.239 -2.387 0.601
The results indicate that none of the relationships between socioeconomic,
demographic, market, and policy variables and the change in percent of voucher holders
per tract were statistically significant at the 95% confidence level. Percent voucher
holders per tract in 2000 is the only independent variable to have a significant
relationship with the reduction in percent voucher holders in 2016.
In the regression analysis presented in Table 8, Chattanooga is the base city,
represented by the constant. Memphis represents the base city with a policy change,
represented by the constant and the coefficient for policy. The estimator equations for

21
each city seen in Appendix I represent the relationships between negative change
(reduction) in percent voucher holder and all the independent variables.
All cities are compared to Chattanooga as the base city. For example, the 0.212
coefficient for policy represents the effect of having a source of income protection policy
and being in Memphis relative to Chattanooga. Because two cites have a policy change
and two do not, two city coefficients are omitted. However, Chattanooga is the original
base city to which every other city is compared.
The effect of policy on the reduction in percent vouchers per tract in each city
can be seen in Table 8 below.
Table 8: Impact of Source of Income Protection on the Decrease in Percent Voucher
Holders Tract Chattanooga (base city) -0.893 Grand Rapids -0.178 Memphis -0.682 Milwaukee -0.053
In Memphis and Grand Rapids, the cities with source of income protection, there
is a negative relationship between the degree of reduction in percent voucher holders and
the presence of the policy. When the source of income protections occur in Memphis and
Grand Rapids, the negative percent change (reduction) in voucher holders decreases by -
0.682% and -0.178% respectively. These figures indicate that when a policy change that
includes source of income protections occurs the decrease in percent of voucher holders
per tract gets larger, meaning that a smaller percent of voucher holders live in these tracts
than did in 2000, holding all other variables constant. Such reduction in HCV households
would likely represent some type of dispersal with the HCV households moving to other
census tracts.
However, the effect of the policy change is greater in Memphis than in Grand
Rapids. For example, if a tract had 5% voucher holders in 2000 and 3% voucher holders
in 2016, there would be a change of -2%. With the source of income protection in place,
this reduction would have been greater indicating the percent voucher holder would be
smaller in 2016 than otherwise expected. In the example above, the percent voucher
holders per tract would be 2% compared to 5% in 2000 indicating a change of -3%.

22
Interestingly, the coefficients for Chattanooga and Milwaukee, cities with no
source of income protection, are in the same direction as the two cities with income
protections. And the reduction in the percentage of voucher holders per tract in this
subsample is greater than expected. While the policy variable has no statistically
significant impact on the reduction in percent of voucher holders, Chattanooga and
Milwaukee experienced decreases in percent voucher holder by -0.893% and -0.053%
respectively. In sum, tracts where the percent voucher holder decreased between 2000
and 2016, that decrease is greater than expected in both Chattanooga and Milwaukee, all
other variables being held constant.
Interestingly, additional reduction of voucher holders, which may represent
voucher household dispersal, is greater in Chattanooga than in the comparison treatment
city Grand Rapids. It is expected there would be less dispersal in Chattanooga because
there are no source of income protections in place, however, that does not appear to be
the case. The impact of the source of income policy followed the expected pattern in the
Memphis and Milwaukee. In Memphis, a city with additional protections, the dispersal of
HCV households appears to be greater than the dispersal in Milwaukee. A greater
discussion of these findings will be addressed in the interpretation section.
23
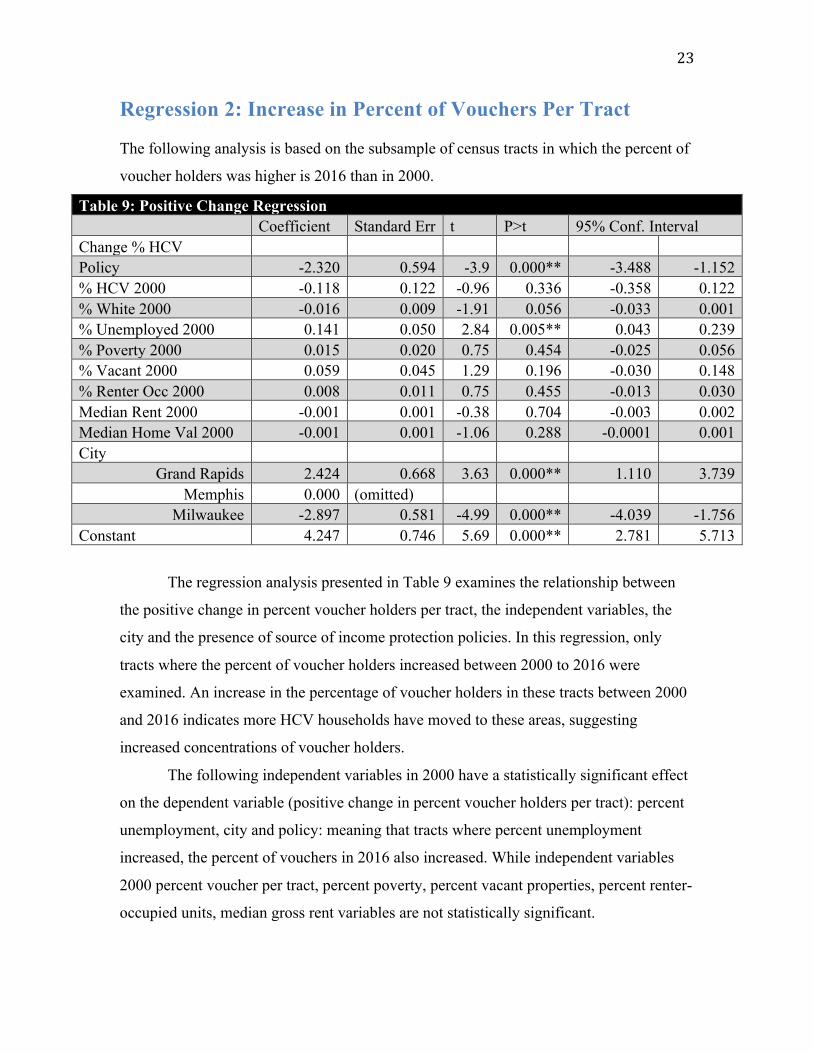
Regression 2: Increase in Percent of Vouchers Per Tract The following analysis is based on the subsample of census tracts in which the percent of
voucher holders was higher is 2016 than in 2000.
Table 9: Positive Change Regression
Coefficient Standard Err t P>t 95% Conf. Interval
Change % HCV Policy -2.320 0.594 -3.9 0.000** -3.488 -1.152
% HCV 2000 -0.118 0.122 -0.96 0.336 -0.358 0.122 % White 2000 -0.016 0.009 -1.91 0.056 -0.033 0.001 % Unemployed 2000 0.141 0.050 2.84 0.005** 0.043 0.239 % Poverty 2000 0.015 0.020 0.75 0.454 -0.025 0.056 % Vacant 2000 0.059 0.045 1.29 0.196 -0.030 0.148 % Renter Occ 2000 0.008 0.011 0.75 0.455 -0.013 0.030 Median Rent 2000 -0.001 0.001 -0.38 0.704 -0.003 0.002 Median Home Val 2000 -0.001 0.001 -1.06 0.288 -0.0001 0.001 City
Grand Rapids 2.424 0.668 3.63 0.000** 1.110 3.739 Memphis 0.000 (omitted)
Milwaukee -2.897 0.581 -4.99 0.000** -4.039 -1.756 Constant 4.247 0.746 5.69 0.000** 2.781 5.713
The regression analysis presented in Table 9 examines the relationship between
the positive change in percent voucher holders per tract, the independent variables, the
city and the presence of source of income protection policies. In this regression, only
tracts where the percent of voucher holders increased between 2000 to 2016 were
examined. An increase in the percentage of voucher holders in these tracts between 2000
and 2016 indicates more HCV households have moved to these areas, suggesting
increased concentrations of voucher holders.
The following independent variables in 2000 have a statistically significant effect
on the dependent variable (positive change in percent voucher holders per tract): percent
unemployment, city and policy: meaning that tracts where percent unemployment
increased, the percent of vouchers in 2016 also increased. While independent variables
2000 percent voucher per tract, percent poverty, percent vacant properties, percent renter-
occupied units, median gross rent variables are not statistically significant.

24
Similarly to the previous regression, Chattanooga is the base city, represented by
the constant. Memphis represents the base city with a policy change, represented by the
constant and the coefficient for policy. The equations for each city presented in Appendix
II represent the relationship between change in percent voucher holder and the
independent variables.
All cities are compared to Chattanooga as the base city and expressed in relative
terms. For example, the -2.320 coefficient for policy is actually the effect of having a
policy and being in Memphis relative to Chattanooga. Because two cites have a source of
income protection policy change and two do not, two city coefficients are omitted.
However, Chattanooga is the original base city to which every other city is compared.
The effect of source of income protections on the increase in percent vouchers per
tract in each city can be seen in Table 10 below.
Table 10: Impact of Source of Income Protection on the Increase in Percent
Voucher Holders Tract Chattanooga (base city) 4.247 Grand Rapids 4.351 Memphis 1.927 Milwaukee 1.350
In Memphis and Grand Rapids, the cities with source of income protection, there
is a positive relationship between the existence of the source of income laws and the
positive change in percent voucher holders. Tracts in Memphis and Grand Rapids where
the percent of voucher holders increased between 2000 and 2016 would increase more
than expected by 1.927% and 4.351% respectively. Meaning in tracts in Memphis and
Grand Rapids with an increase in the percent voucher holders per tract would have a
greater concentration than otherwise expected. The increased concentration of HCV
households runs counter to the hypothesis that source of income protection would result
in greater spatial dispersion of voucher holders. In 420 or 72.4% percent of the 580 tracts
in the overall sample, the percent of voucher holders increased from 2000 to 2016.
Interestingly, the results for Milwaukee and Chattanooga, the cities with no
source of income protection, were similar. Their change in percent voucher holders per
tract increased by 1.350% and 4.247% respectively, further increasing the concentration
of voucher holders per tract. However, the degree of increase is different in each city.
25
Being in Chattanooga seems to have a greater effect on the increased concentration of
voucher holders than being in Milwaukee. The level of concentration of HCV
participants in these tracts is greater than expected. The impact of residing in Milwaukee
is positive as well but the effect of city on the increase in the concentration of voucher
holders less than 1.5%.
Interpretation The sample used for the regression analysis presented in Table 7 is the subsample of
census tracts in which there was a reduction in the percent of voucher holders between
2000 and 2016. The regression which examined the relationship between the change in
percent voucher holders per tract and the independent variables, including city and policy
did not produce a statistically significant relationship between the policy and dependent
variable. While there was no statistically significant evidence that explains the connection
between source of income protections and geographical concentration of voucher holders,
such legal protection may still increase housing options for voucher holders.
In Memphis and Grand Rapids, cities with source of income protection, the presence
of the policy change was negatively related to the change in percent vouchers per tract. In
tracts in which the percent of voucher holders declined between 2000 and 2016, the
reduction in the percent of voucher holders is greater than expected. In Memphis, the
percent of voucher holders decreased in 29% of the tracts, while the percent voucher
holders decreased in 11% of the Grand Rapids tracts. It can be assumed because the
percent of voucher holders in these census tracts decreased between 2000 and 2016, those
households must have moved elsewhere. Perhaps the source of income protection is
allowing HCV households to move to other neighborhoods and disperse to other areas of
the city.
However, in Milwaukee and Chattanooga, cities without source of income
protection laws, there was a reduction of the percentage of voucher holders in 40% and
30% of the census tracts respectively. Table 11 indicates the percent of census tracts in
each city which experienced and increase or decrease in percent of voucher holders. It
was hypothesized that in cities without source of income protection voucher holders are
less likely to see a decrease in the concentration of voucher holders in tracts between
2000 and 2016.

26
Table 11: Percent Increase/Decrease HCV Holders per City Chattanooga Grand Rapids Memphis Milwaukee Total Tracts 81 55 202 242 HCV Increased Tracts 57 49 144 146 % Tracts Increased 70% 89% 71% 60% HCV Decreased Tracts 24 6 58 96 % Tracts Decreased 30% 11% 29% 40%
Yet, Milwaukee and Chattanooga saw reductions in the percent of voucher
holders in tracts between 2000 and 2016 and the amount of reduction was more than
expected. These results run counter to the anticipated impact of the source of income
protection. If the source of income protections had the anticipated effect, the cities
without such laws would either see an increase in the percent of voucher holders per tract
or the percent would remain the same indicating a continued concentration of voucher
holders. Even in tracts with a decrease in the percent of voucher holders, one would
expect to see only a marginal decrease because, presumably, the current discrimination
against voucher holders would persist, restricting their rental choices.
In Table 9, the regression of tracts with an increase in percent voucher holders per
tract, a somewhat similar pattern can be seen. The impact of being in a city with source of
income protections did not yield the expected results.
One would expect in Memphis and Grand Rapids cities with legal protections, the
concentration of voucher holders, would not be as severe as in Chattanooga and
Milwaukee. Even in tracts where the percent of voucher holders increased, it would be
assumed the percent increase of voucher holders would not be as large. However, the data
indicates the opposite.
While all cities, regardless of source of income protection appear to have a
positive impact on the change in percent voucher holder, meaning further their
concentrations of voucher holders in 2016, the increase is even greater in Grand Rapids
and Memphis than their respective comparison cities. While it may not be expected that
the effect of the policy would have a significant impact on reducing concentration of
HCV holders, it counterintuitive to learn Memphis and Grand Rapids had increases in the
concentration of HCV households. This finding runs counter to the hypothesis that living

27
in a city with source of income protections leads to dispersal of HCV households to
different neighborhoods. While this interpretation will be addressed further in the
discussion section, it is important to recognize that these findings apply only to these two
cities, not to all cities with source of income protection in place.
As seen in Table 12 only certain independent variables were statistically
significant in either regression.
Table 12: Summary Statistics Increase
Coefficient Increase
P>t Decrease
Coefficient Decrease
P>t Policy - ** + % HCV 2000 - - ** % White 2000 - * - % Unemployed 2000 + ** + % Poverty 2000 + + % Vacant 2000 + + % Renter Occ 2000 + - * Median Rent 2000 - + Median Home Val 2000
- +
City Grand Rapids 2.424381 ** 0.5039348 Memphis 0.000000 0.0000000 Milwaukee -2.897032 ** 0.8404496 ** Constant 4.246953 ** -0.8934077
** indicates if the variable is significant at 95% confidence interval and * for
significance at the 90% confidence interval.
In tracts with a decrease in HCV participants between 2000 and 2016, indicating
some dispersal of HCV households , only percent HCV in 2000 and percent renter
occupied in 2000 were statistically significant. However, the percent renter occupied was
only significant at the 90% confidence level. Additionally, the only city that had a
statistically significant relationship with the patterns of concentration was Milwaukee. In
tracts with a decrease in percent voucher holders between the two years, 5 independent
variables (percent unemployed, percent poverty, percent vacant, median rent and median
home value) had positive correlations with the dependent variable. As the value of these

28
variables increased, the negative change in percent voucher holders, meaning its more
HCV participants moving away from these census tracts.
For example, an increase in median rent is associated with a decrease in the
percent voucher holders, which is what one would expect given the current residential
patterns of HCV households. While the correlation between the dependent variable,
median rent and median home value are in the expected direction, one would also expect
a positive relationship between the percent unemployed, percent poverty and percent
vacant units and the percent of voucher holders. However, these relationships are not
statistically significant. The only statistically significant independent variable, percent
renter occupied, is associated in the expected direction. As the percent of renter occupied
units increases the negative change of voucher holders will decrease, meaning there will
be a greater percent of voucher holders in the tract than otherwise expected.
In tracts where the percent of voucher holders increase between 2000 and 2016,
indicting an increase in concentration of HCV participants, percent unemployed (at the
90% confidence interval) and percent white (at the 95% confidence interval) are the only
statistically significant independent variables. The correlation coefficients between these
two variables and the concentration of HCV households supports the existing research on
current residential patterns of voucher holders. As concluded by Metzger’s and
McClure’s studies, HCV households face barriers when attempting to live outside of
segregated neighborhoods with higher concentrations of voucher holders. As the percent
unemployment increases, the percent of voucher holders per tract increased. While as the
percent white per tract increases, the percentage of voucher holders per tract is decreased.
The impact of source of income protections may not have decreased the
concentration of voucher holders, however, it appears the socioeconomic and market
conditions of census tracts have a statistically significant relationship with the residential
location of voucher holders. Racial composition and economic conditions are related to
census tract residential location of HCV participants.

29
Discussion & Policy Implications The hypothesis of this study was that the presence of source of income protections
would allow HCV participants greater opportunity to live in more economically and
racially diverse neighborhood; that legal protections would lead to greater spatial
dispersion of voucher holders. The results of this analysis, however, do not support this
prediction.
While the results of this analysis do not support the prediction, it is crucial not to
dismiss the importance of source of income protections. In seeking housing, especially
housing in economically stable communities, HCV participants face a variety of barriers.
One of the many barriers is the lack of legal protection regarding source of income. If
landlords are allowed to discriminate simply based on rental assistance, problems will
continue to exist for HCV participants. Ensuring this obstacle is removed is a vital step in
providing HCV participants full choice in where they may utilize their voucher.
This study only examines four U.S. cities, thus they results may not be
generalizable to other cities. Also, the lack of appropriate time series data prevented
tracking the movement of specific households. Such data would have allowed analysis of
the movement of individual HCV households to determine whether source of income
protections had the hoped for effects in individuals’ movements.
Even with source of income anti-discrimination laws in place, landlords still can
discriminate against HCV participants. Landlords can increase their credit check or
background check requirements to certain levels that many HCV participants cannot
meet. Many voucher holders may not know their legal rights or be aware of the anti-
discrimination laws thus limiting their housing choices. Most people, regardless of HCV
status, are not familiar with the fair housing laws in their city or state and landlords may
use this lack of information to their advantage. Additionally, it is difficult to detect
discrimination in the housing market. An individual family may be told they failed the
credit check or their references were insufficient when the landlord simply did not want
to rent to them because they participate in the HCV program.
In addition to discrimination and prejudice, HCV holders face significant
financial barriers in securing housing in economically diverse and stable communities.
Even if landlords accept vouchers, there is a likelihood the tenant may not be able to

30
afford many areas, because of caps on the amount of rental subsidy provided by the
housing authority.
Current proposed policies may help address some of the other barriers HCV
participants face. One such policy is the use of Small Area Fair Market Rent (SAFMR) to
determine level of allowable subsidies. The final rule for SAFMR which will be
implemented in 24 metro areas was published by HUD in November 2016. Historically
the amount subsidy housing authorities could provide for each rent bracket was based on
the Fair Market Rent (FMR) for an entire metropolitan region. The SAFMR rule proposes
calculating the FMRs based on zip code in order to more accurately calculate the average
rental prices in a given area.lxiii The impact of this rule has yet to be analyzed.
Mobility programs are another approach aimed at reducing the barriers HCV
participants face in their search for desirable housing. These programs can take different
forms and be run by a housing authority or a local nonprofit organization. Most
commonly, mobility programs assist HCV participants in finding housing in communities
with strong education and employment opportunities.lxiv Each mobility program will have
a slightly different definition of a strong neighborhood but they all have the same goal: to
aid HCV households in their efforts to move to higher opportunity areas.
The SAFMR and mobility programs help voucher holders overcome some of the
financial barriers which keep them from securing housing in economically stable
neighborhoods. While extra financial assistance is important, if landlords can
discriminate simply based on someone’s source of income then the extra financial
opportunities available to the HCV holders may be ineffective in expanding participants
housing choices. Additional polices must be implemented to support the legal, social and
financial rights of the HCV participants.
In the two cities studied, this research found that source of income protections
were not related to the concentration of voucher holders. Voucher holders, however,
should have the legal protections necessary to utilize their voucher in any neighborhood
they choose. Without such protections any additional assistance provided to eliminate
financial or social obstacles may not be effective. Eliminating landlord bias against
government housing assistance through the provision of source of income laws,

31
implementing mobility programs, and increasing payment standards are important steps
towards creating greater housing choice.

32
Appendix Estimator Equations Appendix I: Negative Change (Decrease) in Percent Voucher Per Tract Estimator Equations Chattanooga = -1.006643 + 0(policy) -0.3945762(voucherper00) – 0.0072144(perwhite00) + 0.0053653(Perunem00) +0.0000505(MedHHIn00) + 0.0089074(perpov00) + 0.0245638(pervac00) – 0.0086921(perrent00) + 0.0014479(medgrorent00) +0.000000288(medval00) Grand Rapids = -1.006643 + 0.5021928(city) + 0.2137595(policy) -0.3945762(voucherper00) – 0.0072144(perwhite00) + 0.0053653(Perunem00) +0.0000505(MedHHIn00) + 0.0089074(perpov00) + 0.0245638(pervac00) – 0.0086921(perrent00) + 0.0014479(medgrorent00) +0.000000288(medval00) Memphis= -1.006643 + 0.2137595(policy) -0.3945762(voucherper00) – 0.0072144(perwhite00) + 0.0053653(Perunem00) +0.0000505(MedHHIn00) + 0.0089074(perpov00) + 0.0245638(pervac00) – 0.0086921(perrent00) + 0.0014479(medgrorent00) +0.000000288(medval00) Milwaukee= -1.006643 + 0.8304886(city) + 0.2137595(policy) -0.3945762(voucherper00) – 0.0072144(perwhite00) + 0.0053653(Perunem00) +0.0000505(MedHHIn00) + 0.0089074(perpov00) + 0.0245638(pervac00) – 0.0086921(perrent00) + 0.0014479(medgrorent00) +0.000000288(medval00) Appendix II: Positive Change (Increase) in Percent Voucher Per Tract Estimator Equations Chattanooga = 3.8186 -0.1526278(voucherper00) – 0.0219574(perwhite00) + 0.1369446(perunem00) +0.0000506(medhhin00) + 0.0241736(perpov00) + 0.01516(perrent00) – 0.0022587(medgrorent00) – 0.00000750 (medval00) Grand Rapids = 3.8186 + 2.559941(city) -2.439511(policy) - 0.1526278(voucherper00) – 0.0219574(perwhite00) + 0.1369446(perunem00) + 0.0000506(medhhin00) + 0.0241736(perpov00) + 0.01516(perrent00) – 0.0022587(medgrorent00) – 0.00000750 (medval00) Memphis = 3.8186 -2.439511(policy) - 0.1526278(voucherper00) – 0.0219574(perwhite00) + 0.1369446(perunem00) + 0.0000506(medhhin00) + 0.0241736(perpov00) + 0.01516(perrent00) – 0.0022587(medgrorent00) – 0.00000750 (medval00) Milwaukee = 3.8186 -2.986208(city) - 0.1526278(voucherper00) – 0.0219574(perwhite00) + 0.1369446(perunem00) + 0.0000506(medhhin00) + 0.0241736(perpov00) + 0.01516(perrent00) – 0.0022587(medgrorent00) – 0.00000750 (medval00)

33
Fair Housing Ordinances
Memphis, Tennessee Code of Ordinances Chapter 10: Fair Housing
Unlawful housing practices A) “It is unlawful for an owner or other person engaging in a real estate transaction, or for a real estate broker or salesperson, real estate operator, or person acting by or on behalf of any of these to discriminate against any person in the sale or rental of real property or any housing accommodation because of race, color, religion, national origin, sex, age, familial status, source of income or handicap/disability.” B) “It shall be a discriminatory practice for any person because of race, color, religion, national origin, sex, age, familial status, source of income or handicap/disability to: 1) Refuse to sell or rent after the making of a bona fide offer or to negotiate for the sale or rental of, or otherwise to make unavailable or deny, real property or a housing accommodation to a person; 2) Discriminate against any person in the terms, conditions, or privileges of sale or rental of real property or a housing accommodation, or in the provision of services or facilities in connection therewith; and it shall specifically be a violation of this section for an owner or manager of rental property to fail to maintain rental property in compliance with applicable housing code provisions because some or all of the tenants are members of classes protected by this chapter or the Tennessee Human Rights Act; 3) Refuse to receive or transmit a bona fide offer to purchase, rent or lease real property or a housing accommodation from a person; 4) Represent to a person that real property or a housing accommodation is not available for inspection, sale, rental or lease when in fact it so available, or to refuse to permit a person to inspect real property or a housing accommodation; 5) Make, print, publish, circulate, post or mail or cause to be made, printed, published, circulated, posted or mailed a notice, statement, advertisement, or sign, or to use a form of application for the purchase, rental or lease of real property or a housing accommodation, or make a record of inquiry in connection with the prospective purchase, rental or lease of real property or a housing accommodation, which indicates, directly or indirectly, a limitation, specification, or discrimination as to race, color, religion, national origin, sex, age, familial status, source of income, or handicap/disability or an intent to make such a limitation, specification, or discrimination; 6)Offer, solicit, accept, use or retain a listing of real property or housing accommodation for sale, rental or lease with the understanding that a person may be discriminated against in the sale, rental or lease of that real property or housing accommodation or in the furnishing of facilities or services in connection therewith; or 7) Deny any person access to, or membership or participation in, any multiple-listing services, real estate brokers' organization or other service, organization, or facility

34
relating to the business of selling or renting real property, or to discriminate against such person in the terms or conditions of such access, membership or participation.” C)
“3) To safeguard all individuals residing within the city from discrimination in housing because of race, color religion, national origin, sex, age, familial status, source of income or handicap/disability; to promote equal protection of all parties; and to encourage all citizens to maintain and improve the quality of housing within the city and thereby to preserve the health and general welfare thereof.” (Code 1985, § 48-252; Ord. No. 4932, § 1, 3-5-2002) Definitions:
“Source of Income means regular, verifiable income, or its equivalent, from which any individual can pay rental, mortgage or other payments associated with the provision of housing. The term shall specifically include Section 8 vouchers or certificates issued by the United States Department of Housing and Urban Development of similar contractual commitments whereby a third party commits to making all or a portion of rental, mortgage or other housing related payments” (Code 1985, § 48-253; Ord. No. 4932, § 1, 3-5-2002)
Grand Rapids, Michigan Code of Ordinances Chapter 160: Discrimination in Real Property Transactions
Discriminatory Practices “It shall be unlawful for an owner, a real estate broker or salesperson, or any other person, because of race, color, creed, religion, national origin, ancestry, age, gender, disability, marital status, height, weight, sexual orientation, gender identity, source of lawful income or public assistance recipient status: 1) To refuse to engage in a real estate transaction with a person; 2) To discriminate against a person in the terms, conditions or privileges of a real estate transaction or in the furnishing of facilities or services in connection therewith; 3) To refuse to receive or to fail to transmit a bona fide offer to engage in a real estate transaction from a person 4) To refuse to negotiate for a real estate transaction with a person; 5) To represent to a person that real property is not available for inspection, sale, rental or lease when, in fact, it is so available, or to intentionally fail to bring a property listing to the person's attention, or to refuse to permit the person to inspect real property; 6) To print, circulate, post or mail or cause to be so published a statement, advertisement or sign, or to use a form of application for a real estate transaction, or to make a record or inquiry in connection with a prospective real estate transaction, which indicates, directly or indirectly, an intent to make a limitation, specification, or discrimination with respect thereto; or 7) To offer, solicit, accept, use or retain a listing of real property with the understanding that a person may be discriminated against in a real estate transaction or in the furnishing of facilities or services in connection therewith.”

35
(Ord. No. 2015-60, § 1, 10-13-15)
Policy
“It is hereby declared to be the policy of the City of Grand Rapids, in the exercise of its police power for the protection of the public health, safety and general welfare, for the maintenance of business and good government, and for the promotion of the City's trade, commerce and manufacture, to assure equal opportunity to all persons to live in adequate housing facilities regardless of race, color, creed, religion, national origin, ancestry, age, gender, disability, marital status, height, weight, sexual orientation, gender identity, source of lawful income or public assistance recipient status, and to that end, prohibit discrimination in housing.” (Ord. No. 2015-60, § 1, 10-13-15) Definition “Source of lawful income means consistent income derived from wages, social security, supplemental security income, all forms of Federal, State or local assistance payments or subsidies, Section 8 assistance, child support, alimony and public assistance which can be verified and substantiated.” (Ord. No. 2015-60, § 1, 10-13-15)
Milwaukee, Wisconsin
Milwaukee City Charter and Code of Ordinances
“The practice of providing equal opportunities in housing and employment to persons without regard to sex, race, religion, color, national origin or ancestry, age, disability, lawful source of income, marital status, sexual orientation, gender identity or expression, past or present membership in the military service, familial status, or an individual's affiliation with, or perceived affiliation with any of these categories, is a desirable goal of the city and a matter of legitimate concern to its government. Discrimination against any city resident endangers the rights and privileges of all. The denial of equal opportunity intensifies group conflict, undermines the foundations of democratic society and adversely affects the general welfare of the community. Denial of equal opportunity in housing compels individuals and families who are discriminated against to live in housing below the standards to which they are entitled. Denial of equal opportunity in employment deprives the community of the fullest productive capacity of those of its members so discriminated against and denies to them the sufficiency of earnings necessary for maintaining the standards of living consistent with their abilities and talents.” Wisconsin State Legislature: Subchapter III – Equal Rights Programs “INTENT. It is the intent of this section to render unlawful discrimination in housing. It is the declared policy of this state that all persons shall have an equal opportunity for housing regardless of sex, race, color, sexual orientation, disability, religion, national origin, marital status, family status, status as a victim of domestic abuse, sexual assault,

36
or stalking, lawful source of income, age, or ancestry and it is the duty of the political subdivisions to assist in the orderly prevention or removal of all discrimination in housing through the powers granted under ss. 66.0125 and 66.1011. The legislature hereby extends the state law governing equal housing opportunities to cover single-family residences that are owner-occupied. The legislature finds that the sale and rental of single-family residences constitute a significant portion of the housing business in this state and should be regulated. This section shall be considered an exercise of the police powers of the state for the protection of the welfare, health, peace, dignity, and human rights of the people of this state.” Definition “(h) “Discriminate" means to segregate, separate, exclude, or treat a person or class of persons unequally in a manner described in sub. (2), (2m), or (2r) because of sex, race, color, sexual orientation, disability, religion, national origin, marital status, family status, status as a victim of domestic abuse, sexual assault, or stalking, lawful source of income, age, or ancestry.” Note “Federal rent vouchers are not clearly within the meaning of “lawful source of income.” Knapp v. Eagle Property Management Corp. 54 F.3d 1272 (1995).”
Chattanooga, Tennessee Code of Ordinance, Chapter 21: Housing Article VI Fair Housing
Unlawful acts generally “As made applicable by section 21-83 of this article, and except as exempted by sections 21-84 and21-86 of this article, it shall be unlawful: 1) To refuse to sell or rent after the making of a bona fide offer, or to refuse to negotiate for the sale or rental of, or otherwise make unavailable or deny, a dwelling to any person because of race, color, sex, handicap, religion, national origin, or familial status. 2) To discriminate against any person in the terms, conditions, or privileges of sale or rental of a dwelling, or in the provision of services or facilities in connection therewith, because of race, color, sex, handicap, religion, national origin, or familial status. 3) To make, print, or publish, or cause to be made, printed or published any notice, statement, or advertisement, with respect to the sale or rental of a dwelling that indicates any preference, limitation, or discrimination based on race, color, sex, handicap, religion, national origin, or familial status or an intention to make any such preference, limitation or discrimination. 4) To represent to any person because of race, color, sex, handicap, religion, national origin, or familial status that any dwelling is not available for the inspection, sale, or rental when such dwelling is in fact so available. 5) For profit, to induce or attempt to induce any person to sell or rent any dwelling by representations regarding the entry or prospective entry into the neighborhood of a person or persons of a particular race, color, sex, handicap, religion, national origin, or familial status.” (Code 1986, § 21-67; Ord. No. 9808, § 3, 11-12-92; Ord. No. 9885, § 1, 5-18-93)

37
References i Expanding Choice: Practical Strategies For Building A Successful Housing Mobility Program Appendix B: State, Local, and Federal Laws Barring Souce-of-Income Discrimination. 2016. Poverty & Race Research Action Council. Retrieved on March 1, 2017 from http://www.prrac.org/pdf/AppendixB.pdf ii Fair Housing: Source of Income Discrimination. Apartments We Live Here. Retrieved on March 4, 2017 from https://www.nmhc.org/uploadedFiles/Articles/Issue_Fact_Sheet/Fair%20Housing%20Source%20of%20Income%202014-01.pdf iii Expanding Choice: Practical Strategies For Building A Successful Housing Mobility Program Appendix B: State, Local, and Federal Laws Barring Souce-of-Income Discrimination. 2016. Poverty & Race Research Action Council. Retrieved on March 1, 2017 from http://www.prrac.org/pdf/AppendixB.pdf iv Jones, J. and Lafferty, S. 2016. “Baltimore County bill would end income discrimination against renters.” The Baltimore Sun. Retrieved on February 28, 2017 from http://www.baltimoresun.com/news/opinion/oped/bs-ed-home-act-20160720-story.html v Wood, P. and Donovan, D. 2016. “Lawmakers Consider Banning Housing Voucher Discrimination.” The Baltimore Sun. Retrieved on February 28, 2017 from http://www.baltimoresun.com/news/maryland/sun-investigates/bs-md-sun-investigates-housing-20160227-story.html vi Wood, P. 2016. “Baltimore County Council Rejects Housing Anti-Discrimination Bill.” The Baltimore Sun. Retrieved on February 28, 2917 from http://www.baltimoresun.com/news/maryland/baltimore-county/bs-md-co-housing-policy-vote-20160801-story.html vii Untied States Fact Sheet: Federal Rental Assistance. Center on Budget and Policy Priorities. Retrieved on February 25, 2017 from http://www.cbpp.org/sites/default/files/atoms/files/4-13-11hous-US.pdf viii Beck, P. (1996). Fighting Section 8 Discrimination: The Fair Housing Act’s New Frontier. Harvard Civil Rights-Civil Liberties Law Review. 155. 155 – 186. Retrieved on September 24, 2016. ix Luna, J. & Leopold, J. (2015) Landlord Discrimination Restricts the use of Rental Vouchers. Retrieved September 20, 2016, from http://www.urban.org/urban-wire/landlord-discrimination-restricts-use-rental-vouchers x Massey, D. (2001). Residential Segregation and Neighborhood Conditions in U.S. Metropolitan Areas. From America Becoming: Racial Trends and Their Consequences. Ed. Smelser, N. Wilson, W. & Mitchell, F. National Academy Press. xi Ibid. xii Seitles, M. (1998). The Perpetuation of Residential Racial Segregation in America: Historical Discrimination, Modern Forms of Exclusion, and Inclusionary Remedies. Land Use and Environmental. 14:1. 89-123 Retrieved September 27, 2016. Beck, P. (1996). Fighting Section 8 Discrimination: The Fair Housing Act’s New Frontier. Harvard Civil Rights-Civil Liberties Law Review. 155. 155 – 186. Retrieved on September 20, 2016. xiv Daniel, T. (2009). Bringing Real Choice to the Housing Choice Voucher Program: Addressing Discrimination Under the Federal Fair Housing Act. The Georgetown Law Journal, 98, 969-794. xv Beck, P. (1996). Fighting Section 8 Discrimination: The Fair Housing Act’s New Frontier. Harvard Civil Rights-Civil Liberties Law Review. 155. 155 – 186. Retrieved on September 20, 2016. xvi Hills v. Gautreaux 425 U.S. 284 (1976). Retrieved September 18, 2016 from https://supreme.justia.com/cases/federal/us/425/284/ xvii Housing Choice Voucher Fact Sheet. Department of Housing and Urban Development. Retrieved on March 1, 2017 from https://portal.hud.gov/hudportal/HUD?src=/program_offices/public_indian_housing/programs/hcv/about/fact_sheet xviii Housing Choice Voucher Program Guidebook: Chapter 6 – Calculating Rents and Payments. Department of Housing and Urban Development. Retrieved on March 15, 2017 from https://portal.hud.gov/hudportal/documents/huddoc?id=DOC_11750.pdf xixHousing Choice Voucher Program Guidebook: Chapter 11 – Housing Assistance Payments (HAP) Contracts. Department of Housing and Urban Development. Retrieved on March 4, 2017 from https://portal.hud.gov/hudportal/documents/huddoc?id=DOC_11755.pdf

38
xx McClure, K. Schwartz and Taghavi, B. (2014) Housing Choice Voucher Location Patterns a Decade Later. Housing Policy Debate. 25:2. 215-233 Retrieved March 20, 2017 from http://www.tandfonline.com/doi/pdf/10.1080/10511482.2014.921223?needAccess=true xxiIbid.xxiiIbid.xxiii McClure, K. Schwartz and Taghavi, B. (2014) Housing Choice Voucher Location Patterns a Decade Later. Housing Policy Debate. 25:2. 215-233 Retrieved March 20, 2017 from http://www.tandfonline.com/doi/pdf/10.1080/10511482.2014.921223?needAccess=true xxivMetzger,M.(2011)TheReconcentrationofPoverty:PatternsofHousingVoucherUse,2000to2008.DepartmentofHumanDevelopmentandSocialPolicy&InstituteforPolicyResearch,NorthWesternUniversity.RetrievedonMarch29,2017fromhttps://www.sesp.northwestern.edu/docs/publications/8563752464e6bb87d56cec.pdfxxv Semuels, A. (2015) How Housing Policy is Failing America’s Poor. The Atlantic. Retrieved on March 20, 2017 from https://www.theatlantic.com/business/archive/2015/06/section-8-is-failing/396650/ xxvi Ibid. xxvii McClure, K. Schwartz and Taghavi, B. (2014) Housing Choice Voucher Location Patterns a Decade Later. Housing Policy Debate. 25:2. 215-233 Retrieved March 20, 2017 from http://www.tandfonline.com/doi/pdf/10.1080/10511482.2014.921223?needAccess=true xxviii Horm, K, Ellen, I and Schwartz, A. (2014) Housing Choice Voucher Holders Are Not Reaching Higher-Performing Schools. How Housing Matters Policy Research Brief MacArthur Foundation. Retrieved on March 15, 2017 from https://www.macfound.org/media/files/HHM_-_Housing_Choice_Voucher_Holders_Reaching_Higher-Performing_Schools.pdf xxix Ibid. xxx McClure, K. Schwartz and Taghavi, B. (2014) Housing Choice Voucher Location Patterns a Decade Later. Housing Policy Debate. 25:2. 215-233 Retrieved March 20, 2017 from http://www.tandfonline.com/doi/pdf/10.1080/10511482.2014.921223?needAccess=true xxxi Rosenburg, K., Lowenfield, L, and Way, H. (2010) Furthering Fair Housing Choices for Voucher Tenants in Austin. HousingWorks. Retrieved on March 15, 2017 from https://law.utexas.edu/wp-content/uploads/sites/11/2015/07/2010-09-ECDC-Fair_Housing_Voucher_Tenants.pdf xxxii Tighe, R., Hatch, M., and Mead, J. (2017) Source of Income Discrimination and Fair Housing Policy. Journal of Planning Literature. 32:1. 3-15. Retrieved on March 20, 2017 from http://journals.sagepub.com/doi/pdf/10.1177/0885412216670603 xxxiii Seitles, M. (1998). The Perpetuation of Residential Racial Segregation in America: Historical Discrimination, Modern Forms of Exclusion, and Inclusionary Remedies. Land Use and Environmental. 14.1. 89-123 Retrieved September 27, 2016. xxxiv Luna, J. & Leopold, J. (2015) Landlord Discrimination Restricts the use of Rental Vouchers. Retrieved September 20, 2016, from http://www.urban.org/urban-wire/landlord-discrimination-restricts-use-rental-vouchers xxxv (2010) Statewide Source of Income Coalition . Tompkins County Office of Human Rights. Retrieved on March 15, 2017 from file:///Users/annie/Downloads/Attachment-6366.pdf xxxvi Pendall, R. (2000). Why Voucher and Certificate Users Live in Distressed Neighborhoods. Housing Policy Debate. 11:4. 881-910. xxxvii Austin Tenants’ Council (2012) Voucher Holders Need Not Apply: An Audit Report on the Refusal of Housing Choice Vouchers by Landlords in the Austin MSA. Retrieved on March 12, 2017 from http://www.austintexas.gov/edims/document.cfm?id=211114 xxxviii Daniel, T. (2009). Bringing Real Choice to the Housing Choice Voucher Program: Addressing Discrimination Under the Federal Fair Housing Act. The Georgetown Law Journal, 98, 969-794. xxxix Graves, E. (2016). Rooms for Improvement: A Qualitative Metasynthesis of the Housing Choice Voucher Program. Housing Policy Debate. 26:2. 346-361. xl Ibid xli Ibid. xlii Tighe, R., Hatch, M., and Mead, J. (2017) Source of Income Discrimination and Fair Housing Policy. Journal of Planning Literature. 32:1. 3-15. Retrieved on March 20, 2017 from http://journals.sagepub.com/doi/pdf/10.1177/0885412216670603
39
xliii Ibid. xliv Daniel, T. (2009). Bringing Real Choice to the Housing Choice Voucher Program: Addressing Discrimination Under the Federal Fair Housing Act. The Georgetown Law Journal, 98, 969-794. xlv Ibid. xlvi Livesly-O’Neil, W. (2015) Does Source of Income Protection Work? Texas Housers. Retrieved on March 10, 2017 from https://texashousers.net/2015/05/05/does-source-of-income-protection-work/ xlvii Daniel, T. (2009). Bringing Real Choice to the Housing Choice Voucher Program: Addressing Discrimination Under the Federal Fair Housing Act. The Georgetown Law Journal, 98, 969-794. xlviii Lawyers Committee for Better Housing. (2002). Locked Out: Barriers to Choice for Voucher Holders – Report of Section 8 Housing Choice Voucher Discrimination. Retrieved on September 19, 2016 from http://lcbh.org/sites/default/files/resources/2002-lcbh-housing-voucher-barriers-report.pdf xlixFreeman, L. (2012). The Impact of Source of Income Laws on Voucher Utilization. Housing Policy Debate. 22:2. 297-318. l Tighe, R., Hatch, M., and Mead, J. (2017) Source of Income Discrimination and Fair Housing Policy. Journal of Planning Literature. 32:1. 3-15. Retrieved on March 20, 2017 from http://journals.sagepub.com/doi/pdf/10.1177/0885412216670603 li Ibid. lii Ibid. liii Expanding Choice: Practical Strategies For Building A Successful Housing Mobility Program Appendix B: State, Local, and Federal Laws Barring Souce-of-Income Discrimination. 2016. Poverty & Race Research Action Council. Retrieved on March 1, 2017 from http://www.prrac.org/pdf/AppendixB.pdf liv Ibid. lv ESRI Community Report Chattanooga lvi ESRI Memphis Community Report lvii Simply Map Memphis Population lviii ESRI Milwaukee Community Report lix Milwaukee City Ordinance Chapter 109: Equal Rights. Retrieved on Marc 5, 2017 from http://city.milwaukee.gov/ImageLibrary/Groups/ccClerk/Ordinances/Volume-1/CH109.pdf lx Wisconsin State Statue. Chapter 106: Apprentice, Employment and Equal Rights Programs. Retrieved on March 5, 2017 from http://docs.legis.wisconsin.gov/statutes/statutes/106.pdf lxi Housing Choice Voucher Guidebook: Chapter 5 – Eligibility and Denial of Assistance. Department of Housing and Urban Development. Retrieved on February 25, 2017 from https://portal.hud.gov/hudportal/documents/huddoc?id=DOC_11749.pdf lxiiBenDor,T.andStewart,A.(2009).LandUsePlanningandSocialEquityinNorthCarolina’sCompensatoryWetlandandStreamMitigationPrograms.SpringerScienceandBusinessMedia.RetrievedonMarch24,2017fromfile:///Users/annie/Downloads/BenDor_Stewart_JEM_Final.pdf.lxiii “HUD Publishes Final Small Area FMR Rule” 2016. National Low Income Housing Coalition. Retrieved on February 25, 2017 from http://nlihc.org/article/hud-publishes-final-small-area-fmr-rule lxiv Housing Mobility Programs in the U.S. 2015. National Conference on Housing Mobility. Retrieved on February 20, 2017 from http://prrac.org/pdf/HousingMobilityProgramsInTheUS2015.pdf