Faculty of Management and Social Sciences Abasyn ...
305
An Empirical Investigation into the Mediating Role of Internal Service Quality on the Linkage between Internal Organizational Factors and Organizational Performance By Khawaja Fawad Latif Registration No. AUP-11FL-Ph.D (MGT)-3124 Research Thesis Submitted to the Department of Management Sciences, Abasyn University, Peshawar in Partial Fulfillment of the Requirements for the Degree of Doctor of Philosophy of the Abasyn University, Pakistan Faculty of Management and Social Sciences Abasyn University Peshawar Campus, Ring Road (Charsadda Link), Peshawar, Khyber Pakhtunkhwa 2015
Transcript of Faculty of Management and Social Sciences Abasyn ...

An Empirical Investigation into the Mediating Role of Internal Service Quality on the
Linkage between Internal Organizational Factors and Organizational Performance
By
Khawaja Fawad Latif
Registration No. AUP-11FL-Ph.D (MGT)-3124
Research Thesis Submitted to the Department of Management Sciences, Abasyn
University, Peshawar in Partial Fulfillment of the Requirements for the Degree of
Doctor of Philosophy of the Abasyn University, Pakistan
Faculty of Management and Social Sciences
Abasyn University Peshawar Campus, Ring Road (Charsadda Link), Peshawar,
Khyber Pakhtunkhwa 2015

ii
Certificate of Approval
I certify that I have read “An Empirical Investigation into the Mediating Role of Internal
Service Quality on the Linkage between Internal Organizational Factors and Organizational
Performance” by Khawaja Fawad Latif, AUP-11FL-Ph.D (MGT)-3124 and that in my opinion
this work meets the criteria for approving a thesis submitted in partial fulfillment of the
requirements for the degree of Ph.D. in Management Sciences at Abasyn University,
Peshawar.
Supervisor External Examiner (i)
______________________ ___________________________
Name: Dr. Qadar Bakhsh Baloch Name: Dr. Rashid Rehman
Date: ______________________ Date: ______________________
External Examiner (ii)
___________________________
Name: Dr. Raza Ullah
Date: ______________________
Internal Examiner
___________________________
Name: Dr. Shahid Jan Kakakhel
Date: ______________________
Head of Department
____________________________
Name: Prof. Dr. Aurangzeb
Date: ______________________

iii
Dedication
I dedicate this work to the most important pillars of my life, first and foremost, my
parents who sacrificed their comfort for my education; to my brothers; and to my beloved
wife and son for bearing with my lack of attention during the time I was writing the thesis.

iv
Acknowledgements
I confront scarcity of words to thank the Al-Mighty for granting me the virtue of
knowledge and making me a capable person to utilize the skills i acquired. Afterwards there
are certain other individuals who have helped in pursuing this literary journey. I would like to
extend my appreciation and thanks to my supervisor, Dr. Qadar Bakhsh Baloch for his
constant encouragement, counselling and support. I would like to extend my gratitude to my
teacher, Dr. Shahid Jan Kakakhel for his support and guidance. A special thanks is also due
to the Chancellor Abasyn University, Mr. Muhammad Imran Ullah, and Vice Chancellor,
Prof. Dr. Jamil Ahmad for their constant urge and drive to complete my thesis in time. I
render my earnest gratitude to Dean of Research Prof. Dr. Muhammad Iqbal for his unlimited
support and guidance. A special thanks to my work colleagues, Mr. Shahid Rashid, Mr. Irfan
Ullah, and Mr. Naveed Shinwari for sharing my work load. A note of thanks is also due to
Mr. Aziz Ahmad and Mr. Adeel Wahab Siddiqui for their support.
I would like to thank Mr. Amjad Ali, my teacher, former colleague, and my mentor
for his support and guidance at the start of my academic career. I would also like to extend
my regards to Mr. Sabur Sethi, President, City University of Science and Information
Technology for putting forth his trust in my competencies and providing me with an
opportunity to work at City University after my graduation.
I would like to express my heartfelt thanks to my dearest friend Abdul Wahab for his
constant and sincere prayers and support. Last but not the least a special acknowledgment to
my dear friend, colleague and fellow Ph.D. Scholar, Mr. Muhammad Usman Haider for his
conviction in my abilities and for being an indispensable helping hand at Abasyn University.

v
Table of Contents
Certificate of Approval .............................................................................................................. ii
Dedication ................................................................................................................................ iii
Acknowledgements ................................................................................................................... iv
Table of Contents ....................................................................................................................... v
List of Tables ............................................................................................................................ ix
List of Figures .......................................................................................................................... xii
Abstract ................................................................................................................................... xiv
Chapter 1 Introduction............................................................................................................ 1
1.1. Background ........................................................................................................................... 1
1.2. Statement of Problem ........................................................................................................... 7
1.3. Objectives of the Study ......................................................................................................... 7
1.4. Research Questions ............................................................................................................... 8
1.5. Summary of Theoretical Framework and Research Hypotheses ..................................... 9 1.5.1. Organizational Learning, ISQ and Organizational Performance .................................................. 9 1.5.2. Organizational Collaborative Culture, ISQ and Organizational Performance ............................ 10 1.5.3. Organizational Commitment, ISQ and Organizational Performance ......................................... 10 1.5.4. Perceived Organizational Support, ISQ and Organizational Performance ................................. 11 1.5.5. Role Stress, ISQ and Organizational Performance ..................................................................... 11 1.5.6. Internal Marketing, ISQ and Organizational Performance ......................................................... 11
1.6. Research Scope .................................................................................................................... 12 1.6.1. Conceptual scope ........................................................................................................................ 12 1.6.2. Choice of Data Context .............................................................................................................. 12 1.6.3. Population and Sample. .............................................................................................................. 13
1.7. Significance of the Study .................................................................................................... 13 1.7.1. Academic Significance ............................................................................................................... 13 1.7.2. Organizational Significance ....................................................................................................... 14 1.7.3. Managerial Significance ............................................................................................................. 14 1.7.4. Economic Significance ............................................................................................................... 15 1.7.5. Social Significance ..................................................................................................................... 15
1.8. The Research Contributions .............................................................................................. 15
1.9. Research Plan ...................................................................................................................... 16 1.9.1. Phase 1: Literature Review ......................................................................................................... 17 1.9.2. Phase 2: Research Methodology................................................................................................. 17 1.9.3. Phase 3: Data Analysis and Interpretation .................................................................................. 18
1.10. Organization of the Study .............................................................................................. 18
Chapter 2 Literature Review ................................................................................................ 20
2.1. Introduction ......................................................................................................................... 20

vi
2.2. The Concept of Quality....................................................................................................... 20
2.3. Internal Service Quality (ISQ) ........................................................................................... 24 2.3.1. Barriers to Internal Service Quality. ........................................................................................... 29 2.3.2. Fostering Internal Service Quality .............................................................................................. 32 2.3.3. Measuring ISQ ........................................................................................................................... 35 2.3.4. Banks and Internal Service Quality ............................................................................................ 40
2.4. Internal Organizational Factors ........................................................................................ 41 2.4.1. Organizational Learning ............................................................................................................. 52 2.4.2. Organizational Culture ............................................................................................................... 58 2.4.3. Organizational Commitment ...................................................................................................... 68 2.4.4. Perceived Organizational Support (POS) ................................................................................... 75 2.4.5. Role Stress .................................................................................................................................. 79 2.4.6. Internal Marketing ...................................................................................................................... 83
2.5. Organizational Performance .............................................................................................. 90 2.5.1. Earnings per Share ...................................................................................................................... 92 2.5.2. Return on Equity ........................................................................................................................ 92 2.5.3. Return on Assets ......................................................................................................................... 93
2.6. Service Quality and Organizational Performance ........................................................... 93
2.7. Mediating Role of Internal Service Quality ...................................................................... 95
2.8. Summary of Internal Organizational Factors and their Sources ................................... 97
Chapter 3 Conceptual Framework and Hypotheses........................................................... 99
3.1. Introduction ......................................................................................................................... 99
3.2. Conceptual Framework ...................................................................................................... 99
3.3. Research Hypotheses ........................................................................................................ 101 3.3.1. Organizational Learning, ISQ, and Organizational Performance ............................................. 102 3.3.2. Organizational Collaborative Culture, ISQ, and Organizational Performance ......................... 103 3.3.3. Organizational Commitment, ISQ, and Organizational Performance ...................................... 104 3.3.4. Perceived Organizational Support, ISQ, and Organizational Performance .............................. 105 3.3.5. Role Stress, ISQ, and Organizational Performance .................................................................. 106 3.3.6. Internal Marketing, ISQ, and Organizational Performance ...................................................... 107
3.4. Summary ............................................................................................................................ 108
Chapter 4 Research Methodology ...................................................................................... 109
4.1. Research Philosophy ......................................................................................................... 109
4.2. Nature of Research ........................................................................................................... 111
4.3. Research Design ................................................................................................................ 111
4.4. Population .......................................................................................................................... 112
4.5. Sample ................................................................................................................................ 113
4.6. Measurement ..................................................................................................................... 114 4.6.1. Internal Service Quality ............................................................................................................ 115 4.6.2. Organizational Learning ........................................................................................................... 117 4.6.3. Organizational Collaborative Culture ....................................................................................... 117 4.6.4. Organizational Commitment .................................................................................................... 118

vii
4.6.5. Perceived Organizational Support ............................................................................................ 119 4.6.6. Role Stress ................................................................................................................................ 119 4.6.7. Internal Marketing .................................................................................................................... 120 4.6.8. Subjective Organizational Performance ................................................................................... 121 4.6.9. Objective Organizational Performance .................................................................................... 122
4.7. Pre-testing .......................................................................................................................... 122 4.7.1. Stage-1 - Content validity ......................................................................................................... 122 4.7.2. Stage Two: Readability ............................................................................................................ 123 4.7.3. Stage Three: Pilot Study ........................................................................................................... 124 4.7.4. Stage Four: Mistake Elimination .............................................................................................. 125
4.8. Data Collection .................................................................................................................. 126
4.9. Data Analysis ..................................................................................................................... 127 4.9.1. Descriptive Analysis ................................................................................................................. 127 4.9.2. Factor Analysis ......................................................................................................................... 127 4.9.3. Validity of Research ................................................................................................................. 128 4.9.4. Reliability Assessment ............................................................................................................. 129 4.9.5. Correlation Analysis ................................................................................................................. 130 4.9.6. Structural Equation Modeling .................................................................................................. 131 4.9.7. Mediation Analysis ................................................................................................................... 133
4.10. Summary of Research Methodology ........................................................................... 135
Chapter 5 Data Analysis and Results ................................................................................. 136
5.1. Descriptive Statistics ......................................................................................................... 136 5.1.1. Data Screening and Cleaning ................................................................................................... 136 5.1.2. Demographic Profile of Respondents ....................................................................................... 136 5.1.3. Descriptive Statistics of Constructs (Means, Skewness and Kurtosis) ..................................... 144
5.2. Factor Analysis .................................................................................................................. 164 5.2.1. Assumptions ............................................................................................................................. 164 5.2.2. Component Matrix ................................................................................................................... 167 5.2.3. Summary of Factor Analysis .................................................................................................... 173
5.3. Reliability ........................................................................................................................... 174
5.4. Construct Validity ............................................................................................................. 176 5.4.1. Convergent Validity ................................................................................................................. 176 5.4.2. Discriminant Validity ............................................................................................................... 177
5.5. Structural Equation Modeling ......................................................................................... 178 5.5.1. Evaluations of Measurement Models ....................................................................................... 178 5.5.2. Hypotheses Testing .................................................................................................................. 192
5.6. ISQ and Employee Demographics ................................................................................... 220 5.6.1. ISQ and Gender ........................................................................................................................ 220 5.6.2. ISQ and Age ............................................................................................................................. 220 5.6.3. ISQ and Rank ........................................................................................................................... 221 5.6.4. ISQ and Employment Type ...................................................................................................... 222 5.6.5. ISQ and Banking System.......................................................................................................... 223 5.6.6. ISQ and Years of Education ..................................................................................................... 224 5.6.7. ISQ and Job Tenure .................................................................................................................. 224 5.6.8. ISQ and Type of Bank .............................................................................................................. 225
5.7. Summary of the Research Results ................................................................................... 225

viii
Chapter 6 Discussion and Conclusions .............................................................................. 230
6.1. What factors affect organizational performance? ......................................................... 230
6.2. What factors affect ISQ? .................................................................................................. 235
6.3. What is the impact of ISQ on organizational performance? ........................................ 238
6.4. Does ISQ act as mediator between internal organizational factors & organizational
performance?................................................................................................................................. 239
6.5. Discussion on Measurement and Structural Models ..................................................... 241
6.6. Conclusions ........................................................................................................................ 242
6.7. Implications of the Study .................................................................................................. 245
6.8. Limitations and Delimitations.......................................................................................... 248
6.9. Directions for Future Research ....................................................................................... 248
6.10. Recommendations ......................................................................................................... 249
References ............................................................................................................................. 252

ix
List of Tables
Table 2.1 Description of Concept of Quality ....................................................................................... 21
Table 2.2 Major Barriers to Internal Service Quality ......................................................................... 31
Table 2.3 Initiatives to foster ISQ ........................................................................................................ 35
Table 2.4 Measuring Internal Service Quality ..................................................................................... 39
Table 2.5 Theoretical and Empirical foundation for identification of organizational factors ............ 48
Table 2.6 Summary of Internal Organizational Factors and their Sources ......................................... 98
Table 4.1 Characteristics of Positivism ............................................................................................. 110
Table 4.2 Sample Frame .................................................................................................................... 113
Table 4.3 Internal Service Quality Scale ........................................................................................... 116
Table 4.4 Organizational Learning scale items ................................................................................. 117
Table 4.5 Organizational collaborative culture scale items .............................................................. 118
Table 4.6 Organizational Commitment Scale .................................................................................... 118
Table 4.7 Perceived Organizational Support Scale ........................................................................... 119
Table 4.8 Role Stress Scale ................................................................................................................ 120
Table 4.9 Internal Marketing Scale ................................................................................................... 121
Table 4.10 Subjective organizational performance scale items ......................................................... 122
Table 4.11 Items removed at content validity stage ........................................................................... 123
Table 4.12 Mean Comparison for Constructs .................................................................................... 124
Table 4.13 Items removed during pilot testing stage ......................................................................... 125
Table 4.14 Questionnaires Response Details .................................................................................... 126
Table 4.15 Summary of Recommended fit Indices ............................................................................. 133
Table 5.1 Age Distribution of Respondents ....................................................................................... 137
Table 5.2 Gender distribution of respondents ................................................................................... 138
Table 5.3 Respondent’s years of education ....................................................................................... 139
Table 5.4 Nature of Employment ....................................................................................................... 140
Table 5.5 Rank distribution of respondents ....................................................................................... 141
Table 5.6 Descriptive statistics for Tenure ........................................................................................ 142
Table 5.7 Respondent’s distribution by banking system .................................................................... 142
Table 5.8 Respondent’s distribution by banking system .................................................................... 143
Table 5.9 Descriptive Statistics for organizational learning ............................................................. 145
Table 5.10 Normality distribution testing of organizational learning ............................................... 146
Table 5.11 Descriptive Statistics of organizational commitment ....................................................... 147
Table 5.12 Normality distribution testing of organizational commitment ......................................... 148
Table 5.13 Descriptive Statistics of collaborative culture ................................................................. 149
Table 5.14 Normality distribution testing of collaborative culture ................................................... 150
Table 5.15 Descriptive statistics for perceived organizational support ............................................ 151
Table 5.16 Normality distribution testing of perceived organizational support ................................ 152
Table 5.17 Descriptive statistics for role ambiguity .......................................................................... 153
Table 5.18 Normality distribution testing of role ambiguity .............................................................. 153
Table 5.19 Descriptive statistics for role conflict .............................................................................. 154
Table 5.20 Normality distribution testing of role conflict.................................................................. 155
Table 5.21 Descriptive statistics for internal marketing .................................................................... 155
Table 5.22 Normality testing of internal marketing ........................................................................... 156
Table 5.23 Descriptive statistics for Reliability ................................................................................. 157
Table 5.24 Normality distribution testing of reliability ..................................................................... 158

x
Table 5.25 Descriptive statistics for assurance. ................................................................................ 159
Table 5.26 Normality testing for assurance ....................................................................................... 159
Table 5.27 Descriptive statistics for empathy .................................................................................... 160
Table 5.28 Normality testing of empathy ........................................................................................... 161
Table 5.29 Descriptive statistics for responsiveness.......................................................................... 161
Table 5.30 Normality testing of responsiveness ................................................................................. 162
Table 5.31 Descriptive statistics for organizational performance ..................................................... 163
Table 5.32 Normality testing of organizational performance ............................................................ 163
Table 5.33 Summary of inter-variable correlation ............................................................................ 165
Table 5.34 Assumptions’ statistics for factor analysis ....................................................................... 167
Table 5.35 Component Matrix for Organizational Learning............................................................. 168
Table 5.36 Component Matrix for organizational commitment ......................................................... 169
Table 5.37 Component Matrix for Organizational collaborative culture .......................................... 169
Table 5.38 Component Matrix for perceived organizational support ............................................... 170
Table 5.39 Component Matrix for role stress .................................................................................... 170
Table 5.40 Component matrix for internal marketing ....................................................................... 171
Table 5.41 Component matrix for internal service quality ................................................................ 172
Table 5.42 Component matrix for organizational performance ........................................................ 173
Table 5.43 Summary of factor analysis .............................................................................................. 174
Table 5.44 Reliability analysis of the constructs ............................................................................... 175
Table 5.45 AVE for constructs ........................................................................................................... 177
Table 5.46 Comparison of Square root of AVE and Inter-Construct Correlations ........................... 178
Table 5.47 Summary of initial and attained findings: Organizational Learning ............................... 179
Table 5.48 Summary of initial and attained findings: Organizational Collaborative Culture .......... 181
Table 5.49 Summary of initial and attained findings: Organizational Commitment ......................... 182
Table 5.50 Summary of initial and attained findings: Organizational Commitment ......................... 184
Table 5.51 Summary of initial and attained findings: Role Stress ..................................................... 185
Table 5.52 Summary of initial and attained findings: Internal Marketing ........................................ 186
Table 5.53 Summary of initial and attained findings: Internal Service Quality ................................ 188
Table 5.54 Summary of initial and attained findings: Organizational Performance ........................ 190
Table 5.55 Summary of the measurement models .............................................................................. 191
Table 5.56 Summary of initial and attained findings: Structural Model A ........................................ 193
Table 5.57 Summary of measurements: Internal Organizational Factors and ISQ .......................... 195
Table 5.58 Summary of initial and attained findings: Structural Model B ........................................ 196
Table 5.59 Summary of measurements: Internal Organizational Factors & Organizational
Performance ........................................................................................................................................ 198
Table 5.60 Summary of initial and attained findings: Structural Model C1-2-3 ............................... 199
Table 5.61 Summary of measurements: Internal Organizational Factors & Organizational
Performance ........................................................................................................................................ 203
Table 5.62 Summary of initial and attained findings: Structural Model D ....................................... 204
Table 5.63 Summary of measurements: ISQ and Organizational Performance (OP) ....................... 205
Table 5.64 Summary of initial and attained findings: Structural Model E1-2-3 ............................... 205
Table 5.65 Summary of measurements: ISQ and Organizational Performance ................................ 207
Table 5.66 Mediation analysis ISQ between OL and OP .................................................................. 209
Table 5.67 Mediation analysis ISQ between CC and OP .................................................................. 210
Table 5.68 Mediation analysis ISQ between OC and OP .................................................................. 211
Table 5.69 Mediation analysis ISQ between POS and OP ................................................................ 212
Table 5.70 Mediation analysis ISQ between RS and OP ................................................................... 213

xi
Table 5.71 Mediation analysis ISQ between IM and OP ................................................................... 214
Table 5.72 Mediation analysis ISQ between OL and ROE ................................................................ 215
Table 5.73 Mediation analysis ISQ between CC and ROE ................................................................ 216
Table 5.74 Mediation analysis ISQ between IM and ROE ................................................................ 217
Table 5.75 Mediation analysis ISQ between OC and ROA ............................................................... 218
Table 5.76 Mediation analysis ISQ between OC and ROE ............................................................... 219
Table 5.77 Compare Means, ISQ with respect to Gender ................................................................. 220
Table 5.78 Compare Means, ISQ with respect to Age ....................................................................... 221
Table 5.79 ANOVA Results, ISQ and Job Rank ................................................................................. 222
Table 5.80 Multiple Comparison across Job Ranks .......................................................................... 222
Table 5.81 Compare Means, ISQ with respect to Employment Type ................................................. 223
Table 5.82 Compare Means, ISQ with respect to Banking System .................................................... 224
Table 5.83 ANOVA results, ISQ across Years of Education .............................................................. 224
Table 5.84 ANOVA results, ISQ across different job tenures ............................................................ 225
Table 5.85 Compare Means, ISQ with respect to Type of Bank ........................................................ 225
Table 5.86 Summary of Hypotheses Results ...................................................................................... 227

xii
List of Figures
Figure 1.1. Theoretical Framework for the Study .................................................................................. 9
Figure 1.2. Research Phase 1 ................................................................................................................ 17
Figure 1.3. Research Phase 2 ................................................................................................................ 18
Figure 1.4. Research Phase 3 ................................................................................................................ 18
Figure 3.1. Conceptual Framework .................................................................................................... 101
Figure 4.1. Research Design ............................................................................................................... 112
Figure 4.2. Diagrammatic Representation of Mediation Analysis ..................................................... 134
Figure 5.1. Age wise distribution of respondents ............................................................................... 137
Figure 5.2. Gender wise distribution of respondents .......................................................................... 138
Figure 5.3. Distribution of respondents on years of education ........................................................... 139
Figure 5.4. Respondent’s nature of employment ................................................................................ 140
Figure 5.5. Distribution by job rank ................................................................................................... 141
Figure 5.6. Distribution by Banking System (Source: Field Data) .................................................... 142
Figure 5.7. Distribution by Bank Type ............................................................................................... 143
Figure 5.8. Measurement model for organizational learning ............................................................. 180
Figure 5.9. Measurement model for collaborative culture ................................................................. 181
Figure 5.10. Measurement model for organizational commitment .................................................... 183
Figure 5.11. Measurement model for perceived organizational support ............................................ 184
Figure 5.12. Measurement model for role stress ................................................................................ 186
Figure 5.13. Measurement model for internal marketing ................................................................... 187
Figure 5.14. Measurement model for ISQ .......................................................................................... 189
Figure 5.15. Measurement model for organizational performance .................................................... 191
Figure 5.16. Structural Model A: Internal organizational factors and ISQ ........................................ 194
Figure 5.17. Structural Model B: Internal organizational factors and organizational performance ... 197
Figure 5.18. Structural Model C1: Internal organizational factors and organizational performance . 200
Figure 5.19. Structural Model C2: Internal organizational factors and organizational performance . 201
Figure 5.20. Structural Model C3: Internal organizational factors and organizational performance . 202
Figure 5.21. Structural Model D: ISQ and organizational performance ............................................ 204
Figure 5.22. Structural Model E1: ISQ and Objective Organizational Performance ......................... 206
Figure 5.23. Structural Model E2: ISQ and Objective Organizational Performance ......................... 206
Figure 5.24. Structural Model E3: ISQ and Objective Organizational Performance ......................... 207
Figure 5.25. Mediation: ISQ, OL and OP ........................................................................................... 209
Figure 5.26. Mediation: ISQ, CC and OP ........................................................................................... 210
Figure 5.27. Mediation: ISQ, OC and OP .......................................................................................... 211
Figure 5.28. Mediation: ISQ, POS and OP ......................................................................................... 212
Figure 5.29. Mediation: ISQ, RS and OP ........................................................................................... 213
Figure 5.30. Mediation: ISQ, IM and OP ........................................................................................... 214
Figure 5.31. Mediation: ISQ, OL and ROE ........................................................................................ 215
Figure 5.32. Mediation: ISQ, CC and ROE ........................................................................................ 216
Figure 5.33. Mediation: ISQ, IM and ROE ......................................................................................... 217
Figure 5.34. Mediation: ISQ, OC and ROA ....................................................................................... 218
Figure 5.35. Mediation: ISQ, OC and ROE ....................................................................................... 219

xiii
Abbreviations
Abbreviation Description
ISQ Internal Service Quality
OL Organizational Learning
OC Organizational Commitment
CC Collaborative Culture
POS Perceived Organizational Support
IM Internal Marketing
RS Role Stress
POP Perceived Organizational Performance
ROE Return on Equity
ROA Return on Average Assets
EPS Earnings Per Share
SEM Structural Equation Modelling
CFA Confirmatory Factor Analysis
EFA Exploratory Factor Analysis
AVE Average Variance Extracted

xiv
Abstract
The study seeks to evaluate the mediating role of ISQ on the relationship between
different internal organizational factors and organization performance, furthermore the study
also ascertains the influence of internal organizational factors on ISQ and organizational
performance. Additionally the study also evaluates the impact of ISQ on organizational
performance. The internal organizational factors include; organizational learning,
collaborative culture, organizational commitment, perceived organizational support, role
stress & internal marketing. The study is a descriptive cum correlational, focusing on the
performance and ISQ of different banks operating in Peshawar. The sample included 80 bank
branches, the data was collected from the employees working in different bank branches
located within the city of Peshawar. Banks selected as part of the population required to have
more than five branches. Stratified random sampling technique was utilized to collect the data
from different banks operating in the city of Peshawar. A total of 564 questionnaires were
distributed in 80 different branches of medium and large sized banks. In the present study 404
questionnaires were returned, constituting the response rate of 71.63%. A total of 63
questionnaires were rejected. The total number of questionnaires usable for the study was
341.
Evaluating the impact of different internal organizational factors on ISQ revealed that
three out of six internal organizational factors namely; organizational commitment, role
stress, and internal marketing have a significant influence on the internal service quality.
While three factors namely; organizational learning, collaborative culture and perceived
organizational support did not have a significant influence on the internal service quality. The
results revealed that four out of six internal organizational factors namely; organizational
learning, organizational commitment, role stress, and internal marketing have a significant
influence on the perceived organizational performance. While two factors namely;

xv
collaborative culture and perceived organizational support did not have a significant
influence on the perceived organizational performance. Mediation analysis proved partial
mediation between all internal organizational factors and perceived organizational
performance. The objective measure for bank performance used in the present study included
Return on Equity (ROE), Earnings per Share (EPS) and Return on Assets (ROA). Mediation
analysis between different internal organizational factors and financial organizational
performance showed that ISQ fully mediates the path between organizational learning and
Return on Equity (ROE), collaborative culture and ROE, and internal marketing and ROE.
The study ascertains that ISQ has a significant influence in predicting both subjective and
objective organizational performance measures. The present research strengthens the
theoretical assertions that unless ISQ is not strengthened, the organization will not be able to
attain external service quality, growth and profit. The mediated effect of ISQ is important to
top management, implying their responsibility for investing to create an environment that
nurtures trust, understanding, commitment, provision of timely service, and positivity in
attitude and behavior. Management which expects to reap benefits of service quality must
understand the need of better ISQ and should invest in the intangible factors that have been
proven to affect the tangible profits. The research study affirms that it is not only external
service quality that adds to the profitability of the organizations. Therefore, it is found
imperative for the banks to foster ISQ in their workplace environment.
Keywords: Organizational Learning, Organizational Commitment, Organizational Culture,
Perceived Organizational Support, Role Stress, Internal Marketing, Internal Service Quality,
Organizational Performance

1
Chapter 1
Introduction
1.1. Background
Organizations operate in an extremely competitive, vibrant, challenging, and dynamic
business environment. In response to the pressures of running business in such an
environment, organizations seek ways to add value to the services offered and improve their
service quality. One way to achieve optimal level of service quality is through focus on the
human resources. The role of human resource in the attainment of desired profits is
increasingly catching the focus of the organizations. There is a move from concern for
production to concern for people. This shift is especially true for service industries. The
change in focus is dictated by the understanding that services are created, nurtured, and
delivered through people. Lack of attention towards human resources can seriously hamper
the value of service. This is because in customer contact businesses, quality of service
delivered is strongly linked with the quality of service providers. It is for this reason that the
need for quality improvement continues unabated both in the manufacturing and service
sector (Longenecker & Scazzero, 2000). The challenge to provide efficient and effective
service is dictated by the fact that today’s customers are more informed, knowledgeable, and
experienced about the variety of products and services being offered in the market. This
awareness about product quality, shape customers’ expectations about the product, and
compels the business world to meet the expectations and anticipations of the customers
(Prakash & Mohanty, 2012). Improvements in service quality are also necessitated by the fact
that Liberalisation has provided customers the opportunity to choose their service provider.
Thus, customers demand better quality or otherwise they have the chance to shift to another
supplier (Pina, Torres, & Bachiller, 2014).

2
Parasuraman (2002) stressed that scholarly literature attests to the benefits of
providing superior customer service. Emphasis is laid on the business to create meaningful,
memorable customer experiences (Prakash & Mohanty, 2012). This user satisfaction will
come from service quality (Hernon & Whitman, 2001; Wang & Shieh, 2006). Service quality
is an important tool that not only ensures survival but growth in the extremely competitive
business environment. Businesses requires user satisfaction for survival and growth.
Businesses make progress based on the level of relationship it has with the customers. The
key to better relationship is the quality of service customers receive that would make them
come back for the service. Service quality is thus a business imperative, especially for service
sector. The user satisfaction flows from the employees, and employees will not be able to
generate quality service unless or until the services exchanged between different employees
are worthy and valued. Hence, the service providers have placed more emphasis on the
significance of service quality as a way of attaining competitive advantage (Gustaffson, 2009;
Sureshchander, Rajendran, & Anatharaman, 2002; Vanniarajan & Subbash, 2011).
Longenecker and Scazzero (2000) further highlight the value of service quality by referring
to history when quality was referred to as competitive advantage. Today’s businesses run the
risk of being driven out if they fail to improve the quality, and they referred to quality as a
market segment mandate.
In general, quality is recognized as basic value capable of generating a competitive
advantage through product/service differentiation (Hamid Reza Ghasemian, Azad, &
Seyedaliakbar, 2014). The differentiation of service stimulates customer satisfaction, it can
pay rich dividends like customer retention, cost reduction and increased profits (Zeithaml,
Bitner, & Gremler, 2006). Moreover, businesses should note that service quality is an asset
that needs to be managed, after all, it is more complicated to do service well than to change
the price or to alter the inventory of goods available (Prakash & Mohanty, 2012). This is in

3
fact, due to the complex nature of the service, the people involved, and the nature of the
exchange between the service providers. Effective and efficient management of this asset
would enable businesses to stand out from their competitors (Gracia, Cifre, & Grau, 2010).
Service quality has been identified as one of the key features that ultimately leads to
organizational success; however a decline in service quality leads to deterioration in the level
of customer satisfaction (Frost & Kumar, 2000) which adversely affects organizational
performance. However, increased level of service quality has been found to produce greater
satisfaction amongst customers that could lead to patronage intentions and increased sales
(Prakash & Mohanty, 2012).
Service Quality takes two different forms i-e, external and internal. External service
quality relates to assessment based on what the customers’ value and what they are willing to
pay for (Dinitzen & Bohlbro, 2010). External service quality is strongly contingent to internal
service i-e, employees receiving high quality internal services would strive to provide higher
quality external service. Internal service quality (ISQ), on the other hand, points to services
provided by distinctive organizational units or the people working in different departments to
other departments or employees within the organization (Stauss, 1995). ISQ refers to an
organization's ability to attract, develop, motivate and retain quality employees (Mok, Sparks,
& Kadampully, 2001). Thus, in order to achieve optimal level of ISQ, organizations will have
to focus on its employees. This is imperative for most services, as the delivery of services
occurs through human interaction (Boshoff & Mels, 1995). While human factors are
significant in all quality enhancement initiatives, they are critical in service industries
(Longenecker & Scazzero, 2000). The level of internal customer (employee) service quality
has an essential impact on the service value provided to the external customer (Bouranta,
Chitiris, & Paravantis, 2009). This is because many of the employees working in an
organization might seldom or never have a direct interaction with the external customers,

4
however the performance and interaction between employees working in different
departments have a direct effect on the service quality perceived by the external customers.
This understanding has stimulated organizational focus on the development of better ISQ that
would aid in fostering external service which would in turn results in attaining healthier
organizational results. It is widely believed that traits related to service personnel have a key
part in determining customer contentment (Hays & Hill, 2001). It is important to study ISQ,
unless the concerns of ISQ are addressed business will not be able to increase the level of
external service quality, and attain growth and profitability (Cook, 2004). The need to study
ISQ is further highlighted by the fact that the quality of external service delivery is a
reflection of the quality of service that people in the organization provide to each other
(Cook, 2008).
Extensive research is available on service quality from the external customer
perspective, however, relatively few studies have concentrated on the factors that
significantly influence employees’ (Internal Customers) service quality. These researches
which has been carried out in the area of ISQ are in the fields’ of Healthcare (Gunawardane,
2009; Pantouvakis & Mpogiatzidis, 2013), Insurance (Boshoff & Mels, 1995), Food Industry
(Wildes, 2007; Wildes & Parks, 2005), Banks (Bellou & Andronikidis, 2008; Vanniarajan &
Subbash, 2011), University (Jun & Cai, 2010), hotels (Bai, Brewer, Sammons, & Swerdlow,
2006; Paraskevas, 2001), Pharmaceuticals (ELSamen & Alshurideh, 2012), and Airline (Frost
& Kumar, 2001).
Though, there are numerous research studies on external service quality, only limited
studies have focused on internal service quality especially in commercial banks. Hence, the
present study is operationalized among banks. The banking sector is a demand driven
industry and represents a vital section of the services industry in any country (Mishkin,
2001). The current rapidly changing environment is compelling the attention of banking

5
institutions towards service quality, and retail banks are striving towards increasing customer
satisfaction through improved service quality (Choudury, 2014). This is because growth in
the banking sector and the ever increasing competition among banks has clearly highlighted
the need for customer satisfaction and optimization of customer service for a surge in market
shares and profitability (Anderson et al., 1994). It is however important to note that for many
organizations, quality means meeting customers' requirements. However, customer may not
refer to people outside the organization only, Juran (1988) defined customers as persons who
are not only the organization's customers but also its employees. He included all persons in
customers who are affected by an organization’s processes and products. Organizations
understanding of how a person working within the organization is affected by the activities
within the organization can not only aid in designing strategies and practices that would offer
a more congenial business environment but also make employee reciprocate with level of
performance desired by the organization.
Existing research studies have identified the need to look at different factors and its
influence on service quality and organizational performance. Different researchers have
studied different factors that can impact on internal service quality, however, there are gaps in
the existing research that suggest directions for further research. Boshoff and Mels (1995)
suggest that future endeavors in the study of ISQ shall include variables other than
organizational commitment. Tsaur and Lin (2004) who studied HRM practices impact on
service quality recommended that future research should present other factors in the study to
help clarify the antecedents of service behavior. Furthermore, they also noted that the earlier
literature suggests that organizational issues could also be predictors of service behavior.
Vella, Gountas, and Walker (2009) stressed that in an organization, there are too many
factors that can impact on service quality, hence services research requires suitable focus and
a manageable count of constructs that appear to be more significant to explain service quality

6
from the employee’s viewpoint only. Similarly Slatten (2009) recommended that future
research on service quality could include relevant managerial practices other than reward and
support. Andrews, Boyne and Walker (2006) calls for the study of a wider set of measures
that may reveal a stronger link of ISQ with organizational performance. Similarly gaps in the
literature pertinent to organizational performance are also highlighted. Kim (2005) utilized
only four individual-level variables to predict organizational performance and proposed that
future research should look for additional factors that affect organizational performance.
Tseng (2010) suggests the inclusion of a different set of attitudes and behaviors and evaluate
how they impact organizational performance. Hence, based on the limitations of existing
research and future research directions that calls for the inclusion of additional factors that
may carry a significant impact on the ISQ and organizational performance form part of the
present study. The selection of factors is based on the literature pertinent to quality
management, service quality GAPS, and organizational performance. These factors include
Organizational Learning, Collaborative Organizational Culture, Organizational Commitment,
Perceived Organizational Support, Role Stress, and Internal Marketing. The present study
intends to focus on factors that shall be considered by the management to ensure better ISQ
that ultimately leads to improved service delivery to the customers. The factors are derived
from literature and are discussed in detail in chapter 2.
Quality of service and enhanced organizational performance can be warranted through
adoption of two different strategies. One is reactive while the other is proactive. Where
performance management techniques and rewards for better service or performance can be
termed as reactive approaches, since the employee is compensated afterwards and have a
short term influence. These measures may not guarantee optimal service or performance.
Organizational focus on proactive measures that bring about change in how people feel,
perceive, and behave can have a long term effect. Organizations need to focus on the

7
personality of their employees, and how well they interact and respond to each other. This is
possible only through paying attention to organizational initiatives, employee behaviors and
attitudes. Focusing on these factors will lead to changes in the values of the employee. It is
for this reason that the present study attempts to evaluate the influence of different
organizational initiatives and attitudes on both ISQ and organizational performance.
The present study not only brings together different organizational factors, and
evaluates its impact on ISQ but also evaluates the linkage of ISQ with organizational
performance. Further empirical investigation is needed on service quality and its relationship
with organizational performance, especially among different service organizations (Al-Enezi,
2012). The study further evaluates whether ISQ mediates between different internal
organizational factors and organizational performance or not. Since existing studies have
identified how ISQ influences or is influenced by other factors in different industries.
Research has shown the influence of different internal organizational factors on
organizational performance. A causal link could be established based on the existing
literature that shows the influence of different internal organizational factors on ISQ and their
direct impact on organizational performance.
1.2. Statement of Problem
The research reasons that organizational performance will improve on the basis of
ISQ rather than the influence of internal organizational factors alone. The present study seeks
to ascertain if ISQ mediates between internal organizational factors and organizational
performance or otherwise.
1.3. Objectives of the Study
The overarching goal of this research is to examine whether ISQ acts as a mediator
between different internal organizational factors and organizational performance or

8
otherwise. The scarcity of the research in this area highlights a knowledge gap. This study
aims to address this gap. The specific objectives of the study are as under
a. To evaluate factors (organizational learning, organizational collaborative culture,
organizational commitment, perceived organizational support, role stress, and internal
marketing) that significantly influence organizational performance.
b. To investigate factors (organizational learning, organizational collaborative culture,
organizational commitment, perceived organizational support, role stress, and internal
marketing) that significantly influence ISQ.
c. To evaluate the impact of ISQ on Organizational Performance
d. To investigate if ISQ acts as a mediator between internal organizational factors and
organizational performance.
1.4. Research Questions
In order to seek the solution of the research question/problem, the research focused to
find answers to the following questions.
a. What are the internal organizational factors (organizational learning, organizational
collaborative culture, organizational commitment, perceived organizational support,
role stress, and internal marketing) that affect organizational performance?
b. What are the internal organizational factors (organizational learning, organizational
collaborative culture, organizational commitment, perceived organizational support,
role stress, and internal marketing) that affect ISQ?
c. What is the impact of ISQ on organizational performance
d. Does ISQ act as a mediator between internal organizational factors and organizational
performance?

9
1.5. Summary of Theoretical Framework and Research Hypotheses
A number of diverse studies on different internal organizational factors, ISQ and
organizational performance have been studied to draw the theoretical framework for the
current study. The study not only evaluates the direct influence of different internal
organizational factors on ISQ but also on organizational performance. Furthermore, the study
also evaluates the mediating role of ISQ. Based on the extensive review of literature the
following framework of proposed to study the relationships.
Figure 1.1. Theoretical Framework for the Study
Based on the aforementioned framework, following set of hypotheses are proposed to test the
relationships
1.5.1. Organizational Learning, ISQ and Organizational Performance
H1a: There is a significant impact of Organizational Learning on ISQ
H1b: There is a significant impact of Organizational Learning on Perceived Organizational
Performance
H1c1-2-3: There is a significant impact of Organizational Learning on Objective
Organizational Performance (EPS, ROE, & ROA)
Organizational Performance Objective Performance
Subjective Performance
Internal
Service Quality
Internal Organizational Factors
Organizational Learning
Collaborative Culture
Internal Marketing
Organizational Commitment
Perceived Organizational Support
Role Stress

10
H1d: ISQ mediates between Organizational Learning and Perceived Organizational
Performance
H1e1-2-3: ISQ mediates between Organizational Learning and Objective Organizational
Performance (EPS, ROE, & ROA)
1.5.2. Organizational Collaborative Culture, ISQ and Organizational
Performance
H2a: There is a significant impact of Organizational Collaborative Culture on ISQ
H2b: There is a significant impact of organizational collaborative culture on Perceived
Organizational Performance
H2c1-2-3: There is a significant impact of organizational collaborative culture on objective
organizational performance (EPS, ROE, & ROA)
H2d: ISQ mediates between Organizational Culture and Perceived Organizational Performance
H2e1-2-3: ISQ mediates between Organizational Culture and Objective Organizational
Performance (EPS, ROE, & ROA)
1.5.3. Organizational Commitment, ISQ and Organizational Performance
H3a: There is a significant impact of Organizational Commitment on ISQ.
H3b: There is a significant impact of Organizational Commitment on Perceived Organizational
Performance
H3c1-2-3: There is a significant impact of organizational commitment on objective
organizational performance (EPS, ROE, & ROA)
H3d: ISQ mediates between Organizational Commitment and Perceived Organizational
Performance
H3e1-2-3: ISQ mediates between Organizational Commitment and Objective Organizational
Performance (EPS, ROE, & ROA)

11
1.5.4. Perceived Organizational Support, ISQ and Organizational Performance
H4a: There is a significant impact of perceived organizational support on ISQ
H4b: There is a significant impact of perceived organizational support on perceived
organizational performance
H4c1-2-3: There is a significant impact of perceived organizational support on objective
organizational performance (EPS, ROE, & ROA)
H4d: ISQ mediates between Perceived Organizational Support and Perceived Organizational
Performance
H4e1-2-3: ISQ mediates between Perceived Organizational Support and Objective
Organizational Performance (EPS, ROE, & ROA)
1.5.5. Role Stress, ISQ and Organizational Performance
H5a: There is a significant impact of Role Stress on ISQ
H5b: There is a significant impact of Role Stress on Perceived Organizational Performance
H5c1-2-3: There is a significant impact of Role Stress on objective organizational performance
(EPS, ROE, & ROA)
H5d: ISQ mediates between Role Stress and Perceived Organizational Performance
H5e1-2-3: ISQ mediates between Role Stress and Objective Organizational Performance (EPS,
ROE, & ROA)
1.5.6. Internal Marketing, ISQ and Organizational Performance
H6a: There is a significant impact of Internal Marketing on ISQ
H6b: There is a significant impact of Internal Marketing on Perceived Organizational
Performance
H6c1-2-3: There is a significant impact of Internal Marketing on objective organizational
performance (EPS, ROE, & ROA)
H6d: ISQ mediates between Internal Marketing and Perceived Organizational Performance

12
H6e1-2-3: ISQ mediates between Internal Marketing and Objective Organizational
Performance (EPS, ROE, & ROA)
H7a: There is a significant impact of ISQ on Perceived Organizational Performance
H7b1-2-3: There is a significant impact of ISQ on objective organizational performance (EPS,
ROE, & ROA)
1.6. Research Scope
1.6.1. Conceptual scope
The study examined the relationship between internal organizational factors
(independent variable), ISQ (mediating variable) and organizational performance (dependent
variable) in the context of banking sector.
1.6.2. Choice of Data Context
The referent data set for the study was obtained from the banking industry in Pakistan.
The focus on banking sector in the present study is dictated by the growth of service sector
that gives a new dimension of stability to Pakistan’s growth process (Ahmed & Ahsan, 2011).
Furthermore, the banking industry provides the financial foundation for growth and stability
in any economy and particularly in the developing economies (Uzkurt, Kumar, Kimzan, &
Eminoglu, 2013). The transformation of the Pakistani banking sector over the past 15 years
through liberalization, establishment of private banks, the privatization of public-sector
banks, and the tightening of prudential regulations has resulted in superior banking
performance (di Patti & Hardy, 2005). Similarly State Bank of Pakistan reports that most of
the banks operating in Pakistan are stable, this shows that Pakistani banking industry has
matured and is found to have been working on improving service quality both for the internal
and external customers. Consequently, the study is based in the context of Banking Industry
in Pakistan and aims to interpret findings from the study for support in designing internal

13
organizational strategies and fostering internal service quality to improve organizational
performance.
1.6.3. Population and Sample.
This research is restricted to the Banking sector. The Data was collected from the
Banks located in Peshawar. The population frame for the study was drawn from the banks
listed in Karachi Stock Exchange (KSE) with over five branches in the city of Peshawar. The
banks were selected on the basis that they had more than five branches in the city in order to
have a representative sample. Out of 24 banks listed in KSE, banks with more than 5
branches in the city were included in the study.
The research divided banks into two strata, i-e, Medium and Large Banks. Since
smaller banks had less than or equal to 5 branches in Peshawar. Therefore, they were
excluded from the study. Since Haksever, Cook, & Chaganti (1997) concluded that causes
that lead to service GAPS in large corporations do not exist in smaller firms. The stratified
random sampling technique is utilized, as taking a random sample might not lead to accurate
results and hence they might not be truly a representative of the population, as with the
increase in the magnitude of bank, the timing of service, stress, learning opportunities would
change. It is for this purpose that stratified random sampling technique has been adopted.
Banks with total assets in excess of Rs. 500 billion are categorized as “Large Banks”, banks
with total assets in between Rs. 100 billion to Rs. 500 billion are categorized as “Medium
Size Banks”. The research adopted the stratified random sampling technique and distributed
banks in homogeneous groups of medium and large banks.
1.7. Significance of the Study
1.7.1. Academic Significance
Service Quality has been identified by both academicians and practitioners as
imperative for organizational survival and growth. The findings of the research will add to

14
the knowledge and understanding of the subject of ISQ. Lack of research in the area of ISQ,
factors that influence ISQ and its relationship with the organizational performance highlight a
knowledge gap. The present study will add to the existing body of knowledge and further
elucidate the phenomenon and its linkage with different internal organizational factors and
organizational performance.
1.7.2. Organizational Significance
The study may help in generating greater awareness among banks on the importance
of having better ISQ, as it would serve as a vehicle for organizational effectiveness.
Additionally the research can help business to understand the value and potential contribution
of different internal organizational factors in organizational performance. Furthermore,
internal service quality is an underdeveloped area. This highlights a prospect for service
organizations that operate in highly competitive and often technologically sophisticated
markets to gain an understanding of further ways to extract any potential advantage over their
rivals (Krios, 2005). Conducting this study in Pakistan is also of great value since limited
work is done on service quality in the banking sector.
1.7.3. Managerial Significance
The present study provides significant insight for HR managers in the banking sector.
The study will assist HR managers in developing better understanding of ISQ and whether
ISQ is worth investment and also in evaluating which factors significantly impact ISQ. With
the findings of this study, HR managers can outline policies and procedures that would help
in the establishment of better ISQ. Furthermore, the research would help the business
managers to determine the key factors that contribute towards organizational performance.
Business executives and managers can then channelize their energies towards variables that
are the most significant.

15
1.7.4. Economic Significance
Banks can significantly contribute to the economic development of a country. Banks,
who perform well can help improve the economy of the country since they would be in a
better position to contribute towards the growth of the economy through assistance of
business. A well performing bank also fuels economic activity by permitting businesses to
invest beyond the available cash that impacts the job market through the creation of
opportunities and potentially helps in improving overall productivity of the country.
1.7.5. Social Significance
The research may help in improving people’s conduct and behaviour. Developing an
understanding of factors that can significant influence employee’s ability to communicate,
understand, show empathy, being responsive towards others can help shape better employee
behaviour both on and off the job. An employee who shows the necessary work related
behaviours can be a valuable member of the society, since he would be in a better position to
balance both work and personal life. Failing to deliver appropriate internal service quality can
significantly hamper employee’s ability to deal with people outside work. Since organizations
do not operate in vacuum, they are filled with people from the society, what people
experience at work, they bring it back home to their social life. Hence, better understanding
of how different factors influence ISQ and fostering ISQ have its social implications.
1.8. The Research Contributions
There are both theoretical and practical justifications for the present study. The
theoretical contributions include a better understanding of the different factors that can affect
ISQ, organizational performance and the effects of ISQ on organizational performance.
Furthermore the study also investigates if ISQ mediates between the direct influence of
internal organizational factors and organizational performance, further highlighting the role

16
of ISQ in the indirect influence of different internal organizational factors and organizational
performance. This will further clarify the need for businesses
To focus on skill acquisition that would not only help in performance
improvements, but also aid in timely delivery of service;
To foster collaboration through the establishment of a strong organizational
culture;
To employ internal marketing techniques that lead to consistency in service
quality;
To minimize role ambiguity and conflict that reduces instability and fosters
focus on the job;
To employ supportive management techniques that would induce benevolence
and display favorable attitudes and behaviors ensuring empathy.
The theoretical contribution also takes account of the value of ISQ for the banking
sector. Moreover, the present study would help in the advancement of knowledge in the areas
of organizational learning, employee satisfaction, organizational commitment, perceived
organizational support, role stress, internal marketing and ISQ. On the practical front, the
present study would help practitioners and policy-makers, who wish to make advancements
in firms’ competitiveness and external service quality through better ISQ, the study would
help identify factors that significantly contribute towards ISQ. The study would also aid in
comprehending the concept of ISQ in more detail.
1.9. Research Plan
The research plan for the study was divided into three phases, steps in each phase were
performed for the completion of this study. The phases and steps in each phase are identified
diagrammatically as follows.

17
1.9.1. Phase 1: Literature Review
The 1st Phase of research started with review of literature pertinent to the scope of
study. Based on the extensive review of existing literature, problem statement was
formulated, and furthermore the literature helped in identification of factors relevant to the
study. The theoretical framework was proposed based on the review of literature.
Figure 1.2. Research Phase 1
1.9.2. Phase 2: Research Methodology
In the 2nd phase, based on the literature review, the research methodology was designed
to attain the desired research objectives. The research methodology started with the population
definition, secondly sampling technique was identified and sample was drawn. Questionnaire
to measure the different variables in the study was designed based on the available measures.
Pre-testing step help purify the questionnaires and finally data was collected.
Literature Review
Factors Identification
Problem Identification
Theoretical Framework
Hypotheses Development

18
Figure 1.3. Research Phase 2
1.9.3. Phase 3: Data Analysis and Interpretation
During the last phase of the study, after collection of the data, data was subjected to
analysis, analysis was carried out in SPSS and AMOS. Results was interpreted and reported
Figure 1.4. Research Phase 3
1.10. Organization of the Study
Following is the chapterization / arrangements of the research thesis/ report.
Chapter 1: Introduction
Chapter one provides the context of the study. Highlighting the research problem,
research objectives and the research questions. Furthermore the chapter also sheds light on
the scope, significance, contribution of the study and the research plan.
Literature Review
Research Methodology
Population Definition
Measurement
Sampling
Pre-Testing
Data Collection
Data Analysis
Interpretation
Reporting

19
Chapter 2: Literature Review
Chapter two discusses in detail the relevant literature, the concept of the different
variables under study. Furthermore the chapter also discusses in detail the relationship
between different variables.
Chapter 3: Conceptual Framework and Hypotheses
Chapter three, based on the extensive literature review present the conceptual
framework for the study. Furthermore the chapter also present the research hypotheses.
Chapter 4: Research Methodology
Chapter four discusses in detail the research design of the study. This chapter also
includes information pertaining to the research philosophy, nature of research, population,
sample, measuring instruments, and data analysis procedures.
Chapter 5: Data Analysis and Findings
Chapter five reports the results of the empirical research. Initially descriptive statistics
of respondents are discussed, followed by validity and reliability statistics. Hypotheses are
tested using structural measurement models.
Chapter 6: Discussion & Conclusions
In the final chapter, the major findings of the research are discussed and it has been
linked to the findings of previous studies. The chapter further explains the contribution of the
study, limitations & delimitations, directions for future research and conclusions.
To sum up, this chapter highlights the background and overview of the research study.
The background explains the gap in the existing research. Research problem, research
questions and objectives, justification, and contribution explicitly indicates the value of
research. The following chapter discusses in detail existing research and theories pertinent to
internal organizational factors, ISQ and organizational performance.

20
Chapter 2
Literature Review
2.1. Introduction
The literature review is designed to explore the theoretical foundations underpinning
internal organizational factors, their association with Internal Service Quality (ISQ) and
organizational performance. The chapter attempts to identify the influence of different
internal organizational factors on ISQ and on organizational performance. The chapter aims
to:
a. Define and explain the quality concept with special emphasis on service quality,
barriers and means to foster service quality, internal organizational factors and
organizational performance.
b. Identify and describe predictors: Organizational Learning (OL), Organizational
Collaborative Culture (CC), Organizational Commitment (OC), Perceived
Organizational Support (POS), Role Stress (RS) and Internal Marketing (IM);
Mediating Variable: ISQ, and dependent variable: Organizational performance.
2.2. The Concept of Quality
Quality is a vital attribute of any product or service, therefore all organizations
vigorously pursue to achieve and maintain it. This is the result of the globalization that is
currently affecting societies resulting in amplified economic competition and mounting
consciousness of the value of quality to success (Kruger, 2001). Its significance is enhanced
in the service sector, and more dominant in the banking sector (Bahir & Nantel, 2000).
Quality of service is regarded as an important issue in the banking industry since it has
ostensible relationship with reduced costs (Crosby, 1979) and profitability (Rust & Zahorik,
1993).

21
Quality has been an elusive concept in business. Many people deem it as some level
of supremacy; while others regard it as lack of manufacturing defects (Evans, 2005). One of
the earliest works on quality is attributed to the three gurus of quality, namely Juran, Crosby
and Deming. Juran referred it to as “fitness for use” (Juran, 1988) and Crosby`s defined
quality as “zero defect” (Crosby, 1979). Both Juran and Crosby identified the immediate need
of quality. It is however important to note that in both of the definitions, the quality is
determined by the end product that is delivered for use to the customer. Deming, who is
referred to as the father of quality, did not define quality in a single statement. He contested
that it is only the customers who can define quality and it’s a relative terminology that
changes its meaning contingent to the needs of the customer (Suarez, 1992). Feigenbaum
defined quality of a product or service as “the total composite product and service
characteristics of marketing, engineering, manufacture, and maintenance through which the
product and service in use will meet the expectations of the customer” (Feigenbaum, 1991, p.
7.). International Organization for Standardization, defined quality as “Degree to which a set
of inherent characteristics fulfils requirements”. Taap, Chong, Kumar and Fong (2011)
defined quality in manufacturing and services sector as the totality of characteristics and
features of a service or product that stands on its ability to satisfy given needs. The concept of
quality and its definition over the years and evolution is tabulated in table 2.1.
Table 2.1
Description of Concept of Quality
Description of Quality Author(s) / Source
Fitness for use Juran (1988)
Quality cannot be defined, it’s a relative terminology that can only be assessed
by the customer.
Suarez (1992)
Zero defects Crosby (1979)

22
The total composite product and service characteristics of marketing,
engineering, manufacturing, and maintenance through which the product and
service in use will meet the expectations of the customer
Feigenbaum (1991)
Quality is thought of by many people as some level of supremacy or distinctive
brilliance; however it is viewed by others as a lack of manufacturing defects.
Evans (2005)
The Degree to which a set of inherent characteristics fulfils requirements International Organization
for Standardization
Quality in manufacturing and services sector is referred to as the entirety of
features and characteristics of a product or service that bears on its ability to
satisfy given needs.
Taap, Chong, Kumar and
Fong (2011)
Source: Author
Differences exist in the concept of quality between manufacturing and services sector.
It is generally observed that technology controls the quality in the manufacturing companies
while the human interaction in the case of manufacturing industries is minimized. What
makes manufacturing easier than services sector is that batches of product are always large,
and defects are found prior to shipment to the customer; hence it is bound to be easier in the
manufacturing industry in comparison to the service industry (Dale, Williams, Barber, &
Wiele, 1997). The involvement of human interaction makes the management of quality in the
service industry difficult, since human perceptions, attitudes and behaviours change overtime,
this transition may sometime be very swift in nature. Hence, services industry requires the
employees to be high on emotional intelligence, so that they are able to control their emotions
while interacting with customers and fellow workers. In case of the manufacturing sector,
where the quality of product is determined when the customer gets hold of the product, and
the products are designed and developed according to the predetermined specifications and
requirements. In case of the manufacturing sector, the customer might have very little or no
interaction with the maker of the product. This is not true for the services sectors, the quality

23
of services is constantly evaluated by the customer until the interaction between the service
provider and receiver is complete, plus it is not just the service that is evaluated, but also the
performance of service provider.
Different authors have pinpointed some key differences pertinent to quality in
manufacturing and services sector (e.g. Dale, Williams, Barber, & Wiele, 1997, Try &
Schein, 1995, Bitran, 1993). The differences are described as follows:
Process: Manufacturing process variability is much more difficult to control than the
human component in the delivery of services.
Intangibility: Services cannot be touched, tasted or smelled, so quality may be
difficult for consumers to assess and objective measures of performance influence customer
satisfaction in service as well as intangible aspects during the service performance. Service
sector differs in the lack of tangibility of the service offered and consequently the problem of
applying standards in a rigorous and consistent manner.
Heterogeneity: This refers to the fact that services are performances that humans
produce frequently and so no two services would be precisely be the same.
Leadership and Management Support: Leadership is crucial to quality management
process. It is imperative that TQM is initiated and driven from the top of the organization.
The concern for production is relatively higher in the manufacturing sector. However, in
services sector, it is important that the concern for people is relatively higher in services
sector.
Simultaneity: Most services are produced and consumed simultaneously, hence
quality of service and customer satisfaction is increasingly reliant on the interaction between
customers and employees.
Perishability: An important element of services is that they cannot be stored, saved
returned, or resold. This demands strong recovery strategies.

24
2.3. Internal Service Quality (ISQ)
Employees working in an organization can only produce fruitful results for the
business if the communication, coordination, and relationship among them is efficient and
effective. Employees are strongly reliant on each other to produce the required level of
service, this service delivered and received is referred to as ISQ. ISQ is defined as the quality
of service delivered by different departments or the people working in these departments, to
other departments or to workers within the organization (Stauss, 1995). The person delivering
the service is referred to as the supplier, while the person receiving the service is the internal
customer. Hammer (2001) defined ISQ as “an organized group of related activities that
together create a result of value to customers.” (p. 52). It can be asserted that the former
definition highlights the system of ISQ while the latter identifies the ultimate objective of
ISQ. Gremler, Bitner, and Evans (1994) referred to ISQ as a dyadic interaction between an
internal customer and an internal service provider. It leads to the fact that it’s a two way
relationship, and for successful internal service, efforts are required from both parties. The
concept of ISQ used in this research reflects Heskett et al.’s (1994) statement that ISQ is
determined by the attitudes employees have towards each other and the way people serve
each other within the organization. In simple terms, ISQ refers to the quality of interaction,
support, and level of communication between different individuals working in an
organization.
Internal customer is an important factor in the delivery of service to the external
customer. Internal customers are people in the organization working for different departments
who are interdependent on each other to carry out their work. Internal customer is referred to
individuals of other departments within an organization that an internal supplier serves (Jun
& Cai, 2010). What makes them essential is the fact that they are part of the service delivery
chain (Kendall, 2006). This implies that a business works in the form of a chain where

25
individuals and different business functions are mutually dependent and are closely linked.
Each takes inputs from each other (Farner, Luthans, & Sommer, 2001) with the ultimate aim
to fulfill the needs of external customers. If an internal supplier fails to provide the desired
level of service to an internal customer, the result would be a less optimal service delivered to
the external customer (Douglass, Calantone, & Keller, 2005). Most researchers agree that
satisfaction of internal customers (i.e. employees) is pivotal for the success of a service firm
(Gremler, Bitner, & Evans, 1995). Ishikawa (1985) stressed on paying attention to the
internal customers and internal relationships. It must be the common goal of each department
to fully satisfy each other through the provision of timely and effective service. This will help
build trust, understanding, and confidence in each other.
Management and staff in organizations rarely understand that employees and
functions are actually customers of each other. It is important to note that business
organizations have been complacent in recognizing the severe repercussions of their sluggish
ISQ and its influence on organizations’ overall performances (Vanniarajan & Subbash,
2011); Getty and Getty (2000) further identified the role of employees and noted that service
workers bring more to the job than education or work skills. A service company is highly
dependent on the personalities of individual employees who can make or break a service
company. Therefore, the employees of a service organization are the ones who deliver
quality. Failure to focus on the initiatives to foster ISQ makes the management wonder why
they have failed to raise staff to care about how and what they need to do for the external
customers (Christensen, Coombes-Betz, & Stein, 2007).
Acknowledging the view that employees are also customers involve managing
people’s skills to make each person feel valued and communicating the importance of each
job role across the team. There must be a feeling of reliability among staff and they shall
share mutual respect. This will lead to an attitude of satisfaction. When the internal customers

26
are completely satisfied, the workforce is ready to satisfy its customers (Papasolomou &
Vrontis, 2006). This satisfactory service received by the internal customers (Employees)
within the organization translates into the business ability to please the external customers.
This argument is supported by various researchers who have argued that both internal and
external customers are equally important, and successful quality of service received by the
internal customers would lead to efficient and effective external service as it would result in
more effective performance, lower waste and lower costs (Marshall, Baker, & Finn, 1998;
Stanley & Wisner, 2001). The kind of treatment the internal customers receive severely
affects the external customers; managements’ inconsiderate behavior towards employees
(Poor working conditions, Low pay, limited career opportunities, lack of training and
development) can stimulate negative attitude in staff that would result in negative behavior
towards the external customer (Christensen et al., 2007). The indecent behavior by the
management towards the employees can also lead to hostile relations between the coworkers,
resulting in retaliation from employees in the form of delays in completion of tasks, sharing
of incorrect information, lack of willingness to help and cooperate with coworkers. Bouranta,
Chitiris and Paravantis (2009) assert the view that if managers wish to improve the external
service quality they should focus on ISQ issues.
Business has laid much of their focus on the external service quality. Hays (1996)
highlighted the ground for this management behavior and further observed that the
excitement and passion surrounding the drive and excellence to serve external customers
often outdo the internal activities and processes. The management must understand that if
staff in one department fails to provide timely service to their co-workers in another
department, this will surely result in delayed service to external customers, thus resulting in
negative credibility and loss of reputation. This slowness in focus towards ISQ is changing.
Business organizations are realizing the fact that an adequate level of service received within

27
the organization would translate into satisfactory external service quality. The quality of
external service is hugely reliant on the quality of internal service. This further highlights the
significance to study internal service encounter (Gunawardane, 2011). It could further be
asserted that for the purpose of achieving higher external service, an organization can be
framed into a chain of individual functional units (Jeng & Kuo, 2012). Thus the ultimate
objective of ISQ is to provide quality service to external customers that actually relies on
delivering service quality across internal units (Brandon-Jones & Silvestro, 2010).
The quality of service, that employees in different departments receive from each
other significantly influence how external customer’s expectations for service quality are met
since ISQ establishes and reinforces a climate and organizational culture directed towards
quality (Omachonu & Ross, 2005). Boshoff & Mels (1995) identified that most of the service
delivery occurs through human interaction and during that interaction organization require
their employees to infuse extra effort, technically referred to as Discretionary behavior,
however this discretionary effort depends on a variety of factors; some of them include
employee-supervisor relationship, and the level of commitment employees shows towards
organization’s goals, objectives and values. Having said that, commitment of an employee
has a positive influence on the service quality of employees (Vandenberghe et al., 2007) to
enable business achieve high goals in the way it measures and manages success, it will have
to prioritize employees and customers (Heskett, Jones, Loveman, Sasser, & Schlesinger,
1994).
Customers’ perception of service offered is strongly contingent to the level of service
offered by the employees. Employees working within the organization work closely to create
the service experience for the customers. Heightened level of internal service experience
between the employees can help in creation of an improved service experience for the
customer. It is thus important to note that an organization that wants to better serve its

28
customer cannot only focus its energies on spending time and money on finding ways to
provide enhanced service to its customers, but on its internal service units as well (Hays,
1996). Cook (2004) endorsed the assertion that many businesses invest their time and effort
in measuring external customer perception, but they fail to recognize that external service is a
reflection of what is happening in the organization between staff and different functions,
different departments provide service to each other, the type of service they provide each
other. It is anticipated that similar type of service would be provided to external customers,
thus if a poor internal service exists, the final service to the customer will be damaged (Kang,
James, & Alexandris, 2002).
A satisfied customer foundation surely guides the business to success if linkage of
external service with the employees is clearly established. ISQ has it imprints on the success
of the business that comes from service performance, while service performance comes from
the quality of service (Zailani, Din, & Wahid, 2006). This quality of service is not only the
external service quality but also the ISQ, since the quality of external service is dictated by
the quality of internal service (Cook, 2004). Not only that ISQ results in external service
quality, but also benefit the organization in a variety of other ways, for instance employee
retention is based on ISQ (Cook, 2008; Dinitzen & Bohlbro, 2010; Suganthi & Samuel,
2004). Furthermore the focus on ISQ is important for business growth (Little & Marandi,
2003), it’s critical in determining the success of an organization in today’s competitive
environment (Anosike & Eid, 2011; Frost & Kumar, 2001), it is crucial in the effective
implementation of the organizational objectives (Anosike & Eid, 2011). The need for
effective ISQ is further enhanced by the fact that it is the first step in the service-profit chain
(Williams, 2007), since service quality delivered early in the production chain sets an
absolute limit on the potential quality of the final good/service to the external customer
(Hays, 1996).

29
Successful service organizations value both the customers and employees (Petzer et
al., 2006), since ISQ is contingent to employees, and different employees might have
different expectations of what service is. Employee demographics effect these beliefs (age,
gender, experience, education, and job rank). Some employees define ISQ as helpful
colleagues, while others define it a good organizational structure and reward (Dinitzen &
Bohlbro, 2010). For organizations to be successful they have to be considerate of these
factors. The value of employees in service organizations is further highlighted by Congram
and Friedman (1991), who referred to the significance of employees a total of three times
while describing the ten most important characteristics of successful service firms. The
characteristics are employees who are empowered to assist customers and sometimes in ways
that go beyond the call of duty, employees who believe in what the organization stands for
and employees who work for fulfillment of service promise to the customers. The importance
of providing excellent service to internal customers is evident despite its far reaching benefits
in serving external customers and helping business attain competitive advantage, the area has
received little attention (Jun & Cai, 2010). Hence, the present research endeavors to enrich
the existing literature on ISQ and highlight the role it can play in attainment of improved
organizational performance.
2.3.1. Barriers to Internal Service Quality.
During the last three decades, considerable literature has been produced on service
quality but the problem still persists and organizations still continue to get it wrong. One of
the reasons is that dimensions of service quality vary across countries, and is affected by
culture, attitudes, values and beliefs. What leads to poor service quality? The question needs
to be answered before one can devise a way to foster it. It is often the case that different
functions in the organization fail to understand the value they add to the service delivery
process. An alarming situation is that only a few managers and employees have

30
comprehended that individual employees and departments are infact customers of each other
(Boshoff & Mels, 1995). This leads to the thinking in the departments that employees are
mere one unit, performing only a single activity in the process (Stauss, 1995), what they fail
to understand is that they might be that crucial link, they do not contemplate on the fact that
an activity might precede them and an activity will follow them. Douglass, Calantone, and
Keller (2005) call this myopic view of the departments’ role. This prejudiced approach results
in the loss of focus and departments fail to regard how the output of their activities influences
service downstream to other consumers in the organization. However, this blinkered
approach can be resolved through interdepartmental customer orientation (Stauss, 1995).
Interdepartmental customer orientation is an effort that encourages business functions to view
their internal role as a part of the entire process and understand how their input, job functions,
and services can help foster the level of service provided to the external customer (Douglass
et al., 2005).
While there are departmental issues that hinder service quality, there are
organizational issues that cause friction to enhance service quality. There are instances where
the management of the organizations is not acquainted with the fundamentals of quality
management (Dale, Wiele, & Williams, 2001). Other reasons that emerge from this failure to
understand quality include failure to select talented employees, service process failures,
dearth of training, or misalignment of incentives are identified as few reasons for improper
service quality (Gerstner & Libai, 2006). While Lynn, Heinrich, and Hill (2000) asserted that
hindrance in attracting qualified personnel is a reason for poor service quality. Chaker and
Jabnoun (2010) on the other hand identified that goals setting, employee-job fit, management
commitment to quality of service, role conflict, role ambiguity, technology-job fit, horizontal
communication, and propensity to over promise, widens the service quality gaps. Newman
(2001) also found lack of top management commitment and lack of horizontal

31
communication to be an obstacle to service quality. Similarly, poor communication on part of
the management with the staff may result in employees’ loss of commitment, feeling of job
dissatisfaction, and confusion resulting in poor service delivery (Zeithaml, Parasuraman, &
Berry, 1990). The lack of inclusion of aforementioned constructs limits the focus of
management, and it may not be able to emphasize on the different dimensions that make up
improved service quality within the business organization. In their studies, Chaker and
Jabnoun (2010) found lack of empowerment, trust deficit, weak culture, lack of
transformational leadership, and centralization to be the factors that act as obstacles to ISQ.
Furthermore, lack of basic application of sophisticated technology and the way
business treat its customers is staggering and unbelievable (Dale et al., 2001). Although Dale
et al. (2001) are referring to customers, it has been emphasized previously that employees are
internal customers who receive service from other departments, and if the treatment they
receive within the organization is not healthy, it will severely influence their work. It is the
employees that can hinder or foster ISQ.
Table 2.2
Major Barriers to Internal Service Quality
S. No Study Major Barriers Identified
1 Boshoff & Mels (1995), Stauss (1995) Individuality
2 Douglass, Calantone, & Keller (2005) Lacking foresight or intellectual insight.
3 Dale, Wiele, & Williams (2001) Lack of acquaintance to fundamentals of service
quality
4 Gerstner & Libai (2006) and Lynn,
Heinrich, & Hill (2000)
Failure to attract qualified personnel
5 Chaker & Jabnoun (2010), Newman
(2001), and Zeithaml, Parasuraman, &
Berry (1990)
Lack of management commitment
Source: Author

32
2.3.2. Fostering Internal Service Quality
Perceived ISQ can be evaluated as the degree and direction of the discrepancy
between employee’s perceptions and their expectations about the particular service (Chuang,
2010). For inconsistency to be eradicated, collective efforts within the organization are
required for the positive end results of growth, productivity, profitability, and customer
loyalty; however, it is instrumental to recognize that fostering positive employee behavior
wouldn’t take place in a vacuum. Organizational efforts in different areas of the organization
are required to nurture ISQ. Service must be viewed as a symbiotic relationship, interactive
system, not as disengaged parts (Shostack, 1987). Chaker and Jabnoun (2010) recommended
that managers may foster service quality through increased decentralization, empowerment
and improved transformational leadership skills. To foster ISQ business needs to commit
similar resources and develop focus towards internal service units as done for external service
quality (Hays, 1996). The ground justification is highlighted by Bellou and Andronikidis
(2008) who contended that personnel who effectively manage internal customers would
exhibit similar, appropriate behavior when interacting with external customers that would
ensure superior external service quality. All of this is not possible without developing an
understanding of the norms, attitudes and cultural background of people; since internal
customers would have different views, priorities, and attitudes. Jeng and Kuo (2012) research
on Chinese culture demonstrated that internal customers displayed varied level of importance
of the factors and attributes in ISQ, therefore, to nurture better ISQ, first management must
conduct a thorough assessment of the potency of factors in that particular organization, and
the factors that the organization deems important, only then can the organization decide on
the factors to work on.
Alternatively, ISQ can be fostered through an organizational focus on employees.
Employees who are satisfied with their job are believed to go an extra mile, they show

33
discretionary behavior and have a positive attitude towards the organization as compared to
those who are dissatisfied. Chaker and Jabnoun (2010) noted that people’s attitudes
significantly influence service quality dimensions of empathy and responsiveness. Yoon and
Suh (2003) found that satisfied employees are expected to work harder and provide better
services. Employees satisfaction is the key to delivering service quality (Malhotra &
Mukherjee, 2004) since employee satisfaction is the driver of ISQ (Omachonu & Ross,
2005). What follows enhanced internal customer satisfaction is the determination of the
profits of the company (Malhotra & Mukherjee, 2004). Internal customer orientation is of key
advantages to ISQ. As employees in the service chain who are knowledgeable about the
internal customers’ demands would facilitate interdepartmental synergies desirable to
accomplish organizational goals (Anosike & Eid, 2011).
One approach for the envisaging service system is called “Blueprinting”, a technique
can be fruitful for enhancement of internal service levels. Shostack (1987) asserted that a
blueprint must document all process steps and points, the documentation must be carried to
whatever level of detail is needed to distinguish between any two competing services. The
service blueprinting would elucidate the exchanges and transactions that create value between
departments. The process can be helpful in clarifying the interrelated activities and
dependencies amongst departments.
Douglass, Calantone, and Keller (2005) proposed internal service level can be
improved if a department whose activity precedes that of another department completes its
task before the department following may begin, thus departments must realize the value of
start-to-finish relationship between them. It is important that the preceding department
understands that the other department would not be able to commence its operation unless the
predecessor finishes its activities. Furthermore, the management needs to focus on the profile
of the staff interacting with the customers, it is where the management cannot exercise it

34
control over the behaviors of employees and discretionary effort is extremely important in
delivery of superior service quality. The right commitment profile needs to be encouraged
and developed among staff that would enhance the service levels (Malhotra, Mavondo,
Mukherjee, & Hooley, 2013).
Knapp (2010) proposed the idea of internal service desks to respond to questions;
distribute information and handle incidents and service requests for its company’s employees.
A company can have several types of internal help desks or service desks that employees
contact for support. Organizations may establish HR help desk to assist in medical insurance
or other HR functions. This will help in boosting the satisfaction of internal customers since
their information needs may be sufficed, therefore enabling internal customers to perform
their tasks and the networks of organizational units will be more likely to work effectively
together to attain customer satisfaction (Bellou & Andronikidis, 2008). Petzer et al. (2006)
explain that ISQ is based on better choice and training for workers, quality work environment
and a strong support for workers who work with customers.
Panda (2001) stressed the need for internal customer relationship management. This is
necessitated by the fact that it is not possible for an employee to know everything about the
organization and its offerings in today’s multilayered and multi-location enterprises. A well-
structured internal customer relationship management program can empower the employees
feel the relative impact on the job holders for the enterprise and how their performance
affects the whole chain of external marketing delivery in an organization. The top
management can then address the gaps in the significance of the job done by an employee
and strategic relevance of his contribution to the overall customer satisfaction. It is of great
important for the business to consider initiatives that can foster the level of internal service
quality. The area, if properly nurtured can help the business not only attain the tangible
benefits of profits but also can help in achieving intangible rewards, like employee

35
satisfaction, customer satisfaction, customer loyalty, and lower turnover rates both for the
employees and customers. The following table summarizes the organizational initiatives for
fostering ISQ.
Table 2.3
Initiatives to foster ISQ
S. No Study Initiatives to Foster ISQ
1 Chaker & Jabnoun (2010) and
Anosike & Eid (2011)
Decentralization, Empowerment, Transformational
leadership
2 Shostack (1987) Collectivism in services & Bluprinting
3 Hays (1996) Resource allocation as done for external services
4 Yoon & Suh (2003), Malhotra and
Mukherjee (2004), Omachonu & Ross
(2005), and Anosike & Eid (2011)
Increased employee satisfaction
5 Malhotra, Mavondo, Mukherjee, &
Hooley (2013)
Staff commitment profile
6 Knapp (2010) Internal help desks
7 Petzer et al (2006) Training, quality work environment and support
8 Panda (2001) Internal customer relationship management
Source: Author
2.3.3. Measuring ISQ
Service Quality is not easily classifiable and quantifiable owing to the characteristics
of services that differentiate it from from goods, this actually poses a problem with the
management of service quality in service firms. The reason for this difficulty is highlighted
by Parasuraman, Zeithaml, and Berry (1985) who noted that goods have tangible cues to
assess quality, they may include style, hardness, color, label, feel, package, and fit. However,
in case of service fewer tangible cues exist. A number of different scales to measure service
quality have been developed based on the number of different definitions proposed in the past

36
(Jain & Gupta, 2004). The primary focus of research measuring service quality has been
about how to meet or exceed the external customers' expectation, and has viewed service
quality as a measure of how the service delivered matches consumer’s expectations (Kang,
James, & Alexandris, 2002). Similar to the measurement of quality perceived by customers in
the form of sets of dimensions or criteria, the quality of internal service that employees
receive from other departments can be meaningfully categorized and measured (Reynoso &
Moores, 1994). One of the approaches to measure ISQ is a gap-based measure, this is
achieved through the utilization of the SERVQUAL scale (Parasuraman et al. 1988).
One of the earliest attempts, on modelling service quality came from Parasuraman,
Berry and Zeithmal (1985). Parasuraman, Zeithaml, and Berry (1985) identified ten
determinants of service quality, as identified in table 3. Parasuraman, Berry and Zeithmal
(1988) measured customers perception of service quality through development of a multi-
item scale from the original ten determinants, after the empirical investigation utilizing factor
analysis, the procedure resulted in a refined scale (SERVQUAL) with 22 items spread among
five dimensions. SERVQUAL instrument has been widely applied for measurement of
external service quality, however Zeithmal, Parasuraman and Berry (1990) claimed that,
“SERVQUAL, with appropriate adaptation can be used by departments and division
within a company to ascertain the quality of service they provide to employees in other
departments and divisions”
Similarly Kang, James, and Alexandris (2002) also assert that it seems reasonable to
modify SERVQUAL instrument to measure ISQ. However, despite the widespread
application and rising acceptance, theoretical and operational criticism has been levelled
against SERVQUAL scale.
Buttle (1996) has levelled a number of theoretical issues, he holds the view that the
focus of SERVQUAL is on the process of service delivery while it fails to measure the

37
outcomes of the service encounter. The five different dimensions are not universal; the
number of dimensions comprising service quality is contextualized; furthermore the items
within the different sub-factors do not always load on to the theoretical factors that one would
expect; Moreover a high degree of interrelation exists between the five dimensions
(Assurance, reliability, empathy, responsiveness and tangibility). While operationally, the
variability in each service quality dimension cannot be captured through the limited number
of items in each dimension (four or five).
There is no agreement on a tool to precisely measure ISQ, a number of different
studies have utilized SERVQUAL to gauge the level of ISQ. A number of attempts have been
made to utilize servqual instrument to measure ISQ. Chaston (1994) studied service gaps in
the UK manufacturing sector, to obtain further understanding of internal customer
management, a modified version of the SERVQUAL research tool was used to survey
managers in UK manufacturing operation. Six dimensions were identified in the study. To be
able to obtain feedback from internal customers in purchasing function, Young and Varble
(1997) used SERVQUAL, the results indicated that SERVQUAL is a useful method for
obtaining feedback from internal customers. The study found reliability to be the most
important dimension, while tangibility was found to be less important by the internal
customers.
Reynoso and Moore (1995) studied ISQ at two hospitals in England. They found ten
dimensions of ISQ as shown in table 3. It was concluded that transferability of the
SERVQUAL dimensions from the external to the internal customer appeared to be well
justified. Similarly, Brooks, Lings, and Botschen (1999) compared dimensions of ISQ with
the SERVQUAL dimensions of external service quality which have been proposed by
Parasuraman et al. (1988). They found Eight of the ten dimensions recognized by
Parasuraman et al. (1985) to be important internally and two additional dimensions, proactive

38
decision making and attention to detail were found to be important in the internal customers'
evaluation of the service received. Tangibility was found to least important to the internal
customer. This is in fact similar to the study by Young and Varble (1997) who also found
tangibles to be least important dimensions for the internal customers. Kuei (1999) carried out
an empirical study to appraise the influence of perceived quality-oriented climate of internal
service providers and actual quality-oriented practices on the perceived ISQ. ISQ was
assessed using the SERVQUAL instrument.
SERVQUAL was grouped into five factors (tangibility, reliability, responsiveness, assurance,
& empathy). It is worth noting that tangibility was not part of the study since internal
customers must use internal service providers, thus the tangibility dimension is not of
concern. The study found that ISQ should be established as a long-term goal of the
organization and SERVQUAL instrument without the tangible dimension is useful for
evaluating ISQ. Based on the findings of existing research, Tangibles dimension was not
included in the present study.
Kang, James, and Alexandris (2002) used the SERVQUAL questionnaire
(Parasuraman, Zeithaml, & Berry, 1988) to develop an instrument that would measure ISQ.
They found that ISQ had similar dimensions, namely assurance, tangibility, reliability,
responsiveness, and empathy. Bouranta, Chitiris, and Paravantis (2009) in their study of
restaurant industry in Greece measured ISQ by developing a new scale based on SERVPERF.
On the suggestions of a focus group consisting of five experienced waiters, the initial
instrument was supplemented and improved; the final instrument included 23 items and
exhibited good internal consistency. The dimensions of ISQ included empathy,
responsiveness, professionalism, safety, tangibles, interest and reliability.
Bruhn (2003) employed another service quality instrument for the development of the
internal services satisfaction index at Novartis, which was proposed by Cronin and Taylor

39
(1992). The dimensions of quality and questions were adjusted to mirror quality aspects of
the internal services at Novartis. ISQ was conceptualized in 12 dimensions, namely
reliability, competence, friendliness, accessibility, time to provide the service, reaction speed,
added value generated, flexibility, customization, transparency in services offered, cost
transparency, and cost-benefit ratio.
There is a great amount of commonality among the dimensions revealed from
different studies. With some studies proposing dimensions different from the others, almost
all of the studies are unanimous in suggessting that Reliability, Tangibles, Assurance,
Responsiveness, and Empathy are key dimensions of measuring service quality. It can also be
observed that all other dimensions stem from the original parasuraman, Zeithaml & Berry
(1985) scale, since all the dimensions measure the level of different positive behaviours
people share at work. The higher the level of positive behaviours perceived by people, the
greater would be the level of service quality.
Table 2.4
Measuring Internal Service Quality
S. No Study Dimensions
1 Parasuraman, Zeithaml & Berry
(1985)
Responsiveness, Competence, Reliability, Coutesy, Access,
Credibility, Communication, Security, Tangibles,
Understanding/Knowing.
2 Chaston (1994) Reliability, Responsiveness, Tangibles, Assurance,
Empathy, and Proactive Decision Making
3 Young & Varble (1997) Reliability, Tangibles, Assurance, Responsiveness, and
Empathy
4 Reynoso & Moores (1995) Reliability, Tangibles, Flexibility, Promptness,
Professionalism, Confidentiality, Communication,
Helpfullness, Preparedness and Consideration.

40
5 Lings and Brooks (1998) Reliability, Credibility, Responsiveness, Courtesy,
Competence, Understanding the Customer, Communication,
Proactive Decision Making, Attention to Detail, and Access.
6 Bouranta, Chitiris, & Paravantis
(2009)
Responsiveness, Empathy, Professionalism, Tangibles,
Reliability, and Interest.
7 Bruhn (2003) Competence, Reliability, Accessibiity, Friendliness,
Reaction Speed, Time to provide the service, Flexibility,
Customization, Added Value Generated, Const Benefit
Ratio, Transparency in Services Offered, and Cost
Transparency
Source: Author
2.3.4. Banks and Internal Service Quality
The current study is concentrated in the banking sector. In the contemporary world the
area of service quality management is experiencing a number of improvements and especially
in the banking sector, it is hard to identify a single bank that has not instigated any kind of
service quality improvement program. In view of the increasing similarity of product
characteristics, service quality has become indispensable in keeping ahead of competitors.
The focus on service quality is dictated by the expectations that banking operations would be
more dynamic and competitive, since there is increased deregulation, liberalization, and
globalization (Taap, Chong, Kumar, & Fong, 2011). This is also necessitated by the fact that
although the contact time between employees and customers may be short, but this contact
happens quite regularly, service provided to the customers most of the times come from
variety of employees working together, data and information are exchanged amongst the
employees to produce quality service to the customer, it could be argued that workers who
effectively manage internal customers would establish similar and suitable behavior when
interacting with external customers (Bellou & Andronikidis, 2008). It is thus asserted that
employee’s failure to coordinate among themselves will lead to poor quality of service that

41
will affect the financial performance of the bank since the service quality of banks rely over
the ISQ (Vanniarajan & Babu, 2011). This assertion is validated by Anosike and Eid (2011),
who found a positive influence of ISQ on customer orientation. Thus to improve high quality
of internal service in banks, administration shall prioritize the monitoring and management of
quality initiatives (Bellou & Andronikidis, 2008).
Service Quality has been studied in banking sector. Mukherjee, Nath and Pal (2003)
studied a total of 27 public sector banks and their customers in India. They evaluated the
influence of service quality on financial performance. The results revealed that banks with
higher level of service have an improved resource transformation to performance using
superior service delivery as the medium. The outcome of the study endorsed the linkage
between resources, service quality and performance. Similarly, Sobhy and Megeid (2013)
found positive and direct nexus between customer service quality, profitability and liquidity.
Although, the importance of ISQ in banks is vividly highlighted, there has been very little
research on how ISQ influences bank’s performance or what factors cause a drive in ISQ.
2.4. Internal Organizational Factors
The level of service quality received cannot be detached from the quality of service
provided (Lewis, 1989). This is the reason that service managers are now focusing on factors
that drive profitability, for instance technology supporting Frontline workers, investment in
people, better recruiting, linking compensation to performance at every level, increasing
motivation and training practices (Heskett et al., 1994). A number of different factors
influence the employee’s level of internal service quality. Organizations require a few key
areas to be consistently valued and cared. It is important for the organizations that these key
factors go in the right way, otherwise organization may have to face negative repercussions.
The choice of antecedents for the present study is guided by the literature that aided in the

42
identification of factors that could act as potential antecedents to internal service quality and
also carry an impact on organizational performance. As suggested by Tsaur and Lin (2004)
who noted that literature suggests that organizational issues could also be predictors of
service behavior.
The selection of factors is dictated by the fact that quality management and
organizational performance within the financial services sector is dictated by conformance to
requirements' approach and with increasing management's financial and physical control over
people, systems, documentation and procedures. Such approach only moderately addresses
quality because (a) precise `conformance' is hard to attain and (b) this method neglects
employees and customers (Knights & McCabe, 1997). Since, the focus is on control and
making sure that the policies and procedures are followed, the present study attempts to focus
on factors that can lead to initiatives that the banks can easily adopt and implement. A study
of the existing literature from the perspective of Quality Management, Service Quality
GAPS, and Organizational Performance enabled to identify those features which can be
crucial in supporting service quality and improving organizational performance: these are
organizational learning, organizational commitment, collaborative organizational culture, role
stress, perceived organizational support, and internal marketing (from Quality Management:
Zeithaml et al., 1990; Boshoff & Mels, 1995; Hauser & Paul, 2006; Ueno, 2008; Ostrom et
al., 2010; Ming, 2010; O’Neil & Davis, 2010; Agbenyiga, 2011; Pasebani, Mohammadi, &
Yektatyar, 2012; Hon, 2013; Alfalla-Luque, Marin-Garcia, & Medina-Lopez, 2014; from
Service Quality Gaps: Zeithaml, Berry, & Parasuraman, 1988; Gronroos, 1990; Zeithaml,
Berry, Parasuraman, 1990; from Organizational Performance: Ogbonna & Harris, 2000;
Eisenberger, Armeli, Rexwinkel, Lynch, & Rhoades, 2001; Eder & Eisenberger, 2008; Abu-
Jarad, Yusof, & Nikbin, 2010; Boselie, Dietz, & Boon, 2005; Brown, 2011; Samad, 2013;
Hon, 2013).

43
Limitations of existing research has also helped in identification of different factors to
be included in the present study. The study of these factors can help the business organization
to identify those activities and practices that should be addressed in order to ensure progress.
These factors would either need to be cultivated if they already exist or developed, if they are
not in place. The need for the study is further highlighted since there is barely any research
available that examined the path that relates different internal organizational factors with ISQ
and organizational performance altogether. The literature shows two categories of factors that
have an impact on service quality, managerial (Zeithaml et al., 1988; Dabholkar, & Abston,
2008) and employee aspects (Dabholkar, & Abston, 2008).
Starting with the managerial aspects, an important managerial factor that has a
significant implication for adequate functioning of employees is organizational learning.
Although organizations learn as individuals learn, organizational learning becomes embedded
in organizational memory, in rules, routines and procedures (Yakhlef, 2009). The learning
initiatives are taken by the management of the organization, but require ownership of
employees. Failure to acquire skills will undermine employees’ responsiveness to the needs
of not only the employees but external customers as well. There has been increasing interest
in organizational learning in the workplace. Learning culture has shown to significantly
influence service quality (Pasebani, Mohammadi, & Yektatyar, 2012; Di Xie, 2005; Ming,
2010). There is an agreement that a learning organization will help the business organization
attain a significant competitive advantage through employees who have a clear vision and
understanding of the importance of the service quality (Hays & Hill, 2001; Zeithaml et al.,
1990).
Organizational commitment is one of the employee aspects that has been reported to
have significant implications for both the internal service quality and organizational
performance. The importance of organizational commitment is advocated by the fact that the

44
higher the degree to which an employee identifies with the organization and its objectives the
better his or her service behavior would be (Boshoff & Mels, 1995). Boshoff & Mels (1995)
further called for the inclusion of other factors and to investigate their impact on service
quality other than organizational commitment. Furthermore O’Riordan (2003) asserted that
creating and fostering an environment of internal customer service take time, he identified
commitment to regard colleagues as customers and culture as means to create a better internal
service. Research has shown both direct and indirect influence of commitment on
performance. Brown (2011) and Samad (2013) in their study of commitment and financial
performance found a direct, positive and significant influence of employee commitment on
organizational financial performance. Similarly Alfalla-Luque, Marin-Garcia, & Medina-
Lopez (2014) also supported the influence of commitment on all the different dimensions of
performance. While Boselie, Dietz, and Boon (2005) found that the effect of commitment on
performance was mediated by productivity and quality. Keeping in view the direct and
mediated influence of commitment, the factor was included in the study for further analysis.
A major shortfall of the existing research it its focus on customer relationship
management in comparison to attention on the dynamics of effectively supporting and
developing personnel who offer service to the customers (Bowen, 2010; Johlke & Duhan,
2000). Appreciating the significant impact that service personnel have on the success of the
business, there shall be an urgency in services research to better recognize how to establish
and leverage organizational cultures that effectively support and develop service employees
(Ostrom et al., 2010). A number of different aspects of organizational culture have been
identified in the GAP Model (Zeithaml, Berry, & Parasuraman, 1988) namely teamwork,
monitoring and supervision, communication and leadership. Teamwork and communication
can be referred to as important determinants of a strong organizational culture. The present
study utilizes collaborative culture since it is more relevant to the banks where working

45
environments are characterized by trust and interpersonal relationships emphasizing mutual
cooperation among employees. Research has shown the role of culture in fostering service
quality (Agbenyiga, 2011; Raub, 2008; Hauser & Paul, 2006) and organizational outcome
like performance (Abu-Jarad, Yusof, & Nikbin, 2010; Ogbonna & Harris, 2000).
Perception of support from organization leads individuals to feel obligated for making
contributions to their organization (Eder & Eisenberger, 2008). POS has been repeatedly
identified as a factor that can have a significant influence on the working of the employees.
Individuals accompanying the perception of getting support from their organization feel
honored, protected, and acknowledged, and in return exhibit raised assistance, identification,
gratitude, and persistent work (Chiang & Hsie, 2012). Hence POS generates an obligation on
employees to have a concern for the organization’s prosperity and assist the organization to
attain its goals (Chew & Wong, 2008; Dhar, 2012; Eisenberger, Armeli, Rexwinkel, Lynch,
& Rhoades, 2001). The role of POS in the provision of superior service is evident, however,
there is limited research highlighting the contribution of POS towards service quality, the
present research would help in clarifying the contribution in establishing a higher level of
service quality within the organization.
From the management perspective, the relationship between role stress and internal
service quality has significant implications (Boshoff & Mels, 1995). Role stress is an
employee aspect that can result in negative employee reactions that could be damaging to the
organization. Role stress consisting of role ambiguity and role conflict has been identified as
a factor that influences service quality in GAP Model (Zeithaml, Berry, & Parasuraman,
1988). O’Neil and Davis (2010) noted that stress can influence the service quality and
performance of employees, reduce personal accomplishment, and foster depersonalization
which in turn can impact employees’ psychological health and business effectiveness. The
banking industry is a high-contact and people-oriented service, where apart from the

46
customers who are always in contact with the employees, the internal customers are highly
dependent on the service from each other, hence service performance can regarded as the
most important factor that determines service quality. Higher level of stress can result in
emotional exhaustion, which is the state of being overly tired from the emotional demands of
a task (Hon, 2013). Thus affecting employee responsiveness. It is reasonable to expect that
stress is adversely related to employee job attitudes and service performance. Work-related
stress has been linked with damaging work outcomes, for instance low morale, disloyalty,
absenteeism, burnout, job seeking, workplace deviance, and voluntary turnover (Glazer &
Beehr, 2005). Such responses are unfavorable for quality of service and organizational
effectiveness (Hon, 2013).
An important managerial practice that is imperative for the provision of superior
service quality is internal marketing. Ziethaml, Berry, and Parasuraman (1990) argued that
level of service quality deteriorates when internal customers are reluctant or incompetent to
accomplish the required level of service. Reluctance to perform a particular service is
reflected in the attitude of the staff, while lack of ability may arise due to absence of proper
training or other rewards on the part of the organization are necessary to attract and sustain an
able, efficient and effective workforce (Zeithaml, Berry, and Parasuraman, 1990).
Furthermore internal marketing is also identified as the strategy to close Gap 3 – the
differences between customer driven service designs/standards and service delivery
(Gronroos, 1990). It is also argued that internal marketing have been seen as vital for closing
Gap 3 (Gronroos, 1990). It is thus off great importance for the service organizations to
identify the steps that could be taken as part of the IM strategy, to make sure that service
personnel; exhibit the requisite attitude and effort to satisfy the customer during the service
encounter. Hence, there is a desperate need to integrate IM functions for the satisfaction of
employees (Zeithaml et al., 1988; Bitner et al., 1990). The need and prominence of IM in

47
determining the attitudes and behaviors of the service personnel cannot be undermined, and
does call for further research.
In light of the above cited findings, it is obvious that different scholars, researchers,
and practitioners have identified different factors. Six factors have been identified from the
literature for the present study. It is concluded that internal organizational factors contribute
towards enhancement of ISQ, and directly as well as indirectly lead to organizational
performance. The following table shows the factors identified based on the review of
literature. The factors and their relationship with service quality and organizational
performance is discussed in detail in the following sections.

48
Table 2.5
Theoretical and Empirical foundation for identification of organizational factors
Predictor Outcome (s) Results Source (s)
Organizational Learning Perceived Service Quality Significant Impact Hays and Hill (2001)
Organizational Learning Internal Service Quality Learning improves levels of internal service Pasebani, Mohammadi, & Yektatyar
(2012), Di Xie (2005), Ming (2010)
Organizational Learning Organizational Performance Learning leads to improved organizational
performance
Thompson and Kahnweiler (2002),
Kandemir and Hult (2005), Skerlavaj
and Dimovski (2006), Ruiz-Mercader,
Merono-Cerdan, and Sabater-Sanchez
(2006), Kuo (2011)
Bureaucratic Culture Service Quality Emphasis on standards and centralization
contributes to high level service behavior by
employees
Raub (2008)
Group Culture Service Quality Significant Influence on Service Quality Hauser and Paul (2006)
Organizational Culture Service Effectiveness Significant Positive Relationship Agbenyiga (2011)
Team oriented
organizational culture
Service Quality Significant Positive Relationship Phapruke (2008)

49
Organizational Culture Productivity and Work Quality Culture leads to outcomes like Productivity and
Work Quality
Mathew, Ogbonna, and Harris (2012)
Organizational Culture Service Quality Culture stressing communication can result in
service quality.
Tsai and Tang (2008)
Competitive and
Innovative Culture
Organizational Performance Direct, Strong and Positive association Ogbonna & Harris, 2000
Organizational Culture Financial Performance Positive Relationship Perters and Waterman (1982), Ortiz &
Arnborg (2005), Schlechter (2001)
Involvement and
Cooperative Culture
Organizational Performance Positive Impact Ginevičius and Vaitkūnaite (2006)
Organizational
Commitment
Internal Service Quality Strong Positive Impact Boshoff and Mels (1995)
Organizational
Commitment
Service Quality Positive Relationship Malhotra and Mukherjee (2004)
Employee Commitment Financial Success Positive Correlation Benkhoff (1997)
Lack of Commitment Financial Performance Performance related problems such as, high
costs, low profits, low stock prices and poor
customer service
Pfeffer (1998)
Perceived Organizational
Support
High Quality Employees Positive Relationship Wayne, Shore, & Liden (1997)

50
Top Management Support Quality Efforts Lack of Support dooms Quality efforts Deming (1982, 1986)
Perceived Organizational
Support
Performance Positive influence Byrne & Hochwarter, 2007
Perceived Organizational
Support
Performance Significant Impact Rhoades and Eisenberger (2002)
Stress Output, Product Quality,
Service Morale
Negative Relationship Brown & Uehara (2008)
Role Stress Productivity Negative Impact Koustelios et al (2004), Ofoegbu and
Nwadiani, (2006), Chang and Lu (2007)
Stress Concern for the organization &
colleagues and responsibility
Negative Relationship Fairbrother and Warn (2003)
Stress Service Lack of Direction makes service suffer Varca (1999)
Role Stress Service Gap Role Ambiguity and Role Conflict widens
service gaps
Chaker and Jabnoun (2010)
Role Stress Quality of Work Negative Contribution in Quality Bauer and Brazer (2011)
Stress Job Performance Negative impact Stamper and Johlke (2003)
Stress Organizational Success Stress obstructs organizational success Noblet (2003)
Stress Productivity and Efficiency Stress reduces Productivity and Efficiency Dua (1994)
Internal Marketing (IM) Service Quality IM a solution to the problem of delivering
consistent service quality.
Berry, Hensel and Burke (1976)

51
IM Employee Behaviours and
Service Interaction
IM is crucial in producing the mentioned
outcomes.
Reza, Javadin, Rayej, Yazdani, Estiri, &
Aghamiri (2012)
IM Service Train and motivate employees to provide better
service.
Cooper & Cronin, 2000
IM ISQ Strongly related to perceptions of ISQ. Opoku et al. (2009)
IM Service IM dimensions (i.e. training and incentive) were
main drivers of the level of service
Tsai and Tang (2008)
IM Financial Performance Significant Influence Lings and Greenley (2009)
IM Business Performance Significant linear relationship Saad, Ahmed and Rafiq (2002)
IM Organizational Performance Internal marketing has positive impact on
organization performance.
Hwang and Chi’s (2005)
IM Business Performance Positive influence Panigyrakis and Theodoridis (2009)
Service Quality Business Performance Significant Impact Jain and Gupta (2004)
Service Quality Financial Performance Service improves financial bottom line Getty & Getty (2000)
ISQ Banks Performance Performance improved through ISQ Bellou and Andronikidis (2008)
Source: Author

52
2.4.1. Organizational Learning
Learning is regarded as a key to survival, organizations that fail to learn most often
cease to exist. Organizations must try to comprehend the fact that learning not only helps to
understand the changes that are occurring in the environment, but also helps in making
change happen within the organization. It is an argument in support of organizational learning
that is carried out in organizations by key personnel whose learning is linked to subsequent
changes within the organization (Cook & Yanow, 2011). It is important to note from an
organizational perspective that self-doubt stimulates the learning process; doubt here refers to
the understanding that organizing and operating methods of business are as perfect as they
could be or as optimal as other alternatives. Organizational learning continues as faith
prevails in support of risk-taking linked with new arrangements or methods. It is, however,
important to note that a stronger conviction in support of certain arrangements or actions may
lead to blockage of sustained learning and is difficult to challenge (Srikantia & Pasmore,
1996).
A variety of definitions have been laid out on organizational learning. Most of the
definitions pertinent to organizational learning refer to it as a process. Lien, Hung, and
McLean (2007) refer to it as a process that facilitates the alignment among organizational
strategies, culture, and competitive environment. This is made possible through acquisition of
relevant skills that complement the vision, mission and long terms goals of the business. Day
(1994) referred to it as a process that transform information into knowledge and knowledge
into action. The actions are reflected in associated behavioral and cognitive changes (Kim,
1993). The way these changes are brought about is highlighted by Srikantia and Pasmore
(1996) who referred to it as a process involving confrontation with our own behavior openly;
doubts and convictions are conveyed and deliberated among organizational members, this is
simply stated as the process of detecting and correcting errors (Argyris & Schon, 1978). This,

53
however, is referred to as single-loop learning where a mismatch is corrected through
identification of performance gaps, and changing the action (Argyris & Schon, 1996). The
limitation of single loop learning is identified by Senge (2006) who noted that a mere
adaptability does not facilitate creativity. Daft and Weick (1984) stated that organizational
learning is knowledge about the nexus between the organization’s activities and its
environment. Similarly, Schwandt and Marquardt (2000) defined organizational learning as a
representation of a multifaceted interrelationship between personnel, their behaviors,
symbols, and methods within the organization. Slater and Narver (1995) called organizational
learning as the development of new knowledge or insights that have the potential to inspire
behavior. According to Panayides (2007), organizational learning is a mean to create and
utilize knowledge to enhance competitive advantage. Two main themes emerge from all the
above definitions; first, organizational learning is concerned with knowledge and second is
pertinent to relationships. Knowledge perspective of organizational learning is more related
to the assimilation and distribution of knowledge that ultimately influences organizational
performance while the second perspective relates it with changes in the behavioral and
cognitive aspects of the business. Individuals through acquisition of relevant skills and
knowledge adapt to the changes and improve both job and organizational performance. It is
clearly visible that in all the different statements, one clear feature of organizational learning
is the change in behavior/actions of individuals working for the organization.
Three different levels of organizational learning, namely individual learning, team
learning, and organizational learning are identified by Solingen, Berghout, Kusters, &
Trienekens (2000). Responsibility on the part of the person to take learning initiative is
referred to as individual learning. Utilizing capability of different people who work together
as a group is called team learning. There is a common learning approach in teams, team
member support each other in attaining individual learning objectives, and cooperating with

54
other teams in the learning process. Individual learning takes shape of organizational learning
when new knowledge is transmitted across departmental boundaries to others working in the
organization that reap the benefits from what has been learned. This is only possible through
interaction and fostering network between the department, developing an understanding of
how different departments and individuals in these departments are linked to each other.
Furthermore how skills set of individuals in a particular department complement personnel
working in other departments. This can be achieved through group trainings and network
meetings.
Single loop, double loop and deuteron learning have been identified as three major
types of learning (Argyris & Schon, 1978). Single loop learning encompasses closing the
performance gaps through detection and correction of errors, this enables business to act upon
their policies and objectives, the outcomes are gauged against the norms and expectations of
the organization. Single loop learning is suitable for the routine and monotonous jobs because
it helps in getting routine jobs done. However, single loop learning does not trigger any
organization wide change. This type of learning be suitable at the very operational level
within the organization. Single loop learning can help both the internal and external customer
receive the service right the first time. Double-loop learning on the other hand points to the
willingness to question long-held assumptions about organizations’ mission, customers,
capabilities, or strategies. This is a double loop (Argyris, 1978, 1996) or generative learning
(Senge, 2006), since it helps in generating new ideas, concepts, strategies that cultivates the
learning in organization by challenging the underlying governing values. This type of
learning can help understanding why or why not the current processes will work. It can help
in creating a better and enhanced service structure by questioning the existing policies and
practices of the organization. Third is deutero-learning, refers to the mechanism to carry out

55
single-loop and double-loop learning. Deutero-learning is more proactive in nature with
organizational focus on achieving perfection (Argyris & Schon, 1978).
2.4.1.1. Linkage of Organizational Learning with Service Quality and
Organizational Performance
The question of how organizational learning relates to improvement in service quality
has not yet been sufficiently analyzed. Organizational learning and service quality
complement each other. Since, employees who are better equipped with latest skills can serve
the customers in a better way. There are few studies that highlight the relationship between
organizational learning and service quality. Argyris and Schon (1978) even defined
organizational learning as “the detection and correction of errors”. Detection and correction is
the process that would most certainly improve the quality of service, hence when an
organization learns, it equips itself with the ability to solve its problems resulting in timely
delivery of service, this is also known as quality control (Hays & Hill, 2001).
Zohrabi, Mahdavi, & Mahdavi (2013) contend that a strong attitude towards the
prominence of service quality may generate useful competitive advantage to the employees.
Pasebani, Mohammadi, & Yektatyar (2012) called organizational learning as one of the
essential elements that contribute towards ISQ. They concluded that learning culture can help
the staff in the provision of improved service quality. Similarly, Di Xie (2005) in his study
found that application of organizational learning culture can have a decisive role in fostering
ISQ. It was concluded that investment in building a learning culture is worthwhile due to its
potentially strong relationship with employees’ internal service quality. Likewise, Ming
(2010) in the study of Chinese service organizations found a significant relationship of
organizational learning culture with ISQ. Hays and Hill (2001) also noted that there is a
positive relationship of organizational learning and employee motivation with perceived
service quality. They established in order to achieve supreme service quality it is essential to

56
have motivated employees and organizational learning ability. The need for organizational
learning is further highlighted in the assertion that new knowledge can be engendered from
both the external and internal sources (Yakhlef, 2009). Internal sources are no other than
employees; failure on the part of the organization to foster communication, trust, empathy,
understanding, responsiveness would most certainly deter employees in working together and
creation of new knowledge.
Organizational learning emphasizes performance improvement through the
acquisition of skills that organization and employees were not acquainted with the past.
Organizational learning is inclined towards creating “useful” knowledge for the organization.
Efficiency, innovation, and competitive advantage are few of the valued outcomes created by
a learning organization. Organizational learning brings positive changes in the way people
perceive their internal and external environments (cognitive changes) and how they people
(behavioral changes); this also carries a significant positive impact on organizational
performance (Thompson & Kahnweiler, 2002; Kandemir & Hult, 2005).
Direct and indirect influence of organizational learning on organizational performance
is available in the literature. Skerlavaj and Dimovski (2006) from an employee perspective
established a significant positive and strong impact of organizational learning on
organizational performance. Similarly Ruiz-Mercader, Merono-Cerdan, and Sabater-Sanchez
(2006) also found that individual and organizational learning exhibit a significant and positive
influence on organizational performance. Khandekar and Sharma (2006) in their study of
Indian global organizations, interviewed 100 managers and established a positive link
between organizational learning and performance. Similarly Kuo (2011) found the direct
impact of organizational learning on organizational performance in technology companies in
Taiwan. Skerlavaj, Stemberger, Skrinjar, and Dimovski (2007) in their study of medium and
large Slovenian companies found a statistically significant relationship between

57
organizational learning culture on organizational performance. Skerlavaj, Stemberger,
Skrinjar, and Dimovski (2007) noted that improved organizational learning culture adds to
organizational performance in financial as well as nonfinancial terms but the influence of
learning on performance would be indirect. Song and Kolb (2012) in their SEM analysis
found that the knowledge creation process has a mediating effect on learning organization
culture in predicting the perceived level of organizational financial performance. The linkage
between organizational learning, service quality and organizational performance is further
elucidated by the findings of Rondeau and Wagar (2002) whose study results suggested that a
quality management program without the assistance of a robust organizational learning
culture may not be sufficient to attain improved business performance.
Different dimensions of organizational learning have proved that it has influence over
organizational performance. Michna (2009) in their study of SME’s in Poland identified 11
dimensions of organizational learning, except strategic ability, all other dimensions had a
significant relationship with organizational performance dimensions (Income Growth and
Employment Growth). However, none of the organizational learning dimensions had any
relationship with index growth. Prieto and Revilla (2006) categorized organizational learning
capability as knowledge stocks and learning flows, they based their data from 111 Spanish
firms and found that organizations with the highest level of knowledge stocks and learning
flows, obtained superior performance. It is thus established that business organizations that
invest efforts in organizational learning generate both tangible and intangible benefits in
terms of an improved efficiency, optimal of employee trust in leadership, decreased costs of
work per employee, committed workforce, flexibility, increased employee satisfaction and
increased financial gains.
The aforementioned literature further elucidates the linkage between organizational
learning, ISQ, and organizational performance. Organizational learning has been found to

58
improve organizational capacity to innovate, efficiency and competitive advantage through
skill acquisition, which can further enhance income growth and financial gains.
Organizational learning can help organizations detect and correct its errors. This can ensure
timely delivery of service. Learning through skill acquisition not only improves employee’s
capabilities that can make the environment more manageable but also fosters positive
employee behavior, thus putting employees in a better position to understand and respond to
each other’s problems. Once employee’s issues are resolved, this can make them focus on the
objectives of the organization and can make them more productive.
2.4.2. Organizational Culture
Culture constitutes a central part of how a business conducts its routine operations.
Several definitions have been put forth to state the concept of organizational culture.
Organizational culture refers to the overall ethos of a business: characteristics that include
both psychological and structural elements, which impact the perceptions and behavior of the
employees (Fletcher & Jones, 1992).Van der Post, de Coning & Smit (1998) stated that
culture is to the organization what personality is to the individual, it is a concealed but
integrated force that provides meaning and direction, thus culture fundamentally defines the
organization. Schein (1992) defined organizational culture as a pattern of basic assumptions
invented, discovered or developed by a given group as it learns to cope with its problem of
external adaptation and internal integration. In the last few decades researchers and managers
have utilized the concept of culture to point to the climate and practices that businesses
develop around their handling of employees, or to the espoused values and credo of an
organization (Schein, 2010). Van den Berg and Wilderom (2004) noted that culture between
departments in an organization may differ, they stated that organizational culture is the shared
perceptions of organizational work practices within organizational units that may differ from
other organizational units. Drake, Gulman, and Roberts (2005) referred to culture as an image

59
of an organization’s philosophy, history, leadership, values, and shared beliefs. Schein (2010)
asserted that in this context, managers speak of developing the “right kind of culture,” a
“culture of quality” or a “culture of customer service”. In this case culture points to a certain
values that managers try to instill in their organizations. This right culture is further
elaborated by Pfister (2009), who asserted that a right culture would promote “effectiveness”,
an “ethical culture” would contribute towards organizational performance. Pfister (2009),
influenced by Schein’s work on organizational culture, defined it as,
“A pattern of basic assumptions that a group has invented, discovered, or developed
in learning to cope with its problems of external adaptation and internal integration,
which is represented in a system of shared values defining what is important, and
norms, defining appropriate attitudes and behaviors that guide each individual’s
attitudes and behaviors.”(p. 3)
Since there is a right culture, this refers to the assumption that there are stronger or
weaker cultures and better or worse cultures and that the “right” kind of culture will impact
on the effectiveness of the business organization. There is often the implication in the
managerial literature that for effective performance there is a need of having a culture, it is
imperative that effective organization will only be established if there is a strong culture since
employees would have gelled together, understood the objectives of the organization, respect
and comprehend each other, leading to quality of product and service produced. The original
emphasis on shared values gave rise to the idea of organizational culture's strength (van den
Berg & Wilderom, 2004). Cultural strength points to the valence of the agreement between
employees and their organization on the importance of the key cultural values. The strength
of the cultural connection is based on the identification and significance the employee has for
the organizational values (Booth & Hamer, 2009).

60
Varied research studies have classified organizational culture. One of the most widely
used cultural dimensions was put forth by Hofstede (1990). Hofstede (1990) initially
developed four dimensions of culture, namely Power Distance, Uncertainty avoidance,
Individualism/Collectivism, and Masculinity/feminity. Van den Berg and Wilderom (2004)
on the basis of literature review and empirical studies, identified 5 dimensions of
organizational culture i.e. External orientation, Autonomy, human resource orientation,
interdepartmental coordination, and improvement orientation. The culture assessment scale
developed by Cameron and Quinn (2011) is probably the most frequently used questionnaires
to assess organizational culture. Cameron and Quinn (2011) made four quadrants
corresponding with the four organizational cultures:
Clan: Clan culture depicts a one big happy family where people have a lot in common and
working environment is sociable.
Adhocracy: In an adhocracy culture working environment is energetic and creative. Leaders
innovate and take risks.
Hierarchy: The focus in the hierarchy is on completing work and getting things done.
Characteristics of people include competitiveness and concentration on goals.
Market: Market structure is characterized by formalization and structure work environment.
Employees are bound by procedures. Leaders take pride in an efficiency-based coordination.
These four organizational cultures differ deeply on these two dimensions:
External focus and differentiation vs. Internal focus and integration
Flexibility and discretion vs. Stability and control
Glaser, Zamanou, and Hacker (1987) studied organizational culture in 195
government employees representing every level and division in their department and found 6
dimensions i-e. Involvement, Teamwork & Conflict, Information flow, Climate & Morale,
Supervision, and Meetings. Hofstede, Neuijen, Ohayv and Sanders (1990) based on the study

61
in twenty units from ten different organizations in Denmark and Netherlands classified
organizational culture and revealed four manifestations of organizational culture namely
Symbols, Heroes and Rituals which were grouped as Practices, since they were overt and
observable, while the fourth manifestation was termed as Values (feeling of good and evil),
since values are not observable, unconscious and rarely discussable but are manifested in
alternative of behavior. Practices were further divided into the dimensions of Employee
Oriented vs. Job Oriented, People Oriented vs. Results Oriented, Open System vs. Closed
System, Parochial vs. Professional, Normative vs. Pragmatic, and Loose vs. Tight Control.
While values was further divided into dimensions of Work Centrality, Need for Security, and
Need for Authority.
Variety of dimensions are available in the literature pertinent to culture, however, it is
not possible to study all of the dimensions. For the present study, Collaborative Culture scale
is utilized. In the context of the organizational culture, this current study stresses the aspect of
creating a collaborative culture. Collaboration in the current study precisely refers to ‘mutual
sharing norms of behavior’ (Yang, 2007). According to Flores (2004, p. 300), collaborative
cultures refer “to working relationships which are spontaneous, voluntary, evolutionary, and
development-oriented”. Lopez, Peon, and Ordas (2004) defined collaborative culture as one
that values communication, teamwork, empowerment, and respect and leverages the
knowledge of employees resulting in organizational learning. An important aspect in all the
above mentioned definitions of collaborative culture is the supportive behavior that is
extended by workers towards each other, this in fact creates a working environment where
people like to work. Hence a collaborative culture inspires complete engagement of team
members since employees enjoy support from each other, mutual respect, and care (Bstieler
& Hemmert, 2010).

62
2.4.2.1. Linkage of Organizational Culture with Service Quality and Organizational
Performance
Although there is a dearth of empirical research that examines the influence of
organizational culture on ISQ in the banking sector, however there have been studies that
have shown the influence of organizational culture on service quality in other sectors. In the
study of airline service employees Zerbe, Dobni and Harel (1998) revealed that service
culture had a direct influence on self-reported service behavior. Similarly Agbenyiga (2011)
in their study of child-welfare agency found a significant influence of organizational culture
on service effectiveness. Literature has identified the need for strong culture to boost level of
service quality within the organization. Gronroos (1990) has identified that a strong culture
that fosters customer/service orientation and comprehension of service quality is vital for
successful service quality management. Moreover, the need for a strong service oriented
culture that inspires employee behavior is necessitated (Zerbe, Dobni & Harel, 1998) since
management in the service sector does not have control over their employees’ service
behavior (Schneider & Bowen, 1995). A strong service-oriented culture can give guidelines
for right and proper behavior toward customers culminating the need for establishing undue
processes and procedures to monitor employees’ service delivery. Similarly Mathew,
Ogbonna, and Harris (2012) asserted that organizational culture that exceeds the old-
fashioned approaches of compliance to quality standards or quality control can lead to the
internalization of quality as well as the values, attitudes, and behaviors that promote it.
Beliefs and expectations are part of the organizational culture, and prescribe the way in which
things are done in the organization (Glisson & James, 2002). If the employees within an
organization value keeping their word and trust the coworkers, this will certainly influence
the provision of service with reliability and assurance. Thus, there is a window of opportunity
for organizations to focus on fostering a culture that promotes positive service behavior in

63
and out of the organization, and this could very well translate into business profitability. The
study of corporate culture is thus important in trying to better comprehend the context of
organizations and the people managing the organization (Rashid, Sambasivan, & Johari,
2003). Exploring the relationship between organizational culture and service quality
Phapruke (2008) found that team oriented organizational culture has a positive and significant
influence on service quality, strengthening the finding of the study, Chiang and Hsieh (2012)
who found a positive relationship between the employees’ consciousness of a supportive
organizational culture and their mutually supportive and cooperative behavior. Similarly
Mathew, Ogbonna, and Harris (2012) found in their study of Indian software companies that
organizational culture produces outcomes like worker satisfaction, work quality, and
productivity. Further, satisfaction, quality, and productivity are proposed as leading to firm
profitability and growth while work quality is presented as a significant contributor towards
organizational innovation.
The evaluation of culture is necessary to recognize the kind of culture predominant in
the organization. Culture assessment is an efficient way to recognize complex organizational
culture and to direct and implement organizational changes for enhanced service delivery
structures. According to Abu-Jarad, Yusof, Nikbin (2010) organizational culture carries its
influence on various employees and organizational related outcomes. Schein (1990) and Lok
and Crawford (2004) further highlight the areas that the culture affects, and it includes the
way in which people consciously and subconsciously think, makes decisions and ultimately
the way in which they perceive, feel and act. Corporate culture has an impact on employees’
behavior, managers may need to shape and develop organizational culture that are more
conducive to the employees and organizational setting (Rashid, Sambasivan, & Johari, 2003).
Hence different organizational cultures have varying influences on the delivery of service as
actions of employees may change due to the work culture prevalent in their organizations.

64
However, in most cases a strong culture was found to have significant influence. Glisson
(2007) asserted that rigid organizational cultures are characterized by service providers
having little preference or flexibility; with limited input to key management decisions; and
chained by numerous bureaucratic rules and regulations. This may make it difficult for
internal customer to provide prompt service to the internal suppliers, however Raub (2008)
study of bureaucratic culture and employee behavior in the Swiss hotel industry found that
high level of employee service behavior was determined by emphasis on standards and
centralization.
Developing an appropriate organizational culture should be a critical component in
the success of a bank since banking industry typically involves a high level of interaction
between customers and employees. The need for an appropriate organizational culture in
banks is highlighted by Julian and Ramaseshan (1994) who noted customers' perceptions of
bank’s culture and image are often based on their exchanges with bank employees. This calls
for motivation and satisfaction of a teller’s with whom customers interact more frequently.
Given the nature of a teller’s duty this is not an easy task. The training and socialization
programs that tellers are involved with will play a major role in their level of job satisfaction
and motivation. This can not only be limited to tellers, customers in today’s banking industry
interact with staff at all levels, thus motivation and job satisfaction is an imperative for all the
employees. Culture can be a mean to enhance the motivation and satisfaction. Tsai and Tang
(2008) from the internal marketing perspective established that organizational culture
stressing over communication and prospects can motivate the staff to have excellent service
quality. Similarly Hauser and Paul (2006) in their study of information system service quality
found that only group culture had a significant influence on service quality.
Papasolomou and Vrontis (2006) in the study of UK retail banking industry found that
treating employees as customers, develops a strong service culture and provides the grounds

65
for a strong brand. This service culture was found to be critical in the TQM implementation
success in the UAE banking sector (Al-Marri, Ahmed, & Zairi 2007). Anosike and Eid
(2011) study in banking sector found that organizational culture provides a unifying focus to
support and guide the attitudes and behaviors of organization members to deliver quality to
other employees. Choudhury (2008) recommended that culture may play an essential role in
determining how external customers perceive what constitutes service quality. Furthermore, it
is suggested that service quality dimensions such as access, understanding of the customer,
and reliability are related to factors of economic development, such as competition, affluence,
infrastructure, education, and technology.
Organizational culture can be described as the bedrock upon which organizational
performance is based. A poor organizational culture and climate will significantly deteriorate
service quality and customer satisfaction and hence the organizational performance (Oh &
Pizam, 2008). It is therefore regarded as one of two types of intangible resources that are
regularly noted in the scholarly management literature to explain the sustainable firm success
is culture (Schein, 1985). The organizational culture practice has been identified as one of the
most crucial factor that determines organizational success than national or occupational
culture (Abu-Jarad, Yusof, Nikbin, 2010). Ogbonna & Harris (2000) identify that the reason
for this is that certain organizational cultures lead to superior financial performance. They
found direct, strong, and positive associations in their analysis of the links between
competitive and innovative forms of culture and organizational performance. Corporate
culture has received much consideration in the recent years due to its potential impact on
organizational performance (Rashid, Sambasivan, & Johari, 2003). Lok and Crawford (2004)
noted that organizational culture can exert substantial impact in organizations, particularly in
areas such as commitment and performance. The prerogative that culture is related to

66
organizational performance is instituted on the perceived role that culture can play in
engendering competitive advantage (Ogbonna& Harris, 2000).
Literature on organizational culture constantly reinforces the notion that
organizational culture is necessary for effective functioning and performance of the
organizations. Research has shown significant influence of organizational culture on
subjective organizational performance, however, there has been some, albeit limited
empirical support for the effect of culture on objective organizational performance (Wilderon,
van den Berg, & Wiersma, 2012; Xenikou & Simosi, 2006; Uzkurt, Kumar, Kimzan, &
Eminoglu, 2013). In their study of 36 American companies between 1961 and 1980, Peters
and Waterman (1982) found certain direct links between corporate culture and financial
performance, measured in terms of average turnover growth, compounded asset growth,
average return on capital, mean ratio of market to book value, average return on sales, and
average return on equity. More recent studies have also indicated that organizational culture
has its impact on the long term financial performance of the organizations and culture will be
playing a deciding role in determining the success or failure of organizations (Ortiz &
Arnborg, 2005; Schlechter, 2001)
Xenikou and Simosi (2006) in their study of large financial organization in Greece
found that only two out of four (achievement and adaptive orientation) cultural traits had an
influence on the financial performance, however, Uzkurt, Kumar, Kimzan, & Eminoglu
(2013) studied the influence of innovative organizational culture in the Turkish banking
sector, and found significant influence on objective organizational performance (Profitability,
Market Value and Market Share). Surprisingly, though, Skerlavaj, Stemberger, Skrinjar, and
Dimovski (2007) study of one of the dimensions of organizational culture (Organizational
Learning Culture (OLC)) showed that OLC has a positive direct impact on all three aspects of
non-financial performance perspectives included in the model: customer, supplier and

67
performance of the employee. The impact of OLC on financial performance was positive, but
indirect (through non-financial performance from the employee perspective). There has been
evidence of the influence of organizational culture on subjective organizational performance,
Yesil and Kaya (2013) also in their study of firms in Gaziantep in Turkey found that
organizational culture dimensions have no effect on firm financial performance (Sales
Growth and Return on Assets) however the evidence of the impact of organizational culture
on objective organizational performance have been inconclusive due to definitional,
structural and design related differences and problems (Yesil & Kaya, 2013).
A general belief confirms that corporate culture has a long term impact on
performance (Kotter & Heskett, 1992). Ginevičius and Vaitkūnaite (2006) reported that
organizational culture determined by involvement and cooperation positively impacts
organizational performance. Kotter (2012) also suggested that organizational culture has the
potential to improve employee job satisfaction, the sense of certainty about problem solving,
and organizational performance. Dwyer, Richard, & Chadwick (2003) in their study of banks
revealed no significant influence of organizational culture on the financial performance of
banks. Similarly Wilderon, van den Berg, & Wiersma (2012) revealed in the study of a large
Dutch Bank that none of the 5 factors of organizational culture had a significant relationship
with objective organizational performance. However all dimensions except Human-resource
orientation showed a significant relationship with perceived organizational performance.
However contrary to other studies Booth and Hamer (2009) found significant influence of
cultural dimensions (Morale, Job Satisfaction, Tools & support infrastructure and
Manageable workload) on financial performance (Sales Intensity) in UK retail business.
Following this line of logic, this study attempts to further investigate the role of
organizational collaborative culture on firm objective and subjective performance.

68
The aforementioned literature can be summarized to further clarify the causal link
between culture, ISQ and organizational performance. Culture constitutes of psychological
and structural elements that affect employee’s perceptions and behaviours, most important
behaviours in the context of this study are responsiveness, reliability and assurance which
determine the level of ISQ. Enhanced level of these identified behaviours would make a
stronger organizational culture that would help in improving firm profitability. Rigid culture
influences level of cooperation within the organization that has a significant impact on
organizational performance.
2.4.3. Organizational Commitment
A number of different definitions have been proposed to elaborate the concept of
Organizational commitment. It includes, process by which the goals of the individuals and
the organization become congruent, attitude or orientation that links the identity of the
employee to the organization, the perceived rewards associated with continued participation,
an involvement with a particular organization, the costs associated with leaving the
organization and normative pressures to act in a way that meets organizational goals (Meyer
& Allen, 1997). Mowday, Porter and Steers (1982) characterized organizational commitment
as a readiness to exert considerable effort on behalf of the organization, a strong belief in and
acceptance of the organizational goals and values, and a strong desire to maintain
membership in an organization. Muthuveloo & Rose (2005) referred to organizational
commitment as the willingness of employees to accept organizational values and goals and
direct efforts towards attainment of these goals. Furthermore commitment was conditioned to
complete involvement and participation in all the activities both work and non-work related
to the organization and to dedicate time and effort towards the advancement of the
organization. Employee commitment to the organization is characterized by a proactive
attitude representing an internalized employee's belief that stems out from soft HR

69
approaches (Shepherd & Mathews, 2000). Organizational commitment is a psychological
state that characterizes the employee’s relationship with the organization (Rashid,
Sambasivan, Johari, & 2003). This relationship is characterized by the relative strength of an
individual’s identification with and involvement in a particular organization” is referred to as
commitment to the organization (Robins, Judge, & Sanghi, 2009). This definition entails a
strong belief and recognition of the organization’s goals and values and a willingness to exert
considerable effort on behalf of the organization. This is only possible when employees
perceive that they have a connection with their job which is another measure of degree of
organizational commitment (Bai, Brewer, Sammons, & Swerdlow, 2006).
Three main themes emerge from the above statements that describe organizational
commitment, first is characterized by a strong belief in the goals and values of the
organization, second, willingness to go the extra mile, and third continued association with
the organization. It can be asserted that employees having these characteristics have a higher
level of commitment. The three broad themes that emerge from aforementioned definitions of
organizational commitment led Meyer and Allen (1991) to formulate a three dimensional
construct of commitment which included affective, normative and continuance which is
sometimes labeled calculative commitment (Iverson & Buttigieg, 1999). Employees’
emotional attachment to, identification with and involvement with the organization based on
the positive feeling and emotions towards the organization is referred to as affective
commitment. Employees will continue to work for the organization since they want to
(Gautam, Van Dick & Wagner, 2004).
The commitment based costs associated with leaving the organization is referred to as
continuance commitment (Meyer & Allen, 1997). Gautam Van Dick and Wagner (2004)
identified two reasons for continuance commitment, first the perceived cost of leaving the
organization in the form of payment reduction, loss of pension benefits, and secondly due to

70
lack of job openings. Although the employees may be looking to leave the organization, but
this form of commitment ensures that employees continue working for the organization,
regardless of their feeling of discontent and dissatisfaction towards the organization
(Appelbaum, et al, 2004). This may be because such employees are likely to resort to loyalty
or neglect as the response to their dissatisfaction.
When employees feel obligated to continue working for the organization, this may be
due to the internalization of values and goals of the organization, this is referred to as
normative commitment (Meyer & Allen, 1997). Normative commitment refers to an inner
feeling of obligation that pressurizes the employee to continue working for the organization
due to work culture and other socially accepted norms. (Gautam, Van Dick, & Wagner,
2004). This may be due to the support that employee might have received in the past from the
organization, or the reference on which the employees availed the job.
The differentiation point between a committed and not committed employee is that
employees who show commitment are dedicate more of their time, energy and talents to the
workplace. This depicts the acceptance and believe in the organizational goals and values.
Once an employees’ belief is strong, employees consider organization as their own, this
ownership towards organization translates into discretionary effort, and no compromise on
the quality of product and service. In other words, the willingness of committed employees to
engage in discretionary effort beyond the call of duty make them highly likely to be better
service quality performers. This level of involvement and commitment of the staff leads to a
higher level of service, resulting in a smaller internal service gap (Frost & Kumar, 2001).
A variety of measures are available in the literature to measure organizational
commitment. However, according to Fields (2002), three primary issues that shall be
addressed in measuring organizational commitment:
1. How does it form? – Pointing to the basis of commitment.

71
2. What is the evidence of commitment? – Referring to the manifestation of commitment
is it an attitude or behavior)
3. What or who is the employee committed to? – Stating the focus of commitment
Fields (2002) further clarified that each of the dimensions of commitment (Affective,
Normative and Continuance) describe the basis of commitment. With respect to whether term
commitment is an attitude or behavior, affective commitment has been termed as an
attitudinal component, while normative and continuance commitment is termed as behavioral.
The third issue is that of focus. This refers to the notion that is the employees willing to stay
with the organization for personal gains or if the employee really believes in the organization.
This results in personal or organizational focus.
A number of measures are available to measure organizational commitment. One of
the earliest attempt was by Mowday, Steers and Porter (1979) who proposed a 15 item uni-
dimensional scale that asked respondents to rate the statements about their feelings for the
organization. Meyer & Allen (1997) developed one of the most widely used scale for
measuring commitment, as identified and described above. They prescribed 3 different
dimensions (Affective, Normative and Continuance). The instrument had a total of 22 items
with 8 statements to evaluate affective commitment, 6 for normative commitment and 8
pertinent to continuance commitment. Similarly Balfour and Wechsler (1996) produced a 3
dimensional scale consisting of nine items. The three dimensions included commitment based
on affiliation or pride in the organization (Identification Commitment), a commitment based
on identification with the organization (Affiliation Commitment), and commitment based on
satisfactory exchange with the organization (Exchange Commitment) resulting in
appreciation of the individual by the organization. Reviewing the items further revealed that
identification and affiliation, commitment dimensions can be viewed as a subset of affective
commitment scale of Meyer and Allen (1997). Exchange commitment dimensions make the
72
scale different from the previously discussed scales, it adds reciprocity to organizational
commitment, and reveals if the employee is getting any intangible reward for the attachment
to the organization.
2.4.3.1. Linkage of Organizational Commitment with Service Quality and
Organizational Performance
An employee who is attached to an organization would feel differently for his/her job
and the workplace. The feelings and emotions the employee has for the organization makes
the individual thought process very different. The actions of the employee are dictated by the
consequences they have for the business. An employee with heightened affection for the
organization would behave differently not only with the external customers, who are the
ultimate determinant of organizational performance, but also with each and every employee
working within the organization. The level of attachment employee has with the organization
translates into employee attitudes and behaviours. Employee’s strength of identification with
the organization’s goals, vision and values is reflected in the employee’s delivery of service.
(Unzicker, Clow, & Babakus, 2000). Employee identification with the organization has a
significant negative influence on turnover, lower turnover implies that employees would have
worked with each other over a longer period of time, they would understand each other’s
needs and wants, thus would be in a better position to facilitate fellow workers and the
service received from the fellow workers would be adequately satisfying, since employees
would have longer work tenures. Lower turnover, therefore, means a more experienced crew,
and consequently, better service quality. There has been plenty of research on the effects of
employee commitment on service quality from a customer perspective, however a little
research effort is carried out over the influence on organizational commitment on ISQ.
Boshoff and Mels (1995) studied the influence of organizational commitment on ISQ
in insurance sales people, and found a strong positive impact of commitment on ISQ. This

73
was attributed to the fact that salespeople internalize and identify with the organizational
goals, objectives and values, thus will boost ISQ through increased discretionary effort.
Discretionary efforts are of great significance in service industries, since organizations cannot
control the level of interaction between the customer and the employees. The willingness of
employees to engage in discretionary efforts during a service encounter, determines the level
of SQ delivered to customers, leading to customer satisfaction (Zeithaml, Berry, &
Parasuraman, 1990). Discretionary effort is equally important during the contact between
employees. One employee’s willingness to provide adequate, timely, efficient, and effective
service to the other employee can help the organization produce the desired deliverables and
attain superior performance. The level of service quality provided to the customer is strongly
dictated by the willingness of employees to accept and support organizational goals and act in
a manner that is likely to promote these goals. (Boshoff & Tait, 1996). For example,
Malhotra and Mukherjee study in a major retail bank in the UK (2004) found that the OC of
employees plays a vital role in shaping the level of SQ delivered to customers. Although the
existing research focus on the relationship between commitment and service quality has been
on the external customer. However, superior service to the external customer is strongly
contingent to the enhanced internal service. Hence, it is suggested that employee commitment
can have a significant positive impact on the internal service quality.
Much has been researched on the linkage between commitment and performance. The
objective of the present study pertinent to organizational commitment is two folds. One is to
evaluate the influence of organizational commitment to organizational performance, and the
second is to identify if ISQ mediates the relationship between organizational commitment and
organizational performance. A consensus prevailed in the present age that organizations are
not competing on the basis of products they produce rather the quality of people they employ.
However, in order to achieve performance related objectives, it is essential to deal with issues

74
relating to commitment and compliance which is part of the soft HR issue that contributes
towards organizational performance (Adhikari & Gautam, 2011). The generation of
commitment is rooted in the expectation that people can make a difference because of their
capabilities and commitment, which are rare, non-substitutable, valuable and inimitable
(Barney, 1991). It is thus important to understand that organizations understand value its
employees and the payoffs of organizational commitment in terms of organizational success.
Research has shown that organizational commitment is considered to result in greater
effort which, in turn, results in improved performance (Worsfold, 1999). Different results are
found based on the varying definitions of commitment and performance (Somers &
Birnbaum, 1998). Benkhoff (1997) investigated the influence on organizational performance
in terms sales targets met and change in profits. It was found that employee commitment was
positively correlated with the financial success of divisions (in sample bank branches).
Research has revealed that an increased level of employee engagement is positively
associated with financial performance (Collins, 2001; Ingelgard & Norrgren, 2001). While
failure to attain organizational commitment has its consequences in the form of performance
related problems such as high costs, low profits, low stock prices, and poor customer service
(Pfeffer, 1998).
Organizational commitment links employees' identity to the organization, which can
strengthen service delivery. Once employees identify with the organization, this reduces
employee turnover resulting in long term working relationship with the organization that can
also lead to improved service delivery while lack of commitment can slow down the service
delivery. Commitment has been identified as a factor in the provision of long term financial
results. The direction of efforts as a result of employee commitment can aid in higher level of
trust and reliability amongst employees that can produce improved performance.

75
2.4.4. Perceived Organizational Support (POS)
Service employees tend to be more responsive towards the needs of the customers, if
they perceive that the management is concerned with meeting their needs (Getty & Getty,
2000). Drawing on the social exchange theory Rhoades and Eisenberger (2002) defined POS
as the employees’ perception concerning the extent to which the organization values their
contributions and cares about their well-being. Similarly Dawley, Andrews and Bucklew
(2008) described POS as employees’ beliefs that the organization values their contributions
and well-being. Moreover, POS “may be used by employees as an indicator of the
organization’s benevolent or malevolent intent in the expression of exchange of employee
effort for reward and recognition” (Lynch, Eisenberger, & Armeli, 1999, pp. 469-70).
Perceived Organizational Support among the employees and the employer develops over time
through numerous exchanges and reflects the level to which workers recognize that their
organization/business is committed to them (Stamper & Johlke, 2003).
The perception of being valued and cared by the management is utilized by the
employees to fulfill their social needs for approval, affiliation, and esteem, and to determine
the organization’s readiness to compensate the increased effort with greater rewards (Yoon,
SEO & Yoon, 2004). This concept of perceived organizational support based on social
exchange theory (Blau, 1964) and the norm of reciprocity (Gouldner, 1960). Social exchange
theory highlights the reason as to why workers feel indebted to reciprocate actions directed
toward them by the business organization. Social exchange theory states that employees tend
to counter beneficial treatment they receive with positive work-related behaviors (Mishra,
2013). Moreover, an increased level of POS associates with the understanding that employees
who feel a higher level of POS will reciprocate favorable behavior when they trust that the
organization will reward them. The specific benefits exchanged may be valued primarily
because they are symbols of a high-quality relationship (Mishra, 2013). Lambert (2000)

76
contended that high level of organizational support may result in positive behaviors valued by
the organizations, this is in response to the benevolent treatment from the organization.
2.4.4.1. Linkage of Perceived Organizational Support with Service Quality and
Organizational Performance
POS is viewed as an important explanatory framework for understanding the
relationship between employees and the workplace. It is regarded by some researchers as
central in understanding job-related attitudes and behaviors of employees (Shen et al., 2013).
There have been theoretical and practical contributions that highlight the influence of POS on
employees’ behavior which actually stimulates how employees treat their coworkers and
customers. Employees feelings about the organization’s care and emphasis are driven by the
perception of the support employees’ receive at work. Employees with a sense of POS feel
that in circumstances where they need work or life support, the organization is willing to lend
a helping hand; employees personally feel cared for, recognized, and respected, and in turn
display identification, increased cooperation, appreciation, diligent performance, and
reciprocity among workers. The dictionary meaning of reciprocity refers to mutual benefit,
and based on the norm of reciprocity, employees in receipt of greater resources from the
employer are likely to compensate their employers with greater levels of performance
(Eisenberger et al., 1986; Rousseau & Parks, 1993). Based on the principle of reciprocity,
employees with POS not only help coworkers, but also increase their own job satisfaction and
organizational commitment (Chiang & Hsieh, 2012). This helps from the coworkers is
reflected in terms of higher level of trust, increased reliability, deeper understanding of issues
and challenges that leads to joint problem solving, and task responsiveness that results in
efficient and effective working.
It is important to note that achieving service quality and making satisfied and loyal
customers depend on the attitudes, performance and behavior of employees (Kusluvan &

77
Kusluvan, 2000). Mohr and Bitner (1995) anticipated that POS has a direct influence on
contact personnel service efforts defined as the amount of energy put into service works.
Likewise, Wayne, Shore, & Liden (1997) found that POS is positively related to a high
quality employee. Similarly, Yoon, Seo & Yoon (2004) argued that POS may greatly impact
employee attitudes and behavioral responses. This is due to the fact that the provision of
organizational support to an employee is likely to engender feelings of benevolence towards
the organization, consolidating the link between employer and employee, which, in turn,
increases the feelings of responsibility to recompense the organization, through the norm of
reciprocity (Maertz, Griffeth, Campbell, & Allen, 2007). Employees who experience high
levels of POS tend to have more feelings of obligation based on the norm of reciprocity. This,
in turn, may contribute to such employees having more favorable attitudes and behaviors
towards their workplace (Shen et al., 2013). Organizational support is thus a necessary pre-
requisite for conducive employee behaviors at work. Deming (1982, 1986) consistently stated
that lack of top management support and poor supervision will doom any quality effort. Juran
(1993) emphasized that management needs to instill a philosophy of continuous improvement
and provide the necessary support in organizational practices.
In order to foster ISQ, managers who expect quality service from employees will have
to provide service quality to workers (Wildes, 2007). Social exchange theory can be applied
to account for the relationship between managers and workers. The norm of reciprocity in
social exchange theory proclaims that an action by one party leads to a response by another
party (Yee, Yeung, & Cheng, 2010). One way to ensure a positive reciprocity orientation is
by ensuring that internal customers are properly supported and consulted with regard to the
service delivery issues (O’Riordan & Humphreys, 2003). In order to boost ISQ, the employer
has to show devotion towards building a relationship of long-term employment with its

78
employees by fulfilling their needs through offering them favorable working conditions; in
return, employees will be satisfied, engaged, committed and loyal.
When employees have high levels of POS, the reciprocity norm (Gouldner, 1960)
motivates them to help the organization reach its goals and objectives. In return of the support
provided by the organization, it expects a high level of performance in return for its
consideration to employees’ socio emotional needs (Eisenberger, Huntington, Hutchinson, &
Sowa, 1986). Lynch, Eisenberger, and Armeli (1999) theorize that employees who perceive
high levels of perceived organizational support, are more compelled to contribute to the
objectives of the organization. One of the reasons for this can be attributed to the fact that
organizational support works as a resource capable of effecting performance by neutralizing
stressors (Rhoades & Eisenberger, 2002). The support and values employees receive from the
organization results in lower levels of stress and encourages commitment to the organization
that results in a positive influence on performance (Byrne & Hochwarter, 2007). It is however
important to understand that as the perceived organizational support increases; individuals
feeling contempt towards the organization suffer from a few of exploitation that undermines
their inclination to contribute (Lynch, Eisenberger, & Armeli, 1999). Rhoades and
Eisenberger (2002) meta-analysis of POS included 20 performance studies and found a
highly statistically significant relationship between POS and performance. Rhoades and
Eisenberger (2002) reported considerable empirical support for the fact that POS is related to
outcomes favorable to employees (for instance, Job Satisfaction) and the employer, in term of
reduced turnover, performance, lessened withdrawal behavior. One of the purposes of this
research is to examine how perceptions of organizational support influence employees' level
of service quality. Drawing on the norms of reciprocity of social exchange theory, it is argued
that employees who are receive adequate support from their organization will deliver quality
internal service.

79
Perceived organizational support neutralizes employee stress and can result in
increased cooperation that can enhance employee responsiveness (the key determinant of
Internal Service Quality). Supportive management induces benevolence that can foster
favorable attitudes and behaviors amongst employees, which can result in increased levels of
empathy in employees, employees would be in a better position to understand the coworker’s
problems and issues. Furthermore Perceived organizational support leads employees to
reduce tendency to miss the work (Wayne, Shore, & Liden, 1997). This shows that
employees would try to make sure that they perform services rights for the first time and
avoid making corrections later. This is a key characteristic of ISQ and is referred to as
reliability. This would lead to more satisfied employees resulting in enhanced organizational
performance. Furthermore supportive management can lead to the attainment of
organizational objectives. This further establishes the causal link amongst POS, ISQ and
organizational performance.
2.4.5. Role Stress
Selye (1936) first coined the term stress in the field of life sciences, describing it as a
force, pressure or strain exercised upon an object or person which tries to resist these forces
and attempt to maintain its original state. The concept of stress is defined differently across
different disciplines, as identified by Rees and Redfern (2000) who asserted that there is no
universally accepted definition for the term stress. Common usage for stress is an "emphasis,
extra force or pressure, tension and strain" (Oxford American Dictionary, 1980). This
definition is not clear by the way individuals experience stress in their lives. Waters and
Ussery (2007) defined stress as an opposing response that employees experience when
external demands exceed their internal capabilities. Thus, there is a gap between the
employee’s capabilities and the expectations laid onto the employee. Stress at work is mainly

80
a result of increased workload, future uncertainty, lack of proper organizational
communication, lack of resources (Ongori & Agolla, 2008).
One of the causes of occupational stress is role stress that can be considered as a
characteristic of most occupations. Role stress in an organizational context is said to occur
when there is a discrepancy between an employees’ perceived state and desired state,
provided that the presence of this inconsistency is found to be important by the employee
(Edwards, 1992). Once it is considered important, this may lead to stress. It may be regarded
as a result of gaps between an employee’s perception of the characteristics of a particular role
and what is actually being achieved by the employee currently performing the role (Lambert
& Lambert, 2001). Originally proposed by Gross, Mason and McEachern (1958), role stress
points to a condition where role obligations (i.e., expected, and actual behaviors related to a
job role) are irritating, vague, difficult, impossible or conflicting. Kahn and Quinn (1970)
stated that role stress is everything about a job role that leads to adverse consequences for the
employees.
Role ambiguity and role conflict mainly form role stress in the jobs (Ortqvist &
Wincent, 2006). Lack of clarity and required information that is prerequisite to perform the
job role effectively is referred to as role ambiguity, on the other hand role conflict is a
condition that occurs in an employee when he/she perceives that the demands and
expectations of two or more members of their role set (i.e. Customers and
Supervisors/managers) are unsuited or contrasting (Singh, 1998).
2.4.5.1. Linkage of Role Stress with Service Quality and Organizational
Performance
Stress is a negative psychological phenomenon. Research has shown negative effects
of stress on the way people perform at work. Christo and Pienaar (2006) noted that stress
leads to increased absentee rates, internal conflicts and low employee morale. Stress has been

81
related to a reduction in output, product quality, service morale (Brown & Uehara, 2008). A
number of studies have shown that both forms of role stress (Role Conflict and Role
Ambiguity) are related to lower satisfaction levels which may affect empathy, a key
determinant of ISQ, high absenteeism that would affect the employee's ability to provide
reliable service, lack of employee involvement would affect employee responsiveness. All
these characteristics will affect employee productivity and efficiency in the business
(Koustelios et al, 2004; Ofoegbu & Nwadiani, 2006; Chang & Lu, 2007). Fairbrother and
Warn (2003) revealed a number of negatives of stress, apart from reduced efficiency,
decreased capacity to perform, dampened initiative, and reduced interest in working,
increased rigidity of thought, however, two most critical consequences that would result in
loss of optimal ISQ were lack of concern for the organization & colleagues, and a loss of
responsibility. These factors would significantly undermine responsiveness and reliability of
service from the coworkers.
Role stress can result in confusion about the appropriate action to take due to lack of
clarity that comes from role ambiguity, leading to inaction or inappropriate decisions. It is
expected that elevated stressors in one’s work environment to have detrimental effects on
achievement. Service consults would be less effective at their jobs if they perceive high levels
of job stress in comparison to co-workers whose perception of job stress is low. The
argument is that delivery of persistent and effective quality service will be hampered by the
perception of stressful work environment. Varca (1999) noted that work stressors result in a
lack of direction that yield a situation where service suffers. On the other hand clearly defined
roles decrease job tension and leads to a higher level of service quality (Frost & Kumar,
2001). Bauer and Brazer (2011) examined role stress among new USA principals, they
maintained that all three types of role stress (Role Conflict, Role Ambiguity, & Role

82
Overload) contributed to outcomes reflecting the quality of the work experience for
professionals’.
The different attitudinal and behavioral outcomes of organizational stress can
potentially impact both employee and organizational performance. It is generally accepted,
higher level of stress affects organizational performance, since it reduces productivity and
efficiency (Dua, 1994). Stamper and Johlke (2003) assert that employee stress has negative
effects on the firm itself such as decreased job performance. This mainly stems from the fact
that occupational stress results in decreased capacity to perform, reduced efficiency,
dampened initiative, reduced interest in working, lack of concern for the organization,
increased rigidity of thought, poor internal communication and conflict, poor quality of
products and services (Greenberg & Baron, 2000; Schabracq & Cooper, 2000; Murphy,
1995) all these surely lead to detrimental organizational performance. Stress results in
compromised individual functioning that is related to employee stress (Smith, 2000) and is a
major obstruction to organizational success (Noblet, 2003). In case of being stressed both
work and personal factors are pushed beyond the range of stability (Change & Lu, 2009) thus
resulting in loss of focus and forcing the individuals to react in ways that are not normally
acceptable within in a business organization and thus ultimately resulting in loss of efficiency
and effectiveness (Latif, Nadeem, Khalil, & Zeb, 2012).
It is however, important to understand that stress is not always negative, stress has
also been found to have a positive influence on individuals and thus the organization.
According to Stevenson and Harper (2006), if stress is manageable, it could help improve
individual’s performance. This is possible because then stress would act as a motivating
agent, providing individual a challenge to perform and would ultimately result in better and
improved organizational performance.

83
The aforementioned literature further elucidates the linkage between role stress,
internal service quality and organizational performance. Role stress has been found to result
in instability that results in loss of focus leading to loss in efficiency and effectiveness, which
is a key determinant of organizational performance. Role stress leads to increased levels of
absenteeism that can hamper the provision of reliable service, which in the case of banks can
directly affect customer base and hence the profits of the business. Compromised individual
functioning, lack of clarity, internal conflicts and lack of involvement are other outcomes of
role stress, which would affect responsiveness, empathy (both key determinants of ISQ) and
people performance at work. Empathy is characterized by attention, sensitivity and interests
of coworkers while responsiveness is determined by optimum communication, willingness to
help and efficiency. Lack of empathy and subdued responsiveness would result in poor job
performance.
2.4.6. Internal Marketing
The IM concept was first proposed in the mid 1970’s by Berry, Hensel and Burke
(1976) as a way of achieving consistent service quality. Berry, Hensel and Burke (1976) first
defined internal marketing as: “Internal Marketing is concerned with making available
internal products (jobs) that satisfy the needs of a vital internal market (employees) while
satisfying the objectives of the organization” (p. 8). Its basic premise was “to have satisfied
customers, the firm must also have satisfied employees” and that this could be best attained
by treating employees as customers (Ahmed & Rafiq, 2002). Similarly Drake, Gulman, and
Roberts (2005) identify the give and take relationship in internal marketing by stating that
internal marketing involves making employees to love the brand, hence, in turn, will
convince the customer to love it. Further Ballantyne (2000) identified the developmental
aspect of internal marketing and why it should be done, Ballantyne (2000) stated that

84
“It is a strategy for developing relationships between staff across internal
organizational boundaries. This is done so that staff autonomy and know-how may combine
in opening up knowledge generating processes that challenge any internal activities that need
to be changed. The purpose of this activity is to enhance the quality of external marketing
relationships.”(p. 44)
The need to study IM is required from both the employee and organizational
perspective. Firstly, from the employee perspective, the need to study internal marketing is
warranted by the fact that until recently incentives (usually monetary) were believed to be an
effective technique applied by employers to confirm a form of staff promotion/service
stability. Therefore, if IM as a concept is applied, it should enhance positive interactions
between staff which in turn would ameliorate their relationship with the external customer
(Panigyrakis & Theodoridis, 2008). Secondly, from an organizational perspective, companies
who understand that they must get employees to buy in before the customers starts to buy
have started to put together the blueprint for a long-lasting and successful business. In order
to make an employee buy in, the companies must share information and recognize
employees’ contributions (Drake, Gulman, & Roberts, 2005). Tsai and Wu (2011) summed
up the benefits reaped by both employees and organizations from an IM initiative in Hospital,
they found reinforcing a hospital’s mission, strengthening employee relationships, increasing
OC and reducing turnover can be attained utilizing the IM concept. IM is significant since it
allows firms to provide training and development for employees, provide organizational
vision for managers, enhance motivation and inspiration and retain employees.
The literature identifies two primary motives of IM. First, through interactions
between personnel and customers, it complements external strategic marketing efforts,. These
exchanges are perceived as contributory in luring the customer and increased satisfaction
(Panigyrakis & Theodoridis, 2008), this ultimately leads to better financial performance,

85
which is evident from the research of Lings and Greenley (2009) who found internal
marketing to be influential in the financial performance of the firm through customer
satisfaction. Shaker and Basem (2010) assert that relationship marketing has a positive
impact on organizational performance. Second, it effectively develops and maintains a
employee base which is both satisfied and motivated, So, the IM initiative assists both the
employees and the organization successfully (Dunne and Barnes, 2000).
As a result of competitive forces and deregulations, many service industries have had
to make major changes, these changes have brought with them challenges and opportunities,
now in order to meet with those challenges and opportunities a greater number of
organizations have comprehended the need for implementing internal marketing programs
(Frost & Kumar, 2001). Internal marketing helps in creating a service and customer-oriented
culture among employees, service organizations are increasingly trying to adopt the concept
of internal marketing (Kang, James, & Alexandris, 2004).
IM elements are described in a variety of ways (Ueno, 1995). Gronroos (2000)
identified eight different activities inherent in IM; namely: management support and internal
dialog, training, HR management, internal mass communication and information support,
developing systems and technology support, external mass communication, internal service
recovery, market segmentation and market research. Foreman and Money (1995) determine
three factors that represent IM: efforts to develop employees, to reward them, and to provide
them with a corporate vision. Moreover, they provide a starting point in the empirical
development of a more comprehensive mix of IM elements (Keller, Lynch, Ellinger, Ozment,
& Calantone, 2006). Ahmed, Rafiq, and Saad (2003) developed a complete set of activities
including: internal communication, strategic rewards, organizational structure, training and
development, physical environment, senior leadership, staffing, selection and succession,
incentive system, empowerment, inter functional coordination, and operational/process

86
changes. Akroush, Abu-ElSamen, Samawi, Odetallah, (2012) in their study of tourism
restaurants operating in Jordan found that IM consists of six dimensions: staff recruitment,
staff training, staff motivation, internal communications, staff retention and job security.
Wu, Tsai and Fu (2013) identified two dimensions of internal marketing: Managerial
Support and Internal Communication. Lings and Greenley (2005) identified and confirmed
five dimensions of Internal Market Orientation. These describe different managerial
behaviors associated with internal marketing. The identified factors include Formal face-to-
face information generation, Formal written information generation, Responsiveness,
Informal information generation, and Information dissemination. Gounaris (2006) found a
three factor order construct for internal market orientation. The three sub -dimensions
included internal market intelligence generation, disseminate intelligence, response to
intelligence. Panigyrakis and Theodoridis (2009) further specified that the IM construct,
within the retail industry, consists of five dimensions: formal interaction, reward systems,
feedback, internal procedures and internal customer orientation. Internal marketing for the
present study was assessed using a 15-item scale developed by Foreman and Money (1995).
This scale measures three dimensions of internal marketing: service training programs (seven
items), performance incentives (three items) and vision about service excellence (five items).
2.4.6.1. Linkage of Internal Marketing with Service Quality and Organizational
Performance
In order to enhance the quality of products and services and to attain a better
performance, researchers have utilized the concept of IM. According to Rafiq and Pervaiz
(2000, p. 454),
“Internal marketing is a planned effort using a marketing like approach to overcome
organizational resistance to change and to align, motivate and inter-functionally co-ordinate
and integrate employees towards the effective implementation of corporate and functional

87
strategies in order to deliver customer satisfaction through a process of creating motivated
and customer orientated employees.”
Berry, Hensel and Burke (1976) first proposed internal marketing as a solution to the
problem of delivering consistently high service quality. Internal marketing is presented as a
management approach which enables and motivates all members of the organization (Turkoz
& Akyol, 2008). It has already been established earlier in the internal marketing literature that
the basic premise of internal marketing is to create a satisfied workforce. This satisfaction
would help business in convincing the Frontline employees to accept and support the
organizational values, goals and objectives that should be beneficial to both the organization
and customers as well as to employees (Panigyrakis & Theodoridis, 2009).
One of the most crucial factors that can improve employees’ behaviors and can polish
their interactions with the customers is IM (Reza, Javadin, Rayej, Yazdani, Estiri, &
Aghamiri, 2012). Internal marketing consists of an effort by the organization to train and
motivate its employees to provide better service (Cooper & Cronin, 2000). It is well
understood that before employees provide a better service to external customers they have to
provide an optimum level of service to the employees within the organization. Kotler (1994)
has advocated the same fact by stating that “it makes no sense to promise excellent service
before the staff is ready to provide it” (p. 22). Staff will only be ready to provide an excellent
service to customers if they receive an optimum level of service within the organization. The
influence of internal marketing on service quality has been iterated a number of times in the
literature. Fisk, Brown and Bitner (1993) identify the fundamental idea that underlies the
concept that everyone in the organization has a customer and that internal customers must be
sold on the service and they are happy in their jobs.
Vasconcelos (2007) argued that improvements in internal marketing strategy such as
developing the internal relationship between the internal customers will give rise to

88
improvements in the external marketing strategy. It is important that the needs of the internal
customers and service providers are satisfied and they are motivated (Tsai & Tang, 2008).
Once the needs of the employees are met they become committed, co-operative, and
enthusiastic about the organization, however failure to motivate and satisfy the internal
customers will results in problems for the organization, these problems can be removed
through implementation of internal marketing programs, an internal marketing program will
eliminate departmental walls, integrate members organization wide (Ahmed & Rafiq, 2003),
and thus creates the opportunity to improve quality throughout the organization (Prasad &
Steffes, 2002).
Lings and Brooks (1998) utilized the SERVQUAL scale to examine ISQ. The results
demonstrated that the implementation of internal marketing improves ISQ and influences
external service quality. Lings and Greenley (2005) identified that IM was interchangeably
used with internal-market orientation to improve organizational climate. According to Opoku
et al. (2009), IM is strongly related to the perceptions of ISQ. Their results suggested that
“employees who use and are satisfied with the services offered have higher perceptions of the
interaction quality”. Similarly, Tsai and Tang (2008) found that IM dimensions (i.e. Training
and incentive) as main drivers of the level of service provided by nurses in Taiwan. Akroush,
Abu-ElSamen, Samawi, Odetallah, (2012) in their study of tourism restaurants operating in
Jordan found that IM consists of six dimensions: staff recruitment, staff training, internal
communications, staff motivation, staff retention, and job security. Staff retention has
positively and significantly affected ISQ. Staff recruitment exerted the strongest effect on
ISQ.
Internal marketing through a planned approach utilizes a marketing like efforts to
educate, coordinate, and motivate internal customers (employees) towards creating
satisfaction for external customers and as an outcome, enhancing organizational performance.

89
The development of internal market orientation is expected to have positive consequences for
the firm and its employees (Lings & Greenley, 2005). In order to improve company’s
performance and its employees, it is necessary to create and align internal association
between departments, functions and its employees inside the organization (Turkoz & Akyol,
2008). Tsai and Tang (2008) stressed that organizations have to treat employees as internal
customers, and satisfy their needs about providing a service, this will encourage employees to
provide service excellence to external customer and add to organizational performance.
Research conducted in the area of IM has ensured a change in the mindset where
organizations are considering their employees as customers, and are considerate of the fact
that in order to ensure success of the business, the employees must be served and the quality
of this service is important as the quality of service to external customer is deemed important.
(ELSamen & Alshurideh, 2012).
Research has shown the positive influence of internal marketing on organizational
performance, Lings and Greenley (2009) found internal marketing influence on financial
performance through customer satisfaction, however Saad, Ahmed and Rafiq (2002) study of
a total number of 504 companies (463 manufacturing and 41 service companies) with 300
employees revealed that there is a significant linear relationship between internal marketing
and business performance. According to Hwang and Chi’s (2005) empirical results of a
survey of 359 employees working in international hotels in Taiwan, internal marketing has a
positive impact on employee job satisfaction, and both job satisfaction and internal marketing
have positive impacts on organization performances. However Bouranta, Mavridoglou, and
Kyriazopoulos (2005) found a relatively weak effect of Internal Marketing to Business
Performance in banks, one of the reasons accountable for the very feeble bond lies in the fact
that some banks adapted to Internal Marketing very recently hence its effects haven't
appeared yet. Panigyrakis and Theodoridis (2009) study of supermarket chains in Greece

90
with nationwide coverage found that IM indeed has a positive influence on business
performance. The conflicting and varied findings from the research requires that the
relationship between ISQ and performance to be further evaluated. The present study strives
to penetrate this gap of negligible research into the effect of internal marketing on
organizational performance.
The research studies referenced, clearly highlight the relationship between internal
marketing, internal service quality and organizational performance. Internal marketing can
result in consistency in service quality since it integrates organizational members by
improving organizational climate and acceptance of organizational values and goals. Once
employees start valuing the organization, they feel responsible, and start to take ownership of
their work. This ownership can help in the development of understanding of the needs of both
the employees and the organization and employees try to make sure they perform their jobs
right the first time and respond to queries both within and outside the organization in an
efficient and effective manner. IM can help in improving staff retention and generate
satisfied workforce that enhances service quality and business performance.
2.5. Organizational Performance
The ultimate criterion variable of interest for researchers in any area of management
is organizational performance (Richard, Devinney, Yip, & Johnson, 2009). Organizational
performance is an indicator which measures how well an organization attain their objectives
(Hamon, 2003). Organizational performance alludes to financial performance in economic
terms such as profits and return on investment (Homburg & Pflesser, 2000). A broader
definition is proposed by Richard, Devinney, Yip, and Johnson (2009, pp. 722) who stated
that

91
“Organizational performance encompasses three specific areas of firm outcomes: (a)
financial performance (profits, return on assets, return on investment, etc.); (b) product
market performance (sales, market share, etc.); and (c) shareholder return (total shareholder
return, economic value added, etc.).”
Organizational survival is determined by performance, which is at the core of all the
activities that are undertaken by the organization (Abdalkrim, 2013; Bani-Hani, Al-Ahmad,
& Alnajjar, 2009; Choudhary, Akhtar, & Zaheer, 2013). Organizations aim to sustain
competitive advantage and attain high performance. Performance of an organization is the
result of its activities and processes (Robins & Coulter, 2007) and is a reflection of how well
the organization exploits its tangible and intangible resources (Wheelen & Hunger, 2010).
Business organizations are a key element for developing nations, hence these
organizations have a key role to play in our daily lives. Thus, many economists consider
organizations and institutions like an engine that determines the social, political, and
economic progress. Continued performance is the focus of any organizational focus because
only through performance, organizations are able to grow and progress. Thus, performance is
one of the most potent variables in the managerial research (Gavera, Ilies, & Stegerean,
2011).
Research has described OP as a multi-dimensional concept (Hamdam, Pakdel, &
Soheili, 2012; Ouakouak, Ouedraogo, & Mbengue, 2013). There are different aspects on
which organizational performance can be evaluated (Choudhary, Akhtar, & Zaheer, 2013).
Measures for OP can be divided into two categories: financial or non-financial (Abdalkrim,
2013; Akdemir, Erdem, & Polat, 2010; De Waal, 2012; Nzuve and Omolo, 2012).
Organizational performance may be measured using objective or subjective (i.e. Perceptual)
measures. Hancott (2005) revealed that, a number of objective indicators have been adopted
to measure OP, such as net or total asset growth rate, profit growth rate, shareholder return,

92
return on sales, growth in market share, return on net assets, and number of new products,
etc. In 1990, return on net assets and return on capital have been applied in performance
measurement as well. Tippins and Sohi (2003) propose that OP is measured on four
dimensions: relative profitability, return on investment, customer retention, and total sales
growth. In the present study, for the present study the focus is on both objective and
subjective performance.
Subjective data involve perceptual judgement, however, traditionally objective data
have been believed to be less biased, but the problem is that it is not always available, when
this is the case subjective data may be a reasonable alternative (McCracken, McIlwain, &
Fottler, 2001). Subjective measures ask supposedly well-informed respondents (key
informants) about organizational performance. According to Singh (2004) a disadvantage of a
perceptual measure is that it can be highly subjective, both in the judgment of organizational
performance itself and in the selection of a competing organization.
The present study also takes into account the objective data pertinent to organizational
performance. The objective data that are incorporated in the present study includes the
following variables
2.5.1. Earnings per Share
It is a part of a company's income (income minus expenses) which is due to each
common stock holders. Earnings per share is a sign of a company's prosperity (firm
performance), also known as market prospect ratio. Higher EPS represents that company is
making more profits which will lead to achieve the modern corporation goal i.e.
maximization of shareholders wealth. (Van Horne, 2012)
2.5.2. Return on Equity
Firm performance can be measured by four financial tools return on sales, return on
assets, market share change and customer satisfaction (Carmeli & Tishler, 2004). Return on

93
equity (ROE) is the ratio of net profit to total investment made by the owners. ROE provides
a view in the direction of management efficiency in generating a yield in lieu of the
titleholders of the corporation---depending on the proportion of equity in the concern.
Progressive results of the ratio represents the high level of earnings made by the firm. (Smith
et. al., 1994).
2.5.3. Return on Assets
According to Richard, Devinney, Yip, and Johnson (2009), Return on assets (ROA) is
a standard accounting tool for measuring organizational performance. ROA refers to the
earnings generated by the business in relation to the asset utilized in its operations. Generally
expressed as Net profit/Net Assets. It represents the set of data regarding managerial
expertise and their decisions in the best possible use of resources in order to generate returns
because an organization is being considered on its total financial performance, which
includes judgment made to acquire long term assets or tied up money in land and buildings
(in other words, by means of funds that might be used for additional revenue-generating
investments), or invest in securities. Investors or creditors are more likely interested in ROA
because if a firm return on assets is more than the average return in the industry is more likely
to higher ROE.
2.6. Service Quality and Organizational Performance
Deming (1982) noted that quality initiative within the organization results in
enhanced productivity that ultimately leads to improved competitiveness. Organizational
performance fundamentally depends on its key resource “people”. For Quality is the
responsibility of everybody ranging from top management to the unskilled worker
(Feigenbaum, 1983). Feigenbaum, further identified that it is the total participation of all
employees and the total integration of all the company’s technical and human resources that

94
will lead to long-term business success. Juran (1988) highlighted that the involvement of the
management can become visible through the establishment of the Quality Policy.
In the banking industry, the importance of relationship development and maintenance
with key customers has previously been investigated (Madill, Feeney, Riding, &
Haines.2002). Hawke and Heffernan (2006) identified increased profit through reduced risk,
improved communication links, and referrals to be some of the benefits of strong
relationships with key customers. Although, it is noted in the context of external customers
yet repeatedly the same is recorded for the internal customers as well. The bank needs to
maintain cordial relationship within the bank, which would positively influence bank
performance.
The unfounded expectation that the connection between service and profits was
simple and direct results in time to verify the association. A number of arguments are put
forth that identify the reason for failure to track the investment in service quality directly to
profits. First, just as the return of advertising, the benefits of service quality are rarely
identified in the short term and are experienced over time, hence the traditional research
approaches are less amenable to detection. Second, the individual contribution of service has
been difficult to calculate since other than service improvements there are many variables, for
instance pricing, distribution, competition, and advertising that carry a significant influence
on company profits. Third, spending on the right service variables and proper execution is a
key prerequisite as compared to mere expenditures on service (Zeithaml, 2000). However,
studies have revealed that ISQ has a key relationship with organizational performance. ISQ
has come to be recognized as a strategic tool for attaining operational efficiency and
improved business performance (Jain & Gupta, 2004).

95
Provision of quality service to external customers is only possible through significant
improvement in organizations' improvement of quality service to internal customers. Better
performance, combined with improved attitudes, transfers itself in quality service delivery.
Improved service and empathy from employees results in willingness of external
customers to purchase the service, which results in improved financial performance (Getty &
Getty, 2000). Provision of service by employees to their coworkers is an important dimension
of ISQ. Adequate service provided would help the employees in performing their duties in an
acceptable manner without any strain of delay or errors, thus, the quality of internal services
affects employee satisfaction (Zhen-You, 2003). Bellou and Andronikidis (2008) conducted a
study on 16 big banks in Greece found that banks’ performance eventually improved through
improved ISQ that influenced the behavior and satisfaction of the external customers.
2.7. Mediating Role of Internal Service Quality
Based on the aforementioned literature, it is evident that internal organizational factors
do have an influence on organizational performance; however the direct influence is still not
entirely convincing and confirmed. Previous studies have separately investigated the
influence of different internal organizational factors on ISQ, and the influence of ISQ on
organizational performance has also been reported in literature. Hence there exists a causal
relationship between internal organizational factors, ISQ and organizational performance.
ISQ as mediating variable can be central in developing an understanding how different
internal organizational factors and organizational performance are related.
To the best of the researchers’ knowledge, no research was found in the literature that
evaluated the mediating role of ISQ on the linkage between different internal organizational
factors and organizational performance. Moreover, existing studies have evaluated the
influence of internal organizational factors on ISQ at one hand and the relationship between
ISQ and organizational performance on the other. The present study proposed that the

96
influence of internal organizational factors on organizational performance is not direct but is
mediated by ISQ. It is proposed that internal organizational factors influence the way internal
customers, provide services to the internal suppliers, which subsequently leads to better
organizational performance.
The banking industry has traditionally focused on how to transform its physical
resources to generate financial performance, and therefore, inadvertently ignored the
mediating role of service quality (Mukherjee, Nath & Pal, 2003). Zellmer-Bruhn and Gibson
(2006) stated that team learning positively influences both task performance and the quality
of interpersonal relations. Knowledge sharing and learning behaviors are positively
associated with business process improvement, product and service offerings which in turn
are positively related to organizational performance (Law and Ngai, 2008). Research has
exhibited indirect influence of organizational learning on organizational performance, Hao,
Kasper, and Muehlbacher (2012) discovered that organizational learning does not impact
directly on performance, but mainly through innovation. ISQ is considered as a prerequisite
for overall company performance (Large & Konig, 2009), while existing research
aforementioned has shown that a number of variable affect ISQ. There are a number of
studies which have reported different mediating variables between organizational culture and
performance (Tseng, 2010; Zheng Yang, McLean, 2010, Han, Kim, Srivasta, 1998).
Similarly, Bae and Ha (2014) noted that prior research approaches the relationship between
commitment and performance from the viewpoint of causality. However, performance is
affected by internal and external factors of firms. These factors could mediate the relationship
between commitment and performance. This further strengthens the assertion that
organizational culture affects performance through other mediating factors.

97
2.8. Summary of Internal Organizational Factors and their Sources
Internal Organizational Factors have been researched as one of the characteristics
influencing organizational performance. However, there is a paucity of research which
models and empirically investigates the relationship between different internal organizational
factors and organizational performance. In addition, there is limited research that ascertains
the impact of internal service on organizational performance, similarly fewer researches have
studied ISQ as being impacted by different internal organizational factors. The research
makes an important contribution to the existing literature by empirically examining the
relationship between internal organizational factors, ISQ, and organizational performance.
The present research argues that the direct impact of different internal organizational factors
on organizational performance is through the level of internal service quality. For instance, an
employee facing an increased level of role stress, this may hinder employee’s ability to
communicate, show support, or provide timely service and in turn influence organizational
performance. Otherwise an increased organizational learning can make employee more
responsive, understanding, trustworthy, and knowledgeable. Existing research in the area of
internal service quality lacks the idea that internal service quality can mediate the relationship
between different internal organizational factors and organizational performance. Previous
studies although limited in the area of internal service quality focus on the antecedents of
internal service quality or the impact of internal service quality on organizational
performance. There is a significant lack of literature and empirical evidence on the role of
internal service quality. The literature suggests a causal relationship between different
internal organizational factors, internal service quality and organizational performance. Based
on the extensive review of literature, six factors were identified to evaluate their influence on
ISQ and organizational performance. The factors and their sources are highlighted in the table
2.6.

98
Table 2.6
Summary of Internal Organizational Factors and their Sources
Predictors Sources
OL Hays and Hill (2001), Pasebani, Mohammadi, & Yektatyar (2012), Di Xie (2005), Ming (2010),
Thompson and Kahnweiler (2002), Kandemir and Hult (2005), Skerlavaj and Dimovski (2006),
Ruiz-Mercader, Merono-Cerdan, and Sabater-Sanchez (2006), and Kuo (2011)
CC Raub (2008), Hauser and Paul (2006), Agbenyiga (2011), Phapruke (2008), Mathew, Ogbonna,
and Harris (2012), Tsai and Tang (2008), Ogbonna & Harris (2000), Perters and Waterman
(1982), Ortiz & Arnborg (2005), Schlechter (2001), and Ginevičius and Vaitkūnaite (2006)
OC Boshoff and Mels (1995), Malhotra and Mukherjee (2004), Benkhoff (1997), and Pfeffer (1998)
POS Wayne, Shore, & Liden (1997), Deming (1982, 1986), Byrne & Hochwarter, (2007), and
Rhoades and Eisenberger (2002)
RS Brown & Uehara (2008), Koustelios et al (2004), Ofoegbu and Nwadiani, (2006), Chang and Lu
(2007), Fairbrother and Warn (2003), Varca (1999), Chaker and Jabnoun (2010), Bauer and
Brazer (2011), Stamper and Johlke (2003), Noblet (2003), and Dua (1994)
IM Berry, Hensel and Burke (1976), Reza, Javadin, Rayej, Yazdani, Estiri, & Aghamiri (2012),
Cooper & Cronin (2000), Opoku et al. (2009), Tsai and Tang (2008), Lings and Greenley
(2009), Saad, Ahmed and Rafiq (2002), Hwang and Chi’s (2005), and Panigyrakis and
Theodoridis (2009)
Source: Author

99
Chapter 3
Conceptual Framework and Hypotheses
3.1. Introduction
This chapter discusses the theoretical framework of the study. The main objective of this
chapter is to describe the conceptual model, which would encapsulate the available
knowledge and describe the relationship between the different internal organizational factors,
internal service quality, and organizational performance. Furthermore the chapter also
identified the testable hypotheses for the study.
3.2. Conceptual Framework
Based on the extensive literature review, a conceptual model is presented as shown in
the Figure 6. The conceptual model for the study consists of three components.
A set of independent variables, referred to as internal organizational factors,
consisting of six different variables, namely: organizational learning, collaborative
culture, organizational commitment, perceived organizational support, role stress and
internal marketing
A mediating variable, namely internal service quality
The criterion variable named organizational performance.
This conceptual framework was based on the logical theoretical relationships,
presenting that different internal organizational factors affect organizational performance
(Skerlavaj & Dimovski, 2006; Booth & Hamer, 2009; Benkhoff, 1997; Rhoades &
Eisenberger, 2002; Chang & Lu, 2007; Lings & Greenley, 2009). Moreover, in the
relationship between internal organizational factors and the criterion variable i.e.
organizational performance, internal service quality was considered. It was further proposed
that internal service quality mediates the relationship between different internal

100
organizational factors and organizational performance. Six different internal organizational
factors form part of the study, namely; Organizational Learning, Collaborative Culture,
Organizational Commitment, Perceived Organizational Support, Role Stress and Internal
Marketing.
The present study advances the research stream that has explored the effects of variety
of internal organizational factors on organizational performance. The research seeks to
validate the direct relationship between the different internal organizational factors under
study and organizational performance. Furthermore the study also assess the relationship
between ISQ and organizational performance. The current study seeks to verify the findings
of existing research that highlights the significant influence of internal organizational factors
and ISQ on organizational performance. The study takes a step in the forward direction by
showing that ISQ mediates the relationship between different internal organizational factors
and organizational performance. Thus it suggests, for instance increase in the satisfaction of
employees with the level internal marketing (One of the different internal organizational
factors) results in higher level of internal service quality of the employees through increased
reliability, assurance, responsiveness and empathy that results in higher level of
organizational performance.
Most of the existing research studies have evaluated the direct influence of different
internal organizational factors on organizational performance, with few contributing through
investigation of relationship between different internal organizational factors and ISQ.
Similarly, fewer studies have assessed the impact of ISQ on organizational performance. All
previous research studies culminate at this point. The mediating role of service quality and
precisely the role of ISQ on the relationship between different internal organizational factors
and organizational performance has been neglected.

101
The mediating role is investigated in the present research since the banking industry
inadvertently ignores the mediating role of service quality (Mukherjee, Nath & Pal, 2003).
Given these suggested relationships between internal organizational factors, internal service
quality and organizational performance. Efficient and effective management of internal
organizational factors can help improve the level of internal service quality that would
subsequently improve organizational performance. Internal service quality can change the
influence of different independent variables on the ultimate criterion variable, therefore, the
internal service quality was expected to play a mediating role in the relationship between
internal organizational factors and organizational performance. Hence the following
conceptual framework for the study of relationships among different internal organizational
factors, internal service quality and organizational performance is proposed.
Figure 3.1. Conceptual Framework
The proposed conceptual framework is tested in chapter five using empirical
information gathered from different banks in this study.
3.3. Research Hypotheses
Based on the conceptual framework formulated on the basis of literature, the
following set of hypotheses is proposed to evaluate the linkage between different internal
Organizational Performance Objective Performance
Subjective Performance
Internal
Service Quality
Internal Organizational Factors
Organizational Learning
Collaborative Culture
Internal Marketing
Organizational Commitment
Perceived Organizational Support
Role Stress

102
organizational factors, ISQ, and organizational performance. Two different sets of hypotheses
are proposed, the first investigates the direct influence of different internal organizational
factors on ISQ and organizational performance along with the influence of ISQ on
organizational performance. The second set, with very scarce existing research evaluates the
mediating role of ISQ.
3.3.1. Organizational Learning, ISQ, and Organizational Performance
The present research not only tests the direct relationship between organizational
learning, ISQ and organizational performance, but also evaluates the role of ISQ in the
relationship between organizational learning and organizational performance. Organizational
learning has been established as a well-known factor to influence organizational performance
at work. Existing research has shown that learning can help businesses improve their
efficiency and competitive advantage that translates into growth and financial gains.
Literature has shown significantly positive influence of learning on the service quality
(Pasebani, Mohammadi, & Yektatyar; 2012, Di Xie, 2005). Learning can help shape human
behaviour and help employees behave in a manner that is conducive to the environment of
the organization. Based on the aforementioned literature that supports the impact of
organizational learning on both ISQ and organizational performance a causal chain of
relationship between organizational learning, ISQ, and Organizational performance can be
established. Hence, the following hypotheses are proposed to test the relationships.
H1a: There is a significant impact of Organizational Learning on ISQ
H1b: There is a significant impact of Organizational Learning on Perceived Organizational
Performance
H1c1-2-3: There is a significant impact of Organizational Learning on Objective
Organizational Performance (EPS, ROE, & ROA)

103
H1d: ISQ mediates between Organizational Learning and Perceived Organizational
Performance
H1e1-2-3: ISQ mediates between Organizational Learning and Objective Organizational
Performance (EPS, ROE, & ROA)
3.3.2. Organizational Collaborative Culture, ISQ, and Organizational
Performance
A number of research studies have separately investigated the influence of culture on
both ISQ and organizational performance. Organizational culture has been found to play a
crucial role in achieving superior organizational performance. Strong organizational culture
can help bind the employees together, thus creating an environment within the organization
where employees trust each other and are willing to support and care for each other (Chiang
& Hsieh, 2012). The quality is improved since organizational culture can help provide a
unifying focus to support and guide the attitudes and behaviors of organization members to
deliver quality to other employees (Anosike & Eid, 2011). The literature attests to the impact
of culture on both ISQ and organizational performance. The present study proposes that
culture influences both ISQ and organizational performance and ISQ significantly influences
organizational performance, hence based on the relationships identified in the literature
following hypotheses are proposed to test the relationships.
H2a: There is a significant impact of Organizational Collaborative Culture on ISQ
H2b: There is a positive significant impact of organizational collaborative culture on Perceived
Organizational Performance
H2c1-2-3: There is a positive significant impact of organizational collaborative culture on
objective organizational performance (EPS, ROE, & ROA)
H2d: ISQ mediates between Organizational Culture and Perceived Organizational Performance

104
H2e1-2-3: ISQ mediates between Organizational Culture and Objective Organizational
Performance (EPS, ROE, & ROA)
3.3.3. Organizational Commitment, ISQ, and Organizational Performance
The literature indicates that organizational commitment can significantly influence the
performance of the organization. Employees who believe in the vision/mission of the
organization work selflessly towards betterment of the organization. Employee’s
identification with the organization and their concern for the fate of the organization can push
the employees to show discretionary behaviour that would further enhance the productivity of
the organization. Failure to attain organizational commitment can result in problems like high
costs, low profits, low stock prices, and poor customer service (Pfeffer, 1998). Organizational
commitment can also help boost employee positive attitude and behaviour towards other
employees, this is caused by their willingness to accept different tasks, their enthusiasm to
put in extra effort, all this can result in reliability of service, timely problem solving and
prompt decision making. The present research hypothesizes that organizational commitment
has direct influence on both ISQ and organizational performance, moreover the direct impact
of commitment on organizational performance is mediated by ISQ. Hence, the following
hypotheses are proposed to ascertain the relationship.
H3a: There is a significant impact of Organizational Commitment on ISQ.
H3b: There is a significant impact of Organizational Commitment on Perceived Organizational
Performance
H3c1-2-3: There is a significant impact of organizational commitment on objective
organizational performance (EPS, ROE, & ROA)
H3d: ISQ mediates between Organizational Commitment and Perceived Organizational
Performance

105
H3e1-2-3: ISQ mediates between Organizational Commitment and Objective Organizational
Performance (EPS, ROE, & ROA)
3.3.4. Perceived Organizational Support, ISQ, and Organizational Performance
The research hypothesizes that increased level of perceived organizational support
would significantly influence ISQ and organizational performance, furthermore the
relationship between perceived organizational support and organizational performance is
mediated by ISQ. The literature shows that higher level organizational support positively
impacts organizational performance. Reciprocity norm which is at the heart of the perceived
organizational support make employees to recompense their employers with increased
performance (Eisenberger et al., 1986). This also makes employees render full support to
their fellow employees in performing their services thus helping in fostering improved
service quality. One of the reasons for this enhanced service quality is the feeling of
responsibility that the employees feel towards the organization (Maertz, Griffeth, Campbell,
& Allen, 2007). Based on the relationships identified in the literature, the following set of
hypotheses are proposed to ascertain the relationship between perceived organizational
support, ISQ, and organizational performance.
H4a: There is a significant impact of perceived organizational support on ISQ
H4b: There is a significant impact of perceived organizational support on perceived
organizational performance
H4c1-2-3: There is a positive significant impact of perceived organizational support on
objective organizational performance (EPS, ROE, & ROA)
H4d: ISQ mediates between Perceived Organizational Support and Perceived Organizational
Performance
H4e1-2-3: ISQ mediates between Perceived Organizational Support and Objective
Organizational Performance (EPS, ROE, & ROA)

106
3.3.5. Role Stress, ISQ, and Organizational Performance
An increased amount of stress felt by the employees can significantly hamper the
employee’s ability to perform that can seriously obstruct attainment of organizational
objectives. Literature on Role Stress in the present study has been determined by Role
Ambiguity and Role Conflict. Research has shown negative influence of role stress on
organizational performance, similarly the inverse relationship between role stress and ISQ is
also evident. Research may results from a number of factors that may include lack of
resources, improper communication, increased workload or uncertainty (Ongori & Agolla,
2008). An Organization will not be able to fulfill its objectives if it fails to address the issues
that foster role stress. Similarly an employee who is stressed due to the aforementioned
factors will not be in a positive to offer quality service to the fellow employees. Since,
employee’s behaviour would not be conducive towards the coworkers. An individual stressor
that provokes dissatisfaction from the job will eventually release the employee’s ties to the
organization. This removal of ties results in lack of concern for the coworkers and the
organizational itself. Based on the literature on the relationship among role stress, ISQ and
organizational performance, following relationships are hypothesized.
H5a: There is a significant impact of Role Stress on ISQ
H5b: There is a significant impact of Role Stress on Perceived Organizational Performance
H5c1-2-3: There is a significant impact of Role Stress on objective organizational performance
(EPS, ROE, & ROA)
H5d: ISQ mediates between Role Stress and Perceived Organizational Performance
H5e1-2-3: ISQ mediates between Role Stress and Objective Organizational Performance (EPS,
ROE, & ROA)

107
3.3.6. Internal Marketing, ISQ, and Organizational Performance
Although marketing as a concept has mostly been applied to the external customers.
However, in modern management and with the advent of new tools and techniques to foster
both employee and organizational performance, marketing like approaches have also been
formulated for employees who can also be referred to as internal customers. Internal
marketing can offer a course for the organizations to develop long lasting relationship
between staff (Ballantyne, 2000). IM as a strategy can help employees buy into the activities
of the business, once the employees start to believe the strategies of the organization they are
in better positive to persuade external customers. IM can help employees in establishing
enhanced coordination, integration, and internal functionality (Rafiq & Pervaiz, 2000). All
this can certainly enhance the quality of service provided to the external customer and hence
can aid in attaining higher financial gains (Lings & Greenley, 2009). In order to better
comprehend the relationship among internal marketing, ISQ, and organizational performance,
the following hypotheses are proposed.
H6a: There is a significant impact of Internal Marketing on ISQ
H6b: There is a significant impact of Internal Marketing on Perceived Organizational
Performance
H6c1-2-3: There is a significant impact of Internal Marketing on objective organizational
performance (EPS, ROE, & ROA)
H6d: ISQ mediates between Internal Marketing and Perceived Organizational Performance
H6e1-2-3: ISQ mediates between Internal Marketing and Objective Organizational
Performance (EPS, ROE, & ROA)
H7a: There is a significant impact of ISQ on Perceived Organizational Performance
H7b1-2-3: There is a significant impact of ISQ on objective organizational performance (EPS,
ROE, & ROA)

108
3.4. Summary
The chapter describes in detail the conceptual framework developed for the present
research study. The conceptual framework portrays hypothesized relationship between
different internal organizational factors, internal service quality and organizational
performance.
The conceptual framework can be divided into three halves, with the first focused on
establishing the direct relationship between different internal organizational factors and
organizational performance, the second seeks to establish the direct relationship between
different internal organizational factors and ISQ, while the third seeks to ascertain whether or
not ISQ mediates the relationship between different internal organizational factors and
organizational performance. Finally, based on the theoretical model, specific testable
hypotheses are proposed. The following chapter explain the research methodology
undertaken for the research.

109
Chapter 4
Research Methodology
This chapter presents in detail the research methodology adopted for the study. The
chapter explains the steps taken to investigate the mediating role of internal service quality
(ISQ) on the linkage between internal organizational factors and organizational performance.
The chapter discusses methodological details like population, sample, variables, selected
instruments, data collection, tools for analysis, and rationale behind their selection.
4.1. Research Philosophy
The present study is a survey research based on the positivist research paradigm.
Positivism asserts that it is possible to capture reality through the use of research instruments
such as experiments and questionnaires (Blaxter, Hughes, & Tight, 2006), it is a kind of
deductive approach that proves or disapproves hypotheses of a research (Green, 2008).
However, the mainstay of positivism is the use of quantitative approaches (Blaxter, Hughes,
& Tight, 2006).
Robson (2002) identified 5 stages through which positivist research goes
Deduction of hypothesis from theory
Expression of hypothesis in operational terms
Testing the operational hypothesis
Examination of specific outcome of the inquiry
If necessary, modification of the theory
The following tabulated characteristics testify that the research falls in positivist
paradigm as it matches to the criterion identified by Easterby-Smith, Thorpe, and Lowe
(2002) for such research.

110
Table 4.1
Characteristics of Positivism
Elements Characteristics
The Observer Must be independent The researcher was not part of proposed population for the
study
Human Interest Should be irrelevant No self interest in the results or responses with no
relevancy to any bank.
Explanations Must demonstrate
causality
The research is based on identifying the effect on criterion
variable in numerical terms, showing how the correlation
carry effect of an independent variable on the dependent
variable.
Research progress Hypotheses and
deduction
Based on extensive literature review to propose
empirically testable hypotheses
Concepts Need to be
operationalized so they
can be measured
All variables are operationalized based on detailed review
of existing literature and measured quantitatively
Units of Analysis Should be reduced to the
simplest terms
Respondents include employees working at different
branches of the banks.
Generalization Statistical probability Inferential Statistical techniques are used to generalize
results through identification of level of significance
Sampling Required Large numbers selected
randomly
Stratified random sampling technique is used.
The study commenced with a review of the existing literature, during this stage the
variables were studied, with emphasis on their concepts and measurement, relationships
between variables identified. Based on the review of the literature, a theoretical framework was
proposed and hypotheses formulated. Further to hypotheses development, data were collected
through questionnaires, and it was further analyzed and interpreted to substantiate the
hypothesis. Further the results would be discussed in light of the existing studies.

111
The research is an integration of constructs which will be the basis of investigation in
relation to the data collected through a survey from the banks operating in Peshawar, Pakistan.
Using Statistical Package for the Social Science (SPSS), Version 20, and AMOS the data were
analyzed.
4.2. Nature of Research
The research is a mix of quantitative and qualitative nature, as the quality variables
are qualitative in nature and the data acquired, analyzed is quantified & subjected to
statistical techniques to obtain the findings. The study involved attaching numbers to measure
the variables through adaptation of questionnaires, and responses were quantified. A
quantitative survey was conducted to measure variables using a structured questionnaire.
4.3. Research Design
Research design can be thought of as the logic or master plan of a research that throws
light on how the study is to be conducted. Research design is required to identify the way in
which the requisite data can be gathered and analyzed to arrive at a solution (Sekaran, 2003).
The research design of current research included several key steps in the process as shown in
Figure below.

112
Figure 4.1. Research Design
4.4. Population
Population refers to the entire group of people, events, or things of interest that the
researcher wishes to investigate (Sekaran, 2003). The population frame for the study was
drawn from the banks listed in Karachi Stock Exchange (KSE) having over five branches
operating in Pakistan and the city of Peshawar. The banks include the ones which are
controlled centrally by the head offices hence it is assumed that different factors studied in
Peshawar would be similar all over Pakistan. The banks selected should have more than five
Purpose of Study
Types of Investigation
Researcher Interference
Study Setting
Sampling
Instrument
Development
Data Collection
Hypotheses Testing
Descriptive cum Correlational
Minimal: Studying events as they normally occur
Noncontrived
Stratified Random Sampling
Review of Existing Scales/Questionnaires
Questionnaire Measurement Scale
Pre-Testing of Questionnaire
Distribution and Collection Questionnaire
Personal Visits
Postal survey
Data Analysis Descriptive Statistics, Reliability, Validity, Correlation
and Regression

113
branches in order to have a representative sample. Out of 24 banks listed in KSE, banks with
more than five branches in the city were included in the study. The list of sample frame or
working population of the research study of February 2014 is tabulated below.
Table 4.2
Sample Frame
S.No Banks Total No of Branches
operating in
Peshawar
Total No. of
Employees in
Peshawar
Large Banks
1 Allied Bank Limited 34 238
2 Bank Al-Falah 13 137
3 Habib Bank Limited 27 201
4 National Bank Limited 21 262
5 United Bank Limited 27 159
6 MCB Bank 27 323
Subtotal 149 1320
Medium Banks
7 Bank Al-Habib 9 97
8 Askari Bank 7 104
9 Faysal Bank 9 130
10 Meezan Bank Limited 11 144
11 Bank of Khyber 14 161
Subtotal 50 636
199 1956
4.5. Sample
A sample is referred as a subset of the population, which is truly representative and
proportionate to the strata in the population (Sekaran, 2003). The most accurate way of
research is census, but due to constraint of time, money and resources mostly survey adopt

114
sample (Bajpai, 2011). The stratified random sampling technique is utilized as taking a
random sample may not lead to accurate results since they may not be truly representative of
the population, as with the increase in the magnitude of bank, the timing of service, stress,
learning opportunities would change. It is for this purpose stratified random sampling
technique has been adopted. The groups should be relatively homogeneous and the strata
should contrast with each other (Bajpai, 2011). The banks were divided into two strata,
Medium and Large Banks, since smaller banks had less than or equal to 5 branches in
Peshawar they were excluded from the study. For multivariate research, the sample size
should be at least 10 times or more than the number of variable in the research (Sekaran,
2003). Roscoe (1975) proposed that a sample size of over 30 and less than 500 is appropriate
for most researches and in studies where sample are broken into subsamples (Male/Female,
Conventional/Islamic, or Junior/Middle/Senior), a minimum sample size of 30 in each
category is necessary in each dimension. The total population in the present study is 1956,
based on the sample size calculation for a given population size by Sekaran (2003), it was
decided to take a minimum sample size of 322.
Banks with total assets in excess of Rs. 500 billion is categorized as “Large Banks”,
banks with total assets in between Rs. 100 billion to Rs. 500 billion is categorized as
“Medium Size Banks”. The research adopted the stratified random sampling technique,
distributed population in homogeneous groups of medium and large banks.
4.6. Measurement
Data collection through the survey is an appropriate technique since it allows the
researcher to target a large number of elements in the population and thus reliable and valid
information collected from the selected sample can be generalized over the entire population
(Kerlinger & Lee, 2000).
115
In order to investigate the mediating role of ISQ between internal organizational
factors and organizational performance, both primary and secondary data has been collected.
A questionnaire has been used to collect primary data from bank employees, while financial
performance data has been collected from annual bank reports. A rating scale with anchors
from strongly agree to strongly disagree have been used as an option for each statement. Each
option was assigned a rating scale. 1 = Strongly Disagree, 2 = Disagree, 3 = Somewhat
Disagree, 4= Neither Agree nor Disagree, 5 = Somewhat Agree, 6 = Agree, 7 = Strongly
Agree.
The questionnaire was divided into two sections. Section A consisted of questions
pertinent to personal and job related information primarily categorical in nature measured on
nominal and ordinal scale. Section B consisted of perceptual questions relating to
independent, mediating and dependent variables. Three years data relating to financial
performance were taken from the financial reports of the banks submitted available on the
bank's website. Return on Equity (ROE), Earning per Share (EPS), and Return on Assets
(ROA) were the objective measures of organizational performance used in the study.
For measuring the constructs of interests in the present study, scales were adapted
from established measures from existing studies. However a few minor changes were made,
like the original scale had the question “I am proud to tell others that I am part of this
organization”, this was changed to “I am proud to tell others that I am part of this Bank”.
Each of the construct along with their source and items is further discussed.
4.6.1. Internal Service Quality
ISQ was measured by a scale developed by Kang, James and Alexandris (2002). Five
dimensions were identified from ISQ scale, namely Reliability, Assurance, Tangibles,
Empathy and Responsiveness with reliability of .922, .908, .872, .938 and .938 respectively

116
in the original study. Tangibles dimension was not included in the study. A total of 18 items
made up the ISQ scale.
Table 4.3
Internal Service Quality Scale
Scale Items
Reliability
1. In my bank coworkers provide service that is promised
2. In my bank coworkers are dependable for handling my problems
3. In my bank coworkers perform services right the first time, to avoid having to make corrections later
4. In my bank coworkers provide correct and necessary information
5. In my bank coworkers are reliable
Assurance
1. In my bank I can trust my coworkers
2. In my bank I feel safe in dealing with coworkers
3. In my bank coworkers are polite and kind
4. In my bank coworkers are knowledgeable
Empathy
1. In my bank coworkers are sincerely concerned about problems
2. In my bank we have convenient working hours
3. In my bank coworkers give me individual attention
4. In my bank coworkers seem to have each other best interests in mind
5. In my bank coworkers are sensitive to my work-related needs
Responsiveness
1. In my bank my communication with coworkers is appropriate, accurate and clear
2. In my bank coworkers respond quickly and efficiently to my request
3. In my bank coworkers are willing to help me
4. In my bank coworkers are willing to accommodate special requests and needs

117
4.6.2. Organizational Learning
The organizational learning scale utilized in the present research has been developed
on the instruments devised by García-Morales, Lloréns-Montes, Verdú-Jover (2007) and
Spicer & Sadler-Smith (2006). A few items were removed from Spicer & Sadler-Smith
(2006) scale after discussion with experts and bank executives since they weren’t relevant to
the banks. Organizational learning scale consisted of a total of eight statements. Higher rating
on the organizational learning scale referred to developed degree of organizational learning.
Table 4.4
Organizational Learning scale items
Scale Items
1. This is an open organization and as much information as possible is made available to employees.
2. There exists two-way communication between employees of all levels
3. Feedback system on services is provided to customers and employees
4. The bank has learned or acquired much new and relevant knowledge over the last few years.
5. The learning and development process has helped the bank employees to acquire new skills
6. The learning and development process has helped in building capacities for sustained organizational
effectiveness
7. The Bank’s performance has been influenced by new learning it has acquired over the last few years.
8. The organization is a learning organization.
9. We actively encourage employees and customers to let us know if we are going wrong in the way
we do things and to let us know how we can improve.
4.6.3. Organizational Collaborative Culture
In order to measure organizational collaborative culture, scale developed by López,
Peón, & Ordás (2004) was utilized for the study. López, Peón, & Ordás (2004) developed the
scale to measure the influence of organizational culture on knowledge management.
Originally there were 8 items in the scale, a higher value of the organizational culture referred

118
to a strong culture. López, Peón, & Ordás (2004) removed two items as part of the validation;
reliability for the 6 items was from the study of López, Peón, & Ordás (2004) was reported to
be .848.
Table 4.5
Organizational collaborative culture scale items
Scale Items
1. The bank considers change to be natural and necessary
2. The bank considers individuals as an asset and tries to appreciate them continuously
3. Everybody’s opinions and contributions are respected
4. Problems are discussed openly, to avoid finding culprits
5. Collaboration and co-operation among the different duties
6. In general, all departments are aware of consumer satisfaction
7. Individuals who experiment and take reasonable risks are well considered even if they should be
mistaken
8. The preservation of different point of views is encouraged
4.6.4. Organizational Commitment
Organizational commitment was measured by the nine-item short version of the
Organizational Commitment Questionnaire (OCQ) developed by Mowday, Steers and Porter
(1979).
Table 4.6
Organizational Commitment Scale
Scale Items
1. I am willing to put in a great deal of effort beyond that normally expected in order to help this bank
be successful.
2. I talk up this bank to my friends as a great organization to work for.
3. I would accept almost any type of job assignment in order to keep working for this bank

119
4. I find that my values and the bank's values are very similar.
5. I am proud to tell others that I am part of this bank.
6. This bank really inspires the very best in me in the way of job performance.
7. I am extremely glad that I chose this bank to work for, over others I was considering at the time I
joined.
8. I really care about the fate of this bank.
9. For me this is the best of all possible banks for which to work.
4.6.5. Perceived Organizational Support
Perceived Organizational Support was measured through the scale developed by
Chiang & Hsieh (2012) based on Rhoades, Eisenberger and Armeli (2001) construct of
perceived organizational support. The reliability for POS in the study by Chiang & Hsieh
(2012) was reported to be .772.
Table 4.7
Perceived Organizational Support Scale
Scale Items
1. My bank cares about my opinions
2. My bank really cares about my well being
3. My bank strongly considers my goals and values
4. Help is available from my bank when I have a problem
5. My bank would forgive an honest mistake on my part
4.6.6. Role Stress
Role stress is characterized by role ambiguity and role conflict. Both factors are
measured by instrument developed by Agarwal and Ramaswami (1993). Role ambiguity is
measured by 5 items while role conflict is measured by a total of 6 items. A higher rating of
role ambiguity and role conflict shows increased role stress. In the original study Cronbach’s

120
Alpha for Role Ambiguity was reported to be .89, while reliability for Role Conflict was
reported to be .73, both values are over the acceptable value of .70.
Table 4.8
Role Stress Scale
Scale Items
Role ambiguity
1. I don’t have clear, planned goals and objectives for my job.
2. I am not always sure that I have divided my time properly between tasks.
3. I don’t know what my responsibilities at work are.
4. I don’t know exactly what is expected of me at work.
5. It is not explained clearly what tasks have to be done.
6. There are no clear planned goals and objectives for my job.
Role conflict
1. I receive assignments without the resources to complete it.
2. I receive assignments without adequate resources and materials to execute it.
3. I have to break a rule or policy in order to carry out assignments.
4. I do things that are apt to be acceptable by one person but not by others.
5. I receive incompatible requests from two or more people.
6. I work under incompatible policies and guidelines.
7. I work with two or more groups who operate quite differently.
8. I have to do things that should be done differently.
4.6.7. Internal Marketing
The construct for internal marketing was developed by Foreman and Money (1995).
The original scale had a total of 15 items. Foreman and Money (1995) identified three
dimensions of internal marketing, namely Development, Rewards and Vision. The alpha for
the entire scale in the original study was reported to be .94, which is very acceptable.

121
Table 4.9
Internal Marketing Scale
Scale Items
1. Our bank offers employees a vision that we can believe in.
2. Our bank’s vision is well communicated to all employees.
3. This bank prepares employees to perform well.
4. Our bank views the development of knowledge and skills in employees as an investment rather than
a cost.
5. Skill and knowledge development of employees happens as an ongoing process in our bank
6. We teach our employees “why they should do things” and not just “how they should do things”.
7. This bank goes beyond training and educates employees to work together.
8. This bank measures and rewards employee performance that contributes most to our bank’s vision.
9. Data gathered from employees is used to improve jobs, and to develop strategy of the bank
10. In our bank, those employees who provide excellent service are rewarded for their efforts.
11. In this bank, employees are properly trained to perform their service roles
12. The bank places considerable emphasis on communication with employees
13. This bank has the flexibility to accommodate the differing needs of employees
14. Our performance measurement and reward systems encourage employees to work together
15. Our bank communicates to employees the importance of their service roles
4.6.8. Subjective Organizational Performance
Subjective organizational performance was measured using the scale developed by
Tseng (2010). A total of 5 items made up the scale with reliability reported to be .913 in the
original study. A higher rating of organizational performance by respondents meant better
organizational performance.

122
Table 4.10
Subjective organizational performance scale items
Scale Items
1. The bank has made a vital improvement in the finance and performance over past few years
2. The bank has made a vital improvement in the relationship between an organization and its
customers over past few years
3. The bank has made a vital improvement in organizational effectiveness and efficiency (e.g. timing of
launching new products or services) over past few years
4. The bank has made a vital improvement in human resources development (e.g. employee skills,
personnel development, etc.) over past few years
5. The bank has made a vital improvement in preparing for the future (e.g. quality/depth of strategic
planning, indicators of partnerships and alliances) over past few years
4.6.9. Objective Organizational Performance
In order to measure the objective organizational performance, book based measures of
organizational performance were utilized. Annual reports were consulted for this purpose.
Following books based measure were used from 3 years annual report of the banks.
Earnings Per Share
Return on Equity
Return on Assets
4.7. Pre-testing
Dillman (2000) identified four stages for the validation of survey instrument. The four
stages are discussed in detail below
4.7.1. Stage-1 - Content validity
Content validity refers to degree to which the content of the items adequately represents
the universe of all relevant items under study. One way to determine content validity is to

123
present the instrument to a panel of judges (Cooper & Schindler, 2003). Initially content
validation was performed by the researcher, supervisor and co-supervisor. In the next phase the
questionnaire was presented to Head of Department, three doctoral candidates, 2 experts from
banking sector. The panel in both phases were asked to
1. Review the questions, and recommend changes
2. Recommend addition or removal of items from the instrument
3. To suggest if the scales required any changes
The following table shows the items that were removed after through consultation amongst the
panel to evaluate content validity.
Table 4.11
Items removed at content validity stage
Construct Items Removed
Organizational Culture Individuals who experiment and take reasonable risks are well
considered even if they should be mistaken
Role Conflict I work with two or more groups who operate quite differently.
4.7.2. Stage Two: Readability
The second stage involves readability of the research instrument, for the purpose of
ascertaining readability of the questionnaire, fellow colleagues, some bank employees were
asked to evaluate the research instrument, the respondents were asked to assess whether the
wording used in the research questionnaire is easy to understand; whether the questions do not
take much time in interpretation; whether items in the questionnaire are not to lengthy and
whether the readers would not lose the concept of the items in case the items get lengthy.

124
4.7.3. Stage Three: Pilot Study
Before the actual data collection, a pilot study was conducted in order to evaluate the
instruments that were to be used for actual data collection phase. The objective of the pilot
study was to ascertain the reliability of the constructs, whether the questionnaire is easy to
understand, and to improve the questionnaire in terms of sentence structure and phrasing of
items, if needed. 40 questionnaires were distributed among different bank employees and
discussion was held. Data collected was analyzed using SPSS. Table 19 shows the list of
items that were removed from further research from each construct due to low reliability and
mismatch with the banking sector. The mismatch was assessed after thorough discussion with
the supervisor and executive from different banks.
The second stage in pilot testing involved comparing subjects responses between two
cities. This was done to ensure that the responses between two cities are not significantly
different from each other. The objective measures are taken from the annual reports covering
measures based on the performance of bank as a whole. A total of 80 responses were
gathered and compared between the two cities. Overall results revealed no significant
difference in the means of the different constructs in the study. The reason for the lack of
difference could be attributed to the centralized bank structure, with all banks operating under
the policies outlined by State Bank of Pakistan. The following table shows the results of
mean comparison.
Table 4.12
Mean Comparison for Constructs
Construct t Sig.
Organizational Learning .967 .336
Collaborative Culture 1.481 .143

125
Organizational Commitment -.177 .860
Internal Marketing .773 .442
Role Stress -.395 .694
Perceived Organizational Support 1.648 .103
Internal Service Quality
Reliability .372 .711
Assurance -.168 .867
Empathy .507 .614
Responsiveness -.153 .879
Organizational Performance -1.652 .103
Table 4.13
Items removed during pilot testing stage
Construct Items Removed
Organizational Learning We actively encourage employees and customers to let us know if we are going
wrong in the way we do things and to let us know how we can improve.
Organizational Culture The preservation of different point of views is encouraged
Internal Marketing This bank has the flexibility to accommodate the differing needs of employees
Organizational Commitment For me this is the best of all possible banks for which to work.
Role Stress
Role Ambiguity There are no clear planned goals and objectives for my job.
Role Conflict I have to do things that should be done differently.
4.7.4. Stage Four: Mistake Elimination
In the final stage the modified instrument was examined and any mistakes that might
have gone unnoticed, were removed.

126
4.8. Data Collection
The research setting for this study was Public and Private Sector Banks in KPK. The
research primarily focused on the primary sources of data collected through research
questionnaire. The respondents includes branch bankers working at different levels within the
Banking sector.
The data was collected through questionnaires distributed through personal visits made
to the banks, emails and posts. Measurement used was a seven points rating Scale. Secondary
data were to be obtained from relevant research that includes conference proceedings, annual
reports, and research journals.
A total of 564 questionnaires were distributed in 80 different branches of medium and
large sized banks. In the present study 404 questionnaires were returned, constituting the
response rate of 71.63. A total of 63 questionnaires were rejected. The total number of
questionnaires usable for the study was 341. The following table summarizes the banks
selected as sample, questionnaires distributed, questionnaires returned and questionnaires
usable.
Table 4.14
Questionnaires Response Details
S.N
o Bank
No. of
Branches
No of
Employees
Questionnaires
Returned
Usable
Questionnaires
1 Allied Bank Limited 10 57 37 30
2 Bank Al-Falah 7 46 35 32
3 Habib Bank Limited 9 57 37 34
4 National Bank Limited 7 54 41 36
5 United Bank Limited 10 55 38 33
6 MCB Bank Limited 7 50 36 29
7 Bank Al-Habib Limited 5 35 22 10
8 Askari Bank 5 46 36 33
9 Faysal Bank Limited 5 35 23 18
10 Meezan Bank 7 51 38 32
11 Bank of Khyber 8 78 61 54
Total Number of Branches 80 564 404 341

127
4.9. Data Analysis
The research analysis was combination of descriptive and inferential statistical analysis.
The tools and details of each type of analysis are explained below.
4.9.1. Descriptive Analysis
Descriptive data analysis is used to describe the data. Descriptive statistics are used to
summarize and present data in a form that is easy for the reader to understand. Such
summaries of data, which may be tabular, graphical, or numerical, are referred to as
descriptive statistics(Anderson, Sweeney, & Williams, 2011).Descriptive statistics also help
researchers detect sample characteristics that may influence their conclusions (Thompson,
2009). Descriptive statistics are often said to be univariate in nature because only one
variable is involved in it (Huck, 2012). Descriptive statistics used in the present study seek to
discover any anomalies in the data by analyzing frequencies for each variable. Skewness and
kurtosis values were analyzed to check for distribution. The rule of thumb for skewness and
kurtosis is that the values that fall between +2.00 to -2.00 are considered normal (Lomax &
Hahs-vaughn, 2012; De Laurentis, Maino, & Molteni, 2011).It is however important to note
that sample size do have a significant influence on normality. A study investigating with
small samples of 50 or fewer observations, and especially if the sample size is less than 30 or
so, significant departures from normality can have a substantial impact on the results. For
sample sizes of 200 or more, however, these same effects may be negligible (Hair, Black,
Babin, & Anderson, 2009).
4.9.2. Factor Analysis
Factor analysis is used in the study to test the items in each construct quantitatively.
Factor analysis has been extensively used in research for purification of items. Items that do
not load substantially or items violating the predicted factor structure are eliminated. Factor
analysis is used extensively by researchers involved in the development and evaluation of

128
tests and scales. Individual items and questions are analyzed using factor analytic techniques,
the items are refined and reduced (Pallant, 2011). Factor analysis is further utilized to
establish validity of the construct.
4.9.3. Validity of Research
One of the criteria for good measurement is validity (Bajpai, 2011).The core essence
of the word validity is captured by the term accuracy (Huck, 2012). Validity is the ability of
an instrument to measure what it is designed to measure (Pellissier, 2007; Bajpai, 2011).
Validity definition is pertinent to findings of the research, put forth by Saunders, Lewis, and
Thornhill (2009) state that validity is concerned with whether the findings are really about
what they appear to be about. Two form of validities are assessed in the present research,
namely convergent and discriminant validity.
4.9.3.1. Construct Validity
Construct validity is particularly important in quantitative research. Construct validity
exists when a measure reliably measures and truthfully represents a unique concept. In order
to establish construct validity, exploratory factor analysis is utilized (Zikmund, Babin, Carr,
& Griffin, 2013). Factors with Eigen values greater than 1 should be identified and items with
factor loadings less than 0.5 should be deleted (Shi & Wright, 2001). To attain construct
validity the researcher must focus on convergent and discriminant validity (Bajpai, 2011).
4.9.3.1.1. Convergent Validity
According to Zikmund, Babin, Carr, & Griffin (2013) convergent validity is
established when the concepts that should be related to each other, are in fact related, highly
reliable scales show convergent validity. All items in a construct shall converge to establish
convergent validity. Convergent validity is established statistically when items that are meant
to converge (measure the same constructs) have similar scores. Exploratory factor analysis
can be utilized to assess when items “load” appropriately on higher order factors (Recker,

129
2013). The uni-factorial nature of variables and constructs confirms the construct validity of
the dimensions under study (Kuei, 1999). Convergent validity through factor analysis is
established when block of items measuring the same construct strongly agree (i-e converge)
in their representation of the underlying construct they were created to measure. This is found
when loadings are high and have narrower range between 0.7 and 0.9, this would result in
greater confidence that all items help in estimation of underlying construct (Widaman, 2010).
Further to factor analysis Average Variance Extracted (AVE) statistic is calculated,
Convergent validity is established if an AVE of 0.5 or greater is achieved for the constructs
(Fornell & Larcker, 1981; Sweeney & Soutar, 2001).
4.9.3.1.2. Discriminant Validity
According to Zikmund, Babin, Carr, & Griffin (2013) discriminant validity refers to
uniqueness or distinctiveness of a construct, discriminant validity is established when a scale
that should not correlate too highly with a measure of a different construct, is in fact not
related. An instrument with high degree of discriminant validity would need to be shown to
correlate poorly (or not at all) with another instrument designed to measure something totally
different (Herbst & Coldwell, 2004). The criterion to evaluate discriminant validity is that
square root of AVE for each construct must be greater than inter-correlations with other
constructs (Bhattacherjee& Sanford, 2006; Kim & Malhotra, 2005; Sweeney & Soutar,
2001).
4.9.4. Reliability Assessment
Apart from validity the other criteria for good measurement is reliability (Bajpai,
2011).The core essence of the word reliability is captured in the term accuracy (Huck, 2012).
Reliability according to Pellissier (2007) deals with the extent to which research finding can
be replicated. According to Nunnally (1978), reliability refers to the extent of measurements
of particular test repeatability. Reliability implies that the instrument should produce

130
consistent results. In short reliability is concerned with the consistency of the research
findings (Hair, Celsi, Money, Samouel, & Page, 2003).
A number of ways are available to measure the reliability of an instrument. One is
Test-retest reliability, it is obtained through repeated measurement of the same respondent or
group of respondents using the same instrument. Results are correlated, the higher the
correlation, the greater is the reliability (Hair et. al., 2003; Herbst & Coldwell, 2004). Split
half reliability is another way that refers to the testing of the summated scores. The scale is
split with the intention to correlate one half with the other. The greater the magnitude of
correlation, the greater the reliability (Herbst & Coldwell, 2004). However the most
recommended and widely used measure of reliability is coefficient alpha (α) or Cronbach’s
(1951) alpha. The range is from 0 to 1. The nearer the value of α to 1 is, the better the
reliability is then. If the value is low, it can be attributed to the items that are too few or there
is very little commonality among the items (Churchill, 1979). Nunnally (1978) suggests that
reliability of 0.5 – 0.6 is sufficient although a coefficient of 0.7 or above is desirable.
Cronbach’s Alpha is used to test reliability in the current study.
4.9.5. Correlation Analysis
Correlation measures the degree of association between variables (Bajpai, 2011). Two
statistics are important while studying correlation. First is the significance of the relationship,
second is the strength of relationship express as Pearson’s r. Value for r ranges between 0 and
±1.A value of 0 shows no linear relationship and a value of ±1.00 specifies a perfect linear
relationship, however there is no direct interpretation for values in between. There are several
guidelines available that show different ranges and the relationships are interpreted
accordingly. The relationships can be described in terms of how closely they approach the
extremes (for example, coefficients approaching 0.00 can be described as “weak” and those
approaching ±1.00as“strong”). The direction of relationship between the variables can either

131
be positive or negative. A positive correlation indicates a direct relationship, such cases are
referred to as high-high, low-low. A negative correlation indicates an indirect or inverse
relationship (i.e., high–low, low–high). High refers to high scores on a variable and low
points to low scores.
4.9.6. Structural Equation Modeling
The present study utilizes structural equation modeling technique to test the
measurement and structural models. Structural equation modeling makes use of different
models to represent relationship among observed variables, the fundamental goal is testing
the theorized model hypothesized and how different constructs are related to each other
(Lomax & Schumacker, 2012). The present study tests regression and basic confirmatory
factor models using structural equation modeling. Modeling is performed in IBM SPSS
AMOS 20.
Confirmatory factor models deals with the measurement models, i.e. the relationship
between the observed measures, indicators or items and the latent variable or factors (Hoyle,
2014). The structural regression models resemble confirmatory factor models; moreover they
also hypothesize the relationships between different constructs in the study. These models
can be used to test or disconfirm theories about explanatory relationships amongst various
latent variables (Raykov & Marcoulides, 2006).
It is imperative that the researchers evaluates whether the data fits the model well. A
number of indices are available to test if the model fits the data well. Model fit refers to how
the data reflects underlying theory; however the issue is by no means agreed. There are a
number of fit indices and there exists a wide disparity in agreement on not only the indices to
report but the cut-offs for different indices (Hooper, Coughlan, & Mullen, 2008).
The SEM literature pinpoints several indices that can be used to evaluate the goodness
of fit of a specified model to the observed data. It is however important to note that there is

132
no agreement on the fit indices that should be reported. There are certain recommendations
available in the literature. Hu and Bentler (1999) recommended reporting, SRMR, CFI, TLI,
and RMSEA. Kashy, Donnerllan, Ackerman, and Russell (2009) suggested CFI or TLI along
with chi-square and RMSEA. Bandalos and Finney (2010) recommended reporting Chi-
Square, CFI, TLI, RMSEA and SRMR. Mueller and Hancock (2010) recommended RMSEA,
SRMR, and at least one of CFI, NFI and TLI. Similarly Widaman (2010) encouraged the use
of chi-square, CFI, TLI and RMSEA. The present study is based on the aforementioned
recommendations and utilizes CMIN, SRMR, CFI, TLI, and RMSEA.
Each of the fit indices has their designated cut-off value. The cutoff value is closed to
.08 for SRMR; and the cutoff value is closed to .06 for RMSEA (Hu and Bentler, 1998)
however the value should not exceed .08. Traditionally the cut off value for CFI is .90 (Wang
& Wang, 2012). Bentler (1990) suggest that CFI and TLI values in the range of .90-.95 are
indicative of acceptable model fit. Brown (2012) asserted that when fit indices fall in the
marginal ranges, it is important to consider consistency of the model expressed by various
types of fit indices. It is thus important to consider and report different fit indices when
evaluating model fit. CMIN is the relative chi-square also called the normed chi-square. This
value equals the chi-square index divided by the degrees of freedom. The criterion for
acceptance varies across researchers, ranging from less than 2 (Ullman, 2001) to less than 5
(Schumacker & Lomax, 2004).
It is important to note that model fit may not be attained in the initial analysis therefore
Anderson and Gerbing (1988) suggested that to improve the model fit, items related to
problematic standard residuals or larger reductions of chi-square were identified and eliminated
one by one for standard residual covariances Brown (2006) recommends a cut off value 2.0

133
Table 4.15
Summary of Recommended fit Indices
Level of Fit Measures
RMSEA SRMR CFI TLI CMIN
≤.08 ≤ .08 ≥ .90 ≥ .90 Between 2 to 5
4.9.7. Mediation Analysis
Mediation is a possible form of interrelationship; mediation involves a set of causal
hypotheses. An independent variable may influence the dependent variable through another
variable referred to as mediating variable. Mediation can either be partial or full, if the effect
of independent variable on dependent variable is entirely transmitted by the mediating
variable, this is referred to as full mediation, if the effect of independent variable on
dependent variable is partly transmitted by the mediating variable, this is referred to as partial
mediation (Warner, 2008). In mediation, the focus is on the mechanism that operates between
two predictors and the criterion variable (Jose, 2012). The landmark work on mediation was
by Baron and Kenny in 1986. Baron and Kenny assert that mediating variable accounts for
the relationship between the independent and the dependent variable. Three multiple
regressions are imperative to perform mediation analysis. The technical procedure to test
mediation as is highlighted by Baron and Kenny, which is described below.
1. Mediating variable is regressed on the independent variable (Independent variable is
the predictor and mediating variable is the criterion variable) providing estimate a.
2. Dependent variable is regressed on the independent variable providing estimate c.
3. Dependent variable is regressed on the indpendent variable and the mediating variable
providing estimate c’ and b respectively.

134
Each of the mediation analysis is shown diagramatically as follows.
Figure 4.2. Diagrammatic Representation of Mediation Analysis
Once the three different regression analyses are performed, it is argued that one can
determine if mediation occurred. The following conditions must be sbstantiated for mediation
to be supported
1. The independent variable must predict the mediating variable in the first regression
2. The independent variable must predict the dependent variable in the second regression
3. The mediating variable must predict the dependent variable in the third equation
A number of possible outcomes are possible in mediation, Meyers, Gamst, and
Guarino (2013) have identified a number of possible results.
1. Full mediation is observed when the direct relationship between independent and
dependent variabel is fully attenuated (Independent variable does not significantly
predict depdendent variable with mediating variable in the model).
2. Partial mediation is observed when the direct relationship between independent and
dependent variable is still significant but less strong with mediating variable in the
model than it was in isolation.
3. No mediation is observed if the direct relationship between the independent and
dependent variable is as strong with mediating in the model as it was in isolation.
4. The direct relationship between the independent variable and dependent variable is
significantly stronger with the mediating variable in the model than it was in isloation.
MV
IV DV
a b
c’
c

135
This results signifies that mediating variable has acted as a supressor variable. This
shows that the presence of mediating variable has enhanced the prediction of independent
variable on dependent variable. The presence of mediating variable has helped in purification
of the relationshipe between the predictor and criterion variable.
Once mediation is performed, Sobel test is utilized to evaluate if the effect of the
mediator is significant. The Sobel test performs a statistical test to see if the indirect path
from the IV to the DV is statistically significantly different from zero. This is the same idea
as the test providing support for partial mediation.
4.10. Summary of Research Methodology
The present study is based on the positivist research paradigm that utilizes research
instruments to collect data and hypotheses generated through literature are approved or
disapproved. The population for the study was drawn from banks listed in KSE operating in
the city of Peshawar. Stratified Random Sampling technique is utilized for the selection of
sample. The factors in the study were quantifiable and have been operationalized in existing
research. Questionnaire was developed based on the instruments in existing research studies.
The survey instrument was passed through four different stages of validation as identified by
Dillman (2000). Furthermore the chapter also discussed the data analysis techniques that
would be utilized to describe the data and test the hypotheses. The following chapter
discusses in detail the sample at hand and the research hypotheses.

136
Chapter 5
Data Analysis and Results
The chapter provides a detail and in-depth analysis of data gathered from different
banks. Initially descriptive statistics are presented including frequencies for categorical
variables and descriptive statistics including measure of central tendency, analysis of skewness
and kurtosis, validity and reliability analysis.
5.1. Descriptive Statistics
5.1.1. Data Screening and Cleaning
It is imperative that the data is screened and cleansed before any analysis is
performed, this would enhance the confidence in the results and would make sure that the
findings and conclusion is appropriate. Every single item from the questionnaire was
reviewed, minimum and maximum values for all different variables were analyzed to make
sure that they fall within the acceptable range.
5.1.2. Demographic Profile of Respondents
The demographic profile of the respondents is presented in this section to provide an
insight into their composition, age, gender, years of education, nature of employment, job rank,
tenure, banking system in which the respondents currently work and designation.
5.1.2.1. Age
The demographic profile of respondents showed that average age of respondents was
33.58, minimum age of a respondent was 20 years while the oldest bank worker in the study
was 59 years old. Respondents were further classified into different categories. The
categories and representation in different categories in presented in the table and chart below.
Majority of the respondents in the study belonged to the age group 30-39 consisting of 144
(42.2%) respondents.

137
Table 5.1
Age Distribution of Respondents
Age Group Frequency Percent
20-29 128 37.5
30-39 144 42.2
40-49 41 12.0
50-59 28 8.2
Total 341 100.0
Figure 5.1. Age wise distribution of respondents
(Source: Field Data)
5.1.2.2. Gender
Gender distribution of the respondents showed that majority of the respondents were
male (n = 289) representing 84.8 % of the sample, while females were (n = 52) constituting
15.2% of the total sample.

138
Table 5.2
Gender distribution of respondents
Gender Frequency Percent
Male 289 84.8
Female 52 15.2
Total 341 100.0
Figure 5.2. Gender wise distribution of respondents
(Source: Field Data)
5.1.2.3. Years of Education
Years of education was measured in number of years. Average years of education were
16.12. Majority of the respondents had sixteen followed by eighteen years of education.

139
Table 5.3
Respondent’s years of education
Years of Education Frequency Percent
14.00 32 9.4
16.00 247 72.9
17.00 11 3.2
18.00 49 14.5
Total 340 100.0
Figure 5.3. Distribution of respondents on years of education
(Source: Field Data)
5.1.2.4. Nature of Employment
Survey respondents were asked to identify they nature of employment with the bank.
46 (13.5%) were on contract while 295 (86.5%) were working with the banks on permanent
basis.

140
Table 5.4
Nature of Employment
Nature of Employment Frequency Percent
Contract 46 13.5
Permanent 295 86.5
Total 341 100.0
Figure 5.4. Respondent’s nature of employment
(Source: Field Data)
5.1.2.5. Job Rank
Respondents job rank was measured on three categories, Junior, middle and senior.
Subjects were asked to identify their job rank. Majority of the respondents were middle
ranked (206) representing 60.4% of the total sample, followed by junior rank employees,
which were 91 (26.4%). A total of 45 (13.2%) senior level employees were part of the study.

141
Table 5.5
Rank distribution of respondents
Job Rank Frequency Percent
Junior 90 26.4
Middle 206 60.4
Senior 45 13.2
Total 341 100.0
Figure 5.5. Distribution by job rank
(Source: Field Data)
5.1.2.6. Tenure
Survey respondents were asked to mention their tenure with the current bank in number
of years. Tenure ranged from .50 to 39. Average tenure was 6.69 years (SD = 7.58).

142
Table 5.6
Descriptive statistics for Tenure
N Min Max Mean Std. Deviation
Tenure 333 .50 39.00 6.6979 7.58016
5.1.2.7. Banking System
Banking system in Pakistan is either conventional or Islamic. Data was collected from
both Islamic and conventional banks. 266 (78%) of the respondents were from conventional
banks while 75 (22%) of the respondents were employed at Islamic banks.
Table 5.7
Respondent’s distribution by banking system
Banking System Frequency Percent
Conventional 266 78.0
Islamic 75 22.0
Total 341 100.0
Figure 5.6. Distribution by Banking System
(Source: Field Data)

143
5.1.2.8. Bank Type
Banks in Pakistan fall under two types, public and private. Data was collected from
both Public and Private sector banks. 90 (26.4%) of the respondents were from Public sector
banks while 251 (73.6%) of the respondents were employed in private sector banks.
Table 5.8
Respondent’s distribution by banking system
Banking System Frequency Percent
Public 90 26.4
Private 251 73.6
Total 341 100.0
Figure 5.7. Distribution by Bank Type
(Source: Field Data)

144
5.1.2.9. Designation
Respondents were asked to reveal their designation at the bank. A total of nine
respondents did not reveal their designation. A number of different designations were found.
This is due to the fact that different banks have established different career ladder and have a
number of designations. Appendix 2 shows the frequency distribution for designation of
respondents in the present study.
5.1.3. Descriptive Statistics of Constructs (Means, Skewness and Kurtosis)
This section presents in detail the descriptive analysis of the different constructs.
Sample Size, minimum & maximum value, measure of central tendency, standard deviation
are presented. For the normality distribution testing the skewness and kurtosis were performed.
All the items have shown the acceptable skewness and kurtosis and can be used in further
analysis.
5.1.3.1. Organizational Learning
The first factor that the subjects in the study responded to was organizational learning.
Organizational learning measured the learning initiatives and their implications. The purpose
of this factor is to understand the level of organizational learning within the banks. In order to
develop this understanding descriptive statistics have been carried out to analyze the factor.
Descriptive statistics results are shown in the following table.

145
Table 5.9
Descriptive Statistics for organizational learning
N Min Max Mean Std. Deviation
OL1 341 1.00 7.00 4.7683 1.68619
OL2 341 1.00 7.00 4.5836 1.63137
OL3 341 1.00 7.00 4.8504 1.58056
OL4 341 1.00 7.00 5.0880 1.64974
OL5 341 1.00 7.00 5.0411 1.57688
OL6 341 1.00 7.00 5.0323 1.54220
OL7 341 1.00 7.00 4.9648 1.52968
OL8 341 1.00 7.00 5.1114 1.54897
Valid N 341
Descriptive statistics table for organizational learning presents that the respondents are
showing that their banks have initiatives for organizational learning and the employees see
their banks believe in organizational learning. Item OL8 has the highest mean of 5.11 implying
that the respondents are of the opinion that the banks they are working for are a learning
organization. It clearly shows that the banks are striving to become a learning organization.
Organizational learning factor was also analyzed for skewness and kurtosis to see
whether the data is normally distributed. The following table shows that all the items were
normally distributed items are as all the four items are in the range of ±2.

146
Table 5.10
Normality distribution testing of organizational learning
N Skewness Kurtosis
Statistic Statistic Std. Error Statistic Std. Error
OL1 341 -.624 .132 -.556 .263
OL2 341 -.598 .132 -.591 .263
OL3 341 -.696 .132 -.255 .263
OL4 341 -.948 .132 .183 .263
OL5 341 -.924 .132 .189 .263
OL6 341 -.945 .132 .273 .263
OL7 341 -.972 .132 .372 .263
OL8 341 -.990 .132 .614 .263
Valid N 341
5.1.3.2. Organizational Commitment
In general, organizational commitment construct measures the employee’s degree of
association with the organization. The construct is operationalized using eight different
questions. The purpose of the construct is to measure and develop an understanding as to how
much an employee identify with the bank. The following table shows the descriptive statistics
for organizational commitment.

147
Table 5.11
Descriptive Statistics of organizational commitment
N Min Max Mean SD
OC1 341 1.00 7.00 5.3812 1.54391
OC2 341 1.00 7.00 5.1290 1.68237
OC3 341 1.00 7.00 5.0938 1.74305
OC4 341 1.00 7.00 4.7683 1.65804
OC5 341 1.00 7.00 5.4223 1.50996
OC6 341 1.00 7.00 4.9619 1.64719
OC7 341 1.00 7.00 5.1554 1.59296
OC8 341 1.00 7.00 5.4047 1.51866
Valid N 341
It is found that the employees have a strong identification with the bank. All items
results of this factor obtained more than five points in mean analysis except OC4 and OC6
which were very close to five indicating that most of the employees share a good level of
attachment and loyalty with the banks.
The following table represents the skewness and kurtosis analyses in which all items
show the acceptable points indicating the normally distributed data in the data set.
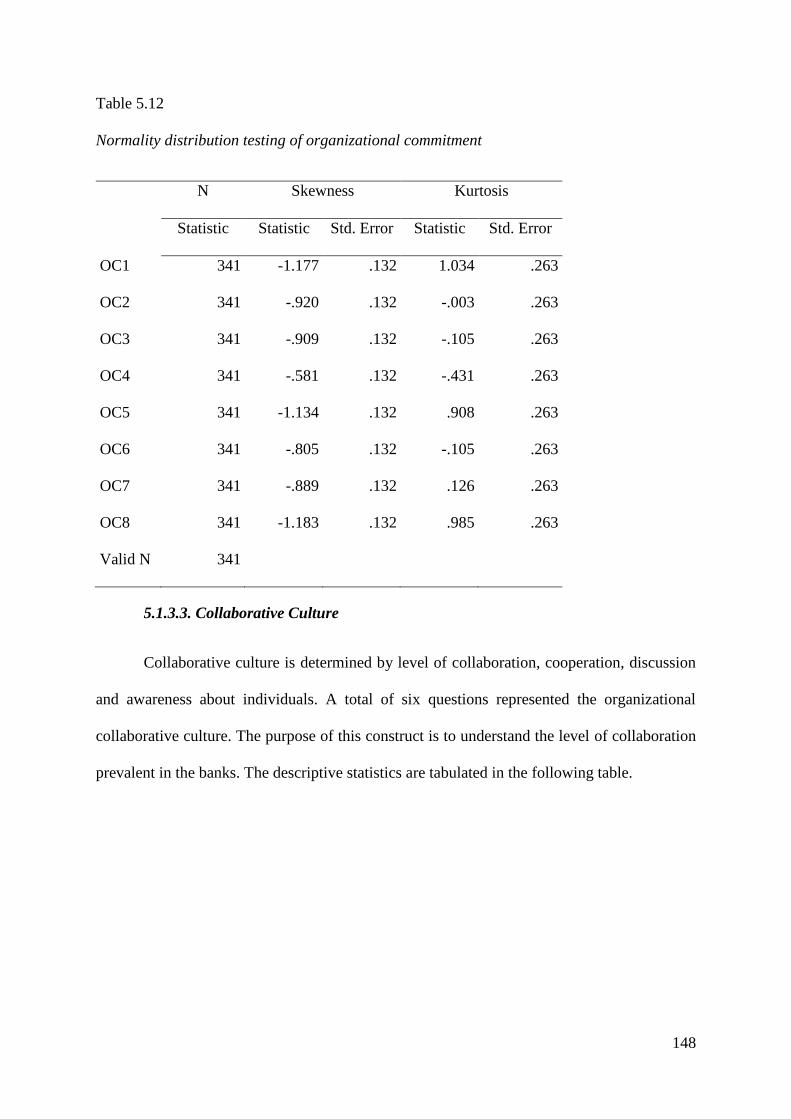
148
Table 5.12
Normality distribution testing of organizational commitment
N Skewness Kurtosis
Statistic Statistic Std. Error Statistic Std. Error
OC1 341 -1.177 .132 1.034 .263
OC2 341 -.920 .132 -.003 .263
OC3 341 -.909 .132 -.105 .263
OC4 341 -.581 .132 -.431 .263
OC5 341 -1.134 .132 .908 .263
OC6 341 -.805 .132 -.105 .263
OC7 341 -.889 .132 .126 .263
OC8 341 -1.183 .132 .985 .263
Valid N 341
5.1.3.3. Collaborative Culture
Collaborative culture is determined by level of collaboration, cooperation, discussion
and awareness about individuals. A total of six questions represented the organizational
collaborative culture. The purpose of this construct is to understand the level of collaboration
prevalent in the banks. The descriptive statistics are tabulated in the following table.

149
Table 5.13
Descriptive Statistics of collaborative culture
N Min Max Mean SD
CC1 341 1.00 7.00 4.8358 1.62046
CC2 341 1.00 7.00 4.5806 1.69864
CC3 341 1.00 7.00 4.4692 1.75811
CC4 341 1.00 7.00 4.4839 1.65846
CC5 341 1.00 7.00 4.8534 1.52881
CC6 341 1.00 7.00 4.9883 1.52427
Valid N 341
Descriptives table indicates that most of the respondents agreed that their banks have a
collaborative culture. All the items of this factor obtained more than 4 points of means. It shows
that the banks have a culture where collaboration is way of doing things. Overall average was
Collaborative culture factor was analyzed for skewness and kurtosis to determine
whether the data are normally distributed. The following table shows that all the items were
normally distributed items are as all the four items are in the range of ±2.

150
Table 5.14
Normality distribution testing of collaborative culture
N Skewness Kurtosis
Statistic Statistic Std. Error Statistic Std. Error
CC1 341 -.813 .132 -.067 .263
CC2 341 -.547 .132 -.662 .263
CC3 341 -.571 .132 -.741 .263
CC4 341 -.526 .132 -.565 .263
CC5 341 -.735 .132 -.048 .263
CC6 341 -.852 .132 .126 .263
Valid N 341
5.1.3.4. Perceived Organizational Support
Perceived organizational support determines the level of support the employees
receive from their organization. Perceived organizational support is taken as a predictor
variable in this research. Five questions pertinent to perceived organizational support form
part of this factor. The purpose if this factor is to establish the level of organizational support
employees perceive that they receive from the organization. The results are tabulated below.

151
Table 5.15
Descriptive statistics for perceived organizational support
N Min Max Mean SD
POS1 341 1.00 7.00 4.2639 1.68928
POS2 341 1.00 7.00 4.5718 1.72310
POS3 341 1.00 7.00 4.4927 1.68840
POS4 341 1.00 7.00 4.6334 1.75498
POS5 341 1.00 7.00 4.2669 1.88860
Valid N 341
Most of the bankers highlighted that they receive a certain level of support from the
organization. The perceived organization support mean value ranged between the scale neither
agree nor disagree (neutral) and somewhat agree. Highest mean value was found for POS4,
showing that the subjects had help available from the bank in case of a problem.
The items of the perceived organizational support factor were also analyzed for
normality distribution testing and the results of the skewness and kurtosis show that all the
items are normally distributed in data set.

152
Table 5.16
Normality distribution testing of perceived organizational support
N Skewness Kurtosis
Statistic Statistic Std. Error Statistic Std. Error
POS1 341 -.497 .132 -.692 .263
POS2 341 -.593 .132 -.604 .263
POS3 341 -.544 .132 -.632 .263
POS4 341 -.555 .132 -.712 .263
POS5 341 -.373 .132 -1.001 .263
Valid N 341
5.1.3.5. Role Stress
This factor measures the level of stress experienced by the bankers in their jobs. To
operationalize this construct, subjects were asked to rate statements on two sub-factors. Role
ambiguity and role conflict.
5.1.3.5.1. Role Ambiguity
The purpose of this construct to understand how much lack of clarity the bankers
experience in their job. A total of five statement were presented to the bankers to rate their
level of role ambiguity. The following tables shows the descriptive statistics for role
ambiguity.

153
Table 5.17
Descriptive statistics for role ambiguity
N Min Max Mean SD
RA1 341 1.00 7.00 2.8563 1.74555
RA2 341 1.00 7.00 2.9413 1.71398
RA3 341 1.00 7.00 2.4018 1.57177
RA4 341 1.00 7.00 2.4868 1.59336
RA5 341 1.00 7.00 2.6129 1.71747
Valid N 341
The statistics show that on average the respondents did not experience role ambiguity,
since most of the responses gathered were between the options disagree and somewhat
disagree. Item RA2 had the highest mean, indicating the only ambiguity most of the
respondents had was clear division of time between tasks. The following table represents the
skewness and kurtosis of role ambiguity factor. All the items fall within the acceptable range.
Table 5.18
Normality distribution testing of role ambiguity
N Skewness Kurtosis
Statistic Statistic Std. Error Statistic Std. Error
RA1 341 .679 .132 -.699 .263
RA2 341 .642 .132 -.742 .263
RA3 341 1.168 .132 .551 .263
RA4 341 1.022 .132 .094 .263
RA5 341 .990 .132 -.031 .263
Valid N 341

154
5.1.3.5.2. Role Conflict
The level of conflict bankers have in performing their job is measured using six
different statements. The following tables shows the descriptive statistics for role conflict.
Table 5.19
Descriptive statistics for role conflict
N Min Max Mean SD
RC1 341 1.00 7.00 3.2698 1.81593
RC2 341 1.00 7.00 3.3284 1.85759
RC3 341 1.00 7.00 2.8387 1.72023
RC4 341 1.00 7.00 3.1701 1.71167
RC5 341 1.00 7.00 3.3402 1.73590
RC6 341 1.00 7.00 2.9853 1.79618
Valid N 341
The statistics show that on average the respondents did experience a little amount of
role conflict, since most of the responses gathered were between the options somewhat
disagree and neither agree nor disagree. Item RC5 had the highest mean, indicating that the
bankers receive a lot of incompatible requests from two or more people.
Skewness and kurtosis statistics of the items of the role conflict factor are presented in
the table below. All the items fall within the acceptable range.

155
Table 5.20
Normality distribution testing of role conflict
N Skewness Kurtosis
Statistic Statistic Std. Error Statistic Std. Error
RC1 341 .350 .132 -1.124 .263
RC2 341 .330 .132 -1.240 .263
RC3 341 .607 .132 -.813 .263
RC4 341 .392 .132 -.902 .263
RC5 341 .271 .132 -1.161 .263
RC6 341 .558 .132 -.930 .263
Valid N 341
5.1.3.6. Internal Marketing
Internal marketing construct seeks to determine if the organization treats its
employees as internal customers and employs ways to enhance communication, morale and
retention of employees. Internal marketing is measured using 14 different items. The
following table shows if the banks utilizes internal marketing means in their bank.
Table 5.21
Descriptive statistics for internal marketing
N Min Max Mean SD
IM1 341 1.00 7.00 4.8592 1.69883
IM2 341 1.00 7.00 4.9384 1.66248
IM3 341 1.00 7.00 4.9795 1.56887
IM4 341 1.00 7.00 4.8944 1.63976

156
IM5 341 1.00 7.00 4.8944 1.56450
IM6 341 1.00 7.00 4.7361 1.55132
IM7 341 1.00 7.00 4.7625 1.67662
IM8 341 1.00 7.00 4.6305 1.67810
IM9 341 1.00 7.00 4.4076 1.68588
IM10 341 1.00 7.00 4.6804 1.67697
IM11 341 1.00 7.00 4.6569 1.63136
IM12 341 1.00 7.00 4.6364 1.62056
IM14 341 1.00 7.00 4.6833 1.64477
IM15 341 1.00 7.00 4.8123 1.56618
Valid N 341
The above table indicates that overall there is lack of complete agreement on the
internal marketing initiatives of the bank since most of the respondents on all items fell
between scale option neither agree nor disagree and somewhat agree.
Assessing the skewness and kurtosis values for normality distribution indicates that
the data was normally distributed.
Table 5.22
Normality testing of internal marketing
N Skewness Kurtosis
Statistic Statistic Std. Error Statistic Std. Error
IM1 341 -.767 .132 -.327 .263
IM2 341 -.868 .132 -.144 .263
IM3 341 -.894 .132 .149 .263
IM4 341 -.760 .132 -.301 .263

157
IM5 341 -.737 .132 -.194 .263
IM6 341 -.537 .132 -.491 .263
IM7 341 -.690 .132 -.467 .263
IM8 341 -.564 .132 -.663 .263
IM9 341 -.477 .132 -.794 .263
IM10 341 -.604 .132 -.593 .263
IM11 341 -.683 .132 -.300 .263
IM12 341 -.599 .132 -.557 .263
IM14 341 -.656 .132 -.490 .263
IM15 341 -.800 .132 -.150 .263
Valid N 341
5.1.3.7. Internal Service Quality
5.1.3.7.1. Reliability
Reliability refers to the ability of employees to provide the service they are intended
or required to. Reliability is a sub-factor of ISQ. The purpose of this factor is to assess if the
coworkers provide correct, timely and necessary information. The following table reveals the
descriptive statistics for reliability.
Table 5.23
Descriptive statistics for Reliability
N Min Max Mean SD
REL1 341 1.00 7.00 4.8739 1.57888
REL2 341 1.00 7.00 4.7947 1.56772
REL3 341 1.00 7.00 4.8915 1.53870

158
REL4 341 1.00 7.00 5.1437 1.43277
REL5 341 1.00 7.00 5.1584 1.54487
Valid N 341
Descriptive statistics show bankers agreement with the reliability of service that
workers receive from the coworkers. Highest average score was found on REL5, showing
that bankers rated their coworkers to be reliable.
Reliability construct was assessed for normality using values of skewness and
kurtosis. The following table shows that normality was attained since the statistics fall in the
acceptable range.
Table 5.24
Normality distribution testing of reliability
N Skewness Kurtosis
Statistic Statistic Std. Error Statistic Std. Error
REL1 341 -.742 .132 -.137 .263
REL2 341 -.771 .132 -.051 .263
REL3 341 -.728 .132 -.096 .263
REL4 341 -.846 .132 .313 .263
REL5 341 -.927 .132 .304 .263
Valid N 341
5.1.3.7.2. Assurance
The second sub-factor of ISQ is assurance. Assurance refers to the feeling of trust,
safety and politeness towards the coworkers. The constructs measures bankers’ perception

159
about their coworkers if there are trustworthy, polite, kind and knowledgeable. The construct
is made of four items. The following table shows the descriptive statistics for assurance
Table 5.25
Descriptive statistics for assurance.
N Min Max Mean SD
ASR1 341 1.00 7.00 5.0821 1.63932
ASR2 341 1.00 7.00 5.2082 1.52452
ASR3 341 1.00 7.00 5.1994 1.50532
ASR4 341 1.00 7.00 5.1378 1.46781
Valid N 341
The results show that there is a good amount of trust that coworkers within the bank
share with each other. Each items average was over 5 (Somewhat Agree).
The following table shows the normality test for assurance using skewness and
kurtosis statistics. The results show that normality was achieved.
Table 5.26
Normality testing for assurance
N Skewness Kurtosis
Statistic Statistic Std. Error Statistic Std. Error
ASR1 341 -.922 .132 .161 .263
ASR2 341 -.977 .132 .492 .263
ASR3 341 -.978 .132 .548 .263
ASR4 341 -.841 .132 .308 .263
Valid N 341

160
5.1.3.7.3. Empathy
Third dimension of ISQ in the study is empathy. Empathy refers to the level of
understanding between the coworkers at the workplace. The purpose of this dimension to
understand if the bankers experienced a caring, individualized attention from their coworkers.
Empathy is measured using five items. The following table shows the descriptive statistics for
empathy.
Table 5.27
Descriptive statistics for empathy
N Min Max Mean SD
EMP1 341 1.00 7.00 5.0029 1.49607
EMP2 341 1.00 7.00 4.4721 1.84947
EMP3 341 1.00 7.00 4.7801 1.60193
EMP4 341 1.00 7.00 4.9120 1.42391
EMP5 341 1.00 7.00 4.8680 1.48429
Valid N 341
Descriptive statistics for empathy reveal that there is a slight agreement to the
perception that employees at empathetic. Higher mean value was obtained for EMP1,
indicating that bank workers are concerned about the problems faced within the bank.
The following table shows the skewness and kurtosis values to test the normality of
empathy dimension of ISQ. All items within the factor have acceptable statistics for
normality.

161
Table 5.28
Normality testing of empathy
N Skewness Kurtosis
Statistic Statistic Std. Error Statistic Std. Error
EMP1 341 -.737 .132 -.028 .263
EMP2 341 -.527 .132 -.855 .263
EMP3 341 -.647 .132 -.338 .263
EMP4 341 -.723 .132 .165 .263
EMP5 341 -.727 .132 .089 .263
Valid N 341
5.1.3.7.4. Responsiveness
The last dimension of ISQ is responsiveness. Responsiveness refers to the willingness
to help employees and provide prompt service. The purpose of this construct is to develop an
understanding how much responsive are the employees towards the needs to their coworkers.
Four different statements were adapted from existing literature to measure responsiveness.
The following table shows the descriptive statistics for responsiveness.
Table 5.29
Descriptive statistics for responsiveness
N Min Max Mean SD
RES1 341 1.00 7.00 5.3021 1.39525
RES2 341 1.00 7.00 5.0616 1.53939
RES3 341 1.00 7.00 5.1525 1.43083
RES4 341 1.00 7.00 5.1525 1.46736
Valid N 341

162
The results reveal that on all items the average score for responsiveness was found to
be over 5. This shows that coworkers were responsive to the service needs of their coworkers.
Higher mean was found for RES1, indicating that the communication was clear and
appropriate.
The following table shows the normality testing using skewness and kurtosis statistics
for responsiveness. All items statistics fell between the acceptable ranges of ±2.
Table 5.30
Normality testing of responsiveness
N Skewness Kurtosis
Statistic Statistic Std. Error Statistic Std. Error
RES1 341 -.989 .132 .554 .263
RES2 341 -.882 .132 .108 .263
RES3 341 -.894 .132 .424 .263
RES4 341 -.996 .132 .764 .263
Valid N 341
5.1.3.8. Organizational Performance
Subjective organizational performance was measured using five statements that not
only asked the respondents to reveal about sales, but also relationship with customers, human
resource development and preparation for the future. The following table shows the
descriptive statistics based on the rating received by each of the statements in the
organizational performance construct.

163
Table 5.31
Descriptive statistics for organizational performance
N Min Max Mean SD
OP1 341 1.00 7.00 5.3666 1.48044
OP2 341 1.00 7.00 5.3490 1.44250
OP3 341 1.00 7.00 5.1290 1.45756
OP4 341 1.00 7.00 5.0352 1.60108
OP5 341 1.00 7.00 5.0792 1.60776
Valid N 341
The descriptive statistics reveal a close agreement of the bank workers to effective
organizational performance. The following table shows the normality testing of organizational
performance construct. All items statistics for skewness and kurtosis fell in the acceptable
range.
Table 5.32
Normality testing of organizational performance
N Skewness Kurtosis
Statistic Statistic Std. Error Statistic Std. Error
OP1 341 -.966 .132 .464 .263
OP2 341 -.917 .132 .393 .263
OP3 341 -.839 .132 .216 .263
OP4 341 -.845 .132 -.021 .263
OP5 341 -.911 .132 .175 .263
Valid N 341

164
5.2. Factor Analysis
After conducting descriptive statistics, factor analysis was performed to identify the
underlying factors. Factor analysis is used to determine what items should be included or
excluded in further analysis. Factor analysis is concerned with whether the covariance or
correlation among a set of observed variables can be explained in terms of a smaller number
of unobservable constructs known as common factors (Landau & Everitt, 2004). Factor
analysis is one of the most commonly used techniques for data reduction and structure
detection. Moreover, it may also be used to decide which items on the scale are to be
included or excluded from the measure.
5.2.1. Assumptions
Before data is factor analyzed, it is important to make sure that data to be analyzed is
appropriate and passes the required assumptions for the analysis. First it is important to make
sure that adequate sample is available for factor analysis. Essentially large enough samples
are required to make sure that the correlations are good representation of their population
values. There are a number of ‘rules of thumb’ proposed to indicate what constitutes a large
enough dataset: there should be at least 200 scores overall (Hinton, 2004). Field (2005)
suggests that the sample size of 300 or over shall provide a stable factor solution. Tabachnick
and Fidell (2001) also suggest that sample size of at least 300 is adequate for factor analysis;
they also suggest 5 cases for each item are adequate. In the present study the sample size is
341, which is adequate for factor analysis. There are 65 items, the ratio of 5 to 1 is also met.
An alternative method to check sample adequacy is Kaiser-Meyer-Olkin (KMO)
measure of sampling adequacy. The data are judged to be factorable if the KMO measure of
sampling adequacy is greater than .60 (Huck, 2012). The KMO statistic ranges from 0 to 1.
Any value over 0.6 is regarded as acceptable for a factor analysis (Pallant, 2011) as values

165
below this would mean that the factor analysis will not be able to account for much of the
variability in the data and so is not worth undertaking (Hinton, 2004).The results for KMO
measure of sampling adequacy revealed values for all constructs close to 1, indicating that the
sampling condition was satisfied for the analysis. The results for KMO measure of sampling
adequacy are summarized in table 53.
Once it is affirmed that the sample is adequate for factor analysis, inter-variable
correlation analysis shall be conducted for the constructs that are to be factor analyzed. To be
considered suitable for factor analysis, the correlation matrix should show at least some
correlations of r = .3 or greater (Pallant, 2011).Situation may arise when inter-variable
correlation may be too high resulting in multicollinearity. Correlation matrix along with the
determinant statistics shall be examined as this option is vital for testing of multicollinearity.
Field (2005) suggests that determinant of R-matrix should be greater than .00001. In case the
value of determinant is less than the prescribed value, variables that correlate highly shall be
eliminated (r > .8). Inter-variable correlation and determinant statistic for each construct was
examined. The results for inter-variable correlation are summarized in the following table.
Table 5.33
Summary of inter-variable correlation
Construct No. of Items Multicollinearity Item(s) removed Items remaining
Organizational Learning 8 OL5-OL6 (OL5) 7
Collaborative Culture 6 - - 6
Organizational Commitment 8 - - 8
Perceived Organizational Support 5 - - 5
Role Stress 11 - - 11
Internal Marketing 14 IM14-IM15 IM15 13
Internal Service Quality 18 ASR1-ASR2 ASR2 14

166
ASR3-ASR4
RES4-RES3
EMP4-EMP5
RES3-RES2
ASR4
RES3
EMP5
Organizational Performance 5 OP4-OP5 OP5 4
Items depicting multicollinearity are deleted from further analysis. Aforementioned
table shows the constructs, the variables with multicollinearity, items removed and items
remaining in each construct.
The second test is the Bartlett’s test of sphericity. This examines the correlation
matrix, fit’s an identity matrix. A significant Bartlett test indicates that correlation matrix is
significantly different from an identity matrix. All construct have a significant Bartlett’s Test
of Sphericity, thus the correlation matrix is significantly different from an identity matrix.
For factor analysis in the present study principal component analysis with varimax
rotation is used. The most commonly used approach for factor analysis is principal
components analysis (Pallant, 2011; Huck, 2011; Bajpai, 2011). The most popular rotation
method used is varimax rotation (Huck, 2012).
An important step in factor analysis is the decision on the number of factors that shall
be extracted. One of the most commonly used techniques is known as Kaiser’s criterion, or
the eigenvalue rule. Using this rule, only factors with an eigenvalue of 1.0 or more are
retained for further investigation (Pallant, 2011). Thus, big eigenvalues imply useful factors,
whereas small eigenvalues imply superfluous factors. When researchers apply Kaiser’s
criterion, factors are retained only if they have eigenvalues larger than 1.0. The present study
utilizes eigenvalue to retain factors.

167
Once a factor structure has been found, next step is to decide which variables make up
which factor (Field, 2005). The minimum factor loading criteria was set 0.50 which is
considered higher (Leech, Barrett, & Morgan, 2005).
Table 5.34
Assumptions’ statistics for factor analysis
Construct DCMa KMOb BTSc
Sig
Organizational Learning .019 .888 1331.463 .000*
Collaborative Culture .054 .862 983.846 .000*
Organizational Commitment .008 .920 1609.251 .000*
Perceived Organizational Support .071 .869 894.402 .000*
Role Stress .000 .881 2571.749 .000*
Internal Marketing .00002 .950 3580.413 .000*
Internal Service Quality .00002 .935 3553.091 .000*
Organizational Performance .087 .804 825.139 .000*
a Determinant of Correlation Matrix
b Kaiser-Meyer-Olkin Measure of Sampling Adequacy
c Bartlett's Test of Sphericity
* p<.001
5.2.2. Component Matrix
After testing the assumptions on each of the construct they were subjected to factor
analysis. Factor analysis results for each construct are described in this section.

168
5.2.2.1. Organizational Learning
Organizational learning construct was subjected to factor analysis. A total of seven
items in the construct organizational learning were factor analyzed. The results showed one
factor solution. All items shows loading over .70 which is well over the acceptable factor
loading value. No items were removed, and all items represented the underlying factor
organizational learning.
Table 5.35
Component Matrix for Organizational Learning
Construct/Variables Loadings
Organizational Learning
OL1 .715
OL2 .718
OL3 .795
OL4 .824
OL6 .828
OL7 .827
OL8 .787
5.2.2.2. Organizational Commitment
Organizational commitment construct comprised of 8 items. All items loaded well
above the cut off score of .50 onto a single factor. Thus all items in the factor represent the
underlying latent variable organizational commitment.

169
Table 5.36
Component Matrix for organizational commitment
Construct/Variables Loadings
Organizational Commitment
OC1 .672
OC2 .850
OC3 .797
OC4 .751
OC5 .817
OC6 .804
OC7 .835
OC8 .789
5.2.2.3. Collaborative Culture
A total of six items were part of the collaborative culture. All items were loaded onto
a single factor with all loading over .70. No items were removed, and all items represented
the underlying factor organizational collaborative culture.
Table 5.37
Component Matrix for Organizational collaborative culture
Construct/Variables Loadings
Collaborative Culture
CC1 .739
CC2 .805
CC3 .849
CC4 .767
CC5 .835
CC6 .720

170
5.2.2.4. Perceived Organizational Support
Perceived organizational support construct comprised of 5 items. Factor loadings
table showed that except POS5 which had the lowest loading of .667 still above the cut off
score, all items had loading over .80. The uni-factorial structure indicates that the items
represent the underlying dimension of perceived organizational support.
Table 5.38
Component Matrix for perceived organizational support
Construct/Variables Loadings
Perceived Organizational Support
POS1 .825
POS2 .878
POS3 .886
POS4 .833
POS5 .667
5.2.2.5. Role Stress
Role stress construct comprised of 11 items resulted in two distinct factor. Factor one
with had 5 items and represented role ambiguity. Factor two had 6 items and represents role
conflict. No items were removed from the analysis and all items had acceptable loadings.
Table 5.39
Component Matrix for role stress
Construct/Variables Loadings
Role Stress
Role Ambiguity

171
RA1 .712
RA2 .682
RA3 .870
RA4 .876
RA5 .794
Role Conflict
RC1 .792
RC2 .806
RC3 .824
RC4 .792
RC5 .829
RC6 .768
5.2.2.6. Internal Marketing
Internal marketing construct comprised of a total of 13 items. Factor analysis revealed
a single factor solution with all items loading well above the cutoff point. The following table
shows the loadings for internal marketing construct.
Table 5.40
Component matrix for internal marketing
Construct/Variables Loadings
Internal Marketing
IM1 .755
IM2 .811
IM3 .844
IM4 .836
IM5 .809
IM6 .790

172
IM7 .775
IM8 .848
IM9 .708
IM10 .798
IM11 .796
IM12 .834
IM14 .810
5.2.2.7. Internal Service Quality
ISQ is comprised of 14 items. Factor analysis revealed a two factor solution. The first
was named Reliability while the second was named Empathy and Responsiveness. First
factor had a total of six items. Seven items loaded onto the second factor. One item cross
loaded onto both the factor and hence was removed from further analysis.
Table 5.41
Component matrix for internal service quality
Construct/Variables Loadings
Internal Service Quality 1 2
Reliability
REL1 .728
REL2 .808
REL3 .789
REL4 .797
REL5 .807
ASR1 .733
Empathy & Responsiveness
EMP1 .708
EMP2 .729

173
EMP3 .744
EMP4 .749
RES1` .707
RES2 .703
RES4 .710
Item Removed (Cross Loading)
In my bank Coworkers are polite and kind. .526 .529
5.2.2.8. Organizational Performance
The results of factor analysis of the criterion variable organizational performance
reveal a uni-factorial solution. All items loaded substantially well onto a single factor with
loadings over .80.
Table 5.42
Component matrix for organizational performance
Construct/Variables Loadings
Organizational Performance
OP1 .827
OP2 .916
OP3 .880
OP4 .851
5.2.3. Summary of Factor Analysis
Factor analysis on organizational learning, collaborative culture, organizational
commitment, perceived organizational support, internal marketing and organizational
performance revealed that these entire constructs are uni-dimensional. Theoretically role
stress is comprised of role ambiguity and role conflict, all items pertinent to role ambiguity
and role conflict converged to form the two factor that make up role stress. Theoretically ISQ

174
is made of four dimensions, however in the present study factor analysis extracted two
factors, reliability and empathy and responsiveness.
The following table shows the summary of factor analysis for all the factors in the
present study. Additional information that makes part of this table is variance explained.
Bajpai (2011) recommends that the factors explaining 60-70% of the cumulative percentage
of variance should be retained. In the present study all factors have achieved the prescribed
limit.
Table 5.43
Summary of factor analysis
Constructs No. of
items
No. of items
eliminated
Factors
extracted
Variance
explained (%)
Organizational Learning 7 - 1 61.818
Collaborative Culture 6 - 1 61.976
Organizational Commitment 8 - 1 62.573
Perceived Organizational Support 5 - 1 67.513
Role Stress 11 - 2 69.004
Internal Marketing 13 - 1 64.309
Internal Service Quality 13 1 2 67.551
Organizational Performance 4 - 1 75.551
5.3. Reliability
Once a factor structure is revealed, reliability analysis of the construct is performed.
Cronbach Alpha test has been used to test the reliability of the constructs. The results of the
Alpha Reliability are shown in Table 64. The reliability of the construct in the present study

175
range between .874 and .953. Results indicate that reliability of all the constructs is well
above .8 (Field, 2005) which indicates good reliability is attained. Descriptive for scale item
if deleted were also analyzed to check if there is a substantial increase in reliability upon
deletion of an item. It was found that removing an item would not improve the construct
reliability.
Table 5.44
Reliability analysis of the constructs
Construct No. of Items Cronbach’s Alpha
Organizational Learning 7 .895
Collaborative Culture 6 .876
Organizational Commitment 8 .914
Perceived Organizational Support 5 .874
Role Stress 11 .911
Role Ambiguity 5 .876
Role Conflict 6 .913
Internal Marketing 13 .953
Internal Service Quality 13 .938
Reliability 6 .913
Empathy & Responsiveness 7 .907

176
Organizational Performance 4 .890
5.4. Construct Validity
Construct validity is determined once convergent and discriminant validity is
established.
5.4.1. Convergent Validity
As noted in chapter 4. Convergent validity is established when the concepts that
should be related to each other are in fact related. The uni-factorial nature of variables and
constructs confirms the construct validity of the dimensions under study (Kuei, 1999).
Convergent validity through factor analysis is established when block of items measuring the
same construct strongly agree (i-e converge) in their representation of the underlying
construct they were created to measure. Convergent validity is established if an AVE of 0.5
or greater is achieved for the constructs.
Organizational learning, collaborative culture, organizational commitment, perceived
organizational support, internal marketing and organizational performance constructs are uni
dimensional hence convergent validity is established. Items pertinent to role ambiguity and
role conflict load substantially well onto their respective factors and no cross loadings were
observed, hence all items related to role ambiguity and role conflict converged to form the
two factors that make up role stress. Theoretically ISQ is made of four dimensions, however
in the present study factor analysis extracted two factors, reliability and empathy and
responsiveness, and the items pertinent to the dimensions load onto their respective factors.
Furthermore AVE is calculated, the results revealed that convergent validity for all constructs
is established since the statistics for AVE for all the factors is greater than .50.

177
Table 5.45
AVE for constructs
Constructs AVE
Organizational Learning .61
Collaborative Culture .61
Organizational Commitment .62
Perceived Organizational Support .67
Role Stress
Role Ambiguity .62
Role Conflict .64
Internal Marketing .64
Internal Service Quality
Reliability .60
Empathy & Responsiveness .52
Organizational Performance .75
5.4.2. Discriminant Validity
Discriminant validity determines the extent to which sufficiently distinct constructs
are not strongly correlated with each other. Discriminant validity is established if square root
of AVE for each construct is greater than inter-correlations of other constructs. Table 5.46
compares AVE square roots and inter-construct correlations. The results indicate that square
root of AVE of each construct is greater than other inter-construct correlations.

178
Table 5.46
Comparison of Square root of AVE and Inter-Construct Correlations
OL OC CC POS RA RC IM REL OP EMPRES
OL (.78)
OC .553** (.79)
CC .717** .609** (.78)
POS .532** .667** .690** (.82)
RA -.236** -.306** -.246** -.220** (.79)
RC -.284** -.247** -.250** -.213** .535** (.80)
IM .647** .652** .677** .702** -.282** -.297** (.80)
REL .516** .590** .549** .528** -.277** -.315** .657** (.77)
OP .610** .614** .552** .521** -.328** -.285** .689** .607** (.86)
EMPRES .501** .650** .614** .569** -.269** -.263** .643** .720** .618** (.72)
5.5. Structural Equation Modeling
This section focuses on the process of the multivariate analysis using structural
equation modeling.
5.5.1. Evaluations of Measurement Models
The present study involves a total of eight different constructs. This section tests subjects
each of the construct to confirmatory factor analysis (CFA) to test if the data fits the
measurement and structural model.
5.5.1.1. Organizational Learning
Organizational learning comprised of seven items, one item was removed in
multicollinearity analysis. The items were further subjected to CFA, the results are divided
into two parts, and initial model is compared with the final model. The results of both initial

179
and final model are shown in the table 67. The results indicate a good fit was attained for the
construct organizational learning. Initial loadings indicate low loadings for OL1 and OL2,
initially OL1 was removed and the model was run again, the fit indices improved but still the
results indicated a poor fit, the model was run again and OL2 was removed, Good fit was
attained on the removal of OL3. Remaining items shows good factor loadings. Fit indices
reveal an excellent fit for organizational learning construct. The measurement model along
with the factor loading is presented the figure.
Table 5.47
Summary of initial and attained findings: Organizational Learning
Items Initial
Loadings
Final
Standardized
Loadings
C.R.
(t)
OL1 .613
OL2 .622
OL3 .722
OL4 .809 .792 ---
OL6 .825 .846 16.748
OL7 .826 .868 17.172
OL8 .759 .759 14.728
Attained Fit Indices
CMIN/DF (df) SRMR CFI TLI RMSEA
Initial 10.452 (146.335/14) .0695 .90 .850 .167
Final .941 (1.882/2) .0077 1.00 1.00 .000
Composite Reliability: .88

180
Figure 5.8. Measurement model for organizational learning
All three items OL1, OL2 and OL3 relates to information sharing, Means analysis
reveal a relatively low means for the three items. This shows lack of access to information,
communication amongst employees and feedback. Organizational learning scale for the
present study comprised of a total of eight items adapted from García-Morales, Lloréns-
Montes, and Verdú-Jover (2007) and Spicer & Sadler-Smith (2006). All items from Spicer &
Sadler-Smith (2006) construct were eliminated, since they used it in sales and marketing
context. All other items from the other study remained. Furthermore the composite reliability
score for this measure is .88 which evinced that the retained items are thought to be reliable
measure.
5.5.1.2. Collaborative Culture
Collaborative culture comprised of a total of six items. The items were further
subjected to CFA, the results are divided into two parts, and initial model is compared with
the final model. The results of both initial and final model are shown in the following table.
The results indicate a perfect fit obtained for the construct organizational collaborative
culture. In initial CFA, CC1 and CC6 did not load well and thus was deleted. Modification
indices were analyzed and covariances were drawn between the error terms, the final model
had a total of four items.

181
Except for RMSEA and CMIN, three indices SRMR, CFI and TLI showed good fit,
hence the model showed mediocre fit and is used in the further analysis.
Table 5.48
Summary of initial and attained findings: Organizational Collaborative Culture
Items Initial
Loadings
Final
Standardized
Loadings
C.R.
(t)
CC1 .669 ---
CC2 .764 .79 ---
CC3 .832 .84 14.47
CC4 .722 .79 12.65
CC5 .790 .75 13.33
CC6 .641 --
Attained Fit Indices
CMIN/DF (df) SRMR CFI TLI RMSEA
Initial 8.037(72.332/9) .459 .935 .892 .144
Final 6.78 (6.78/1) .020 .99 .95 .13
Composite Reliability: .87
Figure 5.9. Measurement model for collaborative culture
Item 1 (CC1) related to change and its appreciation as an imperative, López, Peón,
and Ordás (2004) also found low loading for this item. Literature shows that bank employees

182
do show their concern with respect to change (Awasthy, Vijayalakshmi, & Gupta, 2012), this
could be attributed to the low loadings. Item 6 (CC6) was removed due to low loading. The
composite construct reliability for the four items is .83, the realibility is above the acceptable
level indicating that the retained four items are considered reliable as well as valid for the
construct measure.
5.5.1.3.Organizational Commitment
Organizational commitment was made up of a total of eight items. Initial results of the
CFA showed that OC1 and OC4 had load loadings. First OC1 was removed and measurement
model was run again, the results didn’t reveal an adequate model fit, further OC4 was
removed from the analysis, the results revealed a good fit. The results of the initial and the
final model are summarized in the table 5.49. A total of 6 items were included for further
analysis. The model is shown in the figure
Table 5.49
Summary of initial and attained findings: Organizational Commitment
Items Initial
Loadings
Final
Standardized
Loadings
C.R.
(t)
OC1 .617 ---
OC2 .829 .825 15.267
OC3 .750 .730 13.405
OC4 .700 ---
OC5 .799 .797 17.172
OC6 .767 .760 14.005
OC7 .814 .827 15.302
OC8 .763 .756 ---
Attained Fit Indices

183
CMIN/DF (df) SRMR CFI TLI RMSEA
Initial 5.25(105.175/20) .04 .947 .925 .11
Final 1.94(15.574/8) .01 .99 .98 .05
Composite Reliability: .90
Figure 5.10. Measurement model for organizational commitment
In the study by Lee (2000), OC1 failed to load substantially onto the respective factor
and thus was deleted from further analysis. The items is theoretically very close to OC3 and
OC8, thus deletion of the items would not affect the face validity of the construct. In another
study within Pakistan, Tayyab (2007) found low loadings for items OC1 and OC4 and
relatively low mean values. The construct reliability for organizational commitment was
found to be .90.
5.5.1.4. Perceived Organizational Support
Perceived organizational support was made up of a total of five items. Initial results of
the CFA showed that a good fit was attained. Although the loadings for POS5 were low, but
since an acceptable fit was attained, the item is retained for further analysis. The results of the
initial and the final model are summarized in the table 5.50. A total of 5 items were included
for further analysis. The model is shown in the figure

184
Table 5.50
Summary of initial and attained findings: Organizational Commitment
Items Initial
Loadings
Final
Standardized
Loadings
C.R.
(t)
POS1 .783 .783 ---
POS2 .854 .854 16.857
POS3 .870 .870 17.181
POS4 .772 .772 14.971
POS5 .563 .563 10.407
Attained Fit Indices
CMIN/DF (df) SRMR CFI TLI RMSEA
Initial 1.71(8.585-/) .01 .99 .99 .04
Final 1.71(8.585-/) .01 .99 .99 .04
Composite Reliability: .88
Figure 5.11. Measurement model for perceived organizational support
5.5.1.5. Role Stress
The concept of role stress was measure by two constructs; Role ambiguity comprising
5 items and role conflict comprising of 6 items. Initial results of CFA reveal a poor model fit
with none of the indices in the acceptable range. Two items from role ambiguity did not load

185
well and thus were removed, RC2 showed a high standardized residual covariance and thus
was removed from further analysis, RC2 in its meaning is very close to RC1, and thus the
face validity is not affected by deletion of RC2. Removal of items lead to good fit for the role
stress model. The results of the initial and the final model are summarized in the table 5.51. A
total of three items from role ambiguity and five items from role conflict were part of the
model. The model is shown in the figure
Table 5.51
Summary of initial and attained findings: Role Stress
Items Initial
Loadings
Final
Standardized
Loadings
C.R.
(t)
Role Ambiguity
RA1 .632 ---
RA2 .621 ---
RA3 .858 .85 18.82
RA4 .902 .91 20.10
RA5 .823 .83 ---
Role Conflict
RC1 .833 .77 15.17
RC2 .853 --- ---
RC3 .808 .83 17.51
RC4 .736 .83 16.97
RC5 .794 .81 ---
RC6 .756 .77 19.97
Attained Fit Indices
CMIN/DF (df) SRMR CFI TLI RMSEA
Initial 7.911 (340.169/43) .06 .88 .85 .14

186
Final 1.50(27.047/18) .02 .99 .99 .03
Composite Reliability:
Figure 5.12. Measurement model for role stress
5.5.1.6. Internal Marketing
For internal marketing in the initial model 13 items were subjected to CFA. The
results reveal a total of eight items in the final model. Five items were removed from the
analysis due to low loadings and higher standardized residual covariances. The results of the
initial and final attained model are presented in the table 5.52. The figure shows the
measurement model and the loadings for each item.
Table 5.52
Summary of initial and attained findings: Internal Marketing
Initial
Loadings
Final
Standardized
Loadings
C.R.
(t)
IM1 .734
IM2 .796 .770

187
IM3 .830
IM4 .822 .831 16.03
IM5 .792
IM6 .770 .792 15.17
IM7 .751 .767 14.61
IM8 .835
IM9 .678
IM10 .780 .758 14.39
IM11 .776 .718 13.50
IM12 .818 .780 16.37
IM14 .790 .747 14.07
Attained Fit Indices
CMIN/DF (df) SRMR CFI TLI RMSEA
Initial 6.62(430.865/65) .04 .897 .877 .129
Final 2.50(32.586/13) .02 .98 .97 .06
Composite Reliability: .92
Figure 5.13. Measurement model for internal marketing
In total five items were removed as part of confirmatory factor analysis. Theoretically
internal marketing construct is divided into three sub-factors, Development, Vision and
Rewards (Foreman & Money, 1995), however in the present study IM was found to be

188
unidimensional in nature. One item from Vision, two from Developments and two from
rewards were removed during CFA. Still two items from Vision and Development were part
of the study covering for the details pertinent for vision and development. The composite
reliability for the construct was .91 that is well over the acceptable value.
5.5.1.7. Internal Service Quality
Exploratory factor analysis revealed two factors for ISQ namely reliability and
Empathy and Responsiveness. Only one item was removed since it failed to load
substantially. Final ISQ construct had a total of 12 items. The initial and final attained factor
structure is shown in figure. The loadings and indices for initial and final attained model are
shown in table 5.53.
Table 5.53
Summary of initial and attained findings: Internal Service Quality
Initial
Loadings
Final
Standardized
Loadings
C.R.
(t)
Reliability
REL1 .725 .707 ---
REL2 .760 .748 13.35
REL3 .819 .809 14.42
REL4 .856 .877 15.44
REL5 .864 .867 15.43
ASR1 .773 .805 14.16
Empathy & Responsiveness
EMP1 .796 .799 ---
EMP2 .499 --- ---
EMP3 .818 .777 15.86

189
EMP4 .829 .793 16.30
RES1 .755 .764 15.54
RES2 .862 .872 18.58
RES4 .846 .864 18.36
Attained Fit Indices
CMIN/DF (df) SRMR CFI TLI RMSEA
Initial 4.09(262.144/64) .04 .93 .92 .09
Final 2.56(131.025/51) .03 .97 .96 .06
Composite Reliability: For Reliability: .91 For Empathy and Responsiveness: .91
Figure 5.14. Measurement model for ISQ
One item (EMP2) that measures if the bank has convenient working hours were
removed from the analysis. On deletion of EMP2, the resultant model manifested significant
enrichment to the overall fit of the model as shown in the attained fit indices. It was not a
problem for the six item factor to attain content and face validity. Finally the composite

190
reliability score for reliability is .91 and empathy & responsiveness was found to be .91
which is deemed to be reliable for the measurement of reliability and empathy &
responsiveness. ASR1 for further analysis is referred to as REL6.
5.5.1.8. Organizational Performance
Originally organizational performance construct had a total of five items. One item
was removed due to multicollinearity. The four items left were subjected to CFA. The results
showed all items load substantially well onto the construct. The fit indices are indicate an
adequate fit for the construct since RMSEA is a little higher. The initial and final loadings are
compared in table 5.54. The model is shown in figure.
Table 5.54
Summary of initial and attained findings: Organizational Performance
Initial
Loadings
Final
Standardized
Loadings
C.R.
(t)
OP1 .77 .77 ---
OP2 .91 .96 17.53
OP3 .82 .77 15.88
OP4 .78 .73 15.07
Attained Fit Indices
CMIN/DF (df) SRMR CFI TLI RMSEA
Initial 15.38(30.769/2) .03 .96 .89 .20
Final 3.10(3.10/1) .00 .99 .98 .07
Composite Reliability: .88

191
Figure 5.15. Measurement model for organizational performance
No items were removed from the analysis. The four items construct to measure
organizational performance has been used in the literature (Tseng, 2010). This approved the
reliability and validity of the measure. The composite reliability for this measure is .88 which
is considered a reliable measure for organizational performance.
5.5.1.9. Summary of measurement models
The results of measurement models for all constructs reveal that a good fit was
obtained for all measurement models. RMSEA was a bit higher for internal marketing, ISQ
and organizational performance, however the values of other indices for these construct
showed good fit. The summary for all measurement models is presented in table 5.55.
Table 5.55
Summary of the measurement models
Fit Indices
Constructs CMIN SRMR CFI TLI RMSEA
Organizational Learning .941 .0077 1.00 1.00 .00
Collaborative Culture 6.78 .020 .99 .95 .13

192
Organizational Commitment 1.94 .01 .99 .98 .05
Internal Marketing 2.50 .02 .98 .97 .06
Role Stress 1.50 .02 .99 .99 .03
Perceived Organizational Support 1.71 .01 .99 .99 .04
Internal Service Quality 2.56 .03 .97 .96 .06
Organizational Performance 3.10 .00 .99 .98 .07
5.5.2. Hypotheses Testing
Further to the evaluation of the measurement model for each construct, Structural
equation model was tested. Three different structural models are proposed. First seeks to
investigate the influence of different internal organizational factors on ISQ while the second
model seeks to evaluate the influence of different predictor variables on organizational
performance. The third model evaluates the influence of ISQ on OP.
5.5.2.1. Structural Model A: Internal organizational factors and ISQ
Following the similar approach of comparing initial and attained model, structural
equation model for internal organizational factors and the mediating variable ISQ is
compared. Only one index (TLI) failed to pass the cut-off value, overall the model did show
adequate fit. Factor loadings were analyzed along with standardized residuals and
modification indices. POS5 with low factor loadings were removed and the model was run
again. In the initial model there were a few items with standardized residual covariance just
over 2, removing the items did not improve the model fit significantly, hence the items were
retained. Final model show an adequate fit with all indices attaining the required range. The
following table shows the indices for the final model.

193
Table 5.56
Summary of initial and attained findings: Structural Model A
Attained Fit Indices
CMIN/DF (df) SRMR CFI TLI RMSEA
Final 2.181(2006.978/920) .04 .90 .90 .05

194
Figure 5.16. Structural Model A: Internal organizational factors and ISQ

195
Table 5.57
Summary of measurements: Internal Organizational Factors and ISQ
Hypotheses Structural Paths Std.
loading
C.R P Results
H1a Organizational Learning → ISQ -.023 -.317 .751 Rejected
H2a Collaborative Culture → ISQ .132 1.406 .160 Rejected
H3a Organizational Commitment → ISQ .334 4.393 .000 Supported
H4a Perceived Organizational Support → ISQ -.082 -.815 .415 Rejected
H5a Role Stress → ISQ -.120 -1.948 .050 Supported
H6a Internal Marketing → ISQ .486 5.643 .000 Supported
The table 5.57 shows if the predictor variables in the model had a significant
influence on the mediating variable (ISQ). Each hypothesis is evaluated based on the
standardized coefficient, its critical ratio, significance level. The estimation of hypotheses
demonstrated that three of the hypothesized links were significant whilst two were not.
5.5.2.2. Structural Model B: Internal organizational factors and organizational
performance
Structural model B seeks to find out the relationship between internal organizational
factors and subjective organizational performance. The initially hypothesized model A did
show an acceptable fit. To improve the overall model fit, loadings, modification indices and
standardized residual covariances were analyzed. POS5 with low factor loading was removed
and the model was run again. Analysis of standardized residual covariance’s also resulted in
removal of one item (OP1) with covariance over the threshold value, item was removed only
if it had a significant influence in improving the overall model fit. The final model is shown
in table 5.58; the figure shows the structural equation model

196
Table 5.58
Summary of initial and attained findings: Structural Model B
Attained Fit Indices
CMIN/DF (df) SRMR CFI TLI RMSEA
Final 2.09(1057.833/504) .04 .93 .92 .06

197
Figure 5.17. Structural Model B: Internal organizational factors and organizational
performance

198
Table 5.59
Summary of measurements: Internal Organizational Factors & Organizational Performance
Hypotheses Structural Paths Std.
loading
C.R P Results
H1b Organizational Learning → Organizational
Performance
.332 4.514 .000 Supported
H2b Collaborative Culture → Organizational Performance -.163 -1.763 .078 Rejected
H3b Organizational Commitment → Organizational
Performance
.186 2.566 .010 Supported
H4b Perceived Organizational Support → Organizational
Performance
-.045 -.456 .649 Rejected
H5b Role Stress → Organizational Performance -.119 -1.793 .049 Supported
H6b Internal Marketing → Organizational Performance .494 5.881 .000 Supported
The table 5.59 shows if the influence of the predictor variables in the model had a
significant influence on the mediating variable (Organizational Performance). Each
hypothesis is evaluated based on the standardized coefficient, its critical ratio, significance
level. The estimation of hypotheses demonstrated that four of the hypothesized links were
significant whilst two were not.
5.5.2.3. Structural Model C: Internal organizational factors and objective
organizational performance
Structural model C seeks to find out the relationship between internal organizational
factors and objective organizational performance. Three different models are tested, each
analyzing the different objective measures. The initially hypothesized models did show an
acceptable fit. POS5 with low factor loading was removed from each of the model. The final
model did revealed an acceptable model fit. The final models is shown in table 5.60, the
figures shows the structural equation models

199
Table 5.60
Summary of initial and attained findings: Structural Model C1-2-3
Attained Fit Indices
Earnings Per Share
Model C1 CMIN/DF (df) SRMR CFI TLI RMSEA
Final 2.10(1061.769/505) .04 .93 .92 .06
Return on Equity
Model C2 CMIN/DF (df) SRMR CFI TLI RMSEA
Final 2.08(1036.670/505) .04 .93 .92 .05
Return on Assets
Model C3 CMIN/DF (df) SRMR CFI TLI RMSEA
Final 2.06(1042.517/505) .04 .93 .92 .05

200
Figure 5.18. Structural Model C1: Internal organizational factors and organizational
performance

201
Figure 5.19. Structural Model C2: Internal organizational factors and organizational
performance

202
Figure 5.20. Structural Model C3: Internal organizational factors and organizational
performance

203
Table 5.61
Summary of measurements: Internal Organizational Factors & Organizational Performance
Hypotheses Structural Paths Std. loading C.R P Results
1 Organizational Learning → EPS
Organizational Learning → ROE
Organizational Learning → ROA
-003,
-.039,
.002.
-.031,
-.403,
-.019.
.976,
.687,
.985.
Rejected
Rejected
Rejected
2 Collaborative Culture → EPS
Collaborative Culture → ROE
Collaborative Culture → ROA
.014,
.146,
.086.
.108,
1.147,
.673.
.914,
.251,
.501.
Rejected
Rejected
Rejected
3 Organizational Commitment → EPS
Organizational Commitment → ROE
Organizational Commitment →ROA
.127,
.114,
.147.
1.259,
1.149,
1.465.
.208,
.250,
.143.
Rejected
Rejected
Rejected
4 Internal Marketing → EPS
Internal Marketing → ROE
Internal Marketing → ROA
.198,
.181,
.119.
1.805,
1.670,
1.092.
.071,
.095,
.275
Rejected
Rejected
Rejected
5 Role Stress → EPS
Role Stress → ROE
Role Stress → ROA
.070,
-.022,
.048.
.845,
-.276,
.591.
.398,
.783,
.555.
Rejected
Rejected
Rejected
6 Perceived Organizational Support → EPS
Perceived Organizational Support → ROE
Perceived Organizational Support → ROA
-.266,
-.237,
-.198
-1.937,
-1.738,
-1.447
.053,
.082,
.148.
Rejected
Rejected
Rejected
The table 5.61 shows if the influence of the predictor variables in the model had a no
significant influence on the criterion variable (Objective Organizational Performance). Each
hypothesis is evaluated based on the standardized coefficient, its critical ratio, significance
level. The estimation of hypotheses demonstrated that all other hypothesized links were
insignificant.

204
5.5.2.4. Structural Model D: ISQ and organizational performance
Structural model D evaluates the relationship between ISQ and organizational
performance. The initial model revealed acceptable fit indices for SRMR, CFI and TLI,
however RMSEA showing mediocre fit. The modification indices and standardized residual
covariances were analyzed. One item, RES1 was removed and covariances were drawn
between items of the similar latent construct. The final attained model showed acceptable fit
indices. Table 5.62 shows the comparison between initial and final model.
Table 5.62
Summary of initial and attained findings: Structural Model D
Attained Fit Indices
CMIN/DF (df) SRMR CFI TLI RMSEA
2.485(208.70/84) .03 .968 .960 .06
Figure 5.21. Structural Model D: ISQ and organizational performance

205
Table 5.63
Summary of measurements: ISQ and Organizational Performance (OP)
No Structural Paths Standardized
loading
C.R P Label
1 ISQ → OP .711 10.276 .000 Supported
The table 5.63 shows if the mediating variable (ISQ) had a significant influence on
organizational performance. The hypothesis is evaluated based on the standardized
coefficient, its critical ratio, significance level. The estimation of hypotheses demonstrated
that the hypothesized link between ISQ and organizational performance was significant.
5.5.2.5. Structural Model E: ISQ and Objective Organizational Performance
Structural model E evaluates the relationship between ISQ and objective measures
organizational performance. The initial model did reveal good fit indices for SRMR, TLI, and
CFI; however the value of RMSEA showed mediocre fit. All items loaded substantially well
onto their factors. Any changes to the initial models did not significantly improve the models,
hence no changes were made to the model Table 5.64 shows the final model.
Table 5.64
Summary of initial and attained findings: Structural Model E1-2-3
Attained Fit Indices
Earnings Per Share
Model E1 CMIN/DF (df) SRMR CFI TLI RMSEA
3.37(212.878/63) .03 .95 .94 .08
Return on Equity
Model E2 CMIN/DF (df) SRMR CFI TLI RMSEA
3.34(210.423/63) .03 .95 .94 .08

206
Return on Assets
Model E3 CMIN/DF (df) SRMR CFI TLI RMSEA
3.29(207.465./63) .03 .95 .94 .08
Figure 5.22. Structural Model E1: ISQ and Objective Organizational Performance
Figure 5.23. Structural Model E2: ISQ and Objective Organizational Performance

207
Figure 5.24. Structural Model E3: ISQ and Objective Organizational Performance
Table 5.65
Summary of measurements: ISQ and Organizational Performance
Structural Paths Standardized
loading
C.R P Label
ISQ
→
Objective Organizational Performance
(EPS, ROE, ROA.)
.153,
.269,
.216.
2.307,
4.221,
3.425.
.021,
.000,
.000.
Supported
Supported
Supported
The table 5.65 shows if the mediating variable (ISQ) had a significant influence on
objective measures of organizational performance. Contrary to the influence of internal
organizational factors, ISQ did have a significant influence on objective measures of
organizational performance. The hypothesis is evaluated based on the standardized
coefficient, its critical ratio, significance level. The estimation of hypotheses demonstrated
that the hypothesized link between ISQ and financial measures of organizational performance
were significant.

208
5.5.2.6. Mediation Analysis
In this section mediation analysis is performed. A number of conditions were
highlighted in chapter 3, to established mediation. Mediation analysis is performed using
Baron and Kenny Approach through the step wise procedure highlighted by Warner (2013).
Warner (2013) conclude that several condition are required before testing for mediation
1. A significant total relationship between the independent and dependent variable
2. A significant influence of independent variable on the mediating variable
3. A significant influence of mediating variable on dependent variable
Keeping in line with the conditions the following mediation analysis are performed,
1. ISQ mediates between Organizational Learning and Organizational Performance
2. ISQ mediates between Collaborative Culture and Organizational Performance
3. ISQ mediates between Organizational Commitment and Organizational Performance
4. ISQ mediates between Perceived Organizational Support and Organizational
Performance
5. ISQ mediates between Internal Marketing and Organizational Performance
6. ISQ mediates between Role Stress and Organizational Performance
7. ISQ, Organizational Learning and Organizational Performance (ROE)
8. ISQ mediates between Collaborative Culture and Organizational Performance (ROE)
9. ISQ mediates between Internal Marketing and Organizational Performance (ROE)
10. ISQ mediates between Organizational Commitment and Organizational Performance
(ROA)
11. ISQ mediates between Organizational Commitment and Organizational Performance
(ROE)

209
5.5.2.6.1. ISQ, Organizational Learning and Organizational Performance
Mediation analysis was performed using Baron and Kenny (1986) causal approach.
The initial causal variable was organizational learning (OL), the criterion variable was
organizational performance (OP), and the mediating variable was ISQ (ISQ).
The results reveal that the total effect of OL on OP was significant, c = .633, p< .001.
OL was significantly predictive of hypothesized mediating variable, ISQ; a = .513, p< .001,
when controlling for OL, ISQ was significantly predictive of OP, b = .516, p< .001. The
estimated direct effect of OL on OP, controlling for ISQ, was c’ = .368, P < .001.
The indirect effect, ab, was .264. This was judged to be statistically significant using
Sobel (1982) test, z = 7.80, p< .0001. The coefficients for both a and b were found
statistically significant, the Sobel test for the ab product was also significant, the direct effect
from OL on OP (c’) was also statistically significant. Since the Sobel test results were
significant, therefore, the effects of OL on OP were partially mediated by ISQ.
Table 5.66
Mediation analysis ISQ between OL and OP
Analysis IV – MV (a)
OL - ISQ
MV – DV (b)
ISQ - OP
Direct without
Mediator (c)
Direct with
Mediator (c’)
Results
Est. S.E Est. S.E Est. Sig Est. Sig
OL – ISQ -
OP
.513 .043 .516 .050 .633 .000 .368 .000 Partial
Mediation
Figure 5.25. Mediation: ISQ, OL and OP
ISQ
OL OP
a = .513 b = .516
c’ = .368
c = .633

210
5.5.2.6.2. ISQ, Collaborative Culture and Organizational Performance
Mediation analysis was performed using Baron and Kenny (1986) causal approach.
The initial causal variable was collaborative culture (CC), the criterion variable was
organizational performance (OP), and the mediating variable was ISQ (ISQ).
The results reveal that the total effect of CC on OP was significant, c = .453, p< .001.
CC was significantly predictive of hypothesized mediating variable, ISQ; a = .478, p< .001,
when controlling for CC, ISQ was significantly predictive of OP, b = .628, p< .001. The
estimated direct effect of CC on OP, controlling for ISQ, was c’ = .153, P < .001.
The indirect effect, ab, was .300. This was judged to be statistically insignificant
using Sobel (1982) test, z = 8.53, p< .0001. The coefficients for both a and b were found
statistically significant, the Sobel test for the ab product was also significant, the direct effect
from CC on OP (c’) was also statistically significant. Since the Sobel test results were
significant, therefore, the effects of CC on OP were partially mediated by ISQ.
Table 5.67
Mediation analysis ISQ between CC and OP
Analysis IV – MV (a)
CC - ISQ
MV – DV (b)
ISQ - OP
Direct without
Mediator (c)
Direct with
Mediator (c’)
Results
Estimate S.E Est. S.E Est. Sig Est. Sig
CC - ISQ -
OP
.478 .038 .628 .054 .453 .000 .153 .000 Partial
Mediation
Figure 5.26. Mediation: ISQ, CC and OP
ISQ
CC OP
a = .478 b = .628
c’ = .153
c = .453

211
5.5.2.6.3. ISQ, Organizational Commitment and Organizational Performance
Mediation analysis was performed using Baron and Kenny (1986) causal approach.
The initial causal variable was organizational commitment (OC), the criterion variable was
organizational performance (OP), and the mediating variable was ISQ (ISQ).
The results reveal that the total effect of OC on OP was significant, c = .625, p< .001.
OC was significantly predictive of hypothesized mediating variable, ISQ; a = .617, p< .001,
when controlling for OC, ISQ was significantly predictive of OP, b = .316, p< .001. The
estimated direct effect of OC on OP, controlling for ISQ, was c’ = .501, P < .001.
The indirect effect, ab, was .194. This was judged to be statistically significant using
Sobel (1982) test, z = 5.61, p< .001. The coefficients for both a and b were found statistically
significant, the Sobel test for the ab product was also significant, the direct effect from OC on
OP (c’) was also statistically significant, therefore, the effects of OC on OP were only partly
mediated by ISQ.
Table 5.68
Mediation analysis ISQ between OC and OP
Analysis IV – MV (a)
OC - ISQ
MV – DV (b)
ISQ - OP
Direct without
Mediator (c)
Direct with
Mediator (c’)
Results
Estimate S.E Est. S.E Est. Sig Est. Sig
OC – ISQ -
OP
.617 .037 .316 .053 .625 .000 .501 .000 Partial
Mediation
Figure 5.27. Mediation: ISQ, OC and OP
ISQ
OC OP
a = .617 b = .316
c’ = .501
c = .625

212
5.5.2.6.4. ISQ, Perceived Organizational Support and Organizational Performance
Mediation analysis was performed using Baron and Kenny (1986) causal approach.
The initial causal variable was Perceived Organizational Support (POS), the criterion variable
was organizational performance (OP), and the mediating variable was ISQ (ISQ).
The results reveal that the total effect of POS on OP was significant, c = .473, p<
.001. POS was significantly predictive of hypothesized mediating variable, ISQ; a = .486, p<
.001, when controlling for POS, ISQ was significantly predictive of OP, b = .600, p< .001.
The estimated direct effect of POS on OP, controlling for ISQ, was c’ = .181, P < .001.
The indirect effect, ab, was .291. This was judged to be statistically significant using
Sobel (1982) test, z = 8.48, p< .0001. The coefficients for both a and b were found
statistically significant, the Sobel test for the ab product was also significant, the direct effect
from POS on OP (c’) was also statistically significant, therefore, the effects of POS on OP
were only partly mediated by ISQ. Comparison of the coefficients for the direct vs indirect
paths (c’ = .181 vs. ab = .291) suggest that a large part is mediated by ISQ.
Table 5.69
Mediation analysis ISQ between POS and OP
Analysis IV – MV (a)
POS - ISQ
MV – DV (b)
ISQ - OP
Direct without
Mediator (c)
Direct with
Mediator (c’)
Results
Est. S.E Est. S.E Est. Sig Est. Sig
POS – ISQ -
OP
.486 .036 .600 .055 .473 .000 .181 .000 Partial
Mediation
Figure 5.28. Mediation: ISQ, POS and OP
ISQ
POS OP
a = .486 b = .600
c’ = .181
c = .473

213
5.5.2.6.5. ISQ, Role Stress and Organizational Performance
Mediation analysis was performed using Baron and Kenny (1986) causal approach.
The initial causal variable was Role Stress (RS), the criterion variable was organizational
performance (OP), and the mediating variable was ISQ (ISQ).
The results reveal that the total effect of RS on OP was significant, c = -.358, p< .001.
RS was significantly predictive of hypothesized mediating variable, ISQ; a = -.322, p< .001,
when controlling for RS, ISQ was significantly predictive of OP, b = .680, p< .001. The
estimated direct effect of RS on OP, controlling for ISQ, was c’ = -.139, P < .05.
The indirect effect, ab, was -.218. This was judged to be statistically significant using
Sobel (1982) test, z = -6.08, p< .001. The coefficients for both a and b were found
statistically significant, the Sobel test for the ab product was also significant, the direct effect
from RS on OP (c’) was also statistically significant, therefore, the effects of RS on OP were
only partly mediated by ISQ.
Table 5.70
Mediation analysis ISQ between RS and OP
Analysis IV – MV (a)
RS - ISQ
MV – DV (b)
ISQ - OP
Direct without
Mediator (c)
Direct with
Mediator (c’)
Results
Estimate S.E Est. S.E Est. Sig Est. Sig
RS – ISQ -
OP
-.322 .048 .680 .047 -.358 .000 -.139 .002 Partial
Mediation
Figure 5.29. Mediation: ISQ, RS and OP
ISQ
RS OP
a = -.322 b = .680
c’ =-.139
c =-.358

214
5.5.2.6.6. ISQ, Internal Marketing and Organizational Performance
Mediation analysis was performed using Baron and Kenny (1986) causal approach.
The initial causal variable was internal marketing (IM), the criterion variable was
organizational performance (OP), and the mediating variable was ISQ (ISQ).
The results reveal that the total effect of IM on OP was significant, c = .658, p< .001.
IM was significantly predictive of hypothesized mediating variable, ISQ; a = .615, p< .001,
when controlling for IM, ISQ was significantly predictive of OP, b = .406, p< .001. The
estimated direct effect of IM on OP, controlling for ISQ, was c’ = .408, P < .001.
The indirect effect, ab, was .249. This was judged to be statistically significant using
Sobel (1982) test, z = 6.52, p< .001. The coefficients for both a and b were found statistically
significant, the Sobel test for the ab product was also significant, the direct effect from IM on
OP (c’) was also statistically significant, therefore, the effects of IM on OP were only partly
mediated by ISQ.
Table 5.71
Mediation analysis ISQ between IM and OP
Analysis IV – MV (a)
IM - ISQ
MV – DV (b)
ISQ - OP
Direct without
Mediator (c)
Direct with
Mediator (c’)
Results
Est. S.E Est. S.E Est. Sig Est. Sig
IM – ISQ -
OP
.615 .034 .406 .058 .658 .000 .408 .000 Partial
Mediation
Figure 5.30. Mediation: ISQ, IM and OP
ISQ
IM OP
a = .615 b = .406
c’ = .408
c = .658

215
5.5.2.6.7. ISQ, Organizational Learning and Organizational Performance (ROE)
Mediation analysis was performed using Baron and Kenny (1986) causal approach.
The initial causal variable was Organizational Learning (OL), the criterion variable was
objective organizational performance (ROE), and the mediating variable was ISQ (ISQ).
The results reveal that the total effect of OL on ROE was significant, c = 1.335, p<
.05. OL was significantly predictive of hypothesized mediating variable, ISQ; a = .513, p<
.001, when controlling for OL, ISQ was significantly predictive of ROE, b = 2.701, p< .001.
The estimated direct effect of OL on ROE, controlling for ISQ, was c’ = -.051, P > .05.
The indirect effect, ab, was 1.054. This was judged to be statistically significant using
Sobel (1982) test, z = 4.046, p< .0001. The coefficients for both a and b were found
statistically significant, the Sobel test for the ab product was also significant, the direct effect
from OL on ROE (c’) was found to be statistically insignificant, therefore, the effects of OL
on ROE were completely mediated by ISQ.
Table 5.72
Mediation analysis ISQ between OL and ROE
Analysis IV – MV (a)
OL - ISQ
MV – DV (b)
ISQ - ROE
Direct without
Mediator (c)
Direct with
Mediator (c’)
Results
Est. S.E Est. S.E Est. Sig Est. Sig
OL – ISQ -
ROE
.463 .041 2.778 .641 .977 .048 -.308 .586 Complete
Mediation
Figure 5.31. Mediation: ISQ, OL and ROE
ISQ
OL ROE
a = .463 b= 2.778
c’ =-.308
c =.977

216
5.5.2.6.8. ISQ, Collaborative Culture and Organizational Performance (ROE)
Mediation analysis was performed using Baron and Kenny (1986) causal approach.
The initial causal variable was Collaborative Culture (CC), the criterion variable was
objective organizational performance (ROE), and the mediating variable was ISQ (ISQ).
The results reveal that the total effect of CC on ROE was significant, c = 1.184, p<
.05. CC was significantly predictive of hypothesized mediating variable, ISQ; a = .478, p<
.001, when controlling for CC, ISQ was significantly predictive of ROE, b = 2.764, p< .001.
The estimated direct effect of CC on ROE, controlling for ISQ, was c’ = -.137, P > .05.
The indirect effect, ab, was 1.321. This was judged to be statistically significant using
Sobel (1982) test, z = 3.888, p< .0005. The coefficients for both a and b were found
statistically significant, the Sobel test for the ab product was also significant, the direct effect
from CC on ROE (c’) was found to be statistically insignificant, therefore, the effects of CC
on ROE were completely mediated by ISQ.
Table 5.73
Mediation analysis ISQ between CC and ROE
Analysis IV – MV (a)
CC - ISQ
MV – DV (b)
ISQ - ROE
Direct without
Mediator (c)
Direct with
Mediator (c’)
Results
Est. S.E Est. S.E Est. Sig Est. Sig
CC – ISQ -
ROE
.478 .038 2.764 .676 1.184 .014 -.137 .810 Complete
Mediation
Figure 5.32. Mediation: ISQ, CC and ROE
ISQ
CC ROE
a = .478 b= 2.764
c’ =-.137
c =1.184

217
5.5.2.6.9. ISQ, Internal Marketing and Organizational Performance (ROE)
Mediation analysis was performed using Baron and Kenny (1986) causal approach.
The initial causal variable was Internal Marketing (IM), the criterion variable was objective
organizational performance (ROE), and the mediating variable was ISQ (ISQ).
The results reveal that the total effect of IM on ROE was significant, c = 1.508, p<
.005. IM was significantly predictive of hypothesized mediating variable, ISQ; a = .615, p<
.001, when controlling for IM, ISQ was significantly predictive of ROE, b = 2.724, p< .001.
The estimated direct effect of IM on ROE, controlling for ISQ, was c’ = -.268, P > .05.
The indirect effect, ab, was 1.675. This was judged to be statistically significant using
Sobel (1982) test, z = 3.556, p< .0005. The results reveal that both a and b coefficients were
statistically significant, the Sobel test for the ab product was significant, the direct effect from
IM on ROE (c’) was found to be statistically insignificant, therefore, the effects of IM on
ROE were completely mediated by ISQ.
Table 5.74
Mediation analysis ISQ between IM and ROE
Path IV – MV (a)
IM - ISQ
MV – DV (b)
ISQ - ROE
Direct without
Mediator (c)
Direct with
Mediator (c’)
Results
Est. S.E Est. S.E Est. Sig Est. Sig
IM – ISQ -
ROE
.615 .035 2.724 .750 1.508 .003 -.168 .803 Complete
Mediation
Figure 5.33. Mediation: ISQ, IM and ROE
ISQ
IM ROE
a = .615 b= 2.724
c’ =-.168
c =1.508

218
5.5.2.6.10. ISQ, Organizational Commitment and Organizational Performance (ROA)
Mediation analysis was performed using Baron and Kenny (1986) causal approach.
The initial causal variable was Organizational Commitment (OC), the criterion variable was
objective organizational performance (ROA), and the mediating variable was ISQ (ISQ).
The results reveal that the total effect of OC on ROA was significant, c = .117, p< .05.
OC was significantly predictive of hypothesized mediating variable, ISQ; a = .617, p< .001,
when controlling for OC, ISQ did not significantly predict ROA, b = -.027, p> .05. The
estimated direct effect of OC on ROA, controlling for ISQ, was c’ = .233, p < .05.
The indirect effect, ab, was -.016. This was judged to be statistically insignificant
using Sobel (1982) test, z = 0.396, p > .05. The results reveal no significant mediation since
the ISQ did not significantly predict ROA, when controlling for OC.
Table 5.75
Mediation analysis ISQ between OC and ROA
Path IV – MV (a)
OC - ISQ
MV – DV (b)
ISQ - ROA
Direct without
Mediator (c)
Direct with
Mediator (c’)
Results
Est. S.E Est. S.E Est. Sig Est. Sig
OC – ISQ -
ROA
.617 .038 -.027 .068 .117 .023 .233 .002 No
Mediation
Figure 5.34. Mediation: ISQ, OC and ROA
ISQ
OC ROA
a = .617 b= -.027
c’ = .233
c = .117

219
5.5.2.6.11. ISQ, Organizational Commitment and Organizational Performance (ROE)
Mediation analysis was performed using Baron and Kenny (1986) causal approach.
The initial causal variable was Organizational Commitment (OC), the criterion variable was
objective organizational performance (ROE), and the mediating variable was ISQ (ISQ).
The results reveal that the total effect of OC on ROE was significant, c = 1.364, p<
.05. OC was significantly predictive of hypothesized mediating variable, ISQ; a = .617, p<
.001, when controlling for OC, ISQ did not significant predict ROE, b = -.515, p > .05. The
estimated direct effect of OC on ROE, controlling for ISQ, was c’ = .3.047, P < .05.
The indirect effect, ab, was -.317. This was judged to be statistically significant using
Sobel (1982) test, z = .745, p > .05. The results reveal no significant mediation since the ISQ
did not significantly predict ROE, when controlling for OC.
Table 5.76
Mediation analysis ISQ between OC and ROE
Path IV – MV (a)
OC - ISQ
MV – DV (b)
ISQ - ROE
Direct without
Mediator (c)
Direct with
Mediator (c’)
Results
Est. S.E Est. S.E Est. Sig Est. Sig
OC – ISQ -
ROE
.617 .037 -.515 .690 1.364 .009 3.047 .000 No
Mediation
Figure 5.35. Mediation: ISQ, OC and ROE
ISQ
OC ROE
a = .617 b= -.515
c’ =3.04
c =1.364

220
5.6. ISQ and Employee Demographics
This section analysis ISQ with respect to different demographical variables in the
study. The demographic variables in the study include gender, age, job rank, employment
type, banking system, years of education, job tenure, and type of bank.
5.6.1. ISQ and Gender
Differences in the perception of level of ISQ was evaluated between Male and Female
Employees. Table 5.77 shows the mean values, standard deviation, t- statistics and p value
male and female respondents with respect to the level of ISQ. It is assumed that there is no
mean difference in both the groups’ perceptions. The reason for this assumption is that in
modern business world both men and women are considered equal, with both groups having
the ability to perform similar activities and work under similar environment and take similar
challenges. The results of the independent sample t-test reveal no significant difference in the
perceptions of the males and the females with respect to the test variable i.e. ISQ (p > .05).
This shows that both male and female employee have similar perception about their
coworkers. However, still male employee perception of ISQ is slightly higher than female
respondents, although the difference is insignificant. This shows that male employees have a
slightly more positive perception of the level of internal service shared at work.
Table 5.77
Compare Means, ISQ with respect to Gender
Gender N Mean Std. Deviation t Sig
ISQ Male 289 5.0551 1.19621
1.536 .125 Female 52 4.7788 1.17965
5.6.2. ISQ and Age
Differences in the perception of ISQ was evaluated across the different age groups. A
total of four age groups were identified in the study, ranging between 20-29, 30-39, 40-49,

221
and 50-59. The results revealed that there is no statistically significant difference between age
groups as determined by one-way ANOVA (F (3, 337) = .675, p = .568). This shows that
with change in age there is no change in the perception of internal service quality received.
Furthermore, the results also promote the assertion that at any age, the organization demands
its employees to provide quality service not only to the external customers but also the
internal members of the organization. It might also be assumed that with an increase in age,
employee ability to be reliable, show responsiveness and assurance might be difficult.
However, results of the present study negate this assertion. The results also lead to the belief
that in modern organizations age does not significantly affect the competency, ability and
responsiveness of its employees. The following table summarized the results of one-way
ANOVA analysis.
Table 5.78
Compare Means, ISQ with respect to Age
Sum of Squares df Mean Square F Sig.
Between Groups 2.905 3 .968 .675 .568
Within Groups 483.531 337 1.435
Total 486.436 340
5.6.3. ISQ and Rank
Differences in perception of the internal service quality was compared across different
job ranks. The job ranks in the current study were junior, middle and senior. There was a
statistically significant difference across job rank as determined by one-way ANOVA (F (2,
338) = 3.187, p = .043). A Dunnett T3 post-hoc test revealed that the perception of ISQ was
significantly different between Middle and Senior (p = .010), however, no significant
difference was revealed in any of the other job ranks. The results reveal that employee’s at
senior level have a significantly better perception of the level of service quality they receive
from their coworkers. Employees in the Junior and Middle level share similar perception,

222
since there is negligible difference in the means of the employees belonging to the junior and
middle level. The results of the one-way ANOVA analysis are summarized in the following
tables.
Table 5.79
ANOVA Results, ISQ and Job Rank
Sum of Squares df Mean Square F Sig.
Between Groups 9.002 2 4.501 3.187 .043
Within Groups 477.433 338 1.413
Total 486.436 340
Table 5.80
Multiple Comparison across Job Ranks
(I) Rank (J) Rank N Mean Std. Deviation Mean Difference
(I-J)
Sig.
Junior Middle
90 4.9750 1.26094 .03608 .994
Senior -.45278 .058
Middle Junior
206 4.9389 1.20613 -.03608 .994
Senior -.48886* .010
Senior Junior
45 5.4278 .92568 .45278 .058
Middle .48886* .010
5.6.4. ISQ and Employment Type
Differences in the perception of level of ISQ was evaluated between Contract and
Permanent Employees. Table 5.81 shows the mean values, standard deviation, t- statistics and
p value for contract and permanent employees with respect to the level of ISQ. It is assumed
that there is no mean difference in both the groups’ perceptions. The reason for this
assumption is that contract employees would try to make sure that they provide optimum
level of service to the coworkers in order to receive satisfactory rating in performance
appraisal that could lead to a permanent position, in case of permanent employees, they
would make effort to provide superior service to their coworkers in order to have a healthy

223
relationship, receive better performance appraisal, and enhance bank’s performance that may
result in promotions. The results of the independent sample t-test reveal no significant
difference in the perceptions of the Contract and Permanent employees with respect to the
test variable i.e. ISQ (p > .05). This shows that both contract and permanent employees have
similar perception about their coworkers. However, still contractual employee perception of
ISQ is slightly higher than permanent employees, although the difference is insignificant.
This shows that contract employees have a slightly more positive perception of the level of
internal service shared at work.
Table 5.81
Compare Means, ISQ with respect to Employment Type
Employment N Mean Std. Deviation t Sig
ISQ Contract 46 5.2464 1.09741
1.425 .155 Permanent 295 4.9766 1.20845
5.6.5. ISQ and Banking System
Differences in the perception of level of ISQ was evaluated between Conventional
and Islamic banking system. Table 5.82 shows the mean values, standard deviation, t-
statistics and p value conventional and Islamic banks respondents with respect to the level of
ISQ. It is assumed that there is no mean difference in both the groups’ perceptions. The
reason for this assumption is that Islamic banking system is still developing in Pakistan, and
customers are showing an upward trend in utilizing services of Islamic Banks, this poses a
great threat to the conventional banking system in an Islamic Country. Hence, both bank
employees would try to make sure that their level of internal service is adequate so they can
provide superior external service. The results of the independent sample t-test revealed no
significant difference in the perceptions of the Conventional and Islamic Banking System
with respect to the test variable i.e. ISQ (p > .05). This shows that employees working under
both conventional and Islamic banking system share similar perception about their

224
coworkers. However, still employees working under Islamic banking system perception of
ISQ is slightly higher than employees in conventional system, although the difference is
insignificant. This shows that Islamic system has a slightly more positive perception of the
level of internal service shared at work.
Table 5.82
Compare Means, ISQ with respect to Banking System
System N Mean Std. Deviation t Sig
ISQ Conventional 266 4.9699 1.22730
-1.252 .211 Islamic 75 5.1656 1.07197
5.6.6. ISQ and Years of Education
Differences in perception of the internal service quality was compared across different
years of education of the employees. Employees in the study had four different years of
education namely; 14, 16, 17, and 18. The results of One-Way ANOVA analysis revealed no
significant difference across different years of education, (F (3, 338) = 1.752, p = .156). The
results of the one-way ANOVA analysis are summarized in the following table.
Table 5.83
ANOVA results, ISQ across Years of Education
Sum of Squares df Mean Square F Sig.
Between Groups 7.493 3 2.498 1.752 .156
Within Groups 477.533 335 1.425
Total 485.026 338
5.6.7. ISQ and Job Tenure
Differences in perception of the internal service quality was compared across different
job tenure of the employees. Employees in the study were divided into four different job
tenures namely; 0-10, 11-20, 21-30, and 31-40. The results of One-Way ANOVA analysis

225
revealed no significant difference across different job tenures, (F (3, 332) = .210, p = .890).
The results of the one-way ANOVA analysis are summarized in the following table.
Table 5.84
ANOVA results, ISQ across different job tenures
Sum of Squares df Mean Square F Sig.
Between Groups .914 3 .305 .210 .890
Within Groups 477.570 329 1.452
Total 478.484 332
5.6.8. ISQ and Type of Bank
Differences in perception of the internal service quality was compared between public
and private sector banks. Table 5.85 shows the mean values, standard deviation, t- statistics
and p value for public and private banks respondents with respect to the level of ISQ. It is
assumed that there is no mean difference in both the groups’ perceptions. The results of the
independent sample t-test revealed no significant difference in the perceptions of the public
and private sector banks with respect to the test variable i.e. ISQ (p > .05). This shows that
employees working under both public and private banks system share similar perception
about their coworkers. However, employees working in private sector banks has slightly
better ISQ than employees in public sector banks, although the difference is insignificant.
Table 5.85
Compare Means, ISQ with respect to Type of Bank
Type N Mean Std. Deviation t Sig
ISQ Public 90 4.9611 1.07027
-.479 .632 Private 251 5.0315 1.23961
5.7. Summary of the Research Results
This study contributes to the literature on the relationship between different internal
organizational factors, ISQ and organizational performance in the banking sector. It provides

226
empirical evidence to the theoretical model that links different internal organizational factors,
ISQ and organizational performance. It was found that four out of six internal organizational
factors, namely organizational learning, organizational commitment, role stress, and internal
marketing have a significant influence on perceived organizational performance. While two
factors namely collaborative culture and perceived organizational support did not have a
significant influence on organizational performance.
Furthermore the study also evaluated the mediating role of ISQ between different
internal organizational factors and organizational performance. Mediation analysis proved
partial mediation between all internal organizational factors and perceived organizational
performance. ISQ when used a mediator showed partial mediation between OL and POP.
Similarly ISQ partially mediated between CC and POP. ISQ also partially mediated the path
between OC and POP. Partial mediation was also supported between POS and POP; likewise
partial mediation was supported between IM and POP. In case of mediation analysis between
different internal organizational factors and financial organizational performance, ISQ did
show full mediation on a number of instances. The study showed that ISQ fully mediates the
path between OL and ROE, CC and ROE, and IM and ROE.
Further to the evaluation of how the independent, mediating and dependent variables
are related, the present study also evaluated whether there exists any differences in internal
service quality across different demographic variables. The results revealed out of the
different demographic variables considered in the present study, namely; Gender, Age, Job
Rank, Employment type, Banking System, Years of Education, Job Tenure and Type of
Bank. Level of internal service quality was only found be different across Job Ranks, for all
other demographic variables there were no significant differences. Summary of hypotheses
and their results are presented in the following table.

227
Table 5.86
Summary of Hypotheses Results
Hypotheses Paths Hypotheses
Supported
H1a OL → ISQ Rejected
H1b OL → POP Supported
H1c1 OL → EPS Rejected
H1c2 OL → ROE Rejected
H1c3 OL → ROA Rejected
H1d OL → ISQ → POP Partial Mediation
H1e1 OL → ISQ → EPS No Mediation
H1e2 OL → ISQ → ROE Full Mediation
H1e3 OL → ISQ → ROA No Mediation
H2a CC → ISQ Rejected
H2b CC → POP Rejected
H2c1 CC → EPS Rejected
H2c2 CC → ROE Rejected
H2c3 CC → ROA Rejected
H2d CC → ISQ → POP Partial Mediation
H2e1 CC → ISQ → EPS No Mediation
H2e2 CC → ISQ → ROE Full Mediation
H2e3 CC → ISQ → ROA No Mediation
H3a OC → ISQ Supported
H3b OC → POP Supported
H3c1 OC → EPS Rejected
H3c2 OC → ROE Rejected
H3c3 OC → ROA Rejected
H3d OC → ISQ → POP Partial Mediation
H3e1 OC → ISQ → EPS No Mediation

228
H3e2 OC → ISQ → ROE No Mediation
H3e3 OC → ISQ → ROA No Mediation
H4a POS → ISQ Rejected
H4b POS → POP Rejected
H4c1 POS → EPS Rejected
H4c2 POS → ROE Rejected
H4c3 POS → ROA Rejected
H4d POS → ISQ → POP Partial Mediation
H4e1 POS → ISQ → EPS No Mediation
H4e2 POS → ISQ → ROE No Mediation
H4e3 POS → ISQ → ROA No Mediation
H5a RS → ISQ Supported
H5b RS → POP Supported
H5c1 RS → EPS Rejected
H5c2 RS → ROE Rejected
H5c3 RS → ROA Rejected
H5d RS → ISQ → POP Partial Mediation
H5e1 RS → ISQ → EPS No Mediation
H5e2 RS → ISQ → ROE No Mediation
H5e3 RS → ISQ → ROA No Mediation
H6a IM → ISQ Supported
H6b IM → POP Supported
H6c1 IM → EPS Rejected
H6c2 IM → ROE Rejected
H6c3 IM → ROA Rejected
H6d IM → ISQ → POP Partial Mediation
H6e1 IM → ISQ → EPS No Mediation
H6e2 IM → ISQ → ROE Full Mediation
H6e3 IM → ISQ → ROA No Mediation
H7a ISQ → POP Supported

229
H7b1 ISQ → EPS Supported
H7b2 ISQ → ROE Supported
H7b3 ISQ → ROA Supported

230
Chapter 6
Discussion and Conclusions
The thesis contained an empirical investigation into the mediating role of Internal
Service Quality (ISQ) on the linkage between internal organizational factors and
organizational performance. Internal organizational factors involved organizational learning,
organizational collaborative culture, organizational commitment, perceived organizational
support, role stress and internal marketing.
6.1. What factors affect organizational performance?
The findings of the research question one are based on the validated structural model
that was subsequently purified using (Confirmatory Factor Analysis) CFA as discussed in
chapter 4. Regression along with the coefficients and p value were presented in the table
corresponding to the regression models.
Research question one evaluated the influence of different internal organizational
factors over organizational performance i-e both subjective and objective. In order to evaluate
the influence of different internal organizational factors on organizational performance,
different hypotheses were proposed. To answer the research question one, 12 hypotheses
were developed (H1b, H1c, H2b, H2c, H3b, H3c, H4b, H4c, H5b, H5c, H6b and H6c).
H1b: There is a significant impact of Organizational Learning on Perceived
Organizational Performance
H1c1-2-3: There is a significant impact of Organizational Learning on Objective
Organizational Performance (EPS, ROE, & ROA)
H2b: There is a positive significant impact of organizational collaborative culture on
Perceived Organizational Performance

231
H2c1-2-3: There is a positive significant impact of organizational collaborative culture
on objective organizational performance (EPS, ROE, & ROA)
H3b: There is a significant impact of Organizational Commitment on Perceived
Organizational Performance
H3c1-2-3: There is a significant impact of organizational commitment on objective
organizational performance (EPS, ROE, & ROA)
H4b: There is a significant impact of perceived organizational support on perceived
organizational performance
H4c1-2-3: There is a positive significant impact of perceived organizational support on
objective organizational performance (EPS, ROE, & ROA)
H5b: There is a significant impact of Role Stress on Perceived Organizational
Performance
H5c1-2-3: There is a significant impact of Role Stress on objective organizational
performance (EPS, ROE, & ROA)
H6b: There is a significant impact of Internal Marketing on Perceived Organizational
Performance
H6c1-2-3: There is a significant impact of Internal Marketing on objective
organizational performance (EPS, ROE, & ROA)
Analysis of the hypothesis (H1b) indicated that a significant positive relationship
exists between Organizational Learning (OL) and Perceived Organizational Performance
(POP). It implies that better organizational learning initiatives would positively effect on
organizational performance however the current study did not discover significant influence
of OL on any of the three measures of objective organizational performance (H1c). The
finding revealing significant impact of OL on POP is in line with the earlier research
conducted by Skerlavaj and Dimovski (2006) that demonstrated statistically significant

232
positive and strong impact of organizational learning on organizational performance from the
employee perspective. However, contrary to the study of Skerlavaj and Dimovski (2006) and
Ellinger, Ellinger, Yang, and Howton (2002), the current study did not discover significant
influence of OL on financial performance. The study offers support for the existence of a
business case for the concept of organizational learning. The significant positive influence of
organizational learning on organizational performance suggests that there is a payoff for
businesses that hold close practices and strategies consistent with the organizational learning.
In other words, an organization can improve performance if it readjusts itself to the dynamic
environment through the learning process (Wang & Ellinger, 2011).
Analysis of the hypothesis (H2b) through multiple regression model discovered a non-
significant relationship between CC and POP. Parallel to non-significant influence of CC on
perceived organizational performance, the present study did not find significant influence of
CC on any of the three measures of organizational performance (H2c). A scarcity of empirical
studies exist that investigates the influence of collaborative culture on organizational
performance. The finding that CC is not related to POP is in contradiction to the theory and
research studies that has recognized organizational culture as an important driver of better
organizational performance and have shown significant influence of organizational culture on
organizational performance (Orgbanna & Harris, 2000; Lok & Crawford, 2004; Booth &
Hamer, 2009). Earlier studies also failed to discover significant influence of organizational
culture on objective measures of organizational performance (Dwyer, Richard, & Chadwick,
2003; Wilderon, van den Berg & Wiersma, 2012; Yesil & Kaya, 2013). It is recommended
that it is of great benefit for the organizations to nurture a collaborative organizational culture
by instituting mechanisms and structures that focus on creation of environment where
workers share an understanding and further aid in the development of support, care, and
cooperation among employees. The findings that reveal influence of culture on performance

233
are still mixed and further research needs to be conducted on the nexus between culture and
organizational performance.
H3b appraised the influence of OC on POP. The results demonstrated a significant
influence of OC on POP. However, the current study did not discover significant influence of
OC on any of the three measures of financial organizational performance (H3c). The results
of the current study are on par with the research findings of Brett, Cron, and Slocum (1995)
and Worsfold (1999). Contrary to the results of current study, Benkhoff (1997), Collins
(2001), Ingelgard & Norrgren (2001) found a significant influence of OC on financial
performance. The present study did not reveal a significant influence of OC on objective
measures of organizational performance. An employee that shows acceptance towards the
values of the organization is highly unlikely to quit on the organization, both in terms of
reduced effort to complete the task and leaving the organization altogether. Hence, it leads to
long-term working relationship between the employee and the organization, helping
organization attain increased profits and enhanced performance.
Analysis of H4b discovered absence of significant influence of POS on POP.
Similarly, in the present study none of the measures of objective organizational performance
were significantly predicted by POS (H4c). Hence, both H4b and H4c were not substantiated.
In contrast to extensive theoretical support, limited empirical support is discovered to exist
for the relationship between POS and performance. The results of the present study are
dissimilar to the findings of Rhoades & Eisenberger (2002) and Armeli, Eisenberger, Fasolo
& Lynch (1998) study who found a significant relationship between POS and Performance.
Since banks operate under tight policies and procedures, there is very limited scope for
mistakes and valuing of opinions. Limited level of POS was experienced by bank employees
in the current study. This can be a reason for insignificant relationship between POS and

234
POP. However, supportive management that induces among employees the feelings of
compassion, empathy, and identification can lead to enhanced cooperation not only with the
coworkers but also with the organization.
Furthermore, the analysis of H5b revealed a significant negative influence of RS on
POP. The results showed that an increase in RS that comprised of role ambiguity and role
conflict would lead to a decline in organizational performance. The influence of RS on
objective measures of performance was not found, hence H5c was not substantiated. As
highlighted in the literature, there is lack of empirical support for the influence of role stress
on organizational performance, thus the present study adds to the existing body of research.
The finding is in line with the theoretical assertions that highlight a detrimental effect of
stress on performance (Stamper & Johlke, 2003; Noblet, 2003).
The last of the internal organizational factors was IM, H6b hypothesized that there
exists a significant positive influence of IM on POP. The hypothesis was substantiated and a
significant positive influence of IM was found on POP. Hence, it reveals the IM is
instrumental in the creation of organizational competencies and business performance (Saad,
Ahmad, & Rafiq, 2002). No significant influence was found of IM on financial performance.
Hence H6C was not supported. This finding is dissimilar to the findings of Greenley & Lings
(2002) and Bouranta, Chitiris, & Paravantis (2009) who found a significant influence of IM
on financial performance
The results of the current study reveal that none of the internal organizational factors
significantly predicted the financial performance. As for perceived POP, Only two measures
(CC & POS) did not have a significant influence on POP.

235
6.2. What factors affect ISQ?
The findings of the research question one are based on the validated structural model
that was subsequently purified using CFA as discussed in chapter 4. Regression along with
the coefficients and p value was presented in the table corresponding to the regression
models.
Research question two evaluated the influence of different internal organizational
factors on ISQ. To determine the influence of different internal organizational factors on ISQ,
different hypotheses were proposed. To answer the research question two, six hypotheses
were developed (H1a, H2a, H3a, H4a, H5a, and H6a).
H1a: There is a significant impact of Organizational Learning on ISQ
H2a: There is a significant impact of Organizational Collaborative Culture on ISQ
H3a: There is a significant impact of Organizational Commitment on ISQ.
H4a: There is a significant impact of perceived organizational support on ISQ
H5a: There is a significant impact of Role Stress on ISQ
H6a: There is a significant impact of Internal Marketing on ISQ
Analysis of H1a evaluated the influence of OL on ISQ. The results revealed an
insignificant influence of OL on ISQ. In the current study, the multiple regression models
illustrates that ISQ is not significantly predicted by OL. The results are contrary to the
assertion of Zohrabi, Mahdavi, & Mahdavi (2013) who noted that OL can help in improving
service quality, Pasebani, Mohammadi, & Yektatyar (2012) who in their study found a
significant influence of OL on ISQ. Lack of significance in the current study does imply
limited focus of the banks on organizational learning. Mean analysis of the organizational
learning construct does reveal a limited agreement on part of the employees that banks have
taken initiatives to become an organization of knowledge. Failure to reveal a significant

236
influence does not undermine the significance of learning in fostering ISQ. An organization
that fails to turn itself into an entity that not only acquires knowledge but also distributes it
amongst its employees is ultimately heading towards destruction. A knowledgeable employee
can be decisive in the success or failure of service delivery. Lack of knowledge can cause
delays in the deliverance of timely and accurate service since, there would be too many weak
links in the service delivery chain that ultimately provide services.
Analysis of H2a evaluated the influence of CC on ISQ. The results revealed an
insignificant impact of CC on ISQ. Hardly any evidence in the literature is found that tested
the influence of CC on ISQ. However literature does show the influence of different forms of
culture on ISQ. Raub (2008) found a negative relationship between bureaucratic culture and
service quality, the findings of the present study are contrary to the findings of Agbenyiga
(2011), who found a significant influence of organizational culture on service quality. The
lack of significance does not imply that the business may not focus on organizational culture.
Different forms of culture may shape ISQ differently. The positive impact of cooperation,
collaboration, respect and value is well established in the literature. An existence of these
norms within the organization certainly carries its weight in deliverance of quality, since
employees become more approachable, connected and easy to communicate with.
H3a evaluates the influence of OC on ISQ. The present study substantiated the
proposition that OC has a positive and significant influence on ISQ. This indicates that a
higher level of commitment shown by the employees towards their organization would lead
them to be more responsive, trustworthy, compassionate, and willing towards their
coworkers. The findings of the present study are similar to the Boshoff and Mels (1995) who
in their study of OC and ISQ also found a significant influence of OC on ISQ in insurance
salespeople. This further strengthens the assertion by O'Riordan, J. (2003) that commitment

237
can play its role in development of internal customer service, and commitment will lead
employees to care for the colleagues as if it is their duty. An employee’s decision to provide
service to an organization wholeheartedly or not depends in large part on how employee feels
about the organization, job and coworkers. Which in this particular case was considerably
high. The significant linkage between OC and ISQ could be attributed to the fact that
employees feel proud in telling others that they work for a particular bank and that they care
about the fate of the bank. Bank initiatives that help members to identify themselves with
organizational goals and objectives will aid in enhancing internal service quality through
increased discretionary effort.
Next hypothesis H4a evaluated the relationship between POS and ISQ. The study did
not find any significant relationship between POS and ISQ. This could be attributed to the
fact that none of the items average score in the construct POS was over 5, that represents
Somewhat Agree on the rating scale. This forms the perception of the bank employees that
they don’t receive adequate support from the bank. Thus the link between POS and ISQ was
found to be insignificant. Although, there is insufficient research that evaluates the impact of
POS on ISQ, however, existing research studies support the notion that POS can result in
positive employee behaviours.
Hypothesis H5a evaluated if there exists a negative significant relationship between
RS and ISQ. The current study found a negative significant relationship between RS and ISQ.
Research conducted by Brown and Uehara (2008) found a negative relationship between
stress and service. The respondents in the present study had a low role ambiguity, and such is
expected in banks where roles are clearly defined and employees have a well-established job
description. Thus it could be asserted that the clarity in job role would have helped employees
in providing adequate service to the co-workers.

238
Hypothesis H6a evaluated if IM carries a significant influence on ISQ. The present
study found a significant influence of IM on ISQ. Available literature on the impact of IM on
ISQ has shown significant influence of IM on ISQ (Lings & Brooks, 1998; Lings & Greely,
2005). In the present study the mean analysis definitely reveal a significant amount of IM
initiative undertaken by the banks for its employees. This would help employees in becoming
more committed to the organizations, as revealed earlier; the employees exhibited a level of
commitment towards the organization. Thus internal marketing initiative would have helped
in integrating the employees and create a better organizational climate.
6.3. What is the impact of ISQ on organizational performance?
The findings of the research question one are based on the validated structural model
that was subsequently purified using CFA as discussed in chapter 4.
Research question evaluated the influence of ISQ on both financial and non-financial
performance. In order to evaluate the influence of ISQ on organizational performance,
different hypotheses were proposed. To answer the research question three, four hypotheses
were developed (H7a, H7b1, H7b2, and H7b3).
H7a: There is a significant impact of ISQ on Perceived Organizational Performance
H7b1-2-3: There is a significant impact of ISQ on objective organizational performance
(EPS, ROE, & ROA)
The analysis revealed a significant influence of ISQ on both POP and Financial
performance indicators (EPS, ROE, & ROA). Hence, the entire four hypotheses were
substantiated. Study by Bellou and Andronkidis (2008) has shown significant positive
influence of ISQ on organizational performance.

239
The results reveal a higher degree of responsiveness in bank employees. The results
reveal a significant level of responsiveness by the employees towards their coworkers, this is
a significant factor of ISQ (Zhen-You, 2003), and this improved attitude towards coworkers
helps in attaining improved organizational performance. Responsiveness corresponds to the
fact that bank employees deliver timely service, since operations in bank are interconnected
to each other, provision of timely service to coworkers can significantly enhance quality of
service provided to the customers, and subsequently would lead to the customer retention, as
well as help in achieving maximum profits.
6.4. Does ISQ act as mediator between internal organizational factors & organizational
performance?
The final research question seeks to ascertain if ISQ mediates between internal
organizational factors and organizational performance. To unearth the answer to this research
question a number of different hypotheses were proposed that stipulated if ISQ mediates
between different internal organizational factors and subjective and objective measures of
organizational performance. No literature is found that explicitly investigates the mediating
role of ISQ. Thus, this study appears to be the first to analyze if ISQ mediates the relationship
between internal organizational factors and organizational performance. However, existing
literature helps in establishing a causal relationship between different internal organizational
factors, ISQ, and organizational performance. Mediating analysis has helped in building and
refining the theory, the present study further facilitated in understanding the causal inference
since earlier studies merely evaluated the direct relationship between the variables. The study
has established the role ISQ can play in explaining the relationship between different internal
organizational factors and organizational performance.
The mediating effects helps assess whether the relationship between two variables is
direct or whether it occurs indirectly through some third (i.e., mediating) variable (Shaver,

240
2005). Mediation analysis proved partial mediation between all internal organizational factors
and perceived organizational performance. This showed that the relationship between
different internal organizational factors and ISQ to a certain extent (partially) occurs through
the mediating variable ISQ. ISQ when used a mediator showed partial mediation between OL
and POP. Similarly, ISQ partially mediated between CC and POP. ISQ also partially
mediated the path between OC and POP. Partial mediation was also supported between POS
and POP. ISQ also partially mediated the path between RS and POP; likewise partial
mediation was supported between IM and POP. Thus, it is partially supported that internal
organizational factors carry an impact on subjective organizational performance through ISQ.
This shows that satisfaction with different internal organizational factors increase an
employee’s drive to perform well, this initiates positive behaviours among employees, they
are willing to show discretionary behaviours and also prepared to get involved with other
employees. The enthusiasm and conviction of employees is communicated to the coworkers
and hence facilitates employee performance that significantly improves the organizational
performance.
In case of mediation analysis between different internal organizational factors and
financial organizational performance, ISQ certainly depicted full mediation on a number of
instances. The study revealed that ISQ utterly mediates the path between OL and ROE, CC
and ROE, CC and ROA, and IM and ROE. The findings further ascertain the role of ISQ as
mediating variable between different internal organizational factors and organizational
performance. This communicates that the effect of ISQ in improving organizational
performance cannot be negated. Organizations with respect to all other factors shall consider
ISQ, and take concrete steps that foster ISQ.

241
6.5. Discussion on Measurement and Structural Models
In this research attempt, eight measurement models were identified. Six constructs
pertinent to internal organizational factors were evaluated along with ISQ and POP. At the
very first stage, the constructs were evaluated using EFA, the items were purified and items
with low factor loadings and multicollinearity were removed from further analysis.
Furthermore, the constructs were refined and verified for unidimensionality, validity and
reliability by performing CFA. Each of the measurement models displayed good fit, with all
items depicting acceptable loadings and construct reliability.
Exploratory factor analysis revealed two underlying factors in ISQ. This is
contradictory to theoretical dimensions of Reliability, Assurance, Empathy and
Responsiveness identified by Parasuraman, Berry and Zeithaml (1988), Kuei (1999) and
Kang, James, and Alexandris (2002). However the findings of the present study complements
the criticism levelled by Buttle (1996) on the service quality scale. The present study as
identified by Buttle found that items do not load onto the factors which one would expect.
A total of nine structural models were tested to determine the impact of predictors
over criterion variables. The models can also be termed as regression models. Structural
Model A assessed the influence of different internal organizational factors on ISQ. ISQ was
measured by two sub-factors empathy & responsiveness and reliability. The results of CFA
indicated a good model fit. The results of Structural Model A showed that three out of six
internal organizational factors significantly influence ISQ. The significant variables were OC,
RS and IM while insignificant variables were CC, OL and POS.
Structural Model B assessed the influence of different internal organizational factors
on POP. The results of CFA indicated a good model fit. The results of Structural Model B
showed that four out of six internal organizational factors significantly influence POP. The

242
significant variables were OL, OC, RS and IM while insignificant variables were CC and
POS.
Structural Model C assessed the influence of different internal organizational factors
on financial performance. Each of the financial performance measures (EPS, ROE and ROA)
were tested separately using different models. Thus the sub models could be referred to as
structural model C1-2-3. The results of CFA indicated a good model fit. The results of
Structural Model C2 and Structural Model C3, testing the influence of internal organizational
factors on EPS, ROE and ROA revealed no significant influence of any of internal
organizational factors over the financial measures (EPS, ROE and ROA).
Structural Model D assessed the influence of ISQ on POP. The results of CFA
indicated a good model fit. The results of Structural Model D exhibited that ISQ had a
significant influence on POP.
Structural Model E assessed the influence of ISQ on financial performance. Each of
the financial performance measures (EPS, ROE and ROA) were tested separately using
different models. Thus, the sub-models could be referred to as structural model E1-2-3. The
results of CFA indicated a good model fit. The results indicated a significant influence of ISQ
on all the three financial measures. ISQ influence on POP was also found significant in
earlier structural model D. This further highlights the importance of ISQ in attaining better
organizational performance.
6.6. Conclusions
The overarching goal of this dissertation was to examine whether ISQ acts as a
mediator between different factors internal to the organization and organizational
performance. The lack of research in this area highlights a knowledge gap. This study aims to

243
address this gap and in doing so provide directions to sustain and improve business
performance.
The study started with extensive review of relevant theoretical literature that focuses
on inter organizational factors, ISQ, and Organizational Performance. Internal organizational
factors that were part of the study included organizational learning, collaborative culture,
organizational commitment, internal marketing, role stress (role conflict and role ambiguity),
and perceived organizational support. Review of the literature revealed a significant lack of
empirical studies that investigated the influence of different internal organizational factors on
ISQ; however there is substantial literature on how different internal organizational factors
influence both perceived and objective measures of organizational performance. Moreover
there is a significant lack of research that investigates the mediating role of ISQ. Literature
highlights that different internal organizational factors have a significant influence on ISQ,
and furthermore ISQ has a significant influence on organizational performance, based on this
causal relationship it was hypothesized that there is an indirect influence of different internal
organizational factors on organizational performance, mediated by ISQ. Extensive review of
literature led to the development of empirically testable hypotheses.
The study was a survey based research with a positivist research paradigm with a
deductive approach that utilized quantitative approaches (Blaxter, Hughes, & Tight, 2006).
The population of the study was drawn from Karachi Stock Exchange (KSE) with banks
having more than five branches in the city of Peshawar. Stratified random sampling technique
was utilized with banks divided into two strata of medium and large banks. Questionnaire
was drafted based on the existing constructs from previous studies and was tested using
Dillman (2000) four stages of validation. A few items were removed during the pre-testing
phase. Data were inserted into the software SPSS, the descriptive analysis was conducted
using SPSS; moreover measurement and structural models were developed using AMOS.

244
The first structural model evaluated the influence of different internal organizational
factors on ISQ. The results showed that out of six, three factors were found to have
significant influence on ISQ. The three factors were organizational commitment, role stress
and internal marketing, while collaborative culture, organizational learning and perceived
organizational support were found insignificant. Based on the findings of this structural
model, the research concludes that for the banks to improve the level of ISQ, the banks
should make efforts to improve the level of employee satisfaction with the significant factors
highlighted in the present study and in the existing literature, the better the level of internal
organizational factors the higher would be the level of service the coworkers provide to each
other.
Another important objective of the study was to determine the factors that
significantly influence both perceived and objective measures of organizational performance.
Multiple regression model showed that four factors were found to have significant influence
on perceived organizational performance while two factors had no significant influence.
Organizational learning, organizational commitment, role stress, and internal marketing were
significant however, collaborative culture and perceived organizational support had no
significant influence on perceived organizational performance. None of the internal
organizational factors had a significant influence on any of the objective measures of
organizational performance. The significant influence of internal organizational factors on
perceived organizational performance further strengthened the findings of existing literature
that also showed significant relationship between different factors and performance,
furthermore vigor to the assertion that organizations shall continue to invest in the significant
factors.
The study also evaluated the influence of ISQ on both objective and subjective
measures of organizational performance. The results indicated that ISQ had a significant

245
influence on both the subjective and objective measures of organizational performance. The
finding strengthens the assertion that unless organizational focus on the service received by
coworkers, the organization cannot attain adequate level of profitability and may not be able
to ensure external service quality that would ultimately harm business performance.
Furthermore, the research main interest was if ISQ acts as a mediator between internal
organizational factors and organizational performance. The finding was partially supported in
case of mediation between different internal organizational factors and perceived
organizational performance, the relationship between all internal organizational factors and
organizational performance was partially mediated. As for objective organizational
performance, ISQ fully mediated the relationship between organizational learning and return
on equity, collaborative culture and return on equity, internal marketing and return on equity.
This further substantiates the assertion that ISQ mediates the relationship between internal
organizational factors and performance implying the need to foster ISQ.
6.7. Implications of the Study
This research elucidates the literature through a number of contributions. Foremost,
the present study is the first to incorporate several different internal organizational factors to
review its impact on ISQ. This is especially significant in highlighting the factors that notably
predict and sustain an influence on ISQ. This would help the business to apprehend the value
of different internal organizational factors in establishing satisfactory ISQ. The management
can in turn shift their focus over variables that can help in fostering ISQ.
Secondly, existing study adds to the literature by investigating the influence of
different internal organizational factors on both subjective and objective measures of
organizational performance. Although there have been research that individually evaluated
the influence of different factors on organizational performance, but to date no research has

246
taken these six factors into account. Multiple regression models identified that four out of six
factors significantly influence POP.
Third, the study ascertains that ISQ has a significant influence in predicting both
subjective and objective organizational performance measures. Such a research is scarce that
investigates the relationship, empirical research is heavily focused on external service quality
that had repeatedly noted significant influence of ISQ on performance (Zeithaml, Bitner, &
Gremler, 2006; Prakash & Mohanty, 2012), the present research invigorates the theoretical
assertions that unless ISQ is not strengthened organization will not be able to attain external
service quality, growth and profit (Cook, 2004). Thus it is important for the performance of
business to have strong foundation of ISQ.
Fourth, the present study ascertains if ISQ mediates between different organizational
factors and organizational performance. Direct influence of the factors is supported from the
literature; the study found existence of partial mediation of ISQ between different internal
organizational factors and POP, while ISQ fully mediated the path between some of the
internal organizational factors and financial measure of performance (ROE). This augments
the literature, since there is a dearth of research on the mediating role of ISQ between
different factors and different book measures of organizational performance.
The mediated effect of ISQ is important to top management, implying their
responsibility for investing to create an environment that nurtures trust, understanding,
commitment, provision of timely service, and positivity in attitude and behavior.
Management which expects to reap benefits of service quality must understand the need of
better ISQ and should invest in the intangible factors that have been proven to affect the
tangible profits. Banks operate under tight guidelines; it is for the management to understand
that each bank branch is supplied with adequate and well trained staff, tangible resources to

247
carry out office duties, training schedules, employee support programs and clear reward
management system that fosters collaboration, support, togetherness and collectivity. The
present research highlights the items that are either highly rated or lowly rated by the bank
workers. One such factor is POS, the mean analysis revealed a low average score on all the
items, highlighting the fact that banks need to provide more support to their staff in order to
foster motivation, commitment and goal attainment that would turn into an asset for the
business and help in that aids in achievement of performance.
The present research has strong practical implications. First and foremost the research
study shows it is not only external service quality that adds to the profitability of the
organizations. The research has displayed significant influence of ISQ on both perceived and
objective measures of organizational performance. This shows that it is imperative for the
banks to ensure that they take initiatives that foster ISQ. Furthermore, a new paradigm is
added to existing research that has repeatedly evaluated the influence of different internal
organizational factors on organizational performance, the influence is mediated, although in
most cases partially by ISQ implies that executives should be moving ahead by considering
implementation of initiatives that further strengthen ISQ with the expectation for a business
performance improvement. Investment involves activities that clearly highlight distinct job
roles, learning initiatives that help short and long term development, communication and
development of believe in the mission and vision, and concrete rewards for performance.
Failure to make proper consideration for improvements in ISQ may seriously affect
organizational performance, since employees may not be able to provide timely and adequate
service desired by their coworkers.

248
6.8. Limitations and Delimitations
Research is constrained by schedules, resources and scope. These constraints limit the
research. Every research is restricted by a number of constraints; the present research is no
exception. In terms of the research methodology, the study uses cross-sectional data and
hence causality of the relationships between predictor and criterion variables should not be
implied from results of this study (Barczak, Lassk, & Mulki, 2010). There may be many
aspects and findings that a longitudinal study can reveal. Bank workers work under tights
time schedules with multitude of customers waiting to be served, extracting time to complete
a detailed questionnaire can be a tough ask as well as a challenging endeavor. Thus, a number
of questionnaires were half filled, and a number of time repeated reminders and visits were
made to collect the questionnaires. Another limitation is that the data collected was confined
to one city. Peshawar is the capital of one of four provinces in the country and is a big city
with all banks operating in the city. This may limit the generalizability of the research. The
present study is limited to large and medium sized banks listed in KSE, the study may be
extended to other international and small banks.
6.9. Directions for Future Research
There is always room for the researcher to improve the research and delve into new
directions. The future research may consider more than one city for data collection with the
inclusion of small and other international banks operating in the country. The selection of
different factors in the study was based on the extensive review of literature, future research
study may be based on the selection of factors on preliminary interviews from the bankers.
Furthermore, the study one takes into account only one dimension of organizational culture,
further research may also include different cultural typologies. For instance further research
may include the dimensions namely; human resource orientation, interdepartmental

249
coordination, and improvement orientation as identified by Van den Berg and Wilderom
(2004) or the typologies identified by Cameron and Quinn (2011). The present study only
focuses on the shorter version of Mowday, Steers and Porter (1979) organizational
commitment scale. Apart from this, future research may include different dimensions of
organizational commitment. The future study may utilize Meyer and Allen (1991) three
dimensional construct of commitment which includes affective, normative and continuance
commitment constructs. The present study addresses an area that has significant implications
for banking services theory and practice. Continued refinement of the scale for measuring
internal service quality in retail banking, proposed in this study, is certainly possible based on
further research and trends in retail banking. The current study evaluates the direct influence
of internal service quality on organizational performance, future research may include other
factors in the Heskett (1994) service profit chain.
6.10. Recommendations
Changing people’s attitudes and behaviours takes time. An organization wishing for
its employees to show positive work related behaviours will have to undertake a number of
different initiatives, and will have to wait to reap the fruits of the efforts since the
development of an internal customer service ethos takes time. However a number of different
points are recommended that the organizations can focus on to foster the different internal
organizational factors and internal service quality that will in the longer run help business
improve its performance.
a. Banks in Pakistan operate under tight control, through increased regulations. Factors
such as transformational leadership, innovation, creativity, and entrepreneurship
might not be very much applicable. Hence, banks shall focus their energies on factors
that are in their control and try to nurture factors that can lend a helping hand in
creating an environment where service quality thrives.

250
b. First and foremost initiative that any organization needs to undertake is to start
valuing its internal customers, i-e employees. The essence of the statement is that if a
top management wishes its employees to deliver an outstanding level of service to
customers, then it must be prepared to do a great job with its employees’ by not only
providing the tangible rewards but also working on the motivators (in-tangible
factors).
c. Bank can improve the level of internal service quality by improving work
environment, plus branch management should make sure there is no power politics.
This can be achieved through equal opportunities along with equal rights and duties.
d. Internal service can significantly improve if the software’s, and other resource are
easy to use and are more supportive to the employee with less number of steps to
accomplish a task.
e. To counter role stress the management must ensure equal distribution of work.
Management must make sure that every member should pull their weight.
f. Management can improve the commitment profile of the employees through offering
growth and development opportunities from time to time, and through improved
actionable learning through well designed training programs and performance based
pay.
g. Bank can build a strong culture through emphasis on better recruitment and selection
practices with adequate focus on socialization of staff that would help them
understand not just each other but the bank as well.
h. Organizations need to create an approach that promotes the feeling among employees
that organizations’ loss is their loss and its profit is their profit.
i. Training for the sake of training will not yield maximum returns for the bank. Banks
shall make training more practical in nature. Trainings that helps create network and

251
build teams. This can be achieved by maintaining an employee skills database plus
keeping a close eye on the external environment and changes that take place in the
financial circle. Furthermore, the database shall be linked to the bankers’ career
objectives. This will help link individual and organizational objectives.

252
References
Abdalkrim, G. M. (2013). The impact of strategic planning activities on private sector
organizations performance in Sudan: an empirical research. International Journal of
Business and Management, 8(10), 134-143.
Ahmed, A., & Ahsan, H. (2011). Contribution of services sector in the economy of Pakistan.
Working Papers & Research Reports, 2011.
Ahmed, P., & Rafiq, M. (2003). Internal marketing issues and challenges. European Journal
of Marketing, 37(9), 1177-1186.
Ahmed, P. K., Rafiq, M. & Saad, N. M. (2003). Internal marketing and the mediating role of
organizational competencies. European Journal of Marketing, 37(9), 1221-41.
Akdemir, B., Erdem, O., & Polat, S. (2010). Characteristics of high performance
organizations”, Suleyman Demirel University Journal of Faculty of Economics &
Administrative Sciences, 15(1), 155-174.
Akroush, M. N., Abu-ElSamen, A. A., Samawi, G. A., Odetallah, A. L. (2012). Internal
marketing and service quality in restaurants. Marketing Intelligence & Planning, 31(4),
304-336
Al-Enezi, A. (2012). Assessment of the Service Quality Provided by the Kuwaiti Cultural
Office in Cairo: An Empirical Investigation. International Journal of Public
Administration, 35(9), 643-655.
Al-Marri, K., Ahmed, A., & Zairi, M (2007). Excellence in service: An empirical study of the
UAE banking sector. International Journal of Quality & Reliability Management,
24(2), 164-176.
Anderson, E. W., Fornell, C., & Lethman, D. R. (1994). Customer satisfaction, market share,
and profitability. Journal of Marketing, 58(7), 53-66.

253
Anderson, J. C., & Gerbing, D. W. (1988). Structural equation modelling in practice: A review
and recommended two-step approach. Psychological Bulletin, 103(3), 411- 423.
Anderson, D. R., Sweeney, D. J., & Williams, T. A. (2011). Statistics for business and
economics (2nd ed.). Mason, OH: South-Western, Cengage Learning.
Andrews, R., Boyne, G. A., & Walker, R. M. (2006). Strategy content and organizational
performance: An empirical analysis. Public Administration Review, 66(1), 52-63.
Andy, P. (2005). Discovering Statistics Using SPSS:(and Sex and Drugs and Rock'n'Roll).
Sage publications.
Anosike, U. P., & Eid, R. (2011). Integrating internal customer orientation, internal service
quality, and customer orientation in the banking sector: An empirical study. The Service
Industries Journal, 31(14), 2487-2505.
Appealbaum, S., Bartolomucii, No, Beaumier, E., Boulanger, J., Corrigan, r., Dore, I., Girard,
C., & Serroni, C. (2004). Organizational Citizenship behaviour a case study of culture,
leadership and trust. Management Decision, 42(1), 13-40.
Argyris, C., & Schön, D. A. (1978). Organizational learning: A theory of action perspective.
Reading, MA: Addison-Wesley.
Argyris, C. & Schön, D. (1996). Organizational learning II: Theory, method and practice,
Reading, Mass: Addison Wesley.
Armeli, S., Eisenberger, R., Fasolo, P., & Lynch, P. (1998). Perceived organizational support
and police performance: The moderating influence of socioemotional needs. Journal of
Applied Psychology, 83(2), 288.
Agarwal, S., & Ramaswami, S. (1993). Affective organizational commitment of salespeople:
An expanded model. Journal of Personal Selling & Sales Management, 13(2), 49-70.
Awasthy, R., Vijayalakshmi, C., & Gupta, R. K. (2012). Organizational Changes in the Bank
of Baroda. Asian Case Research Journal, 16(01), 65-92.

254
Bahir, K., & Nantel, J. (2000). A reliable and valid measurement scale for the perceived service
quality of banks. International Journal of Bank Marketing, 18(2), 84-91.
Bai, B., Brewer, P., Sammons, G., & Swerdlow, S. (2006). Job satisfaction, organizational
commitment, and internal service quality. Journal of Human Resources in Hospitality
& Tourism, 5(2), 37-54.
Bajpai, N. (2011). Business research methods. Pearson Education India.
Ballantyne, D. (2000). The strengths and weaknesses of internal marketing. Internal
Marketing: Directions for Management, Routledge, London, 43-60.
Bandalos, D. L., & Finney, S. J. (2010). Factor analysis: Exploratory and confirmatory. In G.
R. Hancock & R. O. Mueller (Eds.), the reviewer’s guide to quantitative methods in the
social sciences (pp. 93-114). New York: Routledge.
Bani-Hani, J. S., Al-Ahmad, N. M., & Alnajjar, F. J. (2009). The impact of management
information systems on organizations performance: field study at Jordanian
universities. Review of Business Research, 9, 127-137.
Barczak, G., Lassk, F., & Mulki, J. (2010). Antecedents of team creativity: An examination of
team emotional intelligence, team trust and collaborative culture. Creativity and
Innovation Management, 19(4), 332-345.
Baron, R. M., & Kenny, D. A. (1986). The moderator–mediator variable distinction in social
psychological research: Conceptual, strategic, and statistical considerations. Journal of
personality and social psychology, 51(6), 1173.
Bellou, V., & Andronikidis, A. (2008). The impact of internal service quality on customer
service behaviour: Evidence from the banking sector. International Journal of Quality
& Reliability Management, 25(9), 943-954.
Bentler, P. M. (1990). Comparative fit indexes in structural models. Psychological bulletin,
107(2), 238.

255
Berry, L. (1981). The Employee as Customer. Journal-of-Retail-Banking. 3(1), 33-40
Berry, L. L., Hensel, J. S., & Burke, M. C. (1976). Improving retailer capability for effective
consumerism response. Journal of Retailing, 52(3), 3-14.
Benkhoff, B. (1997). Ignoring commitment is costly: new approaches establish the missing link
between commitment and performance. Human relations, 50(6), 701-726.
Beugelsdijk, S., Koen, C. I., & Noorderhaven, N. G. (2006). Organizational culture and
relationship skills. Organization Studies, 27(6), 833–854.
Bhattacherjee, A., & Sanford. C. (2006). Influence processes for information technology
acceptance: An elaboration likelihood model. MIS Quarterly, 30(4), 805-825.
Blau, P. M. (1964). Exchange and power in social life. New York: Wiley.
Blaxter, L., Hughes, C & Tight, M. (2006). How to research (3rd ed.). Poland: Open University
Press.
Booth, S. A., & Hamer, K. (2009). Corporate culture and financial performance: an empirical
test of a UK retailer. International Journal of Retail & Distribution Management, 37(8),
711-727.
Boshoff, C., & Mels, G. (1995). A causal model to evaluate the relationships among
supervision, role stress, organizational commitment and internal service quality.
European Journal of Marketing, 29(2), 23-42.
Boshoff C., & Tait M. (1996). Quality perceptions in the financial service sector: the potential
impact of internal marketing. International Journal of Service Industry Management
17(5), 5–31.
Bouranta, N., Chitiris, L., & Paravantis, J. (2009). The relationship between internal and
external service quality. International Journal of Contemporary Hospitality
Management, 21(3), 275-293.

256
Bouranta, N., Mavridoglou, G., & Kyriazopoulos, P. (2005). The impact of internal marketing
to market orientation concept and their effects to bank performance. Operational
Research, 5(2), 349-362.
Brandon-Jones, A., & Silvestro, R. (2010). Measuring internal service quality: Comparing the
gap-based and perceptions-only approaches. International Journal of Operations &
Production Management, 30(12), 1291-1318.
Brett, J. F., Cron, W. L., & Slocum, J. W. (1995). Economic dependency on work: a moderator
of the relationship between organizational commitment and performance. Academy of
Management Journal, 38(1), 261-271.
Brooks, R. F., Lings, I. N., & Botschen, M. A. (1999). Internal marketing and customer driven
wavefronts. Service Industries Journal, 19(4), 49-67.
Brown, T. A. (2012). Confirmatory factor analysis for applied research. Guilford Press.
Brown, T. A. (2006). Confirmatory factor analysis for applied research. New York: The
Guilford Press.
Brown, Z. A., & Uehara, D. L. (2008). Coping with teacher stress: A research synthesis for
Pacific education.
Brown, Z. A., & Uehara, D. L. (1999). Coping with teacher stress: A research synthesis for
Pacific educators. Honolulu, HI: Pacific Resources for Education and Learning.
Browne, M. W., & Cudeck, R. (1993). Alternative ways of assessing model fit. In K. A. Bollen
& J. S. Long (Eds.), Testing structural equation models (pp. 136-162). Newsbury Park,
CA: Sage.
Bstieler, L., & Hemmert, M. (2010). Increasing Learning and Time Efficiency in
Interorganizational New Product Development Teams*. Journal of Product Innovation
Management, 27(4), 485-499.

257
Carmeli, A., & Tishler, A. (2004). Resources, capabilities, and the performance of industrial
firms: A multivariate analysis. Managerial and decision economics, 25(6‐7), 299-315.
Chang, K., & Lu, L. (2007). Characteristics of organizational culture, stressors and wellbeing:
The case of Taiwanese organizations. Journal of Managerial Psychology, 22(6), 549-
68.
Chang, K., & Lu, L. (2009). The influence of occupation on stressors and work behaviours. The
International Journal of Human Resource Management, 20(3), 591-605.
Chiang, C., & Hsieh, T. (2012). The impacts of perceived organizational support and
psychological empowerment on job performance: The mediating effects of
organizational citizenship behavior. International Journal of Hospitality Management,
31(180-190).
Choudhary, A.I., Akhtar, S.A. and Zaheer, A. (2013), “Impact of transformational and servant
leadership on organizational performance: a comparative analysis”, Journal of Business
Ethics, Vol. 116 No. 8, pp. 433-440.
Choudhury, K. (2014). Service quality and word of mouth: a study of the banking sector.
International Journal of Bank Marketing, 32(7), 612-627.
Christensen, E., Coombes-Betz, K., & Stein, M. (2007). The certified quality process analyst
handbook. Wisconin, USA: American Society for Quality.
Christo, B., & Pienaar, J. (2006). South Africa correctional official occupational stress: The
role of psychological strengths. Journal of Criminal Justice, 34(1), 73-84.
Chuang, P.-T. (2010). Incorporating disservice analysis to enhance perceived service quality.
Industrial Management & Data Systems, 110(3), 368-391.
Churchill, G. A., Jr. (1979), “A Paradigm for Developing Better Measures of Marketing
Constructs,” Journal of Marketing Research, Vol. 16 (February), pp. 64–73.
Collins, J. (2001). Good to great. New York: Harper Collins.

258
Congram. C. A., & Friedman. M. L. (1991). The quality-leadership connection in service
business. In C. Congram (Ed.). Handbook of marketing for the service industries (pp.3-
19). New York: American Management Association.
Cook, S. (2004). Measuring customer service effectiveness. Hants, England: Gower.
Cook, S. (2008). The essential guide to employee engagement: Better business performance
through staff satisfaction. London: Kogan Page.
Cook, S., & Yanow, D. (2011). Culture and organizational learning. Journal of Management
Inquiry, 20(4), 355-372.
Cooper, J., & Cronin, J. J. (2000). Internal marketing: A competitive strategy for the long-term
care industry. Journal of Business Research, 48, 177-181.
Cronbach, L. J. (1951) Coefficient alpha and the internal structure of tests. Psychometrika,
22(3), 297-334.
Crosby, P. (1979). Quality is free. New York: McGraw-Hill.
Daft, R. L., & Weick, K. L. (1984). Toward a model of organizations as interpretation systems.
Academy of Management Review, 9(2), 284–295.
Dale, B., Wiele, A. v. d., & Williams, A. (2001). Quality - why do organisations still continue
to get it wrong? Managing Service Quality, 11(4), 241-248.
Dawley, D. D., Andrews, M. C., & Bucklew, N. S. (2008). Mentoring, supervisor support, and
perceived organizational support: what matters most? Leadership & Organization
Development Journal, 29(3), 235-247.
Day, G. S. (1994). Continuous learning about markets. California Management Review, 36, 9-
9.
De Laurentis, G., Maino, R., Molteni, L. (2011). Developing, Validating and Using Internal
Ratings: Methodologies and Case Studies. Wiley

259
De Waal, A.A. (2012), “Does quality matter in a high-performance organization?”, Journal for
Quality and Participation, Vol. 35 No. 3, pp. 4-8.
Deming, W. (1982), Quality and Productivity and Competitive Position, MIT Center for
Advanced Engineering Study, Cambridge, MA.
Deming, W. (1986),Out of the Crisis, MIT Center for Advanced Engineering Study,
Cambridge, MA.
Dinitzen, H., & Bohlbro, D. (2010). Value-added logistics in supply chain management.
Copehagen, Denmark: Academica.
di Patti, E. B., & Hardy, D. C. (2005). Financial sector liberalization, bank privatization, and
efficiency: Evidence from Pakistan. Journal of Banking & Finance, 29(8), 2381-2406.
Di Xie, M. (2005). Exploring organizational learning culture, job satisfaction, motivation to
learn, organizational commitment and internal service quality in a sport organization.
School of the Ohio state university.
Douglass, M., Calantone, R., & Keller, S. (2005). Internal service quality: Determinants of
distribution center performance. International Journal of Physical Distribution &
Logistics Management, 35(3), 161-176.
Drake, S., Gulman, M., & Roberts, S. (2005). Light their fire: Using internal marketing to
ignite employee performance and wow your customers. Chicago: Dearborn Trade
Publishing.
Dua, J. K. (1994). Job stressors and their effects on physical health, emotional health and job
satisfaction in a university. Journal of Educational Adminstration, 32, 59-78.
Dunne, P. A., & Barnes, J. G. (2000). Internal marketing: a relationships and value creation
view. Internal marketing: Directions for management, 192-222.

260
Dwyer, S., Richard, O. C., & Chadwick, K. (2003). Gender diversity in management and firm
performance: the influence of growth orientation and organizational culture. Journal of
Business Research, 56(12), 1009-1019.
Easterby-Smith, M., Thorpe, R., & Lowe, A. (2002), Management Research: An Introduction
(2nd ed.). London: SAGE publications.
Edwards, J. R. (1992). A cybernetic theory of stress, coping, and well-being in organizations.
Academy of Management Review, 17(2), 238-274.
Eisenberger, R., Huntington, R., Hutchinson, S., & Sowa, D. (1986). Perceived organizational
support. Journal of Applied Psychology, 71, 500-507.
Ellinger, A. D., Ellinger, A. E., Yang, B., & Howton, S. W. (2002). The relationship between
the learning organization concept and firms' financial performance: an empirical
assessment. Human resource development quarterly, 13(1), 5-22.
ELSamen, A., & Alshurideh, M. (2012). The impact of internal marketing on internal service
quality: A case study in a Jordanian pharmaceutical company. International Journal of
Business and Management, 7(19), 84-95.
Evans, J. R. (2005). Total quality: Management, organization and strategy (4th ed.).
Thomson/South Western.
Fairbrother, K., & Warn, J. (2003). Workplace dimensions, stress and job satisfaction. Journal
of managerial psychology, 18(1), 8-21.
Farner, S., Luthans, F., & Sommer, S. (2001). An empirical assessment of internal cusotmer
service. Managing Service Quality, 11(5), 350-358.
Field, A. (2005). Discovering statistics with SPSS.
Fisk, R. P., Brown, S. W., & Bitner, M. J. (1993). Tracking the Evolution of the Services
Marketing Literature. Journal of Retailing, 69(1), 61-103.

261
Fletcher, B., & Jones, F. (1992). Measuring organizational culture: The cultural audit.
Managerial Auditing Journal, 7(6), 30-36.
Flores, M. A. (2004). The impact of school culture and leadership on new teachers’ learning in
the workplace International Journal of Leadership in Education, 7(4), 297–318.
Foreman, S. K., & Money, A. H. (1995). Internal marketing: concepts, measurement, and
application. Journal of Marketing Management, 11, 755-68.
Fornell, C., & Larcker, D. F. (1981). Evaluating structural equation models with unobservable
variables and measurement error, Journal of Marketing Research, 18(1), 39-50.
Frost, F., & Kumar, M. (2000). INTSERVQUAL - an internal adaptation of the GAP model in
a large service organisation. Journal of Services Marketing, 14(5), 358-377.
Frost, F., & Kumar, M. (2001). Service quality between internal customers and internal
suppliers in an international airline. International Journal of Quality & Reliability
Management, 18(4), 371-386.
García‐Morales, V. J., Lloréns‐Montes, F. J., & Verdú‐Jover, A. J. (2008). The effects of
transformational leadership on organizational performance through knowledge and
innovation*. British Journal of Management, 19(4), 299-319.
Gaur, A. S., & Gaur, S. S. (2006). Statistical methods for practice and research: A guide to
data analysis using SPSS. Sage.
Gautam, T., Van Dick, R., & Wagner, U. (2004). Organizational Identification and
Organizational Commitment: District Aspects of two related concepts, Asian Journal
of Social Psychology, 7, 301-315.
Gavera, C., Ilies, L., & Stegerean, R. (2011). Determinants of organizational performance: The
case of Romania. Management & Marketing Challenges for the Knowledge Society,
6(2), 285-300.

262
Gerstner, E., & Libai, B. (2006). Why does poor service prevail? Marketing Science, 26(6),
601-603.
Getty, J. M., & Getty, R. L. (2000). Service quality starts with employees. Paper presented at
the Human Factors and Ergonomics Society Annual Meeting.
Ginevičius, R., & Vaitkūnaite, V. (2006). Analysis of organizational culture dimensions
impacting performance. Journal of business economics and management, 7(4), 201-
211.
Glaser, S. R., Zamanou, S., & Hacker, K. (1987). Measuring and interpreting organizational
culture. Management Communication Quarterly, 1(2), 173-198.
Glisson, C., & James, L. (2002). The cross-level effect of culture and climate on human service
teams. Journal of Organizational Behavior, 24(6), 767-794.
Gouldner, A. W. (1960). The norm of reciprocity: A preliminary statement. American
Sociological Review, 25, 161-178.
Gracia, E., Cifre, E., & Grau, R. (2010). Service quality: The key role of service climate and
service behavior of boundary employee units. Group & Organization Management,
35(3), 276-298.
Greenberg, J., & Baron, R. A. (2000). Behaviour in organizations (7th ed.). New Jersey:
Prentice Hall Inc.
Greener, S. (2008). Business Research Methods. Ventus Publishing, BookBook.Com.
Gronroos, C. (1985). Internal marketing – theory and practice. American Marketing
Association’s Services Conference Proceedings, 41–7.
Gronroos, C. (1990). Service management and marketing: Managing the moment of truth in
service competition. New York, NY: Maxwell Macmillan International Editions.
Gronroos, C. (2000). Service management and marketing: A customer relationship
management approach (2nd ed.). New York, NY: Wiley.

263
Gross, N., Mason, W., & McEachern, A. (1958). Exploration in role analysis. New York:
Wiley.
Gunawardane, G. (2009). Relationship between dimensions of internal service quality and the
nature of the internal service encounter: A study in the healthcare industry. California
Journal of Operations Management, 7(1), 21-30.
Gunawardane, G. (2011). Reliability of the internal service encounter. International Journal of
Quality & Reliability Management, 28(9), 1003-1018.
Gustaffson, A. (2009). Customer satisfaction with service recovery. Journal of Business
Research, 62(8), 1220-1222.
Hair, J. F., Black, W. C., Babin, B. J., Anderson, R. E., & (2009). Multivariate data
analysis (7th ed.). Upper Saddle River, NJ: Pearson Prentice Hall.
Hair, J. F., Celsi, M. W., Money, A. H., Samouel, P., & Page, M. J. (2003).Essentials of
business research methods. ME Sharpe.
Haksever, CG Cook, R. G., & Chaganti, R. (1997).Applicability of the gaps model to service
quality in small firms. Journal of Small Business Strate 8 (I), 49-66.
Hamdam, H., Pakdel, A., & Soheili, S. (2012). The study of board’s remuneration and its
relationship with accounting indicators for firm’s performance evaluation (evidence
from Tehran Stock Exchange). Australian Journal of Basic & Applied Sciences, 6(10).
Hamid Reza Ghasemian, S., Azad, N., & Seyedaliakbar, H. (2014). A structural equation model
of effective variables on service quality in capital industrial goods sector. International
Journal of Quality and Service Sciences, 6(1), 30-42.
Hamon, T. T. (2003). Organizational effectiveness as explained by social structure in a faith-
based business network organization”, unpublished doctoral dissertation, Regent
University, Virginia Beach, VA.

264
Hancott, D. E. (2005). The relationship between transformational leadership and
organizational performance in the largest public companies in Canada (Doctoral
dissertation, Capella University).
Hao, Q., Kasper, H., & Muehlbacher, J. (2012). How does organizational structure influence
performance through learning and innovation in Austria and China. Chinese
Management Studies, 6(1), 36-52.
Hawke, A., & Heffernan, T. W. (2006). Interpersonal liking in lender-customer relationships
in the Australian banking sector. International Journal of Bank Marketing, 24 (3), 140-
57.
Hays, R. (1996). The strategic power of internal service excellence. Business Horizons, July-
August, 15-20.
Hays, J. M. & Hill, A. V. (2001). A preliminary investigation of the relationships between
employee motivation/vision, service learning, and perceived service quality. Journal of
Operations Management, 19(3), 335-349.
Hernon, P., & Whitman, J. (2001). Delivering satisfaction and service Quality: A customer-
based approach for libraries. Chicago, USA: ALA Editions.
Herbst, F., & Caldwell, D. (2004). Business research. Cape Town: Juta & Co
Heskett, J., Jones, T., Loveman, G., Sasser, W., & Schlesinger, L. (1994). Putting the service-
profit chain to work. Harvard Business Review, March-April.
Hinton, P. R. (2014). Statistics explained. Routledge.
Hofstede, G., Neuijen, B., Ohayv, D, D., & Sanders, G. (1990). Measuring organizational
culture: A qualitative and quantitative study across twenty cases. Administrative
Science Quarterly, 35(2), 286-316.

265
Homburg, C., & Pflesser, C. (2000). A multiple-layer model of market-oriented organisational
culture: Measurement issues and performance outcomes. Journal of Marketing
Research, 37(4), 449-462.
Hwang, I. S., & Chi, D. J. (2005). Relationships among internal marketing, employee job
satisfaction and international hotel performance: An empirical study. International
Journal of Management, 22(2), 258–293.
Hu, L. T., & Bentler, P. M. (1998). Fit indices in covariance structure modeling: Sensitivity to
underparameterized model misspecification. Psychological methods, 3(4), 424.
Hu, L.-T., & Bentler, P. M. (1999). Cutoff criteria for fit indexes in covariance structure
analysis: Conventional criteria versus new alternatives. Structural Equation Modeling,
6, 1-55.
Huck, S. W. (2012). Reading statistics and research (6th ed.). Boston: Pearson
Ingelgard, A., & Norrgren, F. (2001). Effects of change strategy and top management on
quality of working life and economic results. The International Journal of Industrial
Ergonomics, 27(2), 93-105.
Iverson, R. D & Buttigirg, D.M (1999). Affective, normative and continuance commitment:
Can the ‘right kind’ of commitment be managed? Journal of Management Studies,
36(3), 307-333.
Jain, S. K., & Gupta, G. (2004). Measuring service quality: SERVQUAL vs. SERVPERF
scales. Vikalpa, 29(2), 25-37.
Jose, P. E. (2012). Doing statistical mediation and moderation. Guilford Press.
Julian, C. C., & Ramaseshan, B. (1994). The role of customer-contact personnel in the
marketing of a retail bank’s services. International Journal of Retail & Distribution
Management, 22(5), 29-34.

266
Jun, M., & Cai, S. (2010). Examining the relationships between internal service quality and its
dimensions, and internal customer satisfaction. Total Quality Management & Business
Excellence, 21(2), 205-223.
Juran, J. (1993). Made in USA: A renaissance in quality. Harvard Business Review, July-
August, 42-50.
Juran, J. M (1988). Juran's Quality Control Handbook. New York, NY: McGrew-Hill.
Kandemir, D., & Hult, G. T. M. (2005). A conceptualization of an organizational learning
culture in international joint ventures. Industrial Marketing Management, 34(5), 430-
439.
Kang, G. D., Jame, J., & Alexandris, K. (2002). Measurement of internal service quality:
application of the SERVQUAL battery to internal service quality. Managing service
quality, 12(5), 278-291.
Kashy, D. A., Donnellan, M. B., Ackerman, R. A., & Russell, D. W. (2009). Reporting and
interpreting research in PSPB: Practices, principles, and pragmatics. Personality and
Social Psychology Bulletin, 35, 1131-1142.
Keller, S. B., Lynch, D. F., Ellinger, A. E., Ozment, J., & Calantone, R. (2006). The impact of
internal marketing efforts in distribution service operations. Journal of business
logistics, 27(1), 109-137.
Kendall, S. (2006). Customer service from the customers perspective. In L. Fogli (Ed.),
Customer service delivery: Research and best practices (pp. 3-21). San-Francisco:
Jossey-Bass.
Kerlinger, F.N., & Lee, H. B. (2000). Foundations of behavioral research (4th ed.). Wadsworth.
Khandekar, A., & Sharma, A. (2006). Organizational learning and performance: Understanding
Indian scenario in present global context. Education+ Training, 48(8/9), 682-692.

267
Khine, M. S. (Ed.). (2013). Application of structural equation modeling in educational
research and practice. Sense Publishers.
Kim, D. H. (1993). The link between individual and organizational learning. Sloan
Management Review, 34, 37–50.
Kim, S. (2005). Individual-level factors and organizational performance in government
organizations. Journal of public administration research and theory, 15(2), 245-261.
Kim, S. S., & Malhotra, N. K. (2005). A longitudinal model of continued IS use: An integrative
view of four mechanisms underlying post adoption phenomena. Management Science,
51(5), 741-755.
Knights, D., & McCabe, D. (1997). ‘How would you measure something like that?’: Quality
in a retail bank. Journal of Management Studies, 34(3), 371-388.
Kotler, P. (1994). Marketing Management. Englewood Cliffs, NJ: Prentice Hall.
Kotter, J. (2012). Corporate culture and performance. New York, NY: Free Press
Kotter, J. P., & Heskett, J. I. (1992). Corporate culture and performance. New York, NY: Free
Press.
Koushiki Choudhury, K. (2008). Service quality: Insights from the Indian banking scenario.
Australasian Marketing Journal, 16(1), 48-61.
Koustelios, A., Theodorakis, N., Goulimaris, D. (2004). Role ambiguity, role conflict and job
satisfaction among physical education teachers in Greece .The International Journal of
Educational Management, 18(2), 87-92.
Krios, K. (2005). An Exploratory Case Study of Internal Service Quality in a
Telecommunications Organisation: A Frontline Employee Perspective (Doctoral
dissertation, Faculty of Business and Enterprise, Swinburne University of Technology).
Krüger, V. (2001). Main schools of TQM:“the big five”. The TQM Magazine, 13(3), 146-155.

268
Kuei, C. H. (1999). Internal service quality-an empirical assessment. International Journal of
Quality and Reliability Management, 16(8), 783-791.
Kuo, T. H. (2011). How to improve organizational performance through learning and
knowledge?. International Journal of Manpower, 32(5/6), 581-603.
Kusluvan, S., & Kusluvan, Z. (2000). Perceptions and attitudes of undergraduate tourism
students towards working in the tourism industry in Turkey. Tourism Management, 21,
251-269.
Lambert, S. J. (2000). Added benefits: the link between work-life benefits and organizational
citizenship behavior. Academy of Management Journal, 43(5), 801-815.
Lambert, V. A., & Lambert, C. E. (2001). Literature review of role stress/strain on nurses: An
international perspective. Nursing & health sciences, 3(3), 161-172.
Large, R. O., & Konig, T. (2009). A gap model of purchasing’s internal service quality:
Concept, case study and internal survey. Journal of Purchasing & Supply Management,
15, 25-32.
Latif, K. F., Nadeem, A., Khalil, I., Zeb, S. (2012). Work stressors and behaviors across
occupations. City University Research Journal, 2(1), 35-50.
Law, C. C., & Ngai, E. W. (2008). An empirical study of the effects of knowledge sharing and
learning behaviors on firm performance. Expert Systems with Applications, 34(4),
2342-2349.
Leech, N. L., Barrett, K. C., Morgan, G. A., (In collaboration with Clay, J. N., & Quick, D)
(2005). SPSS for Intermediate statistics: Use and interpretation (2nd ed.), Mahwah,
New Jersey: Lawrence Erlbaum.
Liebermann, S., & Hoffmann, S. (2008). The impact of practical relevance on training transfer:
evidence from a service quality training program for German bank clerks. International
Journal of Training and Development, 12(2), 74-86.

269
Lien, B. Y. H., Hung, R. Y., & McLean, G. N. (2007). Organizational learning as an
organization development intervention in six high‐technology firms in Taiwan: An
exploratory case study. Human resource development quarterly, 18(2), 211-228.
Lings, I., & Brooks, R. (1998). Implementing and measuring the effectiveness of internal
marketing. Journal of Marketing Management, 14, 325-351.
Lings, I. N., & Greenley, G. E. (2005). Measuring internal market orientation. Journal of
Service Research, 7(3), 290-305.
Lings, I. N., & Greenley, G. E. (2009). The impact of internal and external market orientations
on firm performance. Journal of Strategic Marketing, 17(1), 41-53.
Little, E., & Marandi, E. (2003). Relationship marketing management. London: Thomson
Learning.
Lok, P. & Crawford, J. (2004). The effect of organizational culture and leadership style on job
satisfaction and organizational commitment: A cross national comparison. Journal of
Management Development, 23(4), 321-338.
Lomax, R. G., Hahs-vaughn, D. L. (2012). An introduction to statistical concept (3rd ed.). NY:
Taylor and Francis.
Longenecker, C., & Scazzero, J. (2000). Improving service quality: a tale of two operations.
Managing Service Quality, 10(4), 227-232.
López, S. P., Peón, J. M. M., & Ordás, C. J. V. (2004). Managing knowledge: the link between
culture and organizational learning. Journal of knowledge management, 8(6), 93-104.
Lynch, P. D., Eisenberger, R., & Armeli, S. (1999). Perceived organizational support: Inferior
versus superior performance by wary employees. Journal of Applied
Psychology, 84(4), 467-483.

270
Madill, J. J., Feeney, L., Riding, A., & Haines, G. H. Jr. (2002). Determinants of SME owners’
satisfaction with their banking relationships: A Canadian study. The International
Journal of Bank Marketing, 20(2), 86-98.
Maertz, C. P., Griffeth, R.W., Campbell, N. S., & Allen, D. G. (2007). The effects of perceived
organizational support and perceived supervisor support on employee turnover. Journal
of Organizational Behavior, 28, 1059-75.
Malhotra N., & Mukherjee A. (2004). The relative influence of organizational commitment and
job satisfaction on service quality of customer-contact employees in banking call
centers. Journal of Services Marketing, 18(3), 162–174.
Marshall, G. W., Baker, J., & Finn, D. W. (1998). Exploring internal customer service quality.
Journal of Business and Industrial Marketing, 13(4/5), 391-392.
Mathew, J., Ogbonna, E., & Harris, L. C. (2012). Culture, employee work outcomes and
performance: An empirical analysis of Indian software firms. Journal of World
Business, 47(2), 194-203.
McCracken, M. J., McIlwain, T. F., & Fottler, M. D. (2001). Measuring organizational
performance in the hospital industry: An exploratory comparison of objective and
subjective methods. Health Services Management Research, 14(4), 211-219.
Meyer J. P., & Allen, N. J. (1997). Commitment in the workplace: Theory, Research and
Application. Thousand oaks: Sage Publication.
Meyers, L. S., Gamst, G. C., & Guarino, A. J. (2013). Performing data analysis using IBM
SPSS. John Wiley & Sons.
Ming, C. (2010). Relationship among organizational learning, internal service quality, and
organizational performance in China's service organizations. Unpublished dissertation.
Kook Min University, Seoul, Korea.

271
Minglong, W. (2010). Structural Equation Model: Operation and Application of AMOS (the
2nd Edition).
Mishkin, F. S. (2001). The economics of money, banking and financial markets (6th ed.).
Reading, MA: Addison-Wesley.
Mishra, S. K. (2014). Linking perceived organizational support to emotional labor. Personnel
Review, 43(6), 845 - 860
Mohr, L. A., & Bitner, M. J. (1995). Process factors in service delivery: what employee effort
means to customers. Advances in services marketing and management, 4, 91-117.
Mok, C., Sparks, B., & Kadampully, J. (2001). Service quality management in hospitality
tourism and leisure. New York: Routledge.
Mowday, R. T., Steers, R. M., & Porter, L. W. (1979). The measurement of organizational
commitment. Journal of Vocational Behavior, 14, 224-247.
Mueller, R. O., & Hancock, G. R. (2008). Best practices in structural equation modeling. In J.
W. Osborne (Ed.), Best practices in quantitative methods (pp. 488–508). Thousand
Oaks, CA: Sage.
Mukherjee, A., Nath, P., & Pal, M. (2003). Resource, service quality and performance triad: A
framework for measuring efficiency of banking services. The Journal of the
Operational Research Society, 54(7), 723-735.
Murphy, L. R. (1995). Occupational stress management: Current status and future directions,
In Cooper, C. L., Rousseau, D. M. (Eds.), Trends in Organizational Behaviour, pp. 1-
14, John Wiliey: Chichester.
Muthuveloo, R. & Rose, R.C. (2005). Typology of organizational commitment. American
Journal of Applied Science, 2(6), 1078-1081.

272
Noblet, A. (2003). Building health promoting work settings: identifying the relationship
between work characteristics and occupational stress in Australia. Health Promotion
International, 18(4), 351-359.
Nunnally, JC. (1978) Psychometric theory. New York: McGraw-Hill.
Nzuve, S. N., & Omolo, E. A. (2012). A study of the practice of the learning organization and
its relationship to performance among Kenyan commercial banks. Problems of
Management in the 21st Century, 4(2), 45-56.
Ofoegbu, F., & Nwadiani, M. (2006). Level of perceived stress among lectures in Nigerian
universities. Journal of instructional psychology, 33(1), 66-74.
Ogbonna, E., & Harris, L. C. (2000). Leadership style, organizational culture and performance:
empirical evidence from UK companies. International Journal of Human Resource
Management, 11(4), 766-788.
Oh, H., & Pizam, A. (Eds.). (2008). Handbook of hospitality marketing management. Elsevier.
Omachonu, V., & Ross, J. (2005). Principles of total quality (3rd ed.). Florida: CRC Press.
Opoku, R. A., Atuobi-Yiadom, N., Chong, C. S., & Abratt, R. (2009). The impact of internal
marketing on the perception of service quality in retail banking: A Ghanaian
case. Journal of Financial Services Marketing, 13(4), 317-329.
O'Riordan, J. (2003). Developing an effective internal customer service ethos.
Ortiz, J. P., & Arnborg, L. (2005). Reflections on involvement, culture, and power in
organizations. Performance Improvement, 44 (6), 31-37.
Ortqvist, D., & Wincent, J. (2006). Prominent consequences of role stress: a meta-analytical
review. International Journal of Stress Management, 13(4), 399-422.
Ouakouak, M. L., Ouedraogo, N., & Mbengue, A. (2013). The mediating role of organizational
capabilities in the relationship between middle managers’ involvement and firm
performance: A European study. European Management Journal, 32(2), 305-318.

273
Panayides, P. (2007). The impact of organizational learning on relationship orientation,
logistics service effectiveness and performance. Industrial Marketing Management, 36,
68 – 80.
Panda, T. K. (2001). Service Quality Value Alignment through Internal Customer Orientation
in Financial Services–An Exploratory Study in Indian Banks.
Panigyrakis, G. G., & Theodoridis, P. K. (2009). Internal marketing impact on business
performance in a retail context. International Journal of Retail & Distribution
Management, 37(7), 600-628.
Pantouvakis, A., & Mpogiatzidis, P. (2013). The impact of internal service quality and learning
organization on clinical leaders’ job satisfaction in hospital care services. Leadership
in Health Services, 26(1), 34-49.
Papasolomou, I., & Vrontis, D. (2006). Building corporate branding through internal
marketing: The case of the UK retail banking industry. Journal of Product & Brand
Management, 15(1), 37-47.
Paraskevas, A. (2001). Exploring hotel internal service chains: A theoretical approach.
International Journal of Contemporary Hospitality Management, 13(5), 251-258.
Parasuraman, A. (2002). Service quality and productivity: A synergistic perspective. Managing
Service Quality, 12(1), 6-9.
Parasuraman, A., Zeithaml, V. A., & Berry, L. L. (1985). A conceptual model of service quality
and its implications for future research. The Journal of Marketing, 41-50.
Parasuraman, A., Zeithaml, V. A., & Berry, L. L. (1988). Servqual. Journal of retailing, 64(1),
12-40.
Pasebani, F., Mohammadi, S., &Yektatyar, M. (2012). The relationship between organizational
learning culture and job satisfaction and Internal service quality in sport organizations
in Iran. Archives of Applied Science Research, 4 (4):1901-1905.

274
Patterson, M., Payne, R., & West, M. (1996). Collective climates: A test of their socio-
psychological significance. Academy of Management Journal, 39(6), 1675-1691.
Pellissier, R. (2007). Business research made easy. Cape Town: Juta& Co
Peters, T. J., & Waterman, R.H. (1982). In search of excellence. New York: Harper & Row.
Petzer, D., Ismail, Z., Roberts-Lombard, M., Hern, L., Klopper, H., Subramani, D., . . . Berndt,
A. (2006). Fresh perspectives: Marketing. South Africa: Pearson Education.
Pfeffer J. (1998). Seven practices of successful organizations. California Management Review,
40, 96–124.
Pfister, J. (2009). Managing organizational culture for effective internal control: From
practice to theory. Berlin: Physica Verlag.
Pina, V., Torres, L., & Bachiller, P. (2014). Service quality in utility industries: the European
telecommunications sector. Managing Service Quality: An International Journal,
24(1), 2-22.
Prakash, A., & Mohanty, R. (2012). Understanding service quality. Production Planning and
Control, 1-16.
Prasad, A., & Steffes, E. (2002). Internal marketing at continental Airlines: Convincing
employees that management knows best. Marketing Letters, 13(2), 75-89.
Recker, J. (2013). Scientific research in information systems: A beginners guide. Queensland:
Springer
Rees, C. J., & Redfern, D. (2000). Recognizing the perceived causes of stress – A training and
development perspective. Journal of industrial and commercial training, 32(4), 120-
127.
Reynoso, J., & Moores, B. (1995). Towards the measurement of internal service
quality. International Journal of Service Industry Management, 6(3), 64-83.

275
Reza, S., Javadin, S., Rayej, H., Yazdani, H., Estiri, M., & Aghamiri, S. A. (2012). How
organizational citizenship behavior mediates between internal marketing and service
quality: The case of Iranian GAS company. International Journal of Quality &
Reliability Management, 29(5), 512-530.
Rhoades, L., & Eisenberger, R. (2002). Perceived organizational support: A review of the
literature. Journal of Applied Psychology, 87(4), 698-714.
Rhoades, L., Eisenberger, R., & Armeli, S. (2001). Affective commitment to the organi- zation:
the contribution of perceived organizational support. Journal of Applied Psychology,
86 (5), 825–836.
Richard, P. J., Devinney, T. M., Yip, G. S., & Johnson, G. (2009). Measuring organizational
performance: Towards methodological best practice. Journal of Management, 35(3),
718-804.
Robbins, S.P. and Coulter, M. (2007), Management, Pearson Prentice Hall.
Robson, C. (2002). Real world research (2nd ed.). Oxford: Blackwell.
Rondeau, K. V., & Wagar, T. H. (2002, August). Organizational learning and continuous
quality improvement: examining the impact on nursing home performance. In
Healthcare Management Forum (Vol. 15, No. 2, pp. 17-23). Elsevier.
Roscoe, J. T. (1975). Fundamental research statistics for the behavioral sciences (pp. 199-
200). New York: Holt, Rinehart and Winston.
Rousseau, D. M., & Parks, J. M. (1993). The contracts of individuals and organizations.
Research in Organizational Behavior, 15, 1-43.
Ruiz-Mercader, J., Merono-Cerdan, A.L. and Sabater-Sanchez, R. (2006). Information
technology and learning: their relationship and impact on organizational performance
in small business. International Journal of Information Management, 26, 16-29.

276
Rust, R. T., & Zahorik, A. J. (1993). Customer satisfaction, customer retention, and market
share. Journal of retailing, 69(2), 193-215.
Saad, N. M., Ahmed, P. K., & Rafiq, M. (2002). Internal marketing: Using marketing like
approaches to build business competencies and improve performance in large
Malaysian corporations. Asian Academy of Management Journal, 7(2), 27-53.
Schabracq, M. J., & Cooper, C. L. (2000). The changing nature of work and stress. Journal of
Managerial Psychology, 15(3), 227-242.
Schein, E, H. (1985). Organizational culture and leadership. San Francisco: Jossey-Bass.
Schein, E. (1990). Organizational culture. American Journal of Psychologist, 4(2), 109-19.
Schein, E., (1992). Organizational culture and leadership. San Francisco, CA: Jossey-Bass.
Schein, E. H. (2010). Organizational cultureand leadership (4th ed.). United States of
America: Jossey-Bass.
Schlechter, A. F. (2001). Achieve performance excellence by practicing leadership effectively.
Management Today, 17 (3), 42-45.
Schneider, B., & Bowen, D. E. (1995). Winning the Service Game. Harvard Business School
Press, Boston, MA.
Schumacker, R. E., & Lomax, R. G. (2004). A beginner's guide to structural equation modeling,
Second edition. Mahwah, NJ: Lawrence Erlbaum Associates.
Schwandt, D., & Marquardt, M. J. (1999). Organizational learning. CRC Press.
Sekaran, U. (2003). Research methods for business: A skill building approach. John Wiley and
Sons Inc., New York.
Senge, P. M. (2006). The Fifth Discipline: The Art and Practice of the Learning Organization.
New York: Currency Doubleday.
Shaker, T. I., & Basem, Y. A. (2010). Relationship marketing and organizational performance
indicators. European Journal of Social Sciences, 12(4), 545–557.

277
Shaver, J. M. (2005). Testing for mediating variables in management research: Concerns,
implications, and alternative strategies. Journal of Management, 31(3), 330-353.
Shen, Y., Jackson, T., Ding, C., Yuan, D., Zhao, L., Dou, Y., & Zhang, Q. (2014). Linking
perceived organizational support with employee work outcomes in a Chinese context:
Organizational identification as a mediator. European Management Journal, 32(3),
406-412.
Shepherd, J. L. & Mathews, P. (2000). Employee commitment: Academic vs. practitioner
perspectives. Employee Relations, 22 (6), 555-575.
Shi, X., & Wright, P. C. (2001). Developing and validating an international business
negotiator’s profile. Journal of Managerial Psychology, 16(5), 364-389.
Shostack, G. (1987). Service positioning through structural change. Journal of Marketing,
51(1), 34-43.
Singh, J. (1998). Striking a balance in boundary-spanning positions: An investigation of some
unconventional influences of role stressors and job characteristics on job outcomes of
salespeople. The Journal of Marketing, 69-86.
Singh, K. (2004). Impact of HR practices on perceived firm performance in India’. Asiapacific
Journal of Human Resources, 42(3) 301-317.
Slåtten, T. (2009). The effect of managerial practice on employee-perceived service quality:
The role of emotional satisfaction. Managing Service Quality: An International
Journal, 19(4), 431-455.
Smith, K. G., Smith, K. A., Olian, J. D., Sims Jr, H. P., O'Bannon, D. P., & Scully, J. A. (1994).
Top management team demography and process: The role of social integration and
communication. Administrative science quarterly, 412-438.

278
Sobhy, N., & Megeid, A. (2013). The impact of service quality on financial performance and
corporate social responsibility: Conventional versus Islamic banks in Egypt.
International Journal of Finance and Accounting, 2(3), 150-163.
Song, J., & Kolb, J. (2012). Learning Organizational Culture and Firm Performance: The
Mediating Effects of Knowledge Creation in Korean Firms. Journal of Leadership &
Organizational Studies, 20(2) 252–264.
Spicer, D. P., & Sadler-Smith, E. (2006). Organizational learning in smaller manufacturing
firms. International Small Business Journal, 24(2), 133-58.
Srikantia, P., & Pasmore, W. (1996). Conviction and doubt in organizational learning. Journal
of Organizational Change Management, 9(1), 42-53.
van Solingen, R., Berghout, E., Kusters, R., & Trienekens, J. (2000). From process
improvement to people improvement: enabling learning in software
development. Information and Software Technology, 42(14), 965-971.
Škerlavaj, M., Dimovski, V. (2006). Influence of organizational learning on organizational
performance from the employee perspective: The Case of Slovenia”, Management,
11(1), 75-90.
Škerlavaj, M., Štemberger, M. I., & Dimovski, V. (2007). Organizational learning culture—
the missing link between business process change and organizational performance.
International Journal of Production Economics, 106(2), 346-367.
Slater, S.F., & Narver, J. C. (1995). Market orientation and learning organization. Journal of
Marketing 59, 63–74.
Smith, A. (2000).The scale of perceived occupational stress. Journal of Occupational
Medicine, 50(5), 294-98.\

279
Somers, M. J., & Birnbaum, D. (1998). Work‐related commitment and job performance: it's
also the nature of the performance that counts. Journal of Organizational
Behavior, 19(6), 621-634.
Stamper, C. L., & Johlke, M. C. (2003). The impact of perceived organizational support on the
relationship between boundary spanner role stress and work outcomes. Journal of
Management, 29(4), 569-588.
Stanley, L., & Wisner, J. (2001). Service quality along the supply chain: Implicatiosn for
purchaing. Journal of Operations Management, 19, 287-306.
Stauss, B. (1995). Internal services: Classification and quality management. International
Journal of Service Industry Management, 6(2), 62-78.
Stevenson, A., & Harper, S. (2006). Work stress and student learning experience. Journal of
Quality Assurance in Education, 14(2), 167-178.
Suarez, G. (1992). Three experts on quality management. TOLO Publication, (92-02).
Suganthi, L., & Samuel, A. (2004). Total quality management. New Delhi: Prentice Hall.
Sureshchander, G., Rajendran, C., & Anatharaman, R. (2002). The relationship between
service quality and customer satisfaction: a factor specific approach. Journal of
Services Marketing, 16(4), 363-379.
Sweeney, J. C., & Soutar, G. N. (2001). Consumer perceived value: The development of a
multiple item scale. Journal of Retailing, 77(2), 203–220.
Taap, M. A., Chong, S. C., Kumar, M., Fong, T. K. (2011). Measuring service quality of
conventional and Islamic banks: A comparative analysis, International Journal of
Quality & Reliability Management, 28(8), 822-840.
Tabachnick, B. G., & Fidell, L. S. (2001). Using multivariate statistics.
Tayyab, S. (2007). An empirical assessment of organizational commitment measures. Pakistan
Journal of Psychological Research, 22(1), 1-21.

280
Thompson, M. A., & Kahnweiler, W. M. (2002). An exploratory investigation of learning
culture theory and employee participation in decision making. Human Resource
Development Quarterly, 13(3), 271-288.
Thompson, C. B. (2009). Descriptive data analysis. Air medical journal, 28(2), 56-59.
Tippins, M. J., & Sohi, R.S. (2003). It competency and firm performance: Is organizational
learning a missing link. Strategic Management Journal, 24, 745-61.
Tsai, Y., & Tang, T.-W. (2008). How to improve service quality: Internal Marketing as a
determining factor. Total Quality Management, 19(11), 1117-1126.
Tsaur, S., & Lin, Y. (2004). Promoting service quality in tourist hotels: the role of HRM
practices and service behavior. Tourism Management, 25, 471-481.
Tseng, S. M. (2010). The correlation between organizational culture and knowledge conversion
on corporate performance. Journal of Knowledge Management, 14(2), 269-284.
Turkoz, I., & Akyol, A. (2008). Internal marketing and hotel performance. Anatolia, 19(1),
149-154.
Ueno, A. (2008). Which management practices are contributory to service quality?.
International Journal of Quality & Reliability Management, 25(6), 585-603.
Ueno, A. (1995). What are the fundamental features supporting service quality? Journal of
Services Marketing, 24(1), 74-86.
Ullman, J. B. (2001). Structural equation modeling. In B. G. Tabachnick & L. S. Fidell (2001).
Using Multivariate Statistics (4th ed; pp 653- 771). Needham Heights, MA: Allyn &
Bacon.
Unzicker D., Clow K.E. & Babakus E. (2000). The role of organizational communications on
employee perceptions of a firm. Journal of Professional Services Marketing, 21(2), 87–
103.

281
Uzkurt, C., Kumar, R., Semih Kimzan, H., & Eminoglu, G. (2013). Role of innovation in the
relationship between organizational culture and firm performance: A study of the
banking sector in Turkey. European Journal of Innovation Management, 16(1), 92-117.
Vandenberghe, C., Bentein, K., Michon, R., Chebat, J., Tremblay, M., & Fils, J. (2007). An
examination of the role of perceived support and employee commitment in employee-
customer encounters. Journal of Applied Psychology, 92(4), 1177-1187.
Van der Post, W. Z., de Coning, T. J. & Smit, E. V. (1998). The relationship between
organizational culture and financial performance: Some South African evidence. South
African Journal of Business Management, 29(1), 30-41.
Van Horne James, C. (2002). Financial Management & Policy, 12/E. Pearson Education India.
Vanniarajan, T., & Babu, S. (2011). Internal service quality and its consquences in commercial
banks: A HR perspective. Global Management Review, 6(1), 42-57.
Vanniarajan, T., & Subbash, K. (2011). Internal service quality and its consequences in
commercial banks: An HR perspective. Global Management Review, 6(1), 42-57.
Varca, P. E. (1999). Work stress and customer service delivery. The Journal of Services
Marketing, 13(3), 229-241.
Vella, P. J., Gountas, J., & Walker, R. (2009). Employee perspectives of service quality in the
supermarket sector. Journal of Services marketing, 23(6), 407-421.
Vinzi, V. E., Chin, W. W., Henseler, J., & Wang, H. (2010). Editorial: Perspectives on partial
least squares (pp. 1-20). Springer Berlin Heidelberg.
Voss, M. D., Calantone, R. J., & Keller, S. B. (2005). Internal service quality: determinants of
distribution center performance. International Journal of Physical Distribution &
Logistics Management, 35(3), 161-176.

282
Wang, Y. L., & Ellinger, A. D. (2011). Organizational learning: Perception of external
environment and innovation performance. International Journal of
Manpower, 32(5/6), 512-536.
Wang, I.-M., & Shieh, C.-J. (2006). The relationship between service quality and customer
satisfaction: The example of CJCU library. Journal of Information and Optimization
Sciences, 27(1), 193-209.
Wang, J., & Wang, X. (2012). Structural equation modeling: Applications using Mplus. John
Wiley & Sons.
Warner, R. M. (2008). Applied statistics: From bivariate through multivariate techniques.
Sage.
Waters, J. A., & Ussery, W. (2007). Police stress: History, contributing factors, symptoms, and
interventions. Policing: an international journal of police strategies & management,
30(2), 169-188.
Wayne, S. J., Shore, L. M., & Liden, R. C. (1997). Perceived organizational support and leader-
member exchange: A social exchange perspective. Academy of Management Journal,
40, 82-111.
Wheelen, T.L. and Hunger, J.D. (2010), Strategic Management and Business Policy, Pearson,
Upper Saddle River.
Widaman, K. F. (2010). Multitrait-multimethod analysis. In G. R. Hancock & R. O. Mueller
(Eds.), The reviewer’s guide to quantitative methods in the social sciences (pp. 299-
314). New York: Routledge.
Wildes, V. (2007). Attracting and retaining food servers: How internal service quality
moderates occupational stigma. Hospitality Management, 26, 4-19.

283
Wilderom, C. P., van den Berg, P. T., &Wiersma, U. J. (2012). A longitudinal study of the
effects of charismatic leadership and organizational culture on objective and perceived
corporate performance. The Leadership Quarterly, 23(5), 835-848.
Wildes, V., & Parks, S. (2005). Internal service quality. International Journal of Hospitality &
Tourism Administration, 6(2), 1-27.
Williams, C. (2007). Management (4th ed.). Canada: Thomson.
Worsfold, P. (1999). HRM, performance, commitment and service quality in the hotel industry.
International Journal of Contemporary Hospitality Management, 11(7), 340-348.
Yakhlef, A. (2009). Outsourcing as a mode of organizational learning. Strategic Outsourcing:
An International Journal, 2(1), 37-53.
Yang, J. T. (2007). Knowledge sharing: Investigating appropriate leadership roles and
collaborative culture. Tourism Management, 28(2), 530-543.
Yoon, M, H., Seo, J, H., & Yoon, T, S (2004). Effects of contact employee supports on critical
employee responses and customer service evaluation, Journal of Services Marketing,
18(5), 395-412.
Young, J. A., & Varble, D. L. (1997). Purchasing's performance as seen by its internal
customers: a study in a service organization. International Journal of Purchasing and
Materials Management, 33(2), 36-41.
Xenikou, A., & Simosi, M. (2006). Organizational culture and transformational leadership as
predictors of business unit performance. Journal of Managerial Psychology, 21(6),
566-579.
Zailani, S., Din, S. H., & Wahid, N. A. (2006). The effects of internal measures of service
quality on business performance: A case of hotel industry in Malaysia. Paper presented
at the 6th Annual Hawaii International Conference on Business, Hawaii.

284
Zeithaml, V. (2000). Service quality, profitability, and the economic worth of customers: What
we know and what we need to learn. Journal of the Academy of Marketing Science,
28(1), 67-85.
Zeithaml, V. A., Berry L. L. & Parasuraman, A. (1990). Delivering quality service-balancing
customer perceptions and expectations. New York: The Free Press.
Zeithaml, V., Bitner, M., & Gremler, D. (2006). Services marketing: Integrating customer
focus across the firm. New York: McGraw-Hill Irwin.
Zellmer-Bruhn, M., & Gibson, C. (2006). Multinational organization context: Implications for
team learning and performance. Academy of Management Journal, 49(3), 501-518.
Zerbe, W. J., Dobni, D. & Harel, G. H. (1998). Promoting employee service behaviour: The
role of perceptions of human resource management practices and service culture.
Canadian Journal of Administrative Sciences, 15(2), 165-179.
Zhen-You, C. (2003). How leadership styles, motives of achievement and their fitness affect
the quality of internal services: Taking the example of marketing & promotional staff
at Taiwanese record labels. Graduate Institute of Communication Management, Ming
Chuan University.
Zikmund, W. G., Babin, B. J., Carr, J. C., & Griffin, M. (2013). Business research methods
(9th ed.). Mason OH: South-Western Cengage.
Zohrabi, M., Mahdavi, R., &Mahdavi, S. A. (2013). The relationship among organizational
learning, internal service quality and performance in Iran's selective sport federations.
European Journal of Experimental Biology, 3(6), 61-65.

285
Appendix 1
Research Questionnaire (Ph.D. Research Study)
I am a PhD scholar of Management Sciences, conducting a survey on “An Empirical Investigation into the
Mediating Role of Internal Service Quality on the Linkage between Internal Organizational Factors and
Organizational Performance” to complete my Ph.D. dissertation.
Thank you in advance for your kind cooperation.
Section A: General Information
Age: ______________ Gender: Male [ ] Female [ ]
Years of Education: _____________ Nature of
Employment:
Contract [ ] Permanent [ ]
Job Rank: Junior [ ]
Middle [ ]
Senior [ ]
Tenure at this Bank:
Bank
_____________________________
Banking
System:
Conventional [ ]
Islamic [ ]
Designation: _____________________
Section B: Please rate each statement in terms of the degree of agreement with each statement; encircle
appropriate response based on the following scale
SCALE: [1=Strongly Disagree] [2=Disagree] [3=Somewhat Disagree] [4= Neither Agree nor Disagree]
[5=Somewhat Agree] [6=Agree] [7=Strongly Agree]
Section B: Organizational Learning 1 2 3 4 5 6 7
This is an open organization and as much information as possible is made
available to employees.
There exists a two-way communication between employees of all levels
Feedback system on services is provided to customers and employees
The bank has learned or acquired much new and relevant knowledge over the last
few years.
The learning and development process has helped the bank employees to acquire
new skills
The learning and development process has helped in building capacities for
sustained organizational effectiveness
The Bank’s performance has been influenced by new learning it has acquired
over the last few years.
The organization is a learning organization.
Section C: Organizational Culture 1 2 3 4 5 6 7
The bank considers change to be natural and necessary
The bank considers individuals as an asset and tries to appreciate them
continuously
Everybody’s opinions and contributions are respected
Problems are discussed openly
Collaboration and co-operation among the different duties and departments is
encouraged
In general, all departments are aware of consumer satisfaction
Section D: Organizational Commitment 1 2 3 4 5 6 7

286
I am willing to put in a great deal of effort beyond that is normally expected in
order to help this bank be successful.
I talk up this bank to my friends as a great organization to work for.
I would accept almost any type of job assignment in order to keep working for
this bank
I find that my values and the bank's values are very similar.
I am proud to tell others that I am part of this bank.
This bank really inspires the very best in me in the way of job performance.
I am extremely glad that I chose this bank to work for, over others I was
considering at the time I joined.
I really care about the fate of this bank.
Section E: Perceived Organizational Support 1 2 3 4 5 6 7
My bank cares about my opinions.
My bank really cares about my well-being.
My bank strongly considers my goals and values.
Help is available from my bank when I have a problem.
My bank would forgive an honest mistake on my part.
Section F: Role Stress 1 2 3 4 5 6 7
Role ambiguity:
I don’t have clear, planned goals and objectives for my job.
I am not always sure that I have divided my time properly between tasks.
I don’t know what my responsibilities at work are.
I don’t know exactly what is expected of me at work.
It is not explained clearly to me what tasks have to be done in the bank.
Role conflict: 1 2 3 4 5 6 7
I receive assignments without the resources to complete it.
I receive assignments without adequate resources and materials to execute it.
I have to break a rule or policy in order to carry out assignments.
I do things that are apt to be acceptable by one person but not by others.
I receive incompatible requests from two or more people.
I work under incompatible policies and guidelines.
Section G: Internal Marketing 1 2 3 4 5 6 7
Our bank offers employees a vision that we can believe in.
Our bank’s vision is well communicated to all employees.
This bank prepares employees to perform well.
Our bank views the development of knowledge and skills in employees as an
investment rather than a cost.
Skill and knowledge development of employees happens as an ongoing process
in our bank
We teach our employees “why they should do things” and not just “how they
should do things”.
This bank goes beyond training and educates employees to work together.
This bank measures and rewards employee performance that contributes most to
our bank’s vision.
Data gathered from employees is used to improve jobs, and to develop strategy
of the bank
In our bank, those employees who provide excellent service are rewarded for
their efforts.
In this bank, employees are properly trained to perform their service roles.
This bank places considerable emphasis on communication with employees.
Our performance measurement and reward systems encourage employees to
work together.
Our bank communicates to employees the importance of their service roles.
Section H: Service Quality 1 2 3 4 5 6 7
Reliability
In my bank Coworkers provide service that is promised.
In my bank Coworkers are dependable for handling my problems.

287
In my bank Coworkers perform services right the first time, to avoid having to
make corrections later.
In my bank Coworkers provide correct and necessary information.
In my bank Coworkers are reliable.
Assurance 1 2 3 4 5 6 7
In my bank I can trust my coworkers.
In my bank I feel safe in dealing with coworkers.
In my bank Coworkers are polite and kind.
In my bank Coworkers are knowledgeable.
Empathy 1 2 3 4 5 6 7
In my bank coworkers are sincerely concerned about problems.
In my bank we have convenient working hours.
In my bank coworkers give me individual attention.
In my bank coworkers seem to have each other best interests in mind.
In my bank coworkers are sensitive to my work-related needs.
Responsiveness 1 2 3 4 5 6 7
In the bank my communication with coworkers is appropriate, accurate and clear
In my bank coworkers respond quickly and efficiently to my request
In my bank coworkers are willing to help me
In my bank coworkers are willing to accommodate special requests and needs
Section I: Subjective Organizational Performance 1 2 3 4 5 6 7
The bank has made avital improvement in the finance and performance over past
few years
The bank has made a vital improvement in its relationship with customers over
past few years
The bank has made a vital improvement in organizational effectiveness and
efficiency (e.g. timing of launching new products or services) over past few years
The bank has made a vital improvement in human resources development (e.g.
employee skills, personnel development, etc.) over past few years
The bank has made avital improvement in preparing for the future (e.g.
quality/depth of strategic planning, indicators of partnerships and alliances) over
past few years

288
Appendix 2
Frequency Percent
Missing 9 2.6
Accounts In charge 1 .3
Area Coordinator 1 .3
Area Manager 2 .6
ARM 1 .3
Assistant 1 .3
Assistant Credit Officer 1 .3
Assistant Manager 25 7.3
Assistant Vice President 10 2.9
Audit Officer 1 .3
Banking Service Manager 1 .3
BCOT Executive 4 1.2
Branch Manager 2 .6
BSO 5 1.5
Business Development Officer 9 2.6
CAD Officer 1 .3
Cash Officer 9 2.6
Cashier 4 1.2
CCR 1 .3
Chief Cashier 1 .3
Chief Manager 1 .3
Cluster Manager 1 .3
Collection Officer 1 .3
Conventional Officer Grade 1 .3
Credit Assistant 4 1.2
Credit Manager 3 .9
Credit Officer 4 1.2
CSO 3 .9

289
CSR 1 .3
customer Relationshi 1 .3
Customer Services Officer 2 .6
Establishment Incharge 1 .3
Executive 1 .3
Forex Exchange Officer 1 .3
General Banking Officer 10 2.9
HR Officer 1 .3
Inc Credits 1 .3
Inc Deposit 1 .3
Inc Forex 1 .3
Incharge Credit 1 .3
Junior Officer 4 1.2
Manager 24 7.0
Manager Teller 1 .3
Manager Trade 1 .3
MG10 2 .6
MG9 1 .3
Office Assistant 3 .9
Officer 2 .6
Officer ICU 1 .3
OG I 26 7.6
OG II 34 10.0
OG III 23 6.7
Operations Manager 27 7.9
operations Officer 1 .3
Operations Officer 10 2.9
PBM 1 .3
Personal Banking Officer 3 .9
Regional Manager 1 .3

290
Relationship Manager 6 1.8
Relationship Officer 8 2.3
Retail Banking Officer 3 .9
RM Assets 2 .6
RM Trade 1 .3
RM-CAD 1 .3
Rural Finance Officer 1 .3
SA 1 .3
Senior Officer 3 .9
Service Quality Coordinator 1 .3
SHR OFFR 1 .3
Sub Officer 1 .3
System Admin 1 .3
Teller 5 1.5
Trade MG 1 .3
TSO 3 .9
Vice President 8 2.3
Total 341 100.0