FACTSHEET November 30th, 2017 - canararobeco.com mospi.nic.in ^^ MOSPI & RBI # Central Statistical...
40
November 30th, 2017 FACTSHEET
-
Upload
dinhkhuong -
Category
Documents
-
view
213 -
download
1
Transcript of FACTSHEET November 30th, 2017 - canararobeco.com mospi.nic.in ^^ MOSPI & RBI # Central Statistical...

November 30th, 2017FACTSHEET

Index
ABOUT FEW SCHEMES OF CANARA ROBECO MUTUAL FUND
PERFORMANCE
DIVIDEND HISTORY
MARKETS & BEYOND
SIP RETURNS
HOW TO READ A FACTSHEET
ECONOMIC UPDATE ................................................................................................................................... 03
EQUITY MARKET REVIEW............................................................................................................................. 04
DEBT MARKET REVIEW ............................................................................................................................... 05
GOLD UPDATE ......................................................................................................................................... 06
CANARA ROBECO EQUITY DIVERSIFIED (CRED) ................................................................................................... 07
CANARA ROBECO EQUITY TAX SAVER (CRETS) .................................................................................................... 08
CANARA ROBECO LARGE CAP+ FUND (CRLCF) .................................................................................................... 09
CANARA ROBECO F.O.R.C.E FUND (CRFRC) ....................................................................................................... 10
CANARA ROBECO EMERGING EQUITIES (CREE).................................................................................................... 11
CANARA ROBECO INFRASTRUCTURE (CRI)......................................................................................................... 12
CANARA ROBECO BALANCE (CRB) .................................................................................................................. 13
CANARA ROBECO MONTHLY INCOME PLAN (CRMIP) .............................................................................................. 14
CANARA ROBECO INDIGO (Income from Debt Instruments & GOld) FUND (CRIF) ........................................................... 15
CANARA ROBECO INCOME (CRINC) ................................................................................................................. 16
CANARA ROBECO GILT PGS (CRGP)................................................................................................................. 17
CANARA ROBECO DYNAMIC BOND FUND (CRDBF) ................................................................................................ 18
CANARA ROBECO MEDIUM TERM OPPORTUNITIES FUND (CRMTOF) ............................................................................ 19
CANARA ROBECO SHORT TERM FUND (CRSTF).................................................................................................... 20
CANARA ROBECO SAVINGS PLUS FUND (CRSPF) .................................................................................................. 21
CANARA ROBECO TREASURY ADVANTAGE FUND (CRTAF) ........................................................................................ 22
CANARA ROBECO LIQUID (CRL) ..................................................................................................................... 23
CANARA ROBECO YIELD ADVANTAGE FUND (CRYAF).............................................................................................. 24
CANARA ROBECO GOLD SAVINGS FUND (CRGSF) & CANARA ROBECO GOLD EXCHANGE TRADED FUND (CRGETF) ...................... 25
PERFORMANCE AT A GLANCE ....................................................................................................................... 26
Scheme Performance - Fund Manager wise....................................................................................................... 30
SIP RETURNS........................................................................................................................................... 32
DIVIDEND HISTORY ................................................................................................................................... 36
HOW TO READ A FACTSHEET ........................................................................................................................ 38
DEFINITIONS & DISCLAIMERS ....................................................................................................................... 39
SCHEME PERFORMANCE - FUND MANAGER WISE
DEFINITION & DISCLAIMERS

Economic Update
Upgrade of India's Sovereign ranking by Moody's, cancelling of OMO Sales by RBI, India rising to the top 100 positions with respect to the ease of doing business, improving 2QFY18 GDP were the major events that were witnessed in the Indian markets in the month of Nov'17. The month started with the yields in the Indian fixed income markets hardening amid global headwinds as well as domestic fiscal worries. Concerns pertaining to the rising crude prices and India exceeding its fiscal borrowing target for the year took the yields of the 10-year benchmark to over 7.00%. Even after Moody's Investors Service raised the country's sovereign credit rating, the benchmark yields did not recede as much as the investors expected it to. RBI's intervention by cancelling OMO Sales helped the 10 year yields change its upward trajectory, however the relief was short-lived as yields again went up over 7%. All the major global and domestic macro factors resulted in the bellwether indices viz. S&P BSE Sensex and Nifty 50 remaining range bound for the Nov'17. With OPEC members deciding to continue the supply cut for the remaining part of the year, Crude oil prices remained under pressure which impacted the overall market sentiments.
The month of Nov'17 witnessed dented equity market sentiments resulting in broader market indices closing in red. Bellwether indices viz. Nifty 50 and S&P BSE Sensex fell by 0.19% and 1.05% respectively. The month saw mixed bag performances by various indices. While S&P BSE Consumer Durables, S&P BSE Realty and S&P BSE IT were the ones which performed well during the month while S&P BSE Metal, S&P BSE Telecom & S&P BSE Oil & Gas were the sectors seen under pressure
The growth of Index of Industrial Production (IIP) slowed to 3.8% in Sep'17 from a revised 4.5% (originally 4.3%) in the previous month mainly due to subdued performance of the manufacturing sector, coupled with contraction in output of consumer durables. Growth of the manufacturing sector also slowed to 3.4% during the month under review from a growth of 5.8% in the same period of the previous year. The cumulative growth for the period from Apr - Sep'17 slowed to 2.5% from 5.8% in the same period of the previous fiscal. Consumer durable goods output contracted by 4.8% in Sept'17 as against a growth of 10.3% in the previous year.
Spurred by rising food and fuel prices, India's retail inflation quickened to 3.58% in Oct'17, the fastest pace in seven months. Consumer Food Price Index-based inflation grew to 1.90% in Oct'17 from 1.25% in Sep'17. However, government action like importing onions and containing hoarding, will be far more effective in containing food prices, thereby helping restrict the inflation in the coming months. WPI inflation moved to its highest level in six months and stood at 3.59% in Oct'17 as against 2.60% in the previous month. The primary article index stood at 3.33%, while fuel & power increased 10.52%.
Trade deficit of our economy widened to its highest level in nearly three years in Oct'17 as export growth contracted for the first time in more than a year. The trade deficit widened to USD 14.02 bn in Oct'17 from USD 8.98 bn in the previous month. Merchandise exports for Oct'17 fell 1.12% on a yearly basis to USD 23.10 bn mainly due to fall in gems and jewellery and textile exports that also came down 24.51% and 39.23%, respectively. Meanwhile, imports grew 7.60% to USD 37.12 bn in Oct'17.
After declining to a three-year low of 5.7% in 1QFY18 – Indian 2QFY18 GDP rose to 6.3% after 5 straight quarterly decline led by the improvement in industrial growth. The pick-up signals indicate that the Indian economy has shaken off the lingering effects of demonetisation and GST rollout. A sharp bounce in manufacturing growth rate at 7% in second quarter from 1.2% in the preceding quarter was among the primary drivers behind the 2QFY18 GDP growth acceleration. Construction activity also expanded while farm growth slowed in second quarter as compared to the preceding three-month period. Market participants expect the GDP to grow at a faster pace in 2HFY18 aided by the low base effect. However, GST implementation glitches, on-going changes in the GST structure, and a possible cut in capex due to rising fiscal stress may limit upside in the subsequent quarters.
4The upcoming RBI Policy is likely to be closely observed by market participants.
4With the inflation numbers well within RBI's target but with oil prices likely to put upward pressure on inflation, the central bank is expected to remain “neutral” and would keep a close watch on the incoming data as well as global commodity price movements, especially that of crude oil. The trajectory of crude oil prices after the production cut would be key for markets
4Fiscal concerns are likely to dominate headlines in the near term as less than smooth roll out of GST could impact government revenues in near term
4Sovereign India's upgrade to Baa2 by Moody's comes as a positive surprise to the debt markets participants and this move will now attract more FII flows which might be positive for the Indian economy
4Though markets have already factored in the impact of US rate hike, the guidance on pace of future rate hikes is likely the key on driving market sentiment. Markets would follow the outcome of Fed's meeting in Dec'17. The overhaul of US tax regime is likely to also drive global markets.
* Bloomberg^ mospi.nic.in^^ MOSPI & RBI# Central Statistical Office## Ministry of commerce
Market Performance*:
IIP^:
Inflation^^:
##Trade Deficit :
#GDP :
Triggers:
Source:
(as on November 30, 2017)
3

Equity Market Review
Mr. Ravi Gopalakrishnan
Head - Equities
The month of Nov'17 had some surprises for the Indian markets. However, on a month on month comparison, the overall sentiments in the Indian markets remained flat on the back of weak domestic macro-data, along with geo-political tensions in the Middle East. The month begun with the reporting of higher retail as well as wholesale inflation numbers, lower IIP and moderating PMI and India's high public debt as a point of continued concern which resulted in the markets losing the momentum it was able to gather over the past month. However, India Inc. got two big surprises in a span of just 20 days; entering Top -100 global ranking in ease of doing business and India's credit rating upgraded by Moody's from Baa3 to Baa2 after 14 years were the announcements which came as something to cheer about. These two in quick succession lifted investor spirits after a dull and weak period of growth effected by demonetization and GST. The latter half of the month also saw the GST council reducing rates on a host of items. Positive cues coming from global markets in US and Eurozone have been encouraging for global growth while China's reducing exports have raised a concern. Towards the end of the month, Indian economy bounced back from a year-long slowdown, marking the GDP growth of the country at 6.3% in 2QFY18 on improvement in industrial growth. What also boosted investor sentiments was the better than expected earnings reporting by the corporates. Overall, the markets were seen to be almost neutral with the benchmark indices viz. Nifty 50 and S&P BSE Sensex ending at 10226.55 and 33149.35 respectively.
News from around the globe coupled with mixed domestic data flows kept the markets in a tight range during the month of Nov'17. While the indices fell during the first half of the month, India's rating upgrade and GST council relooking at various rates, rendered some optimism. Bell weather indices like S&P BSE Sensex declined by 0.19% while Nifty 50 recorded losses of 1.05%. Meanwhile, S&P BSE Mid-Cap rose by 1.99% while S&P BSE Small-Cap gained 3.57%.
S&P BSE Consumer Durables, S&P BSE Realty and S&P BSE IT were the top performing sectors during the month rising by 16.22%, 6.27% and 3.56% respectively. S&P BSE Metal, S&P BSE Telecom & S&P BSE Oil & Gas were the sectors seen under pressure falling by 5.62%, 3.96% and 3.77% respectively.
The index of industrial production saw a slowdown coming in at 3.8% in Sep'17 as compared to 4.5% in Aug'17 (revised from 4.3%). Though an upward momentum sustained across sectors, growth in manufacturing and electricity was at a lower rate on a sequential basis. Driven by a higher coal output, high growth in the mining sector positively impacted the headline IIP index. As the impact of GST disruption eases, momentum in industrial production is expected to rebound.
The Nikkei Manufacturing PMI in India jumped to 52.6 in Nov'17 from 50.3 in the prior month pointing to the strongest expansion in manufacturing sector since Oct'16, as both output and new orders expanded at the fastest pace in 13 months, employment grew the most since Sep'12 and new export orders increased for the first time in three months. Meanwhile, there was a pick-up in inflationary pressures, with input costs increasing the most since April. The rate of output charge inflation was marginal.
The Nikkei Services PMI in India slumped to 48.5 in Nov'17 from 51.7 in the preceding month. It was the first contraction in services activity since Aug'17 as July’s Sood and Services Tax (GST) continued to affect businesses. New orders declined while employment growth eased from Sep'17. At the same time, input cost inflation accelerated to the fastest since Oct'13 while charge inflation quickened to the strongest since Jul'17.
Continuing the trend witnessed in the last month, FPIs (Foreign Portfolio Investor) increased exposure to Indian equities in the month of Nov'17. FII’s turned out to be net buyers in the Indian equity market to the tune of INR 19727.65 crores. Domestic mutual funds continued their buying streak with net investments of around INR 10668.68 crores during Nov’17 (upto 27th Nov ’17).
Globally, market participants would remain observant on the US Fed's decision of a possible rate hike during the upcoming FOMC meeting in Dec'17. The decision would largely dependent on US economic data as well as global dynamics. Global macro-economic situation is expected to remain volatile in the near term. However, with the macro-economic variables in India continues to remain strong compared to other emerging economies.
The earnings outcome for Q2 FY18 thus far suggests some reversal in the profit growth (~13% PAT growth for NIFTY companies) along with higher topline growth and improved operating profits. The broad-based growth in earnings is expected to continue going forward with corporate profits and margins likely to start responding to the improving economy by H2FY18. The direction of the market in the medium term would primarily be driven by macroeconomic developments and news flows surrounding corporate earnings.
Improved earnings and economic data, relaxation in GST provisions and PSB recapitalization move helped Indian equities to be one of the best-performing market among the emerging economies. Policy reforms and robust liquidity are expected to support markets going ahead.
Recent structural changes by the government are likely to be growth augmenting over the medium- to long-term by improving the business environment, enhancing transparency and increasing formalization of the economy. Despite the short-term aberrations, on a long-term horizon, we believe India is slowly heading towards a period of sustainable growth. Though there could be intermediary volatility, investors with long term investment horizon, should take advantage of this interim volatility and should use it as an opportunity to add to the equity exposure in a staggered manner.
^MOSPI, ICRA`Markit **ICRA MFI Explorer
Market Performance**
IIP^
PMI`
Inflows in Indian Equities **
Outlook
Source:
(as on November 30, 2017)
4

Debt Market Review
@Factsheet Debt Market Commentary*
India's sovereign rating upgrade; Outlook stable~:
#Retail Inflation jumps to 3.58% in Oct'17 ̂ :
#India's Growth - revived :
&Fiscal deficit touched 96.1% of FY18 target
Outlook:
Source:
Yields on the 10 Year benchmark rose for the month of Nov'17, led by increase in crude oil prices, uncertainty over fiscal numbers, rising inflation as well as global uncertainties. Moody's decision to raise India's sovereign ratings by a notch during the mid-month, uplifted the enthusiasm of market participants. In addition, the central bank's decision to scrap open market sales helped yields retrace sharply. However, even these moves couldn't help the interest rates reverse its short-term downward trend, eventually resulting in the hardening of yields during the month of Nov'17. The Indian 10-year Benchmark G-sec yields, which were seen at 6.86% on 31st Oct'17, rose by 20bps to 7.06% on 30th Nov'17. On the global front, China posted tepid numbers for both industrial production and retail sales growth in the last month as well as the uncertainty over U.S. tax reform too kept the market participants vigilant. During the month of Nov'17, Indian macro-economic data showed some sign of improvement with GDP growing at 6.3% YoY in Q2FY18 as compared to the previous 5.7% in the previous quarter led by higher growth in key manufacturing sector. However, CPI as well as WPI based inflation increased in the month of Oct'17. The overall reduction in global crude output as the OPEC and non-OPEC members agreed to extend output cuts until the end of 2018 increased the global oil prices by ~$2.20/barrel to $63.57/barrel by the end of Nov'17 from $61.37/barrel at the end of Oct'17. The rupee appreciated marginally against the USD, settling at Rs. 64.75/$ on 30th Nov'17 as against Rs. 64.46/$ on 31st Oct'17.
Moody's upgraded India's sovereign bond rating from Baa3 to Baa2, a first in 14 years on the back of continued reforms and adherence to fiscal discipline. The ongoing reforms measures taken by the government such as the new Goods and Services Tax (GST) regime and the mechanisms for resolving bad loans and re-capitalising public sector banks were the most important measures resulting in the rating upgrade. Moody's believes that the current reforms will advance the government's objective of improving the business climate, enhancing productivity, stimulating foreign and domestic investment, and ultimately fostering strong and sustainable growth. The reform program will thus complement the existing shock-absorbance capacity provided by India's strong growth potential and improving global competitiveness.
Consumer Price Index based inflation rose to 3.58% in Oct'17 from 3.28% in Sep'17, but remained below RBI's target of 4%. Housing, fuel and light as well as clothing added to the increase in inflation rising by 6.68%, 6.36% and 4.76% on a yearly basis, respectively. WPI based inflation moved to its highest level in six months and stood at 3.59% in Oct'17 as against 2.60% in the previous month, primarily due to the substantial increase in fuel & power by 10.52% with primary article index by 3.33%.
India's Gross Domestic Product (GDP) grew 6.3% YoY in Q2FY18 as compared to the previous 5.7% in the previous quarter led by higher growth in key manufacturing sector. On Gross Value Added (GVA) basis, the economy rose 6.1% as against 5.6% rise in Jun quarter of 2017. Manufacturing output rose 7% in the Sep quarter, significantly higher than 1.2% growth in Jun quarter. On the other hand, agriculture output increased 1.7%, slower than 2.3% expansion in the previous quarter.
On the back of increase in capital expenditure, the fiscal deficit at the end of Oct'17 reached 96.1% of the budgeted estimate. The government's total expenditure increased on sequential basis and totalled to Rs. 12.93 lakh crore or 60.2% for the period Apr- Oct'17. The capital expenditure by the government rose to 52.60% and revenue expenditure to 61.5% for the period Apr-Oct'17, due to which the fiscal deficit for the government reached to Rs. 5.25tn of the total target of Rs. 5.46tn. In addition, the revenue deficit has overshot its budgetary estimate and rose to 125% of the full-year target of Rs. 3.2tn as compared to 92.5% the previous year.
4Compared to the volatility entrenched around global economies like the US and Europe, volatility in India remains to be low compared to its global peers. Going forward, the US Fed Policy decision coupled with the US tax regime overhaul, would be instrumental in defining the path of the markets globally. The decision would largely dependent on US economic data as well as global dynamics. The global markets could continue to remain volatile as major central banks remained vigilant over the macroeconomic developments.
4The pause of OMO sales and the surprise upgrade of India's Sovereign rating by the rating agency has not only cheered the markets but also has provided much needed reversal in short term trend in yields. The rating upgrade may enhance investors' risk appetite and could also support the foreign investor inflows in the economy. The reforms by the government and RBI would likely contribute to a gradual decline in the interest rates by bringing out the reduction in the general government debt burden over the medium to short term. With the inflation numbers, well within the RBI's target, the central bank is expected to remain “neutral” and in “pause” mode in the upcoming monetary policy and would keep a close watch on the incoming data as well global commodity price movements, especially crude oil.
4The domestic macro-economic stability and gradual pick-up in growth may help FPI inflows on the back of strong institutional framework and stable political situation. The upgrade by Moody's is expected to have strong positive impact on the yields in the longer term. We continue to believe that a strategy which focuses on current accruals and active duration management could offer better risk-adjusted returns.
# @ &MOSPI, ̂ RBI, *MFI Explorer, Bloomberg, CGA, ~ Moody's Analytics
Mr. Avnish JainHead - Fixed Income
(as on November 30, 2017)
5

Gold Update
Overview
Outlook:
Source:
Chart of the Month:
Positive momentum indicating passage of US tax plan and increased political uncertainty in Germany kept gold prices in a tight range last month. The yellow metal closed flat in the month of November 2017 at $1275 per troy ounce while the U.S. Dollar Index lost 1.6% to close at 93.05 as markets remained jittery around the proposed tax plan by U.S. President Donald Trump. The Indian rupee continued to appreciate for second month in a row closing at 64.46 against the U.S. Dollar, up 0.6% at the end of November 2017. The domestic price of gold has risen by 5.1% this year as it closed at Rs. 29236 per 10 grams, underperforming dollar prices owing to currency appreciation.
The headline inflation data in U.S. slowed as it rose just 1.6% on y-o-y basis while Core PCE was unchanged at 1.4% whereas positive momentum buildup in inflation continued. The labour improvement came out strong last month as jobless claims in hurricane hit regions have recovered faster back to normal levels. The U.S. non-farm payrolls addition recovered significantly from previous month figures which came in as a relief. Wage growth however came in flat and remained the cause of concern for policy makers. The trade deficit widened to $43.5bn as imports rose higher than exports. The housing market gained uniformly during the last month with existing home sales and pending home sales rising by 2.0% and 3.5% respectively on a month-on-month basis. The annual pace of home price appreciation was indicative of a steady improvement in the housing sector. Household confidence in the state of the economy came out on a strong footing with most indicators indicating strong broad-based momentum.
Gold prices also faced some headwinds owing to the optimistic assessment of the economic condition by the Federal Open Markets Committee (FOMC). The November FOMC meeting minutes also indicated that most members agreed that the consumer spending and manufacturing sectors witnessed robust growth which overshadowed their concerns on pace of inflation and financial market prices. Gold prices however found some support during the month due to breakdown in coalition talks in Germany leading to high chances of new elections. Disagreement among the coalition partners on key issues including migration led to German politics landing in unprecedented territory.
Strong global equity markets and rising crude oil prices are expected to keep Gold prices in a tight range in the near term. In upcoming events, Gold prices are expected to be driven by development on the tax reforms in U.S. and the FOMC meeting. The probability that the Trump administration and Republicans would usher in a business-friendly tax overhaul has stoked financial markets higher. The House and Senate however have to agree on a single tax bill before it can be sent to President Trump to sign. Gold prices could remain under pressure if the new version of tax plan comes into action as it could lead to Federal Reserve adopting a more hawkish policy stance in the forthcoming FOMC meetings. The market participants have allotted a probability of more than 95% for a rate hike in December FOMC Meeting.
The yellow metal however, has weathered two rate hikes this calendar year and yet has risen by more than 11% till November 2017. On the other hand the U.S. Dollar Index has lost almost 9% and stands at around 93 after starting the year at 102. This clearly reflects that macro-economic stability continues to play a key role in the minds of global investors. Though lack of inflation has been a concern, higher oil prices and improving labor conditions in U.S. could start to push inflation higher. With the FOMC rate hike this month already factored in, gold prices are well supported in the near term.
The possibility of geopolitical instability and political uncertainty are other key catalysts which have propelled gold prices to outperform its 2016 return. Even though military conflict in North Korea has subsided, its nuclear ambitions could lead to markets looking for safe havens. The euro area recovery has gathered pace with private consumption and investment delivering robust numbers. The continuously improving unemployment rate and rising consumer confidence indicators may prompt the European Central Bank (ECB) to consider a check of their low interest rate policy. However, the uncertainty around Germany's political impasse could jolt the foundation of the European Union. Gold prices however are expected to remain supported and could register another positive year of higher prices.
Bloomberg
Gold output trends of major gold producing nations
'AU'some Fact of the Month:
Source:
At least 110 kg of gold, valued at Rs 37 crore, has been seized from smugglers at the Indira Gandhi International Airport here from January till October this year, according to the customs officials. In 2016, 110 cases were registered by the customs in which a 188 kg gold, valued at Rs
48 crore, was seized.
Economic Times
(as on November 30, 2017)
6
Source: Business Insider

$Source ICRA MFI Explorer = # Monthend AUM as on 30.11.2017 = ^The expense ratios mentioned for the schemes excludes GST on investment management fees.= for disclaimers. Please refer page no. 39
PRODUCT POSITIONING
Canara Robeco Equity Diversified follows a predominantly bottom-up investment approach with a focus on fundamentally sound companies which are likely to deliver superior capital appreciation over the long-term. The fund has a predominant focus on large caps with select high conviction mid cap ideas. The fund provides a blend of 'Growth' and 'Value' style of investing.
INVESTMENT STYLE
Growth Value Blend
Large Cap Mid Cap Small Cap
Diversified Thematic Sector
PORTFOLIO
Name of the Instruments % to NAV
Equities 96.84Listed 96.84Banks 19.78HDFC Bank Ltd 8.23ICICI Bank Ltd 4.77Kotak Mahindra Bank Ltd 4.21IndusInd Bank Ltd 2.57
Consumer Non Durables 10.57Britannia Industries Ltd 3.78ITC Ltd 2.94Hindustan Unilever Ltd 2.00Emami Ltd 1.04Parag Milk Foods Ltd 0.81
Finance 9.22Housing Development Finance Corporation Ltd 4.13Bajaj Finserv Ltd 3.41Max Financial Services Ltd 0.93IIFL Holdings Ltd 0.745Paisa Capital Ltd 0.01
Auto 7.72Maruti Suzuki India Ltd 3.90Hero MotoCorp Ltd 1.25Eicher Motors Ltd 0.93Tata Motors Ltd 0.90Escorts Ltd 0.74
Construction Project 6.45Larsen & Toubro Ltd 3.85Engineers India Ltd 1.52Ashoka Buildcon Ltd 1.08
Power 5.44Power Grid Corporation Of India Ltd 2.68Cesc Ltd 1.78NTPC Ltd 0.98
Petroleum Products 5.34Reliance Industries Ltd 3.14Indian Oil Corporation Ltd 2.20
Cement 4.32Ultratech Cement Ltd 1.68Dalmia Bharat Ltd 1.60The Ramco Cements Ltd 1.04
Transportation 3.86Container Corporation Of India Ltd 2.23
Transport Corporation of India Ltd 0.97TCI Express Ltd 0.66
Software 3.47Infosys Ltd 3.47
Pharmaceuticals 3.16Sun Pharmaceutical Industries Ltd 2.36Jubilant Life Sciences Ltd 0.80
Auto Ancillaries 3.08MRF Ltd 1.61Motherson Sumi Systems Ltd 1.47
Chemicals 3.02Solar Industries India Ltd 1.64Atul Ltd 1.38
Pesticides 2.70UPL Ltd 1.63PI Industries Ltd 1.07
Industrial Products 2.24Bharat Forge Ltd 1.17Timken India Ltd 1.07
Gas 1.96Indraprastha Gas Ltd 0.99Petronet LNG Ltd 0.97
Textile Products 1.51K.P.R. Mill Ltd 1.51
Telecom - Services 1.14Bharti Airtel Ltd 1.14
Industrial Capital Goods 1.13Bharat Electronics Ltd 1.13
Engineering Services 0.73VA Tech Wabag Ltd 0.73
Money Market Instruments 3.58Reverse Repo (for India) 3.58
Net Current Assets -0.42
Grand Total ( Net Asset) 100.00
CANARA ROBECO EQUITY DIVERSIFIED (CRED)
lCapital appreciation over long term
lInvestment predominantly in equity and equity related securities
This product is suitable for investors who are seeking*:
*Investors should consult their financial advisers if in doubt about whether the product is suitable for them.Investors understand that their principal
will be at Moderately High Risk
$QUANTITATIVE INFORMATION
Standard Deviation 15.90
Portfolio Beta 1.06
Portfolio Turnover Ratio 0.81 times
R-Squared 0.91
Sharpe Ratio 0.23
FUND INFORMATION
CATEGORY: Open Ended Equity Scheme
SCHEME OBJECTIVE: To generate capital appreciation by investing in equity and equity related securities. However, there can be no assurance that the investment objective of the scheme will be realized.
NAV: (as on November 30, 2017)Direct Plan - Dividend Option ` 48.89Regular Plan - Dividend Option ` 35.27Direct Plan - Growth Option ` 124.56Regular Plan - Growth Option ` 121.15
DATE OF ALLOTMENT: September 16, 2003
ASSET ALLOCATION:
Equity and equity related instruments: 85% -100%.
Money Market instruments : 0% - 15%
MINIMUM INVESTMENT:
Lumpsum: ̀ 5000 in multiples of ̀ 1 thereafter
Subsequent purchases: Minimum amount of ` 1,000 and multiples of ̀ 1 thereafter.
SIP/STP/SWP: For monthly frequency - ` 1000 and in multiples of ̀ 1 thereafter
For quarterly frequency - ̀ 2000 and in multiples of ̀ 1 thereafter
PLANS / OPTIONS :
Regular Plan- Growth Option Regular Plan- Dividend Reinvestment Option/ Payout Option
Direct Plan- Growth OptionDirect Plan- Dividend Reinvestment Option/ Payout Option
ENTRY LOAD: Nil
EXPENSE RATIO^:
Regular Plan : 2.47%
Direct Plan : 1.72%
BENCHMARK: S&P BSE 200
FUND MANAGER: 1) Mr. Ravi Gopalakrishnan2) Mr. Shridatta Bhandwaldar
TOTAL EXPERIENCE: 1) 24 Years2) 11 Years
MANAGING THIS FUND: 1) Since 16-Sep-122) Since 5-July-16
#Monthend AUM : 817.01 Crores
Monthly AVG AUM : ` 813.87 Crores
EXIT LOAD:
1% - If redeemed/switched out within 1 year from the date of allotment, Nil - if redeemed/switched out after 1 year from the date of allotment.
`
(as on November 30, 2017)
RISKOMETER
7

$ Monthend AUM as on 30.11.2017 = ^The expense ratios mentioned for the schemes excludes GST on investment management fees.
=Please refer page no. 39 for disclaimers.
Source ICRA MFI Explorer = #
CANARA ROBECO EQUITY TAX SAVER (CRETS)
PRODUCT POSITIONING
Canara Robeco Equity Tax Saver is an ELSS with a 3 year lock-in period providing Tax Benefits under Sec 80 C of Income Tax Act. The fund benefits from long term investing due to its lock-in. The portfolio consists of both large and mid cap stocks with a 'Growth' style of investing.
PORTFOLIO
Name of the Instruments % to NAV
Equities 98.46Listed 98.46Banks 22.79HDFC Bank Ltd 8.87Kotak Mahindra Bank Ltd 6.77ICICI Bank Ltd 5.45IndusInd Bank Ltd 1.70
Consumer Non Durables 14.05Hindustan Unilever Ltd 4.60Britannia Industries Ltd 4.22Parag Milk Foods Ltd 2.03Kansai Nerolac Paints Ltd 1.95ITC Ltd 1.25
Transportation 7.09Container Corporation Of India Ltd 4.76Transport Corporation of India Ltd 2.33
Pharmaceuticals 6.96Sun Pharmaceutical Industries Ltd 2.95Piramal Enterprises Ltd 1.92Sanofi India Ltd 1.11Jubilant Life Sciences Ltd 0.98
Petroleum Products 6.57Indian Oil Corporation Ltd 3.07Hindustan Petroleum Corporation Ltd 1.81Reliance Industries Ltd 0.95Bharat Petroleum Corporation Ltd 0.74
Auto 5.56Tata Motors Ltd A (DVR) 2.02Mahindra & Mahindra Ltd 1.54Hero MotoCorp Ltd 1.11Tata Motors Ltd 0.89
Finance 5.11Housing Development Finance Corporation Ltd 3.08SBI Life Insurance Co Ltd 1.36ICICI Lombard General Insurance Co Ltd 0.67
Software 4.56Infosys Ltd 3.47Oracle Financial Services Software Ltd 1.09
Construction Project 4.47Ashoka Buildcon Ltd 2.34Sadbhav Engineering Ltd 2.13
Cement 4.25Ultratech Cement Ltd 2.57Grasim Industries Ltd 1.68
Power 2.84Power Grid Corporation Of India Ltd 2.84
Gas 2.41Indraprastha Gas Ltd 2.41
Pesticides 2.21Bayer Cropscience Ltd 2.21
Auto Ancillaries 2.12MRF Ltd 2.12
Fertilisers 1.81Coromandel International Ltd 1.81
Engineering Services 1.65VA Tech Wabag Ltd 1.65
Telecom - Services 1.40Bharti Airtel Ltd 1.40
Industrial Capital Goods 1.34Texmaco Rail & Engineering Ltd 1.34
Construction 0.94Ahluwalia Contracts (India) Ltd 0.94
Industrial Products 0.33Timken India Ltd 0.33
Money Market Instruments 1.78Reverse Repo (for India) 1.78
Net Current Assets -0.24
Grand Total ( Net Asset) 100.00
lCapital appreciation over long term
lInvestment in equity and equity related securities
This product is suitable for investors who are seeking*:
*Investors should consult their financial advisers if in doubt about whether the product is suitable for them.Investors understand that their principal
will be at Moderately High Risk
$QUANTITATIVE INFORMATION
Standard Deviation 14.71
Portfolio Beta 0.95
Portfolio Turnover Ratio 0.66 times
R-Squared 0.87
Sharpe Ratio 0.20
FUND INFORMATION
CATEGORY: Open Ended Equity Linked Tax Saving Scheme
SCHEME OBJECTIVE:
(ELSS Scheme) Seeking to provide long term capital appreciation by predominantly investing in equities and to facilitate the subscribers to seek tax benefits as provided under Section 80 C of the Income Tax Act, 1961. However, there can be no assurance that the investment objective of the scheme will be realized.
NAV: (as on November 30, 2017)Direct Plan - Dividend Option ` 38.29Regular Plan - Dividend Option ` 25.79Direct Plan - Growth Option ` 59.63Regular Plan - Growth Option ` 58.08
DATE OF ALLOTMENT: March 31, 1993
ASSET ALLOCATION:
Equity and equity related instruments: 80%-100%.
Money Market instruments : 0% - 20%.
MINIMUM INVESTMENT:
Lumpsum: ̀ 500 in multiples of ̀ 1 thereafter
Subsequent purchases: Minimum amount of ` 500 and multiples of ̀ 1 thereafter.
SIP/STP/SWP: For monthly frequency - ` 500 and in multiples of ̀ 1 thereafter
For quarterly frequency - ` 1000 and in multiples of ̀ 1 thereafter
PLANS / OPTIONS :
Regular Plan- Growth Option Regular Plan- Dividend Payout Option
Direct Plan- Growth OptionDirect Plan- Dividend Payout Option
ENTRY LOAD: Nil
EXPENSE RATIO^:
Regular Plan : 2.38%Direct Plan : 1.58%
BENCHMARK: S&P BSE 100
FUND MANAGER : 1) Mr. Yogesh Patil2) Mr. Ravi Gopalakrishnan
TOTAL EXPERIENCE : 1) 14 Years 2) 24 Years
MANAGING THIS FUND : 1) Since 1-Apr-162) Since 1-Oct-17
#Monthend AUM : ` 870.78 Crores
Monthly AVG AUM : ` 872.25 Crores
EXIT LOAD: Nil
(as on November 30, 2017)
RISKOMETER
8

$ Monthend AUM as on 30.11.2017= ^The expense ratios mentioned for the schemes excludes GST on investment management fees.= Please refer page no. 39 for disclaimers.
Source ICRA MFI Explorer = #
CANARA ROBECO LARGE CAP+ FUND (CRLCF)The sign (+) in the name of the fund has been used in terms of asset allocation and not in terms of return/yield.
PRODUCT POSITIONING
Canara Robeco Large Cap+ is an open ended fund which will invest in Top 150 companies based on their Market capitalization. The fund aims to benefit from the growing Indian economy by investing in large cap stocks as they have a potential to grow in tandem with Indian economy. The fund will also utilize the inputs from the internal quant model which will act as an idea generator
PORTFOLIO Name of the Instruments % to NAV
Equities 99.01Listed 99.01Banks 23.29HDFC Bank Ltd 9.91ICICI Bank Ltd 5.68Kotak Mahindra Bank Ltd 4.87IndusInd Bank Ltd 2.83
Consumer Non Durables 14.18Britannia Industries Ltd 5.29Hindustan Unilever Ltd 3.99ITC Ltd 3.21Emami Ltd 1.69
Finance 10.00Bajaj Finserv Ltd 5.02Housing Development Finance Corporation Ltd 4.98
Auto 9.49Maruti Suzuki India Ltd 5.03Hero MotoCorp Ltd 1.58Eicher Motors Ltd 1.54Tata Motors Ltd 1.34
Software 7.27Infosys Ltd 3.91Oracle Financial Services Software Ltd 3.36
Petroleum Products 6.21Reliance Industries Ltd 3.48Indian Oil Corporation Ltd 2.73
Auto Ancillaries 5.18MRF Ltd 2.61Motherson Sumi Systems Ltd 2.57
Construction Project 4.84Larsen & Toubro Ltd 4.84
Cement 3.81Ultratech Cement Ltd 3.81
Power 3.50Power Grid Corporation Of India Ltd 3.50
Transportation 3.41Container Corporation Of India Ltd 3.41
Pharmaceuticals 2.80Sun Pharmaceutical Industries Ltd 2.80
Pesticides 2.13UPL Ltd 2.13
Telecom - Services 1.45Bharti Airtel Ltd 1.45
Gas 1.45Petronet LNG Ltd 1.45
Money Market Instruments 1.90CBLO 1.90
Net Current Assets -0.91
Grand Total ( Net Asset) 100.00
lCapital appreciation over long term
lInvesting in companies having a large market capitalization
This product is suitable for investors who are seeking*:
*Investors should consult their financial advisers if in doubt about whether the product is suitable for them.
Investors understand that their principalwill be at Moderately High Risk
$QUANTITATIVE INFORMATION
Standard Deviation 14.60
Portfolio Beta 0.97
Portfolio Turnover Ratio 0.63 times
R-Squared 0.92
Sharpe Ratio 0.21
(as on November 30, 2017)
FUND INFORMATION
CATEGORY : Open Ended Equity Scheme
SCHEME OBJECTIVE :
The Investment Objective of the fund is to provide capital appreciation by predominantly investing in companies having a large market capitalization. However, there can be no assurance that the investment objective of the scheme will be realized.
NAV: (as on November 30, 2017)Direct Plan - Dividend Option ` 22.91Regular Plan - Dividend Option ` 15.92Direct Plan - Growth Option ` 23.08Regular Plan - Growth Option ` 22.08
DAT E OF ALLOTMENT : August 20, 2010
ASSET ALLOCATION :
Large Cap equity and equity related @Instruments : 65% - 100%. Domestic Debt and
Money Market Instruments (including securitized debt up to 10% of Avg AUM ): 0%- 35%.@For the purpose of this Fund, Large Cap Companies are defined as those which are ranked from 1 to 150 on the basis of market capitalization at the time of investment. The ranking will be reviewed on the basis of market capitalisation of companies at the end of every calendar quarter.
MINIMUM INVESTMENT:
Lumpsum: ̀ 5000 in multiples of ̀ 1 thereafter
Subsequent purchases: Minimum amount of ` 1,000 and multiples of ̀ 1.00 thereafter.
SIP/STP/SWP: For monthly frequency - ̀ 1000 and in multiples of ̀ 1 thereafter
For quarterly frequency - ` 2000 and in multiples of ̀ 1 thereafter
PLANS / OPTIONS : Regular Plan- Growth Option Regular Plan- Dividend Reinvestment Option/ Payout Option
Direct Plan- Growth OptionDirect Plan- Dividend Reinvestment Option/ Payout Option
ENTRY LOAD: Nil
EXPENSE RATIO^:
Regular Plan : 2.77%
Direct Plan : 1.65%
BENCHMARK : S&P BSE 100
FUND MANAGER : 1) Mr. Ravi Gopalakrishnan2) Mr. Shridatta Bhandwaldar
TOTAL EXPERIENCE : 1) 24 Years 2) 11 Years
MANAGING THIS FUND : 1) Since 16-Sep-122) Since 5-July-16
#Monthend AUM : ` 105.95 Crores
Monthly AVG AUM : ` 108.38 Crores
EXIT LOAD:
1% for all amounts if redeemed / switched-out within 1 year from the date of allotment. Nil if redeemed / switched-out after 1 year from the date of allotment.
RISKOMETER
INVESTMENT STYLE
Growth Value Blend
Large Cap Mid Cap Small Cap
Diversified Thematic Sector
9
Investors understand that their principalwill be at High Risk
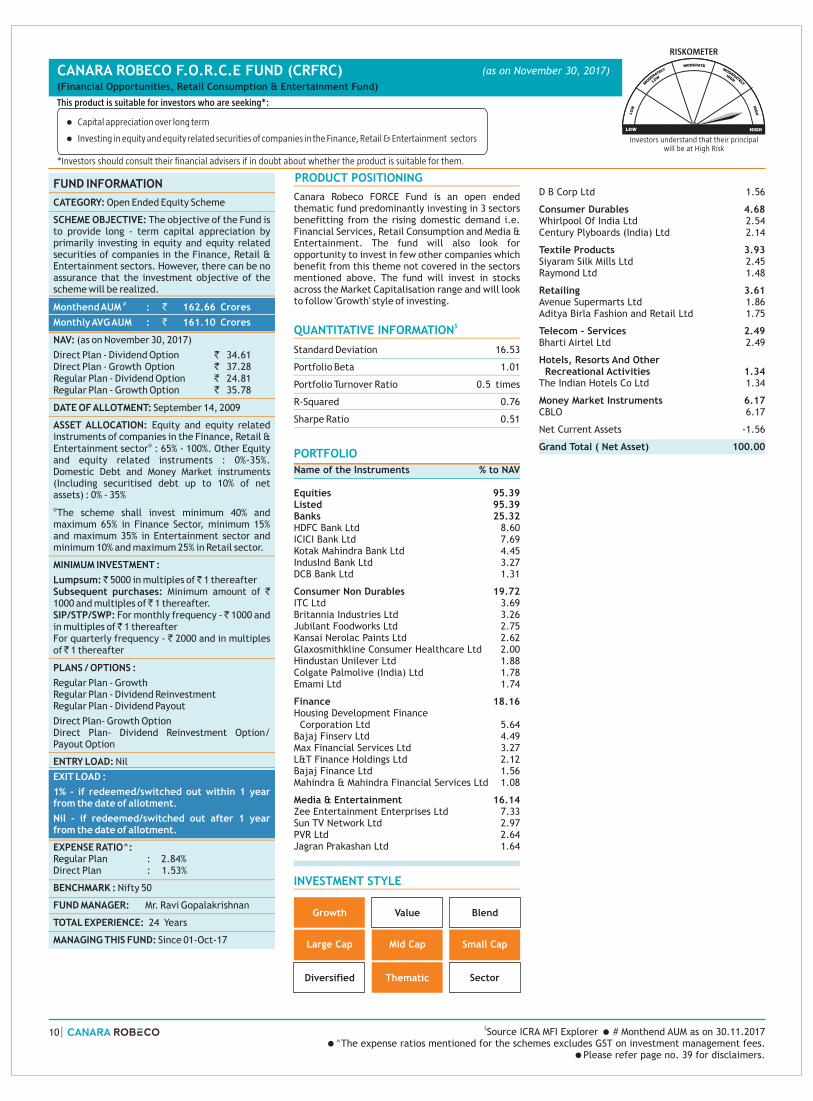
CANARA ROBECO F.O.R.C.E FUND (CRFRC) (Financial Opportunities, Retail Consumption & Entertainment Fund)
(as on November 30, 2017)
INVESTMENT STYLE
Growth Value Blend
Large Cap Mid Cap Small Cap
Diversified Thematic Sector
PRODUCT POSITIONING
Canara Robeco FORCE Fund is an open ended thematic fund predominantly investing in 3 sectors benefitting from the rising domestic demand i.e. Financial Services, Retail Consumption and Media & Entertainment. The fund will also look for opportunity to invest in few other companies which benefit from this theme not covered in the sectors mentioned above. The fund will invest in stocks across the Market Capitalisation range and will look to follow 'Growth' style of investing.
PORTFOLIO
Name of the Instruments % to NAV
Equities 95.39Listed 95.39Banks 25.32HDFC Bank Ltd 8.60ICICI Bank Ltd 7.69Kotak Mahindra Bank Ltd 4.45IndusInd Bank Ltd 3.27DCB Bank Ltd 1.31
Consumer Non Durables 19.72ITC Ltd 3.69Britannia Industries Ltd 3.26Jubilant Foodworks Ltd 2.75Kansai Nerolac Paints Ltd 2.62Glaxosmithkline Consumer Healthcare Ltd 2.00Hindustan Unilever Ltd 1.88Colgate Palmolive (India) Ltd 1.78Emami Ltd 1.74
Finance 18.16Housing Development Finance Corporation Ltd 5.64Bajaj Finserv Ltd 4.49Max Financial Services Ltd 3.27L&T Finance Holdings Ltd 2.12Bajaj Finance Ltd 1.56Mahindra & Mahindra Financial Services Ltd 1.08
Media & Entertainment 16.14Zee Entertainment Enterprises Ltd 7.33Sun TV Network Ltd 2.97PVR Ltd 2.64Jagran Prakashan Ltd 1.64
D B Corp Ltd 1.56
Consumer Durables 4.68Whirlpool Of India Ltd 2.54Century Plyboards (India) Ltd 2.14
Textile Products 3.93Siyaram Silk Mills Ltd 2.45Raymond Ltd 1.48
Retailing 3.61Avenue Supermarts Ltd 1.86Aditya Birla Fashion and Retail Ltd 1.75
Telecom - Services 2.49Bharti Airtel Ltd 2.49
Hotels, Resorts And Other Recreational Activities 1.34The Indian Hotels Co Ltd 1.34
Money Market Instruments 6.17CBLO 6.17
Net Current Assets -1.56
Grand Total ( Net Asset) 100.00
lCapital appreciation over long term
lInvesting in equity and equity related securities of companies in the Finance, Retail & Entertainment sectors
This product is suitable for investors who are seeking*:
*Investors should consult their financial advisers if in doubt about whether the product is suitable for them.
$QUANTITATIVE INFORMATION
Standard Deviation 16.53
Portfolio Beta 1.01
Portfolio Turnover Ratio 0.5 times
R-Squared 0.76
Sharpe Ratio 0.51
FUND INFORMATION
CATEGORY: Open Ended Equity Scheme
SCHEME OBJECTIVE: The objective of the Fund is to provide long - term capital appreciation by primarily investing in equity and equity related securities of companies in the Finance, Retail & Entertainment sectors. However, there can be no assurance that the investment objective of the scheme will be realized.
NAV: (as on November 30, 2017)
Direct Plan - Dividend Option ` 34.61Direct Plan - Growth Option ` 37.28Regular Plan - Dividend Option ` 24.81Regular Plan - Growth Option ` 35.78
DATE OF ALLOTMENT: September 14, 2009
ASSET ALLOCATION: Equity and equity related instruments of companies in the Finance, Retail &
@Entertainment sector : 65% - 100%. Other Equity and equity related instruments : 0%-35%. Domestic Debt and Money Market instruments (Including securitised debt up to 10% of net assets) : 0% - 35%
@The scheme shall invest minimum 40% and maximum 65% in Finance Sector, minimum 15% and maximum 35% in Entertainment sector and minimum 10% and maximum 25% in Retail sector.
MINIMUM INVESTMENT :
Lumpsum: ̀ 5000 in multiples of ̀ 1 thereafterSubsequent purchases: Minimum amount of ` 1000 and multiples of ̀ 1 thereafter.SIP/STP/SWP: For monthly frequency - ̀ 1000 and in multiples of ̀ 1 thereafterFor quarterly frequency - ` 2000 and in multiples of ̀ 1 thereafter
PLANS / OPTIONS :
Regular Plan - Growth Regular Plan - Dividend Reinvestment Regular Plan - Dividend Payout
Direct Plan- Growth OptionDirect Plan- Dividend Reinvestment Option/ Payout Option
ENTRY LOAD: Nil
EXPENSE RATIO^:Regular Plan : 2.84%Direct Plan : 1.53%
BENCHMARK : Nifty 50
FUND MANAGER: Mr. Ravi Gopalakrishnan
TOTAL EXPERIENCE: 24 Years
MANAGING THIS FUND: Since 01-Oct-17
#Monthend AUM : ` 162.66 Crores
Monthly AVG AUM : ` 161.10 Crores
EXIT LOAD :
1% - if redeemed/switched out within 1 year from the date of allotment.
Nil - if redeemed/switched out after 1 year from the date of allotment.
RISKOMETER
$ Monthend AUM as on 30.11.2017=̂The expense ratios mentioned for the schemes excludes GST on investment management fees.
=Please refer page no. 39 for disclaimers.
Source ICRA MFI Explorer = # 10

$ Monthend AUM as on 30.11.2017= ^The expense ratios mentioned for the schemes excludes GST on investment management fees.=Please refer page no. 39 for disclaimers.
Source ICRA MFI Explorer = #
CANARA ROBECO EMERGING EQUITIES (CREE)
INVESTMENT STYLE
Growth Value Blend
Large Cap Mid Cap Small Cap
Diversified Thematic Sector
PRODUCT POSITIONING
Canara Robeco Emerging Equities follows a bottom-
up approach to predominantly invest in a well
diversified portfolio of companies within small &
mid cap universe. The fund endeavours to identify
the stars of tomorrow within the segment.
PORTFOLIO Name of the Instruments % to NAV
Equities 98.24Listed 98.24Consumer Non Durables 10.01Britannia Industries Ltd 2.31Dabur India Ltd 2.18Hindustan Unilever Ltd 1.74Parag Milk Foods Ltd 1.19Akzo Nobel India Ltd 1.06CCL Products (India) Ltd 0.82S.H. Kelkar & Co Ltd 0.71
Finance 10.01Bajaj Finserv Ltd 3.18Mahindra & Mahindra Financial Services Ltd 1.17IIFL Holdings Ltd 1.13Aditya Birla Capital Ltd 0.99Housing Development Finance Corporation Ltd 0.97Can Fin Homes Ltd 0.95Bajaj Finance Ltd 0.61Edelweiss Financial Services Ltd 0.56CARE Ratings Ltd 0.435Paisa Capital Ltd 0.02
Pharmaceuticals 9.35Piramal Enterprises Ltd 2.49Sun Pharmaceutical Industries Ltd 1.79Biocon Ltd 1.53Jubilant Life Sciences Ltd 1.18Hikal Ltd 0.87Suven Life Sciences Ltd 0.83Syngene International Ltd 0.66
Auto Ancillaries 9.03Minda Industries Ltd 4.06Sundram Fasteners Ltd 2.14MRF Ltd 1.97TVS Srichakra Ltd 0.86
Construction Project 6.31Engineers India Ltd 2.18Larsen & Toubro Ltd 1.20
Ashoka Buildcon Ltd 1.19NCC Ltd 1.05Techno Electric & Engineering Co Ltd 0.69
Banks 5.86Kotak Mahindra Bank Ltd 1.74Bank of Baroda 1.47IndusInd Bank Ltd 1.36Karur Vysya Bank Ltd 1.29
Chemicals 5.50Atul Ltd 2.70Navin Fluorine International Ltd 1.50Solar Industries India Ltd 1.30
Industrial Capital Goods 5.14ABB India Ltd 1.56Texmaco Rail & Engineering Ltd 1.37V-Guard Industries Ltd 1.28Honeywell Automation India Ltd 0.93
Transportation 4.52Container Corporation Of India Ltd 2.68TCI Express Ltd 0.98Transport Corporation of India Ltd 0.86
Cement 4.01Dalmia Bharat Ltd 1.67Grasim Industries Ltd 1.39The Ramco Cements Ltd 0.95
Industrial Products 3.88Bharat Forge Ltd 1.23Timken India Ltd 1.05Schaeffler India Ltd 0.98Cummins India Ltd 0.62
Auto 3.66Tata Motors Ltd 2.05Escorts Ltd 0.84Force Motors Ltd 0.77
Power 3.47Cesc Ltd 2.38Power Grid Corporation Of India Ltd 1.09
Petroleum Products 3.06Reliance Industries Ltd 3.06
Pesticides 2.65PI Industries Ltd 1.67Bayer Cropscience Ltd 0.98
Textile Products 2.45Raymond Ltd 1.37K.P.R. Mill Ltd 1.08
Consumer Durables 2.02Whirlpool Of India Ltd 1.46Century Plyboards (India) Ltd 0.56
Telecom - Services 1.83Bharti Airtel Ltd 1.83
Media & Entertainment 1.72PVR Ltd 1.72
Gas 1.71Mahanagar Gas Ltd 1.71
Software 1.37Kpit Technologies Ltd 1.37
Healthcare Services 0.59Thyrocare Technologies Ltd 0.59
Construction 0.09KNR Constructions Ltd 0.09
Money Market Instruments 1.55Reverse Repo (for India) 1.51
CBLO 0.04
Net Current Assets 0.21
Grand Total ( Net Asset) 100.00
lCapital appreciation over long term
lInvesting in diversified mid-cap stocks
This product is suitable for investors who are seeking*:
*Investors should consult their financial advisers if in doubt about whether the product is suitable for them.Investors understand that their principal
will be at Moderately High Risk
$QUANTITATIVE INFORMATION
Standard Deviation 17.43
Portfolio Beta 1.03
Portfolio Turnover Ratio 0.67 times
R-Squared 0.88
Sharpe Ratio 0.80
(as on November 30, 2017)
FUND INFORMATION
CATEGORY: Open Ended Equity Scheme.
SCHEME OBJECTIVE: To generate capital appreciation by primarily investing in diversified mid cap stocks. However, there can be no assurance that the investment objective of the scheme will be realized.
NAV: (as on November 30, 2017)Direct Plan - Dividend Option ` 63.51Regular Plan - Dividend Option ` 47.04Direct Plan - Growth Option ` 98.73Regular Plan - Growth Option ` 94.09
DATE OF ALLOTMENT: March 11, 2005
ASSET ALLOCATION:
Midcap equity & equity related instruments falling within the market capitalization range of
@the underlying benchmark* : 65% - 100% (Risk- High)
Equity & equity related instruments of Companies other than the above: 0% - 35% (Risk- High)
Domestic Debt and Money Market Instruments : 0% - 35% (Risk- Low)
*These companies forming part of the portfolio, would have market capitalization between the highest and the lowest components of the underlying benchmark, and may or may not be a constituent of the underlying benchmark.@‘Nifty Free Float Midcap 100’ is the benchmark of the fund.
MINIMUM INVESTMENT:
Lumpsum: ̀ 5000 in multiples of ̀ 1 thereafter
Subsequent purchases: Minimum amount of ` 1,000 and multiples of ̀ 1 thereafter.
SIP/STP/SWP: For monthly frequency - ̀ 1000 and in multiples of ̀ 1 thereafter
For quarterly frequency - ` 2000 and in multiples of ̀ 1 thereafter
PLANS / OPTIONS :
Regular Plan- Growth Option Regular Plan- Dividend Reinvestment Option/ Payout Option
Direct Plan- Growth OptionDirect Plan- Dividend Reinvestment Option/ Payout Option
ENTRY LOAD: Nil
EXPENSE RATIO^:
Regular Plan : 2.30%Direct Plan : 0.89%
BENCHMARK : Nifty Free Float Midcap 100
FUND MANAGER: 1) Mr. Ravi Gopalakrishnan 2) Mr. Kartik Mehta
TOTAL EXPERIENCE: 1) 24 Years
2) 2 Years
MANAGING THIS FUND: 1) Since 13-May-162) Since 11-Aug-16
#Monthend AUM : ` 2,822.60 Crores
Monthly AVG AUM : ` 2,720.81 Crores
EXIT LOAD :
1% - if redeemed/switched out within 1 year from the date of allotment;
Nil - if redeemed/switched out after 1 year from the date of allotment
RISKOMETER
11

$ Monthend AUM as on 30.11.2017= ^The expense ratios mentioned for the schemes excludes GST on investment management fees.
=Please refer page no. 39 for disclaimers.
Source ICRA MFI Explorer = #
CANARA ROBECO INFRASTRUCTURE (CRI)
INVESTMENT STYLE
Growth Value Blend
Large Cap Mid Cap Small Cap
Diversified Thematic Sector
Canara Robeco Infrastructure endeavours to
capture opportunities in the infrastructure space,
through a predominantly large-cap oriented
portfolio. The fund follows a thematic approach
towards Infrastructure with a 'Growth' style of
investing. The fund aims to have concentrated
holdings on high conviction ideas.
PRODUCT POSITIONING
PORTFOLIO Name of the Instruments % to NAV
Equities 97.31Listed 97.31Transportation 20.30Container Corporation Of India Ltd 9.09Transport Corporation of India Ltd 4.55Blue Dart Express Ltd 3.67TCI Express Ltd 2.99
Construction Project 13.66Ashoka Buildcon Ltd 5.74Sadbhav Engineering Ltd 5.73Techno Electric & Engineering Co Ltd 1.37Larsen & Toubro Ltd 0.82
Cement 13.29Ultratech Cement Ltd 6.24Grasim Industries Ltd 3.65Orient Cement Ltd 2.50Ambuja Cements Ltd 0.90
Petroleum Products 11.02Indian Oil Corporation Ltd 6.74Bharat Petroleum Corporation Ltd 4.28
Gas 9.64Indraprastha Gas Ltd 5.66Petronet LNG Ltd 3.98
Power 9.03Power Grid Corporation Of India Ltd 9.03
Construction 7.54PNC Infratech Ltd 5.23Ahluwalia Contracts (India) Ltd 2.31
Industrial Capital Goods 6.08Texmaco Rail & Engineering Ltd 4.17Praj Industries Ltd 1.91
Engineering Services 5.47VA Tech Wabag Ltd 5.47
Industrial Products 1.28Bharat Forge Ltd 0.89Timken India Ltd 0.39
Money Market Instruments 3.47CBLO 3.47
Net Current Assets -0.78
Grand Total ( Net Asset) 100.00
lCapital appreciation over long term
lInvesting in equities and equity related instruments of companies in the infrastructure sector
This product is suitable for investors who are seeking*:
*Investors should consult their financial advisers if in doubt about whether the product is suitable for them.Investors understand that their principal
will be at High Risk
$QUANTITATIVE INFORMATION
Standard Deviation 17.52
Portfolio Beta 1.04
Portfolio Turnover Ratio 0.38 times
R-Squared 0.73
Sharpe Ratio 0.54
FUND INFORMATION
CATEGORY: Open Ended Equity Scheme
S C H E M E O B J E C T I V E : To g e n e r a t e income/capital appreciation by investing in equities and equity related instruments of companies in the infrastructure sector. However, there can be no assurance that the investment objective of the scheme will be realized.
NAV: (as on November 30, 2017)Direct Plan - Dividend Option ` 39.45Regular Plan - Dividend Option ` 30.49Direct Plan - Growth Option ` 54.88Regular Plan - Growth Option ` 53.01
DATE OF ALLOTMENT: December 2, 2005
ASSET ALLOCATION: Equity and equity related instruments of companies in the Infrastructure sector including derivatives of such companies : 75% - 100%. Domestic Debt and Money Market instruments : 0% - 25%.
MINIMUM INVESTMENT:
Lumpsum: ̀ 5000 in multiples of ̀ 1 thereafter
Subsequent purchases: Minimum amount of ` 1,000 and multiples of ̀ 1 thereafter.
SIP/STP/SWP: For monthly frequency - ` 1000 and in multiples of ̀ 1 thereafter
For quarterly frequency - ̀ 2000 and in multiples of ̀ 1 thereafter
PLANS / OPTIONS : Regular Plan- Growth Option Regular Plan- Dividend Reinvestment Option/ Payout Option
Direct Plan- Growth OptionDirect Plan- Dividend Reinvestment Option/ Payout Option
ENTRY LOAD: Nil
EXPENSE RATIO^:
Regular Plan : 2.84%
Direct Plan : 1.69%
BENCHMARK: S&P BSE 100
FUND MANAGER: Mr. Yogesh Patil
TOTAL EXPERIENCE: 14 Years
MANAGING THIS FUND: Since 29-May-15(As Fund Manager)
Since 1- Dec-11(As Co-Fund Manager)
#Monthend AUM : ` 154.92 Crores
Monthly AVG AUM : ` 150.92 Crores
EXIT LOAD: 1% - If redeemed/switched out within 1 year from the date of allotment, Nil - if redeemed/switched out after 1 year from the date of allotment.
(as on November 30, 2017)
RISKOMETER
12

$ Monthend AUM as on 30.11.2017= ^The expense ratios mentioned for the schemes excludes GST on investment management fees.= Please refer page no. 39 for disclaimers.
Source ICRA MFI Explorer = #
CANARA ROBECO BALANCE (CRB)
INVESTMENT STYLE
Growth Value Blend
Large Cap Mid Cap Small Cap
Diversified Thematic Sector
PRODUCT POSITIONING
Canara Robeco Balance aims to generating long-term capital appreciation through a prudent mix of equity and debt portfolio, making it more suitable for the average investor as it takes away the burden of focusing on asset allocation between equity & debt. The fund invests in a careful blend of select stocks and debt securities which effectively spreads the risk.
PORTFOLIO Name of the Instruments % to NAV
Equities 68.51Listed 68.51Banks 13.33HDFC Bank Ltd 5.38ICICI Bank Ltd 3.35Kotak Mahindra Bank Ltd 3.12IndusInd Bank Ltd 1.48Finance 7.68Housing Development Finance Corporation Ltd 2.83Bajaj Finserv Ltd 2.29Max Financial Services Ltd 1.01CARE Ratings Ltd 0.59IIFL Holdings Ltd 0.50ICICI Lombard General Insurance Co Ltd 0.455Paisa Capital Ltd 0.01Consumer Non Durables 6.96Britannia Industries Ltd 2.07ITC Ltd 1.99Hindustan Unilever Ltd 1.35Emami Ltd 0.54CCL Products (India) Ltd 0.53Parag Milk Foods Ltd 0.48Construction Project 5.75Larsen & Toubro Ltd 2.64Engineers India Ltd 1.07Ashoka Buildcon Ltd 0.91Techno Electric & Engineering Co Ltd 0.75NCC Ltd 0.38Auto 4.76Maruti Suzuki India Ltd 2.25Hero MotoCorp Ltd 1.06Tata Motors Ltd 0.75Eicher Motors Ltd 0.70Power 3.62NTPC Ltd 1.40Power Grid Corporation Of India Ltd 1.23Cesc Ltd 0.99Petroleum Products 3.32Reliance Industries Ltd 1.88Indian Oil Corporation Ltd 1.44Cement 3.12Dalmia Bharat Ltd 1.19Ultratech Cement Ltd 1.05Grasim Industries Ltd 0.88Transportation 2.65Container Corporation Of India Ltd 1.59Transport Corporation of India Ltd 0.67TCI Express Ltd 0.39Software 2.33Infosys Ltd 2.33Pharmaceuticals 2.17Sun Pharmaceutical Industries Ltd 1.52Jubilant Life Sciences Ltd 0.65Auto Ancillaries 1.83MRF Ltd 1.20Minda Industries Ltd 0.63Industrial Products 1.77Bharat Forge Ltd 0.81
ASSET ALLOCATION
lIncome/capital appreciation over long term
lInvesting in equity and equity related securities as well as fixed income securities (debt and money market securities)
This product is suitable for investors who are seeking*:
*Investors should consult their financial advisers if in doubt about whether the product is suitable for them.Investors understand that their principal
will be at Moderately High Risk
Mold Tek Packaging Ltd 0.51Timken India Ltd 0.45Pesticides 1.72UPL Ltd 0.99PI Industries Ltd 0.73Chemicals 1.72Navin Fluorine International Ltd 1.06Atul Ltd 0.66Textile Products 1.53K.P.R. Mill Ltd 0.81Siyaram Silk Mills Ltd 0.72Gas 1.45Petronet LNG Ltd 0.80Indraprastha Gas Ltd 0.65Industrial Capital Goods 0.78Honeywell Automation India Ltd 0.78Telecom - Services 0.78Bharti Airtel Ltd 0.78Media & Entertainment 0.65Zee Entertainment Enterprises Ltd 0.65Construction 0.59Ahluwalia Contracts (India) Ltd 0.59Debt Instruments 6.69Housing Development Finance Corporation Ltd 1.48Housing Development Finance Corporation Ltd 0.73Power Finance Corporation Ltd 0.72Power Finance Corporation Ltd 0.72Indiabulls Housing Finance Ltd 0.72Bharat Petroleum Corporation Ltd 0.72Power Finance Corporation Ltd 0.52Power Grid Corporation of India Ltd 0.37Housing Development Finance Corporation Ltd 0.36Power Finance Corporation Ltd 0.35Money Market Instruments 15.06CBLO 12.94Indiabulls Housing Finance Ltd 1.06National Bank For Agriculture & Rural Development 0.71Treasury Bills 0.35Government Securities 9.048.17% GOI 01-DEC-44 1.917.61% GOI 09-MAY-30 1.466.68% GOI 17-SEP-31 1.387.80% GOI 11-APR-21 1.116.79% GOI 15-MAY-27 1.066.57% GOI 05-DEC-33 1.008.15% GOI 24-NOV-26 0.388.24% GOI 15-FEB-27 0.387.35% GOI 22-JUN-24 0.36
Net Current Assets 0.70
Grand Total ( Net Asset) 100.00
$QUANTITATIVE INFORMATION
Standard Deviation 12.55Portfolio Beta 1.21Portfolio Turnover Ratio 2.56 timesR-Squared 0.83Sharpe Ratio 0.39
(as on November 30, 2017)
RISKOMETER
FUND INFORMATION
CATEGORY: Open Ended Balance Scheme
SCHEME OBJECTIVE: To seek to generate long term capital appreciation and/or income from a portfolio constituted of equity and equity related securities as well as fixed income securities (debt and money market securities). However, there can be no assurance that the investment objective of the scheme will be realized.
NAV: Direct Plan - Monthly Divi. Option ` 86.29Regular Plan - Monthly Divi. Option ` 83.03Direct Plan - Growth Option ` 150.32Regular Plan - Growth Option ` 145.49
DATE OF ALLOTMENT: February 1, 1993
ASSET ALLOCATION: Equity and equity related instruments : 40% - 75%. Debt securities including Securitized debt having rating above AA or equivalent, Money Market Instruments & Govt. Securities : 25% - 60%.
MINIMUM INVESTMENT:
Lumpsum: ̀ 5000 in multiples of ̀ 1 thereafterSubsequent purchases: Minimum amount of ` 1,000 and multiples of ̀ 1 thereafter.SIP/STP/SWP: For monthly frequency - ̀ 1000 and in multiples of ̀ 1 thereafterFor quarterly frequency - ` 2000 and in multiples of ̀ 1 thereafter
PLANS / OPTIONS : Regular Plan- Growth Option Regular Plan - Monthly Dividend Option (Payout and Reinvestment)Direct Plan- Growth OptionDirect Plan - Monthly Dividend Option (Payout and Reinvestment)
ENTRY LOAD: Nil
EXPENSE RATIO^:Regular Plan : 2.45%Direct Plan : 1.08%
BENCHMARK : CRISIL Balanced Fund - Aggressive Index
FUND MANAGER : 1) Mr. Ravi Gopalakrishnan2) Mr. Avnish Jain 3) Mr. Shridatta Bhandwaldar
TOTAL EXPERIENCE : 1) 24 Years 2) 23 Years3) 11 Years
MANAGING THIS FUND: 1) Since 13-May-162) Since 7-Oct-133) Since 5-July-16
#Monthend AUM : ` 1,391.47 Crores
Monthly AVG AUM : ` 1,370.62 Crores
EXIT LOAD: 1% - If redeemed/switched out within 1 year from the date of allotment, Nil - if redeemed/switched out after 1 year from the date of allotment.
(as on November 30, 2017)
13
Equity 68.51%
CBLO/REPO/Reverse Repo & Net Current Assets 13.63%
Treasury Bills/ Sovereign 9.41%
CDs 0.71%
NCDs/Bonds 6.69%
CP 1.06%

$ Monthend AUM as on 30.11.2017= ^The expense ratios mentioned for the schemes excludes GST on investment management fees.
= Please refer page no. 39 for disclaimers.
Source ICRA MFI Explorer = #
CANARA ROBECO MONTHLY INCOME PLAN (CRMIP)
PRODUCT POSITIONINGCanara Robeco Monthly Income Plan is a debt oriented hybrid fund which aims to generate regular income predominantly through exposure in debt instruments. Also a small participation in equity markets endeavours to boost portfolio returns.
QUANTITATIVE INFORMATION $
Yield to Maturity 7.35%Modified Duration 4.96 YearsAverage Maturity 8.73 Years
PORTFOLIO Name of the Instruments % to NAV
Equities 23.47Listed 23.47Banks 5.12HDFC Bank Ltd 2.11ICICI Bank Ltd 1.21Kotak Mahindra Bank Ltd 1.08IndusInd Bank Ltd 0.66Karur Vysya Bank Ltd 0.06
Finance 2.33Housing Development Finance Corporation Ltd 1.06Bajaj Finserv Ltd 0.83Max Financial Services Ltd 0.24IIFL Holdings Ltd 0.20
Consumer Non Durables 1.97Britannia Industries Ltd 0.96Hindustan Unilever Ltd 0.51Emami Ltd 0.32Parag Milk Foods Ltd 0.18
Auto 1.94Maruti Suzuki India Ltd 0.96Hero MotoCorp Ltd 0.32Eicher Motors Ltd 0.24Tata Motors Ltd 0.23Escorts Ltd 0.19
Construction Project 1.58Larsen & Toubro Ltd 0.97Engineers India Ltd 0.38Ashoka Buildcon Ltd 0.23
Industrial Products 1.40Mold Tek Packaging Ltd 0.75Timken India Ltd 0.35Bharat Forge Ltd 0.30
Petroleum Products 1.36Reliance Industries Ltd 0.79Indian Oil Corporation Ltd 0.57
Cement 1.15Dalmia Bharat Ltd 0.47Ultratech Cement Ltd 0.42The Ramco Cements Ltd 0.26
Transportation 0.98Container Corporation Of India Ltd 0.57Transport Corporation of India Ltd 0.24TCI Express Ltd 0.17
Software 0.87Infosys Ltd 0.87
Auto Ancillaries 0.77MRF Ltd 0.41Motherson Sumi Systems Ltd 0.36
Pesticides 0.73UPL Ltd 0.44PI Industries Ltd 0.29
Power 0.71Cesc Ltd 0.46NTPC Ltd 0.25
Pharmaceuticals 0.60Sun Pharmaceutical Industries Ltd 0.60
Gas 0.50Indraprastha Gas Ltd 0.26Petronet LNG Ltd 0.24
Chemicals 0.39Atul Ltd 0.39
Textile Products 0.38K.P.R. Mill Ltd 0.38
Industrial Capital Goods 0.26Bharat Electronics Ltd 0.26
lIncome / Capital appreciation over medium term to long term
lInvestment in Debt instruments, MMI and small portion in equity
This product is suitable for investors who are seeking*:
*Investors should consult their financial advisers if in doubt about whether the product is suitable for them.Investors understand that their principal
will be at Moderately High Risk
RATING PROFILE (% to net assets)
ASSET ALLOCATION
FUND INFORMATIONCATEGORY: Open Ended Debt SchemeSCHEME OBJECTIVE: To generate income by investing in a wide range of Debt Securities and Money Market instruments of various maturities and small portion in equities and Equity Related Instruments. However, there can be no assurance that the investment objective of the scheme will be realized.
NAV: (as on November 30, 2017)Direct Plan - Growth Option ` 55.5032Regular Plan - Growth Option ` 52.7716Direct Plan - Monthly Divi. Option ` 15.1958Regular Plan - Monthly Divi. Option ` 14.3524Regular Plan - Quarterly Divi. Option ` 14.8366Direct Plan - Quarterly Divi. Option ` 15.7088DATE OF ALLOTMENT: April 24, 1988ASSET ALLOCATION: Equity and equity related instruments :10%-25%. Debt securities (including Securitized debt) with Money Market Instruments : 75% - 90%.MINIMUM INVESTMENT: Lumpsum: ̀ 5000 in multiples of ̀ 1 thereafterSIP/STP/SWP: For monthly frequency - ̀ 1000 and in multiples of ̀ 1 thereafterFor quarterly frequency - ` 2000 and in multiples of ̀ 1 thereafterPLANS / OPTIONS : Regular Plan- Growth OptionRegular Plan - Monthly Dividend Payout / Reinvestment OptionRegular Plan- Quarterly Dividend Payout/ Reinvestment OptionDirect Plan- Growth OptionDirect Plan - Monthly Dividend Payout / Reinvestment OptionDirect Plan- Quarterly Dividend Payout/ Reinvestment OptionENTRY LOAD: Nil
EXPENSE RATIO^: Regular Plan : 2.39% Direct Plan : 1.22%
BENCHMARK: Crisil MIP Blended IndexFUND MANAGER : 1) Mr. Avnish Jain
(for debt allocation)2) Mr. Ravi Gopalakrishnan
(for equity allocation)TOTAL EXPERIENCE : 1) 23 Years 2) 24 YearsMANAGING THIS FUND: 1) Since 7-Oct-13
2) Since 16-Sep-12
#Monthend AUM : ` 250.23 CroresMonthly AVG AUM : ` 251.78 Crores
EXIT LOAD: 1% - if redeemed/switched out within 1 year from the date of allotment.Nil – if redeemed / switched out after 1 year from the date of allotment.
MATURITY PROFILE% Allocation
0 to 3 Months 5.05%
6 to 12 Months 4.42%
1 -2 years 10.15%
Greater than 2 Years 48.42%
(as on November 30, 2017)
RISKOMETER
Telecom - Services 0.26Bharti Airtel Ltd 0.26
Engineering Services 0.17VA Tech Wabag Ltd 0.17
Debt Instruments 28.59Dewan Housing Finance Corporation Ltd 4.05Capital First Ltd 4.03Indiabulls Housing Finance Ltd 4.02Bharat Petroleum Corporation Ltd 4.01Indian Railway Finance Corporation Ltd 3.88Power Grid Corporation of India Ltd 2.07Housing Development Finance Corporation Ltd 2.06Power Grid Corporation of India Ltd 2.06Capital First Ltd 2.01Housing Development Finance Corporation Ltd 0.40
Government Securities 34.428.17% GOI 01-DEC-44 8.527.61% GOI 09-MAY-30 6.106.68% GOI 17-SEP-31 5.776.79% GOI 15-MAY-27 3.928.39% RAJASTHAN SDL UDAY 15-MAR-22 2.088.27% RAJASTHAN SDL 23-JUN-22 2.078.39% RAJASTHAN SDL UDAY 15-MAR-21 2.077.35% GOI 22-JUN-24 2.036.57% GOI 05-DEC-33 1.867.72% GOI 26-OCT-55 0.00
Mutual Fund Investments 0.47Canara Robeco Savings Plus Fund 0.47
Reverse REPO 5.05
Other Current Assets 8.00
Grand Total ( Net Asset) 100.00
14
CBLO/REPO/Reverse Repo & Net Current Assets 13.03%
NCDs/Bonds 28.59%
Treasury Bills/ Sovereign
34.41%
Unit Funds 0.47%
Equity 23.51%
CBLO/REPO/Reverse Repo & Net Current Assets 17.03%
AAA & Equivalent 29.48%
Unit Funds 0.61%
Sovereign 44.98%
AA+ & Equivalent
7.89%

$ Monthend AUM as on 30.11.2017= ^The expense ratios mentioned for the schemes excludes GST on investment management fees.= Please refer page no. 39 for disclaimers.
Source ICRA MFI Explorer = #
CANARA ROBECO INDIGO (Income from Debt Instruments & Gold) FUND (CRIF)
PRODUCT POSITIONING
The fund provides a unique combination of Debt and Gold (through Gold ETFs) in one fund. The fund aims to generate alpha through moderate duration play & by capturing the seasonal patterns in Gold. The fund acts as a portfolio diversifier and also provides a blend of accrual & capital appreciation to its investors. The fund through its Gold investment aims to generate additional yield without taking additional credit risk on the fixed income portfolio.
RATING PROFILE (% to net assets)
ASSET ALLOCATION
$$ Canara Robeco Blended Gold Index is a composite index of the Gold Index and CRISIL Short term Bond Fund Index
computed by CRISIL Limited for the purpose of benchmarking the performance of Canara Robeco InDiGo Fund. The Index shall not be copied, transmitted or distributed for any commercial use.
lIncome / Capital appreciation over medium term to short term
lInvestment in debt & money market securities along with investments in Gold ETFs
This product is suitable for investors who are seeking*:
*Investors should consult their financial advisers if in doubt about whether the product is suitable for them.Investors understand that their principal
will be at Moderately High Risk
QUANTITATIVE INFORMATION $
Yield to Maturity 6.36%
Modified Duration 1.32 Years
Average Maturity 1.60 Years
MATURITY PROFILE% Allocation
Net Current Assets 10.66%
0 to 3 Months 25.56%
3 to 6 Months 11.96%
1 -2 years 3.77%
Greater than 2 Years 29.75%
PORTFOLIO
Name of the Instruments % to NAV
Debt Instruments 3.77Power Finance Corporation Ltd 3.77
Government Securities 29.757.80% GOI 11-APR-21 25.057.42% MAHARASHTRA SDL 11-MAY-22 4.70
Mutual Fund Investments 18.29Canara Robeco Gold ETF 12.90Reliance Mutual Fund 5.39
CBLO 25.56
Treasury Bills 11.96
Other Current Assets 10.67
Grand Total ( Net Asset) 100.00
FUND INFORMATION
CATEGORY: Open Ended Debt Scheme
SCHEME OBJECTIVE:To generate income from a portfolio constituted of debt & money market securities along with investments in Gold ETFs. However, there can be no assurance that the investment objective of the scheme will be realized.
NAV: (as on November 30, 2017)Direct Plan - Growth Option ` 15.3522Regular Plan - Growth Option ` 14.8544Regular Plan - Quarterly Divi. Option ` 10.3661Direct Plan - Quarterly Divi. Option ` 11.0939
DATE OF ALLOTMENT: July 9, 2010
ASSET ALLOCATION: Indian Debt & Money Market Instruments :65-90%Gold ETFs:10-35%
MINIMUM INVESTMENT: Lumpsum: ̀ 5000 in multiples of ̀ 1 thereafterSIP/STP/SWP: For monthly frequency - ̀ 1000 and in multiples of ̀ 1 thereafterFor quarterly frequency - ` 2000 and in multiples of ̀ 1 thereafter
PLANS / OPTIONS : Regular Plan- Growth OptionRegular Plan- Quarterly Dividend Payout/ Reinvestment Option
Direct Plan- Growth OptionDirect Plan- Quarterly Dividend Payout/ Reinvestment Option
ENTRY LOAD: Nil
EXPENSE RATIO^:
Regular Plan : 2.47%
Direct Plan : 1.72%
BENCHMARK: Canara Robeco Blended Gold $Index
FUND MANAGER: 1) Mr. Avnish Jain2) Mr. Kiran Shetty
TOTAL EXPERIENCE: 1) 23 Years2) 10 Years
MANAGING THIS FUND: 1) Since 7-Oct-132) Since 7-Oct-13
#Monthend AUM : ` 41.14 Crores
Monthly AVG AUM : ` 42.54 Crores
EXIT LOAD:
1% - if redeemed/switched out within 1 year from the date of allotment.Nil – if redeemed / switched out after 1 year from the date of allotment.
$
(as on November 30, 2017)
RISKOMETER
15
CBLO/REPO/Reverse Repo & Net Current Assets 44.34%
AAA & Equivalent
4.61%
Treasury Bills/Sovereign 51.05%
Gold ETFs 18.29%
CBLO/REPO/Reverse Repo & Net Current Assets 36.23%
NCDs/Bonds 3.77%
Treasury Bills/ Sovereign 41.71%

Investors understand that their principalwill be at Moderate Risk
$ Monthend AUM as on 30.11.2017= ^The expense ratios mentioned for the schemes excludes GST on investment management fees.
= Please refer page no. 39 for disclaimers.
Source ICRA MFI Explorer = #
CANARA ROBECO INCOME (CRINC)
PORTFOLIO
Name of the Instruments Rating % to NAV
Debt Instruments 26.90Capital First Ltd AA+(CARE) 7.71NTPC Ltd AAA(CRISIL) 3.93Indiabulls Housing Finance Ltd AAA(CARE) 3.87Bharat Petroleum Corporation Ltd AAA(CRISIL) 3.85Indian Railway Finance Corporation Ltd AAA(CRISIL) 3.79Power Finance Corporation Ltd AAA(CRISIL) 3.75
Government Securities 48.438.17% GOI 01-DEC-44 Sovereign 8.187.61% GOI 09-MAY-30 Sovereign 7.816.79% GOI 15-MAY-27 Sovereign 7.546.68% GOI 17-SEP-31 Sovereign 7.396.57% GOI 05-DEC-33 Sovereign 7.137.73% GOI 19-DEC-34 Sovereign 3.937.35% GOI 22-JUN-24 Sovereign 3.907.16% GOI 20-MAY-23 Sovereign 2.328.47% MAHARASHTRA SDL 10-FEB-26 Sovereign 0.23
CBLO 25.76
Other Current Assets -1.09
Grand Total ( Net Asset) 100.00
PRODUCT POSITIONING
Canara Robeco Income is an actively managed debt fund wherein the fund manager takes an active view of the interest rate movements. Based on the interest rate view, the duration of the portfolio will be decided along with the asset allocation pattern between sovereign & corporate bonds. As majority of the portfolio gets invested in high quality debt papers, it provides consistent accrual income to the portfolio.
RATING PROFILE (% to net assets)
ASSET ALLOCATION
lIncome / Capital appreciation over medium to long term
lInvestment in Debt and Money Market securities of different maturity and issuers of different risk profiles
This product is suitable for investors who are seeking*:
*Investors should consult their financial advisers if in doubt about whether the product is suitable for them.
QUANTITATIVE INFORMATION $
Yield to Maturity 7.02%
Modified Duration 4.70 Years
Average Maturity 8.23 Years
MATURITY PROFILE
% Allocation
Net Current Assets -1.10%
0 to 3 Months 25.76%
6 to 12 Months 3.87%
Greater than 2 Years 71.47%
FUND INFORMATION
CATEGORY: Open Ended Debt Scheme
SCHEME OBJECTIVE:
To generate income through investment in debt
and money market securities of different
maturity and issuers of different risk profiles.
However, there can be no assurance that the
investment objective of the scheme will be
realized.
NAV: (as on November 30, 2017)Direct Plan - Quarterly Divi. Option ` 15.2647Regular Plan - Quarterly Divi. Option ` 14.7347Direct Plan - Growth Option ` 36.9801Regular Plan - Growth Option ` 35.7877
DATE OF ALLOTMENT: September 19, 2002
ASSET ALLOCATION:
Debt (Including Securitised Debt) : 50% - 100%.
Money Market Instruments / Call Money : 0% - 50%.
MINIMUM INVESTMENT:
Lumpsum: ̀ 5000 in multiples of ̀ 1 thereafter.
SIP/STP/SWP: For monthly frequency - ̀ 1000 and
in multiples of ̀ 1 thereafter
For quarterly frequency - ` 2000 and in multiples
of ̀ 1 thereafter
PLANS / OPTIONS :
Regular Plan- Growth Option Regular Plan - Quarterly Dividend Reinvestment Option/Payout Option
Direct Plan- Growth OptionDirect Plan - Quarterly Dividend Reinvestment Option/Payout Option
ENTRY LOAD: Nil
EXPENSE RATIO^:
Regular Plan : 1.90%
Direct Plan : 1.03%
BENCHMARK: CRISIL Composite Bond Fund Index
FUND MANAGER: Mr. Avnish Jain
TOTAL EXPERIENCE: 23 Years
MANAGING THIS FUND: Since 25-June-14
#Monthend AUM : ` 130.21 Crores
Monthly AVG AUM : ` 130.40 Crores
EXIT LOAD:
1.00% - If redeemed / switched out within 12
months from the date of allotment,
Nil - if redeemed / switched out after 12 months
from the date of allotment
(as on November 30, 2017)
RISKOMETER
16
CBLO/REPO/Reverse Repo & Net Current Assets 24.66%
Treasury Bills/Sovereign 48.43%
AAA & Equivalent 19.19%
AA+ & Equivaent
7.71%
CBLO/REPO/Reverse Repo & Net Current Assets 24.66%
Treasury Bills/Sovereign 48.43%
NCDs/Bonds 26.90%

$ Monthend AUM as on 30.11.2017= ^The expense ratios mentioned for the schemes excludes GST on investment management fees. = Please refer page no. 39 for disclaimers.
Source ICRA MFI Explorer = #
CANARA ROBECO GILT PGS(Provident Fund, Gratuity & Superannuation Fund)(CRGP)
PRODUCT POSITIONING
Canara Robeco Gilt PGS invests in G-Secs of varying
maturity issued by Reserve Bank of India (RBI).
Being invested in sovereign papers, the fund does
not expose its investors to Credit Risk as in the case
of other bond funds.
QUANTITATIVE INFORMATION $
Yield to Maturity 7.01%
Modified Duration 5.92 Years
Average Maturity 9.11 Years
MATURITY PROFILE% Allocation
Net Current Assets 9.21%
0 to 3 Months 7.80%
Greater than 2 Years 82.98%
PORTFOLIO
Name of the Instruments Rating % to NAV
Government Securities 82.988.24% GOI 15-FEB-27 Sovereign 22.026.84% GOI 19-DEC-22 Sovereign 20.756.68% GOI 17-SEP-31 Sovereign 20.016.79% GOI 15-MAY-27 Sovereign 13.616.57% GOI 05-DEC-33 Sovereign 6.448.13% GOI 22-JUN-45 Sovereign 0.15
CBLO 7.80
Other Current Assets 9.22
Grand Total ( Net Asset) 100.00
RATING PROFILE & ASSET ALLOCATION (% to net assets)
lRisk free return (except interest rate risk) and long term capital appreciation
l Investment only in government securities
This product is suitable for investors who are seeking*:
*Investors should consult their financial advisers if in doubt about whether the product is suitable for them.Investors understand that their principal
will be at Moderate Risk
FUND INFORMATION
CATEGORY: Open-Ended dedicated Gilt scheme
SCHEME OBJECTIVE: To provide risk free return (except interest rate risk) while maintaining stability of capital and liquidity. Being a dedicated Gilt Scheme, the funds will be invested in securities as defined under Sec. 2 (2) of Public Debt Act, 1944. However, there can be no assurance that the investment objective of the Scheme will be realized.
NAV: (as on November 30, 2017)Direct Plan - Dividend Option ` 15.3119Regular Plan - Dividend Option ` 14.9349Direct Plan - Growth Option ` 49.0385Regular Plan - Growth Option ` 47.9600
DATE OF ALLOTMENT: December 29, 1999
ASSET ALLOCATION: Govt. Securities Money Market Instruments/Call Money : 0% - 100%.
MINIMUM INVESTMENT: Lumpsum: ̀ 5000 in multiples of ̀ 1 thereafter.SIP/STP/SWP: For monthly frequency - ̀ 1000 and in multiples of ̀ 1 thereafterFor quarterly frequency - ` 2000 and in multiples of ̀ 1 thereafter
PLANS / OPTIONS : Regular Plan- Growth Option Regular Plan- Dividend Reinvestment Option/ Payout Option
Direct Plan- Growth OptionDirect Plan- Dividend Reinvestment Option/ Payout Option
ENTRY LOAD: Nil
EXPENSE RATIO^:
Regular Plan : 1.25%
Direct Plan : 0.60%
BENCHMARK: I-Sec-Li-Bex
FUND MANAGER: Mr. Girish Hisaria
TOTAL EXPERIENCE: 14 Years
MANAGING THIS FUND: Since 24-Aug-14
#Monthend AUM : ` 72.12 Crores
Monthly AVG AUM : ` 72.29 Crores
EXIT LOAD : Nil
(as on November 30, 2017)
RISKOMETER
17
Treasury Bills/Sovereign 82.98%
CBLO/REPO/Reverse Repo & Net Current Assets 17.02%

$ Monthend AUM as on 30.11.2017= ^The expense ratios mentioned for the schemes excludes GST on investment management fees.
= Please refer page no. 39 for disclaimers.
Source ICRA MFI Explorer = #
CANARA ROBECO DYNAMIC BOND FUND (CRDBF)
PRODUCT POSITIONING
Canara Robeco Dynamic Bond Fund intends to invest and trade in G-secs and Corporate Debt by identifying mispriced opportunities & capturing volatility trends. The fund aims at generating Alpha through free-style duration management depending on the interest rate view. At the same time it endeavours to capture accruals in the form of portfolio running yields on high-quality debt instruments.
PORTFOLIO
Name of the Instruments Rating % to NAV
Debt Instruments 5.26Housing Development Finance Corporation Ltd AAA(CRISIL) 3.51Capital First Ltd AA+(CARE) 1.75
Government Securities 56.226.79% GOI 15-MAY-27 Sovereign 15.446.68% GOI 17-SEP-31 Sovereign 14.037.61% GOI 09-MAY-30 Sovereign 12.448.24% GOI 15-FEB-27 Sovereign 7.407.35% GOI 22-JUN-24 Sovereign 3.556.84% GOI 19-DEC-22 Sovereign 1.746.57% GOI 05-DEC-33 Sovereign 1.62
CBLO 32.05
Other Current Assets 6.47
Grand Total ( Net Asset) 100.00
QUANTITATIVE INFORMATION $
Yield to Maturity 6.75%
Modified Duration 4.40 Years
Average Maturity 6.80 Years
lIncome/ Capital appreciation over short to medium term
lInvestment in Debt and Money Market securities
This product is suitable for investors who are seeking*:
*Investors should consult their financial advisers if in doubt about whether the product is suitable for them.Investors understand that their principal
will be at Moderate Risk
ASSET ALLOCATION
RATING PROFILE (% to net assets)
% Allocation
Net Current Assets 6.46%
0 to 3 Months 32.05%
1 -2 years 3.51%
Greater than 2 Years 57.97%
MATURITY PROFILE
FUND INFORMATION
CATEGORY: Open Ended Debt Scheme
SCHEME OBJECTIVE: The objective of the Fund is to seek to generate income from a portfolio of debt and money market securities. However, there can be no assurance that the investment objective of the scheme will be realized and the Fund does not assure or guarantee any returns.
NAV: (as on November 30, 2017)Direct Plan - Dividend Option ` 14.5084Direct Plan - Growth Option ` 19.9932Regular Plan - Dividend Option ` 14.1049Regular Plan - Growth Option ` 19.5004
DATE OF ALLOTMENT: May 29, 2009
ASSET ALLOCATION: Government of india & Corporate Debt Securities
@(including Securitised Debt) : 0% - 100% Money Market Instruments : 0% - 100%.
@Excluding Debt/GOI Securities with initial maturity of less than one year and Treasury bills.
MINIMUM INVESTMENT : Lumpsum: ̀ 5000 in multiples of ̀ 1 thereafter.Subsequent purchases: Minimum amount of ` 1,000 and multiples of ̀ 1 thereafter.SIP/STP/SWP: For monthly frequency - ̀ 1000 and in multiples of ̀ 1 thereafter .For quarterly frequency - ` 2000 and in multiples of ̀ 1 thereafter.
PLANS / OPTIONS :Regular Plan - GrowthRegular Plan - Dividend ReinvestmentRegular Plan - Dividend Payout
Direct Plan- Growth OptionDirect Plan- Dividend Reinvestment Option/ Payout Option
ENTRY LOAD: Nil
EXPENSE RATIO^:
Regular Plan : 1.75%
Direct Plan : 1.07%
BENCHMARK: CRISIL Composite Bond Fund Index
FUND MANAGER: Mr. Girish Hisaria
TOTAL EXPERIENCE: 14 Years
MANAGING THIS FUND: Since 24-Aug-14
#Monthend AUM : ` 286.18 Crores
Monthly AVG AUM : ` 290.40 Crores
EXIT LOAD:0.50% - If redeemed / switched out within six months from the date of allotment,Nil - if redeemed / switched out after six months from the date of allotment
(as on November 30, 2017)
RISKOMETER
18
CBLO/REPO/Reverse Repo & Net Current Assets 38.52%
Treasury Bills/Sovereign 56.22%
AAA & Equivalent 3.51%
AA+ & Equivaent 1.75%
CBLO/REPO/Reverse Repo & Net Current Assets 38.52%
NCDs/Bonds 5.27%
Treasury Bills/ Sovereign56.22%

$ Monthend AUM as on 30.11.2017= ^The expense ratios mentioned for the schemes excludes GST on investment management fees.= Please refer page no. 39 for disclaimers.
Source ICRA MFI Explorer = #
CANARA ROBECO MEDIUM TERM OPPORTUNITIES FUND (CRMTOF)
PRODUCT POSITIONING
Canara Robeco Medium Term Opportunities Fund endeavours to generate accrual income by investing in High quality debt papers. At the same time the scheme endeavours to benefit from interest rate volatility by having low to medium exposure to duration in the portfolio. The fund is suitable for investors who have a medium to long term investment horizon & a moderate risk appetite.
ASSET ALLOCATION
PORTFOLIO
Name of the Instruments % to NAV
Money Market Instruments 8.03JM Financial Products Ltd A1+(ICRA) 4.82Indiabulls Housing Finance Ltd A1+(CRISIL) 3.21
Debt Instruments 65.24Capital First Ltd AA+(CARE) 8.20Tata Motors Ltd AA+(CARE) 6.85Dewan Housing Finance Corporation Ltd AAA(CARE) 6.63Rural Electrification Corporation Ltd AAA(CRISIL) 5.08Food Corporation Of India AAA(CRISIL) 3.56LIC Housing Finance Ltd AAA(CRISIL) 3.38Power Finance Corporation Ltd AAA(CRISIL) 3.37Power Finance Corporation Ltd AAA(CRISIL) 3.34Dewan Housing Finance Corporation Ltd AAA(CARE) 3.31Indiabulls Housing Finance Ltd AAA(CARE) 3.29LIC Housing Finance Ltd AAA(CRISIL) 3.28Power Finance Corporation Ltd AAA(CRISIL) 3.27Indian Railway Finance Corporation Ltd AAA(CRISIL) 3.24Power Grid Corporation of India Ltd AAA(CRISIL) 1.77Power Grid Corporation of India Ltd AAA(CRISIL) 1.68Tata Motors Ltd AA+(CARE) 1.67NTPC Ltd AAA(CRISIL) 1.67HDFC Bank Ltd AA+(CRISIL) 1.65
Government Securities 19.698.43% UTTAR PRADESH SDL UDAY 29-MAR-21 Sovereign 3.396.68% GOI 17-SEP-31 Sovereign 3.146.57% GOI 05-DEC-33 Sovereign 3.038.52% UTTAR PRADESH SDL UDAY 29-MAR-22 Sovereign 1.708.39% RAJASTHAN SDL UDAY 15-MAR-22 Sovereign 1.708.27% GOI 09-JUN-20 Sovereign 1.698.21% HARYANA SDL UDAY 31-MAR-22 Sovereign 1.698.27% RAJASTHAN SDL 23-JUN-22 Sovereign 1.697.61% GOI 09-MAY-30 Sovereign 1.66
CBLO 5.83
Other Current Assets 1.21
Grand Total ( Net Asset) 100.00
Rating
RATING PROFILE (% to net assets)
QUANTITATIVE INFORMATION $
Yield to Maturity 7.35%
Modified Duration 2.49 Years
Average Maturity 3.44 Years
MATURITY PROFILE% Allocation
Net Current Assets 1.20%
0 to 3 Months 13.94%
3 to 6 Months 3.21%
6 to 12 Months 11.49%
1 -2 years 13.31%
Greater than 2 Years 56.85%
lIncome/Capital appreciation over medium to long - term
lInvestment in Debt and Money Market securities with a portfolio weighted average maturity between 3 to 7 years
This product is suitable for investors who are seeking*:
*Investors should consult their financial advisers if in doubt about whether the product is suitable for them.Investors understand that their principal
will be at Moderate Risk
(as on November 30, 2017)
FUND INFORMATION
CATEGORY : Open Ended Debt Scheme
SCHEME OBJECTIVE : The investment objective of the scheme is to generate income and capital appreciation through a portfolio constituted of medium term debt instruments and money market instruments. However, there can be no assurance that the investment objective of the scheme will be realized.
NAV : Direct Plan - Dividend Option 11.4342Regular Plan - Dividend Option ` 11.2000Direct Plan - Growth Option ` 14.0288Regular Plan - Growth Option ` 13.7695
DAT E OF ALLOTMENT : 7th February, 2014
ASSET ALLOCATION : GoI & Debt Securities: 60%-100%
@Money Market Instruments : 0% - 40%.@Money Market Instruments include Commercial Papers, Commercial Bills, Treasury Bills, Government Securities having an un-expired maturity up to one year, Call or Notice Money, Certif icate of Deposit, Usance Bi l ls, Collateralized Borrowing Lending Obligation, Repos & Reverse Repos in Government Securities/Treasury Bills, Bills re-discounting, MIBOR Instruments, alternative investment for the call money market as may be provided by the RBI to meet the liquidity requirements and any other Money market instruments specified by SEBI/RBI from time to time.
MINIMUM INVESTMENT:
Lumpsum: ̀ 5000 in multiples of ̀ 1 thereafter
Subsequent purchases: Minimum amount of ` 1,000 and multiples of ̀ 1 thereafter.
SIP/STP/SWP: `1000 and ` 2,000 respectively for Monthly and Quarterly frequency respectively and in multiples of ̀ 1 thereafter.
PLANS / OPTIONS : Regular Plan- Growth Option Regular Plan- Dividend Reinvestment Option/ Payout Option
Direct Plan- Growth OptionDirect Plan- Dividend Reinvestment Option/Payout Option
ENTRY LOAD: Nil
EXPENSE RATIO^:Regular Plan : 1.25%Direct Plan : 0.57%
BENCHMARK : CRISIL Composite Bond Fund Index
FUND MANAGER : Mr. Avnish Jain
23 Years
#Monthend AUM : ` 306.22 Crores
Monthly AVG AUM : ` 310.02 Crores
EXIT LOAD: 1% - if redeemed/switched-out within 1 year from the date of allotment;Nil - if redeemed/switched out after 1 year from the date of allotment
(as on November 30, 2017)`
TOTAL EXPERIENCE:
MANAGING THIS FUND: Since 7-Feb-14
RISKOMETER
19
CBLO/REPO/Reverse Repo & Net Current Assets 7.03%
AAA & Equivalent 46.87%
AA+ & Equivalent
18.37%
Treasury Bills/Sovereign 19.70%
A1+ & Equivalent8.03%
CBLO/REPO/Reverse Repo & Net Current Assets 7.03%
NCDs/Bonds 65.24%
Treasury Bills/ Sovereign 19.70%
CP 8.03%

Investors understand that their principalwill be at Moderately Low Risk
$ Monthend AUM as on 30.11.2017= ^The expense ratios mentioned for the schemes excludes GST on investment management fees.
= Please refer page no. 39 for disclaimers.
Source ICRA MFI Explorer= #
CANARA ROBECO SHORT TERM FUND (CRSTF)
PRODUCT POSITIONING
Canara Robeco Short Term Fund is perfectly suited
for an investor who has a short term investment
horizon of 6 to 9 months and wishes to avoid high
volatility. In terms of risk return, Canara Robeco
Short Term Fund is positioned between Floating
Rate Funds & Medium Term Funds. The fund
generates income predominantly from accrual
yields on high quality Money Market Instruments,
while an active trading strategy is followed for
generating Alpha.
QUANTITATIVE INFORMATION $
Yield to Maturity 6.88%
Modified Duration 0.96 Years
Average Maturity 1.11 Years
PORTFOLIO
Name of the Instruments Rating % to NAV
Money Market Instruments 4.44Dewan Housing Finance Corporation Ltd A1+(CRISIL) 4.44
Debt Instruments 64.98Housing Development Finance Corporation Ltd AAA(CRISIL) 9.01Power Finance Corporation Ltd AAA(CRISIL) 8.97Sundaram Finance Ltd AA+(CRISIL) 8.90Indian Railway Finance Corporation Ltd AAA(CRISIL) 4.74NTPC Ltd AAA(CRISIL) 4.56Power Grid Corporation of India Ltd AAA(CRISIL) 4.53Dewan Housing Finance Corporation Ltd AAA(CARE) 4.52National Bank For Agriculture & Rural Development AAA(CRISIL) 4.50NTPC Ltd AAA(CRISIL) 4.50LIC Housing Finance Ltd AAA(CRISIL) 4.48Kotak Mahindra Prime Ltd AAA(CRISIL) 4.46Indiabulls Housing Finance Ltd AAA(CARE) 1.81
CBLO 27.43
Other Current Assets 3.15
Grand Total ( Net Asset) 100.00
ASSET ALLOCATION
RATING PROFILE (% to net assets)
% Allocation
Net Current Assets 3.15%
0 to 3 Months 31.87%
6 to 12 Months 9.01%
1 -2 years 42.22%
Greater than 2 Years 13.76%
lIncome / capital appreciation over short term
lInvesting in short term to medium term debt and money market securities
This product is suitable for investors who are seeking*:
*Investors should consult their financial advisers if in doubt about whether the product is suitable for them.
FUND INFORMATION
CATEGORY: Open Ended Debt Scheme
SCHEME OBJECTIVE: The objective of the Fund is to generate income from a portfolio constituted of short to medium term debt and money market securities. However, there can be no assurance that the investment objective of the scheme will be realized.
NAV: (as on November 30, 2017)
Direct Plan - Growth Option ` 19.5104
Direct Plan - Monthly Dividend Option ` 10.1290
Regular Plan - Growth Option ` 19.1043
Regular Plan -
Monthly Dividend Option ` 10.1282
Regular Plan - Weekly Dividend Option ` 10.1214
Direct Plan - Weekly Dividend Option ` 10.1215
DATE OF ALLOTMENT: March 31, 2009
ASSET ALLOCATION:
Money Market Instruments/Debt Securities with less than 2 years residual maturity - 65% - 100%
Debt Securities with less than 5 years residual maturity (including Securitised Debt) - 0% - 35%
MINIMUM INVESTMENT :
Lumpsum: ̀ 5000 in multiples of ̀ 1 thereafter.
Subsequent purchases: Minimum amount of ` 1,000 and multiples of ̀ 1 thereafter.
SIP/STP/SWP: For monthly frequency - ̀ 1000 and in multiples of ̀ 1 thereafter .
For quarterly frequency - ` 2000 and in multiples of ̀ 1 thereafter.
PLANS / OPTIONS :
Regular Plan - Growth Option
Regular Plan - Weekly Dividend Reinvestment Option
Regular Plan - Monthly Dividend Reinvestment Option
Regular Plan - Monthly Dividend Payout Option
Direct Plan - Growth Option
Direct Plan - Weekly Dividend Reinvestment Option
Direct Plan - Monthly Dividend Reinvestment Option
Direct Plan - Monthly Dividend Payout Option
ENTRY LOAD: Nil
EXPENSE RATIO^:
Regular Plan : 1.10%
Direct Plan : 0.60%
BENCHMARK : CRISIL Short Term Bond Fund Index
FUND MANAGER: Ms. Suman Prasad
TOTAL EXPERIENCE: 19 Years
MANAGING THIS FUND: Since 12-Apr-11
#Monthend AUM : ` 112.30 Crores
Monthly AVG AUM : ` 113.34 Crores
EXIT LOAD :0.25% if redeemed/switched out within 60 days from the date of allotment.Nil - if redeemed/switched out after 60 days from the date of allotment.
(as on November 30, 2017)
RISKOMETER
20
AAA & Equivalent 56.08%
A1+ & Equivalent 4.44%
AA+ & Equivalent 8.90%
CBLO/REPO/Reverse Repo & Net Current Assets 30.58%
CBLO/REPO/Reverse Repo & Net Current Assets 30.58%
CDs 4.44%
NCDs/Bonds 64.98%

$ Monthend AUM as on 30.11.2017= ^The expense ratios mentioned for the schemes excludes GST on investment management fees.= Please refer page no. 39 for disclaimers.
Source ICRA MFI Explorer = #
Investors understand that their principalwill be at Moderately Low Risk
RISKOMETER
FUND INFORMATION
PORTFOLIO
Name of the Instruments Rating % to NAV
Money Market Instruments 48.91RBL Bank Ltd A1+(ICRA) 4.85The Ramco Cements Ltd A1+(CRISIL) 4.84Piramal Finance Ltd A1+(ICRA) 4.61Yes Bank Ltd 2.44HDFC Bank Ltd 2.44National Bank For Agriculture & Rural Development A1+(CRISIL) 2.43L & T Finance Ltd A1+(ICRA) 2.43Century Textiles & Industries Ltd A1+(CRISIL) 2.43Manappuram Finance Ltd A1+(CRISIL) 2.41Nabha Power Ltd A1+(CRISIL) 2.41JM Financial Products Ltd A1+(ICRA) 2.40Indiabulls Housing Finance Ltd A1+(CRISIL) 2.40Cox & Kings Ltd A1+(CARE) 2.40Piramal Finance Ltd A1+(ICRA) 2.39ICICI Bank Ltd A1+(ICRA) 2.36Power Finance Corporation Ltd A1+(CRISIL) 2.33JM Financial Products Ltd A1+(ICRA) 1.41Axis Bank Ltd A1+(ICRA) 0.97National Bank For Agriculture & Rural Development A1+(CRISIL) 0.96Debt Instruments 37.17Dewan Housing Finance Corporation Ltd AAA(CARE) 2.48Indian Railway Finance Corporation Ltd AAA(CRISIL) 2.46National Bank For Agriculture & Rural Development AAA(CRISIL) 2.46India Infoline Housing Finance Ltd AA(ICRA) 2.46Tata Motors Ltd AA+(CARE) 2.46Capital First Ltd AA+(CARE) 2.45Sundaram Finance Ltd AA+(CRISIL) 2.44Gruh Finance Ltd AAA(CRISIL) 2.44Capital First Ltd AAA(BWR) 2.44Tata Motors Ltd AA+(CARE) 2.41Indiabulls Housing Finance Ltd AAA(CARE) 1.78Indiabulls Housing Finance Ltd AAA(CARE) 1.48Housing Development Finance Corporation Ltd AAA(CRISIL) 1.47Indian Railway Finance Corporation Ltd AAA(CRISIL) 1.45Reliance Industries Ltd AAA(CRISIL) 1.44Dewan Housing Finance Corporation Ltd AAA(CARE) 0.99Indiabulls Housing Finance Ltd AAA(CARE) 0.98Rural Electrification Corporation Ltd AAA(CRISIL) 0.97Bajaj Finance Ltd AAA(CRISIL) 0.62Rural Electrification Corporation Ltd AAA(CRISIL) 0.50Power Finance Corporation Ltd AAA(CRISIL) 0.50Bajaj Finance Ltd AAA(IND) 0.49Treasury Bills 11.98CBLO 0.83Other Current Assets 1.11
Grand Total ( Net Asset) 100.00
RATING PROFILE (% to net assets)
ASSET ALLOCATION
l Income / Capital appreciation over short term
lInvesting in Short Term Debt Instruments and Money Market Instruments with Weighted Average Portfolio Duration between 3 months to less than 1 year
This product is suitable for investors who are seeking*:
*Investors should consult their financial advisers if in doubt about whether the product is suitable for them.
CATEGORY : Open Ended Debt Scheme
SCHEME OBJECTIVE:To generate income / capital appreciation by investing in a portfolio comprising of short term debt instruments and money market instruments with weighted average portfolio duration between 3 months to less than 1 year. However, there can be no assurance that the investment objective of the scheme will be realized.
NAV : Regular Plan - Daily Dividend Reinvestment Option ` 10.2600Direct Plan - Daily Dividend Reinvestment Option ` 10.2600Direct Plan - Dividend Option ` 24.0823Regular Plan - Dividend Option ` 23.8757Direct Plan - Growth Option ` 26.8712Regular Plan - Growth Option ` 26.6551Direct Plan - Monthly Dividend Option ` 10.2629Regular Plan - Monthly Dividend Option ` 10.2628Regular Plan - Weekly Dividend Option ` 10.2628Direct Plan - Weekly Dividend Option ` 10.2629
DATE OF ALLOTMENT : March 4, 2005
ASSET ALLOCATION:Indian Money Market Instruments : 50% - 100%(Risk - Low to Medium)Indian Debt Securities : 0-50%(Risk - Low to Medium)
MINIMUM INVESTMENT : Lumpsum: ̀ 5000 in multiples of ̀ 1 thereafterSIP/STP/SWP: For monthly frequency - ̀ 1000 and in multiples of ̀ 1 thereafterFor quarterly frequency - ̀ 2000 and in multiples of ̀ 1 thereafter
PLANS / OPTIONS :Regular Plan-Growth OptionRegular Plan- Dividend Reinvestment / Payout Option Regular Plan-Daily Dividend Reinvestment OptionRegular Plan-Weekly Dividend Payout/ Reinvestment OptionRegular Plan- Monthly Dividend Payout/ Reinvestment Option
Direct Plan-Growth OptionDirect Plan- Dividend Reinvestment / Payout OptionDirect Plan-Daily Dividend Reinvestment OptionDirect Plan-Weekly Dividend Payout/ Reinvestment OptionDirect Plan- Monthly Dividend Payout/ Reinvestment Option
ENTRY LOAD: Nil
BENCHMARK: Crisil Liquid Fund Index
FUND MANAGER: 1) Mr. Girish Hisaria2) Ms. Suman Prasad
#Monthend AUM : ` 1,025.78 Crores
Monthly AVG AUM : ` 1,095.50 Crores
(as on November 30, 2017)
EXPENSE RATIO^:
Regular Plan : 0.55%
Direct Plan : 0.36%
14 Years
EXIT LOAD: Nil
TOTAL EXPERIENCE: 1) 2) 19 Years
MANAGING THIS FUND: 1) Since 24-Aug-142) Since 12-Apr-11
PRODUCT POSITIONING
Canara Robeco Savings Plus Fund aims at primarily generating accrual income from investments in money market and debt securities. The Scheme is ideally suited for investors looking at a comparatively lower risk strategy short term debt fund.
QUANTITATIVE INFORMATION$
Yield to Maturity 6.93%
Modified Duration 0.76 Years
Average Maturity 0.87 Years
MATURITY PROFILE
% Allocation
Net Current Assets 1.13%
0 to 3 Months 33.27%
3 to 6 Months 22.23%
6 to 12 Months 11.75%
1 -2 years 17.52%
Greater than 2 Years 14.10%
CANARA ROBECO SAVINGS PLUS FUND (CRSPF) (as on November 30, 2017)
21
AAA & Equivalent 24.95%
AA+ & Equivalent
9.76%
A1+ & Equivalent 48.89%
AA & Equivalent
2.46%
Treasury Bills/Sovereign 11.98%
CBLO/REPO/Reverse Repo & Net Assets 1.96%
Current
CDs 9.13%
CP 34.89%
NCDs/Bonds 37.17%
Treasury Bills/ Sovereign 11.98%
CBLO/REPO/Reverse Repo & Net Assets 1.96%
Current
Fixed Deposit 4.87%

$ Monthend AUM as on 30.11.2017= ^The expense ratios mentioned for the schemes excludes GST on investment management fees.
= Please refer page no. 39 for disclaimers.
Source ICRA MFI Explorer = #
CANARA ROBECO TREASURY ADVANTAGE FUND (CRTAF)
l Income / capital appreciation over short term through a low risk strategy
lInvestment in a mix of Money Market Instruments.
This product is suitable for investors who are seeking*:
*Investors should consult their financial advisers if in doubt about whether the product is suitable for them.
(as on November 30, 2017)
Investors understand that their principalwill be at Low Risk
RISKOMETER
ASSET ALLOCATION
RATING PROFILE (% to net assets)
PORTFOLIO
Name of the Instruments Rating % to NAV
Money Market Instruments 34.30L & T Finance Ltd A1+(CARE) 6.38Axis Bank Ltd A1+(ICRA) 6.38Indiabulls Housing Finance Ltd A1+(CRISIL) 6.36National Bank For Agriculture & Rural Development A1+(CRISIL) 6.31JM Financial Products Ltd A1+(ICRA) 6.31Cox & Kings Ltd A1+(CARE) 2.56
CBLO 34.01
Treasury Bills 31.70
Other Current Assets -0.01
Grand Total ( Net Asset) 100.00
QUANTITATIVE INFORMATION $
Yield to Maturity 6.18%
Modified Duration 0.11 Years
Average Maturity 0.12 Years
Canara Robeco Treasury Advantage Fund seeks to provide consistent income and liquidity through investments made primarily in money market and debt securities following a low risk strategy. The portfolio duration of the fund tends to be slightly higher than a liquid fund.
MATURITY PROFILE
% Allocation
Net Current Assets -0.03%
0 to 3 Months 74.78%
3 to 6 Months 25.26%
FUND INFORMATION
CATEGORY : Open ended Money Market Scheme
SCHEME OBJECTIVE:
To generate income / capital appreciation through a low risk strategy by investment in Money Market Instruments (MMI). However, there can be no assurance that the investment objective of the scheme will be realized.
NAV: (as on November 30, 2017)Direct Plan - Daily Dividend Reinvestment Option ` 1,240.7100Direct Plan - Dividend Option ` 1,489.4152Direct Plan - Growth Option ` 2,600.6830Direct Plan - Monthly Dividend Option ` 1,000.2962Regular Plan - Dividend Payout Option ` 1,047.6356Regular Plan - Daily Dividend Reinvestment Option ` 1,240.7100Regular Plan - Growth Option ` 2,550.0888Regular Plan - Monthly Dividend Option ` 1,000.2769Regular Plan - Weekly Dividend Option ` 1,240.8922Direct Plan - Weekly Dividend Option ` 1,240.9160
DATE OF ALLOTMENT: Retail Plan : September 16, 2003Institutional Plan : August 21, 2007Regular Plan : July 14, 2008
ASSET ALLOCATION:MMI / Call / Debt Instruments / cash and cash equivalents with residual average maturity of equal to or less than one year: 0% - 100% (Risk - Low to Medium)
MINIMUM INVESTMENT : Lump sum InvestmentMinimum amount: ` 500.00 and in multiples of ` 1.00 thereafter.Subsequent purchases: Minimum amount of ` 500.00 and multiples of ̀ 1.00 thereafter.Systematic Investment Plan (SIP):Minimum installment amount - ` 500.00 and in multiples of ` 1.00 thereafter for Monthly and Quarterly frequency respectively.Systematic Transfer Plan (STP):The minimum amount for STP will be subject to the minimum investment amount as detailed in switch-in schemeSystematic Withdrawal Plan (SWP):Minimum amount: ̀ 100 and in multiples of ̀ 1.00 thereafter
PLANS / OPTIONS :Regular Plan - Growth OptionRegular Plan - Daily Dividend ReinvestmentRegular Plan - Weekly Dividend ReinvestmentRegular Plan - Weekly Dividend PayoutRegular Plan - Monthly Dividend ReinvestmentRegular Plan - Monthly Dividend PayoutRegular Plan - Dividend PayoutDirect Plan - Growth Option
#Monthend AUM : ` 78.00 Crores
Monthly AVG AUM : ` 77.69 Crores
Direct Plan - Daily Dividend ReinvestmentDirect Plan - Weekly Dividend ReinvestmentDirect Plan - Weekly Dividend PayoutDirect Plan - Monthly Dividend ReinvestmentDirect Plan - Monthly Dividend PayoutDirect Plan - Dividend Payout
ENTRY LOAD: Nil
EXPENSE RATIO^:
Regular Plan : 0.95%
Direct Plan : 0.25%
BENCHMARK: Crisil Liquid Fund Index
FUND MANAGER: 1) Mr. Girish Hisaria2) Ms. Suman Prasad
TOTAL EXPERIENCE: 1) 14 Years2) 19 Years
MANAGING THIS FUND: 1) Since 24-Aug-142) Since 12-Apr-11
EXIT LOAD: Nil
22
CBLO/REPO/Reverse Repo & Net
Assets 33.99%Current
A1+ & Equivalent 34.31%
Treasury Bills/Sovereign 31.71%
CDs 12.70%
CP 21.61%
CBLO/REPO/Reverse Repo & Net Current Assets 33.99%
Treasury Bills/ Sovereign 31.71%

CDs 4.67%
CP 54.19%
CBLO/REPO/Reverse Repo & Net Current Assets 31.75%
Treasury Bills/ Sovereign 2.33%
Fixed Deposit 7.05%
CANARA ROBECO LIQUID (CRL)
$ Monthend AUM as on 30.11.2017= ^The expense ratios mentioned for the schemes excludes GST on investment management fees.= Please refer page no. 39 for disclaimers.
Source ICRA MFI Explorer = #
PRODUCT POSITIONING
Canara Robeco Liquid invests in only short-term money market instruments with a residual maturity upto 91 days. The fund aims to provide liquidity at all the time. The fund is suitable for investments with very short term horizon & to park surplus money.
QUANTITATIVE INFORMATION $
Yield to Maturity 6.30%
Modified Duration 0.07 Years
Average Maturity 0.08 Years
MATURITY PROFILE
% Allocation
Net Current Assets 0.01%
0 to 3 Months 99.99%
PORTFOLIO
Name of the Instruments Rating % to NAV
Money Market Instruments 65.93The Ramco Cements Ltd A1+(ICRA) 7.00Hinduja Leyland Finance Ltd A1+(CARE) 4.70Aditya Birla Finance Ltd A1+(ICRA) 4.68L & T Finance Ltd A1+(ICRA) 4.68Bajaj Finance Ltd A1+(CRISIL) 4.68Edelweiss Commodities Services Ltd A1+(CRISIL) 4.68RBL Bank Ltd A1+(ICRA) 4.67Century Textiles & Industries Ltd A1+(CRISIL) 4.66Manappuram Finance Ltd A1+(CRISIL) 4.64HDFC Bank Ltd 2.35HDFC Bank Ltd 2.35Yes Bank Ltd 2.35Cox & Kings Ltd A1+(CARE) 2.35National Bank For Agriculture & Rural Development A1+(CRISIL) 2.34Century Textiles & Industries Ltd A1+(CRISIL) 2.34Cox & Kings Ltd A1+(CARE) 2.33Cox & Kings Ltd A1+(CARE) 2.33Nabha Power Ltd A1+(CRISIL) 2.33L & T Finance Ltd A1+(CARE) 0.47
CBLO 31.73
Treasury Bills 2.33
Other Current Assets 0.01
Grand Total ( Net Asset) 100.00
lIncome/Capital appreciation over short term, while maintaining a level of high liquidity
lInvestment in a mix of Money Market Instrument & Debt Securities
This product is suitable for investors who are seeking*:
*Investors should consult their financial advisers if in doubt about whether the product is suitable for them.
FUND INFORMATIONCATEGORY: Open Ended Cash Management SchemeSCHEME OBJECTIVE: To enhance the income, while maintaining a level of liquidity through, investment in a mix of MMI & Debt securities. However, there can be no assurance that the investment objective of the scheme will be realized.
NAV: (as on November 30, 2017)Direct Plan - Daily Divi. Reinvestment Option ` 1,005.5000Direct Plan - Dividend Option ` 1,471.1167Direct Plan - Growth Option ` 2,054.8142Unclaimed Redmp & Dividend Plan-Direct Growth ` 1,116.7412Direct Plan - Monthly Dividend Option ` 1,000.1757Regular Plan - Daily Dividend Reinvestment Option ` 1,005.5000Regular Plan - Growth Option ` 2,050.6655Regular Plan - Monthly Dividend Option ` 1,000.1749Regular Plan - Weekly Dividend Option ` 1,000.1748Direct Plan - Weekly Dividend Option ` 1,000.1758DATE OF ALLOTMENT: Retail Plan : January 15, 2002Institutional Plan : May 31, 2004Regular Plan : July 15, 2008ASSET ALLOCATION: Money Market Instruments/call money:65%-100%Debt (including securitized debt) : 0% - 35%.MINIMUM INVESTMENT : Lumpsum: ̀ 5000 in multiples of ̀ 1 thereafterSubsequent purchases: Minimum amount of ` 1,000 and multiples of ̀ 1 thereafter.STP/SWP: For monthly frequency - ` 1000 and in multiples of ̀ 1 thereafterFor quarterly frequency - ` 2000 and in multiples of ̀ 1 thereafterPLANS / OPTIONS :Regular Plan - Growth OptionRegular Plan - Daily Dividend ReinvestmentRegular Plan - Weekly Dividend ReinvestmentRegular Plan - Weekly Dividend payoutRegular Plan - Monthly Dividend ReinvestmentRegular Plan - Monthly Dividend PayoutDirect Plan - Growth OptionDirect Plan -Daily Dividend ReinvestmentDirect Plan - Weekly Dividend ReinvestmentDirect Plan - Weekly Dividend payoutDirect Plan - Monthly Dividend ReinvestmentDirect Plan - Monthly Dividend PayoutDirect Plan - Dividend PayoutUnclaimed Redmp & Dividend Plan-Direct Growth
ENTRY LOAD: Nil
EXPENSE RATIO^:Regular Plan : 0.12%Direct Plan : 0.08%BENCHMARK: Crisil Liquid Fund IndexFUND MANAGER: 1) Mr. Girish Hisaria
2) Ms. Suman PrasadTOTAL EXPERIENCE: 1) 14 Years
2) 19 Years MANAGING THIS FUND: 1) Since 24-Aug-14
2) Since 18-Mar-11
#Monthend AUM : ` 1,063.73 CroresMonthly AVG AUM : ` 1,033.80 Crores
EXIT LOAD: Nil
(as on November 30, 2017)
RATING PROFILE (% to net assets) ASSET ALLOCATION
Investors understand that their principalwill be at Low Risk
RISKOMETER
23
A1+ & Equivalent 65.92%
CBLO/REPO/Reverse Repo & Net Current Assets 31.75%
Treasury Bills/Sovereign 2.33%

$ Monthend AUM as on 30.11.2017= ^The expense ratios mentioned for the schemes excludes GST on investment management fees.
= Please refer page no. 39 for disclaimers.
Source ICRA MFI Explorer = #
CANARA ROBECO YIELD ADVANTAGE FUND (CRYAF)
PRODUCT POSITIONING
Canara Robeco Yield Advantage seeks to maximize returns through active management of the portfolio consisting of wide range of Debt and Money Market Instruments. The Fund takes Corporate Bond exposure (80-100%) with the aim to generate accrual returns. The scheme may also tactically allocate to money market and government securities (0-20%) to manage liquidity and generate capital appreciation
PORTFOLIO
Name of the Instruments RATING % to NAV
Money Market Instruments 8.66ICICI Bank Ltd A1+(ICRA) 5.40JM Financial Products Ltd A1+(ICRA) 2.16JM Financial Products Ltd A1+(ICRA) 1.10Debt Instruments 70.51Reliance Industries Ltd AAA(CRISIL) 8.80Kotak Mahindra Prime Ltd AAA(CRISIL) 5.62Rural Electrification Corporation Ltd AAA(CRISIL) 5.56Dewan Housing Finance Corporation Ltd AAA(CARE) 4.54National Bank For Agriculture & Rural Development AAA(CRISIL) 4.45Dewan Housing Finance Corporation Ltd AAA(CARE) 3.41Capital First Ltd AA+(CARE) 3.38Tata Motors Ltd AA+(CARE) 3.33Food Corporation Of India AAA(CRISIL) 2.44Tata Motors Ltd AA+(CARE) 2.36Indian Railway Finance Corporation Ltd AAA(CRISIL) 2.28LIC Housing Finance Ltd AAA(CRISIL) 2.24Sundaram Finance Ltd AA+(CRISIL) 2.24Mahindra & Mahindra Financial Services Ltd AAA(IND) 2.23UltraTech Cement Ltd AAA(CRISIL) 2.20Tata Motors Ltd AA+(CARE) 1.17Dewan Housing Finance Corporation Ltd AAA(CARE) 1.14Tata Motors Ltd AA+(CARE) 1.14Indiabulls Housing Finance Ltd AAA(CARE) 1.13Housing Development Finance Corporation Ltd AAA(CRISIL) 1.13Indiabulls Housing Finance Ltd AAA(CARE) 1.13HDFC Bank Ltd AA+(CRISIL) 1.13Power Finance Corporation Ltd AAA(CRISIL) 1.12Kotak Mahindra Prime Ltd AAA(CRISIL) 1.12Capital First Ltd AAA(BWR) 1.12Capital First Ltd AA+(CARE) 1.12Power Finance Corporation Ltd AAA(CRISIL) 1.11National Highways Authority Of India AAA(CRISIL) 1.11Power Finance Corporation Ltd AAA(CRISIL) 0.35ICICI Home Finance Company Ltd AAA(CARE) 0.30Blue Dart Express Ltd AA(ICRA) 0.06Blue Dart Express Ltd AA(ICRA) 0.05Government Securities 3.947.68% GOI 15-DEC-23 Sovereign 2.318.27% RAJASTHAN SDL 23-JUN-22 Sovereign 1.168.21% RAJASTHAN SDL UDAY 31-MAR-21 Sovereign 0.417.86% KARNATAKA SDL 15-MAR-27 Sovereign 0.06
CBLO 16.89
Other Current Assets 0.00
Grand Total ( Net Asset) 100.00
ASSET ALLOCATION
lIncome/ Capital appreciation over medium term to long term.
lInvestment in a wide range of debt securities and Money Market Instruments of various maturities and risk profile and a small portion of investment in Equity and Equity Related Instruments
This product is suitable for investors who are seeking*:
*Investors should consult their financial advisers if in doubt about whether the product is suitable for them.Investors understand that their principal
will be at Moderate Risk
FUND INFORMATION
CATEGORY: Open Ended Debt Scheme
SCHEME OBJECTIVE : To generate regular income by investing in a wide range of debt securities and Money Market Instruments of various maturities and risk profile and a small portion of investment in Equity and Equity Related Instruments. However, there can be no assurance that the investment objective of the Scheme will be realized.
NAV : (as on November 30, 2017)Direct Plan - Growth Option ` 16.8287Regular Plan - Growth Option ` 16.1971Direct Plan - Monthly Dividend Option ` 15.3982Regular Plan - Monthly Dividend Option ` 14.5058Regular Plan - Quarterly Dividend Option ` 14.8415Direct Plan - Quarterly Dividend Option ` 15.4631
DAT E OF ALLOTMENT : 25 April, 2011
ASSET ALLOCATION :Indian Debt and Money Market Instruments: 90% - 100%Equity and Equity related Instruments: 0% - 10%
MINIMUM INVESTMENT :Lumpsum: ̀ 5000 in multiples of ̀ 1 thereafterSIP/STP/SWP: For monthly frequency - ̀ 1000 and in multiples of ̀ 1 thereafterFor quarterly frequency - ` 2000 and in multiples of ̀ 1 thereafter
PLANS/OPTIONS : Regular Plan- Growth OptionRegular Plan- Monthly Dividend Payout / Reinvestment OptionRegular Plan- Quarterly Dividend Payout/ Reinvestment Option
Direct Plan- Growth OptionDirect Plan- Monthly Dividend Payout / Reinvestment OptionDirect Plan- Quarterly Dividend Payout/ Reinvestment Option
ENTRY LOAD: Nil
EXPENSE RATIO^:Regular Plan : 1.25%Direct Plan : 0.53%
BENCHMARK: Crisil MIP Blended Index
FUND MANAGER : 1) Mr. Ravi Gopalakrishnan 2) Ms. Suman Prasad
TOTAL EXPERIENCE : 1) 24 Years 2)19 Years
MANAGING THIS FUND : 1) Since 16-Sep-122) Since 16-Sep-12
#Monthend AUM : ` 446.73 Crores
Monthly AVG AUM : ` 454.00 Crores
EXIT LOAD: Nil
(as on November 30, 2017)
RISKOMETER
QUANTITATIVE INFORMATION $
Yield to Maturity 7.23%
Modified Duration 1.86 Years
Average Maturity 2.26 Years
MATURITY PROFILE
% Allocation
Net Current Assets -0.01%
0 to 3 Months 17.99%
3 to 6 Months 2.16%
6 to 12 Months 11.09%
1 -2 years 21.07%
Greater than 2 Years 47.70%
24
RATING PROFILE (% to net assets)
CBLO/REPO/Reverse Repo & Net Current Assets 16.88%
AAA & Equivalent
54.53%
AA+ & Equivalent 15.88%
AA & Equivalent 0.11%
Treasury Bills/Sovereign 3.95%
A1+ & Equivalent 8.67%
CBLO/REPO/Reverse Repo & Net Current Assets 16.88%
NCDs/Bonds 70.51%
Treasury Bills/ Sovereign 3.95%
CDs 5.40%CP 3.26%

PORTFOLIO
Name of the Instruments % to NAV
Mutual Fund Investments 99.34Canara Robeco Gold ETF 99.34CBLO 0.39Other Current Assets 0.27Grand Total ( Net Asset) 100.00
CANARA ROBECO GOLD SAVINGS FUND (CRGSF)
RATING PROFILE (% to net assets)
CBLO/REPO/Reverse Repo & Net Current Assets : 100.00%
PRODUCT POSITIONING
Canara Robeco Gold Savings Fund is aimed at investors who want to benefit from movements in gold prices without holding physical gold. It follows a passive investment strategy and seeks to provide returns that closely correspond to the returns provided by Canara Robeco Gold ETF.
ASSET ALLOCATION
lCapital appreciation that closely correspond to returns provided by Canara Robeco Gold Exchange Traded Fund
lInvestment in units of Canara Robeco Gold Exchange Traded Fund
This product is suitable for investors who are seeking*:
*Investors should consult their financial advisers if in doubt about whether the product is suitable for them.Investors understand that their principal
will be at Moderately High Risk
(as on November 30, 2017)
FUND INFORMATIONCATEGORY : An Open Ended Fund of FundSCHEME OBJECTIVE : The investment objective of the Scheme is to provide returns that closely correspond to the returns provided by Canara Robeco Gold Exchange Traded Fund .
NAV : Direct Plan - Dividend Option ` 8.8802Regular Plan - Dividend Option ` 8.8521Direct Plan - Growth Option ` 8.9237Regular Plan - Growth Option ` 8.8471DAT E OF ALLOTMENT : June 25, 2012ASSET ALLOCATION : Units of Canara Robeco Gold ETF : 95%-100%Debt and Money Market Instruments (Including Cash Equivalent) and Mutual fund Schemes which invest predominantly in the money market securities or Liquid Schemes : 0%-5%MINIMUM INVESTMENT: Lumpsum: ̀ 5,000 in multiples of ̀ 1 thereafterSIP/STP/SWP: - ̀ 500 and ̀ 1,000 respectively for Monthly and Quarterly frequency respectively and in multiples of ̀ 1 thereafter.PLANS / OPTIONS : Regular Plan- Growth Option Regular Plan- Dividend Reinvestment Option/ Payout OptionDirect Plan- Growth Option
#Monthend AUM : ` 45.19 CroresMonthly AVG AUM : ` 46.25 Crores
(as on November 30, 2017)
Direct Plan- Dividend Reinvestment Option/Payout OptionENTRY LOAD: Nil
EXPENSE RATIO^:Regular Plan : 0.71%Direct Plan : 0.48%BENCHMARK : Price of Physical GoldFUND MANAGER : 1) Mr. Avnish Jain
2) Mr. Kiran Shetty 23 Years
EXIT LOAD:2% if redeemed / switched – out within 1 year from the date of allotment
TOTAL EXPERIENCE: 1) 2) 10 YearsMANAGING THIS FUND: 1) Since 7-Oct-13
2) Since 25-Jun-15
RISKOMETER
MATURITY PROFILE
% Allocation
Net Current Assets 0.27%
CANARA ROBECO GOLD EXCHANGE TRADED FUND (CRGETF)
lCapital appreciation over long term that are in line with the performance of gold, subject to tracking errors
lInvestment predominantly in Gold bullion of 0.995 fineness
This product is suitable for investors who are seeking*:
*Investors should consult their financial advisers if in doubt about whether the product is suitable for them.Investors understand that their principal
will be at Moderately High Risk
(as on November 30, 2017)
PORTFOLIO Name of the Instruments % to NAV
GOLD 995 1KG BAR 99.10CBLO 0.99Other Current Assets -0.09
Grand Total ( Net Asset) 100.00
GOLD
PRODUCT POSITIONING
Canara Robeco Gold Exchange Traded Fund is for investors who want to benefit from movement in gold prices without holding physical gold. It follows passive investment strategy and is benchmarked to price of physical gold. It endeavours to track and provide returns similar to its benchmark ie. prices of domestic gold through investment in physical gold and money market instruments
RATING PROFILE (% to net assets)
CBLO/REPO/Reverse Repo & Net Current Assets : 100.00%
ASSET ALLOCATION
FUND INFORMATIONCATEGORY : An Open Ended Exchange Traded FundSCHEME OBJECTIVE : The investment objective of the Scheme is to generate returns that are in line with the performance of gold, subject to tracking errors. However, there can be no assurance that the investment objective of the Scheme will be achieved.
NAV : (as on November 30, 2017) : 2,739.5523DAT E OF ALLOTMENT : 19th March 2012ASSET ALLOCATION :Physical Gold : 95%-100%Debt & Money Market Instruments (including Cash & Cash equivalents): 0%-5%The Scheme will invest in physical gold of the prescribed quality and standard. MINIMUM INVESTMENT: Directly with the Fund – Subscription / Redemption in exchange of Portfolio Deposit and Cash Component in creation unit size of 1,000
@units and in multiples thereafter . On the Exchange – 1 unit and in multiples of 1 unit thereafter. @ For Large Investors, subscriptions shall only be allowed by payment of requisite Cash through RTGS/NEFT or Funds Transfer Letter/ Transfer Cheque of a bank where the Scheme has a collection account.
#Monthend AUM : ` 52.02 CroresMonthly AVG AUM : ` 53.18 Crores
`
PLANS / OPTIONS : NilExchange Listed : National Stock Exchange / BSEENTRY LOAD: Nil -
EXPENSE RATIO^:Regular Plan : 0.99% = Direct Plan : NABENCHMARK : Domestic Price of goldFUND MANAGER : 1) Mr. Avnish Jain
2) Mr. Kiran Shetty23 Years
EXIT LOAD: Nil - for redemption of the units through Stock Exchange.
TOTAL EXPERIENCE: 1) 2) 10 YearsMANAGING THIS FUND: 1) Since 25-Jun-14
2) Since 1-Apr-12
RISKOMETER
TRACKING ERROR
Annualised Tracking error for Gold ETF as of November 2017 is 0.08 (Period: November 2013 to November 2017).Source: Internal Calculation, Domestic Price of Gold- Nova Scotia Bank
MATURITY PROFILE% Allocation
Net Current Assets -0.09%
$ Monthend AUM as on 30.11.2017= ^The expense ratios mentioned for the schemes excludes GST on investment management fees.= Please refer page no. 39 for disclaimers.
Source ICRA MFI Explorer = # 25
Gold ETFs99.34%
CBLO/REPO/Reverse
Repo & Net Current Assets 0.66%
Gold 99.10%
CBLO/REPO/Reverse
Repo & Net Current Assets0.90%
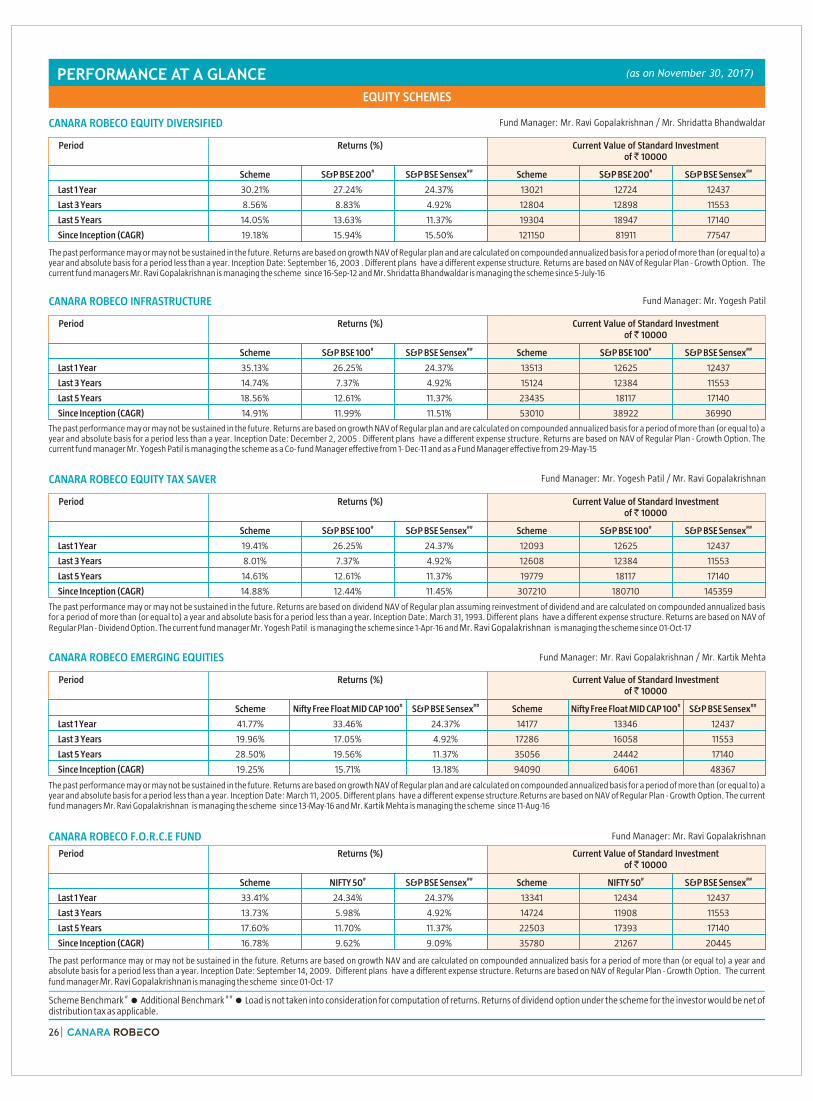
PERFORMANCE AT A GLANCE (as on November 30, 2017)
EQUITY SCHEMES
# # #Scheme Benchmark = Additional Benchmark Load is not taken into consideration for computation of returns. Returns of dividend option under the scheme for the investor would be net of distribution tax as applicable.
=
CANARA ROBECO EQUITY DIVERSIFIED Fund Manager: Mr. Ravi Gopalakrishnan / Mr. Shridatta Bhandwaldar
The past performance may or may not be sustained in the future. Returns are based on growth NAV of Regular plan and are calculated on compounded annualized basis for a period of more than (or equal to) a year and absolute basis for a period less than a year. Inception Date: September 16, 2003 . Different plans have a different expense structure. Returns are based on NAV of Regular Plan - Growth Option. The current fund managers Mr. Ravi Gopalakrishnan ince 16-Sep-12 and is managing the scheme s Mr. Shridatta Bhandwaldar is managing the scheme since 5-July-16
Period Returns (%) Current Value of Standard Investment of ` 10000
Scheme Sensex Scheme
30.21% 27.24% 24.37% 13021 12724 12437
8.56% 8.83% 4.92% 12804 12898 11553
14.05% 13.63% 11.37% 19304 18947 17140
# ## # ##S&P BSE 200 S&P S&P BSE 200 S&P SensexBSE BSE
Last 1 Year
Last 3 Years
Last 5 Years
Since Inception (CAGR) 19.18% 15.94% 15.50% 121150 81911 77547
CANARA ROBECO INFRASTRUCTURE Fund Manager: Mr. Yogesh Patil
The past performance may or may not be sustained in the future. Returns are based on growth NAV of Regular plan and are calculated on compounded annualized basis for a period of more than (or equal to) a year and absolute basis for a period less than a year. Inception Date: December 2, 2005 . Different plans have a different expense structure. Returns are based on NAV of Regular Plan - Growth Option. The current fund manager Mr. Yogesh Patil is managing the scheme as a Co- fund Manager effective from 1- Dec-11 and as a Fund Manager effective from 29-May-15
Period Returns (%) Current Value of Standard Investment of ` 10000
Scheme Sensex Scheme
35.13% 26.25% 24.37% 13513 12625 12437
14.74% 7.37% 4.92% 15124 12384 11553
18.56% 12.61% 11.37% 23435 18117 17140
# ## # ##S&P BSE 100 S&P S&P BSE 100 S&P SensexBSE BSE
Last 1 Year
Last 3 Years
Last 5 Years
Since Inception (CAGR) 14.91% 11.99% 11.51% 53010 38922 36990
Fund Manager: Mr. Yogesh Patil / Mr. Ravi GopalakrishnanCANARA ROBECO EQUITY TAX SAVER
The past performance may or may not be sustained in the future. Returns are based on dividend NAV of Regular plan assuming reinvestment of dividend and are calculated on compounded annualized basis for a period of more than (or equal to) a year and absolute basis for a period less than a year. Inception Date: March 31, 1993. Different plans have a different expense structure. Returns are based on NAV of Regular Plan - Dividend Option. The current fund manager Mr. Yogesh Patil is managing the scheme since 1-Apr-16 and Mr. Ravi Gopalakrishnan is managing the scheme since 01-Oct-17
Period Returns (%) Current Value of Standard Investment of ` 10000
Scheme Sensex Scheme
19.41% 26.25% 24.37% 12093 12625 12437
8.01% 7.37% 4.92% 12608 12384 11553
14.61% 12.61% 11.37% 19779 18117 17140
# ## # ##S&P BSE 100 S&P S&P BSE 100 S&P SensexBSE BSE
Last 1 Year
Last 3 Years
Last 5 Years
Since Inception (CAGR) 14.88% 12.44% 11.45% 307210 180710 145359
CANARA ROBECO EMERGING EQUITIES Fund Manager: Mr. Ravi Gopalakrishnan / Mr. Kartik Mehta
The past performance may or may not be sustained in the future. Returns are based on growth NAV of Regular plan and are calculated on compounded annualized basis for a period of more than (or equal to) a year and absolute basis for a period less than a year. Inception Date: March 11, 2005. Different plans have a different expense structure.Returns are based on NAV of Regular Plan - Growth Option. The current fund managers managing the scheme managing the schemeMr. Ravi Gopalakrishnan is since 13-May-16 and Mr. Kartik Mehta is since 11-Aug-16
Period Returns (%) Current Value of Standard Investment of ` 10000
#Scheme Nifty Free Float MID CAP 100 Sensex Scheme
41.77% 33.46% 24.37% 14177 13346 12437
19.96% 17.05% 4.92% 17286 16058 11553
28.50% 19.56% 11.37% 35056 24442 17140
## ##S&P S&P Sensex#BSE Nifty Free Float MID CAP 100 BSE
Last 1 Year
Last 3 Years
Last 5 Years
Since Inception (CAGR) 19.25% 15.71% 13.18% 94090 64061 48367
CANARA ROBECO F.O.R.C.E FUND Fund Manager: Mr. Ravi Gopalakrishnan
The past performance may or may not be sustained in the future. Returns are based on growth NAV and are calculated on compounded annualized basis for a period of more than (or equal to) a year and absolute basis for a period less than a year. Inception Date: September 14, 2009. Different plans have a different expense structure. Returns are based on NAV of Regular Plan - Growth Option. The current fund manager Mr. Ravi Gopalakrishnan is managing the scheme since 01-Oct- 17
Period Returns (%) Current Value of Standard Investment of ` 10000
Scheme Sensex Scheme
33.41% 24.34% 24.37% 13341 12434 12437
13.73% 5.98% 4.92% 14724 11908 11553
17.60% 11.70% 11.37% 22503 17393 17140
# ## ##NIFTY 50 S&P S&P Sensex#BSE NIFTY 50 BSE
Last 1 Year
Last 3 Years
Last 5 Years
Since Inception (CAGR) 16.78% 9.62% 9.09% 35780 21267 20445
26

INCOME / DEBT SCHEMES
PERFORMANCE AT A GLANCE (as on November 30, 2017)
EQUITY SCHEMES
# # #Scheme Benchmark = Additional Benchmark Load is not taken into consideration for computation of returns. Returns of dividend option under the scheme for the investor would be net of distribution tax as applicable.
=
CANARA ROBECO LARGE CAP+ FUND Fund Manager: Mr. Ravi Gopalakrishnan / Mr. Shridatta Bhandwaldar
The past performance may or may not be sustained in the future. Returns are based on growth NAV of Regular plan and are calculated on compounded annualized basis for a period of more than (or equal to) a year and absolute basis for a period less than a year. Inception Date: August 20, 2010. Different plans have a different expense structure. Returns are based on NAV of Regular Plan - Growth Option. The current fund managers is managing the scheme Mr. Shridatta Bhandwaldar is managing the scheme ince 5-July-16. Mr. Ravi Gopalakrishnan since 16-Sep-12 and s
Period Returns (%) Current Value of Standard Investment of ` 10000
Scheme Sensex Scheme
24.89% 26.25% 24.37% 12489 12625 12437
8.16% 7.37% 4.92% 12661 12384 11553
Last 5 Years 13.29% 12.61% 11.37% 18664 18117 17140
# ## # ##S&P BSE 100 S&P S&P BSE 100 S&P SensexBSE BSE
Last 1 Year
Last 3 Years
Since Inception (CAGR) 11.49% 9.00% 8.41% 22080 18737 18014
CANARA ROBECO BALANCE Fund Manager: Mr. Ravi Gopalakrishnan / Mr. Avnish Jain / Mr. Shridatta Bhandwaldar
The past performance may or may not be sustained in the future. Returns are based on growth NAV of Regular plan and are calculated on compounded annualized basis for a period of more than (or equal to) a year and absolute basis for a period less than a year. Inception Date: February 1, 1993. Different plans have a different expense structure. Returns are based on NAV of Regular Plan - Growth Option. The current fund managers managing the scheme s Mr. Shridatta Bhandwaldar managing the scheme since 5-July-16 and managing the scheme since
Mr. Ravi Gopalakrishnan is ince 13-May-16, is Mr. Avnish Jain is 7-Oct-13
Period Returns (%) Current Value of Standard Investment of ` 10000
Scheme Crisil Balance Fund - Sensex Scheme
19.92% 16.88% 24.37% 11992 11688 12437
10.56% 7.35% 4.92% 13525 12378 11553
15.55% 11.02% 11.37% 20608 16871 17140
## ##S&P S&P SensexBSE Crisil Balance Fund - BSE # #Aggressive Index Aggressive Index
Last 1 Year
Last 3 Years
Last 5 Years
Since Inception (CAGR) 11.38% - 10.73% 145490 - 125831
CANARA ROBECO MONTHLY INCOME PLAN Fund Manager: Mr. Ravi Gopalakrishnan / Mr. Avnish Jain
The past performance may or may not be sustained in the future. Returns are based on dividend NAV of Regular plan assuming reinvestment of dividend and are calculated on compounded annualized basis for a period of more than (or equal to) a year and absolute basis for a period less than a year. Inception Date: April 24, 1988. Different plans have a different expense structure. Returns are based on NAV of Regular Plan - Dividend Option. The current fund managers managing the scheme managing the scheme Mr. Ravi Gopalakrishnan is since 16-Sep-12 and Mr. Avnish Jain is since 7-Oct-13
Period Returns (%) Current Value of Standard Investment of ` 10000
#Scheme Crisil MIP Blended Index Scheme
6.73% 6.76% -0.14% 10673 10676 9986
6.86% 8.91% 8.47% 12208 12926 12770
9.29% 9.60% 7.53% 15599 15818 14381
#10 Years G-Sec # # ##Crisil MIP Blended Index 10 Years G-Sec
Last 1 Year
Last 3 Years
Last 5 Years
Since Inception (CAGR) 9.95% - - 166120 - -
CANARA ROBECO GILT PGS Fund Manager: Mr. Girish Hisaria
The past performance may or may not be sustained in the future. Returns are based on growth NAV of Regular plan and are calculated on compounded annualized basis for a period of more than (or equal to) a year and absolute basis for a period less than a year. Inception Date: December 29, 1999. Different plans have a different expense structure. Returns are based on NAV of Regular Plan - Growth Option. The current fund manager is managing the scheme Mr. Girish Hisaria since 24-Aug-14
Period Returns (%) Current Value of Standard Investment of ` 10000
#Scheme I-Sec Li-Bex Scheme
2.03% 0.45% -0.14% 10203 10045 9986
10.16% 9.82% 8.47% 13379 13255 12770
9.91% 9.78% 7.53% 16042 15950 14381
#10 Years G-Sec # # ##I-Sec Li-Bex 10 Years G-Sec
Last 1 Year
Last 3 Years
Last 5 Years
Since Inception (CAGR) 9.14% - - 47960 - -
CANARA ROBECO YIELD ADVANTAGE FUND Fund Manager: Mr. Ravi Gopalakrishnan / Ms. Suman Prasad
The past performance may or may not be sustained in the future. Returns are based on growth NAV of Regular plan and are calculated on compounded annualized basis for a period of more than (or equal to) a year and absolute basis for a period less than a year. Inception Date: April 25, 2011. Different plans have a different expense structure. Returns are based on NAV of Regular Plan - Growth Option. The current fund managers is managing the scheme s is managing the scheme sMr. Ravi Gopalakrishnan ince 16-Sep-12 and Ms. Suman Prasad ince 16-Sep-12
Period Returns (%) Current Value of Standard Investment of ` 10000
#Scheme CRISIL MIP Blended Index Scheme
6.64% 6.76% -0.14% 10664 10676 9986
7.16% 8.91% 8.47% 12312 12926 12770
Last 5 Years 7.28% 9.60% 7.53% 14210 15818 14381
#10 Years G-Sec # # ##CRISIL MIP Blended Index 10 Years G-Sec
Last 1 Year
Last 3 Years
Since Inception (CAGR) 7.11% 9.07% 7.31% 16197 17746 15938
27

CANARA ROBECO INCOME Fund Manager: Mr. Avnish Jain
The past performance may or may not be sustained in the future. Returns are based on growth NAV of Regular plan and are calculated on compounded annualized basis for a period of more than (or equal to) a year and absolute basis for a period less than a year. Inception Date: September 19, 2002. Different plans have a different expense structure. Returns are based on NAV of Regular Plan - Growth Option. The current fund manager is managing the scheme Mr. Avnish Jain since 25-June-14
Period Returns (%) Current Value of Standard Investment of ` 10000
Scheme CRISIL Composite Bond Scheme
2.03% 3.85% -0.14% 10203 10385 9986
8.04% 9.28% 8.47% 12620 13059 12770
8.44% 9.07% 7.53% 14996 15441 14381
#10 Years G-Sec # ##CRISIL Composite Bond 10 Years G-Sec# #Fund Index Fund Index
Last 1 Year
Last 3 Years
Last 5 Years
Since Inception (CAGR) 8.75% 7.00% 6.47% 35788 27994 25948
PERFORMANCE AT A GLANCE (as on November 30, 2017)
INCOME / DEBT SCHEMES
CANARA ROBECO INDIGO FUND Fund Manager: Mr. Avnish Jain / Mr. Kiran Shetty
The past performance may or may not be sustained in the future. Returns are based on growth NAV of Regular plan and are calculated on compounded annualized basis for a period of more than (or equal to) a year and absolute basis for a period less than a year.Inception Date: July 9, 2010. Different plans have a different expense structure. Returns are based on NAV of Regular Plan - Growth Option. The current fund managers is managing the scheme Mr. Kiran Shetty is managing the scheme since Mr. Avnish Jain since 7-Oct-13 and 7-Oct-13
Period Returns (%) Current Value of Standard Investment of ` 10000
Scheme Scheme
1.38% 5.06% -0.14% 10138 10506 9986
3.63% 7.30% 8.47% 11133 12361 12770
2.64% 5.43% 7.53% 11393 13026 14381
# ##Canara Robeco Blended Canara Robeco Blended 10 Years G-Sec# #Gold Index Gold Index
Last 1 Year
Last 3 Years
Last 5 Years
Since Inception (CAGR) 5.49% 7.83% 6.88% 14854 17472 16358
#10 Years G-Sec
CANARA ROBECO LIQUID Fund Manager: Mr. Girish Hisaria /Ms. Suman Prasad
The past performance may or may not be sustained in the future. Returns are based on growth NAV and are calculated on compounded annualized basis for a period of more than (or equal to) a year and absolute basis for a period less than a year. Inception Date: Retail Plan : January 15, 2002 .Institutional Plan : May 31, 2004 . Regular Plan : July 15, 2008. The face value was changed to ̀ 1000 w.e.f Aug 20, 2011. Different plans have a different expense structure. Returns are based on NAV of Regular Plan - Growth Option. The current fund managers is managing the scheme s
is managing the scheme sMr. Girish Hisaria ince 24-Aug-14
and Ms. Suman Prasad ince 18-Mar-11
Period Returns (%) Current Value of Standard Investment of ` 10000
#Scheme Index Scheme
6.51% 6.62% 5.67% 10651 10662 10567
7.47% 7.51% 7.23% 12420 12435 12336
8.13% 8.14% 7.21% 14787 14794 14168
# # ##Crisil Liquid Fund 364 Day T-Bill Crisil Liquid Fund Index 364 Day T-Bill
Last 1 Year
Last 3 Years
Last 5 Years
Since Inception (CAGR) 7.95% 7.59% 6.57% 20507 19862 18176
Last 7 Days 0.12% 0.12% 0.17% 10012 10012 10017
Last 14 Days 0.24% 0.24% 0.31% 10024 10024 10031
Last 30 Days 0.52% 0.52% 0.55% 10052 10052 10055
#
CANARA ROBECO TREASURY ADVANTAGE FUND Fund Manager: Mr. Girish Hisaria /Ms. Suman Prasad
The past performance may or may not be sustained in the future. Returns are based on growth NAV and are calculated on compounded annualized basis for a period of more than (or equal to) a year and absolute basis for a period less than a year. Inception Date: Retail Plan : September 16, 2003 . Institutional Plan : August 21, 2007 . Regular Plan : July 14, 2008. The face value was changed to ̀ 1000 w.e.f Aug 20, 2011. Different plans have a different expense structure. Returns are based on NAV of Regular Plan - Growth Option. The current fund managers is managing the scheme s
is managing the scheme sMr. Girish Hisaria ince 24-Aug-14
and Ms. Suman Prasad ince 12-Apr-11
Period Returns (%) Current Value of Standard Investment of ` 10000
Scheme Scheme
5.60% 6.62% 5.67% 10560 10662 10567
7.21% 7.51% 7.23% 12329 12435 12336
8.03% 8.14% 7.21% 14715 14794 14168
# ## # ##Crisil Liquid Fund Index 364 Day T-Bill Crisil Liquid Fund Index 364 Day T-Bill
Last 1 Year
Last 3 Years
Last 5 Years
Since Inception (CAGR) 7.97% 7.59% 6.58% 25501 19867 18180
# # #Scheme Benchmark = Additional Benchmark Load is not taken into consideration for computation of returns. Returns of dividend option under the scheme for the investor would be net of distribution tax as applicable.
=
CANARA ROBECO DYNAMIC BOND FUND Fund Manager: Mr. Girish Hisaria
The past performance may or may not be sustained in the future. Returns are based on growth NAVof Regular plan and are calculated on compounded annualized basis for a period of more than (or equal to) a year and absolute basis for a period less than a year. Inception Date: May 29, 2009. Different plans have a different expense structure. Returns are based on NAV of Regular Plan - Growth Option. The current fund manager is managing the scheme Mr. Girish Hisaria since 24-Aug-14
Period Returns (%) Current Value of Standard Investment of ` 10000
#Scheme Crisil Scheme
2.59% 3.85% -0.14% 10259 10385 9986
8.85% 9.28% 8.47% 12907 13059 12770
9.51% 9.07% 7.53% 15754 15441 14381
# # ##Composite Bond Fund Crisil Composite Bond Fund 10 Years G-Sec
Last 1 Year
Last 3 Years
Last 5 Years
Since Inception (CAGR) 8.16% 7.95% 6.05% 19500 19181 16493
#10 Years G-Sec
28

PERFORMANCE AT A GLANCE (as on November 30, 2017)
INCOME / DEBT SCHEMES
# # #Scheme Benchmark = Additional Benchmark Load is not taken into consideration for computation of returns. Returns of dividend option under the scheme for the investor would be net of distribution tax as applicable.
=
CANARA ROBECO SAVINGS PLUS FUND Fund Manager: Mr. Girish Hisaria /Ms. Suman Prasad
The past performance may or may not be sustained in the future. Returns are based on growth NAV of Regular plan and are calculated on compounded annualized basis for a period of more than (or equal to) a year and absolute basis for a period less than a year. Inception Date: March 4, 2005. Different plans have a different expense structure. Returns are based on NAV of Regular Plan - Growth Option. The current fund managers is managing the scheme is managing the scheme sMr. Girish Hisaria since 24-Aug-14 and Ms. Suman Prasad ince 12-Apr-11
Period Returns (%) Current Value of Standard Investment of ` 10000
#Scheme Index Scheme
6.72% 6.62% 5.67% 10672 10662 10567
7.94% 7.51% 7.23% 12585 12435 12336
8.40% 8.14% 7.21% 14974 14794 14168
## # ##Crisil Liquid Fund 364 Day T-Bill Crisil Liquid Fund Index 364 Day T-Bill
Last 1 Year
Last 3 Years
Last 5 Years
Since Inception (CAGR) 7.99% 7.25% 6.17% 26655 24406 21448
CANARA ROBECO SHORT TERM FUND Fund Manager: Ms. Suman Prasad
The past performance may or may not be sustained in the future. Returns are based on growth NAV and are calculated on compounded annualized basis for a period of more than (or equal to) a year and absolute basis for a period less than a year. Inception Date: March 31, 2009. Different plans have a different expense structure. Returns are based on NAV of Regular Plan - Growth Option. The current fund manager managing the scheme Ms. Suman Prasad is since 12-Apr-11
Period Returns (%) Current Value of Standard Investment of ` 10000
Scheme Scheme
5.45% 5.94% -0.14% 10545 10594 9986
7.28% 8.44% 8.47% 12353 12760 12770
7.90% 8.78% 7.53% 14625 15238 14381
# ##Crisil Short Term Crisil Short Term 10 Years G-Sec# #Bond Fund Index Bond Fund Index
Last 1 Year
Last 3 Years
Last 5 Years
Since Inception (CAGR) 7.75% 8.01% 6.35% 19104 19512 17056
#10 Years G-Sec
CANARA ROBECO MEDIUM TERM OPPORTUNITIES FUND Fund Manager: Mr. Avnish Jain
The past performance may or may not be sustained in the future. Returns are based on growth NAV of Regular plan and are calculated on compounded annualized basis for a period of more than (or equal to) a year and absolute basis for a period less than a year.Inception Date: 7th February, 2014. Different plans have a different expense structure. Returns are based on NAV of Regular Plan - Growth Option. The current fund manager is managing the scheme Mr. Avnish Jain since 7-Feb-14. The above scheme is in existence for less than 3 or 5 years
Period Returns (%) Current Value of Standard Investment of ` 10000
Scheme Scheme
4.96% 3.85% -0.14% 10496 10385 9986
7.77% 9.28% 8.47% 12525 13059 12770
# ##Crisil Composite Crisil Composite 10 Years G-Sec# #Bond Fund Index Bond Fund Index
Last 1 Year
Last 3 Years
Since Inception (CAGR) 8.75% 10.40% 9.35% 13770 14583 14061
#10 Years G-Sec
CANARA ROBECO GOLD EXCHANGE TRADED FUND Fund Manager: Mr. Avnish Jain / Mr. Kiran Shetty
The past performance may or may not be sustained in the future. Returns are based on growth NAV of Regular plan and are calculated on compounded annualized basis for a period of more than (or equal to) a year and absolute basis for a period less than a year.Inception Date: 19th March, 2012. Different plans have a different expense structure. Returns are based on NAV of Regular Plan - Growth Option. The current fund managers is managing the scheme s is managing the scheme sMr. Avnish Jain ince 25-June-14 and Mr. Kiran Shetty ince 1-Apr-12
Period Returns (%) Current Value of Standard Investment of ` 10000
Scheme Scheme
0.23% 3.17% 10023 10317
2.59% 4.74% 10801 11494
-2.77% -1.08% 8688 9469
# #Domestic Price of Gold Domestic Price of Gold
Last 1 Year
Last 3 Years
Last 5 Years
Since Inception (CAGR) -0.37% 1.32% 9792 10779
CANARA ROBECO GOLD SAVINGS FUND Fund Manager: Mr. Avnish Jain / Mr. Kiran Shetty
The past performance may or may not be sustained in the future. Returns are based on growth NAV of Regular plan and are calculated on compounded annualized basis for a period of more than (or equal to) a year and absolute basis for a period less than a year.Inception Date: 25th June, 2012. Different plans have a different expense structure. Returns are based on NAV of Regular Plan - Growth Option. The current fund managers is managing the scheme is managing the scheme sMr. Avnish Jain since 7-Oct-13 and Mr. Kiran Shetty ince 25-Jun-15. The above scheme is in existence for less than 3 or 5 years
Period Returns (%) Current Value of Standard Investment of ` 10000
Scheme Scheme
-0.41% 3.17% 9959 10317
1.97% 4.74% 10605 11494
Last 5 Years -3.17% -1.08% 8511 9469
# #Price of Physical Gold Price of Physical Gold
Last 1 Year
Last 3 Years
Since Inception (CAGR) -2.23% 0.10% 8847 10056
29

Scheme Performance - Fund Manager wise (as on November 30, 2017)
Fund Manager: Mr. Ravi Gopalakrishnan
Scheme Name’s CAGR (%)
1 Year Return 3 Years Return 5 Years Return Since Inception#Scheme Benchmark # # #Scheme Benchmark Scheme Benchmark Scheme Benchmark
CANARA ROBECO EQUITY DIVERSIFIED 30.21% 27.24% 8.56% 8.83% 14.05% 13.63% 19.18% 15.94%
CANARA ROBECO EMERGING EQUITIES 41.77% 33.46% 19.96% 17.05% 28.50% 19.56% 19.25% 15.71%
CANARA ROBECO LARGE CAP+ FUND 24.89% 26.25% 8.16% 7.37% 13.29% 12.61% 11.49% 9.00%
CANARA ROBECO BALANCE 19.92% 16.88% 10.56% 7.35% 15.55% 11.02% 11.38% -
CANARA ROBECO MONTHLY INCOME PLAN 6.73% 6.76% 6.86% 8.91% 9.29% 9.60% 9.95% -
CANARA ROBECO YIELD ADVANTAGE FUND 6.64% 6.76% 7.16% 8.91% 7.28% 9.60% 7.11% 9.07%
CANARA ROBECO EQUITY TAX SAVER 19.41% 26.25% 8.01% 7.37% 14.61% 12.61% 14.88% 12.44%
CANARA ROBECO F.O.R.C.E FUND 33.41% 24.34% 13.73% 5.98% 17.60% 11.70% 16.78% 9.62%
Note:a. Mr. Ravi Gopalakrishnan manages 8 open-ended schemes of Canara Robeco Mutual Fund .b. Period for which scheme’s performance has been provided is computed basis last day of the month-end preceding the date of advertisementc. Different plans shall have a different expense structure.
The performance details provided herein are of Regular Plan – Growth Option , except for Canara Robeco Monthly Income Plan and Canara Robeco Equity Tax SaverThe performance details provided for Canara Robeco Monthly Income Plan is of Regular Plan – Dividend Option.The performance details provided for Canara Robeco Equity Tax Saver is of Regular Plan – Dividend Option
d. Past performance may or may not be sustained in the future.
#For scheme benchmark please refer page no 26-29 Load is not taken into consideration for computation of returns. Returns of dividend option under the scheme for the investor would be net of distribution tax as applicable. In case the number of schemes managed by a fund manager is more than six, performance data of schemes including top 3 and bottom 3 schemes managed by fund manager is provided.
=
=
Fund Manager: Mr. Shridatta Bhandwaldar
Scheme Name’s CAGR (%)
1 Year Return 3 Years Return 5 Years Return Since Inception
Scheme Benchmark# # # #Scheme Benchmark Scheme Benchmark Scheme Benchmark
CANARA ROBECO EQUITY DIVERSIFIED 30.21% 27.24% 8.56% 8.83% 14.05% 13.63% 19.18% 15.94%
CANARA ROBECO LARGE CAP+ FUND 24.89% 26.25% 8.16% 7.37% 13.29% 12.61% 11.49% 9.00%
CANARA ROBECO BALANCE 19.92% 16.88% 10.56% 7.35% 15.55% 11.02% 11.38% -
Note:a. Mr. Shridatta Bhandwaldar manages 3 open-ended schemes of Canara Robeco Mutual Fund .b. Period for which scheme’s performance has been provided is computed basis last day of the month-end preceding the date of advertisementc. Different plans shall have a different expense structure. The performance details provided herein are of Regular plan - Growth Option.d. Past performance may or may not be sustained in the future.
Fund Manager: Mr. Yogesh Patil
Scheme Name’s CAGR (%)
1 Year Return 3 Years Return 5 Years Return Since Inception
Scheme Benchmark# # # #Scheme Benchmark Scheme Benchmark Scheme Benchmark
CANARA ROBECO INFRASTRUCTURE 35.13% 26.25% 14.74% 7.37% 18.56% 12.61% 14.91% 11.99%
CANARA ROBECO EQUITY TAX SAVER 19.41% 26.25% 8.01% 7.37% 14.61% 12.61% 14.88% 12.44%
Note:a. Mr. Yogesh Patil manages 2 open-ended schemes of Canara Robeco Mutual Fund .b. Period for which scheme’s performance has been provided is computed basis last day of the month-end preceding the date of advertisementc. Different plans shall have a different expense structure.
The performance details provided herein are of Canara Robeco Infrastructure Regular Plan – Growth Option The performance details provided for Canara Robeco Equity Tax Saver is of Regular Plan – Dividend Option
d. Past performance may or may not be sustained in the future.
Fund Manager: Mr. Kartik Mehta
Scheme Name’s CAGR (%)
1 Year Return 3 Years Return 5 Years Return Since Inception
Scheme Benchmark# # # #Scheme Benchmark Scheme Benchmark Scheme Benchmark
CANARA ROBECO EMERGING EQUITIES 41.77% 33.46% 19.96% 17.05% 28.50% 19.56% 19.25% 15.71%
Note:a. Mr. Kartik Mehta manages 1 open-ended schemes of Canara Robeco Mutual Fund .b. Period for which scheme’s performance has been provided is computed basis last day of the month-end preceding the date of advertisementc. Different plans shall have a different expense structure. The performance details provided herein are of Regular plan - Growth Option.d. Past performance may or may not be sustained in the future.
30

Scheme Performance - Fund Manager wise (as on November 30, 2017)
Fund Manager: Mr. Avnish Jain
Scheme Name’s CAGR (%)
1 Year Return 3 Years Return 5 Years Return Since Inception#Scheme Benchmark # # #Scheme Benchmark Scheme Benchmark Scheme Benchmark
CANARA ROBECO BALANCE* 19.92% 16.88% 10.56% 7.35% 15.55% 11.02% 11.38% -
CANARA ROBECO MONTHLY INCOME PLAN* 6.73% 6.76% 6.86% 8.91% 9.29% 9.60% 9.95% -
CANARA ROBECO INCOME 2.03% 3.85% 8.04% 9.28% 8.44% 9.07% 8.75% 7.00%
CANARA ROBECO INDIGO FUND 1.38% 5.06% 3.63% 7.30% 2.64% 5.43% 5.49% 7.83%
CANARA ROBECO GOLD EXCHANGE TRADED FUND 0.23% 3.17% 2.59% 4.74% -2.77% -1.08% -0.37% 1.32%
CANARA ROBECO GOLD SAVINGS FUND -0.41% 3.17% 1.97% 4.74% -3.17% -1.08% -2.23% 0.10%
CANARA ROBECO MEDIUM TERM OPPORTUNITIES FUND 4.96% 3.85% 7.77% 9.28% - - 8.75% 10.40%
Note:a. Mr. Avnish Jain manages 7 open-ended schemes of Canara Robeco Mutual Fund .b. Period for which scheme’s performance has been provided is computed basis last day of the month-end preceding the date of advertisementc. Different plans shall have a different expense structure. The performance details provided herein are of Regular plan - Growth Option. For Canara Robeco Monthly Income Plan, returns are based on
NAV of Regular Plan - Dividend Option.d. *Managing the portfolio only for debt allocatione. Past performance may or may not be sustained in the future.
Fund Manager: Mr. Girish Hisaria
Scheme Name’s CAGR (%)
1 Year Return 3 Years Return 5 Years Return Since Inception#Scheme Benchmark # # #Scheme Benchmark Scheme Benchmark Scheme Benchmark
CANARA ROBECO GILT PGS 2.03% 0.45% 10.16% 9.82% 9.91% 9.78% 9.14% -
CANARA ROBECO LIQUID 6.51% 6.62% 7.47% 7.51% 8.13% 8.14% 7.95% 7.59%
CANARA ROBECO TREASURY ADVANTAGE FUND 5.60% 6.62% 7.21% 7.51% 8.03% 8.14% 7.97% 7.59%
CANARA ROBECO DYNAMIC BOND FUND 2.59% 3.85% 8.85% 9.28% 9.51% 9.07% 8.16% 7.95%
CANARA ROBECO SAVINGS PLUS FUND 6.72% 6.62% 7.94% 7.51% 8.40% 8.14% 7.99% 7.25%
Note:a. Mr. Girish Hisaria manages 5 open-ended schemes of Canara Robeco Mutual Fund .b. Period for which scheme’s performance has been provided is computed basis last day of the month-end preceding the date of advertisementc. Different plans shall have a different expense structure.The performance details provided herein are of Regular plan - Growth Option.d. Past performance may or may not be sustained in the future.
Fund Manager: Ms. Suman Prasad
Scheme Name’s CAGR (%)
1 Year Return 3 Years Return 5 Years Return Since Inception#Scheme Benchmark # # #Scheme Benchmark Scheme Benchmark Scheme Benchmark
CANARA ROBECO YIELD ADVANTAGE FUND 6.64% 6.76% 7.16% 8.91% 7.28% 9.60% 7.11% 9.07%
CANARA ROBECO LIQUID 6.51% 6.62% 7.47% 7.51% 8.13% 8.14% 7.95% 7.59%
CANARA ROBECO TREASURY ADVANTAGE FUND 5.60% 6.62% 7.21% 7.51% 8.03% 8.14% 7.97% 7.59%
CANARA ROBECO SAVINGS PLUS FUND 6.72% 6.62% 7.94% 7.51% 8.40% 8.14% 7.99% 7.25%
CANARA ROBECO SHORT TERM FUND 5.45% 5.94% 7.28% 8.44% 7.90% 8.78% 7.75% 8.01%
Note:a. Ms. Suman Prasad manages 5 open-ended schemes of Canara Robeco Mutual Fund .b. Period for which scheme’s performance has been provided is computed basis last day of the month-end preceding the date of advertisementc. Different plans shall have a different expense structure. The performance details provided herein are of Regular plan - Growth Option.d. Past performance may or may not be sustained in the future.
#For scheme benchmark please refer page no 26-29 Load is not taken into consideration for computation of returns. Returns of dividend option under the scheme for the investor would be net of distribution tax as applicable.
=
=In case the number of schemes managed by a fund manager is more than six, performance data of schemes including top 3 and bottom 3 schemes managed by fund manager is provided.
Fund Manager: Mr. Kiran Shetty
Scheme Name’s CAGR (%)
1 Year Return 3 Years Return 5 Years Return Since Inception
Scheme Benchmark# # # #Scheme Benchmark Scheme Benchmark Scheme Benchmark
CANARA ROBECO INDIGO FUND 1.38% 5.06% 3.63% 7.30% 2.64% 5.43% 5.49% 7.83%
CANARA ROBECO GOLD EXCHANGE TRADED FUND 0.23% 3.17% 2.59% 4.74% -2.77% -1.08% -0.37% 1.32%
CANARA ROBECO GOLD SAVINGS FUND -0.41% 3.17% 1.97% 4.74% -3.17% -1.08% -2.23% 0.10%
Note:a. Mr. Kiran Shetty manages 3 open-ended schemes of Canara Robeco Mutual Fund .b. Period for which scheme’s performance has been provided is computed basis last day of the month-end preceding the date of advertisementc. Different plans shall have a different expense structure. The performance details provided herein are of Regular plan - Growth Option d. Past performance may or may not be sustained in the future.
31

SIP RETURNS (as on November 30, 2017)
EQUITY SCHEMES
1. Investment date is taken to be 1st of the month or subsequent day if 1st is a holiday and investment of ̀ 10000 is taken. Returns are as on and are CAGR. 2. The calculations are based on the regular growth plan NAVs. 3. NA : Not Applicable as Benchmark index data not available for the period 4. Past performance may or may not be sustained in the future. Scheme
# ## Benchmark , Additional benchmark
30-November-2017
CANARA ROBECO EQUITY DIVERSIFIED Fund Manager: Mr. Ravi Gopalakrishnan / Mr. Shridatta Bhandwaldar
Since Inception 10 yr 7 yr 5 yr 3 yr 1 yr
Total Amt invested (INR) 1710000 1200000 840000 600000 360000 120000
Market Value (INR) 5821650 2587741 1412839 879530 447076 135983
Scheme Returns 15.77% 14.69% 14.59% 15.29% 14.59% 25.68%
#S&P BSE 200 12.84% 12.33% 13.67% 14.84% 14.62% 23.03%
Sensex 11.82% 10.48% 11.11% 11.46% 11.36% 20.01%
Inception Date 16-Sep-03
##S&P BSE
CANARA ROBECO EQUITY TAX SAVER Fund Manager: Mr. Yogesh Patil / Mr. Ravi Gopalakrishnan
Since Inception 7 yr 5 yr 3 yr 1 yr
Total Amt invested (INR) 1060000 840000 600000 360000 120000
Market Value (INR) 2110145 1421744 878255 437501 133753
Scheme Returns 15.05% 14.76% 15.23% 13.08% 21.99%
100 12.08% 12.66% 13.50% 13.53% 21.58%
Sensex 11.73% 11.11% 11.46% 11.36% 20.01%
#S&P BSE
##S&P BSE
Inception Date (Canara Robeco Equity Taxsaver – Reg Growth Plan) 02-Feb-09
CANARA ROBECO EMERGING EQUITIES Fund Manager: Mr. Ravi Gopalakrishnan / Mr. Kartik Mehta
Since Inception 10 yr 7 yr 5 yr 3 yr 1 yr
Total Amt invested (INR) 1530000 1200000 840000 600000 360000 120000
Market Value (INR) 6898525 4635707 2300763 1294722 514795 142270
Scheme Returns 21.65% 25.49% 28.33% 31.35% 24.67% 36.24%
Nifty Free Float Midcap 100 15.60% 17.04% 19.75% 23.16% 21.89% 31.19%
Sensex 10.58% 10.48% 11.11% 11.46% 11.36% 20.01%
Inception Date
#
##S&P BSE
11-Mar-05
CANARA ROBECO BALANCE Fund Manager: Mr. Ravi Gopalakrishnan / Mr. Avnish Jain / Mr. Shridatta Bhandwaldar
Since Inception 20 YR 15 YR 10 yr 7 yr 5 yr 3 yr 1 yr
Total Amt invested 2980000 2400000 1800000 1200000 840000 600000 360000 120000
Market Value 23802986 15894664 7143307 2658766 1467541 900850 438956 130950
Scheme Returns 14.25% 16.45% 16.69% 15.20% 15.65% 16.26% 13.31% 17.40%
Crisil Balanced Fund- Aggressive Index NA NA 11.26% 10.38% 11.00% 11.36% 10.85% 13.97%
Sensex 12.33% 13.15% 12.86% 10.48% 11.11% 11.46% 11.36% 20.01%
Inception Date 01-Feb-93
#
##S&P BSE
CANARA ROBECO F.O.R.C.E FUND Fund Manager: Mr. Ravi Gopalakrishnan
Since Inception 7 yr 5 yr 3 yr 1 yr
Total Amt invested 990000 840000 600000 360000 120000
Market Value 2105974 1642522 991303 471668 136574
Scheme Returns 17.74% 18.81% 20.18% 18.36% 26.66%
NIFTY 50 10.86% 11.67% 12.18% 11.89% 3.44%
Sensex 10.37% 11.11% 11.46% 11.36% 20.01%
#
##S&P BSE
Inception Date 14-Sep-09
32

CANARA ROBECO LARGE CAP+ FUND Fund Manager: Mr. Ravi Gopalakrishnan / Mr. Shridatta Bhandwaldar
Since Inception 7 yr 5 yr 3 yr 1 yr
Total Amt invested 880000 840000 600000 360000 120000
Market Value 1447484 1361789 849461 435433 131932
Scheme Returns 13.30% 13.56% 13.88% 12.75% 19.00%
100 12.23% 12.66% 13.50% 13.53% 21.58%
Sensex 10.78% 11.11% 11.46% 11.36% 20.01%
#S&P BSE
##S&P BSE
Inception Date 20-Aug-10
SIP RETURNS (as on November 30, 2017)
EQUITY SCHEMES
CANARA ROBECO INFRASTRUCTURE Fund Manager: Mr. Yogesh Patil
DEBT SCHEMES
CANARA ROBECO GILT PGS Fund Manager: Mr. Girish Hisaria
Since Inception 15 YR 10 yr 7 yr 5 yr 3 yr 1 yr
Total Amt invested 2160000 1800000 1200000 840000 600000 360000 120000
Market Value 5193467 3754041 2095748 1247831 771603 413304 121778
Scheme Returns 9.00% 9.19% 10.74% 11.11% 10.00% 9.18% 2.77%
Isec Li Bex NA 8.77% 9.41% 9.87% 9.81% 8.44% 2.67%
10yr G Sec Index NA 6.58% 15.30% 7.64% 7.77% 6.77% -0.25%
Inception Date
#
##
29-Dec-99
CANARA ROBECO INCOME Fund Manager: Mr. Avnish Jain
Since Inception 10 yr 7 yr 5 yr 3 yr 1 yr
Total Amt invested 1830000 1200000 840000 600000 360000 120000
Market Value 3780217 1875577 1133689 738146 401967 121974
Scheme Returns 8.93% 8.65% 8.43% 8.22% 7.30% 3.07%
Crisil Composite Bond Fund Index 7.67% 8.58% 9.15% 9.31% 8.54% 4.86%
10yr G Sec Index 6.57% 15.30% 7.64% 7.77% 6.77% -0.25%
Inception Date
#
##
19-Sep-02
CANARA ROBECO MONTHLY INCOME PLAN Fund Manager: Mr. Ravi Gopalakrishnan / Mr. Avnish Jain
Since Inception 10 yr 7 yr 5 yr 3 yr 1 yr
Total Amt invested 1810000 1200000 840000 600000 360000 120000
Market Value 4108080 1942976 1163210 750826 401659 124043
Scheme Returns 10.14% 9.31% 9.15% 8.90% 7.24% 6.33%
Crisil MIP Blended Index 8.66% 9.10% 9.65% 9.87% 9.13% 6.91%
10yr G Sec Index 16.71% 15.30% 7.64% 7.77% 6.77% -0.25%
Inception Date 24-April-88
#
##
Since Inception 10 yr 7 yr 5 yr 3 yr 1 yr
Total Amt invested (INR) 1440000 1200000 840000 600000 360000 120000
Market Value (INR) 3700528 2750037 1631717 1040409 481655 141300
Scheme Returns 14.77% 15.83% 18.63% 22.18% 19.85% 34.59%
100 10.98% 11.69% 12.66% 13.50% 13.53% 21.58%
Sensex 10.03% 10.48% 11.11% 11.46% 11.36% 20.01%
#S&P BSE
##S&P BSE
Inception Date 02-Dec-05
1. Investment date is taken to be 1st of the month or subsequent day if 1st is a holiday and investment of ̀ 10000 is taken. Returns are as on and are CAGR. 2. The calculations are based on the regular growth plan NAVs. 3. NA : Not Applicable as Benchmark index data not available for the period 4. Past performance may or may not be sustained in the future. Scheme
# ## Benchmark , Additional benchmark
30-November-2017
33

SIP RETURNS (as on November 30, 2017)
DEBT SCHEMES
CANARA ROBECO TREASURY ADVANTAGE FUND Fund Manager: Mr. Girish Hisaria /Ms. Suman Prasad
Since Inception 7 yr 5 yr 3 yr 1 yr
Total Amt invested 1130000 840000 600000 360000 120000
Market Value 1662072 1112322 722820 397570 123599
Scheme Returns 7.97% 7.89% 7.38% 6.56% 5.63%
Crisil Liquid Fund Index 7.83% 7.96% 7.70% 7.12% 6.65%
1 yr T- bill index 6.89% 7.21% 7.13% 6.70% 5.90%
Inception Date 14-July-08
#
##
CANARA ROBECO SAVINGS PLUS FUND Fund Manager: Mr. Girish Hisaria /Ms. Suman Prasad
Since Inception 10 yr 7 yr 5 yr 3 yr 1 yr
Total Amt invested 1530000 1200000 840000 600000 360000 120000
Market Value 2653316 1844541 1132199 735328 403982 124307
Scheme Returns 8.24% 8.33% 8.39% 8.07% 7.63% 6.74%
Crisil Liquid Fund Index 7.52% 7.79% 7.96% 7.70% 7.12% 6.65%
1 yr T- bill index 6.60% 6.83% 7.21% 7.13% 6.70% 5.90%
Inception Date
#
##
04-Mar-05
CANARA ROBECO SHORT TERM FUND Fund Manager: Ms. Suman Prasad
Since Inception 7 yr 5 yr 3 yr 1 yr
Total Amt invested 1050000 840000 600000 360000 120000
Market Value 1493531 1110842 724757 399309 123651
Scheme Returns 7.86% 7.85% 7.49% 6.85% 5.71%
Crisil Short-Term Bond Fund Index 8.48% 8.69% 8.55% 7.96% 6.17%
10 YR G-sec Index 7.22% 7.64% 7.77% 6.77% -0.25%
#
##
Inception Date 31-Mar-09
CANARA ROBECO DYNAMIC BOND FUND Fund Manager: Mr. Girish Hisaria
Since Inception 7 yr 5 yr 3 yr 1 yr
Total Amt invested 1030000 840000 600000 360000 120000
Market Value 1528012 1166426 753013 406914 121949
Scheme Returns 8.96% 9.22% 9.02% 8.12% 3.03%
Crisil Composite Bond Fund Index 8.82% 9.15% 9.31% 8.54% 4.86%
10yr G Sec Index 7.26% 7.64% 7.77% 6.77% -0.25%
Inception Date
#
##
29-May-09
1. Investment date is taken to be 1st of the month or subsequent day if 1st is a holiday and investment of ̀ 10000 is taken. Returns are as on and are CAGR. 2. The calculations are based on the regular growth plan NAVs. 3. NA : Not Applicable as Benchmark index data not available for the period 4. Past performance may or may not be sustained in the future. Scheme
# ## Benchmark , Additional benchmark
30-November-2017
34
CANARA ROBECO INDIGO FUND Fund Manager: Mr. Avnish Jain / Mr. Kiran Shetty
Since Inception 7 yr 5 yr 3 yr 1 yr
Total Amt invested 890000 840000 600000 360000 120000
Market Value 1030780 957176 649808 376463 121286
Scheme Returns 3.90% 3.68% 3.15% 2.93% 2.00%
Crisil Blended Gold Index 6.69% 6.52% 6.48% 6.62% 5.65%
10yr G Sec Index 7.56% 7.64% 7.77% 6.77% -0.25%
#
##
Inception Date 09-Jul-10

SIP RETURNS (as on November 30, 2017)
DEBT SCHEMES
CANARA ROBECO MEDIUM TERM OPPORTUNITIES FUND Fund Manager: Mr. Avnish Jain
CANARA ROBECO GOLD SAVINGS FUND Fund Manager: Mr. Avnish Jain / Mr. Kiran Shetty
Since Inception 3 yr 1 yr
Total Amt invested 460000 360000 120000
Market Value 534707 402366 123477
Scheme Returns 7.80% 7.36% 5.43%
Crisil Composite Bond Fund Index 9.22% 8.54% 4.86%
10yr G Sec Index 7.86% 6.77% -0.25%
#
##
Inception Date 07-Feb-15
CANARA ROBECO YIELD ADVANTAGE FUND Fund Manager: Mr. Ravi Gopalakrishnan / Ms. Suman Prasad
Since Inception 5 yr 3 yr 1 yr
Total Amt invested 800000 600000 360000 120000
Market Value 1032483 726587 404790 124170
Scheme Returns 7.54% 7.59% 7.77% 6.53%
Crisil MIP Blended Index 9.73% 9.87% 9.13% 6.91%
10yr G Sec Index 7.71% 7.77% 6.77% -0.25%
#
##
Inception Date 25-Apr-11
Since Inception 5 yr 3 yr 1 yr
Total Amt invested 660000 600000 360000 120000
Market Value 648094 595230 367183 120690
Scheme Returns -0.65% -0.31% 1.29% 1.07%
Domestic Price of Gold (Per KG) 1.86% 2.32% 3.80% 4.52%#
Inception Date 25-Jun-12
1. Investment date is taken to be 1st of the month or subsequent day if 1st is a holiday and investment of ̀ 10000 is taken. Returns are as on and are CAGR. 2. The calculations are based on the regular growth plan NAVs. 3. NA : Not Applicable as Benchmark index data not available for the period 4. Past performance may or may not be sustained in the future. Scheme
# ## Benchmark , Additional benchmark
30-November-2017
35

Canara Robeco Infrastructure
22.08.2014 1.30 24.08
28.08.2015 1.65 25.91
28.08.2016 2.04 26.79
24.08.2017 1.75 29.22
Direct Plan
30.08.2013 0.85 14.08
22.08.2014 1.30 24.73
Regular Plan
Date ofdeclaration (Record Date)
Dividend Distribution
per unit*
NAV as on the date
of declaration
DIVIDEND HISTORY
* On face value of ̀ 10. = For Daily, Weekly & Monthly dividend history of Canara Robeco Liquid Fund, Canara Robeco Treasury Advantage Fund, Canara Robeco Short Term Fund & Canara Robeco Saving Plus Fund Visit : www.canararobeco.com. = The dividend amount is before tax calculation.
Past performance may or may not be sustained in the future. Pursuant to payment of dividend, the NAV of the dividend option of the scheme would fall to the extent of payout and statutory levy (if applicable).
Date ofdeclaration (Record Date)
Dividend Distribution
per unit*
NAV as on the date
of declaration
Canara Robeco F.O.R.C.E Fund
26.07.2013 0.85 14.5100
25.07.2014 1.00 17.7100
31.07.2015 1.30 22.4700
29.07.2016 1.20 21.8600
28.07.2017 1.50 25.7300
Regular Plan
Canara Robeco Monthly Income Plan(Monthly Dividend Option)
Date ofdeclaration (Record Date)
Dividend Distribution
per unit*
NAV as on the date
of declaration
24.06.2016 0.10 14.2047
29.07.2016 0.10 14.6551
26.08.2016 0.10 14.6509
30.09.2016 0.10 14.7343
28.10.2016 0.10 14.7282
25.11.2016 0.10 14.6786
30.12.2016 0.10 14.3254
27.01.2017 0.10 14.5885
23.02.2017 0.10 14.4103
31.03.2017 0.10 14.5997
28.04.2017 0.10 14.6586
26.05.2017 0.10 14.6587
30.06.2017 0.10 14.6359
28.07.2017 0.10 14.7517
24.08.2017 0.10 14.6197
29.09.2017 0.10 14.5526
27.10.2017 0.10 14.5832
24.11.2017 0.10 14.4674
Direct Plan
24.06.2016 0.10 14.7404
29.07.2016 0.10 15.2249
26.08.2016 0.10 15.2364
30.09.2016 0.10 15.3415
28.10.2016 0.10 15.3505
25.11.2016 0.10 15.3147
30.12.2016 0.10 14.9643
27.01.2017 0.10 15.2557
23.02.2017 0.10 15.0855
31.03.2017 0.10 15.3041
28.04.2017 0.10 15.3821
26.05.2017 0.10 15.3997
30.06.2017 0.10 15.3959
28.07.2017 0.10 15.5344
24.08.2017 0.10 15.4130
29.09.2017 0.10 15.3637
27.10.2017 0.10 15.4129
24.11.2017 0.10 15.3087
Quarterly Dividend Option
Regular Plan
17.06.2016 0.30 14.6526
23.09.2016 0.30 15.2206
23.12.2016 0.30 14.7121
24.03.2017 0.30 14.9637
23.06.2017 0.30 15.1503
22.09.2017 0.30 15.0582
Direct Plan
17.06.2016 0.30 15.2133
23.09.2016 0.30 15.8572
23.12.2016 0.30 15.3686
24.03.2017 0.30 15.6850
23.06.2017 0.30 15.9364
22.09.2017 0.30 15.8960
Regular Plan
Date ofdeclaration (Record Date)
Dividend Distribution
per unit*
NAV as on the date
of declaration
Canara Robeco Equity Tax Saver
Regular Plan
26.02.2016 0.89 20.15
04.11.2016 1.00 24.04
28.02.2017 0.90 23.56
10.11.2017 1.00 26.59
Direct Plan
10.11.2017 1.50 39.48
Date ofdeclaration (Record Date)
Dividend Distribution
per unit*
NAV as on the date
of declaration
Canara Robeco Emerging Equities
28.11.2014 2.70 35.38
27.11.2015 2.20 37.54
25.11.2016 2.50 36.68
24.11.2017 2.50 49.33
Direct Plan
25.11.2016 0.75 46.04
24.11.2017 3.00 66.22
Regular Plan
Date ofdeclaration (Record Date)
Dividend Distribution
per unit*
NAV as on the date
of declaration
Canara Robeco Balance
Regular Plan
26.05.2017 0.63 82.02
30.06.2017 0.62 81.75
28.07.2017 0.63 83.73
24.08.2017 0.63 82.67
29.09.2017 0.62 82.13
27.10.2017 0.63 83.60
24.11.2017 0.64 83.81
Monthly Dividend Option -
26.05.2017 0.60 84.33
30.06.2017 0.60 84.20
28.07.2017 0.60 86.37
24.08.2017 0.60 85.41
29.09.2017 0.60 85.00
27.10.2017 0.60 86.66
24.11.2017 0.60 87.02
Monthly Dividend Option -
Direct Plan
Date ofdeclaration (Record Date)
Dividend Distribution
per unit*
NAV as on the date
of declaration
Canara Robeco Income
Regular Plan
23.12.2015 0.20 14.0407
23.03.2016 0.20 14.0555
17.06.2016 0.20 14.1154
23.09.2016 0.20 14.7175
23.12.2016 0.20 14.9144
24.03.2017 0.20 14.7903
23.06.2017 0.20 15.0888
22.09.2017 0.20 14.9541
Quarterly Dividend Option - Direct Plan
23.12.2015 0.20 14.2951
23.03.2016 0.20 14.3356
17.06.2016 0.20 14.4250
23.09.2016 0.20 15.0744
23.12.2016 0.20 15.3087
24.03.2017 0.20 15.2147
23.06.2017 0.20 15.5573
22.09.2017 0.20 15.4593
Quarterly Dividend Option -
Date ofdeclaration (Record Date)
Dividend Distribution
per unit*
NAV as on the date
of declaration
Canara Robeco Equity Diversified
30.10.2015 2.50 34.57
28.10.2016 2.70 34.26
27.10.2017 3.00 37.91
Direct Plan
28.10.2016 0.75 44.07
27.10.2017 4.00 52.37
Regular Plan
Date ofdeclaration (Record Date)
Dividend Distribution
per unit*
NAV as on the date
of declaration
Canara Robeco Large Cap+ Fund
27.11.2015 1.25 15.81
25.11.2016 1.32 14.90
24.11.2017 1.35 17.42
Regular Plan
36

Date ofdeclaration (Record Date)
Dividend Distribution
per unit*
NAV as on the date
of declaration
Canara Robeco Yield Advantage Fund
26.08.2016 0.06 14.0942
30.09.2016 0.06 14.1351
28.10.2016 0.06 14.1804
25.11.2016 0.06 14.3859
30.12.2016 0.06 14.2386
27.01.2017 0.06 14.3250
23.02.2017 0.06 14.3210
31.03.2017 0.06 14.3767
28.04.2017 0.06 14.3995
26.05.2017 0.06 14.4416
30.06.2017 0.06 14.5231
28.07.2017 0.06 14.5887
24.08.2017 0.06 14.6043
29.09.2017 0.06 14.5948
27.10.2017 0.06 14.5993
24.11.2017 0.06 14.5552
Direct Plan
26.08.2016 0.06 14.7508
30.09.2016 0.06 14.8106
28.10.2016 0.06 14.8731
25.11.2016 0.06 15.1038
30.12.2016 0.06 14.9661
27.01.2017 0.06 15.0707
23.02.2017 0.06 15.0796
31.03.2017 0.06 15.1530
28.04.2017 0.06 15.1885
26.05.2017 0.06 15.2455
30.06.2017 0.06 15.3470
28.07.2017 0.06 15.4288
24.08.2017 0.06 15.4579
29.09.2017 0.06 15.4628
27.10.2017 0.06 15.4798
24.11.2017 0.06 15.4452
Quarterly Dividend Option - Regular Plan
17.06.2016 0.18 14.1688
23.09.2016 0.18 14.4387
23.12.2016 0.18 14.5541
24.03.2017 0.18 14.6695
23.06.2017 0.18 14.8554
22.09.2017 0.18 14.9078
Quarterly Dividend Option - Direct Plan
17.06.2016 0.18 14.5416
23.09.2016 0.18 14.8616
23.12.2016 0.18 15.0243
24.03.2017 0.18 15.1828
23.06.2017 0.18 15.4112
22.09.2017 0.18 15.5031
Monthly Dividend Option
Regular Plan
DIVIDEND HISTORY
Date ofdeclaration (Record Date)
Dividend Distribution
per unit*
NAV as on the date
of declaration
Canara Robeco Gilt PGS Fund
20.12.2013 0.37 12.3226
20.06.2014 0.35 12.8805
31.12.2014 0.40 13.6628
26.06.2015 0.40 13.5912
23.12.2015 0.40 13.7057
24.06.2016 0.40 13.9683
23.12.2016 0.45 15.1684
23.06.2017 0.45 15.4644
Direct Plan
20.12.2013 0.37 12.3426
20.06.2014 0.35 12.9282
31.12.2014 0.40 13.7442
26.06.2015 0.40 13.7047
23.12.2015 0.40 13.8634
24.06.2016 0.40 14.1721
23.12.2016 0.45 15.4471
23.06.2017 0.45 15.7997
Regular Plan
Date ofdeclaration (Record Date)
Dividend Distribution
per unit*
NAV as on the date
of declaration
Canara Robeco Dynamic Bond Fund
20.12.2013 0.37 12.2913
20.06.2014 0.35 12.6800
31.12.2014 0.39 13.3433
26.06.2015 0.40 13.2629
23.12.2015 0.40 13.3071
24.06.2016 0.40 13.4407
23.12.2016 0.40 14.3270
23.06.2017 0.45 14.5633
Direct Plan
20.12.2013 0.37 12.3200
20.06.2014 0.35 12.7361
31.12.2014 0.39 13.4389
26.06.2015 0.40 13.4008
23.12.2015 0.40 13.4853
24.06.2016 0.40 13.6734
23.12.2016 0.40 14.6341
23.06.2017 0.45 14.9225
Regular Plan
Date ofdeclaration (Record Date)
Dividend Distribution
per unit*
NAV as on the date
of declaration
Canara Robeco InDiGo
Regular Plan
27.03.2015 0.10 10.6885
26.06.2015 0.10 10.6283
29.09.2015 0.10 10.6462
23.12.2015 0.10 10.5251
23.03.2016 0.10 10.7848
17.06.2016 0.10 10.9058
23.09.2016 0.10 11.0618
23.12.2016 0.15 10.6321
24.03.2017 0.15 10.6384
23.06.2017 0.15 10.5811
22.09.2017 0.15 10.5214
Quarterly Dividend Option - Direct Plan
27.03.2015 0.10 11.1533
26.06.2015 0.10 11.1158
29.09.2015 0.10 11.1592
23.12.2015 0.10 11.0548
23.03.2016 0.10 11.3515
17.06.2016 0.10 11.5031
23.09.2016 0.10 11.6961
23.12.2016 0.15 11.2643
24.03.2017 0.15 11.2986
23.06.2017 0.15 11.2667
22.09.2017 0.15 11.2338
Quarterly Dividend Option -
* On face value of ̀ 10. = For Daily, Weekly & Monthly dividend history of Canara Robeco Liquid Fund, Canara Robeco Treasury Advantage Fund, Canara Robeco Short Term Fund & Canara Robeco Saving Plus Fund Visit : www.canararobeco.com. = The dividend amount is before tax calculation.
Past performance may or may not be sustained in the future. Pursuant to payment of dividend, the NAV of the dividend option of the scheme would fall to the extent of payout and statutory levy (if applicable).
Date ofdeclaration (Record Date)
Dividend Distribution
per unit*
NAV as on the date
of declaration
Canara Robeco Medium TermOpportunities Fund
28.11.2014 0.32 10.9937
29.05.2015 0.30 11.1100
27.11.2015 0.30 11.2040
27.05.2016 0.34 11.3020
25.11.2016 0.35 11.7103
26.05.2017 0.35 11.5525
24.11.2017 0.35 11.5473
Direct Plan
28.11.2014 0.32 11.0052
29.05.2015 0.30 11.1324
27.11.2015 0.30 11.2594
27.05.2016 0.34 11.4032
25.11.2016 0.35 11.8578
26.05.2017 0.35 11.7398
24.11.2017 0.35 11.7801
Regular Plan
37

Fund ManagerAn employee of the asset management company who manages investments of the scheme. He is usually part of a larger team of fund managers and research analysts.
Minimum Application Amount for Fresh SubscriptionThis is the minimum investment amount for a new investor in a mutual fund scheme
Application Amount for Fresh SubscriptionThis is the minimum investment amount for a new investor in a mutual fund scheme.
Minimum Additional AmountThis is the minimum investment amount for an existing investor in a mutual fund scheme.
Yield to MaturityThe Yield to Maturity or the YTM is the rate of return anticipated on a bond if held until Maturity. YTM is expressed as an annual rate. The YTM factors in the bond's current market price, par value, coupon interest rate a d time to maturity.
SIPSIP or systematic investment plan works on the principle of making periodic investments of a fixed sum. It works similar to a recurring bank deposit. For instance, an investor may opt for an SIP that invests Rs. 500 every 15th of the month in an equity fund for a period of three years.
NAVThe NAV or the net asset value is the total asset value per unit of the mutual fund after deducting all related and permissible expenses. The NAV is calculated at the end of every business day. It is the value at which the investor enters or exits the mutual fund.
BenchmarkA group of securities, usually a market index, whose performance is used as a standard or benchmark to measure investment performance of mutual funds, among other investments. Some typical benchmarks include the Nifty, Sensex, BSE200, BSE500, 10 –Year Gsec.
Entry LoadA mutual fund may have a sales charge or load at the time of entry and/or exit to compensate the distributor/agent.
Entry load is charged at the time an investor purchases the units of a mutual find. The entry load is added to the prevailing NAV at the time of investment. For instance, if the NAV is Rs. 100 and the exit load is 1%, the investor will enter the fund at Rs. 101.
Exit LoadExit load is charged at the time an investor redeems the units of mutual fund. The exit load is reduced from the prevailing NAV at the time of redemption. The investor will receive redemption proceed at net value of NAV less Exit Load. For instance if the NAV is Rs. 100 and the exit load is 1% the investor will receive Rs. 99
Modified DurationModified duration is the price sensitivity and the percentage change in price for a unit changes in yield.
Standard DeviationStandard Deviation is a statistical measure of the range of an investment's performance. When a mutual fund has a high standard deviation, its means its range of performance is wide, implying greater volatility.
Sharpe Ratio The Sharpe Ratio, named after its founder, the Nobel Laureate William Sharpe, is a measure of risk-adjusted returns. It is calculated using standard deviation and excess return to determine reward per unit or risk.
BetaBeta is a measure of an investment's volatility vis-à-vis the market. Beta of less than 1 means that the security will be less volatile than the market. A beta of greater than 1 implies that the security's price will be more volatile than the market.
AUMAUM or assets under management refers to recent / updated cumulative market value of investments of a scheme managed by the mutual fund.
HoldingsThe holdings or the portfolio is a mutual fund's latest or updated reported statement of investments/securities. These are usually displayed in terms of percentage to net assets or the rupee value or both. The objective is to give investors an idea of where their money is being invested by the fund manager.
Nature of SchemeThe investment objective and underlying investments determine the nature of the mutual fund scheme. For instance, a mutual fund that aims at generating capital appreciation by investing in stock markets is an equity fund or growth fund. Likewise, a mutual fund that aims at capital preservation by investing in debt markets is a debt fund or income fun. Each of these categories may have sub-categories.
Rating ProfileMutual funds invest in securities after evaluating their creditworthiness a disclosed by the ratings. A depiction of the mutual fund in various investments based on their ratings becomes the rating profile of the fund. Typically, this is a feature of debt funds.
HOW TO READ A FACTSHEET
38

Total Expense Ratio
Expressed as an annualized percentage, it is the ratio of all the expenses of the fund to the total assets of the fund and includes the fund management fees paid to the asset management company for managing the fund's assets.
Sharp Ratio
The Sharpe Ratio, named after its founder, the Nobel Laureate William Sharpe, is a measure of risk-adjusted returns. It is calculated using standard deviation and excess return to determine reward per unit or risk.
Beta Ratio
Beta is a measure of an investment's volatility vis-à-vis the market. Beta of less than 1 means that the security will be less volatile than the market. A beta of greater than 1 implies that the security's price will be more volatile than the market.
Portfolio Turnover Ratio
It is a measure of how often assets within a fund are churned.
Modified Duration
Modified duration is the price sensitivity and the percentage change in price for a unit changes in yield.
Average Maturity
It is the weighted average of residual maturity of debt securities in a fund portfolio
Portfolio Yield
Weighted Average valuation yield of the assets
Standard Deviation
Standard Deviation is a statistical measure of the range of an investment's performance. When a mutual fund has a high standard deviation, its means its range of performance is wide, implying greater volatility.
Risk Free Return
It represents the rate of return an investor could have earned by investing in a security which is believed to have zero investment risk over the specified period of time.
Tracking Error
Tracking error is a measure of how closely is a scheme able to imitate the index to which it is benchmarked. It is the standard deviation of the difference between the scheme and index returns.
R-Squared:
It is a statistical measure of how closely the portfolio returns are correlated with its benchmark.
DEFINITIONS
BRANCH OFFICES Toll Free No : 1800 209 2726 Website : www.canararobeco.com
Disclaimer : The information used towards formulating the outlook have been obtained from sources published by third parties. While such publications
are believed to be reliable, however, neither the AMC, its officers, the trustees, the Fund nor any of their affiliates or representatives assume any
responsibility for the accuracy of such information and assume no financial liability whatsoever to the user of this document. The document is solely for
the information and understanding of intended recipients only. Internal views, estimates, opinions expressed herein may or may not materialize. These
views, estimates, opinions alone are not sufficient and should not be used for the development or implementation of an investment strategy. Forward
looking statements are based on internal views and assumptions and subject to known and unknown risks and uncertainties which could materially impact
or differ the actual results or performance from those expressed or implied under those statements.
Mutual Fund investments are subject to market risks, read all scheme related documents carefully.
DISCLAIMERS (as on November 30, 2017)
Ahmedabad: Tel: (079) 40278936 Bangalore : Tel.: (080) 39871400-01 Bhubaneswar : Tel: ( 674) 2570166 Chandigarh : Tel: (0172) 2712472 Chennai : Tel.: (044) 28492598 Goa :
Tel.: (0832) 2422415 / 6450631 Guwahati : (0361) 2461945 Hyderabad : Tel.: (040) 40123302 / 23401481 Indore : Tel.: (0731) 6451222 Jaipur: Tel.: +(141) 4010281 Kochi : Tel.:
(0484) 2364846 Kolkata : Tel.: (033) 30584716 / 17 / 18 Lucknow : Tel.: ( 522) 4026560 Mangalore : Tel: (0824) 2988804 Mumbai : Tel.: (022) 66585000/18, 66585085-86 New
Delhi : Tel.: (011) 23314175 / 23326417 Nagpur : Tel.: (712) 6604562 Pune : Tel.: (020) 30223820 Patna: Tel (0612) 2220114 Surat : Tel.: (0261) 6554243
Note: The disclosures relating to portfolio Turn over Ratio (for equity segment) is based on the aggregate market value of equity as on 30.11.2017. The disclosures of average
maturity period relates to the debt component of the portfolio as on 30.11.2017.
Unclaimed Dividends : Those Investors who have not received/encashed the Dividends distributed by the Schemes, may write to respective registrar, duly furnishing the Name
of the Scheme, Folio No. and Details of the Dividends not received.
$Note :
Risk ratios calculated for schemes having minimum three year performance
For schemes having completed 4-6 years, 4 year data point considered.
For schemes having more than 6 year tenuer, 6 year data point is considered.
Risk Free Rate of Return : 6.00% (MIBOR as of November 30, 2017)
For the calculation of risk ratios monthly absolute returns calculated at monthly frequency are used
39