
FACTS worTh knowing AbouT The ØreSund bridge Worth Knowing... · of 3.6 million with its two...
56
FACTS WORTH KNOWING ABOUT THE ØRESUND BRIDGE ØRESUNDSBRO KONSORTIET 2008
Transcript of FACTS worTh knowing AbouT The ØreSund bridge Worth Knowing... · of 3.6 million with its two...
FACTS worTh knowing AbouT
The ØreSund bridgeØ r e S u n d S b r o k o n S o r T i e T 2 0 0 8
Content
Introduction 1
Facts
The story of the Øresund Bridge 2
The Øresund Region 4
Øresundsbro Konsortiet 6
The fixed link across Øresund 7
Traffic development
Car traffic 8
Rail and coach traffic 12
Lorry and freight train traffic 13
Traffic to and from Scandinavia 14
Traffic across Øresund 15
The Øresund Bridge’s traffic forecast 17
The Øresund Bridge’s capacity 20
Financing and prices
Financing 22
Pricing 24
Prices on the Øresund Bridge 2008 25
Environment and safety
Environment 26
Safety 27
The Øresund Region
A new European powerhouse 28
One cohesive region 30
Commuting 32
The labour market 34
The housing market 37
Øresund partnerships 42
International investments 43
Attitudes to the Øresund Region
The population is positive 46
The business sector’s experience 48
Appendices 50
The figures in Facts worth knowing About the Øresund bridge have not been reviewed by Øresundsbro konsortiet’s auditors.
1
inTroduCTion
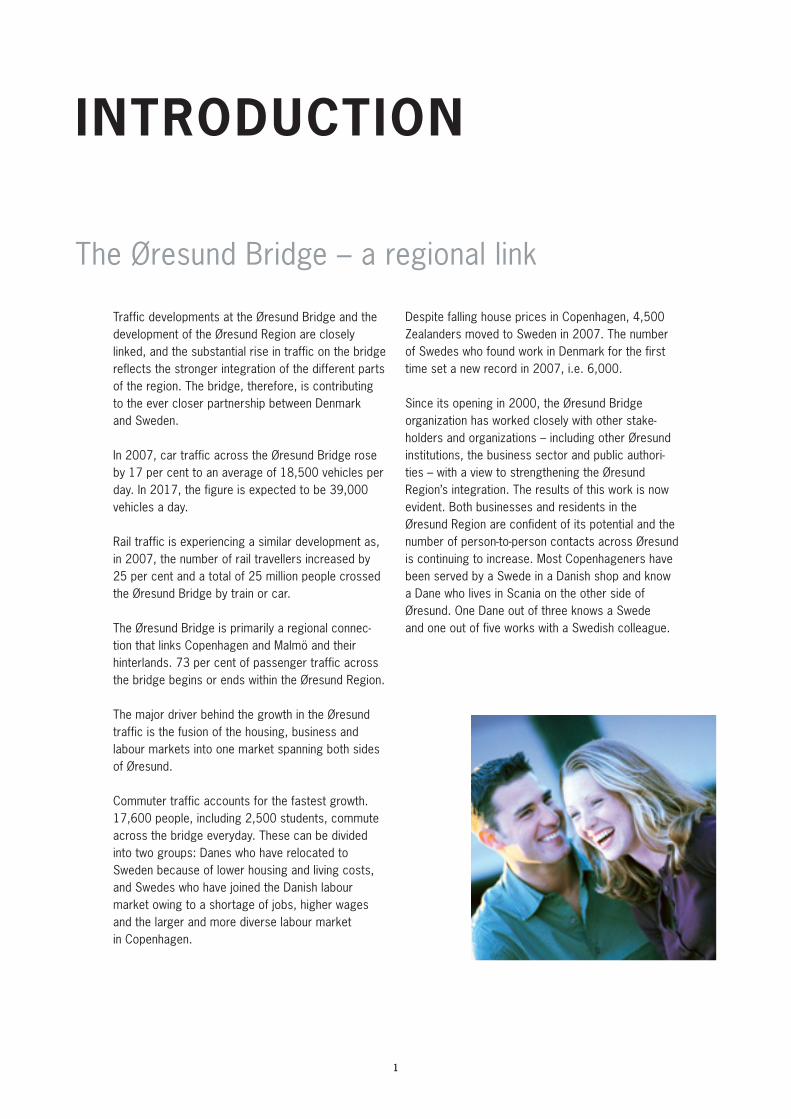
The Øresund Bridge – a regional link
Traffic developments at the Øresund Bridge and the development of the Øresund Region are closely linked, and the substantial rise in traffic on the bridge reflects the stronger integration of the different parts of the region. The bridge, therefore, is contributing to the ever closer partnership between Denmark and Sweden.
In 2007, car traffic across the Øresund Bridge rose by 17 per cent to an average of 18,500 vehicles per day. In 2017, the figure is expected to be 39,000 vehicles a day.
Rail traffic is experiencing a similar development as, in 2007, the number of rail travellers increased by 25 per cent and a total of 25 million people crossed the Øresund Bridge by train or car.
The Øresund Bridge is primarily a regional connection that links Copenhagen and Malmö and their hinterlands. 73 per cent of passenger traffic across the bridge begins or ends within the Øresund Region.
The major driver behind the growth in the Øresund traffic is the fusion of the housing, business and labour markets into one market spanning both sides of Øresund.
Commuter traffic accounts for the fastest growth. 17,600 people, including 2,500 students, commute across the bridge everyday. These can be divided into two groups: Danes who have relocated to Sweden because of lower housing and living costs, and Swedes who have joined the Danish labour market owing to a shortage of jobs, higher wages and the larger and more diverse labour market in Copenhagen.
Despite falling house prices in Copenhagen, 4,500 Zealanders moved to Sweden in 2007. The number of Swedes who found work in Denmark for the first time set a new record in 2007, i.e. 6,000.
Since its opening in 2000, the Øresund Bridge organization has worked closely with other stakeholders and organizations – including other Øresund institutions, the business sector and public authorities – with a view to strengthening the Øresund Region’s integration. The results of this work is now evident. Both businesses and residents in the Øresund Region are confident of its potential and the number of persontoperson contacts across Øresund is continuing to increase. Most Copenhageners have been served by a Swede in a Danish shop and know a Dane who lives in Scania on the other side of Øresund. One Dane out of three knows a Swede and one out of five works with a Swedish colleague.
1
2
From idea to reality
A fixed link across the Øresund waterway was under consideration in Denmark and Sweden for more than a century before becoming a reality. In the 1930s and 1950s, specific proposals for an alignment across the Isle of Saltholm were tabled and, in 1973, the Danish and Swedish governments actually signed an agreement for the construction of a fixed link. This, however, was rejected in 1978 when Denmark decided against relocating the airport at Kastrup to the Isle of Saltholm. In the 1980s, further solutions were put forward, but a final agreement on a fixed Øresund link between Copenhagen and Malmö was not signed until 1991.
In the late 1980s and early 1990s, a clear need to develop and stimulate growth in Southern Scania and Copenhagen emerged. At the time, Malmö was experiencing high unemployment following the closure of several major industrial companies and, in Denmark, a large part of the country’s economic development was centred in Jutland whereas building in Copenhagen was stagnating.
Consequently, the Øresund Bridge became a crucial project in respect of reenergizing economic development in the region. As economic trends recovered in the mid 1990s, other projects emerged. On the
Danish side, the airport at Kastrup expanded considerably and a fast and efficient metro system was built to link the different parts of the city of Copenhagen and the new district of Ørestad.
In Malmö, large sections of the old harbour area were renovated and the former shipyard was replaced by new residential and commercial areas. Today, the southern part of Malmö around Hyllie is the centre of major construction projects, including a commercial centre, a multi arena and a new rail tunnel which will shorten the section between Malmö city centre and Copenhagen via the Øresund Bridge.
The main reason for building the Øresund Bridge was to create one region around Øresund, create stronger commercial ties and promote commuting and cultural exchange between Copenhagen and Malmö. Until 2000, relations between the two cities had been at a low level although the distance between the two city centres is only 30 km.
As well as the regional benefits generated by the Øresund Bridge, a further benefit has been the reduction in travelling time between Sweden and the European continent. This has been particularly important for business and commerce – in Sweden as well as in Denmark.
The story of the Øresund Bridge
FACTS
33
4
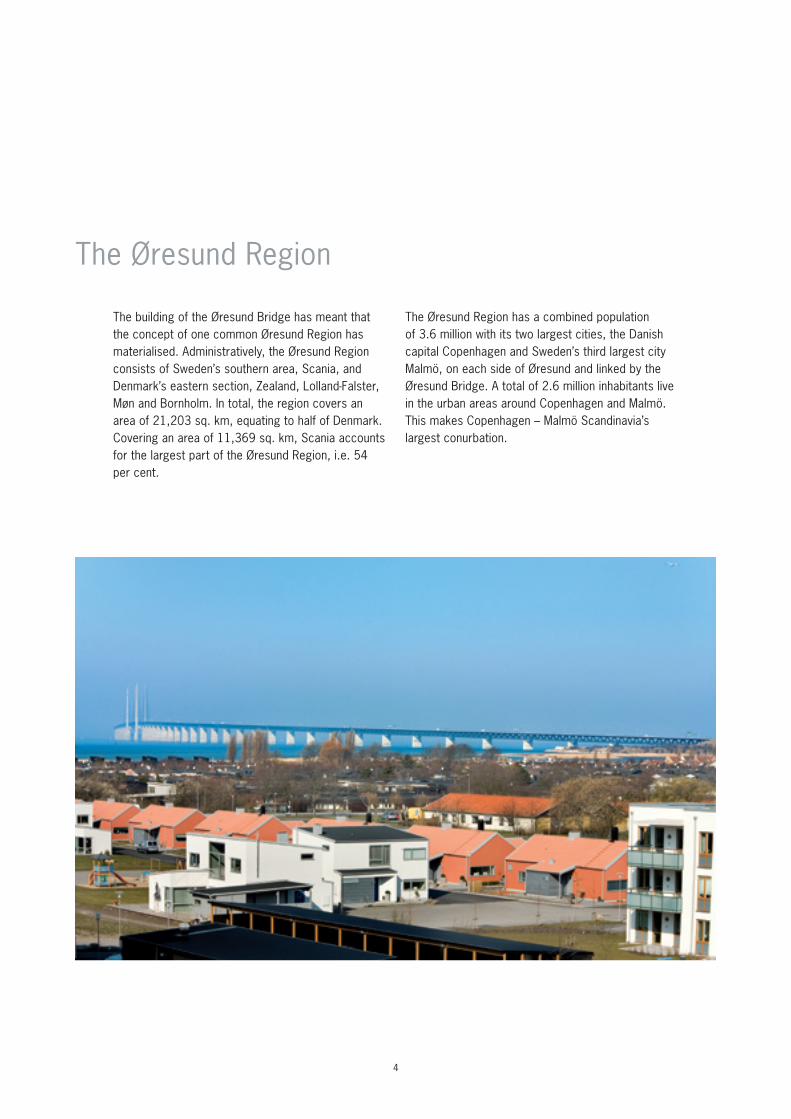
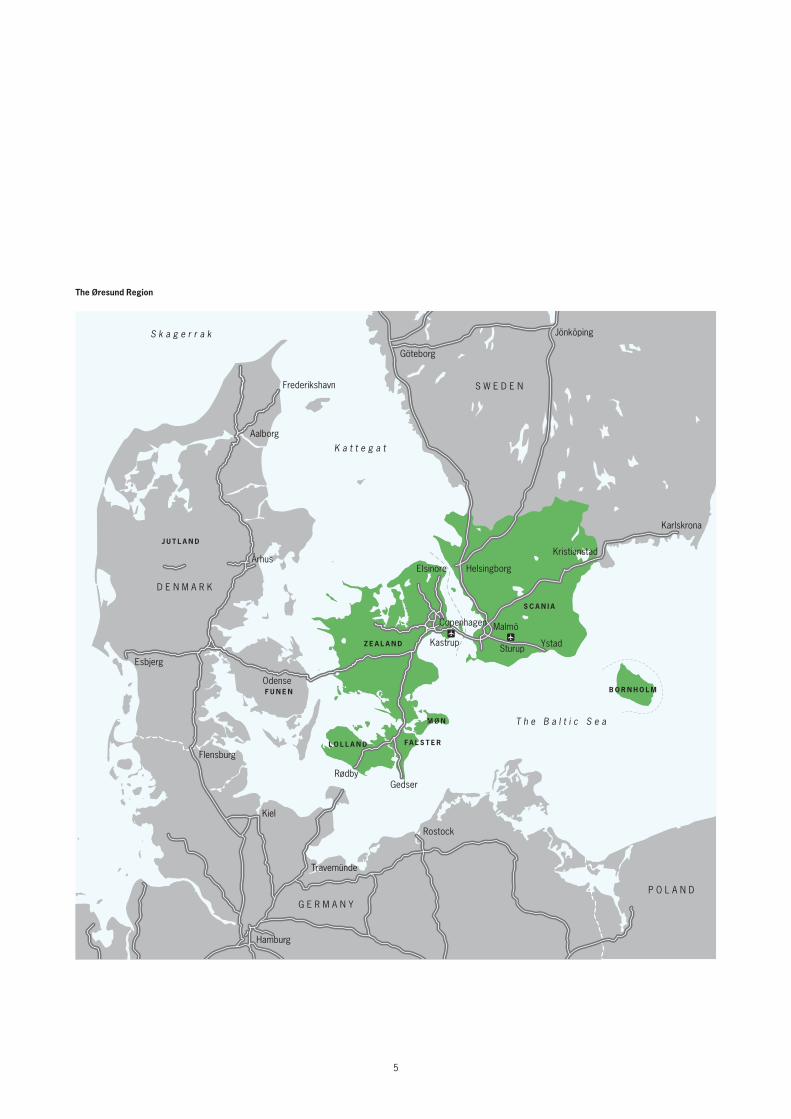
The building of the Øresund Bridge has meant that the concept of one common Øresund Region has materialised. Administratively, the Øresund Region consists of Sweden’s southern area, Scania, and Denmark’s eastern section, Zealand, LollandFalster, Møn and Bornholm. In total, the region covers an area of 21,203 sq. km, equating to half of Denmark. Covering an area of 11,369 sq. km, Scania accounts for the largest part of the Øresund Region, i.e. 54 per cent.
The Øresund Region has a combined population of 3.6 million with its two largest cities, the Danish capital Copenhagen and Sweden’s third largest city Malmö, on each side of Øresund and linked by the Øresund Bridge. A total of 2.6 million inhabitants live in the urban areas around Copenhagen and Malmö. This makes Copenhagen – Malmö Scandinavia’s largest conurbation.
The Øresund Region
5
The Øresund region
Frederikshavn
Århus
Esbjerg
Odense
Kastrup
Copenhagen
Flensburg
Kiel
Travemünde
Hamburg
RødbyGedser
Aalborg
Kristianstad
Ystad
Malmö
Sturup
Elsinore
Göteborg
Jönköping
Karlskrona
Rostock
Helsingborg
D E N M A R K
S W E D E N
P O L A N D
K a t t e g a t
S k a g e r r a k
T h e B a l t i c S e a
G E R M A N Y
B O R N H O L M
S C A N I A
Z E A L A N D
F U N E N
L O L L A N D FA L S T E R
J U T L A N D
M Ø N
6
Øresundsbro Konsortiet
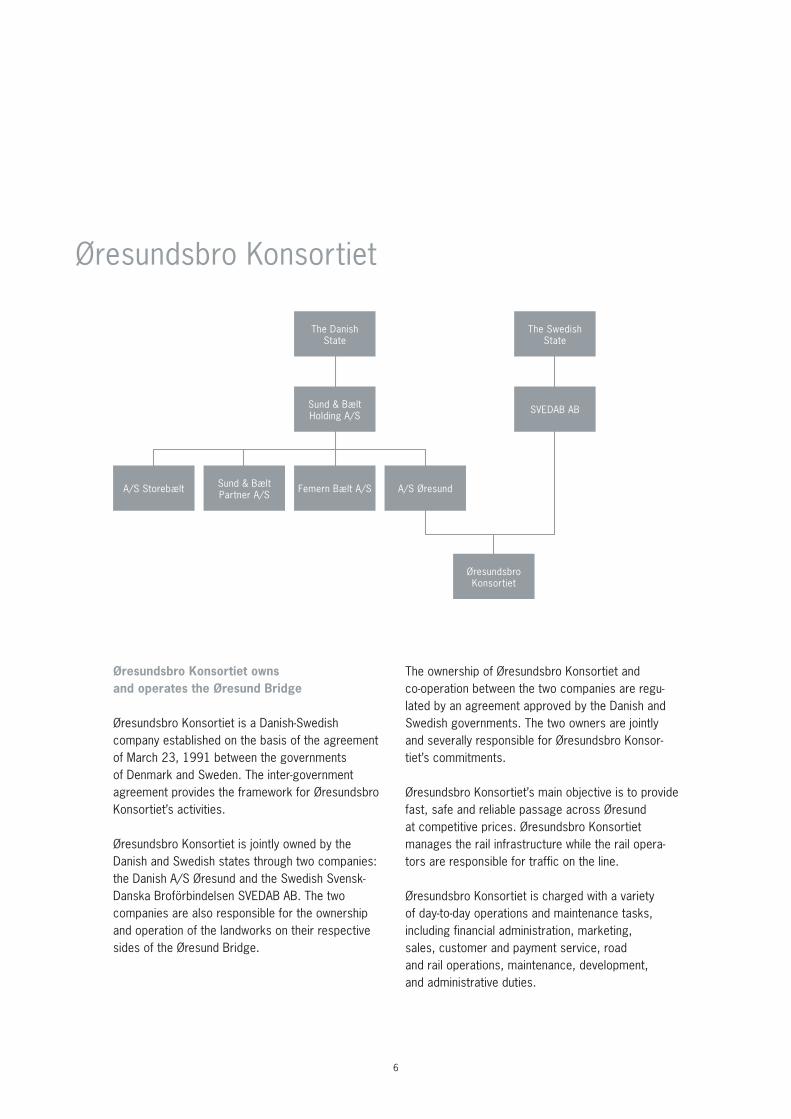
Øresundsbro konsortiet owns and operates the Øresund bridge
Øresundsbro Konsortiet is a DanishSwedish company established on the basis of the agreement of March 23, 1991 between the governments of Denmark and Sweden. The intergovernment agreement provides the framework for Øresundsbro Konsortiet’s activities.
Øresundsbro Konsortiet is jointly owned by the Danish and Swedish states through two companies: the Danish A/S Øresund and the Swedish SvenskDanska Broförbindelsen SVEDAB AB. The two companies are also responsible for the ownership and operation of the landworks on their respective sides of the Øresund Bridge.
The ownership of Øresundsbro Konsortiet and cooperation between the two companies are regulated by an agreement approved by the Danish and Swedish governments. The two owners are jointly and severally responsible for Øresundsbro Konsortiet’s commitments.
Øresundsbro Konsortiet’s main objective is to provide fast, safe and reliable passage across Øresund at competitive prices. Øresundsbro Konsortiet manages the rail infrastructure while the rail operators are responsible for traffic on the line.
Øresundsbro Konsortiet is charged with a variety of daytoday operations and maintenance tasks, including financial administration, marketing, sales, customer and payment service, road and rail operations, maintenance, development, and administrative duties.
Sund & BæltPartner A/S
Femern Bælt A/SA/S Storebælt A/S Øresund
SVEDAB AB
ØresundsbroKonsortiet
Sund & Bælt Holding A/S
The SwedishState
The DanishState
7
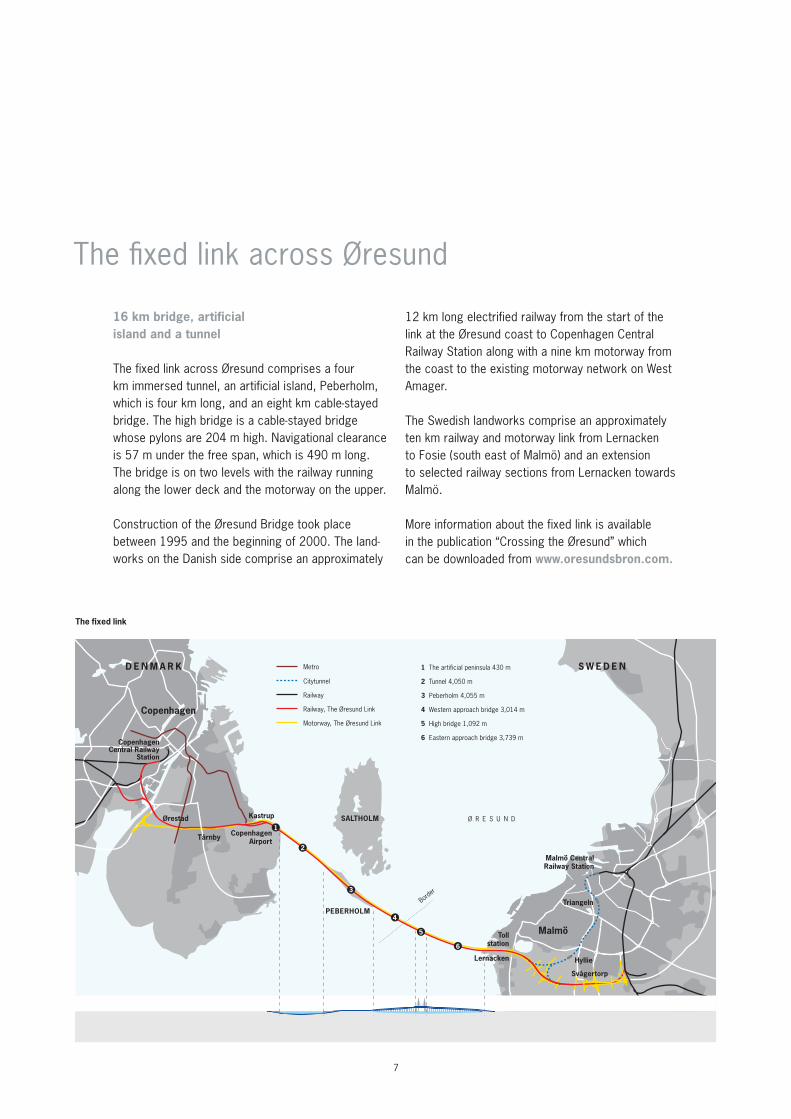
The fixed link across Øresund
16 km bridge, artificial island and a tunnel
The fixed link across Øresund comprises a four km immersed tunnel, an artificial island, Peberholm, which is four km long, and an eight km cablestayed bridge. The high bridge is a cablestayed bridge whose pylons are 204 m high. Navigational clearance is 57 m under the free span, which is 490 m long. The bridge is on two levels with the railway running along the lower deck and the motorway on the upper.
Construction of the Øresund Bridge took place between 1995 and the beginning of 2000. The landworks on the Danish side comprise an approximately
12 km long electrified railway from the start of the link at the Øresund coast to Copenhagen Central Railway Station along with a nine km motorway from the coast to the existing motorway network on West Amager.
The Swedish landworks comprise an approximately ten km railway and motorway link from Lernacken to Fosie (south east of Malmö) and an extension to selected railway sections from Lernacken towards Malmö.
More information about the fixed link is available in the publication “Crossing the Øresund” which can be downloaded from www.oresundsbron.com.
Metro
Citytunnel
Railway
Railway, The Øresund Link
Motorway, The Øresund Link
1 The artificial peninsula 430 m
2 Tunnel 4,050 m
5 High bridge 1,092 m
4 Western approach bridge 3,014 m
3 Peberholm 4,055 m
6 Eastern approach bridge 3,739 m
6
5
4
3
2
1SALTHOLM
Malmö Central Railway Station
CopenhagenCentral Railway
Station
Copenhagen
Ø R E S U N DKastrup
CopenhagenAirport
Ørestad
Tårnby
D E N M A R K S W E D E N
Border
Tollstation
Lernacken
PEBERHOLM
Svågertorp
Hyllie
Malmö
Triangeln
The fixed link
8
TrAFFiC developmenT
Car traffic
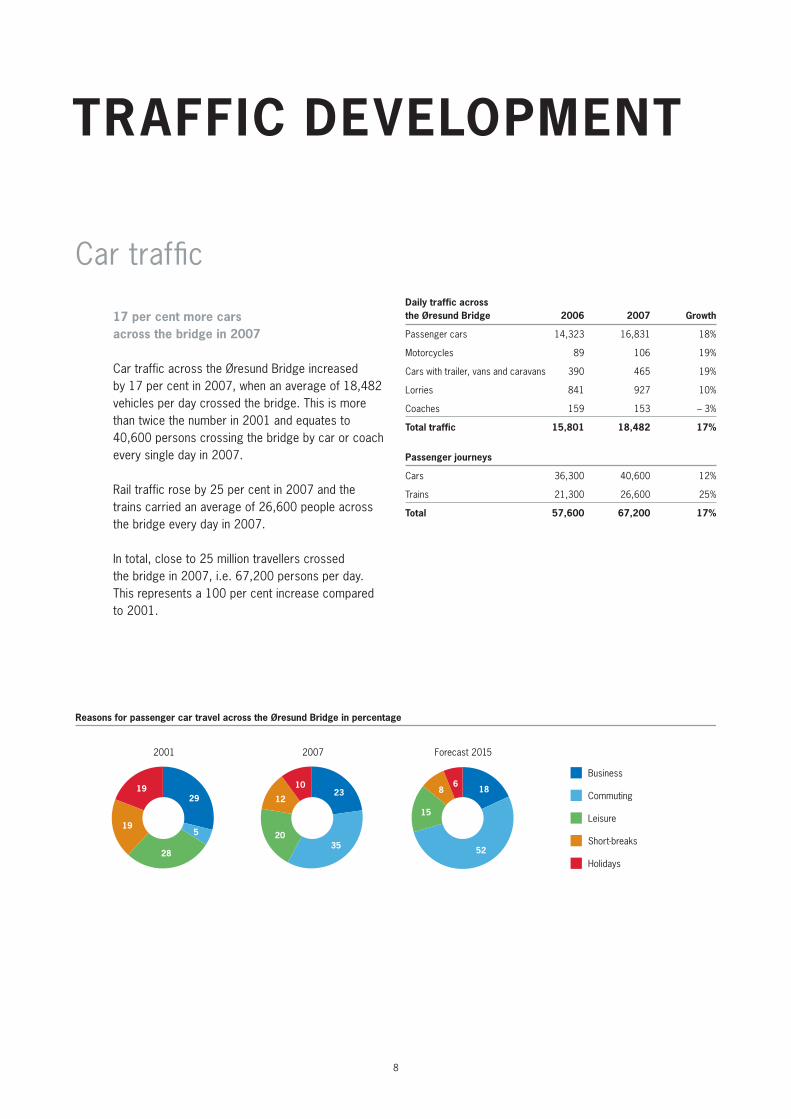
17 per cent more cars across the bridge in 2007
Car traffic across the Øresund Bridge increased by 17 per cent in 2007, when an average of 18,482 vehicles per day crossed the bridge. This is more than twice the number in 2001 and equates to 40,600 persons crossing the bridge by car or coach every single day in 2007.
Rail traffic rose by 25 per cent in 2007 and the trains carried an average of 26,600 people across the bridge every day in 2007.
In total, close to 25 million travellers crossed the bridge in 2007, i.e. 67,200 persons per day. This represents a 100 per cent increase compared to 2001.
Holidays
Short-breaks
Leisure
Commuting
Business
19
19
28
5
29
10
12
2035
236
8
15
52
18
2001 2007 Forecast 2015
Reasons for passenger car travel across the Øresund Bridge in percentage
daily traffic across the Øresund bridge 2006 2007 growth
Passenger cars 14,323 16,831 18%
Motorcycles 89 106 19%
Cars with trailer, vans and caravans 390 465 19%
Lorries 841 927 10%
Coaches 159 153 – 3%
Total traffic 15,801 18,482 17%
passenger journeys
Cars 36,300 40,600 12%
Trains 21,300 26,600 25%
Total 57,600 67,200 17%
9
Commuting across Øresund is the driver behind passenger car traffic
Passenger car traffic accounts for 91 per cent of traffic across the Øresund Bridge and the overall traffic development therefore mirrors the trend in development for passenger car traffic.
In 2007, passenger traffic rose by 18 per cent, the highest growth yet seen on the bridge. The explanation lies mainly with the regional development in the Øresund Region where many Danes are moving to Scania. And many Swedes are finding work in Copenhagen and surrounding areas.
– Commuting, which accounted for 35 per cent of passenger car traffic in 2007, is the fastest growing traffic segment, with an annual growth of 42 per cent. In 2015, commuting is expected to account for half of all passenger car traffic on the bridge. Increased commuting reflects the continued integration of the region’s labour and housing markets where many Danes are settling in Scania but continuing to work in Denmark, while more Swedes are finding jobs in Copenhagen and surrounding areas. Higher wages and salaries in Denmark and lower housing and living costs in Sweden make it attractive to live and work on either side of Øresund.
– regional business traffic, which accounts for slightly less than 25 per cent of passenger car traffic across the bridge, grew by 8 per cent in 2007. The rise reflects the fact that business and industry has started to exploit the Øresund Region’s potential by, for instance, combining offices and departments on either the Danish or Swedish side. Crossregional sales are also rising. Development in Øresund integration across commercial sectors is driven by many companies and sectors and cannot be ascribed to a few large players, segments or projects alone.
– holiday and leisure traffic accounts for the remaining 42 per cent of passenger car traffic. Leisure and short break traffic (up to three overnight stays) has increased by 54 per cent from 2001 to 2007, while holiday traffic (over three overnight stays) has only increased by 10 per cent over the same period. The significant growth in leisure and short break traffic is owing to generally higher levels of prosperity which enable more people to take long weekend breaks and oneday excursions. The fact that the Øresund Region’s inhabitants benefit from a far greater range of leisure activities following the opening of the Øresund Bridge is also a factor. This is, for instance, evidenced by the fact that many Danes now visit Sweden for oneday trips to play golf or ski while people from Southern Sweden make use of Copenhagen’s many cultural offerings.
10
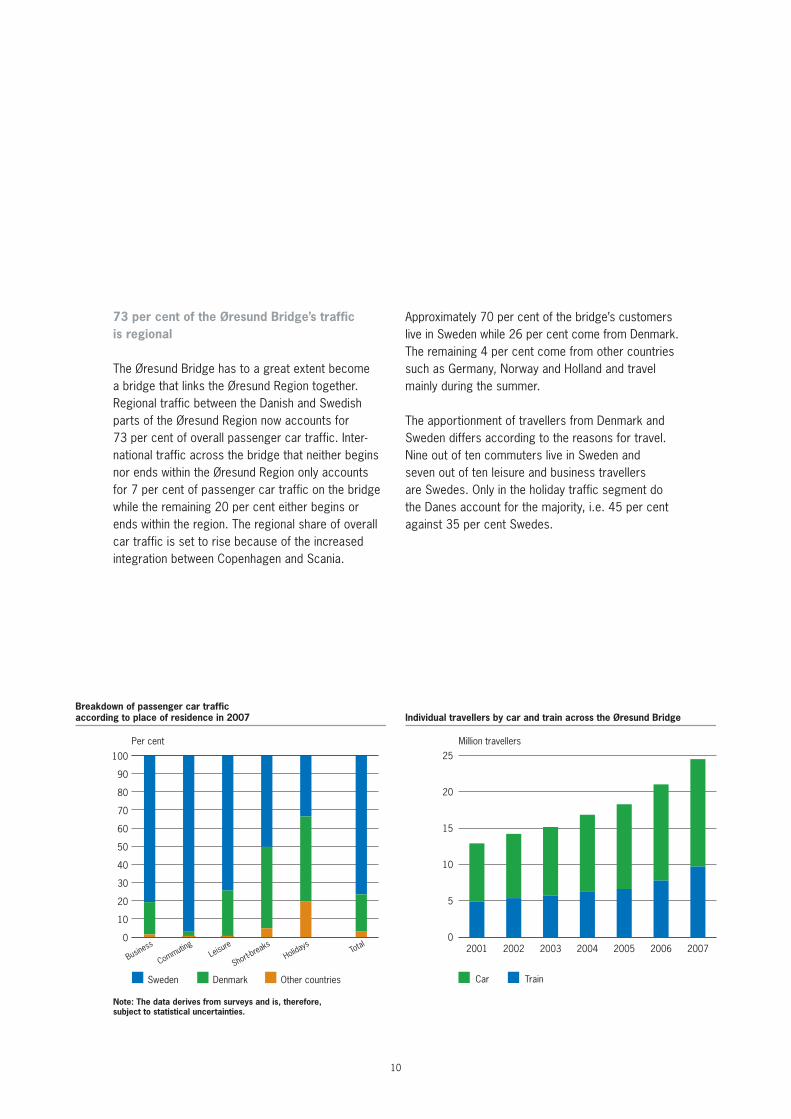
73 per cent of the Øresund bridge’s traffic is regional
The Øresund Bridge has to a great extent become a bridge that links the Øresund Region together. Regional traffic between the Danish and Swedish parts of the Øresund Region now accounts for 73 per cent of overall passenger car traffic. International traffic across the bridge that neither begins nor ends within the Øresund Region only accounts for 7 per cent of passenger car traffic on the bridge while the remaining 20 per cent either begins or ends within the region. The regional share of overall car traffic is set to rise because of the increased integration between Copenhagen and Scania.
Approximately 70 per cent of the bridge’s customers live in Sweden while 26 per cent come from Denmark. The remaining 4 per cent come from other countries such as Germany, Norway and Holland and travel mainly during the summer.
The apportionment of travellers from Denmark and Sweden differs according to the reasons for travel. Nine out of ten commuters live in Sweden and seven out of ten leisure and business travellers are Swedes. Only in the holiday traffic segment do the Danes account for the majority, i.e. 45 per cent against 35 per cent Swedes.
Sweden Denmark Other countries
Total
Holidays
Short-breaks
Leisure
Commuting
Business
0
10
20
30
40
50
60
70
80
90
100
Breakdown of passenger car traffic according to place of residence in 2007
Per cent
Note: The data derives from surveys and is, therefore, subject to statistical uncertainties.
0
5
10
15
20
25
Car Train
2007200620052004200320022001
Individual travellers by car and train across the Øresund Bridge
Million travellers
11
Travel flow for passenger cars across the Øresund bridge in 2007
destination
Funen/ rest of norway/ origin Copenhagen Zealand Jutland europe Scania Sweden bornholm Finland Total
Copenhagen 9% 3% 2% 0% 15%
Zealand 3% 1% 1% 0% 6%
Funen/Jutland 2% 1% 1% 0% 5%
Europe 0% 1% 0% 1% 3%
Scania 51% 6% 2% 3% 62%
Rest of Sweden 4% 1% 1% 2% 9%
Bornholm 0% 0% 0% 0% 1%
Norway/Finland 0% 0% 0% 0% 1%
Total 56% 8% 3% 5% 14% 7% 5% 2% 100%
note: The data derives from surveys and is, therefore, subject to statistical uncertainties.
12
25 per cent growth in rail traffic
Rail traffic across the Øresund Bridge also experienced sound growth. In 2007, 9.7 million train passengers crossed the Øresund – a growth of 25 per cent compared to 2006. In 2007, 47,000 passenger trains and 8,850 freight trains crossed the Øresund Bridge. This amounts to 140 trains per day or an average of three trains per hour in each direction.
Four out of five train passengers are resident in Sweden, and one in every five lives in Denmark. A very small proportion are foreigners. The Øresund trains function primarily as a local means of transport in the region where 90 per cent of the passengers’ journeys are regional.
Around six out of ten train passengers commute for reasons of study or work and, indeed, commuting drives the growth in rail traffic. Leisure traffic
accounts for a large part of the remaining 40 per cent of rail traffic, while business and holiday travellers only account for a small proportion.
The rail system across the Øresund Bridge primarily comprises the Øresund trains which run across the bridge. From 2007, the Øresund trains have increased their frequency from three to six trains per hour during rush hour in each direction in order to alleviate the current space shortage. In nonrush hours, trains run three times per hour in each direction and once per hour at night. The Øresund trains run between Elsinore and several Swedish destinations, including Helsingborg and Kristianstad – all via Malmö. Extra rushhour trains operate between Svågertorp and Nivå. National and international passenger and freight trains also run across the Øresund Bridge.
decline in coach traffic
Over half of all coach traffic to and from the Scandinavian peninsular uses the Øresund Bridge. However, in 2007, coach traffic on the bridge fell by 3 per cent to 56,000 coaches which is largely a consequence of a general decline in international coach traffic.
Coach traffic is split between scheduled and tourist services. Scheduled traffic comprises services between the North European capitals and cities and regional services between Copenhagen, Malmö, Lund, Malmö Airport and Ystad/Bornholm.
Rail and coach traffic
13
Lorry and freight train traffic
10 per cent growth in lorry traffic
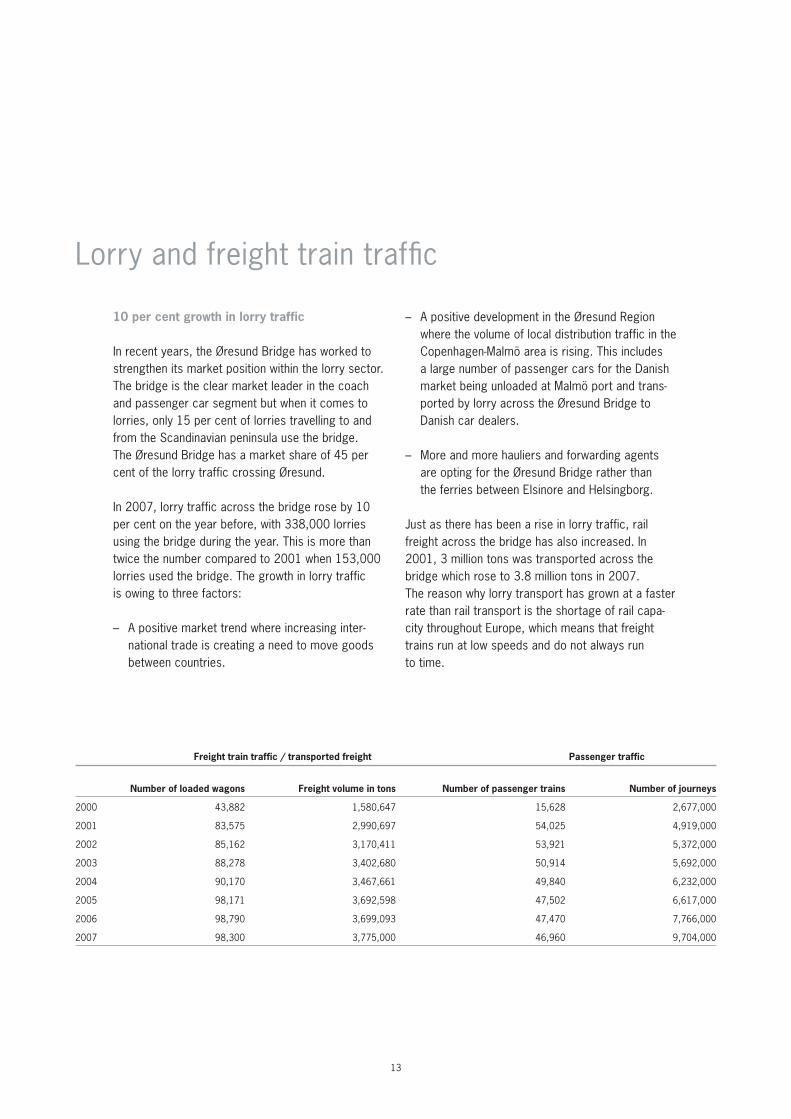
In recent years, the Øresund Bridge has worked to strengthen its market position within the lorry sector. The bridge is the clear market leader in the coach and passenger car segment but when it comes to lorries, only 15 per cent of lorries travelling to and from the Scandinavian peninsula use the bridge. The Øresund Bridge has a market share of 45 per cent of the lorry traffic crossing Øresund. In 2007, lorry traffic across the bridge rose by 10 per cent on the year before, with 338,000 lorries using the bridge during the year. This is more than twice the number compared to 2001 when 153,000 lorries used the bridge. The growth in lorry traffic is owing to three factors:
– A positive market trend where increasing international trade is creating a need to move goods between countries.
– A positive development in the Øresund Region where the volume of local distribution traffic in the CopenhagenMalmö area is rising. This includes a large number of passenger cars for the Danish market being unloaded at Malmö port and transported by lorry across the Øresund Bridge to Danish car dealers.
– More and more hauliers and forwarding agents are opting for the Øresund Bridge rather than the ferries between Elsinore and Helsingborg.
Just as there has been a rise in lorry traffic, rail freight across the bridge has also increased. In 2001, 3 million tons was transported across the bridge which rose to 3.8 million tons in 2007. The reason why lorry transport has grown at a faster rate than rail transport is the shortage of rail capacity throughout Europe, which means that freight trains run at low speeds and do not always run to time.
Freight train traffic / transported freight passenger traffic
number of loaded wagons Freight volume in tons number of passenger trains number of journeys
2000 43,882 1,580,647 15,628 2,677,000
2001 83,575 2,990,697 54,025 4,919,000
2002 85,162 3,170,411 53,921 5,372,000
2003 88,278 3,402,680 50,914 5,692,000
2004 90,170 3,467,661 49,840 6,232,000
2005 98,171 3,692,598 47,502 6,617,000
2006 98,790 3,699,093 47,470 7,766,000
2007 98,300 3,775,000 46,960 9,704,000
14
Traffic to and from Scandinavia
The Øresund region – a northern european transport hub
The opening of the Øresund Bridge in 2000 significantly enhanced the infrastructure between the Scandinavian peninsula and the European continent. In particular, travelling times across Øresund between Zealand and Scania have become faster.
Copenhagen and Malmö are connected by a motorway and the motorway network around both cities is of stateoftheart standard. Øresund trains depart from Elsinore in Denmark via Copenhagen and Malmö to e.g. Gothenburg and Kalmar. Equally, Copenhagen Airport at Kastrup has become more easily accessible from Sweden just as Malmö Airport at Sturup just outside Malmö can now be reached more easily from Denmark.
Having merged into one company, CMP Copenhagen Malmö Port now forms the Nordic area’s largest gateway for imported cars.
All four types of transport are well integrated in the Øresund Region and, compared to corresponding urban communities in Europe, only experience moderate traffic problems and congestion.
The Øresund Region’s geographical location and the well developed infrastructure is ideal for the distribution of goods to and from Scandinavia and the Baltic area. Consequently, many large companies have opted for the Øresund Region as their Nordic distribution centre.
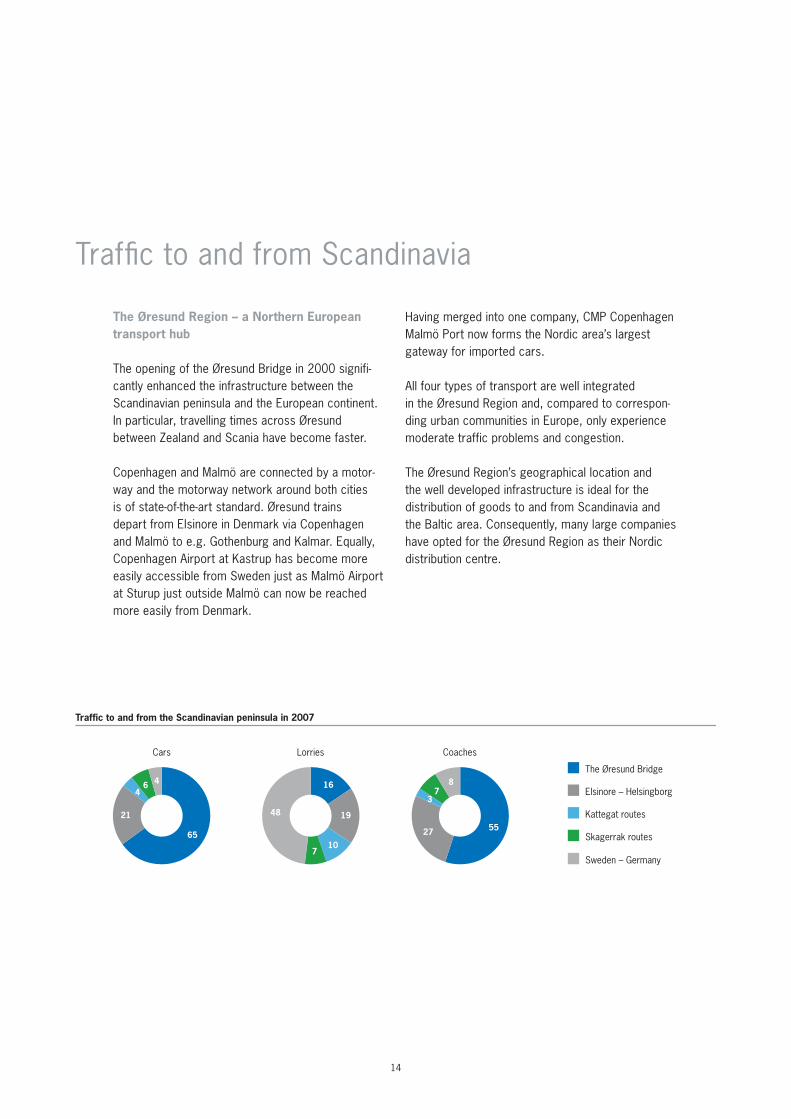
Sweden – Germany
Skagerrak routes
Kattegat routes
Elsinore – Helsingborg
The Øresund Bridge46
4
21
65
48
710
19
16 87
3
27 55
Cars Lorries Coaches
Traffic to and from the Scandinavian peninsula in 2007
15
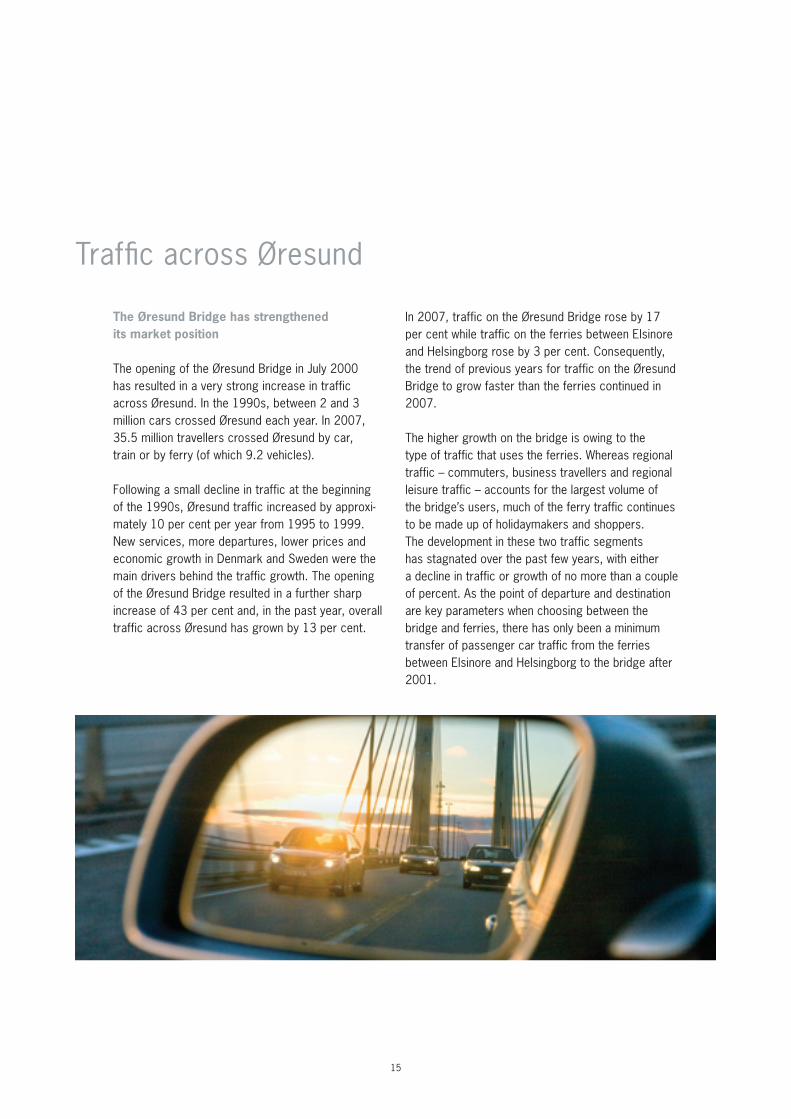
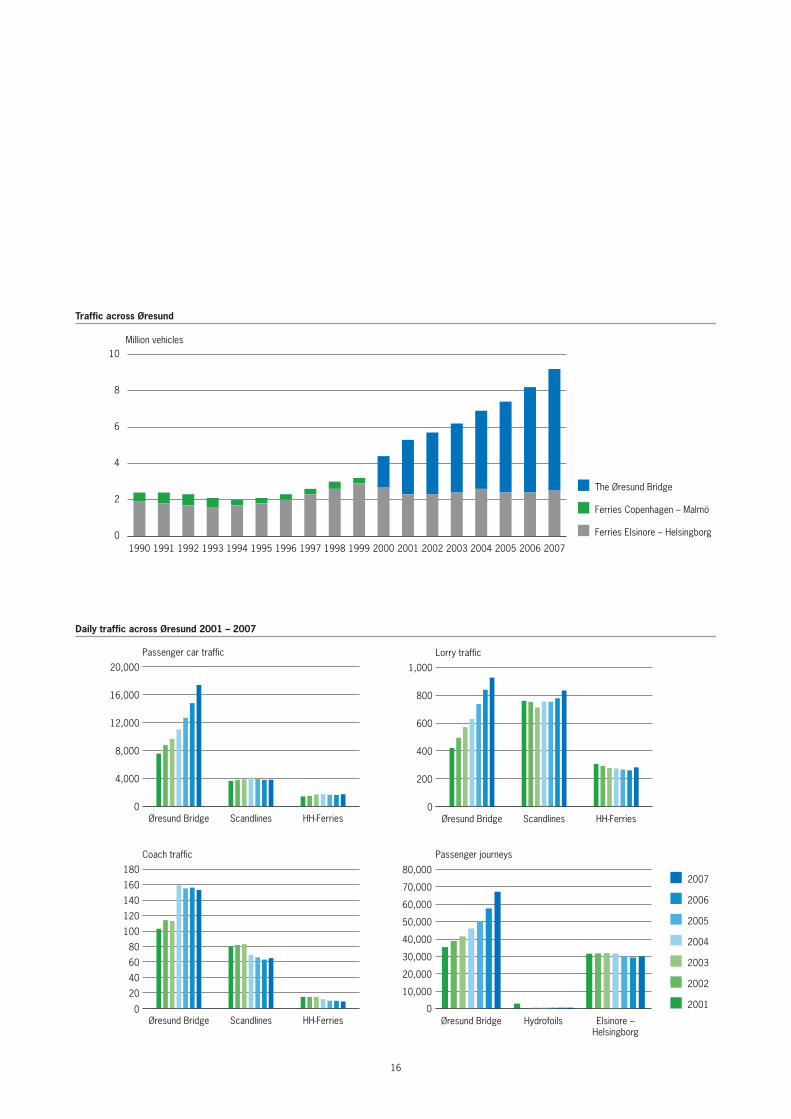
Traffic across Øresund
The Øresund bridge has strengthened its market position
The opening of the Øresund Bridge in July 2000 has resulted in a very strong increase in traffic across Øresund. In the 1990s, between 2 and 3 million cars crossed Øresund each year. In 2007, 35.5 million travellers crossed Øresund by car, train or by ferry (of which 9.2 vehicles).
Following a small decline in traffic at the beginning of the 1990s, Øresund traffic increased by approximately 10 per cent per year from 1995 to 1999. New services, more departures, lower prices and economic growth in Denmark and Sweden were the main drivers behind the traffic growth. The opening of the Øresund Bridge resulted in a further sharp increase of 43 per cent and, in the past year, overall traffic across Øresund has grown by 13 per cent.
In 2007, traffic on the Øresund Bridge rose by 17 per cent while traffic on the ferries between Elsinore and Helsingborg rose by 3 per cent. Consequently, the trend of previous years for traffic on the Øresund Bridge to grow faster than the ferries continued in 2007.
The higher growth on the bridge is owing to the type of traffic that uses the ferries. Whereas regional traffic – commuters, business travellers and regional leisure traffic – accounts for the largest volume of the bridge’s users, much of the ferry traffic continues to be made up of holidaymakers and shoppers. The development in these two traffic segments has stagnated over the past few years, with either a decline in traffic or growth of no more than a couple of percent. As the point of departure and destination are key parameters when choosing between the bridge and ferries, there has only been a minimum transfer of passenger car traffic from the ferries between Elsinore and Helsingborg to the bridge after 2001.
16
0
10,000
20,000
30,000
40,000
50,000
60,000
70,000
80,0002007
2006
2005
2004
2003
2002
2001
Elsinore –Helsingborg
HydrofoilsØresund Bridge
0
200
400
600
800
1,000
HH-FerriesScandlinesØresund Bridge0
4,000
8,000
12,000
16,000
20,000
HH-FerriesScandlinesØresund Bridge
0
20
40
60
80
100
120
140
160
180
HH-FerriesScandlinesØresund Bridge
Passenger journeys
Lorry trafficPassenger car traffic
Coach traffic
Daily traffic across Øresund 2001 – 2007
0
2
4
6
8
10
The Øresund Bridge
Ferries Copenhagen – Malmö
Ferries Elsinore – Helsingborg
200720062005200420032002200120001999199819971996199519941993199219911990
Million vehicles
Traffic across Øresund
17
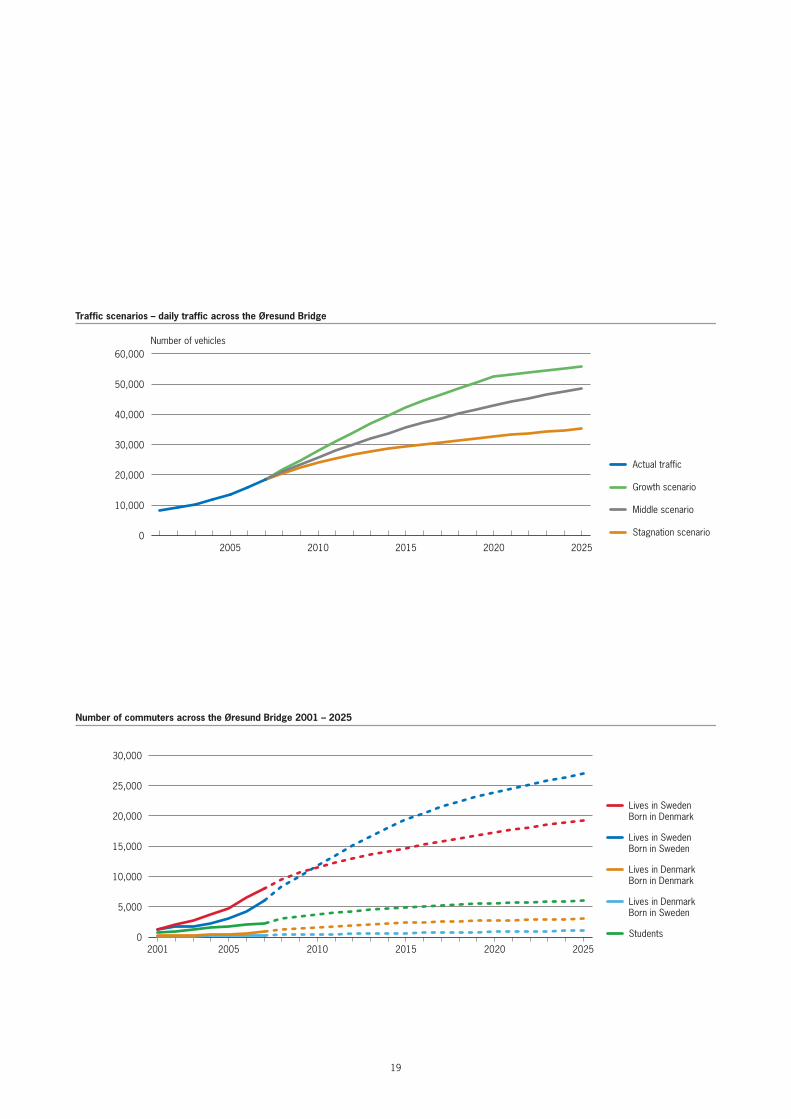
39,000 vehicles across the Øresund bridge in 2017
Every year, Øresundsbro Konsortiet prepares a forecast for future traffic on the bridge. In recent years, the forecasts have comprised three scenarios for road traffic: a growth scenario, a stagnation scenario and a middle scenario.
The middle scenario is the most likely outlook and Øresundsbro Konsortiet’s budget planning is based on the road revenue from this scenario. The middle scenario is often referred to as the traffic forecast. If no specific scenario is given, the middle scenario applies.
The middle scenario is based on the following assumptions:
– Positive regional development where politicians or other authorities, as a minimum, do not hamper interaction across Øresund and where the economic gap between Malmö and Copenhagen in terms of salaries and housing costs remain.
– Stable economic development in Denmark and
Sweden over the next ten years. This development should, more or less, correspond to the development over the past ten years adjusted for demographic change.
– Sustaining the current traffic and infrastructure development in Denmark and Sweden. A minor level of congestion charges or rising petrol and
energy prices will not impact on the longterm forecast but the forecast is not stable viz a viz major changes.
– Unchanged competitive conditions in relation to ferry services.
Traffic across the Øresund Bridge has doubled over the past five years. During the next ten years, daily traffic across the bridge is expected to increase to 39,000 vehicles per day in the middle scenario and this figure is anticipated to increase further to 49,000 vehicles per day by 2025. Annual traffic growth is expected to fall from approximately 14 per cent in 2008 to 2 per cent in 2025. Subsequently, 2 per cent annual growth is expected to be sustained until 2031 when commuter traffic will reach its capacity limit while the other traffic segments will continue to grow.
The driver behind traffic development on the Øresund Bridge is the fusion of Copenhagen and Malmö where many inhabitants have started to commute across the bridge for work or educational purposes. Work or studyrelated commuting is showing the fastest growth and exceeds all previous forecasts. In 2007, 17,600 individuals crossed the bridge every day to their place of work or study on the other side. This is an increase of 31 per cent on 2006. The Øresund Bridge expects 56,000 individuals to commute daily between Malmö and Copenhagen in 2025 – or treble the number of today.
The Øresund Bridge’s traffic forecast
18
The explanation for the strong growth in commuting is:
– That many Danes are moving to the Malmö area.
– There are significant differences in unemployment levels and real wages across Øresund. As a result, many Swedes are looking for work in Copenhagen.
– Copenhagen and the rest of Zealand will, within a few years, see a massive shortage of labour which will create pressure on wages and salaries in Denmark. As the employment shortage and, therefore, pressure on wages and salaries, is less on the Swedish side, this will further strengthen the economic incentive to work in Denmark for residents of Southern Sweden.
– Population figures and employment levels are expected to increase in the Malmö area over the next 20 years. This alone will lead to a 35 per cent increase in employment over 20 years.
The growth scenario is the most positive of the bridge’s three scenarios. This scenario primarily differs from the middle scenario in the assumption that integration of the Øresund Region will proceed at an even higher rate. Over the long term, positive European economic trends will also contribute to this scenario.
Under the growth scenario, traffic on the bridge will rise from 18,500 vehicles in 2007 to 47,000 per day in 2017 and 56,000 vehicles in 2025. In 2031, 60,000 vehicles will cross the bridge every day, which equates to the model’s capacity limit. In practical terms, traffic may well exceed this limit as long as the growth takes place outside peak periods.
The stagnation scenario is the worst case scenario where the development in regional integration declines within a few years. Equally, a prolonged economic crisis or public restrictions on car traffic could also contribute to this scenario.
Under the stagnation scenario, 31,000 vehicles will cross the bridge in 2017 while traffic will double between 2007 and 2025. Although the stagnation scenario represents the most pessimistic view of traffic growth, traffic will still exceed the forecast from before the opening of the bridge. At the time, the bridge was expected to carry a maximum of 22,250 vehicles per day in 2020. Under the stagnation scenario, annual traffic growth will decline from 11 per cent in 2008 to 1.5 per cent around 2025. Over relatively few years, the development in regional integration will decline and traffic growth on the Øresund Bridge will equate to the growth on corresponding road sections in Northern Europe. (Traffic growth on border crossing roads and ferry routes has, over the past 20 years, exceeded growth on domestic routes.)
Øresundsbro Konsortiet believes that, in the longer term, the assumptions for the middle scenario are the most realistic. The growth and stagnation scenarios show the span of the expected development. In some years, growth may be higher than in the growth scenario although, in the long term, developments are most likely to lie between the stagnation and growth scenarios.
19
0
10,000
20,000
30,000
40,000
50,000
60,000
Stagnation scenario
Growth scenario
Middle scenario
Actual traffic
20252020201520102005
Traffic scenarios – daily traffic across the Øresund Bridge
Number of vehicles
0
5,000
10,000
15,000
20,000
25,000
30,000
Students
Lives in DenmarkBorn in Sweden
Lives in DenmarkBorn in Denmark
Lives in SwedenBorn in Sweden
Lives in SwedenBorn in Denmark
202520202015201020052001
Number of commuters across the Øresund Bridge 2001 – 2025
20
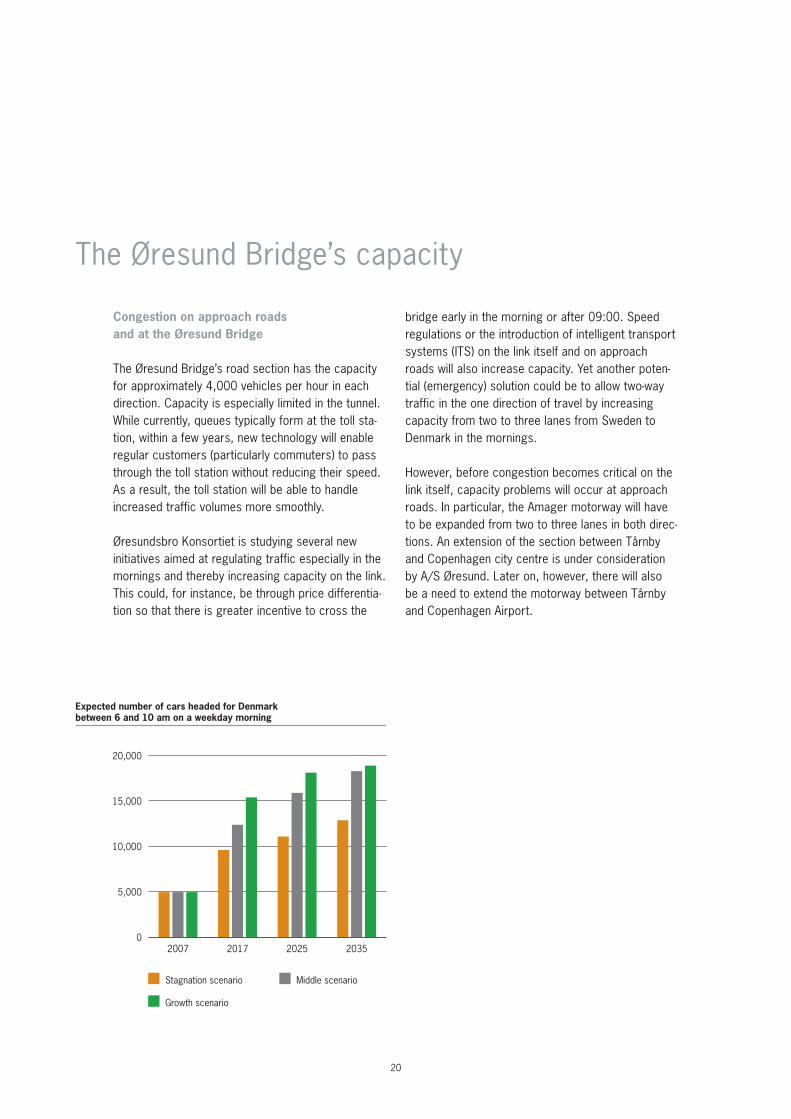
Congestion on approach roads and at the Øresund bridge
The Øresund Bridge’s road section has the capacity for approximately 4,000 vehicles per hour in each direction. Capacity is especially limited in the tunnel. While currently, queues typically form at the toll station, within a few years, new technology will enable regular customers (particularly commuters) to pass through the toll station without reducing their speed. As a result, the toll station will be able to handle increased traffic volumes more smoothly.
Øresundsbro Konsortiet is studying several new initiatives aimed at regulating traffic especially in the mornings and thereby increasing capacity on the link. This could, for instance, be through price differentiation so that there is greater incentive to cross the
bridge early in the morning or after 09:00. Speed regulations or the introduction of intelligent transport systems (ITS) on the link itself and on approach roads will also increase capacity. Yet another potential (emergency) solution could be to allow twoway traffic in the one direction of travel by increasing capacity from two to three lanes from Sweden to Denmark in the mornings.
However, before congestion becomes critical on the link itself, capacity problems will occur at approach roads. In particular, the Amager motorway will have to be expanded from two to three lanes in both directions. An extension of the section between Tårnby and Copenhagen city centre is under consideration by A/S Øresund. Later on, however, there will also be a need to extend the motorway between Tårnby and Copenhagen Airport.
The Øresund Bridge’s capacity
0
5,000
10,000
15,000
20,000
2035202520172007
Growth scenario
Middle scenarioStagnation scenario
Expected number of cars headed for Denmark between 6 and 10 am on a weekday morning
21
tions, however, will eliminate capacity problems on the bridge itself which has a capacity for 15 – 17 trains per hour in each direction. By contrast, capacity problems at Copenhagen Airport, Södra Stambanan in Scania and on certain rail sections in central Copenhagen will worsen if rail capacity is not upgraded when the number of train passengers across the Øresund Bridge trebles in the morning and afternoon.
A solution for congestion problems on the land side, for the road link as well as for the railway, is more urgent than new initiatives on the bridge itself. Extending the infrastructure to and from the bridge is, therefore, a prerequisite for further Øresund integration.
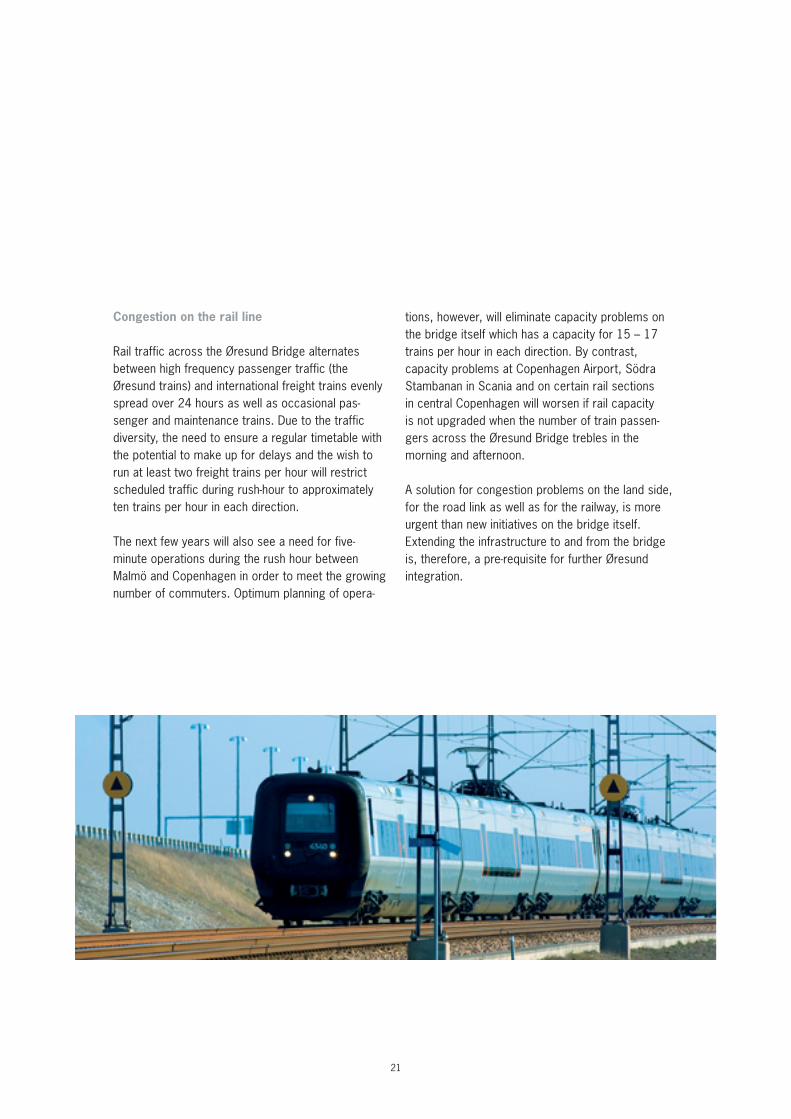
Congestion on the rail line
Rail traffic across the Øresund Bridge alternates between high frequency passenger traffic (the Øresund trains) and international freight trains evenly spread over 24 hours as well as occasional passenger and maintenance trains. Due to the traffic diversity, the need to ensure a regular timetable with the potential to make up for delays and the wish to run at least two freight trains per hour will restrict scheduled traffic during rushhour to approximately ten trains per hour in each direction.
The next few years will also see a need for fiveminute operations during the rush hour between Malmö and Copenhagen in order to meet the growing number of commuters. Optimum planning of opera
22
FinAnCing And priCeS Financing
borrowings of dkk 30 billion
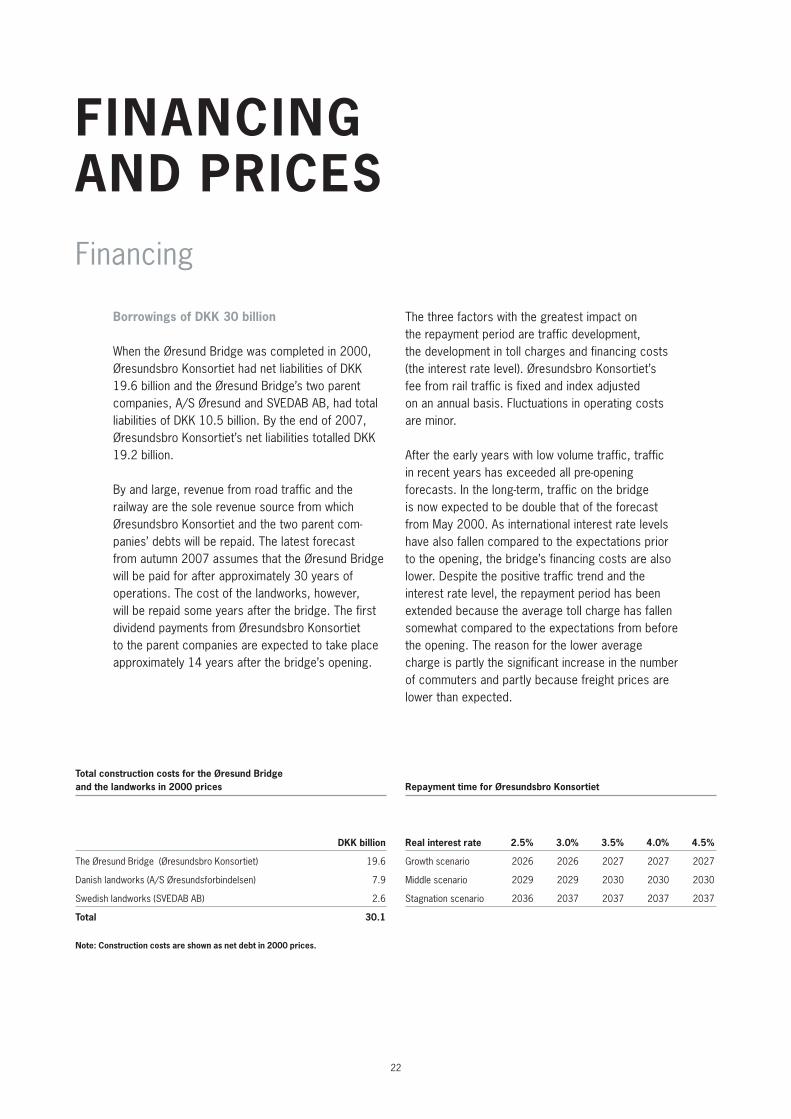
When the Øresund Bridge was completed in 2000, Øresundsbro Konsortiet had net liabilities of DKK 19.6 billion and the Øresund Bridge’s two parent companies, A/S Øresund and SVEDAB AB, had total liabilities of DKK 10.5 billion. By the end of 2007, Øresundsbro Konsortiet’s net liabilities totalled DKK 19.2 billion.
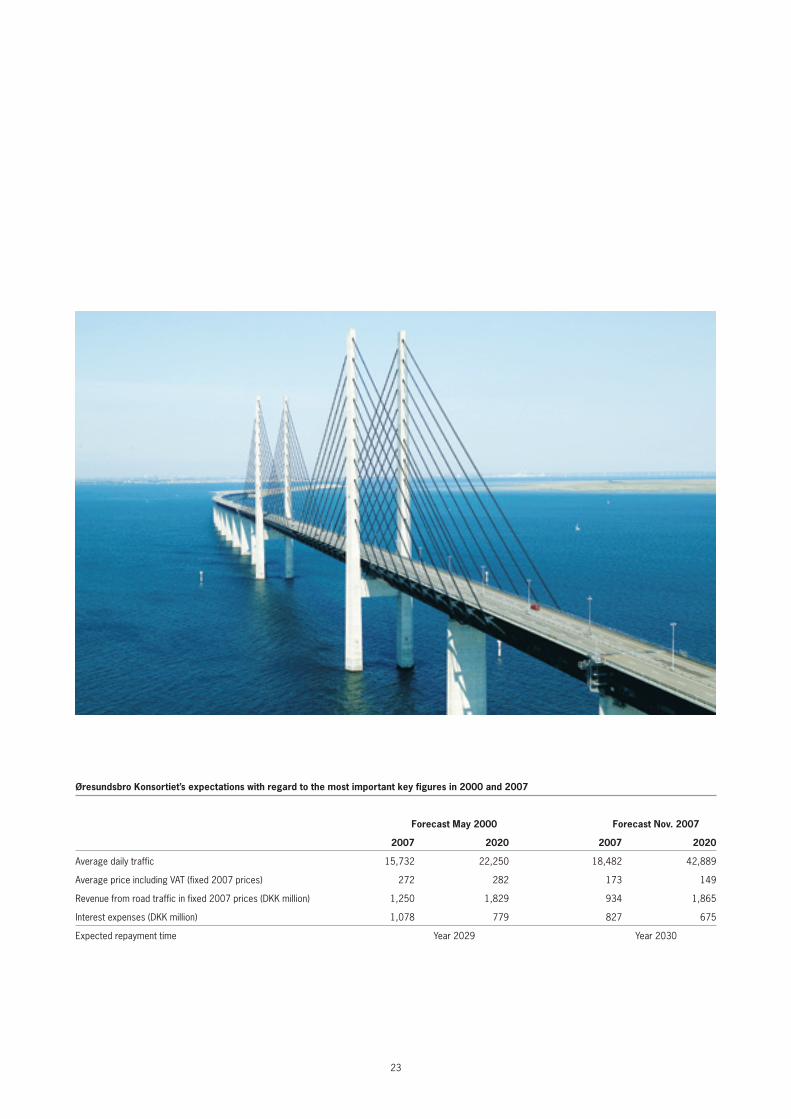
By and large, revenue from road traffic and the railway are the sole revenue source from which Øresundsbro Konsortiet and the two parent companies’ debts will be repaid. The latest forecast from autumn 2007 assumes that the Øresund Bridge will be paid for after approximately 30 years of operations. The cost of the landworks, however, will be repaid some years after the bridge. The first dividend payments from Øresundsbro Konsortiet to the parent companies are expected to take place approximately 14 years after the bridge’s opening.
The three factors with the greatest impact on the repayment period are traffic development, the development in toll charges and financing costs (the interest rate level). Øresundsbro Konsortiet’s fee from rail traffic is fixed and index adjusted on an annual basis. Fluctuations in operating costs are minor.
After the early years with low volume traffic, traffic in recent years has exceeded all preopening forecasts. In the longterm, traffic on the bridge is now expected to be double that of the forecast from May 2000. As international interest rate levels have also fallen compared to the expectations prior to the opening, the bridge’s financing costs are also lower. Despite the positive traffic trend and the interest rate level, the repayment period has been extended because the average toll charge has fallen somewhat compared to the expectations from before the opening. The reason for the lower average charge is partly the significant increase in the number of commuters and partly because freight prices are lower than expected.
Total construction costs for the Øresund bridge and the landworks in 2000 prices
dkk billion
The Øresund Bridge (Øresundsbro Konsortiet) 19.6
Danish landworks (A/S Øresundsforbindelsen) 7.9
Swedish landworks (SVEDAB AB) 2.6
Total 30.1
note: Construction costs are shown as net debt in 2000 prices.
repayment time for Øresundsbro konsortiet
real interest rate 2.5% 3.0% 3.5% 4.0% 4.5%
Growth scenario 2026 2026 2027 2027 2027
Middle scenario 2029 2029 2030 2030 2030
Stagnation scenario 2036 2037 2037 2037 2037
23
Øresundsbro konsortiet’s expectations with regard to the most important key figures in 2000 and 2007
Forecast may 2000 Forecast nov. 2007
2007 2020 2007 2020
Average daily traffic 15,732 22,250 18,482 42,889
Average price including VAT (fixed 2007 prices) 272 282 173 149
Revenue from road traffic in fixed 2007 prices (DKK million) 1,250 1,829 934 1,865
Interest expenses (DKK million) 1,078 779 827 675
Expected repayment time Year 2029 Year 2030
24
Pricing
Framework conditions for the pricing structure
Charges for using the fixed link across Øresund are determined on the basis of the following criteria:
1. The Øresund Bridge must be selffinancing, i.e. the price paid by users for crossing the link must cover all construction and operating costs, including maintenance as well as reinvestments and new investments.
2. The construction of the Øresund Bridge is financed by loans raised in national and international capital markets on the basis of the joint and several state guarantees from the two governments. Revenues must cover ongoing financing costs and secure the longterm repayment of the loans.
3. Øresundsbro Konsortiet determines the toll charges for using the bridge for the purpose of achieving longterm financial stability. VAT is paid to the two governments.
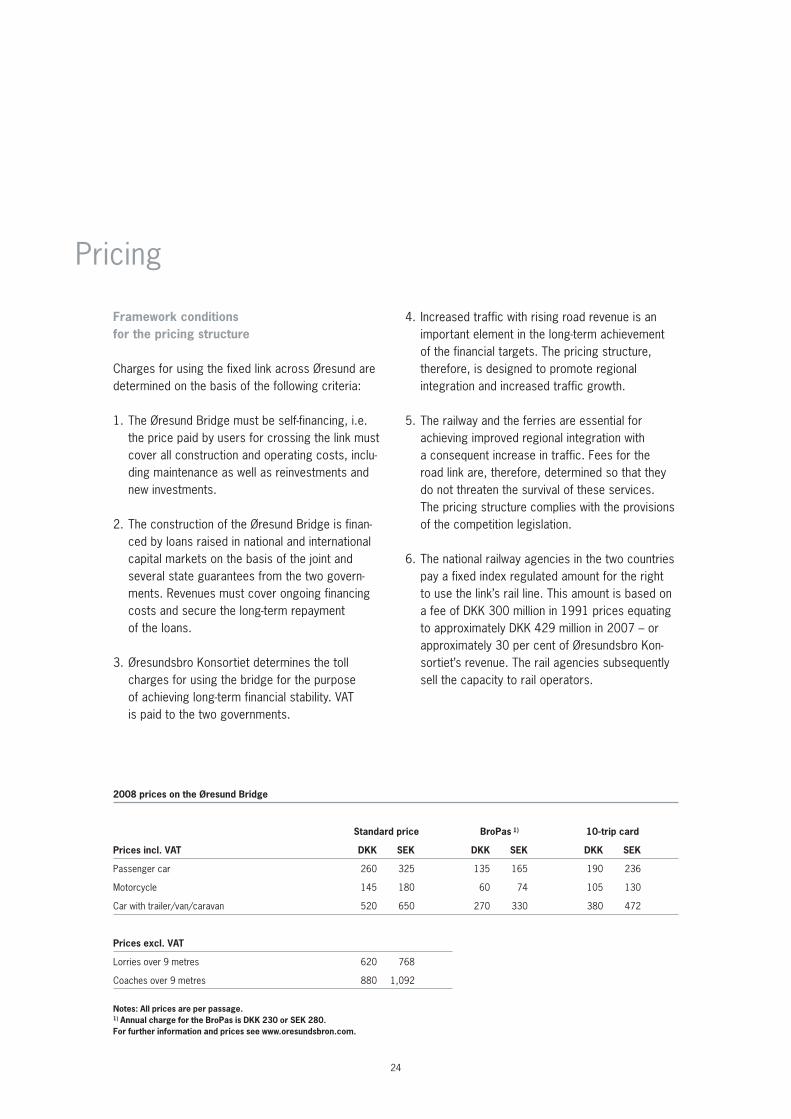
4. Increased traffic with rising road revenue is an important element in the longterm achievement of the financial targets. The pricing structure, therefore, is designed to promote regional inte gration and increased traffic growth.
5. The railway and the ferries are essential for achieving improved regional integration with a consequent increase in traffic. Fees for the road link are, therefore, determined so that they do not threaten the survival of these services. The pricing structure complies with the provisions of the competition legislation.
6. The national railway agencies in the two countries pay a fixed index regulated amount for the right to use the link’s rail line. This amount is based on a fee of DKK 300 million in 1991 prices equating to approximately DKK 429 million in 2007 – or approximately 30 per cent of Øresundsbro Konsortiet’s revenue. The rail agencies subsequently sell the capacity to rail operators.
2008 prices on the Øresund bridge
Standard price bropas 1) 10-trip card
prices incl. vAT dkk Sek dkk Sek dkk Sek
Passenger car 260 325 135 165 190 236
Motorcycle 145 180 60 74 105 130
Car with trailer/van/caravan 520 650 270 330 380 472
prices excl. vAT
Lorries over 9 metres 620 768
Coaches over 9 metres 880 1,092
notes: All prices are per passage.1) Annual charge for the bropas is dkk 230 or Sek 280. For further information and prices see www.oresundsbron.com.
25
The Øresund Bridge pricing strategy is based on the principle of financial stability and offering low prices to frequent customers. Customers can either take out a contract with Øresundsbro Konsortiet, pay cash or pay by credit card at the toll station. Contract customers benefit from discounts and fast passage through the toll station’s automatic lanes by having a brobizz (an electronic transponder).
bropasTo simplify procedures for private customers, the Øresund Bridge, in 2005, launched the BroPas product. By paying an annual subscription of DKK 230 or SEK 280, BroPas customers can cross the bridge at a fixed low price every time (DKK 135 and SEK 165, respectively). Moreover, customers have access to the Øresund Bridge advantage programme which offers special deals on events and attractions on both sides of Øresund at attractive prices. BroPas is the most attractive product for private customers who use the bridge at least once a year and not on a daily basis.
CommutersCommuters can take out a commuter contract which will always be the most advantageous product for customers who commute across the bridge on a daily basis.
Commuters pay an annual subscription and then per passage. Commuters who use the bridge 40 times per month will pay DKK 2,827 or SEK 3,455 per month or DKK 71 and SEK 86 per passage. The exact price depends on the number of journeys undertaken within one calendar month. The price is determined according to a price scale: for the first 16 passages per month, the fee is DKK 135 and SEK 165 after which the charge falls
to DKK 26 and SEK 32 per passage until the 50th trip. The price then reverts to DKK 135 and SEK 165 per passage until the start of a new month when the scheme begins once again.
Commuters who are resident in Sweden and work in Denmark also get a special Øresund allowance of DKK 50 per passage when using their car or motorcycle in addition to the normal transport allowance provided for in taxation legislation.
Commuters with a commuting contract also have access to the Øresund Bridge advantage programme.
ØresundbusinessBusiness customers who cross the bridge by passenger car, van, coach or lorry can benefit from a special business product. In this case, the customer and the Øresund Bridge agree a certain traffic volume which enables customers to cross the bridge at a fixed reduced price for the full year. When the year is over, the final price is calculated on the basis of the actual number of passages undertaken for each vehicle category. The customer subsequently receives a final invoice for the full year.
Cash and 10-trip cardsCustomers who do not wish to take out a contract can either buy 10trip cards at a discount of approximately 30 per cent on the cash price or a single ticket with no discount at the toll station.
The Øresund Bridge’s price list is publicly available and is identical for all customers. All customers are treated in the same way and the price difference is based exclusively on the customer’s actual volume and driving patterns. Read more about prices and products at www.oresundsbron.com.
Prices on the Øresund Bridge 2008

26
Environment
environmenT And SAFeTY
The environment has high priority
Rigorous environmental requirements were one of the preconditions for the establishment of the Øresund Bridge. During the construction period, comprehensive documentation was prepared and an intensive study of the Øresund environment undertaken. Øresundsbro Konsortiet’s efforts to meet the authorities’ environmental requirements have provided the company with a unique environmental profile. In their concluding report from 2001, the Danish and Swedish supervisory authorities confirmed that all requirements relating to the environmental impact in Øresund and the Baltic Sea had been complied with.
Øresundsbro Konsortiet’s studies show that natural flora and fauna have been established in the waters affected by the extensive dredging work during the construction phase. This also applies to the protective islands around the central bridge piers where,
on the concrete surfaces of the bridge piers, a layer has been established largely consisting of common mussels, algae and small crustaceans. Common mussels serve as food for fish and birds and filter the water of algae.
On Peberholm, the flora and fauna are allowed to develop without human interference and so far, over 450 different types of plants have been found. The island also has an exciting bird life, including endangered species such as the avocet and the little tern. The island is also home to the highly endangered green toad as well as rare spiders and insects.
The Øresund Bridge is subject to the environmental legislation of two countries, and a decision was taken from the start to comply with the most stringent regulations. A central requirement is that Øresundsbro Konsortiet must have an overview of its environmental impact and publish an annual environmental report. In addition, specific demands relating to the monitoring of noise conditions, discharged water from the bridge, discharge of drain water from the tunnel and the calculation of the traffic emissions of greenhouse gases have been drawn up. The Øresund Bridge has resulted in a strong reduction in the emission of greenhouse gases from traffic across Øresund as compared to the ferry services before the link was established. Exhaust fumes from traffic across the Øresund Bridge, however, are deemed to continue to have regional significance – although not to the same extent as the previous ferry services.
27
Safety
Strong focus on safety
During the construction period, a major effort was directed at risk management, including identification and handling of relevant risks to people, the environment and economic issues. To this day, this work forms the backbone for operating the Øresund Bridge from a safety perspective.
Acknowledging that risks cannot be entirely avoided or eliminated, Øresundsbro Konsortiet has drawn up criteria for acceptable risk levels – including disruption to traffic on the link and loss of life – so that the Øresund Bridge’s risk levels are reasonable and comparable with other similar traffic facilities.
In practice, this means that risks on the Øresund Bridge relating to, for instance, accidents on the road or rail section, ship or aircraft collisions with the bridge, grounding on the immersed tunnel, and accidents involving fire or hazardous goods are regularly reassessed in a risk analysis and the
result compared to the established acceptance criteria. If necessary, riskreducing measures are set in motion. As an example, the risk of motorists either reversing on the motorway or “ghost drivers” driving against the traffic flow were not originally part of the risk calculations.
Significant work, therefore, has been invested in making trips across Øresund as safe as possible for motorists and rail travellers. A number of safety measures, including surveillance cameras, dynamic signs, barriers and speed limits in the tunnel as well as a ban on overtaking by lorries across the entire link as well as the 24 hour manned traffic centre, aim at preventing accidents as far as possible. Daily operations also place higher priority on safety and contingency planning based on a preventative approach. Targets are also set to minimise the number of safetyrelated incidents.
The joint Swedish/Danish contingency plan for the Øresund Bridge and other contingency aspects, including training, exercises and evaluation of accidents on the bridge are maintained and handled through a comprehensive and sustained cooperation with and between the Danish and Swedish emergency organizations. All these initiatives will ensure maximum effort when incidents occur – as they inevitability will.
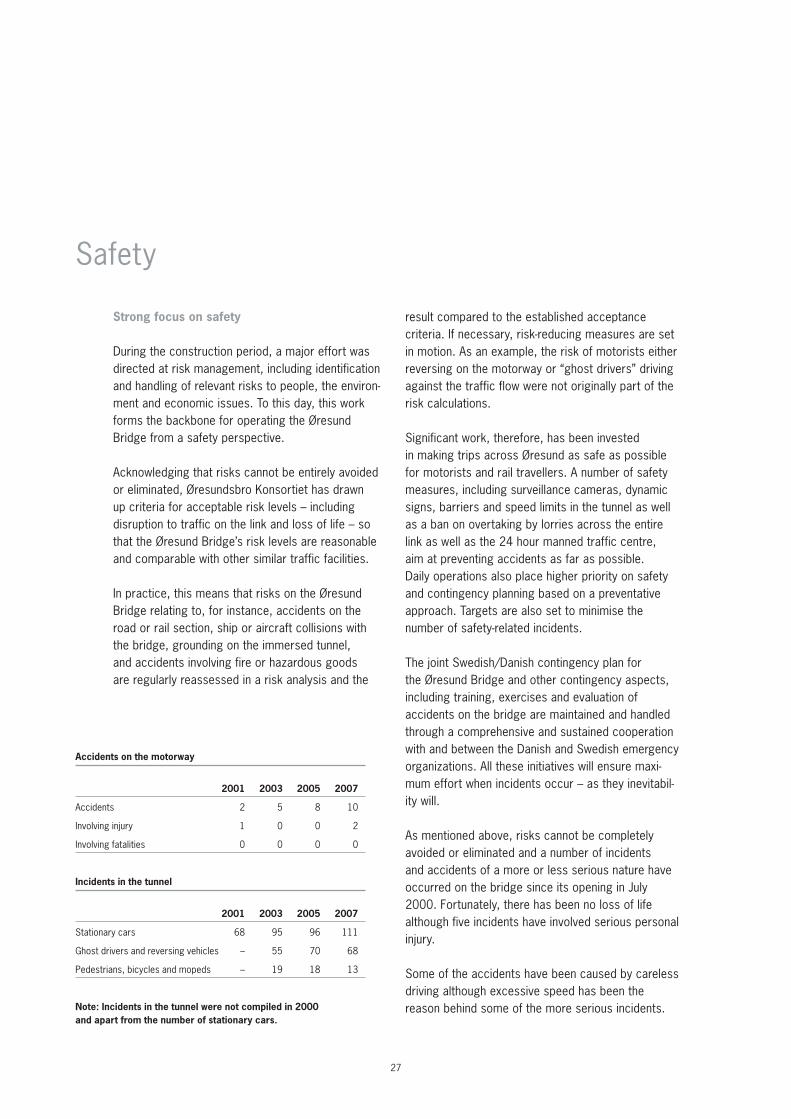
As mentioned above, risks cannot be completely avoided or eliminated and a number of incidents and accidents of a more or less serious nature have occurred on the bridge since its opening in July 2000. Fortunately, there has been no loss of life although five incidents have involved serious personal injury.
Some of the accidents have been caused by careless driving although excessive speed has been the reason behind some of the more serious incidents.
Accidents on the motorway
2001 2003 2005 2007
Accidents 2 5 8 10
Involving injury 1 0 0 2
Involving fatalities 0 0 0 0
incidents in the tunnel
2001 2003 2005 2007
Stationary cars 68 95 96 111
Ghost drivers and reversing vehicles – 55 70 68
Pedestrians, bicycles and mopeds – 19 18 13
note: incidents in the tunnel were not compiled in 2000 and apart from the number of stationary cars.
28
The ØreSund region A new European powerhouse
The opening of the Øresund Bridge cut travelling time across Øresund from one hour to ten minutes. This has created new opportunities for creating one labour and housing market across Øresund and strengthening ties between companies and organizations in the region. The vision is to create one international region around Øresund which is capable of competing with the largest and most advanced regions in Northern Europe.
With the expansion of the European Union by ten new member states in 2004, the Øresund Region acquired a central position in the EU. The region’s strategic location in the Baltic area, its highly developed infrastructure and the well functioning Swedish and Danish societies constitute a firm foundation for the creation of a future European powerhouse in the Baltic Region.
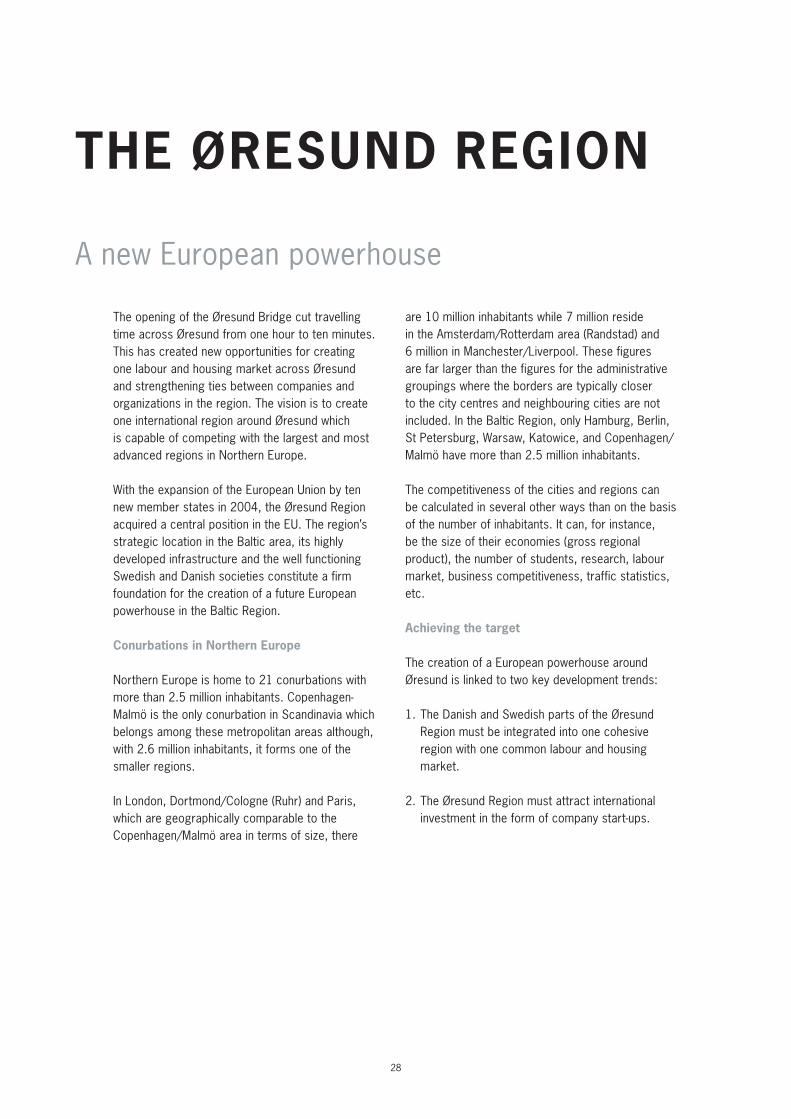
Conurbations in northern europe
Northern Europe is home to 21 conurbations with more than 2.5 million inhabitants. CopenhagenMalmö is the only conurbation in Scandinavia which belongs among these metropolitan areas although, with 2.6 million inhabitants, it forms one of the smaller regions.
In London, Dortmond/Cologne (Ruhr) and Paris, which are geographically comparable to the Copenhagen/Malmö area in terms of size, there
are 10 million inhabitants while 7 million reside in the Amsterdam/Rotterdam area (Randstad) and 6 million in Manchester/Liverpool. These figures are far larger than the figures for the administrative groupings where the borders are typically closer to the city centres and neighbouring cities are not included. In the Baltic Region, only Hamburg, Berlin, St Petersburg, Warsaw, Katowice, and Copenhagen/Malmö have more than 2.5 million inhabitants.
The competitiveness of the cities and regions can be calculated in several other ways than on the basis of the number of inhabitants. It can, for instance, be the size of their economies (gross regional product), the number of students, research, labour market, business competitiveness, traffic statistics, etc.
Achieving the target
The creation of a European powerhouse around Øresund is linked to two key development trends:
1. The Danish and Swedish parts of the Øresund Region must be integrated into one cohesive region with one common labour and housing market.
2. The Øresund Region must attract international investment in the form of company startups.
29
note: The number of inhabitants has been calculated as the number of inhabitants within a radius of 40 km from the city centres. This corresponds to an area of approximately 5,000 sq. km. Source: Øresundsbro konsortiet with data from danmarks Statistik (the national office of statistics).
The most important conurbations in northern europe
London
Dortmund-Köln
Paris
Amsterdam-Rotterdam
Manchester-Liverpool
Liege-Maastricht
Copenhagen-Malmö
Glasgow-Edinburgh
Wien-Bratislava
Nottingham-Leicester
Frankfurt
München
Warszawa
Stuttgart
Leeds-Sheffield
Hamburg
Katowice
Berlin
St. Petersburg
Birmingham
Bruxelles-Antwerpen
More than 5 million inhabitants
2.5 – 5 million inhabitants
1 – 2.5 million inhabitants
30
One cohesive region
daily life in the Øresund region
On the backdrop of an increasingly overheated Danish economy and an acute lack of manpower combined with a housing market in Copenhagen which, despite price falls over the past year, remains pricier than on the other side of Øresund, Scania has become the solution to many people’s problems.
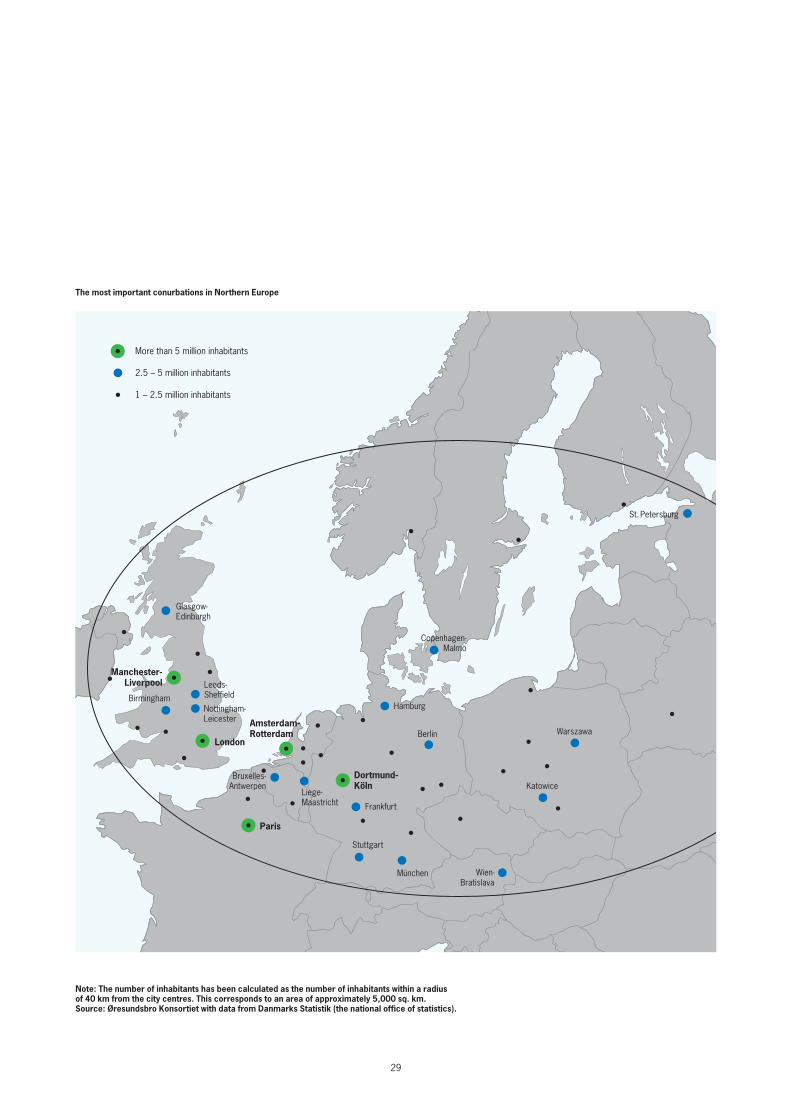
The Øresund Bridge’s integration index reveals that increasing numbers of people are dividing their daily lives between the Swedish and Danish sides and that the Øresund Region is becoming increasingly closer to achieving the goal of becoming one functional region. The integration index has more than quadrupled in seven years. The index measures the develop
ment in business and commutingrelated integration based on morning traffic on the Øresund Bridge.
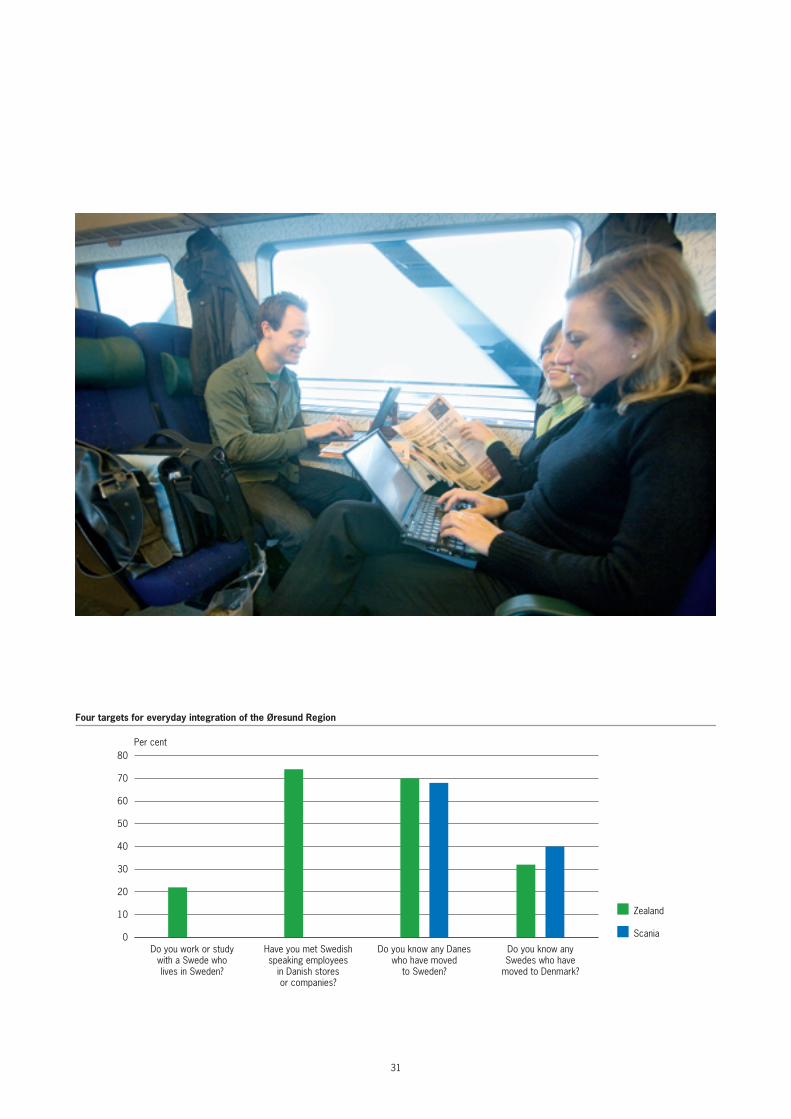
Now, eight years after the opening of the Øresund Bridge, it is quite common to know Danes who have moved to Scania or Swedes who work in Denmark. 75 per cent of the population of Zealand have come across Swedes who work in Danish shops or in Danish companies. 70 per cent know someone who has moved to Sweden, 20 per cent have Swedish colleagues and one out of three knows a Swede who lives in Denmark.
The integration of the Øresund Region is also making a clear impact on daily life in Scania. 68 per cent know a Dane who has moved to Scania while 40 per cent know a Swede who has moved to Denmark.
100
200
300
400
500
20072006200520042003200220012000
Index September 2000 = 100
The Øresund Bridge integration index
31
0
10
20
30
40
50
60
70
80
Scania
Zealand
Do you work or study with a Swede who lives in Sweden?
Have you met Swedish speaking employees
in Danish stores or companies?
Do you know any Danes who have moved
to Sweden?
Do you know any Swedes who have
moved to Denmark?
Four targets for everyday integration of the Øresund Region
Per cent
32
Commuting
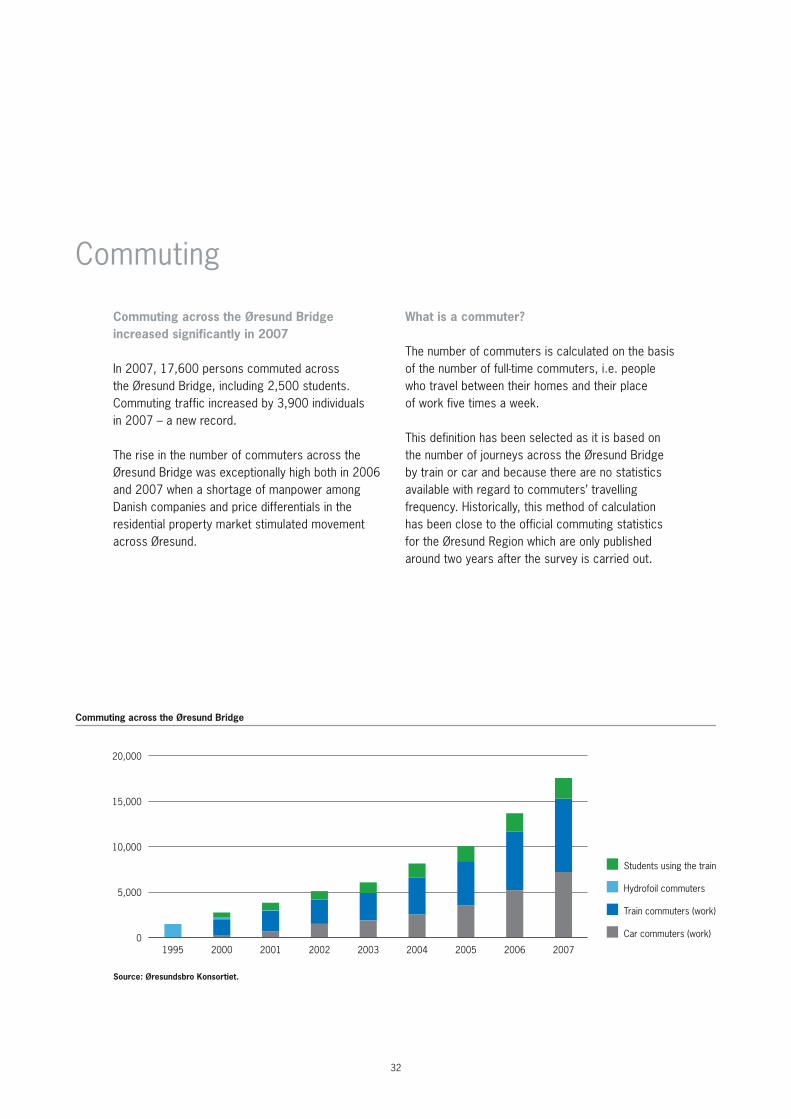
Commuting across the Øresund bridge increased significantly in 2007
In 2007, 17,600 persons commuted across the Øresund Bridge, including 2,500 students. Commuting traffic increased by 3,900 individuals in 2007 – a new record.
The rise in the number of commuters across the Øresund Bridge was exceptionally high both in 2006 and 2007 when a shortage of manpower among Danish companies and price differentials in the residential property market stimulated movement across Øresund.
what is a commuter?
The number of commuters is calculated on the basis of the number of fulltime commuters, i.e. people who travel between their homes and their place of work five times a week.
This definition has been selected as it is based on the number of journeys across the Øresund Bridge by train or car and because there are no statistics available with regard to commuters’ travelling frequency. Historically, this method of calculation has been close to the official commuting statistics for the Øresund Region which are only published around two years after the survey is carried out.
0
5,000
10,000
15,000
20,000
Students using the train
Hydrofoil commuters
Train commuters (work)
Car commuters (work)
200720062005200420032002200120001995
Commuting across the Øresund Bridge
Source: Øresundsbro Konsortiet.
33
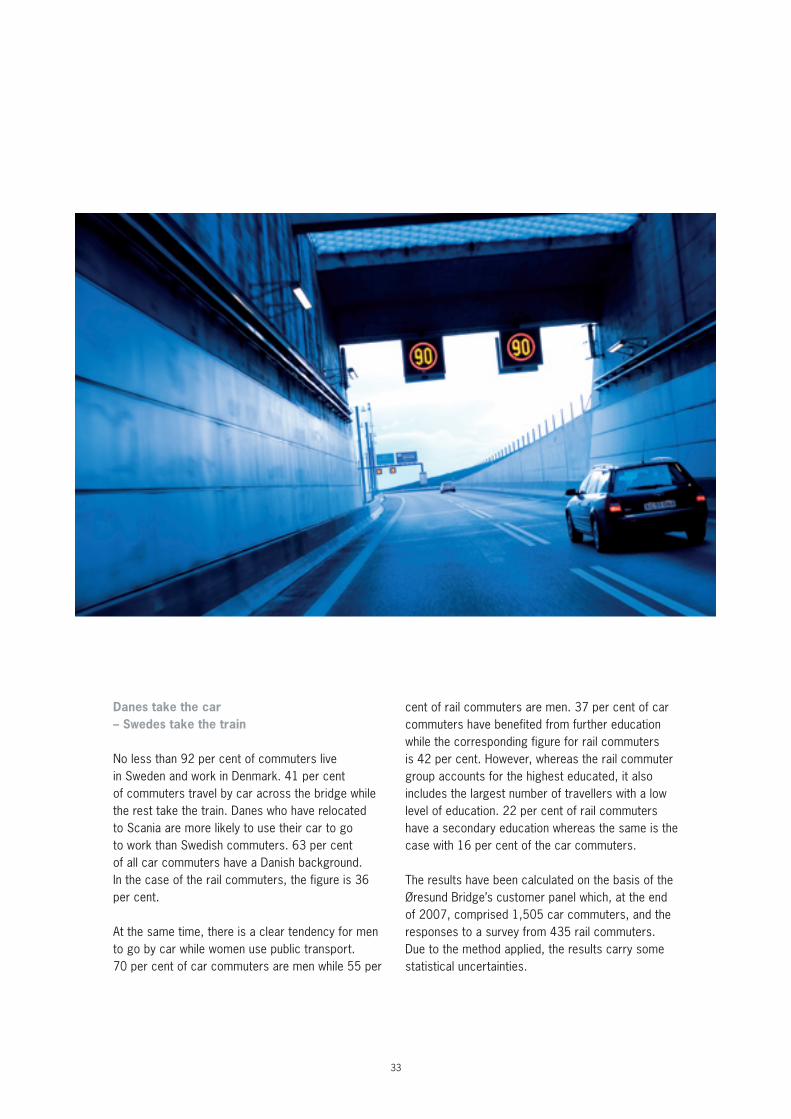
danes take the car – Swedes take the train
No less than 92 per cent of commuters live in Sweden and work in Denmark. 41 per cent of commuters travel by car across the bridge while the rest take the train. Danes who have relocated to Scania are more likely to use their car to go to work than Swedish commuters. 63 per cent of all car commuters have a Danish background. In the case of the rail commuters, the figure is 36 per cent.
At the same time, there is a clear tendency for men to go by car while women use public transport. 70 per cent of car commuters are men while 55 per
cent of rail commuters are men. 37 per cent of car commuters have benefited from further education while the corresponding figure for rail commuters is 42 per cent. However, whereas the rail commuter group accounts for the highest educated, it also includes the largest number of travellers with a low level of education. 22 per cent of rail commuters have a secondary education whereas the same is the case with 16 per cent of the car commuters.
The results have been calculated on the basis of the Øresund Bridge’s customer panel which, at the end of 2007, comprised 1,505 car commuters, and the responses to a survey from 435 rail commuters. Due to the method applied, the results carry some statistical uncertainties.
34
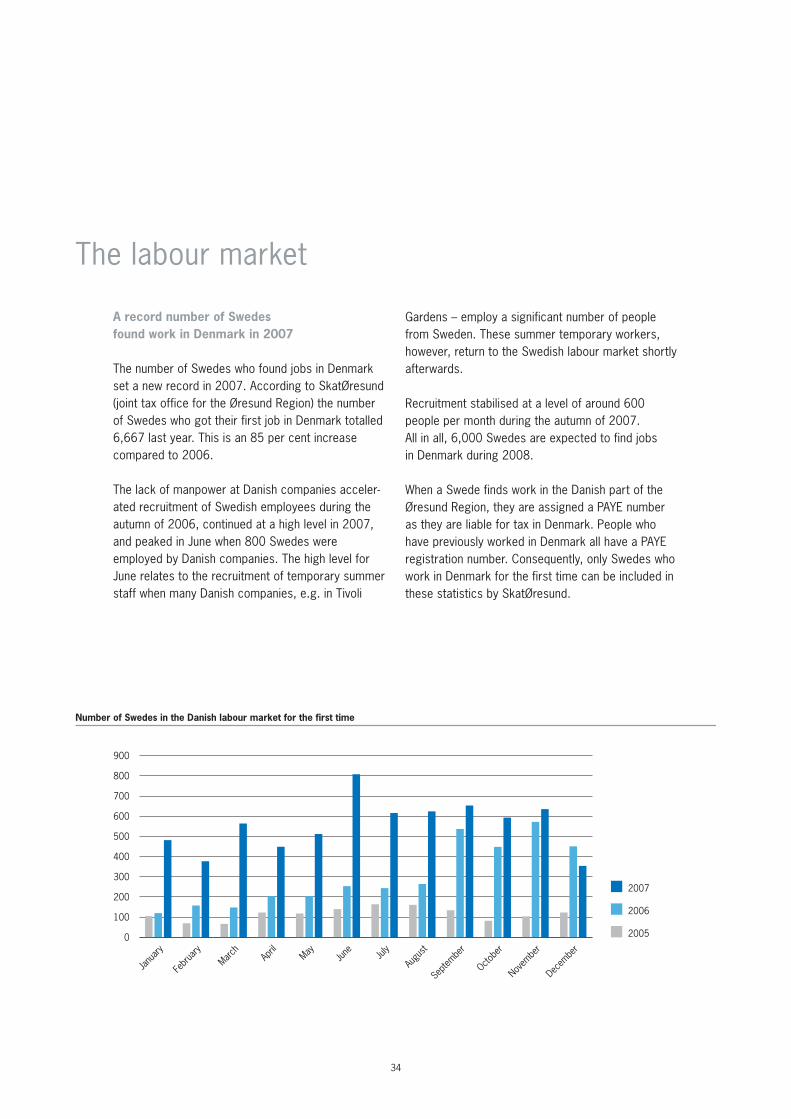
A record number of Swedes found work in denmark in 2007
The number of Swedes who found jobs in Denmark set a new record in 2007. According to SkatØresund (joint tax office for the Øresund Region) the number of Swedes who got their first job in Denmark totalled 6,667 last year. This is an 85 per cent increase compared to 2006.
The lack of manpower at Danish companies accelerated recruitment of Swedish employees during the autumn of 2006, continued at a high level in 2007, and peaked in June when 800 Swedes were employed by Danish companies. The high level for June relates to the recruitment of temporary summer staff when many Danish companies, e.g. in Tivoli
The labour market
Gardens – employ a significant number of people from Sweden. These summer temporary workers, however, return to the Swedish labour market shortly afterwards.
Recruitment stabilised at a level of around 600 people per month during the autumn of 2007. All in all, 6,000 Swedes are expected to find jobs in Denmark during 2008.
When a Swede finds work in the Danish part of the Øresund Region, they are assigned a PAYE number as they are liable for tax in Denmark. People who have previously worked in Denmark all have a PAYE registration number. Consequently, only Swedes who work in Denmark for the first time can be included in these statistics by SkatØresund.
0
100
200
300
400
500
600
700
800
900
2007
2006
2005
Decem
ber
Novem
ber
Octobe
r
Septe
mber
Augu
stJuly
JuneMay
April
March
Febr
uary
Janu
ary
Number of Swedes in the Danish labour market for the first time
35
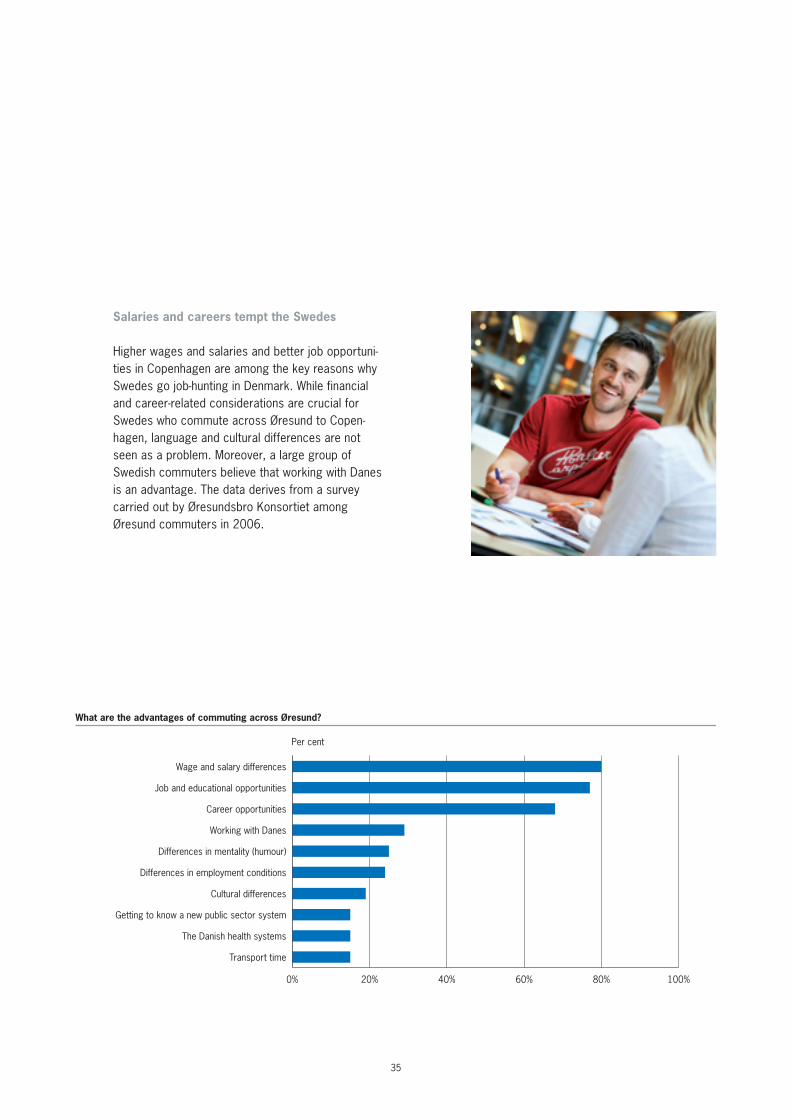
Salaries and careers tempt the Swedes
Higher wages and salaries and better job opportunities in Copenhagen are among the key reasons why Swedes go jobhunting in Denmark. While financial and careerrelated considerations are crucial for Swedes who commute across Øresund to Copenhagen, language and cultural differences are not seen as a problem. Moreover, a large group of Swedish commuters believe that working with Danes is an advantage. The data derives from a survey carried out by Øresundsbro Konsortiet among Øresund commuters in 2006.
0% 20% 40% 60% 80% 100%
Transport time
The Danish health systems
Getting to know a new public sector system
Cultural differences
Differences in employment conditions
Differences in mentality (humour)
Working with Danes
Career opportunities
Job and educational opportunities
Wage and salary differences
Per cent
What are the advantages of commuting across Øresund?
36
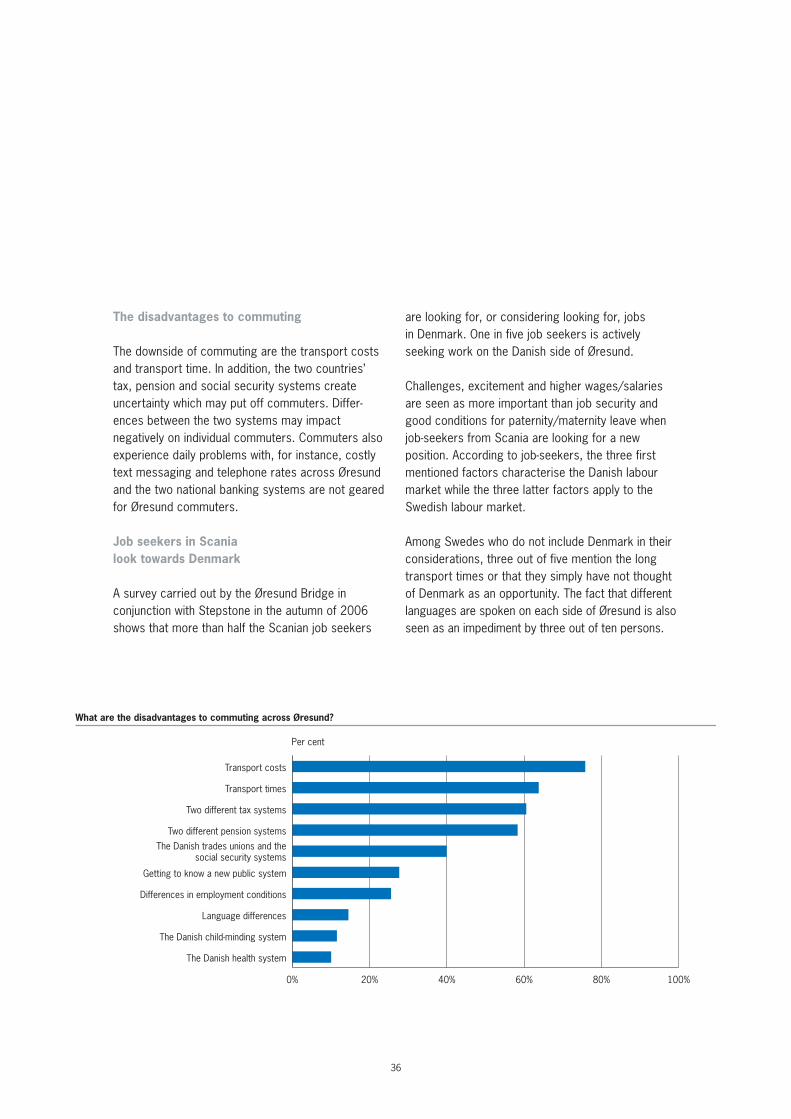
The disadvantages to commuting
The downside of commuting are the transport costs and transport time. In addition, the two countries’ tax, pension and social security systems create uncertainty which may put off commuters. Differences between the two systems may impact negatively on individual commuters. Commuters also experience daily problems with, for instance, costly text messaging and telephone rates across Øresund and the two national banking systems are not geared for Øresund commuters.
Job seekers in Scania look towards denmark
A survey carried out by the Øresund Bridge in conjunction with Stepstone in the autumn of 2006 shows that more than half the Scanian job seekers
are looking for, or considering looking for, jobs in Denmark. One in five job seekers is actively seeking work on the Danish side of Øresund.
Challenges, excitement and higher wages/salaries are seen as more important than job security and good conditions for paternity/maternity leave when jobseekers from Scania are looking for a new position. According to jobseekers, the three first mentioned factors characterise the Danish labour market while the three latter factors apply to the Swedish labour market.
Among Swedes who do not include Denmark in their considerations, three out of five mention the long transport times or that they simply have not thought of Denmark as an opportunity. The fact that different languages are spoken on each side of Øresund is also seen as an impediment by three out of ten persons.
0% 20% 40% 60% 80% 100%
The Danish health system
The Danish child-minding system
Language differences
Differences in employment conditions
Getting to know a new public system
The Danish trades unions and the social security systems
Two different pension systems
Two different tax systems
Transport times
Transport costs
What are the disadvantages to commuting across Øresund?
Per cent
37
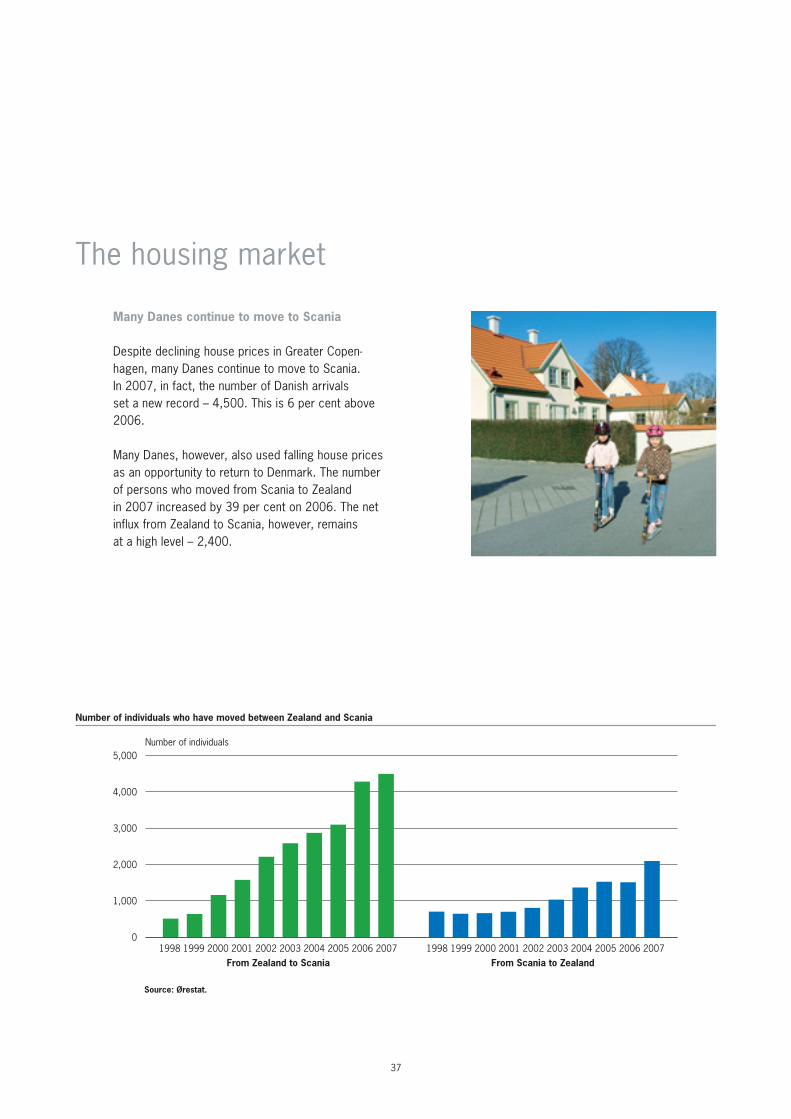
many danes continue to move to Scania
Despite declining house prices in Greater Copenhagen, many Danes continue to move to Scania. In 2007, in fact, the number of Danish arrivals set a new record – 4,500. This is 6 per cent above 2006.
Many Danes, however, also used falling house prices as an opportunity to return to Denmark. The number of persons who moved from Scania to Zealand in 2007 increased by 39 per cent on 2006. The net influx from Zealand to Scania, however, remains at a high level – 2,400.
The housing market
0
1,000
2,000
3,000
4,000
5,000
From Scania to Zealand From Zealand to Scania2007200620052004200320022001200019991998 2007200620052004200320022001200019991998
Number of individuals who have moved between Zealand and Scania
Number of individuals
Source: Ørestat.
38
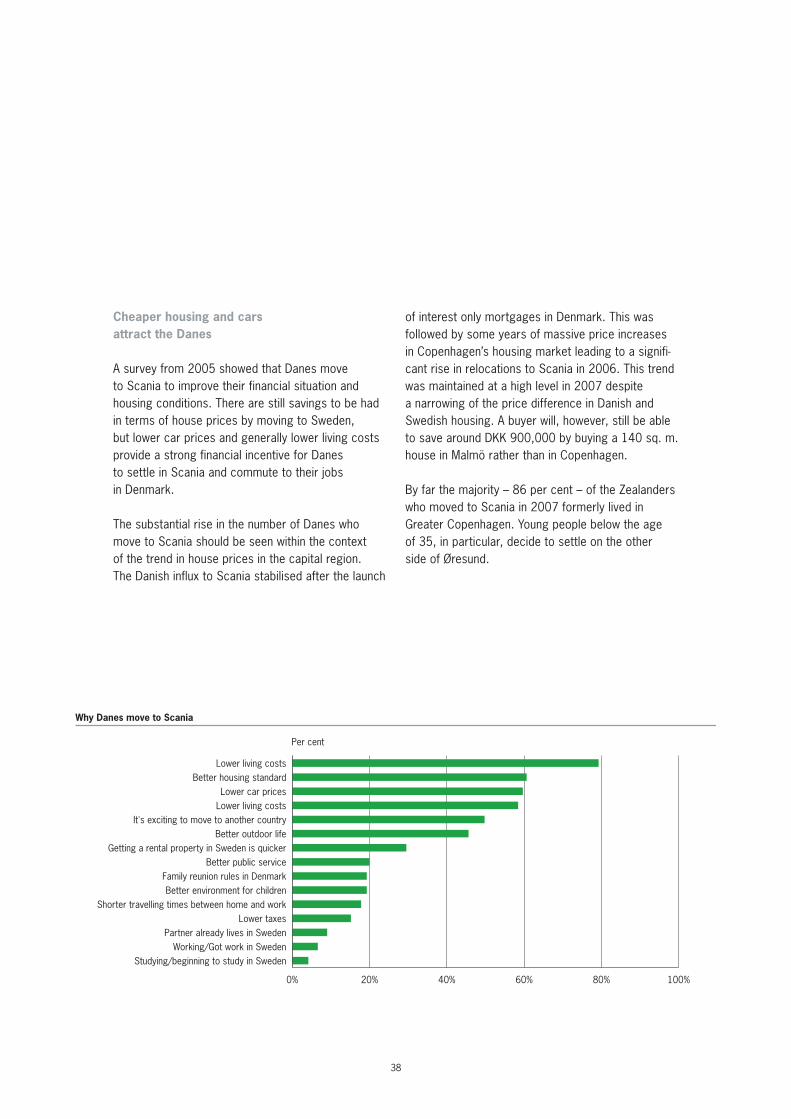
Cheaper housing and cars attract the danes
A survey from 2005 showed that Danes move to Scania to improve their financial situation and housing conditions. There are still savings to be had in terms of house prices by moving to Sweden, but lower car prices and generally lower living costs provide a strong financial incentive for Danes to settle in Scania and commute to their jobs in Denmark.
The substantial rise in the number of Danes who move to Scania should be seen within the context of the trend in house prices in the capital region. The Danish influx to Scania stabilised after the launch
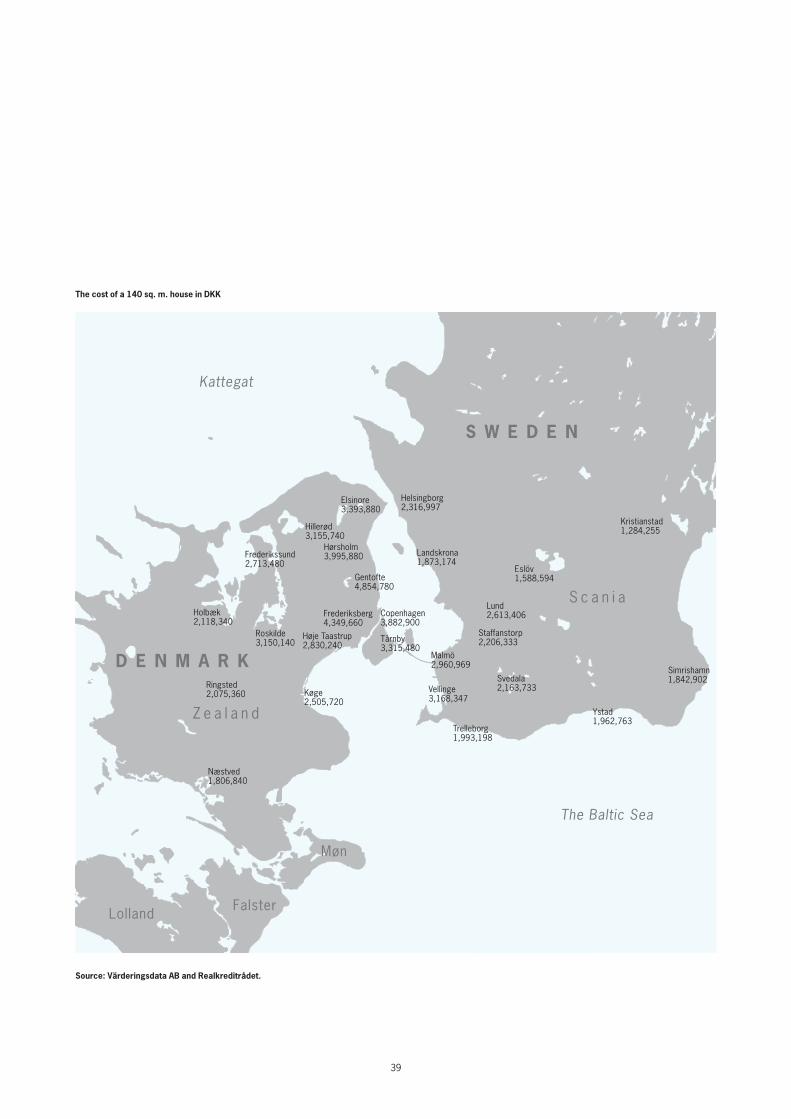
of interest only mortgages in Denmark. This was followed by some years of massive price increases in Copenhagen’s housing market leading to a significant rise in relocations to Scania in 2006. This trend was maintained at a high level in 2007 despite a narrowing of the price difference in Danish and Swedish housing. A buyer will, however, still be able to save around DKK 900,000 by buying a 140 sq. m. house in Malmö rather than in Copenhagen.
By far the majority – 86 per cent – of the Zealanders who moved to Scania in 2007 formerly lived in Greater Copenhagen. Young people below the age of 35, in particular, decide to settle on the other side of Øresund.
0% 20% 40% 60% 80% 100%
Studying/beginning to study in SwedenWorking/Got work in Sweden
Partner already lives in SwedenLower taxes
Shorter travelling times between home and workBetter environment for children
Family reunion rules in DenmarkBetter public service
Getting a rental property in Sweden is quickerBetter outdoor life
It's exciting to move to another countryLower living costsLower car prices
Better housing standardLower living costs
Per cent
Why Danes move to Scania
39
Source: värderingsdata Ab and realkreditrådet.
The cost of a 140 sq. m. house in dkk
Copenhagen3,882,900
Malmö2,960,969
Lund2,613,406
Ystad1,962,763
Trelleborg1,993,198
Kristianstad1,284,255
Roskilde3,150,140
Næstved1,806,840
Køge2,505,720
Landskrona1,873,174
Helsingborg2,316,997
Elsinore3,393,880
Eslöv1,588,594
Staffanstorp2,206,333
Simrishamn1,842,902Svedala
2,163,733Vellinge3,168,347
Tårnby3,315,480
Hillerød3,155,740
Hørsholm3,995,880Frederikssund
2,713,480
Gentofte4,854,780
Holbæk2,118,340
Høje Taastrup2,830,240
Frederiksberg4,349,660
Ringsted2,075,360
Kattegat
Bornholm
Møn
The Baltic Sea
d e n m A r k
S w e d e n
Z e a l a n d
FalsterLolland
F y n
S c a n i a
40
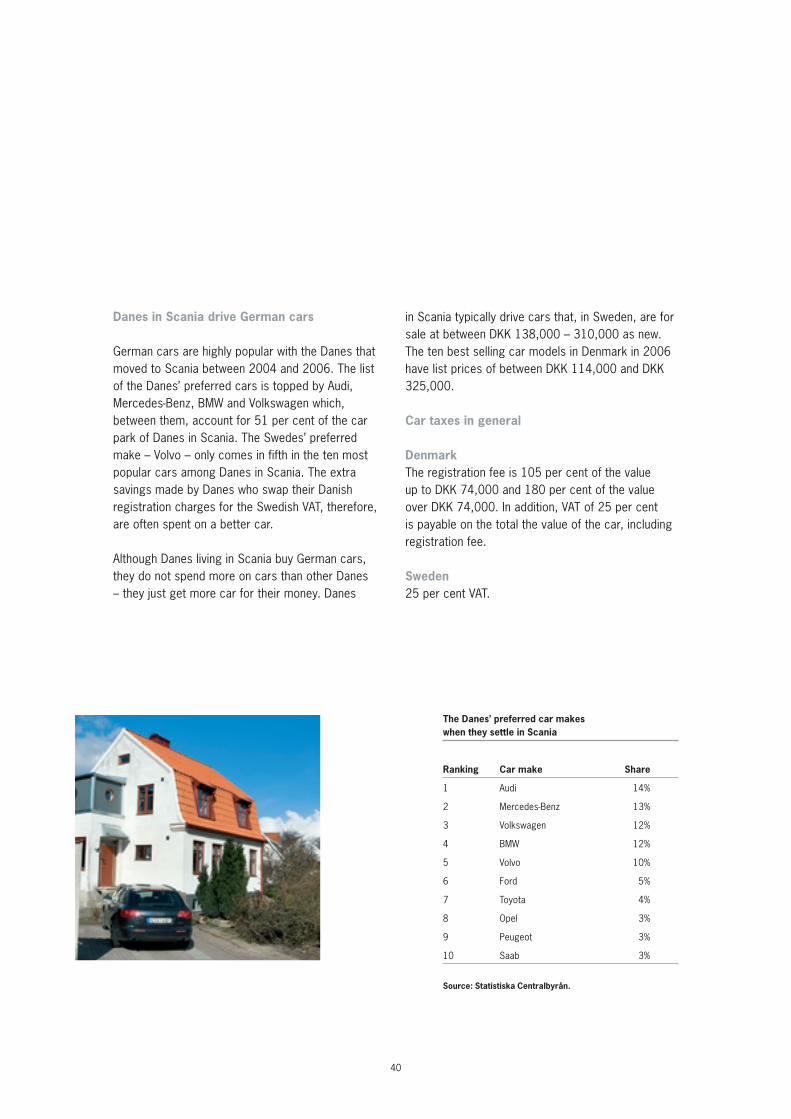
danes in Scania drive german cars
German cars are highly popular with the Danes that moved to Scania between 2004 and 2006. The list of the Danes’ preferred cars is topped by Audi, MercedesBenz, BMW and Volkswagen which, between them, account for 51 per cent of the car park of Danes in Scania. The Swedes’ preferred make – Volvo – only comes in fifth in the ten most popular cars among Danes in Scania. The extra savings made by Danes who swap their Danish registration charges for the Swedish VAT, therefore, are often spent on a better car.
Although Danes living in Scania buy German cars, they do not spend more on cars than other Danes – they just get more car for their money. Danes
in Scania typically drive cars that, in Sweden, are for sale at between DKK 138,000 – 310,000 as new. The ten best selling car models in Denmark in 2006 have list prices of between DKK 114,000 and DKK 325,000.
Car taxes in general
denmarkThe registration fee is 105 per cent of the value up to DKK 74,000 and 180 per cent of the value over DKK 74,000. In addition, VAT of 25 per cent is payable on the total the value of the car, including registration fee.
Sweden25 per cent VAT.
The danes’ preferred car makes when they settle in Scania
ranking Car make Share
1 Audi 14%
2 MercedesBenz 13%
3 Volkswagen 12%
4 BMW 12%
5 Volvo 10%
6 Ford 5%
7 Toyota 4%
8 Opel 3%
9 Peugeot 3%
10 Saab 3%
Source: Statistiska Centralbyrån.
41
Commuters’ experiences with the health services
When you live in one country and work in another, daily life has to function well. Situations that normally run smoothly when you live and work in the same country should not be made more difficult when you work on the other side of the border. The health system is one such area. As a resident of one country with employment in another, Øresund commuters can choose between the Swedish and the Danish health services.
A survey carried out by the Øresund Bridge in 2007 shows that force of habit is paramount when Øresund commuters choose health systems. By and large, Danes choose to remain in the Danish health system after having moved to Sweden, while Swedes mainly choose to stay in the Swedish system while they work in Denmark.
Using the health system in the country where you work, however, is not without its problems. 38 per cent of the survey’s respondents who live in Sweden and use the Danish health system have experienced problems. To a significant extent, these problems relate to the fact that neither the commuters concerned nor the staff in the relevant health system are sufficiently knowledgeable about commuters’ rights or about how to correctly place the commuter patient into the system. One of the consequences is that one in five has been refused treatment
or rejected because they live in another country. A further problem, which 15 per cent of users of the Danish health service have encountered, is that they have been faced with a demand for payment in an otherwise free Danish system. Both problems are typical examples of the considerable ignorance about border commuters’ rights and how they should be handled within the administrative systems.
Respondents who live in Sweden and use the Swedish health system have not experienced problems to a similar extent.
The results are from a survey that was carried out in December 2007 among the Øresund Bridge’s regional panel comprising 1,140 car and train commuters. 647 of the 1,140 participants responded to the survey.
42
The Øresund university
The Øresund University is a partnership between the Øresund Region’s 12 universities throughout the region. The Øresund University was founded by the universities themselves in 1992 with the aim of becoming Europe’s leading transnational university.
Between them, the 12 universities under the Øresund University have:
– 150,000 students– 14,000 researchers and teachers.
Øresund partnerships
Øresund Science region – a unique organization
The Øresund Science Region is a triplehelix organization (a collaborative effort between the world of science, business and the public sector) which brings business, the academic world and the public sector together in a new type of organization. What makes the Øresund Science Region special is the fact that the organization is rooted in regional crossborder collaboration.
Founded in 2001 by the Øresund University, the Øresund Science Region currently comprises five platforms. The first platform, Medicon Valley Academy, was founded in 1997 as an Interreg II A project but is now financed by contributions from its members. The Øresund Food Network, the Øresund IT Academy and the Øresund Environment Academy joined in 2001. Øresund Logistics, the most recent platform, joined in 2003.
43
The Øresund region – the world’s most attractive border region for companies
For the third year running, the Economist Intelligence Unit (EIU) has named Denmark as the world’s best country for company startups, investment and doing business. Sweden is ranked 11th in the survey. On the backdrop of these two impressive rankings, the Øresund Region, which covers parts of the two countries, can be considered the world’s most attractive border region for companies.
The top ranking given to Denmark reflects the country’s stable economy, flexible labour market, well functioning transport and communication infrastructure and favourable financing opportunities for businesses. The local workforce is well educated and low corporate taxation makes the region even more attractive.
EIU concludes that Denmark is highly attractive for both American and European investors focusing on Scandinavia. Denmark’s location close to the other Nordic countries, Germany and the Baltic nations makes it a natural logistics hub, writes EIU.
In the competition for international investment in Scandinavia between Stockholm and Copenhagen, one of Copenhagen’s advantages is its closeness to both the Danish and Swedish markets.
International investments
44
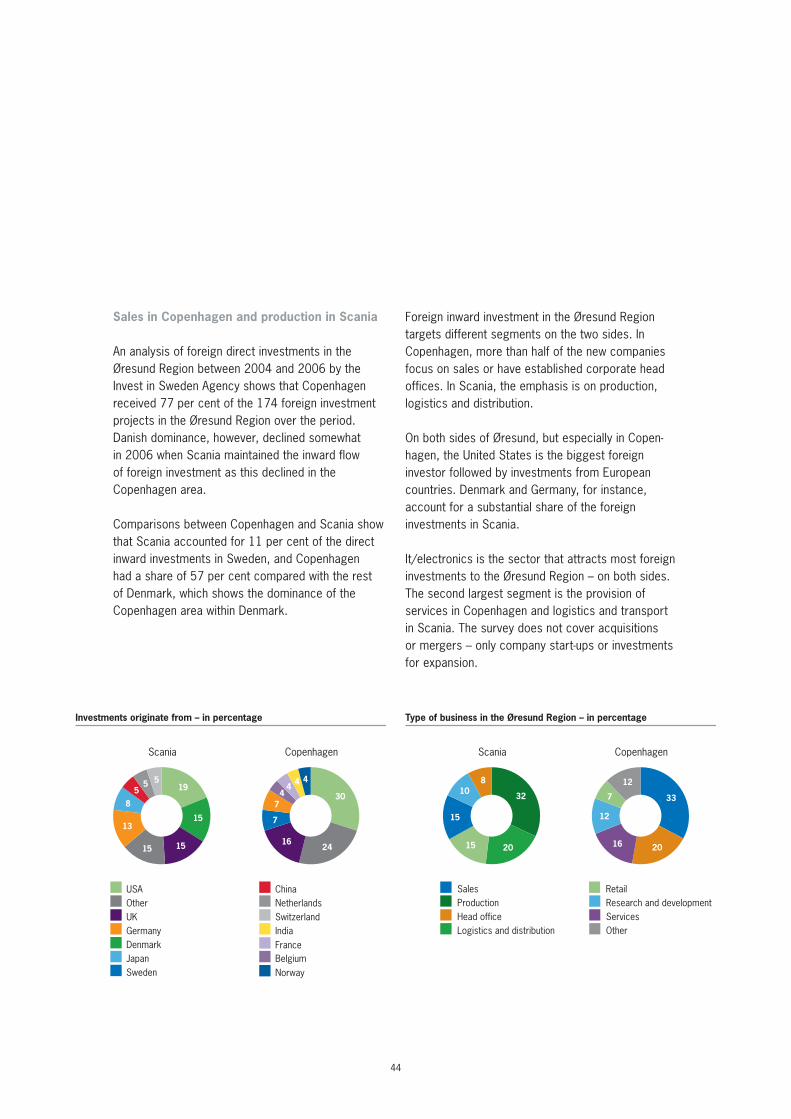
Sales in Copenhagen and production in Scania
An analysis of foreign direct investments in the Øresund Region between 2004 and 2006 by the Invest in Sweden Agency shows that Copenhagen received 77 per cent of the 174 foreign investment projects in the Øresund Region over the period. Danish dominance, however, declined somewhat in 2006 when Scania maintained the inward flow of foreign investment as this declined in the Copen hagen area.
Comparisons between Copenhagen and Scania show that Scania accounted for 11 per cent of the direct inward investments in Sweden, and Copenhagen had a share of 57 per cent compared with the rest of Denmark, which shows the dominance of the Copenhagen area within Denmark.
Foreign inward investment in the Øresund Region targets different segments on the two sides. In Copenhagen, more than half of the new companies focus on sales or have established corporate head offices. In Scania, the emphasis is on production, logistics and distribution.
On both sides of Øresund, but especially in Copenhagen, the United States is the biggest foreign investor followed by investments from European countries. Denmark and Germany, for instance, account for a substantial share of the foreign investments in Scania.
It/electronics is the sector that attracts most foreign investments to the Øresund Region – on both sides. The second largest segment is the provision of services in Copenhagen and logistics and transport in Scania. The survey does not cover acquisitions or mergers – only company startups or investments for expansion.
SwitzerlandNetherlandsChina
Japan
Germany
OtherUK
Denmark
Norway
IndiaFranceBelgium
Sweden
USA
444
4
7
7
1624
Scania Copenhagen
305
58
5
15
13
15
15
19
Investments originate from – in percentage
Head officeResearch and developmentRetail
Logistics and distribution
Production
OtherServices
Sales
20
8
15
10
15 12
20
33
16
12
32 7
Scania Copenhagen
Type of business in the Øresund Region – in percentage
45
46
The population welcomes the border region
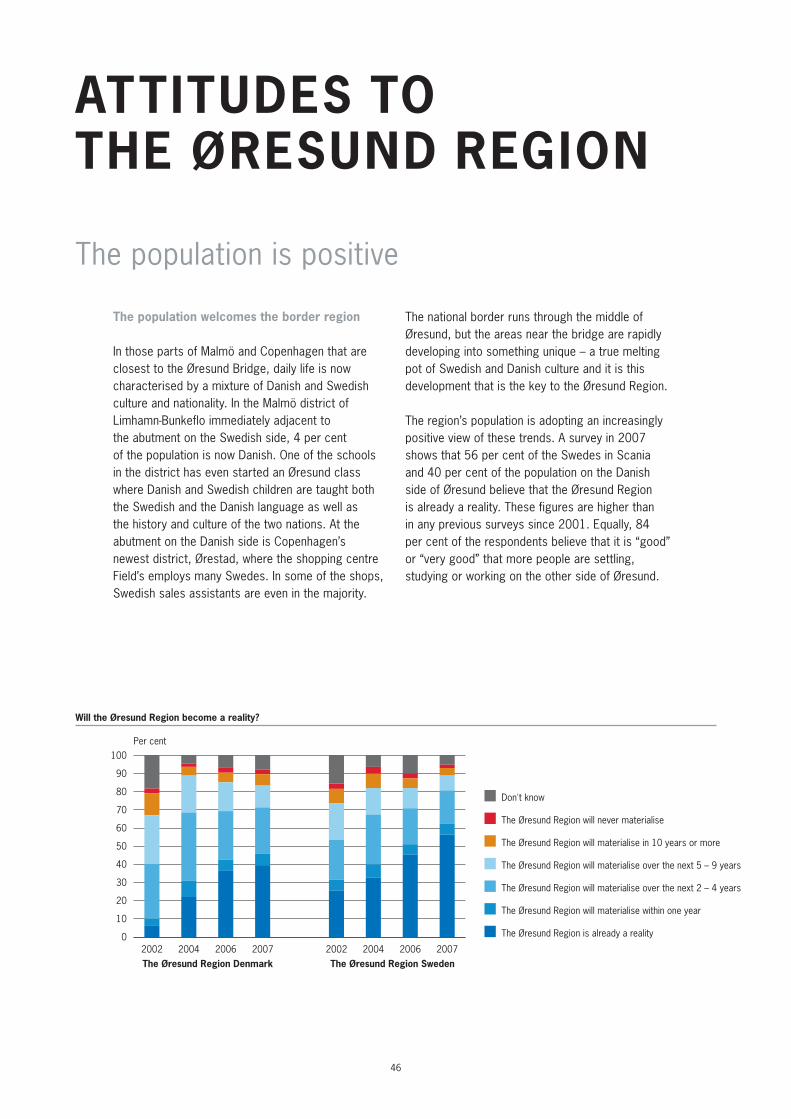
In those parts of Malmö and Copenhagen that are closest to the Øresund Bridge, daily life is now characterised by a mixture of Danish and Swedish culture and nationality. In the Malmö district of LimhamnBunkeflo immediately adjacent to the abutment on the Swedish side, 4 per cent of the population is now Danish. One of the schools in the district has even started an Øresund class where Danish and Swedish children are taught both the Swedish and the Danish language as well as the history and culture of the two nations. At the abutment on the Danish side is Copenhagen’s newest district, Ørestad, where the shopping centre Field’s employs many Swedes. In some of the shops, Swedish sales assistants are even in the majority.
The national border runs through the middle of Øresund, but the areas near the bridge are rapidly developing into something unique – a true melting pot of Swedish and Danish culture and it is this development that is the key to the Øresund Region.
The region’s population is adopting an increasingly positive view of these trends. A survey in 2007 shows that 56 per cent of the Swedes in Scania and 40 per cent of the population on the Danish side of Øresund believe that the Øresund Region is already a reality. These figures are higher than in any previous surveys since 2001. Equally, 84 per cent of the respondents believe that it is “good” or “very good” that more people are settling, studying or working on the other side of Øresund.
The population is positive
ATTiTudeS To The ØreSund region
0
10
20
30
40
50
60
70
80
90
100
Don't know
The Øresund Region will never materialise
The Øresund Region will materialise in 10 years or more
The Øresund Region will materialise over the next 5 – 9 years
The Øresund Region will materialise over the next 2 – 4 years
The Øresund Region will materialise within one year
The Øresund Region is already a reality
20072006200420022007200620042002
The Øresund Region Denmark The Øresund Region Sweden
Will the Øresund Region become a reality?
Per cent
47
decision-makers believe in the Øresund region’s potential
The Øresund Region’s potential for becoming a Northern European powerhouse is good. This is the view of 90 per cent of the region’s decisionmakers who took part in a survey in 2007 in which 265 business leaders, politicians, journalists, senior civil servants, stakeholders, and other interested parties replied to a questionnaire about the Øresund Region’s future potential.
An improved infrastructure is mentioned by the majority of the decisionmakers as an important focus area if the Øresund Region is to become a leading Northern European centre. Enhanced international specialization in core competencies and stronger international marketing of the region are also high on the list.
90 per cent of the survey’s respondents, however, also emphasise the need to join forces across Øresund and share in a common commitment before the goal of establishing the Øresund Region as a leading Northern European centre can be achieved.
48
The business sector’s experience
The business sector’s expectations are met
The Øresund Bridge’s business customers have positive experiences from their activities on the other side of Øresund. In a survey from 2006, 75 per cent of the companies confirm that their expectations with regard to their involvement on the other side of the Øresund have been met. In this respect, there are only minor differences between Danish and Swedish companies. Within the individual sectors, it is the pharmaceutical and biotech industries, media and communication, and public and semipublic organizations that have, in particular, seen their expectations fulfilled. More than 80 per cent of the companies in these segments believe that their expectations have been met.
Besides having had their expectations fulfilled, these companies have also performed well in business terms. 55 per cent of all companies in the survey report that their involvement on the other side of Øresund has impacted positively on the bottom line. Those companies that have taken the full step and started up on the other side of Øresund have done best. 70 per cent of the Swedish companies that have established themselves in Denmark and 60 per cent of the Danish companies that have gone in the opposite direction have improved their results following their move across Øresund.
The majority of the companies have sales activities on the other side while 15 per cent have established subsidiaries. 32 per cent of the companies have additional activities which cover a broad range – from courses to transport to and from Kastrup.

49
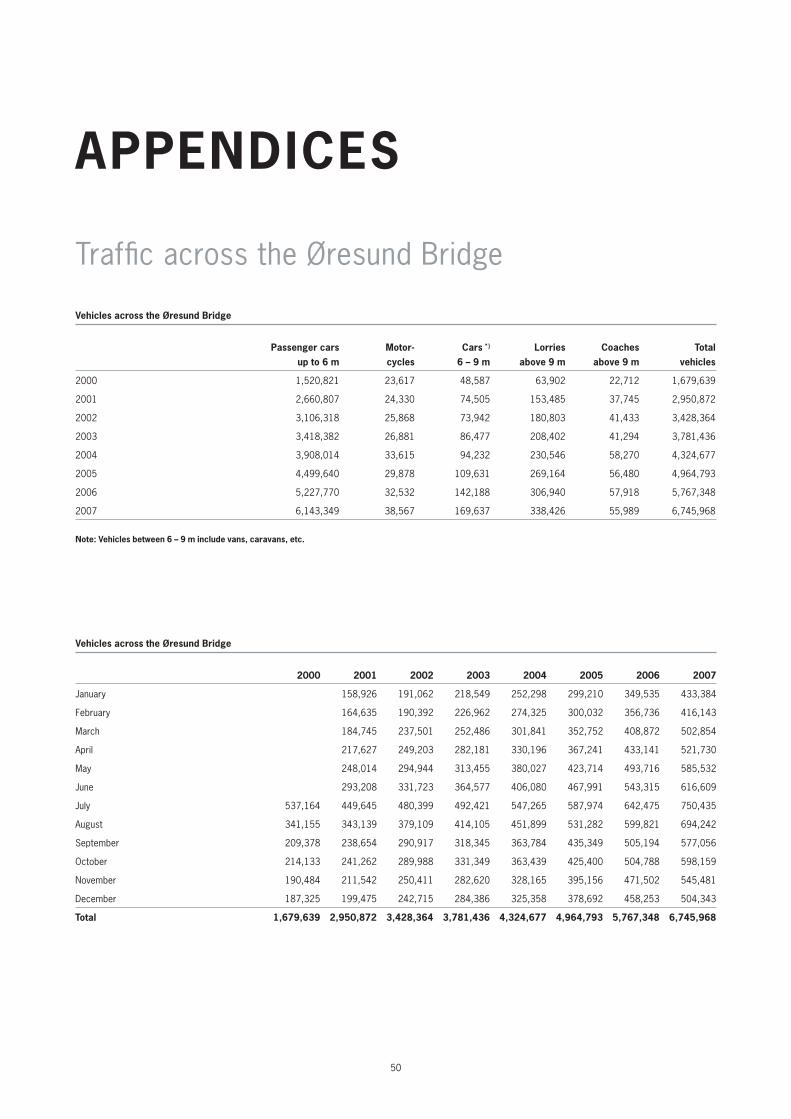
50
AppendiCeS
Traffic across the Øresund Bridge
vehicles across the Øresund bridge
passenger cars motor- Cars *) lorries Coaches Total up to 6 m cycles 6 – 9 m above 9 m above 9 m vehicles
2000 1,520,821 23,617 48,587 63,902 22,712 1,679,639
2001 2,660,807 24,330 74,505 153,485 37,745 2,950,872
2002 3,106,318 25,868 73,942 180,803 41,433 3,428,364
2003 3,418,382 26,881 86,477 208,402 41,294 3,781,436
2004 3,908,014 33,615 94,232 230,546 58,270 4,324,677
2005 4,499,640 29,878 109,631 269,164 56,480 4,964,793
2006 5,227,770 32,532 142,188 306,940 57,918 5,767,348
2007 6,143,349 38,567 169,637 338,426 55,989 6,745,968
note: vehicles between 6 – 9 m include vans, caravans, etc.
vehicles across the Øresund bridge
2000 2001 2002 2003 2004 2005 2006 2007
January 158,926 191,062 218,549 252,298 299,210 349,535 433,384
February 164,635 190,392 226,962 274,325 300,032 356,736 416,143
March 184,745 237,501 252,486 301,841 352,752 408,872 502,854
April 217,627 249,203 282,181 330,196 367,241 433,141 521,730
May 248,014 294,944 313,455 380,027 423,714 493,716 585,532
June 293,208 331,723 364,577 406,080 467,991 543,315 616,609
July 537,164 449,645 480,399 492,421 547,265 587,974 642,475 750,435
August 341,155 343,139 379,109 414,105 451,899 531,282 599,821 694,242
September 209,378 238,654 290,917 318,345 363,784 435,349 505,194 577,056
October 214,133 241,262 289,988 331,349 363,439 425,400 504,788 598,159
November 190,484 211,542 250,411 282,620 328,165 395,156 471,502 545,481
December 187,325 199,475 242,715 284,386 325,358 378,692 458,253 504,343
Total 1,679,639 2,950,872 3,428,364 3,781,436 4,324,677 4,964,793 5,767,348 6,745,968
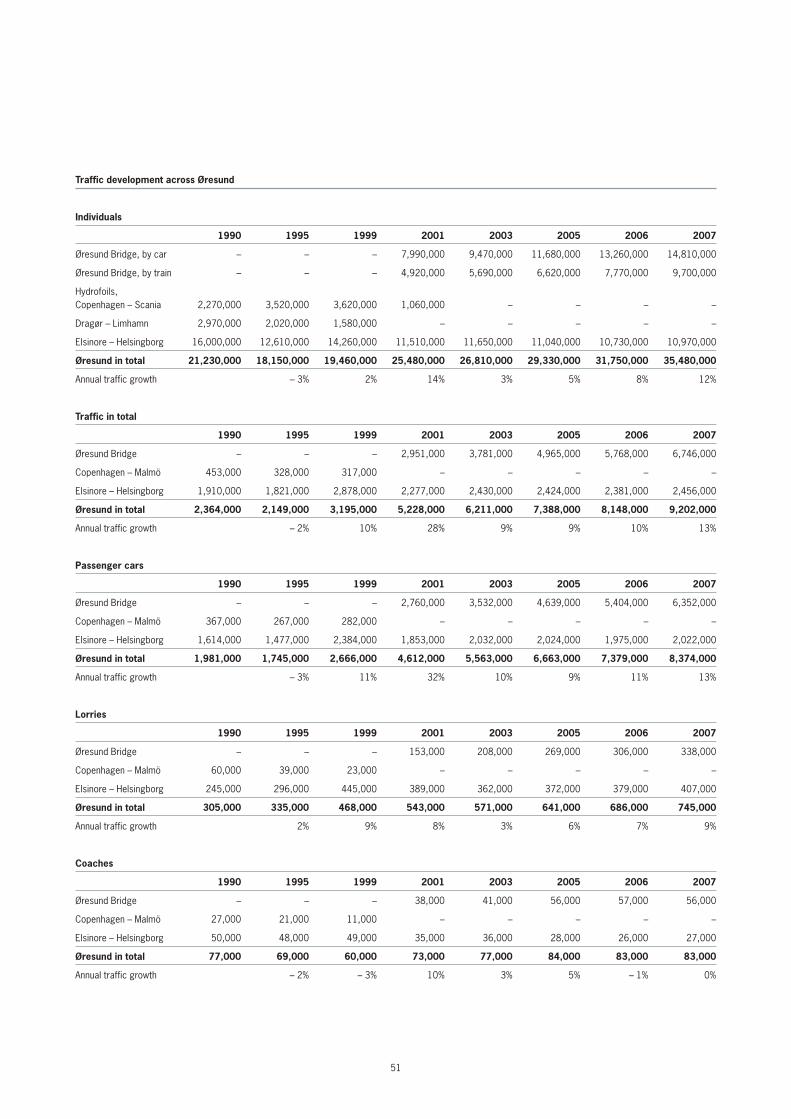
51
Traffic development across Øresund
individuals
1990 1995 1999 2001 2003 2005 2006 2007
Øresund Bridge, by car – – – 7,990,000 9,470,000 11,680,000 13,260,000 14,810,000
Øresund Bridge, by train – – – 4,920,000 5,690,000 6,620,000 7,770,000 9,700,000
Hydrofoils, Copenhagen – Scania 2,270,000 3,520,000 3,620,000 1,060,000 – – – –
Dragør – Limhamn 2,970,000 2,020,000 1,580,000 – – – – –
Elsinore – Helsingborg 16,000,000 12,610,000 14,260,000 11,510,000 11,650,000 11,040,000 10,730,000 10,970,000
Øresund in total 21,230,000 18,150,000 19,460,000 25,480,000 26,810,000 29,330,000 31,750,000 35,480,000
Annual traffic growth – 3% 2% 14% 3% 5% 8% 12%
Traffic in total
1990 1995 1999 2001 2003 2005 2006 2007
Øresund Bridge – – – 2,951,000 3,781,000 4,965,000 5,768,000 6,746,000
Copenhagen – Malmö 453,000 328,000 317,000 – – – – –
Elsinore – Helsingborg 1,910,000 1,821,000 2,878,000 2,277,000 2,430,000 2,424,000 2,381,000 2,456,000
Øresund in total 2,364,000 2,149,000 3,195,000 5,228,000 6,211,000 7,388,000 8,148,000 9,202,000
Annual traffic growth – 2% 10% 28% 9% 9% 10% 13%
passenger cars
1990 1995 1999 2001 2003 2005 2006 2007
Øresund Bridge – – – 2,760,000 3,532,000 4,639,000 5,404,000 6,352,000
Copenhagen – Malmö 367,000 267,000 282,000 – – – – –
Elsinore – Helsingborg 1,614,000 1,477,000 2,384,000 1,853,000 2,032,000 2,024,000 1,975,000 2,022,000
Øresund in total 1,981,000 1,745,000 2,666,000 4,612,000 5,563,000 6,663,000 7,379,000 8,374,000
Annual traffic growth – 3% 11% 32% 10% 9% 11% 13%
lorries
1990 1995 1999 2001 2003 2005 2006 2007
Øresund Bridge – – – 153,000 208,000 269,000 306,000 338,000
Copenhagen – Malmö 60,000 39,000 23,000 – – – – –
Elsinore – Helsingborg 245,000 296,000 445,000 389,000 362,000 372,000 379,000 407,000
Øresund in total 305,000 335,000 468,000 543,000 571,000 641,000 686,000 745,000
Annual traffic growth 2% 9% 8% 3% 6% 7% 9%
Coaches
1990 1995 1999 2001 2003 2005 2006 2007
Øresund Bridge – – – 38,000 41,000 56,000 57,000 56,000
Copenhagen – Malmö 27,000 21,000 11,000 – – – – –
Elsinore – Helsingborg 50,000 48,000 49,000 35,000 36,000 28,000 26,000 27,000
Øresund in total 77,000 69,000 60,000 73,000 77,000 84,000 83,000 83,000
Annual traffic growth – 2% – 3% 10% 3% 5% – 1% 0%
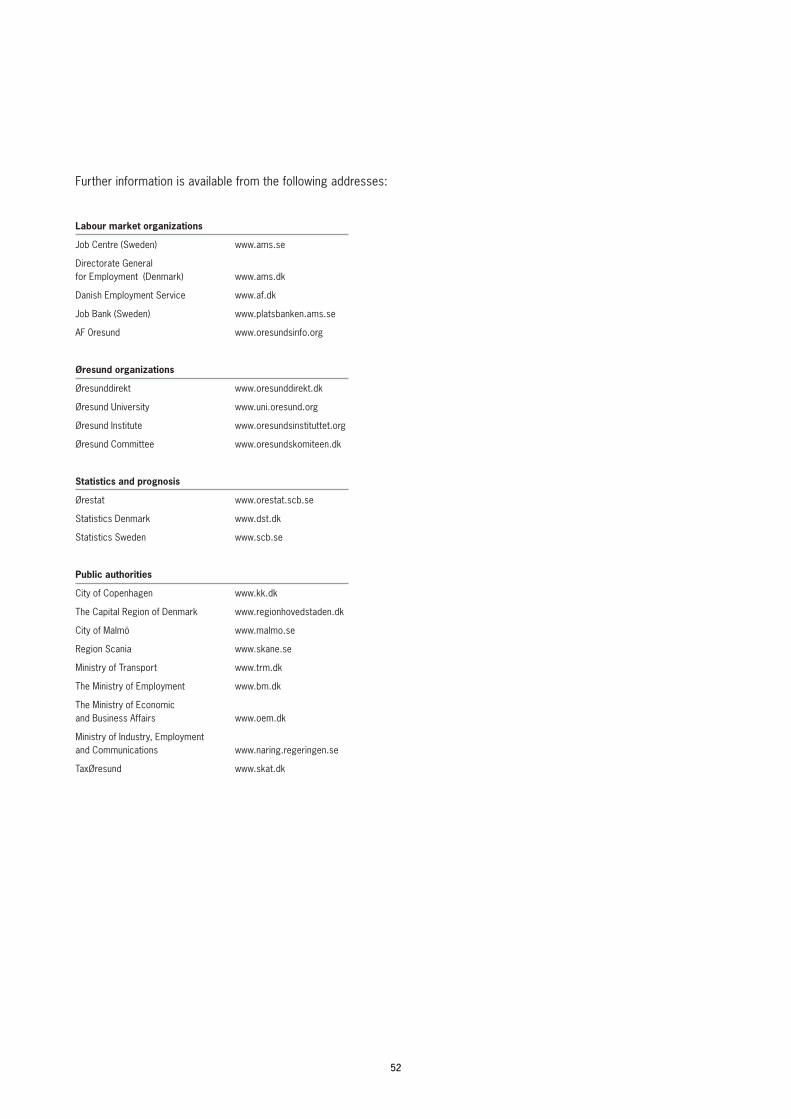
5252
Further information is available from the following addresses:
labour market organizations
Job Centre (Sweden) www.ams.se
Directorate General for Employment (Denmark) www.ams.dk
Danish Employment Service www.af.dk
Job Bank (Sweden) www.platsbanken.ams.se
AF 0resund www.oresundsinfo.org
Øresund organizations
Øresunddirekt www.oresunddirekt.dk
Øresund University www.uni.oresund.org
Øresund Institute www.oresundsinstituttet.org
Øresund Committee www.oresundskomiteen.dk
Statistics and prognosis
Ørestat www.orestat.scb.se
Statistics Denmark www.dst.dk
Statistics Sweden www.scb.se
public authorities
City of Copenhagen www.kk.dk
The Capital Region of Denmark www.regionhovedstaden.dk
City of Malmö www.malmo.se
Region Scania www.skane.se
Ministry of Transport www.trm.dk
The Ministry of Employment www.bm.dk
The Ministry of Economic and Business Affairs www.oem.dk
Ministry of Industry, Employment and Communications www.naring.regeringen.se
TaxØresund www.skat.dk

published by Øresundsbro konsortiet
march 2008
design bgrAphiC
photo miklos Szabo, Steen brogaard, leif Johansson,
drago prvulovic, Søren madsen, pierre mens,
polfoto / mark karrass and Scanpix
print Fihl-Jensen
The Øresund Bridge is owned and operated by Øresundsbro Konsortiet, which is jointly owned by the Danish and Swedish states. The Øresund Bridge occupies a central position in the Øresund Region. Our vision is for the Øresund Region to become a new European powerhouse. Our mission is to build new bridges – economically, culturally and spiritually – in the Øresund Region.
Facts Worth Knowing about the Øresund Bridge is prepared by the Øresundsbro Konsortiet’s analysis department. Questions about this publication can be addressed to:
Britt Andresen, head of analysis [email protected]
Karsten Längerich, strategic planner [email protected]
Michael Bisgaard, analyst [email protected]
The analysis department can be contacted on +45 33 41 60 00 or at [email protected]

Øresundsbro konsortiet · vester Søgade 10 · 1601 Copenhagen v · denmark · Tel. +45 33 41 60 00Øresundsbro konsortiet · kalkbrottsgatan 141 · box 4278 · 203 14 malmö · Sweden · Tel. +46 40 676 60 00
[email protected] · www.oresundsbron.com