Facts Book - Medicines Australia updates and builds on the third edition of the Facts Book, which...
52
Transcript of Facts Book - Medicines Australia updates and builds on the third edition of the Facts Book, which...


This is the fourth edition of the Medicines Australia Facts Book. It updates and builds on the third edition of the Facts Book, which was published in March 2013.
I would like to thank my colleagues Elizabeth de Somer (Director, Policy and Advocacy), Omar Ali Khan (former Manager, Industry Policy) and members of the Medicines Australia Industry Policy Working Group for their work preparing this document.
Please do not hesitate to contact us if you have any queries or feedback. I hope you find this a useful resource.
Yours faithfully,
Tim James Chief Executive Officer M E D I C I n E S A u S T r A l I A
level 1, 16 napier Close, Deakin ACT 2600
P h o n e (02) 6122 8500 e m a i l [email protected] Fa x (02) 6122 8555 W e b www.medicinesaustralia.com.au

3
introduction 4
Part1 6Researchanddevelopment
Part2 18Registrationandreimbursement
Part3 24manufacturingandsales
Part4 38healthoutcomesandexpenditure
Part5 45biotechnologyandthebroadermedicalresearchsectorinaustralia
C o n t e n t s

4
IntroductionThe pharmaceutical industry in AustraliaThe pharmaceutical industry is one of Australia’s most innovative industries. Currently, around 50 global research-based pharmaceutical companies and more than 400 locally-owned biotechnology firms operate in Australia. The industry employs thousands of highly-skilled Australians, generates billions in exports, invests millions of dollars in research and development and, most importantly, delivers medicines and vaccines that millions of Australians use every day to live longer, healthier and more productive lives.
Playing our part to keep Australia’s healthcare system sustainableAustralia is not immune to certain trends affecting other advanced economies. like many of them, Australia is home to an ageing population and the Australian Government, like other governments around the world, faces the challenge of dealing with the issue of rising healthcare costs.
However, successive Australian governments, in close partnership with industry, have implemented reforms to ensure the long-term sustainability of the Pharmaceutical Benefits Scheme (PBS), which provides Australians with universal and subsidised access to over 3000 medicines and which accounts for approximately 80 per cent of the market for medicines in Australia. Fortunately, Government expenditure on the PBS as a percentage of GDP has remained stable for the past decade.

5
Challenges and opportunitiesDespite its successes, the pharmaceutical industry’s future in Australia remains uncertain. It faces a number of challenges which are threatening its future viability and its capacity to contribute to the health and wealth of this nation. For instance, an increasingly unstable and unpredictable operating environment is putting extraordinary pressures on companies and, in many cases, discouraging them from investing in Australia. This has already contributed stagnant or declining investment in research and development and declining exports.
unfortunately, this comes at a time of immense opportunity for Australia. Much of the growth in the market for medicines and vaccines over the next decade will come from Asia and Australia is uniquely placed to meet this demand. With the right policies in place, Australia could double its share of the global pharmaceutical market over the next decade. Without them however, Australia will most likely miss out on this once-in-a-generation opportunity.
Medicines Australia has called on Australian policymakers to:
• ensure a stable, predictable and efficient business operating environment; • strengthen Australia’s intellectual property system; • enable growth in the Australian biotechnology sector; and • enact globally competitive incentives to encourage investment in r&D, high-tech
manufacturing and public-private partnerships.

6
Part 1
research and Development
australia’straditionofexcellenceinmedicalresearchhasmadeitanimportantcomponentoftheglobalhealthcarecontinuum.ithasattractedbillionsinglobalinvestmentinresearchanddevelopmentoverthepast10years,andcollaborationsbetweenglobalpharmaceuticalcompaniesandaustralianentitieshaveenabledthedevelopmentandworld-widedistributionofground-breakingaustraliandiscoveriessuchasthehPVvaccine,whichishelpingprotectwomenaroundtheworldfromcervicalcancer,andanantiviraldrugusedaroundtheworldtopreventorshortenthedurationoffluinfections.

7
Research and Development
1. Bringing new medicines and vaccines to market is expensive, time consuming and incredibly risky
The process of bringing new medicines and vaccines to market is expensive, time consuming and incredibly risky. On average, the cost of bringing a new medicine or vaccine to market is approximately uS$2.6 billion (including the cost of failed research and development projects), and it can take between 10 to 15 years to complete the process.
F i g u R e 1 . 1 Fromresearchtomarket
Early phase research4 - 6 y E A r s
Pre-clinical1 y E A r
Clinical trial6 . 5 y E A r s
registration1 - 2 y E A r s
Post marketing surveillanceC o n T i n u o u s
D i sT r i B u T i o n A n D P o sT m A r k E T i n g s u r v E i l l A n C E :
Approved medicines are distributed to patients worlwide. Post marketing surveillance includes studying any unforseen side effects.
r Eg i sT r AT i o n A n D m A n u fACT u r i n g s C A l E u P :
Successful clinical trial candidate compounds are submitted to regulatory agencies for review and approval. Medicine names are trademarked.
P r E - C l i n i C A l :
Toxicity and safety studies of selected compounds.
E A r ly P h A s E r E s E A r C h :
Basic exploratory research to identify targets, initial research on new compounds carried out in the laboratory.
C l i n i C A l T r i A l s : s u C C E s s f u l P r E C l i n i C A l C o m P o u n D s T E s T E D
P h A s E 1 :
Safety and tolerability in healthy volunteers.
P h A s E 2 :
Safety, efficacy, and bioequivalence studies in small groups of patients.
P h A s E 3 :
large trials with diverse populations to prove efficacy, safety, and quality.
Initial compound patents filed.
s o u R C e s International Federation of Pharmaceutical Manufacturers and Associations, Geneva, 2013, Incremental Innovation: Adapting to Patient needs. Tufts Centre for the Study of Drug Development, Boston, 2014, Cost to Develop and Win Marketing Approval for a new Drug is $2.6 billion.

8
2. incremental innovation plays a vital role in improving health over time
Pharmaceutical innovation does not stop at discovery of the basic molecule, but continues on for 10 to 15 years before launch and beyond. For example, in 1996, the uS Food and Drug Administration approved docetaxel, a small-molecule medicine, as a treatment for locally advanced or metastatic breast cancer. Over the next 10 years, it was also approved for use in certain types of lung, gastric, prostate, head and neck cancers.
F i g u R e 1 . 2 Approval process (docetaxel)
1996Launch: 1998 2000 2002 2004 2006 2008 2010 2012
Clin
ical
val
ue d
ocet
axel
Use in combination with other agents and/or biomarkersUse in different disease indicationsUse earlier in treatment line and/or disease stageUse in initial approved indication
s o u R C e Boston Healthcare Associates, Boston, 2012, recognising Value in Oncology Innovation.

9
Research and Development
2006 2007 2008 2009 2010 2011 2012 2013
160
140
0.00%
5.00%
10.00%
15.00%
20.00%
25.00%
120
100
80
60
40
20
0
R&D
as
a sh
are
of g
loba
l sal
es
US
$ bi
llion
108
19.90% 20.00% 19.90% 19.20% 18.80%18.60% 18.70% 19.10%
120 129 127 129136
134137
Business expenditure on pharmaceutical R&D (global)
3. The pharmaceutical industry invests over us$100 billion globally in research and development each year
The pharmaceutical industry invests more in research and development than any other business sector in the world (uS$ 137 billion in 2013). Between 2006 and 2013, the industry’s investment in research and development grew by an average of 3.4 per cent and accounted for approximately 19 per cent of the industry’s global sales.
F i g u R e 1 . 3 Business expenditure on pharmaceutical r&D (global)
s o u R C e s EvaluatePharma, london, 2014, World Preview 2014, Outlook to 2020. European Commission Joint research Centre, Seville, 2013, Eu r&D Scoreboard: The 2013 Eu Industrial r&D Investment Scoreboard.
10
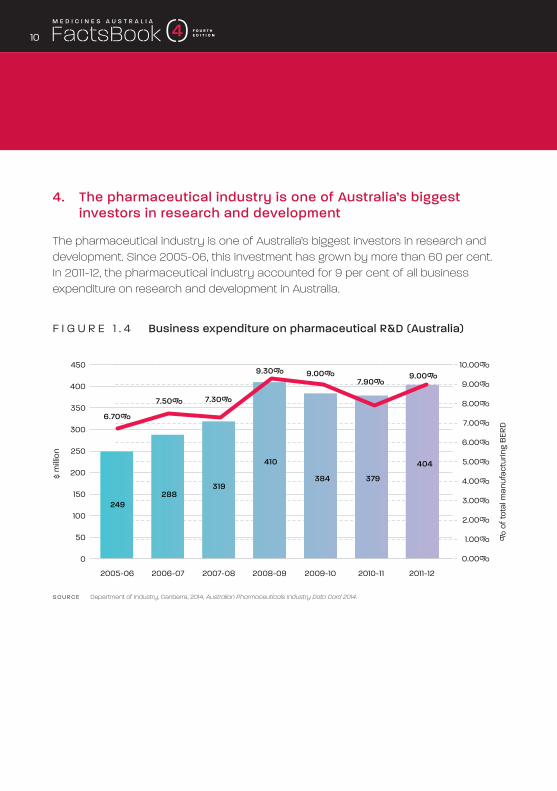
4. The pharmaceutical industry is one of Australia’s biggest investors in research and development
The pharmaceutical industry is one of Australia’s biggest investors in research and development. Since 2005-06, this investment has grown by more than 60 per cent. In 2011-12, the pharmaceutical industry accounted for 9 per cent of all business expenditure on research and development in Australia.
F i g u R e 1 . 4 Business expenditure on pharmaceutical r&D (Australia)
2005-06 2006-07 2007-08 2008-09 2009-10 2010-11 2011-12
400
450
350
0.00%
3.00%
2.00%
1.00%
4.00%
5.00%
6.00%
10.00%
7.00%
8.00%
9.00%
300
250
200
150
100
50
0
% o
f tot
al m
anuf
actu
ring
BERD
$ m
illion
Business expenditure on pharmaceutical R&D (Australia)
249288
319
410
384 379
404
6.70%
7.50% 7.30%
9.30% 9.00%7.90%
9.00%
s o u R C e Department of Industry, Canberra, 2014, Australian Pharmaceuticals Industry Data Card 2014.

11
Research and Development
5. The pharmaceutical industry is currently developing thousands of new medicines and vaccines
The global pharmaceutical industry is currently developing thousands of new medicines and vaccines, including over 900 new ‘biologics’. Biologics are complex molecules derived from living cells and they represent the cutting edge of modern medicine. Biologics have already revolutionised the field and, in time, they could deliver the most effective means of treating a variety of illnesses and disabilities.
F i g u R e 1 . 5 number of biologics in development, 2013Number of Biologics in development, 2013
Autoimmune disorders
Blood disorders
Cancer/related conditions
Cardiovascular disease
Diabetes/related conditions
Digestive disorders
Eye conditions
Genetic disorders
Infectious diseases
Musculoskeletal disorders
Neurological disorders
Respiratory disorders
Skin disorders
Transplantation
Other
71
43
58
28
26
25
30
34
176
39
38
30
13
58
338
s o u R C e Pharmaceutical research and Manufacturers of America, Washington DC, 2014, Drug Discovery and Development: Understanding the R&D Process.

12
6. number of pharmaceutical industry initiated new clinical trials in Australia is in decline
Each year, the pharmaceutical industry initiates hundreds of new clinical trials in Australia, supporting thousands of high-paying jobs and playing a vital role in improving the health and wellbeing of Australians. unfortunately, Australia has been struggling to attract clinical trial investment in recent years. It is vital that all initiatives currently underway to improve Australia’s competitiveness as a destination for clinical trial investment are completed within a reasonable timeframe.
F i g u R e 1 . 6 number of new clinical trials (medicines), AustraliaNumber of new clinical trials (medicines), Australia
2003 2004 2005 2006 2007 2008 2009 2010 2011 2012 2013
603
685 676741
865
748693
634679
759
681
s o u R C e s Therapeutic Goods Administration, Canberra, 2014, Half Yearly Performance Report, Jul-Dec 2013. Department of Industry, Canberra, 2011, Clinically Competitive: Boosting the Business of Clinical Trials in Australia.

13
Research and Development
7. industry-sponsored clinical trials subsidise the delivery of healthcare in Australia
The pharmaceutical industry conducts a full range of clinical trials in Australia, from first-in-human trials (Phase 1) to post-market studies (Phase 4). This investment is not only an additional funding source for Australia’s health system, but also a way of subsidising the delivery of healthcare to Australian patients.
F i g u R e 1 . 7 new clinical trials in Australia
New clinical trials (medicines), by phase, 2013 New clinical trials (medicines), by location, 2013
New South Wales, 29%Victoria, 31%Queensland, 19%South Australia, 12%Western Australia, 7%Tasmania, 1%Australian Capital Territory, 1%
Phase 1, 29%Phase 2, 28%Phase 3, 29%Phase 4, 9%Other, 5%
new clinical trials (medicines), by phase, 2013
new clinical trials (medicines), by location, 2013
s o u R C e Therapeutic Goods Administration, Canberra, 2014, Half Yearly Performance Report, Jul-Dec 2013.

14
8. Despite significant growth in ‘early phase’ clinical research in Australia, there is a decline in late phase activity
Between 2009 and 2013, Phase 1 activity in Australia grew by more than 80 per cent. However, activity in other areas declined, including by around 20 per cent in Phase 3. The Australian Government, in partnership with industry and other stakeholders, is implementing reforms to ensure Australia remains a leading destination for clinical trial investment.
F i g u R e 1 . 8 number of new clinical trials (medicines), by phase, 2009-2013
Phase 1 Phase 2 Phase 3 Phase 4 BA/E N/S
350
300
250
200
150
100
50
0
Number of new clinical trials (medicines), by phase, 2009-2013
Note: BA/E = Bio-Availability/Bio-Equivalence studiesN/S = Not specified
2009 2010 2011 2012 2013
s o u R C e s Therapeutic Goods Administration, Canberra, 2014, Half Yearly Performance Report, Jul-Dec 2013. national Health and Medical research Council, Canberra, 2014, Update: NHMRC Clinical Trial Initiatives, September 2014.

15
Research and Development
9. Clinical trials often give Australian patients early access to innovative therapies
The pharmaceutical industry in Australia conducts clinical trials in numerous therapeutic areas. Patients involved in these trials often get early access to innovative therapies which may be years away from being available to the general public.
F i g u R e 1 . 9 number of active* research studies in Australia (Class 1 medicines Australia members), July 2014
Blood cancers
Cardio-vascular & blood disorders (excl. cancer)
Lung & respiratory conditions (incl. cancers, asthma, etc.)
Skin disorders (incl. cancers)
Mental health & CNS disorders (excl. cancer)
Breast cancer
Musculo-skeletal disorders (incl. autoimmune disorders)
Gastro-intestinal disorders (incl. cancer)
Hepatitis C
Other infectious diseases
Diabetes
Other cancers
Other
Prostate cancer
Ophthalmic conditions
Brain cancer
Cancer of the female reproductive organs
Renal & urinary tract disorders
103
78
58
56
53
50
50
43
38
38
37
35
22
21
18
15
15
13
Number of Active Research Studies in Australia (Class 1 Medicines Australia Members), July 2014
“Active” = “Not Yet Recruiting” + “Recruiting” + “Recruiting By Invitation” + “Active, Not Recruiting”
s o u R C e s Clinicaltrials.gov Department of Industry, Canberra, 2011, Clinically Competitive: Boosting the Business of Clinical Trials in Australia.

16
10. government reforms to boost Australia’s competitiveness as a destination for clinical trial investment must accelerate
Since 2006, growth in clinical trial activity has mostly centred on Asia, with East Asia leading the way. Clearly, the pendulum of global r&D investment has been shifting towards the Asia-Pacific region. Implementing reforms will ensure Australia is able to capitalise on this shift.
F i g u R e 1 . 1 0 regional changes in clinical trial activity, 2006 v 2012: Phase 1, Phase 2, Phase 3, Phase 4
300%
250%
200%
150%
100%
-100%
50%
-50%
0%
CentralAmerica
EastAsia
Growth region
Growth region
Growth region
Japan Europe MiddleEast
NorthAsia
Africa NorthAmerica
Pacifica SouthAmerica
SouthAsia
SouthEast Asia
Phase 1 Phase 2 Phase 3 Phase 4
Key: East Asia (China, Hong Kong, South Korea, Mongolia, Taiwan) North America (Canada, USA, Mexico) North Asia (Russia, Ukraine, ex-Soviet states) Pacifica (Australia, New Zealand)South East Asia (Indonesia, Malaysia, Philippines, Singapore, Thailand, Vietnam)
Regional changes in clinical trial activity, 2006 v 2012: Phase 1, Phase 2, Phase 3, Phase 4
s o u R C e Thomas novak et al., Applied Clinical Trials Online, 2014, Decline of Clinical Trials in Central and Eastern Europe, Fluctuation or Trend?

17
Research and Development
11. The r&D tax incentive has improved Australia’s attractiveness as a destination for investment in research and development
The r&D Tax Incentive is designed to encourage private sector investment in research and development in Australia. It offers companies with an annual turnover of less than $20 million a 43.5 per cent refundable tax offset, and companies with an annual turnover of more than $20 million a 38.5 per cent non-refundable tax offset on eligible expenditure.
F i g u R e 1 . 1 1 is your company eligible for the r&D tax incentive?
s o u R C e s Department of Industry, Canberra, 2014, The R&D Tax Incentive: Snapshot. KPMG, Amstelveen, 2014, Competitive Alternatives: Special Report, Focus on Tax. Grant ready, Surrey Hills, 2014, R&D Tax Incentive.
1 Was an experiment (or set of related experiments) carried out?
Yes
2 Could the outcome of the experiment have been known or determined in advance?
no
3 Did the experimental activities employ the scientific method?
Yes
4 Was the purpose of the experiment to generate new knowledge (hypothesis to experiment, observation and evaluation, and leads to logical conclusions)?
Yes
5 Are the core activities: - Market research or testing for sales promotion - Minerals exploration - Management studies or efficiency surveys - research in social sciences, arts or humanities - Complying with statutory requirements or standards - reverse engineering - Computer software for internal administration.
no
6 Was the activity conducted in Australia?
7 Have you received prior approval from AusIndustry for your current year claim?
no
TheacTiviTyisacorer&DacTiviTy.you must retain records which demonstrate that your activities are eligible.
TheacTiviTyisnoTacorer&DacTiviTy.
no
Yes
Yes
no
no
no
Yes Yes

18
Part 2
registration and reimbursement
Formostpeopleinaustralia,havingaccesstonewmedicinesandvaccinesmeanshavingthemapprovedbythetherapeuticgoodsadministrationandthenlistedonthePharmaceuticalbenefitsscheme.thefasternewmedicinesorvaccinesareapprovedandlisted,thefasteraustralianpatientscanhaveaccesstonewandinnovativetreatments.

19
Registration and reimbursement
1. The Australian Therapeutic goods Administration is globally recognised as a sophisticated regulator
The Therapeutic Goods Administration is the Australian Government agency responsible for regulating the supply, import, export, manufacturing and advertising of therapeutic goods in Australia. like its counterparts in the uS (Food and Drug Administration), the Eu (European Medicines Agency), Canada (Health Canada) and other countries, the TGA reviews complex data on safety, quality and efficacy when considering whether to grant marketing authorisation to new therapies.
F i g u R e 2 . 1 number of new molecular entities given market authorisation, 2010-2014 (as at 31 october 2014)
2010 2011 2012 2013 2014
USA (FDA)Total = 151
Australia (TGA)Total = 144
Europe (EMA)Total = 137
Canada (Health Canada)Total = 124
21
28
1517
30
39
35
2624
27
4138
41
34
28
24
17
21
25 25
Number of new molecular entities given market authorisation, 2010-2014 (as at 31 October 2014)
s o u R C e s united States Food and Drug Administration, Washington DC. Therapeutic Goods Administration, Canberra. European Medicines Agency, london. Health Canada, Ottawa.

20
2. number of submissions to the Pharmaceutical Benefits Advisory Committee is trending marginally upwards, after two years of decline
The Pharmaceutical Benefits Advisory Committee is an independent expert body appointed by the Australian Government. Its primary role is to recommend new medicines for listing on the Pharmaceutical Benefits Scheme. In making its recommendations, the PBAC considers whether new medicines are safe, effective and cost-effective compared to other treatments.
F i g u R e 2 . 2 number of submissions considered by the PBAC, 2010-2013
2010 2011 2012 2013
Number of submissions (all) Number of submissions (medicines)*
195
169162
154140
129
164
141
Number of submissions considered by the PBAC, 2010-2013* excluding medical devices such as glucose test strips and nutritional supplements
* excluding medical devices such as glucose test strips and nutritional supplements
s o u R C e s Department of Health, Canberra, Various Years, PBAC Outcomes. Wonder Drug Consulting, Sydney, 2014, Development of Industry Relevant Key Performance Indicators for the Pharmaceutical Benefits
Scheme - 2010-13.

21
Registration and reimbursement
3. The number of positive recommendations by the Pharmaceutical Benefits Advisory Committee has been declining in recent years
no new medicine can be listed on the Pharmaceutical Benefits Scheme unless it receives a positive recommendation from the PBAC. The number of positive recommendations by the PBAC has been declining in recent years. In addition to time delays, the cost associated with making multiple PBAC submissions is substantial, including around $130,000 for ‘major’ submissions.
F i g u R e 2 . 3 outcomes of PBAC submissions (medicines), 2010-2013
2010 2011 2012 2013
Recommendation rate (medicines)* Rejection rate (medicines)* Deferral rate (medicines)*
72%
24%
4%
61%
55%
36%
9%
57%
33%
10%
32%
7%
Outcomes of PBAC submissions (medicines), 2010-2013*Excluding devices such as glucose test strips and nutritional supplements
*Excluding devices such as glucose test strips and nutritional supplements
s o u R C e s Department of Health, Canberra, Various Years, PBAC Outcomes. Wonder Drug Consulting, Sydney, 2014, Development of Industry Relevant Key Performance Indicators for the Pharmaceutical Benefits Scheme,
2010-13.

22
4. rejections by the Pharmaceutical Benefits Advisory Committee significantly delay patient access to new treatments
In general, the purpose of ‘major’ PBAC submissions is to seek new listings on the Pharmaceutical Benefits Scheme. ‘Minor’ submissions, on the other hand, are more commonly used to seek relatively small changes to existing listings.
F i g u R e 2 . 4 success rate for major and minor PBAC submissions (medicines) 2010-2013
2011 2012
Major Minor
20132010
Success rate for major and minor PBAC submissions (medicines), 2010-2013
53%68%
75%
32%
90%
38%
57%
100%
s o u R C e s Department of Health, Canberra, Various Years, PBAC Outcomes. Wonder Drug Consulting, Sydney, 2014, Development of Industry Relevant Key Performance Indicators for the Pharmaceutical Benefits
Scheme, 2010-13.

23
Registration and reimbursement
5. on average, it takes an estimated 22 months to get a new medicine listed on the Pharmaceutical Benefits scheme
It is becoming more frequent for pharmaceutical companies (or other ‘sponsors’) to have to make multiple submissions to get new medicines listed on the Pharmaceutical Benefits Scheme. unfortunately, this adds to the ‘cost of doing business’ in Australia and, more importantly, delays patient access to new treatments. On average, it takes an estimated 22 months to get a new medicine listed on the PBS.
F i g u R e 2 . 5 success rate for initial PBAC submissions (medicines) 2010-2013
2011 2012 20132010
Success rate for initial PBAC submissions (medicines), 2010-2013
89%
69%60%
51%
s o u R C e s Department of Health, Canberra, Various Years, PBAC Outcomes. Wonder Drug Consulting, Sydney, 2014, Development of Industry Relevant Key Performance Indicators for the Pharmaceutical Benefits
Scheme, 2010-13.

24
Part 3
Manufacturing and sales
medicinesandvaccinesareoneofaustralia’slargestmanufacturedexports.however,pharmaceuticalmanufacturinginaustraliafacesanuncertainfuture.onereasonforthisisthelackofgovernmentincentives;anotherreasonisthelackofrobustgrowthinthedomesticmarketformedicinesandvaccines.

25
Manufacturing and sales
s o u R C e Medicines Australia internal survey.
1. maintaining pharmaceutical manufacturing capacity in Australia continues to be a challenge
Australia has a well-established reputation around the world for manufacturing safe, high-quality medicines and vaccines. Whilst in recent years, several pharmaceutical companies have closed manufacturing facilities in Australia, others have made significant investments in new and existing facilities.
F i g u R e 3 . 1 manufactering investment and job losses since 2007
manufacturing plant closures and associated job losses in Australia since 2007
new manufacturing investment in Australia since 2008
Herron 150 Jobs CSl $250 million
Pfizer* 140 Jobs leo Pharma $130 million
Johnson & Johnson 135 Jobs GSK $91 million
GSK* 120 Jobs AstraZeneca $80 million
MSD 110 Jobs DSM Biologics $65 million
Schering Plough 84 Jobs Hospira $50 million
roche 60 Jobs Fresenius Kabi $47 million
inova 55 Jobs Phebra $25 million
* Partial Johnson & Johnson $21 million
Baxter $12 million
Pharmaxis $10 million

26
2. Pharmaceutical manufacturing in Australia adds significant value to the Australian economy
Despite a difficult operating environment, the pharmaceutical industry in Australia continues to invest in high-tech manufacturing, the added value of which to the Australian economy now stands at close to $3 billion annually.
F i g u R e 3 . 2 industry value add ($ billion)
2.84
2008-09 2009-10 2010-11 2011-12
Industry value add ($ billion)
2.53
2.91
2.65
s o u R C e Department of Industry, Canberra, 2014, Australian Pharmaceuticals Industry Data Card 2014.

27
Manufacturing and sales
3. Pharmaceuticals are one of Australia’s biggest manufactured exports
Despite a recent decline, medicines and vaccines remain one of Australia’s biggest manufactured exports. The global market for these products is set to double over the next decade, with much of the growth coming from Asia. This presents a significant opportunity for Australia to grow its pharmaceutical exports.
F i g u R e 3 . 3 Pharmaceutical exports v. other manufactured exports, Australia, 2003-2013
2003 2004 2005 2006 2007 2008 2009 2011 2012 20132010
Medicinal and pharmaceutical productsProfessional, scientific and controlling instrumentsAircraft and associated equipment, spacecraft, satellites and spacecraft launch vehiclesWine and other alcoholic beveragesCars, road vehicles (incl. air cushion vehicles)
6,000
5,000
4,000
3,000
2,000
1,000
0
$ m
illion
Pharmaceutical exports v. other manufactured exports, Australia, 2003-2013, $ million
s o u R C e Australian Bureau of Statistics, Canberra, 2014, Catalogue 5368.0, International Trade in Goods and Services.
28
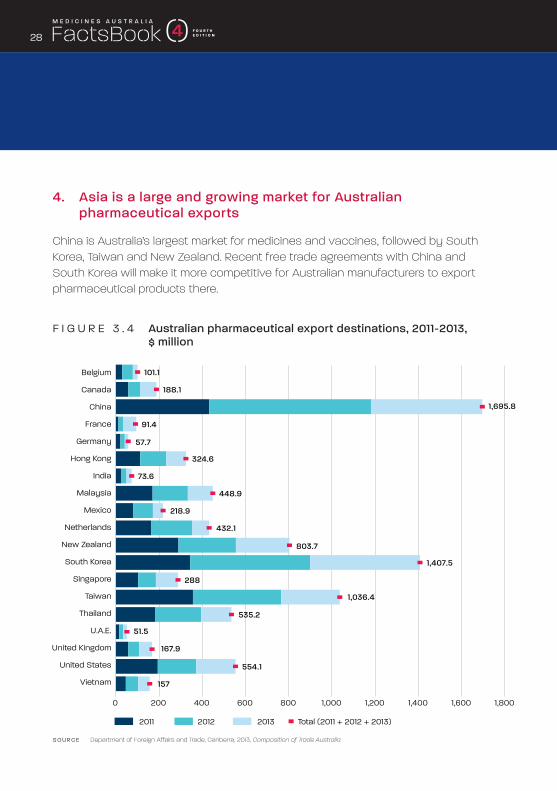
4. Asia is a large and growing market for Australian pharmaceutical exports
China is Australia’s largest market for medicines and vaccines, followed by South Korea, Taiwan and new Zealand. recent free trade agreements with China and South Korea will make it more competitive for Australian manufacturers to export pharmaceutical products there.
F i g u R e 3 . 4 Australian pharmaceutical export destinations, 2011-2013, $ million
1,8001,6001,4001,2001,0008006004002000
288
2012 Total (2011 + 2012 + 2013)20132011
Australian pharmaceutical export destinations, 2011-2013, $ million
Belgium
Canada
China
France
Germany
Hong Kong
India
Malaysia
Mexico
Netherlands
New Zealand
South Korea
Singapore
Taiwan
Thailand
U.A.E.
United Kingdom
United States
Vietnam
101.1
188.1
1,695.8
91.4
57.7
324.6
73.6
448.9
218.9
432.1
803.7
1,407.5
1,036.4
51.5
167.9
157
554.1
535.2
s o u R C e Department of Foreign Affairs and Trade, Canberra, 2013, Composition of Trade Australia.

29
Manufacturing and sales
5. Australia’s share of global outward trade in pharmaceutical goods and services is less than 1 per cent
Australia faces stiff competition for investment in pharmaceutical manufacturing. Countries such as Singapore offer significant incentives to attract this type of investment. Currently, Australia’s share of global outward trade in pharmaceutical goods and services is less than 1 per cent.
F i g u R e 3 . 5 leading exporters of pharmaceutical products, 2013, us$ billion
327
59
45
12
11
9
7
6
5
4
4
2
2
2
2
Leading exporters of pharmaceutical products, 2013, US$ billion
European Union
Switzerland
United States
China
India
Singapore
Israel
Panama
Canada
Australia
Japan
Mexico
Hong Kong
Brazil
South Korea
s o u R C e World Trade Organization, Geneva, 2013, International Trade Statistics, Merchandise Trade.

30
6. Australia currently has a large and growing trade deficit in pharmaceutical goods and services
Despite its reputation for manufacturing safe, high-quality medicines and vaccines, Australia currently imports significantly more of these products than it exports. Growing manufacturing capacity would help Australia to maintain a healthy balance of trade in pharmaceutical goods and services in the future.
F i g u R e 3 . 6 Balance of trade in pharmaceutical goods and services ($ million)Balance of trade in pharmaceutical goods and services ($ million)
2006-07 2007-08 2008-09 2009-10 2010-11 2011-12 2012-13
-4,050 -4,040
-5,045 -5,079
-6,270-6,621 -6,620
s o u R C e Department of Industry, Canberra, 2014, Australian Pharmaceuticals Industry Data Card 2014.

31
Manufacturing and sales
7. There have been notable job losses in the pharmaceutical industry in Australia in recent years
The pharmaceutical industry in Australia creates high-skilled, high-paying jobs in a range of fields, from sales and marketing to health economics to clinical research. In recent years, there have been job losses in the industry, mainly due to commercial restructuring caused by patent expiries.
F i g u R e 3 . 7 Pharmaceutical industry employment in AustraliaPharmaceutical industry employment in Australia
2006-072005-06 2007-08 2008-09 2009-10 2010-11 2011-12 2012-13 2013-14
13,29013,375
14,500
14,04014,180
14,490 14,375
15,400
14,200
s o u R C e IBIS World, Melbourne, 2014, Pharmaceutical Product Manufacturing in Australia: Market research report.

32
8. Australia accounts for only around 1 per cent of the global market for pharmaceutical products
At around 1 per cent, Australia’s share of the global market for pharmaceutical products has remained stable over the past decade. However, it is projected to decline slightly over the coming years, mainly due to the lack of growth in the domestic market and the high rate of growth in other markets (particularly China, Brazil, russia and India).
F i g u R e 3 . 8 Australia’s share of the global pharmaceutical marketAustralia's share of the global pharmaceutical market
North America, 36%EU5, 14%Japan, 9%China, 15%Asia, 6%Australia, 1%Rest of the world, 19%
Key: North America (Canada, USA, Mexico) EU 5 (France, Germany, Italy, Spain, UK)Asia (South Korea, Taiwan, Hong Kong, India, Pakistan, Singapore, Indonesia, Malaysia, Philippines, Vietnam and Thailand)
s o u R C e IMS Institute for Healthcare Informatics, Parsippany, 2013, Market Prognosis.

33
Manufacturing and sales
9. Australia is currently the twelfth largest market in the world for medicines and vaccines
Australia is currently the twelfth largest market in the world for medicines and vaccines. It is projected to remain among the top 20 for at least the next three years.
F i g u R e 3 . 9 Top 20 markets for pharmaceutical goods and services, trends and projections
s o u R C e IMS Institute for Healthcare Informatics, Parsippany, 2013, The Global use of Medicines: Outlook Through 2017.
r a n k 2 0 0 7 i n D e x
1 uS 100
2 Japan 27
3 1 France 13
4 1 Germany 13
5 1 China 11
6 1 Italy 8
7 uK 7
8 1 Spain 7
9 1 Canada 7
10 Brazi l 5
11 Mexico 4
12 Austral ia 4
13 South Korea 3
14 11 russia 3
15 8 Turkey 2
16 1 India 2
17 3 netherlands 2
18 1 Greece 2
19 2 Poland 2
20 4 Belgium 2
r a n k 2 0 1 2 i n D e x
1 uS 100
2 Japan 27
3 2 China 25
4 Germany 13
5 1 France 11
6 4 Brazi l 8
7 1 Italy 8
8 1 uK 7
9 Canada 7
10 2 Spain 6
11 3 russia 5
12 Austral ia 4
13 3 India 4
14 3 Mexico 4
15 2 South Korea 3
16 8 Venezuela 3
17 2 Turkey 3
18 1 Poland 2
19 9 Argentina 2
20 Belgium 2
r a n k 2 0 1 7 i n D e x
1 uS 100
2 1 China 45
3 1 Japan 29
4 2 Brazi l 13
5 1 Germany 13
6 1 France 10
7 Italy 8
8 3 russia 7
9 1 uK 7
10 1 Canada 7
11 2 India 6
12 2 Spain 5
13 1 Mexico 4
14 1 South Korea 4
15 3 Austral ia 4
16 1 Turkey 3
17 1 Venezuela 2
18 1 Argentina 2
19 8 Indonesia 2
20 2 Poland 2

34
10. There has been virtually no growth in the pharmaceutical industry’s turnover in Australia in recent years
Over the last four years, there has been virtually no growth in the pharmaceutical industry’s turnover in Australia. If this trend continues, it could turn Australia into a ‘second tier’ market for medicines and vaccines in the future.
F i g u R e 3 . 1 0 Pharmaceutical industry turnover in Australia ($ billion)
s o u R C e Department of Industry, Canberra, 2014, Australian Pharmaceuticals Industry Data Card 2014.
Pharmaceutical industry turnover in Australia ($ billion)
2006-072005-06 2007-08 2008-09 2009-10 2010-11 2011-12 2012-132004-052003-04
16.1 17.820.4 20.2 20.7 21.4
23.1 22.9 23.4 23.4

35
Manufacturing and sales
11. Pharmaceutical Benefits scheme: key sales statistics
F i g u R e 3 . 1 1 PBs top suppliers and sales
s o u R C e Department of Health, Canberra, 2014, Expenditure and Prescriptions Twelve Months to 30 June 2014.
Top10supplierbyvalueY e a R e n d i n g J u n e 2 01 4
1 Pfizer $690 million
2 AstraZeneca $627 million
3 novartis $507 million
4 Sanofi $371 million
5 MSD $359 million
6 AbbVie $358 million
7 Apotex $357 million
8 Alphapharm $294 million
9 Janssen $290 million
10 GSK $275 million
Derived ex-manufacturer sales ($)
Top10supplierbyscriptvolumeY e a R e n d i n g J u n e 2 01 4
1 Alphapharm 28.2 million
2 Apotex 25.1 million
3 Aspen 19.3 million
4 AstraZeneca 17.6 million
5 Pfizer 16.4 million
6 Sanofi 12.7 million
7 Sandoz 10.1 million
8 GSK 9.9 million
9 MSD 8.6 million
10 Boehringer Ingelheim 7.1 million
Top10sellingmedicinesbytotalcostY e a R e n d i n g J u n e 2 01 4
1 rosuvastatin $392 million
2 Atorvastatin $357 million
3 Adalimumab $276 million
4 Esomeprazole $265 million
5 Fluticasone + Salmeterol $231 million
6 Etanercept $156 million
7 Aflibercept $153 million
8 ranibizumab $149 million
9 Tiotropium $144 million
10 Insulin Glargine $139 million
Total cost includes cost the patient and the cost to the government
Top10sellingmedicinesbyscriptvolumeY e a R e n d i n g J u n e 2 01 4
1 Atorvastatin 8.9 million
2 rosuvastatin 7.8 million
3 Esomeprazole 6.9 million
4 Paracetamol 6.1 million
5 Pantoprazole 4.1 million
6 Perindopril 3.9 million
7 Metformin 3.6 million
8 Fluticasone + Salmeterol 3.2 million
9 Irbesartan 3.1 million
10 Simvastatin 3.0 million
Total for all forms and strengths for each drug

36
Part 4
Health outcomes and expenditure
australiaisoneofthefewcountriesintheworldwhichhasacomprehensivestrategyinrelationtopharmaceuticals.thestrategy,knownasthenationalmedicinesPolicy(nmP),isdesignedtoensurenotonlyongoingandaffordableaccesstonewmedicinesandvaccines,withtheconsequentbenefitsforhealthoutcomes,butalsoaviablepharmaceuticalindustryinaustralia.themainbenefitofthenmPisthatallstakeholders,includingtheaustraliangovernment,thepharmaceuticalindustry,thebroaderhealthcaresectorandthegeneralcommunity,arerequiredtoworktogethertoensurethegreatestpossiblealignmentbetweennationalhealthandindustrypolicies.

37
Health outcomes and expenditure
1. The availability of new medicines and vaccines has contributed to the significant decline in death rates in Australia over the past 100 years
There has been a significant decline in death rates in Australia over the past 100 years. Since 1907, deaths from all causes have declined by more than 80 per cent in Australia, with particularly significant declines in deaths caused by infections, cardiovascular diseases and stroke.
F i g u R e 4 . 1 Deaths per 100,00 population
1907 2012
Deaths per 100,00 population
2,500
2,000
1,500
1,000
500
0
Male Female
Year
s o u R C e Australian Institute of Health and Welfare, Canberra, 2014, Australia’s Health 2014.

38
2. Chronic disease is the leading cause of morbidity and mortality in Australia
Most deaths in Australia today are caused by chronic disease rather than by acute illnesses, which were the leading cause of death and disability a hundred years ago.
F i g u R e 4 . 2 Burden of disease
Major contributors to the burden of disease in AustraliaBurden of disease in Australia
Non-communicable diseases, 85%Injuries, 10%Communicable, maternal, neonatal and nutritional disorders, 5%
Cancer, 16%Musculoskeletal disorders, 15%Cardiovascular diseases, 14%Mental and behavioural disorders, 13%Other, 42%
s o u R C e Australian Institute of Health and Welfare, Canberra, 2014, Australia’s Health 2014.
Burden of disease in Australia
major contributors to the burden of disease in Australia

39
Health outcomes and expenditure
3. Australians enjoy one of the longest life expectancies in the world
Despite spending less on healthcare than most other developed countries (as a percentage of national GDP), Australians today enjoy one of the longest life expectancies in the world. The average life expectancy for Australian men is 79.7 years, sixth highest in the world, and for Australian women 84.2 years, seventh highest in the world.
F i g u R e 4 . 3 government expenditure on health as a percentage of gDP, oECD
2.923.39
4.104.704.70
4.835.13
5.635.63
5.945.96
6.076.31
6.426.646.65
6.796.906.97
7.177.17
7.737.807.867.87
7.987.98
8.228.458.50
8.668.93
9.2710.34
Government expenditure on health as a percentage of GDP, OECD
MexicoChile
South KoreaEstonia
IsraelPoland
HungaryLuxembourg
Slovak RepublicGreeceIreland
AustraliaCzech Republic
SloveniaOECD
PortugalSpain
FinlandSwitzerland
ItalyIceland
SwedenUnited Kingdom
CanadaJapan
NorwayBelgiumAustria
United StatesNew Zealand
GermanyFrance
DenmarkNetherlands
s o u R C e s Organisation for Economic Co-Operation and Development, Paris, 2014, OECD Factbook: Economic, Environmental and Social Statistics. Australian Institute of Health and Welfare, Canberra, 2014, Australia’s Health 2014.

40
4. government expenditure on the Pharmaceutical Benefits scheme as a share of gross domestic product has remained stable over the past decade
The Pharmaceutical Benefits Scheme gives Australians subsidised access to innovative medicines. It is one of the pillars of Australia’s healthcare system. Over the past 10 years, on average, Government expenditure on the PBS has grown by around 4 per cent per annum in real terms. However, as a share of total health expenditure, expenditure on the PBS has remained stable over the past decade.
F i g u R e 4 . 4 government expenditure on the PBs, 2013 dollars, 2003-2013
2006-072005-06 2007-08 2008-09 2009-10 2010-11 2011-12 2012-13 2013-142004-052003-04
% o
f tot
al h
ealth
exp
endi
ture
Government expenditure on the PBS, 2013 dollars, 2003-2013
7.60%
7.40%
7.20%
7.00%
6.60%
6.80%
6.20%
6.00%
6.40%
5.80%
5.60%
5.40%
10,000
9,000
8,000
7,000
6,000
5,000
4,000
3,000
2,000
1,000
0
$ bi
llion
6,406 6,618 7,424 7,567 7,935 8,512 9,038 9,250 9,419 8,996
6.89% 6.69%7.32% 7.04% 6.92% 6.92% 7.04%
6.76%6.49%
6.11% N/A
9,149
s o u R C e s Department of Health, Canberra, 2003-2013, Expenditure and Prescriptions. reserve Bank of Australia, Sydney, Online Inflation Calculator. Australian Institute of Health and Welfare, Canberra, 2014, Health Expenditure Australia 2012-13.

41
Health outcomes and expenditure
5. The pharmaceutical industry has worked with successive Australian governments to ensure the sustainability of the Pharmaceutical Benefits scheme
Despite growth, Government expenditure on the PBS has as a percentage of GDP has remained stable over the past decade. Over the same period, however, overall expenditure on health in Australia as a percentage of GDP has increased from around 8.5 per cent to around 9.5 per cent. The pharmaceutical industry has worked with successive Australian Governments to ensure both the sustainability of the PBS as well as ongoing patient access to new and innovative medicines and vaccines.
F i g u R e 4 . 5 PBs expenditure as a percentage of gDP (+ oECD average)
2003 2004 2005 2006 2007 2008 2009 2010 2011 2012 2013
PBS expenditure as a percentage of GDP (+OECD average)
OECD average
0.0%
0.1%
0.2%
0.3%
0.4%
0.5%
0.6%
0.7%
0.8%
0.9%
1.0%
0.64% 0.65%0.62% 0.59% 0.60%
0.80%
0.65%0.70% 0.69% 0.70% 0.65%
0.60%
0.90% 0.90%
s o u R C e s Organisation for Economic Co-Operation and Development, Paris, 2014, OECD Factbook: Economic, Environmental and Social Statistics. Australian Institute of Health and Welfare, Canberra, 2014, Australia’s Health 2014. Department of Health, Canberra, 2003-2013, Expenditure and Prescriptions. Australian Bureau of Statistics, Canberra, 2014, Catalogue 5206.0, Australian National Accounts: National Income, Expenditure and Product.

42
6. Australians enjoy some of the highest immunisation rates against infectious diseases in the world
Funding for vaccine purchasing under Australia’s national Immunisation Program has increased from $10 million per annum in the mid-1990s to over $350 million in recent years. This has enabled Australians to enjoy some of the highest immunisation rates against infectious diseases in the world.
F i g u R e 4 . 6 funding for niP vaccine program
Financial years
$ m
illion
s
0
50
100
150
200
250
300
350
400
450
500
Seven point plan
2006
-07
2005
-06
2007
-08
2008
-09
2009
-10
2010
-11
2011-
12
2001
-02
2000
-01
1999
-200
0
1998
-99
1997
-98
1996
-97
2002
-03
2004
-05
2003
-04
Pneumococcal
Human Papillomavirus
Meningococcal
s o u R C e s Department of Health, Canberra, 2013, National Immunisation Strategy for Australia: 2013-2018. Australian Institute of Health and Welfare, Canberra, 2014, Australia’s Health 2014.

43
Health outcomes and expenditure
7. The success of the national immunisation Programme has led to dramatic reductions in the incidence of many infectious diseases in Australia
The nIP Schedule covers 16 diseases, including Hep B, diphtheria, tetanus, pertussis, Hib disease, poliomyelitis, pneumococcal, rotavirus, measles, mumps, rubella, meningococcal C, chickenpox, Hep A, HPV and influenza. Due to the success of the immunisation programme, many diseases such as tetanus, diphtheria, Hep B and measles are extremely rare in Australia.
F i g u R e 4 . 7 Coverage of fully immunised children in Australia
s o u R C e Brynley P Gull et al., Canberra, 2011, Immunisation Coverage Annual report.

44
8. vaccination rates in children in Australia are comparable to other oECD countries, but there is room for improvement
F i g u R e 4 . 8 global vaccination rates (children aged 1)
Vaccination rates in children aged 1: Diphtheria, Tetanus and Pertussis
Vaccination rates in children aged 1: Measles
% of children vaccinated0 25 50 75 100
% of children vaccinated0 25 50 75 100
KoreaLuxembourg
ChinaFranceGreecePoland
Slovak RepublicCzech Republic
FinlandHungary
BrazilJapan
PortugalBelgiumSweden
NetherlandsSpain
TurkeyRussian Federation
MexicoOECD 34Slovenia
ItalyIceland
New ZealandIreland
United KindgomSwitzerland
CanadaUnited States
ChileNorway
IsraelGermany
EstoniaAustraliaDenmark
AustriaIndia
South AfricaIndonesia
KoreaChina
GreeceHungary
BrazilCanada
PolandCzech Republic
MexicoSlovak Republic
Russian FederationTurkey
GermanyFinland
PortugalSwedenSlovenia
IsraelLuxembourgNetherlands
BelgiumSpain
OECD 34Japan
AustraliaEstoniaIceland
New ZelandNorway
IrelandSwitzerland
United StatesChile
United KingdomItaly
FranceDenmark
South AfricaAustria
IndonesiaIndia
vaccination rates in children aged 1: Diphtheria, Tetanus and Pertussis
vaccination rates in children aged 1: measles
s o u R C e Organisation for Economic Co-Operation and Development, Paris, 2014, OECD iLibrary: Health Statistics.

45
Part 5
Biotechnology and the broader medical research sector in Australia
asaresultofdecadesofinvestment,includingbysuccessivegovernments,australiatodayishometosomeoftheworld’sbestresearchuniversities,medicalscientistsandhealthcareprofessionals.italsoboastsaworld-classmedicalresearchinfrastructure,astablesocio-economicenvironment,ahistoricallystrongintellectualpropertyregimeandarelativelyefficientregulatorysystem.theseareallfactorsthathavecontributedtothegrowthofbothaustralia’smedicalresearchcapabilitiesanditsindigenousmedicalbiotechnologysector.

46
1. Australia is a leading global hub for biotech innovation
Despite fierce competition, Australia remains a leading global hub for biotech innovation. Australian biotechnology companies have played a critical role in the development of several ground-breaking therapies such as Gardasil® (CSl), relenza® (Biota), Axiron® (Acrux), Bronchitol® (Pharmaxis) and Picato® (Peplin).
F i g u R e 5 . 1 2014 scientific American Worldview overall scores
s o u R C e Scientific American, new York, 2014, Scientific American World View: A Global Biotechnology Perspective.
2014 Scientific American worldview overall scores
United StatesSingapore
DenmarkAustraliaSweden
SwitzerlandFinland
New ZealandUnited Kingdom
LuxembourgCanada
Hong KongGermany
NetherlandsFranceIrelandTaiwan
JapanNorwayAustria
BelgiumIsrael
South KoreaIceland
QatarEstonia
UAESpain
MalaysiaPuerto Rico
PortugalLithuania
Saudi ArabiaCzech Republic
ChileSouth Africa
ItalyLatvia
PolandSlovak Republic
HungaryChina
ThailandGreece
BrazilMexicoTurkeyRussiaKuwait
IndonesiaPhilippines
IndiaUkraine
Argentina
39.631.7
29.728.328.12827.9
27.526.9
26.626.3
25.324.824.824.7
24.224.124
23.923.6
23.222.822.622.4
22.120.3
19.719.7
18.818.6
18.318.118
1716.716.6
15.915.815.715.7
14.812.8
12.212.112
11.711.411.3
10.39.7
8.98.1
76.4

47
Biotechnology and the broader medical research
sector in Australia
2. There are currently more than 50 medical biotechnology companies listed on the Australian securities Exchange
There are currently more than 50 medical biotechnology companies listed on the Australian Securities Exchange, 12 of which had, as of August 2014, market capitalisation of more than $100 million: Csl ($32 billion), mesoblast ($1.5 billion), sirtex ($948 million), mayne ($502 million), Bionomics ($239 million), Alchemia ($188 million), Acrux ($167 million), starparma ($163 million), Benitec ($134 million), neuren ($128 million), Psivida ($121 million), Prana($108 million).
F i g u R e 5 . 2 market capitalisation of AsX-listed medical biotechnology companies, 2008 – (Dec) 2013
2008 2009 2010 2011 2012 2013
$ bi
llion
45
40
35
30
25
20
15
10
5
0
Market cap of ASX-listed medical biotechnology companies, 2008 - (Dec) 2013
25 26 24
33
39
22
s o u R C e s PricewaterhouseCoopers, Sydney, 2014, BioForum 48: Collaboration as a Source of Strength for the Life Sciences Sector. Department of Industry, Canberra, 2014, Biotech Business Indicators: Q4 2013.

48
3. The national health and medical research Council is a leading funder of medical research in Australia
The national Health and Medical research Council is a leading funder of medical research in Australia. nearly 80 per cent of its funding goes to basic sciences and investigator-driven clinical research. The nHMrC also works with stakeholders to develop and implement national policies in fields such research ethics, science training and public health.
F i g u R e 5 . 3 nhmrC research funding: Expenditure on active grants by calendar year
s o u R C e national Health and Medical research Council, Canberra, 2014, Annual Report.
NHMRC Research Funding: Expenditure on active grants by calendar year
20082007200620052004 2009 2010 2011 2012 2013
$340,869,579
$409,716,162$447,068,179
$523,817,474
$621,415,955
$709,987,708$734,041,249
$789,531,259$821,348,308 $805,429,638
49
Biotechnology and the broader medical research
sector in Australia
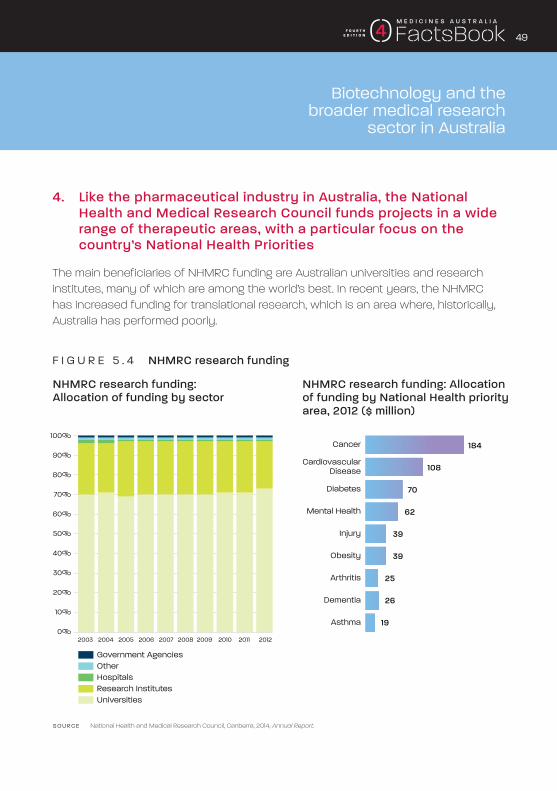
4. like the pharmaceutical industry in Australia, the national health and medical research Council funds projects in a wide range of therapeutic areas, with a particular focus on the country’s national health Priorities
The main beneficiaries of nHMrC funding are Australian universities and research institutes, many of which are among the world’s best. In recent years, the nHMrC has increased funding for translational research, which is an area where, historically, Australia has performed poorly.
F i g u R e 5 . 4 nhmrC research funding
100%
90%
80%
70%
60%
50%
40%
30%
20%
10%
0%
Cancer
Diabetes
CardiovascularDisease
Mental Health
Injury
Obesity
Arthritis
Dementia
Asthma
184
108
70
62
39
39
25
26
19
NHMRC Research Funding: Allocation of funding by sector
Government AgenciesOtherHospitalsResearch InstitutesUniversities
200820072006200520042003 2009 2010 2011 2012
NHMRC Research Funding: Allocation of funding by National Health Priority Area, 2012 ($ million)
nhmrC research funding: Allocation of funding by sector
nhmrC research funding: Allocation of funding by national health priority area, 2012 ($ million)
s o u R C e national Health and Medical research Council, Canberra, 2014, Annual Report.

50
5. independent medical research institutes in Australia offer significant opportunities for collaboration between academia and the pharmaceutical industry to develop new therapies
AnZA
C
Geo
rge
Har
ry P
erki
ns
neu
rosc
ienc
e Au
stra
lia
ArM
I
Gar
van
Han
son
Kollin
g
Men
zies-
TAS
St V
ince
nt’s
TrI
Cen
tena
ry
Chi
ldre
n’s C
ance
r Ins
t
Hun
ter
ludw
ig
Mat
er
Men
zies
MIM
r-PH
I
Mur
doch
Pete
r Mac
QIM
r Be
rgho
fer
QlD
Chi
ldre
n’s
SAH
MrI
Tele
thon
WEH
I
Wes
ley
Wes
tmea
d M
illenn
ium
Bake
r ID
I
HrI
nAr
I
Flor
ey
Vict
or C
hang
Woo
lcoc
k
Burn
et
Ageing Ageing
Bone and joint health Bone and joint health
Canver Canver
CVD CVD
Diabetes Diabetes
Endocrinology Endocrinology
Genetics Genetics
Immunology and immune disorders
Immunology and immune disorders
Infectious diseases Infectious diseases
nephrology nephrology
liver and digestive disorders
liver and digestive disorders
neurology and mental health
neurology and mental health
respiratory disorders respiratory disorders
F i g u R e 5 . 5 major independent medical research institutes in Australia, by area of specialty
s o u R C e Association of Australian Medical research Institutes, Melbourne.

51
Biotechnology and the broader medical research
sector in Australia
AnZA
C
Geo
rge
Har
ry P
erki
ns
neu
rosc
ienc
e Au
stra
lia
ArM
I
Gar
van
Han
son
Kollin
g
Men
zies-
TAS
St V
ince
nt’s
TrI
Cen
tena
ry
Chi
ldre
n’s C
ance
r Ins
t
Hun
ter
ludw
ig
Mat
er
Men
zies
MIM
r-PH
I
Mur
doch
Pete
r Mac
QIM
r Be
rgho
fer
QlD
Chi
ldre
n’s
SAH
MrI
Tele
thon
WEH
I
Wes
ley
Wes
tmea
d M
illenn
ium
Bake
r ID
I
HrI
nAr
I
Flor
ey
Vict
or C
hang
Woo
lcoc
k
Burn
etAgeing Ageing
Bone and joint health Bone and joint health
Canver Canver
CVD CVD
Diabetes Diabetes
Endocrinology Endocrinology
Genetics Genetics
Immunology and immune disorders
Immunology and immune disorders
Infectious diseases Infectious diseases
nephrology nephrology
liver and digestive disorders
liver and digestive disorders
neurology and mental health
neurology and mental health
respiratory disorders respiratory disorders
Independent medical research institutes are a major source of health innovation in Australia. Many of them have partnered with pharmaceutical companies to develop new medicines and vaccines.