Facts and figures 2007–08
12
Forests and forestry Facts and figures 2007–08 www.dpi.nsw.gov.au
Transcript of Facts and figures 2007–08

Forests and forestry
Facts and figures2007–08
www.dpi.nsw.gov.au

F O R E S T S N S W • F A C T S A N D F I G U R E S 2 0 0 7 – 0 8
2
Forests NSWN
ORT
HEA
ST
CEN
TRA
LW
ESTE
RN
SOU
THER
N
NO
RTH
ERN
MA
CQU
ARI
E MO
NA
RO
HU
ME
Stat
e Fo
rest
Nat
ive
Har
dwoo
d Pl
anta
tion
Soft
woo
d Pl
anta
tion
Nat
ive
Fore
st R
egio
n Bo
unda
ry
Plan
ted
Fore
st R
egio
n Bo
unda
ry
Corp
orat
e O
�ce
Busi
ness
Ser
vice
Cen
tre
Regi
onal
o�
ce –
Nat
ive
Regi
onal
o�
ce –
Pla
nted
Fore
st C
entr
e
Nur
sery
Wor
ksho
p
Rese
arch
Cas
ino
Cof
fs H
arb
our
Gra
fton
Gle
n In
nes
Inve
rell
Dor
rigo
Kem
pse
y
Wau
chop
e
Wal
cha
Bul
ahd
elah
Bar
adin
eG
unne
dah
Mus
wel
lbro
ok
Mai
tland
Toro
nto
Syd
ney
Dub
bo
Bat
hurs
t
Forb
es
Mos
sVa
le
Bat
eman
s B
ay
Nar
oom
a
Ed
en
Bom
bal
a
Alb
ury
Tum
bar
umb
a
Tum
utB
atlo
w
Yanc
o Nar
rand
era
Wag
ga W
agga
Den
iliq
uin
Dar
eton
NO
RTH
EAST
CEN
TRA
LW
ESTE
RN
SOU
THER
N
NO
RTH
ERN
MA
CQU
ARI
E MO
NA
RO
HU
ME
Stat
e Fo
rest
Nat
ive
Har
dwoo
d Pl
anta
tion
Soft
woo
d Pl
anta
tion
Nat
ive
Fore
st R
egio
n Bo
unda
ry
Plan
ted
Fore
st R
egio
n Bo
unda
ry
Corp
orat
e O
�ce
Busi
ness
Ser
vice
Cen
tre
Regi
onal
o�
ce –
Nat
ive
Regi
onal
o�
ce –
Pla
nted
Fore
st C
entr
e
Nur
sery
Wor
ksho
p
Rese
arch
Cas
ino
Cof
fs H
arb
our
Gra
fton
Gle
n In
nes
Inve
rell
Dor
rigo
Kem
pse
y
Wau
chop
e
Wal
cha
Bul
ahd
elah
Bar
adin
eG
unne
dah
Mus
wel
lbro
ok
Mai
tland
Toro
nto
Syd
ney
Dub
bo
Bat
hurs
t
Forb
es
Mos
sVa
le
Bat
eman
s B
ay
Nar
oom
a
Ed
en
Bom
bal
a
Alb
ury
Tum
bar
umb
a
Tum
utB
atlo
w
Yanc
o Nar
rand
era
Wag
ga W
agga
Den
iliq
uin
Dar
eton

F O R E S T S N S W • F A C T S A N D F I G U R E S 2 0 0 7 – 0 8
3
Our organisationForests NSW is a public trading enterprise within NSW Department of Primary Industries (NSW DPI), responsible for the sustainable management of more than 2 million hectares of multiple-use native forests and an expanding estate of hardwood and softwood planted forests.
Forests NSW is working to be the best and safest commercial forest manager in Australasia.
Forests NSW key result areas are:
Focus on excellence in profitable and sustainable forest management•Organisational efficiency making optimal use of our assets•Revenue growth•Cost reductions•Simplification of the way we work.•
NSW DPI’s visionProfitable, adaptive and sustainable primary industries building vibrant communities.
NSW DPI’s key result areas are:
Strong economic performance of primary industries•Appropriate access to and wise management of natural resources•Safe, healthy and biosecure industries•A strong voice for primary industries•Excellence in people, innovation and service delivery.•

F O R E S T S N S W • F A C T S A N D F I G U R E S 2 0 0 7 – 0 8
4
Forest statisticsDe
script
ionAu
strali
aNS
WFo
rests
NSW
Tota
l land
area
(milli
on ha
) 77
0 80
2.5To
tal p
opula
tion (
milli
on)
217
n/a
Fore
sts as
a pe
rcent
age o
f land
area
19%
33%
>99
%To
tal fo
rest
area
(milli
on ha
)14
926
.52.5
Nativ
e for
est a
rea (
milli
on ha
)114
726
.22.2
Area
of fo
rest
not l
egall
y res
tricte
d fro
m ti
mbe
r har
vesti
ng 11
319
.92.0
Nativ
e fore
st are
a in f
ormal
natu
re co
nserv
ation
rese
rves (
millio
n ha)
235.1
0.5m
ultipl
e-us
e pub
lic na
tive f
ores
ts (m
illion
ha)
9.42.0
Area
of na
tive p
rodu
ction
fore
st ha
rves
ted a
nnua
lly3
<1%
n/r
2.8%
Plant
ation
fore
st ar
ea (m
illion
ha)
1.97
0.34
0.27
New
area
of pl
anta
tion p
lante
d ha/
year
(ave
rage
2002
-200
6)2
60 12
013
645
7 114
Num
ber o
f peo
ple em
ploye
d in f
ores
t pro
duct
indus
tries
>83
000
>24
000
943
Tota
l exp
orts
of w
ood p
rodu
cts$2
.47 bi
llion
n/r
n/r
Majo
r exp
orts
to
Japan
(38%
), NZ (
17%
) & Ch
ina (1
6%)
n/r
n/r
Tota
l impo
rts of
woo
d pro
ducts
$4.40
billio
nn/
rn/
aM
ajor im
ports
from
NZ (1
9%), C
hina (
10%
) & In
done
sia (8
%)
n/r
n/a
Fore
sts co
ntrib
ution
to G
DP1%
n/r
n/r
Net a
mou
nt of
carb
on se
ques
tere
d (m
illion
tonn
es) b
y m
anag
ed na
tive f
ores
ts pe
r ann
um (e
-CO 2)4
43.5
n/r
4.2
Value
of tu
rnov
er in
fore
st pr
oduc
ts ind
ustri
es (b
illion
)19
n/r
0.31 In
clude
s nati
ve fo
rest re
mnan
ts wi
thin
plante
d fore
st es
tate f
or Fo
rests
NSW
2 Austr
alia’s
Plan
tation
s 200
8 Inv
entor
y figu
re for
NSW
2007
3 Fores
t NSW
only
remov
es a
propo
rtion
of th
e tree
s ove
r the
harve
sted a
reas, e
xcept
for C
ypres
s pine
(26%
)4 Au
strali
an fig
ure fro
m 20
05So
urces:
DAFF
State
of th
e Fore
sts Re
port
2008
, Fore
sts NS
W Se
eing R
eport
2007
-08,
Austr
alian
Burea
u of S
tatist
ics, D
AFF N
ation
al Pla
ntatio
n Inv
entor
y - 20
08
n/a:
Not a
pplic
able
n/r:
Not r
epor
ted

F O R E S T S N S W • F A C T S A N D F I G U R E S 2 0 0 7 – 0 8
5
Economic benefits1.4 million hectares of native State forest available for timber harvesting•Over 7 700 hectares of new softwood plantation established•2.9 million m• 3 of sawlogs and 1.8 million tonnes of pulpwood harvested More than 690 000 greenhouse gas abatement certificates created, •representing the equivalent number of tonnes of CO2 stored100% of eligible plantations accredited for carbon trading•$24 400 profit per employee•
Timber productForests NSW main timber products are:
Hardwood17 000 m3/pa veneer805 000 m3/pa sawlogs606 000 tonnes/pa pulpwood
Softwood2 100 000 m3/pa sawlogs1 164 000 tonnes/pa pulpwood
Hardwood timber products Softwood timber products
0
10
20
30
40
50
0
10
20
30
40
50
60
70
80
0
10
20
30
40
50
0
10
20
30
40
50
60
70
80
Perc
enta
ge (%
)
Perc
enta
ge (%
)
Dry s
truct
ural
7%
Join
ery /
furn
iture
6%
Deck
ing
/ pan
ellin
g 6
%
Hous
e fra
min
g 14
%
Palle
ts 9
%
High
stre
ngth
stru
ctur
al 2
%
Fenc
ing
/ Lan
dsca
pe 8
%
Floor
boar
ds 4
8%
Hous
e fra
min
g 7
3%
Join
ery /
furn
iture
1%
Deck
ing
/ pan
ellin
g 6%
Floor
boar
ds /
bear
ers/j
oists
3%
Fenc
ing
/ Lan
dsca
pe 6
%
Othe
r pre
serv
atio
n 4%
Unse
ason
ed 7
%

F O R E S T S N S W • F A C T S A N D F I G U R E S 2 0 0 7 – 0 8
6
Forests NSW major customersManufacture area Customer Products/ServicesPlywood Ausply, Big River Timbers and
Carter Holt Harvey Plywood flooring & stairs, structural bracing, Formply (concrete construction) and external cladding
Major softwood sawmillers
Auswest, Carter Holt Harvey, Colenden, Dale & Mayers, Highland Pine, Hyne & Son, Penrose Pine, Tarmac and Willmott Forest Products
Structural softwood timber for dwelling construction and renovation markets, internal joinery (e.g. windows and architraves) and furniture timbers, landscape timbers, treated softwood poles and treated decking
MDF and particleboard
Carter Holt Harvey and Monsbent Medium Density Flooring and particleboard products such as flooring, cabinets, bench tops and furniture
Softwood preservation
Pacpine, Penrose Pine and Wilmott Timbers
Treated timber for outdoor applications such as decks, pergolas and landscape timbers
Pulp and paper Midway, Sawmillers Export Pty Ltd, Norske Skog, Pentarch, Queensland Commodity Exports, South East Fibre Exports and Visy
Newsprint, writing paper, cardboard, tissues and paper towels
Major hardwood sawmillers
Australian Solar Timbers, Big River Timbers, Blue Ridge Hardwoods, Boral, Coffs Harbour Hardwoods, Davis & Herbert, Gunnedah Timbers, Grants Holdings, Gulpa Sawmill, Hurfords, ITC Timber, Koppers, Notaras J & Sons and Thora
Kiln dried and green structural timber, strip flooring, furniture and joinery timber, bridge and engineering timber products, power poles, plywood products and external cladding decking
Investors Agriwealth, ST Microelectronics and TEPCO
Plantation investment
Utilities and infrastructure
Country Energy, Crown Castle, Optus, Telstra and Vodafone
Telecommunications and electricity supplier
F O R E S T S N S W • F A C T S A N D F I G U R E S 2 0 0 7 – 0 8
7
2007–08 $‘000
2006–07 $‘000
2005–06 $‘000
2004–05 $‘000
2003–04 $‘000
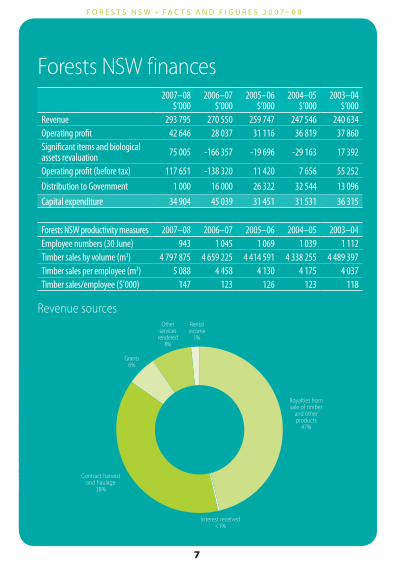
Revenue 293 795 270 550 259 747 247 546 240 634Operating profit 42 646 28 037 31 116 36 819 37 860Significant items and biological assets revaluation 75 005 -166 357 -19 696 -29 163 17 392
Operating profit (before tax) 117 651 -138 320 11 420 7 656 55 252Distribution to Government 1 000 16 000 26 322 32 544 13 096Capital expenditure 34 904 45 039 31 451 31 531 36 315
Forests NSW finances
Forests NSW productivity measures 2007–08 2006–07 2005–06 2004–05 2003–04Employee numbers (30 June) 943 1 045 1 069 1 039 1 112Timber sales by volume (m3) 4 797 875 4 659 225 4 414 591 4 338 255 4 489 397Timber sales per employee (m3) 5 088 4 458 4 130 4 175 4 037Timber sales/employee ($’000) 147 123 126 123 118
Revenue sourcesRental
income 1%
Other services
rendered 8%
Grants 6%
Contract harvest and haulage
38%
Royalties from sale of timber
and other products
47%
Interest received <1%

F O R E S T S N S W • F A C T S A N D F I G U R E S 2 0 0 7 – 0 8
8
Social benefits 943 people directly employed by Forests NSW, with more than •6 000 forest-dependent jobs and 14 000 indirect employment$7.58 million spent on research•786 regional forums attended by Forests NSW staff•104 meetings health and safety meetings staged•More than 31 000 public enquiries addressed•More than $120 000 in corporate sponsorships and support•4 171 people participating in programs at Cumberland State Forest•141km of dedicated mountain bike tracks developed & maintained•
Forest sector employment dependant on State forestsHarvesting / Haulage 1 087Primary processing 4 483Apiary 352Grazing 530Eco-tourism 10Other 52Forest Management 947Total direct employment 7 461Estimated Indirect employment 14 000
Forests NSW Safety Performance (Frequency Rate)*
2002-03 3.6
2003-04 2.8
2004-05 3.1
2005-06 2.7
2006-07 3.3
2007-08 4.5* Number of Lost Time Incidents per 200 000 hours worked

F O R E S T S N S W • F A C T S A N D F I G U R E S 2 0 0 7 – 0 8
9
Environmental benefitsTotal forest estate over 2.49 million hectares•1.99 million hectares of native forests managed•2• 053 sightings of 34 targeted species during pre-harvest surveys Almost $10 million spent on firefighting and bushfire prevention•22% of State forests treated by fuel management strategies•More than $1.1 million spent on feral animal control•8 million tonnes additional of CO• 2-equivalent stored in State forests350 000 environmental compliance items checked in 4• 000 internal compliance efforts8.4 million seedlings grown in our nurseries (age-class 2006)•
Wildfires and prescribed burns trend as a percentage of Forests NSW estate
0
1
2
3
4
5
6
Perc
enta
ge (%
)
0
1
2
3
4
5
6
99–00 00–01 01–02 02–03 03–04 04–05 05–06 06–07 07–08
Wildfire percentage of total area
Prescribed burning percentage of total area
Wildfire linear trend
Prescribed burning linear trend
Reporting periods

F O R E S T S N S W • F A C T S A N D F I G U R E S 2 0 0 7 – 0 8
10
Sustainability 1.4 million hectares available for timber production on State forests•
Mean annual increment for softwood plantations 16.3 m• 3/ha/yr and for hardwood plantations 13.6 m3/ha/yr
Actual annual yield of high quality sawlogs as a percentage of allowable volume: •94% native hardwood forests; 96% cypress and 98% softwood plantations.
What does sustainability mean for Forests NSW?Managing State forests for the long term and retaining opportunities for future generations to meet their needs and expectations, while providing for the present.
Forest Management CertificationForests NSW maintained certification to the Australian Forestry Standard (AFS).
AFS gives independent assurance that Forests NSW management of NSW forests is consistent with internationally recognised principles of sustainable forest management.
Timber buyers wanting an assurance of sustainability should choose timber products displaying the logo for AFS and its over-arching scheme, Programme for the Endorsement of Forestry Certification (PEFC).

ph
oto
sy
nt
he
sis
CO
2 is sequestered
Gr
ow
. Ha
rv
es
t. st
or
e...
Fo
re
st
s –
pa
rt
oF
tH
e c
lim
at
e c
Ha
nG
e s
ol
ut
ion
Re
CyC
LinG
Dis
po
sA
L
Litter and other forest biom
ass
So
il organ
ic matter
Deco
mp
ositio
n
respiratio
n
Anim
als excretion
Carb
on
store
tiM
Be
Rh
AR
Ve
st
inG
Litte
R
LAye
R
FiRe
tiM
Be
Rp
Ro
Ce
ss
inG
tiM
Be
Rp
Ro
DU
Ct
s
LeG
en
DCapturing C
arbon
Releasing C
arbon
Moving carbon
en
eR
Gy
Fos
siL FU
eLs

F O R E S T S N S W • F A C T S A N D F I G U R E S 2 0 0 7 – 0 8
This document has been prepared as a summary. More detailed information can be viewed in Forests NSW Annual and Seeing (Sustainability) Reports online at www.dpi.nsw.gov.au/forests
For more information or copies of these documents contact Forests NSW Information Centre
T 1300 655 687 or 02 9871 3377
W www.dpi.nsw.gov.au/forests
This Facts and Figures is one of a set of summaries relating to primary industries in New South Wales. For details on agriculture, mineral resources and fisheries management in NSW see NSW Department of Primary Industries website www.dpi.nsw.gov.au
DPI
JN 9
297