Facts about Church Attendance in US Orthodox Christian ...
15
Alexei Krindatch, Research Coordinator ([email protected]) Assembly of Canonical Orthodox Bishops of North and Central America Eight Facts about Church Attendance in US Orthodox Christian Churches. Content: Eight Facts about Church Attendance in US Orthodox Christian Churches p.2 Here you will find information about following: About overall rates of church attendance among US Orthodox Christians and among members of individual Orthodox jurisdictions (GOA, OCA, Antiochian Archdiocese, etc.) About how differences in the rates of church attendance between Orthodox jurisdictions affect the size of their actual membership About relationship between the size of an Orthodox parish and the rates of church attendance About state-to-state differences in proportion of Orthodox church members attending services in their parishes on a regular weekly basis About possible regions for the future "planting" of the Orthodox parishes Appendix: p. 10 Tab. 1. US Average Rates of Church Attendance for the Parishes in Various Jurisdictions and in Different Size Categories p. 10 Tab. 2. State-by-State Actual Church Attendance and “Expected” Church Attendance in Orthodox Parishes which belong to the Assembly’s Jurisdictions p. 11 Tab. 3. State-by-State Index of Church Attendance in Orthodox Parishes which belong to the Assembly’s Jurisdictions p. 12 Maps: p. 13 Map 1. Church Attendance in Orthodox Christian Churches by State p. 13 Map 2. "Expected" Church Attendance in Orthodox Christian Churches by State p. 14 Map 3. State-by-State Index of Church Attendance in Orthodox Christian Churches p. 15 1
Transcript of Facts about Church Attendance in US Orthodox Christian ...

Alexei Krindatch, Research Coordinator ([email protected])
Assembly of Canonical Orthodox Bishops of North and Central America
Eight Facts about Church Attendance in US Orthodox Christian Churches.
Content:
Eight Facts about Church Attendance in US Orthodox Christian Churches p.2
Here you will find information about following:
About overall rates of church attendance among US Orthodox Christians and among
members of individual Orthodox jurisdictions (GOA, OCA, Antiochian Archdiocese, etc.)
About how differences in the rates of church attendance between Orthodox jurisdictions
affect the size of their actual membership
About relationship between the size of an Orthodox parish and the rates of church attendance
About state-to-state differences in proportion of Orthodox church members attending
services in their parishes on a regular weekly basis
About possible regions for the future "planting" of the Orthodox parishes
Appendix: p. 10
Tab. 1. US Average Rates of Church Attendance for the Parishes in Various Jurisdictions
and in Different Size Categories p. 10
Tab. 2. State-by-State Actual Church Attendance and “Expected” Church Attendance
in Orthodox Parishes which belong to the Assembly’s Jurisdictions p. 11
Tab. 3. State-by-State Index of Church Attendance in Orthodox Parishes which belong
to the Assembly’s Jurisdictions p. 12
Maps: p. 13
Map 1. Church Attendance in Orthodox Christian Churches by State p. 13
Map 2. "Expected" Church Attendance in Orthodox Christian Churches by State p. 14
Map 3. State-by-State Index of Church Attendance in Orthodox Christian Churches p. 15
1
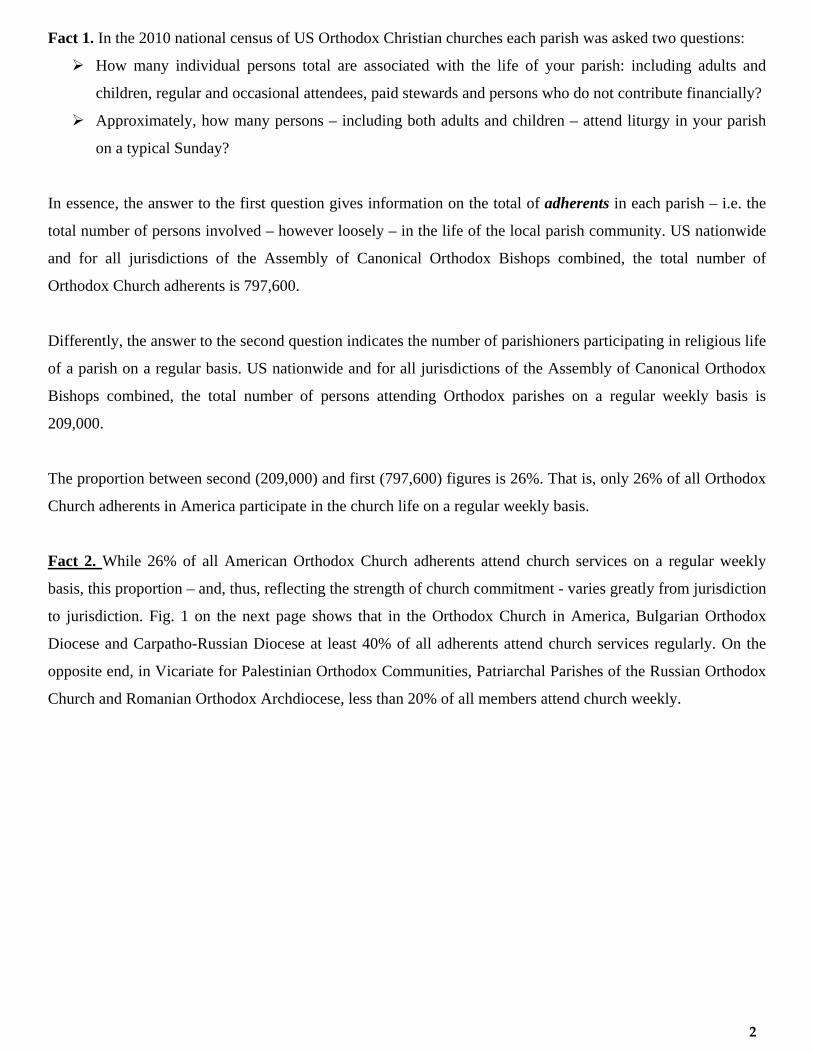
Fact 1. In the 2010 national census of US Orthodox Christian churches each parish was asked two questions:
How many individual persons total are associated with the life of your parish: including adults and
children, regular and occasional attendees, paid stewards and persons who do not contribute financially?
Approximately, how many persons – including both adults and children – attend liturgy in your parish
on a typical Sunday?
In essence, the answer to the first question gives information on the total of adherents in each parish – i.e. the
total number of persons involved – however loosely – in the life of the local parish community. US nationwide
and for all jurisdictions of the Assembly of Canonical Orthodox Bishops combined, the total number of
Orthodox Church adherents is 797,600.
Differently, the answer to the second question indicates the number of parishioners participating in religious life
of a parish on a regular basis. US nationwide and for all jurisdictions of the Assembly of Canonical Orthodox
Bishops combined, the total number of persons attending Orthodox parishes on a regular weekly basis is
209,000.
The proportion between second (209,000) and first (797,600) figures is 26%. That is, only 26% of all Orthodox
Church adherents in America participate in the church life on a regular weekly basis.
Fact 2. While 26% of all American Orthodox Church adherents attend church services on a regular weekly
basis, this proportion – and, thus, reflecting the strength of church commitment - varies greatly from jurisdiction
to jurisdiction. Fig. 1 on the next page shows that in the Orthodox Church in America, Bulgarian Orthodox
Diocese and Carpatho-Russian Diocese at least 40% of all adherents attend church services regularly. On the
opposite end, in Vicariate for Palestinian Orthodox Communities, Patriarchal Parishes of the Russian Orthodox
Church and Romanian Orthodox Archdiocese, less than 20% of all members attend church weekly.
2

Fig 1. Church Attendance in Various American Orthodox Jurisdictions:
% of parishioners who attend on a regular weekly basis
15%
11%
19%
22%
37%
23%
31%
31%
40%
22%
48%
48%
26%
0% 10% 20% 30% 40% 50%
All US Orthodox Churches combined
Carpatho‐Russian Diocese
Bulgarian Diocese
Orthodox Church in America
Antiochian Archdiocese
Rus.Orth.Church Outside Russia
Ukrainian Orthodox Church
Albanian Orthodox Diocese
Greek Orthodox Archdiocese
Serbian Orthodox Church
Romanian Archdiocese
Patriarchal Parishes of ROC
Vicariate for Palestinian Communities
The differences in rates of church attendance have significant implications for how the actual membership in
various US Orthodox jurisdictions can be judged. For instance, Fig. 2 on the next page shows that Greek
Orthodox Archdiocese can claim much more adherents than all other Orthodox jurisdictions combined: 474,500
versus 323,100 respectively. However, if the membership would be measured by the number of persons
attending church regularly, the difference between the GOA and all other jurisdictions is not as dramatic:
105,800 and 103,200. The number of adherents in the Antiochian Archdiocese and in the Serbian Orthodox
Church is similar: 74,700 and 68,800 respectively. But there is a dramatic difference between these two
jurisdictions in number of members attending regularly: 27,300 in Antiochian Archdiocese but only 15,200 in
Serbian Orthodox Church. Both Patriarchal Parishes of the Russian Orthodox Church and Romanian
Archdiocese have more adherents than the Carpatho-Russian Diocese. However, because of the very poor rates
of attendance in the first two and high rates of attendance in the latter, the Carpatho-Russian Diocese has more
regularly participating church members than Romanian Archdiocese and Patriarchal Parishes combined. See
Fig. 2.
3

Fig. 2 Membership in Various American Orthodox Jurisdictions:
Total of Adherents Versus Number of Members Attending Regularly
474,500
84,500
74,700
68,800
27,400
22,100
12,400
11,500
10,500
7,200
2,500
1,200
5,000
8,600
2,200
1,900
6,800
15,200
800
27,300
33,500
105,800
0 100,000 200,000 300,000 400,000 500,000
Greek Orthodox Archdiocese
Orthodox Church in America
Antiochian Archdiocese
Serbian Orthodox Church
Rus.Orth.Ch.Outside Russia
Ukrainian Orthodox Church
Patriarchal Parishes of ROC
Romanian Archdiocese
Carpatho‐Russian Diocese
Palestinian Vicariate
Bulgarian Diocese
Total of adherents Number of members attending church regularly
These examples pose a challenging question for Church leadership. What is more important: having more
adherents – no matter how strong their church commitment is – or having more dedicated members regularly
participating in church life?
4

Fact 3. The rates of church attendance depend not only on jurisdiction. The size of a parish is also a significant
factor which has strong impact on percentage of parishioners regularly participating in church life. Fig. 3 shows:
as the total membership of a parish increases, the proportion of parishioners attending frequently goes down. In
simple terms, in very small parish communities a vast majority of members are likely to be in church every
Sunday. Quite differently, in large churches relatively few members are present at worship services every
weekend.
Fig. 3 Church Attendance in US Orthodox Parishes versus Size of a Parish:
% of parishioners attending on a regular weekly basis in the parishes of various size
(the parishes of all Orthodox jurisdictions combined)
0
10%
20%
30%
40%
50%
60%
70%
1 to 25
26 to 50
51 to 75
76 to 100
101 to125
126 to150
151 to175
176 to
200201 to250
251 to300
301 to 400
401 to 600
601 to1000
1001to
2000
2001+
Size of a parish (persons)
% Attendance
Further analysis of the data revealed an interesting phenomenon. When the total parish population reaches
around 150, the Sunday attendance drops significantly. This may be explained by something known as
“Dunbar’s number,” which is a theoretical cognitive limit of the number of people with whom one can maintain
stable and close social relationships. These are the type of relationships in which an individual knows who each
person is, and how each person relates to every other person. When Dunbar’s number is reached, the parish may
transform in the perception of the laity from a small family-like community to a more amorphous group of not
really well known people. In short, Fig. 3 suggests that the sense of the close-knit community has obvious effect
on proportion of parishioners involved regularly in the life of a parish.
5

Fact 4. Fig. 3 presents picture of church attendance for the parishes of all US Orthodox Churches combined.
However, the same rule – lower rates of attendance in the larger parish – holds true for the individual
jurisdictions as well. See Fig. 4.
One important conclusion can be drawn from Fig. 4. The above discussed fact that such jurisdictions as the
GOA or Serbian Orthodox Church have significantly lower rates of attendance than the OCA or Antiochian
Archdiocese cannot be simply “blamed” to the much larger average size of GOA and Serbian parishes as
compared to OCA or Antiochian churches. Indeed, Fig. 4 shows that GOA (blue line) and Serbian (grey line)
churches tend to have lower than national (black line) rates of attendance in almost all parish size categories.
Quite differently, the Antiochian (red line) and OCA (green line) churches are likely to be above national
average (black line) regardless size of their membership.
Fig. 4. Church Attendance in the Parishes of Various Jurisdictions versus Size of a Parish:
% of parishioners attending on a regular weekly basis in the parishes of various size
0%
10%
20%
30%
40%
50%
60%
70%
1‐25
26 ‐50 51‐75 76 – 100
101 ‐ 125
126 ‐150
151 ‐175
176 ‐200
201 ‐250
251 ‐300
301 ‐400
401 ‐ 600
601 ‐ 1000
1001 ‐2000
More than2000
Size of a parish (persons)
% Attendance
All parishes combined
AOCA
GOA
OCA
ROCOR
Serbian
Ukrainian
6
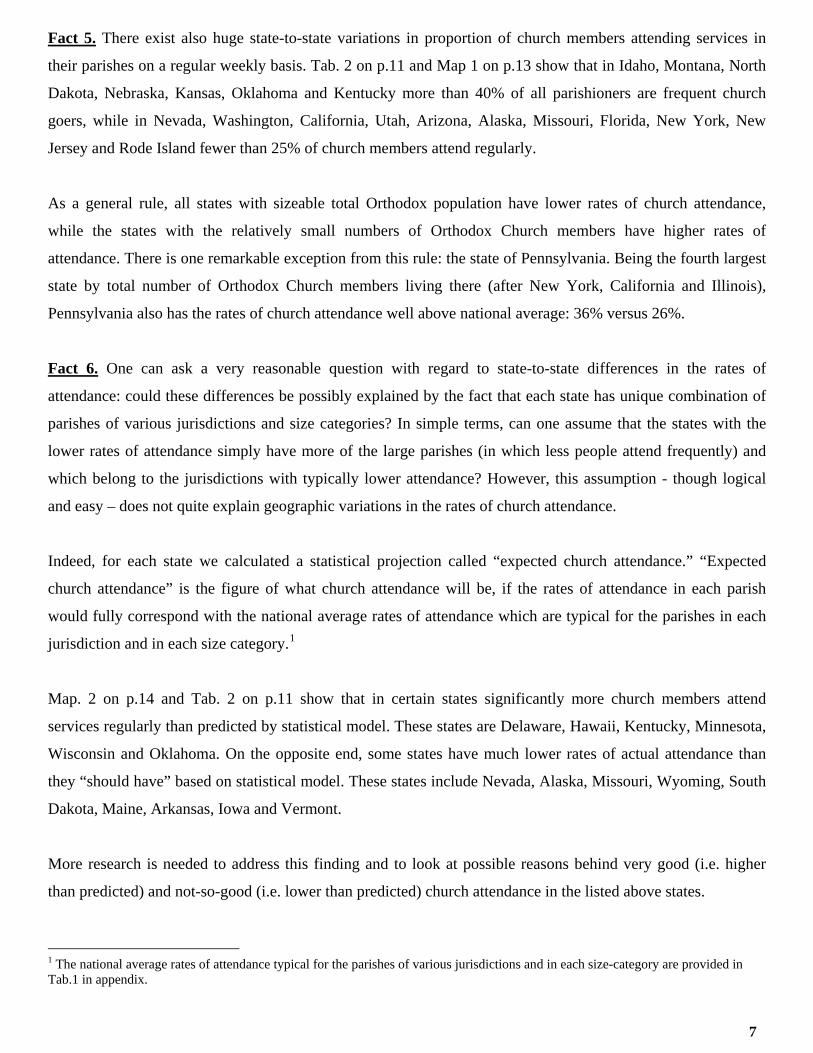
Fact 5. There exist also huge state-to-state variations in proportion of church members attending services in
their parishes on a regular weekly basis. Tab. 2 on p.11 and Map 1 on p.13 show that in Idaho, Montana, North
Dakota, Nebraska, Kansas, Oklahoma and Kentucky more than 40% of all parishioners are frequent church
goers, while in Nevada, Washington, California, Utah, Arizona, Alaska, Missouri, Florida, New York, New
Jersey and Rode Island fewer than 25% of church members attend regularly.
As a general rule, all states with sizeable total Orthodox population have lower rates of church attendance,
while the states with the relatively small numbers of Orthodox Church members have higher rates of
attendance. There is one remarkable exception from this rule: the state of Pennsylvania. Being the fourth largest
state by total number of Orthodox Church members living there (after New York, California and Illinois),
Pennsylvania also has the rates of church attendance well above national average: 36% versus 26%.
Fact 6. One can ask a very reasonable question with regard to state-to-state differences in the rates of
attendance: could these differences be possibly explained by the fact that each state has unique combination of
parishes of various jurisdictions and size categories? In simple terms, can one assume that the states with the
lower rates of attendance simply have more of the large parishes (in which less people attend frequently) and
which belong to the jurisdictions with typically lower attendance? However, this assumption - though logical
and easy – does not quite explain geographic variations in the rates of church attendance.
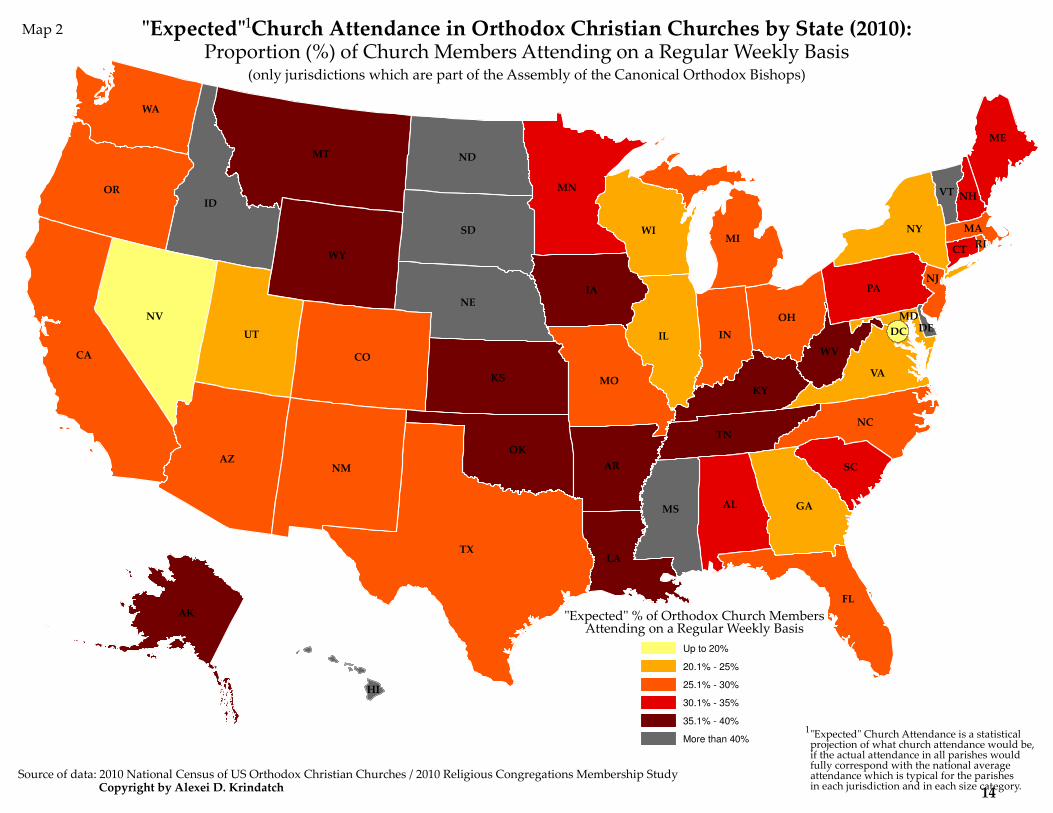
Indeed, for each state we calculated a statistical projection called “expected church attendance.” “Expected
church attendance” is the figure of what church attendance will be, if the rates of attendance in each parish
would fully correspond with the national average rates of attendance which are typical for the parishes in each
jurisdiction and in each size category.1
Map. 2 on p.14 and Tab. 2 on p.11 show that in certain states significantly more church members attend
services regularly than predicted by statistical model. These states are Delaware, Hawaii, Kentucky, Minnesota,
Wisconsin and Oklahoma. On the opposite end, some states have much lower rates of actual attendance than
they “should have” based on statistical model. These states include Nevada, Alaska, Missouri, Wyoming, South
Dakota, Maine, Arkansas, Iowa and Vermont.
More research is needed to address this finding and to look at possible reasons behind very good (i.e. higher
than predicted) and not-so-good (i.e. lower than predicted) church attendance in the listed above states.
1 The national average rates of attendance typical for the parishes of various jurisdictions and in each size-category are provided in Tab.1 in appendix.
7

Fact 7. For each state, we used differences between actual and expected church attendance in combination with
consistency of these difference from parish to parish and created “index of church attendance.” In simple terms,
the “index of church attendance” shows how good real church attendance in each state is compared to what
statistical model suggests it “should be.” The index of church attendance varies from 0 to 1.2 The higher index
of church attendance indicates the states where more parishioners attend regularly than predicted by statistical
model. The lower index of attendance indicates states where fewer church members attend regularly than
predicted by statistical model. Fig. 4 below and Map 3 on p.15 show how different states are faring in terms of
the index of church attendance with the states of Colorado, Kentucky, Oklahoma and Minnesota being the
“best” and the states of Alaska, South Dakota, Wyoming and Rode Island being the “worst.”
Fig. 4 Index of Church Attendance by State
AK
RI IA
UT VT ME
LA FL MAWA NV CT AR
CA MS ALWI GANJMOIN NH ID TX NYVA KS MIOHMTNMAZPA IL NC ND MD WV HI DC
SC DENEORTN
OKMNKYCO
SD WY
‐
0
0.2
0.4
0.6
0.8
1
2 The index of church attendance for each state is provided in Tab. 3 in appendix.
8

Fact 8. Are there any practical implications that Church leadership can use or any practical lessons that can be
learned from the index of church attendance? The answer to this question is “yes.” Fig. 5 shows relation
between index of church attendance and density of the Orthodox parishes (number of parishes per 1,000,000
general population) in each state.
The states in the upper left corner (Kentucky, Oklahoma, Tennessee, South Carolina, etc.) present an interesting
situation. Here, a relatively small number of currently existing Orthodox parishes is combined with very high
index of church attendance suggesting that these states could be good “candidates” for planting new Orthodox
missions and parishes. .
Fig. 5 State-by-State Index of Church Attendance versus Density of Orthodox Parishes
11 12 13 14 15 16 17 18
Number of Orthodox parishes per 1,000,000 state population
Index of church attendance
KY
MS LA
SD
AL
UT
TX GA
OK TN
ND MO
AR
NC
NV
NAZ M
SC HI
IA
VA
WA
ME
CA WI
OR
FL
MN
ID
CO
MD
KS
NE
MT
VT
IN
RI
IL
MI
WY
DE
WV
NY
OH
DC
NJ
NH
MA
CT
PA
0 0.1
0.2
0.3
0.4
0.5
0.6
0.7
0.8
0.9
1
0 1 2 3 4 5 6 7 8 9 10
9
Appendix.
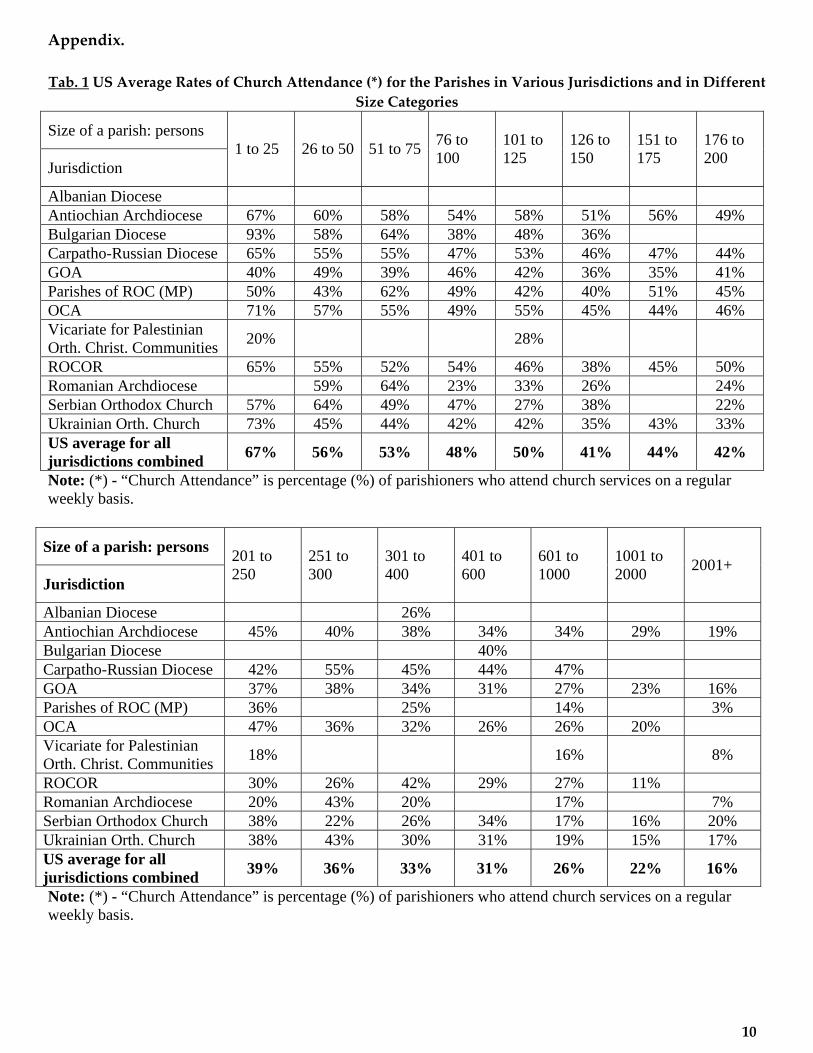
Tab. 1 US Average Rates of Church Attendance (*) for the Parishes in Various Jurisdictions and in Different
Size Categories
Size of a parish: persons
Jurisdiction 1 to 25 26 to 50 51 to 75
76 to 100
101 to 125
126 to 150
151 to 175
176 to 200
Albanian Diocese Antiochian Archdiocese 67% 60% 58% 54% 58% 51% 56% 49% Bulgarian Diocese 93% 58% 64% 38% 48% 36% Carpatho-Russian Diocese 65% 55% 55% 47% 53% 46% 47% 44% GOA 40% 49% 39% 46% 42% 36% 35% 41% Parishes of ROC (MP) 50% 43% 62% 49% 42% 40% 51% 45% OCA 71% 57% 55% 49% 55% 45% 44% 46% Vicariate for Palestinian Orth. Christ. Communities
20% 28%
ROCOR 65% 55% 52% 54% 46% 38% 45% 50% Romanian Archdiocese 59% 64% 23% 33% 26% 24% Serbian Orthodox Church 57% 64% 49% 47% 27% 38% 22% Ukrainian Orth. Church 73% 45% 44% 42% 42% 35% 43% 33% US average for all jurisdictions combined
67% 56% 53% 48% 50% 41% 44% 42%
Note: (*) - “Church Attendance” is percentage (%) of parishioners who attend church services on a regular weekly basis.
Size of a parish: persons
Jurisdiction
201 to 250
251 to 300
301 to 400
401 to 600
601 to 1000
1001 to 2000
2001+
Albanian Diocese 26% Antiochian Archdiocese 45% 40% 38% 34% 34% 29% 19% Bulgarian Diocese 40% Carpatho-Russian Diocese 42% 55% 45% 44% 47% GOA 37% 38% 34% 31% 27% 23% 16% Parishes of ROC (MP) 36% 25% 14% 3% OCA 47% 36% 32% 26% 26% 20% Vicariate for Palestinian Orth. Christ. Communities
18% 16% 8%
ROCOR 30% 26% 42% 29% 27% 11% Romanian Archdiocese 20% 43% 20% 17% 7% Serbian Orthodox Church 38% 22% 26% 34% 17% 16% 20% Ukrainian Orth. Church 38% 43% 30% 31% 19% 15% 17% US average for all jurisdictions combined
39% 36% 33% 31% 26% 22% 16%
Note: (*) - “Church Attendance” is percentage (%) of parishioners who attend church services on a regular weekly basis.
10

Tab. 2 State‐by‐State Actual Church Attendance and “Expected” (*) Church Attendance in Orthodox
Parishes which belong to the Assembly’s Jurisdictions
State
Actual church
attendance
(%)
Expected
attendance
(%)
State
Actual church
attendance (%)
Expected
attendance
(%)
Alabama 33% 33% Nebraska 49% 42%
Alaska 22% 39% Nevada 14% 20%
Arkansas 32% 38% New Hampshire 31% 33%
Arizona 25% 25% New Jersey 23% 25%
California 25% 25% New Mexico 30% 30%
Colorado 31% 27% New York 21% 21%
Connecticut 28% 30% North Carolina 25% 25%
Delaware 50% 40% North Dakota 58% 57%
Florida 21% 25% Ohio 26% 26%
Georgia 21% 25% Oklahoma 46% 40%
Hawaii 64% 46% Oregon 31% 29%
Idaho 50% 48% Pennsylvania 36% 33%
Illinois 26% 22% Rhode Island 24% 28%
Indiana 27% 26% South Carolina 35% 32%
Iowa 34% 39% South Dakota 28% 41%
Kansas 43% 39% Tennessee 37% 35%
Kentucky 57% 37% Texas 29% 28%
Louisiana 29% 37% Utah 21% 23%
Maine 28% 34% Vermont 38% 49%
Maryland 25% 23% Virginia 26% 25%
Massachusetts 25% 25% Washington 24% 28%
Michigan 28% 27% West Virginia 40% 36%
Minnesota 36% 30% Wisconsin 31% 25%
Mississippi 40% 43% Wyoming 40% 38%
Missouri 23% 28% Wash., DC 19% 17%
Montana 43% 39% US nationwide 26%
Note: (*) – “Actual Church Attendance” is percentage (%) of all Orthodox Church members in each state who attend church services on a regular weekly basis. “Expected Church Attendance" is a statistical projection of what church attendance in each state will be, if the rates of attendance in all parishes would fully correspond with the national average rates of attendance which are typical for the parishes in each jurisdiction and in each size category.
11

Tab. 3 State‐by‐State Index of Church Attendance (*) in Orthodox Parishes which belong to the Assembly’s
Jurisdictions
State
Index of
church
attendance
State
Index of
church
attendance
Alabama 0.58 Nebraska 0.78
Alaska 0 Nevada 0.54
Arkansas 0.54 New Hampshire 0.63
Arizona 0.68 New Jersey 0.61
California 0.56 New Mexico 0.68
Colorado 0.91 New York 0.63
Connecticut 0.54 North Carolina 0.70
Delaware 0.77 North Dakota 0.70
Florida 0.47 Ohio 0.67
Georgia 0.61 Oklahoma 0.84
Hawaii 0.73 Oregon 0.79
Idaho 0.63 Pennsylvania 0.68
Illinois 0.70 Rhode Island 0.19
Indiana 0.62 South Carolina 0.75
Iowa 0.23 South Dakota 0.09
Kansas 0.65 Tennessee 0.79
Kentucky 0.86 Texas 0.63
Louisiana 0.45 Utah 0.34
Maine 0.40 Vermont 0.38
Maryland 0.70 Virginia 0.64
Massachusetts 0.50 Washington 0.51
Michigan 0.66 West Virginia 0.71
Minnesota 0.85 Wisconsin 0.59
Mississippi 0.57 Wyoming 0.11
Missouri 0.61 Wash., DC 0.74
Montana 0.68 US nationwide 0.592
Note: (*) - “Index of Church Attendance” evaluates the difference between actual church attendance and “expected” church attendance in each state. “Expected” church attendance is a statistically calculated projection of what church attendance would be, if attendance in all parishes would fully correspond with the national average rates of attendance typical for the parishes in each jurisdiction and in each size category. The index of church attendance varies from 0 to 1. The higher index of church attendance indicates the states where more parishioners attend regularly than predicted by statistical model. The lower index of attendance indicates states where fewer church members attend regularly than predicted by statistical model.
12

TX
CA
MT
AZ
NV
ID
CO
NM
OR
KS
UT
WY
IL
NE
SD
IA
FL
MN
OK
ND
WI
WA
MO
AL GA
AR
PA
LA
NC
NY
IN
MI
MS
TN
KY
VA
OH
SC
ME
WV
VT
NJ
NH
CT
MD
MA
DE
RI
DC
AK
HI
% of Orthodox Church MembersAttending on a Regular Weekly Basis
Copyright by Alexei D. Krindatch
Up to 20%
20.1% - 25%
25.1% - 30%
30.1% - 35%
35.1% - 40%
More than 40%
Proportion (%) of Church Members Attending on a Regular Weekly Basis
Source of data: 2010 National Census of US Orthodox Christian Churches / 2010 Religious Congregations Membership Study 1US nationwide and for all Orthodox Churchescombined, the average rate of attendance is 26%.
Church Attendance in Orthodox Christian Churches by State (2010):1
(only jurisdictions which are part of the Assembly of the Canonical Orthodox Bishops)
DC
MD
Map 1
13
TX
CA
MT
AZ
NV
ID
CO
NM
OR
KS
UT
WY
IL
NE
SD
IA
FL
MN
OK
ND
WI
WA
MO
AL GA
AR
PA
LA
NC
NY
IN
MI
MS
TN
KY
VA
OH
SC
ME
WV
VT
NJ
NH
CT
MD
MA
DE
RI
DC
AK
HI
"Expected" % of Orthodox Church MembersAttending on a Regular Weekly Basis
Copyright by Alexei D. Krindatch
Up to 20%
20.1% - 25%
25.1% - 30%
30.1% - 35%
35.1% - 40%
More than 40%
Proportion (%) of Church Members Attending on a Regular Weekly Basis
Source of data: 2010 National Census of US Orthodox Christian Churches / 2010 Religious Congregations Membership Study
1"Expected" Church Attendance is a statisticalprojection of what church attendance would be,if the actual attendance in all parishes wouldfully correspond with the national averageattendance which is typical for the parishesin each jurisdiction and in each size category.
"Expected" Church Attendance in Orthodox Christian Churches by State (2010):1
(only jurisdictions which are part of the Assembly of the Canonical Orthodox Bishops)
DC
MD
Map 2
14

TX
CA
MT
AZ
ID
NV
CO
NM
OR
KS
UT
SD
IL
WY
NEIA
FL
MN
OK
ND
WI
MO
WA
GAAL
AR
PA
LA
MS
MI
NC
NY
IN
TN
KY
VA
OH
SC
ME
WV
VT
NJ
NH
CT
MD
MA
DE
RI
DC
The Index of churchattendance shows the
difference betweenactual and "expected"church attendance in
each state.
Actual church atten-dance is the percent-
age of church membersattending services on a
regular weekly basis.
"Expected" church atten-dance is a statistically calcu-
lated projection of what churchattendance would be, if attendance
in all parishes would fully corre-spond with the national average rates
of attendance typical for the parishes ineach jurisdiction and in each size category.
The higher index of church attendanceindicates the states where more parishion-
ers attend regularly than predicted bystatistical model.
The lower index of attendance indicatesthe states, where fewer church members
attend regularly than predicted bystatistical model.
AK
HI
Index of Church of Attendance
Copyright by Alexei D. Krindatch
.81 - 1.0
.71 - .80
.51 - .70
.21 - .50
0.0 - .20
Source of data: 2010 National Census of US Orthodox Christian Churches / 2010 Religious Congregations Membership Study
1
Index of Church Attendance in Orthodox Christian Churches1
(only jurisdictions which are part of the Assembly of the Canonical Orthodox Bishops)
DC
MD
Map 3
15