Factors That Student Success - Saint Mary's College That Impact Student Success A Synthesis of Key...
13
Factors That Impact Student Success A Synthesis of Key Data Sources August 2010 1
Transcript of Factors That Student Success - Saint Mary's College That Impact Student Success A Synthesis of Key...
Factors That Impact Student Success
A Synthesis of Key Data Sources
August 2010
1
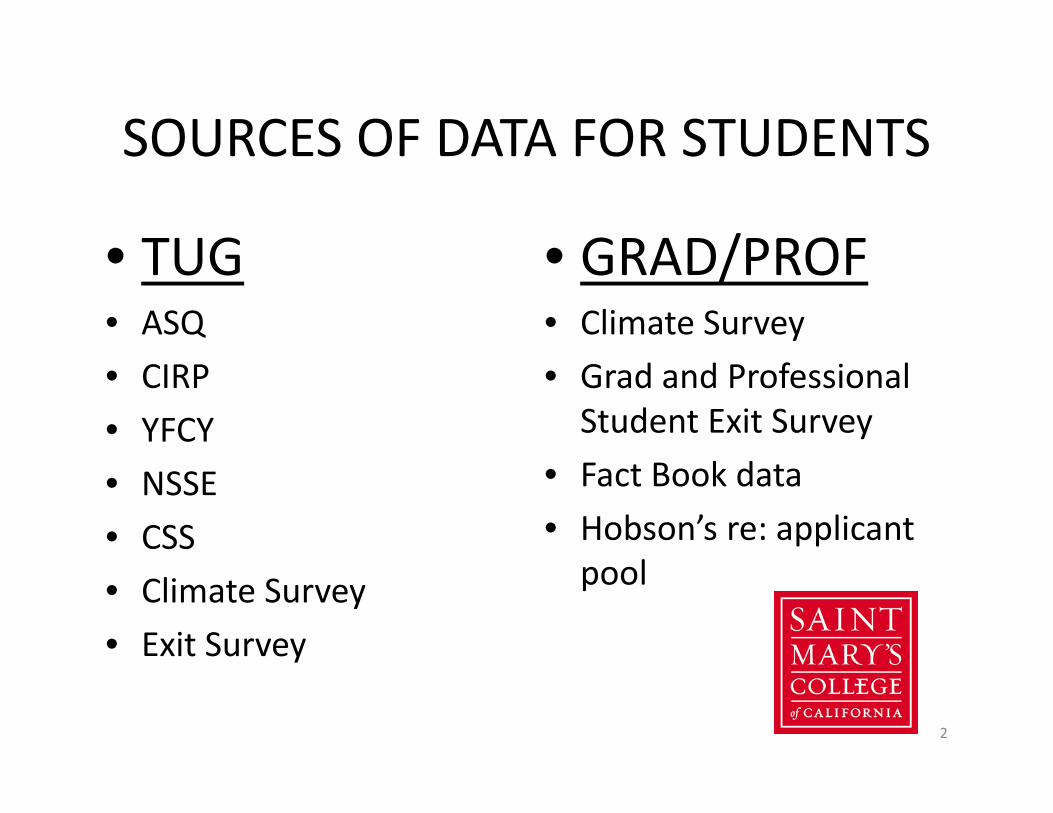
SOURCES OF DATA FOR STUDENTSSOURCES OF DATA FOR STUDENTS
• TUG • GRAD/PROF• TUG• ASQ
• GRAD/PROF• Climate Survey
• CIRP
• YFCY
• Grad and Professional Student Exit Survey
• NSSE
• CSS
• Fact Book data
• Hobson’s re: applicant l• Climate Survey
• Exit Survey
pool
2
RECENT ANALYSES OF TUGRECENT ANALYSES OF TUG STUDENT SUCCESS – ANSTUDENT SUCCESS AN
INVESTIGATION INTO THE 2005‐2009 COHORT
A REPORT BY EDUVENTURES USING VARIOUS DATA SOURCES
3
Executive Summary
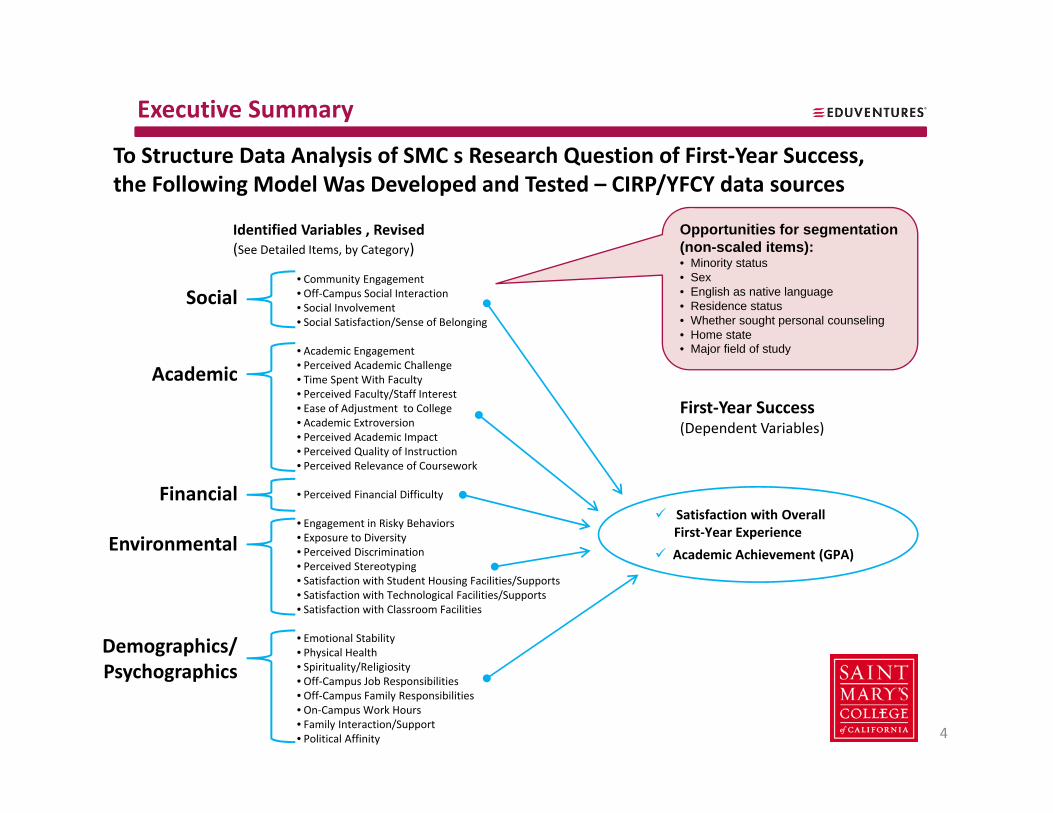
T St t D t A l i f SMC R h Q ti f Fi t Y STo Structure Data Analysis of SMC s Research Question of First‐Year Success, the Following Model Was Developed and Tested – CIRP/YFCY data sources
Identified Variables , Revised(See Detailed Items, by Category)
Opportunities for segmentation (non-scaled items):(See Detailed Items, by Category)
• Community Engagement• Off‐Campus Social Interaction• Social Involvement• Social Satisfaction/Sense of Belonging
• Academic Engagement
Social
( )• Minority status• Sex• English as native language • Residence status • Whether sought personal counseling• Home state• Major field of studyg g
• Perceived Academic Challenge• Time Spent With Faculty• Perceived Faculty/Staff Interest• Ease of Adjustment to College• Academic Extroversion• Perceived Academic Impact• Perceived Quality of Instruction
Academic
First‐Year Success (Dependent Variables)
• Perceived Relevance of Coursework
• Perceived Financial Difficulty
• Engagement in Risky Behaviors• Exposure to Diversity• Perceived Discrimination
Financial
Environmental
Satisfaction with Overall First‐Year Experience
Academic Achievement (GPA)• Perceived Stereotyping• Satisfaction with Student Housing Facilities/Supports• Satisfaction with Technological Facilities/Supports• Satisfaction with Classroom Facilities
• Emotional Stability• Physical HealthS i i li /R li i i
Demographics/
( )
• Spirituality/Religiosity• Off‐Campus Job Responsibilities• Off‐Campus Family Responsibilities• On‐Campus Work Hours• Family Interaction/Support• Political Affinity
Psychographics
4
Executive Summary
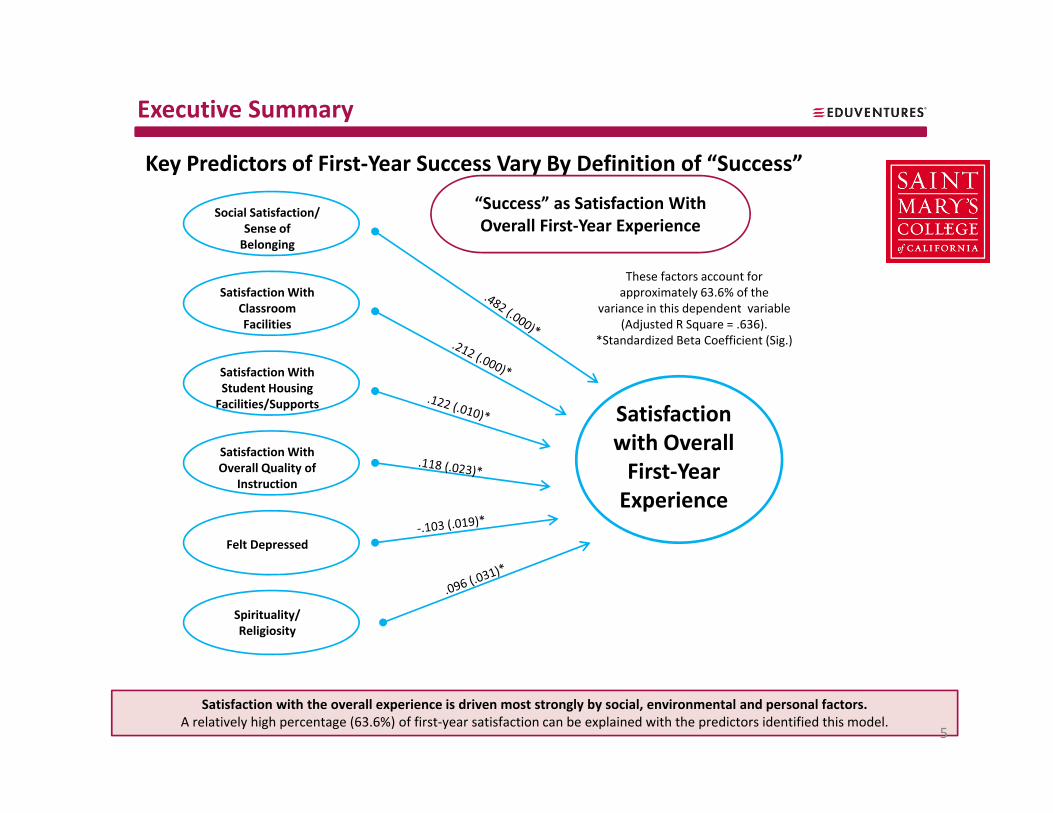
Key Predictors of First‐Year Success Vary By Definition of “Success”
“Success” as Satisfaction With Overall First‐Year Experience
Social Satisfaction/ Sense of Belonging
Satisfaction With Classroom Facilities
These factors account for approximately 63.6% of the
variance in this dependent variable (Adjusted R Square = .636).
*Standardized Beta Coefficient (Sig.)
Satisfaction With Student Housing Facilities/Supports
Satisfaction With
Satisfaction with Overall
Overall Quality of Instruction
Felt Depressed
First‐Year Experience
Spirituality/ Religiosity
Satisfaction with the overall experience is driven most strongly by social, environmental and personal factors. A relatively high percentage (63.6%) of first‐year satisfaction can be explained with the predictors identified this model.
5
Executive Summary
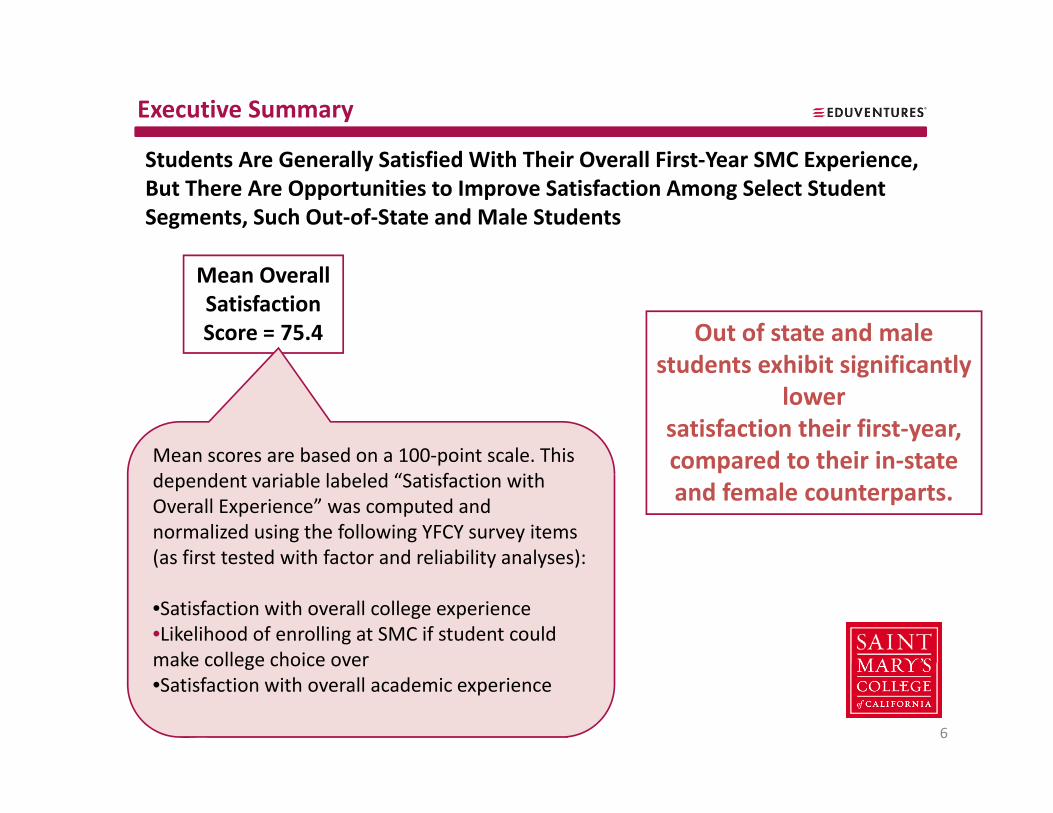
Students Are Generally Satisfied With Their Overall First‐Year SMC Experience, But There Are Opportunities to Improve Satisfaction Among Select Student Segments, Such Out‐of‐State and Male Students
Mean Overall Satisfaction Score = 75.4 Out of state and male
d hibi i ifi l
Mean scores are based on a 100‐point scale This
students exhibit significantly lower
satisfaction their first‐year, compared to their in stateMean scores are based on a 100 point scale. This
dependent variable labeled “Satisfaction with Overall Experience” was computed and normalized using the following YFCY survey items (as first tested with factor and reliability analyses):
compared to their in‐state and female counterparts.
(as first tested with factor and reliability analyses):
•Satisfaction with overall college experience•Likelihood of enrolling at SMC if student could make college choice overmake college choice over•Satisfaction with overall academic experience
6
Executive Summary
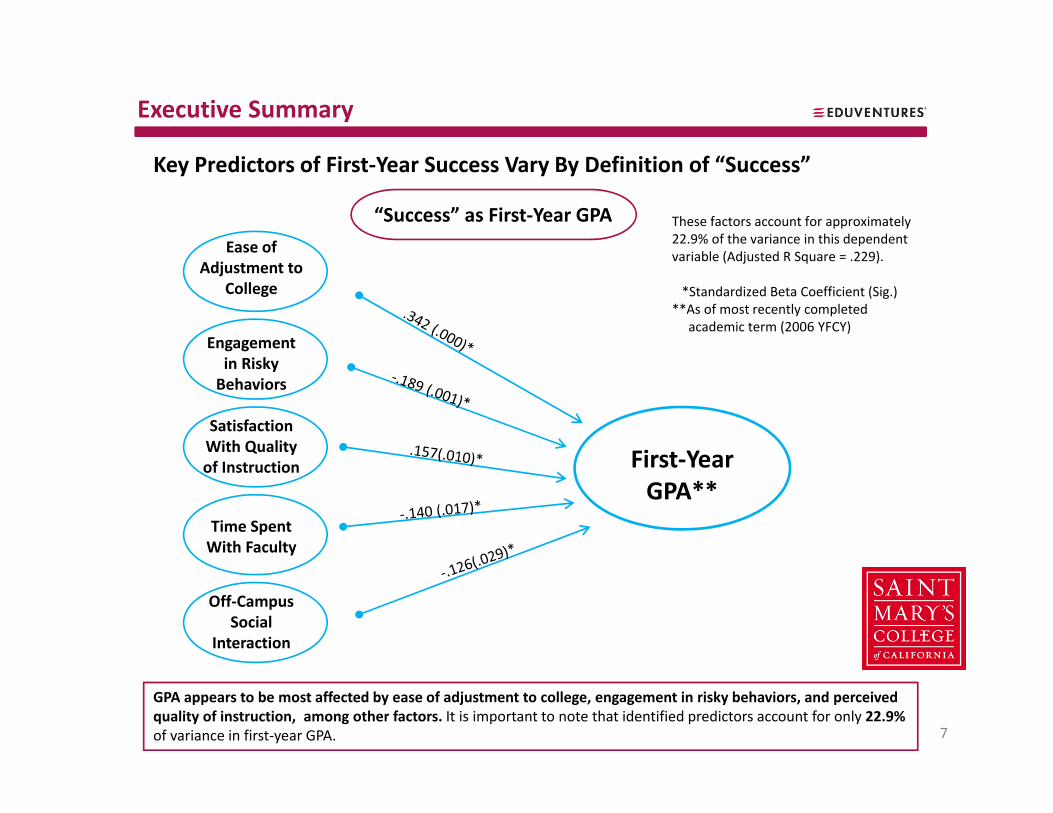
Key Predictors of First‐Year Success Vary By Definition of “Success”
“Success” as First‐Year GPA
Ease of
These factors account for approximately 22.9% of the variance in this dependent
i bl (Adj t d R S 229)Adjustment to
College
Engagement
variable (Adjusted R Square = .229).
*Standardized Beta Coefficient (Sig.)**As of most recently completed
academic term (2006 YFCY)
in Risky Behaviors
Satisfaction With Quality
First Yearof Instruction
Time Spent With Faculty
First‐YearGPA**
Off‐Campus Social
Interaction
GPA appears to be most affected by ease of adjustment to college, engagement in risky behaviors, and perceived quality of instruction, among other factors. It is important to note that identified predictors account for only 22.9%of variance in first‐year GPA. 7
Executive Summary
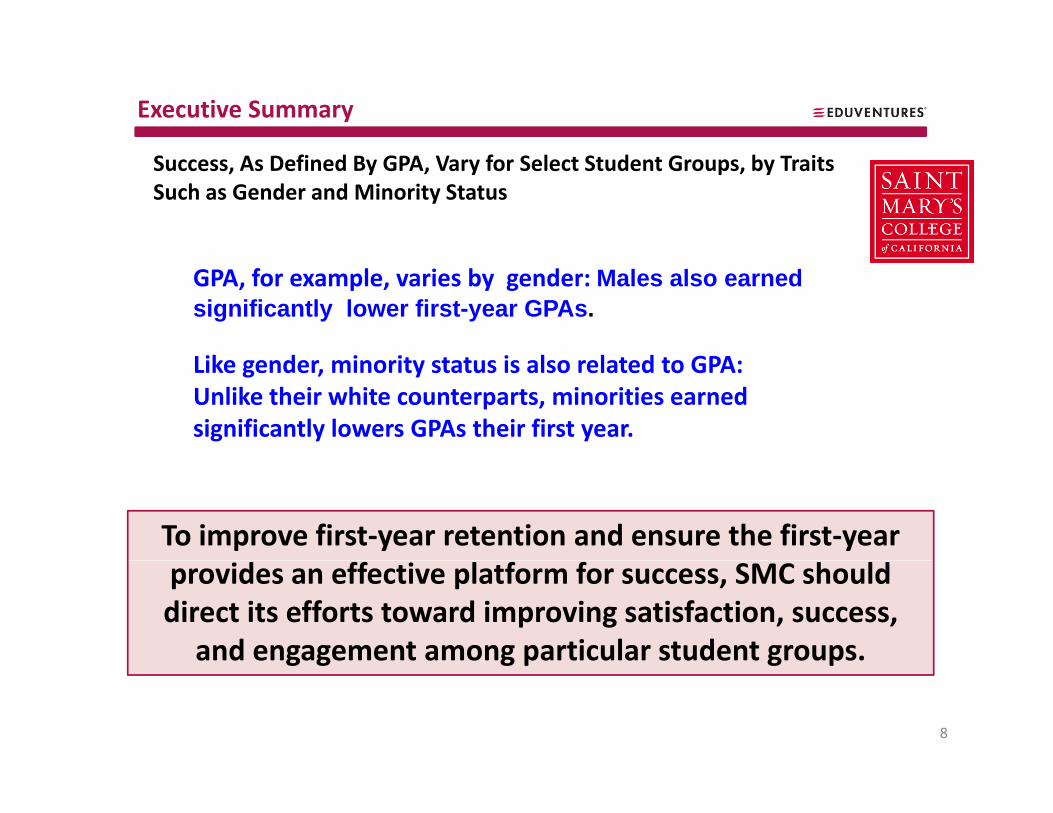
Success, As Defined By GPA, Vary for Select Student Groups, by Traits Such as Gender and Minority Status
GPA, for example, varies by gender: Males also earned significantly lower first-year GPAs.
ik d i i i l l dLike gender, minority status is also related to GPA: Unlike their white counterparts, minorities earned significantly lowers GPAs their first year.
To improve first‐year retention and ensure the first‐year provides an effective platform for success, SMC should direct its efforts toward improving satisfaction, success, and engagement among particular student groups.g g g p g p
8
Executive Summary
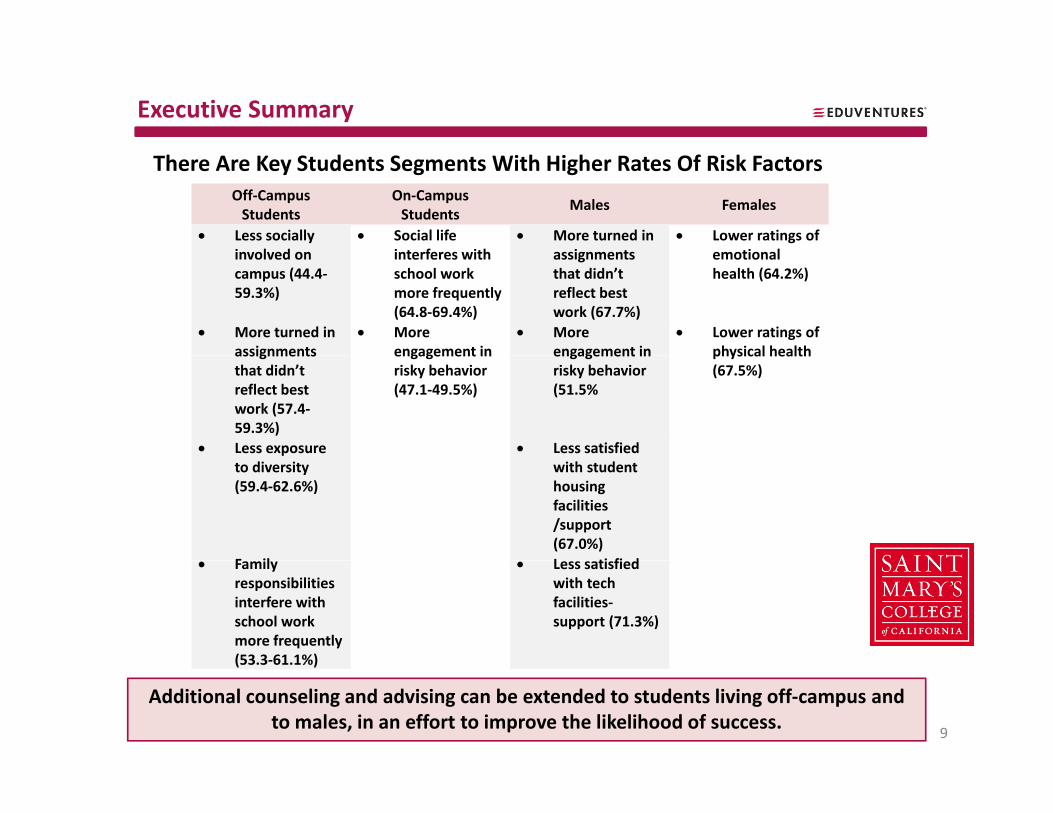
There Are Key Students Segments With Higher Rates Of Risk FactorsOff‐Campus Students
On‐Campus Students
Males Females
Less socially involved on
Social life interferes with
More turned in assignments
Lower ratings of emotionalinvolved on
campus (44.4‐59.3%)
interferes with school work more frequently (64.8‐69.4%)
assignments that didn’t reflect best work (67.7%)
emotional health (64.2%)
More turned in assignments
More engagement in
More engagement in
Lower ratings of physical healthassignments
that didn’t reflect best work (57.4‐59.3%)
engagement in risky behavior (47.1‐49.5%)
engagement in risky behavior (51.5%
physical health (67.5%)
Less exposure Less satisfied to diversity (59.4‐62.6%)
with student housing facilities /support (67.0%)
F il L ti fi d Family responsibilities interfere with school work more frequently (53.3‐61.1%)
Less satisfied with tech facilities‐support (71.3%)
Additional counseling and advising can be extended to students living off‐campus and to males, in an effort to improve the likelihood of success.
(53.3 61.1%)
9
Executive Summary
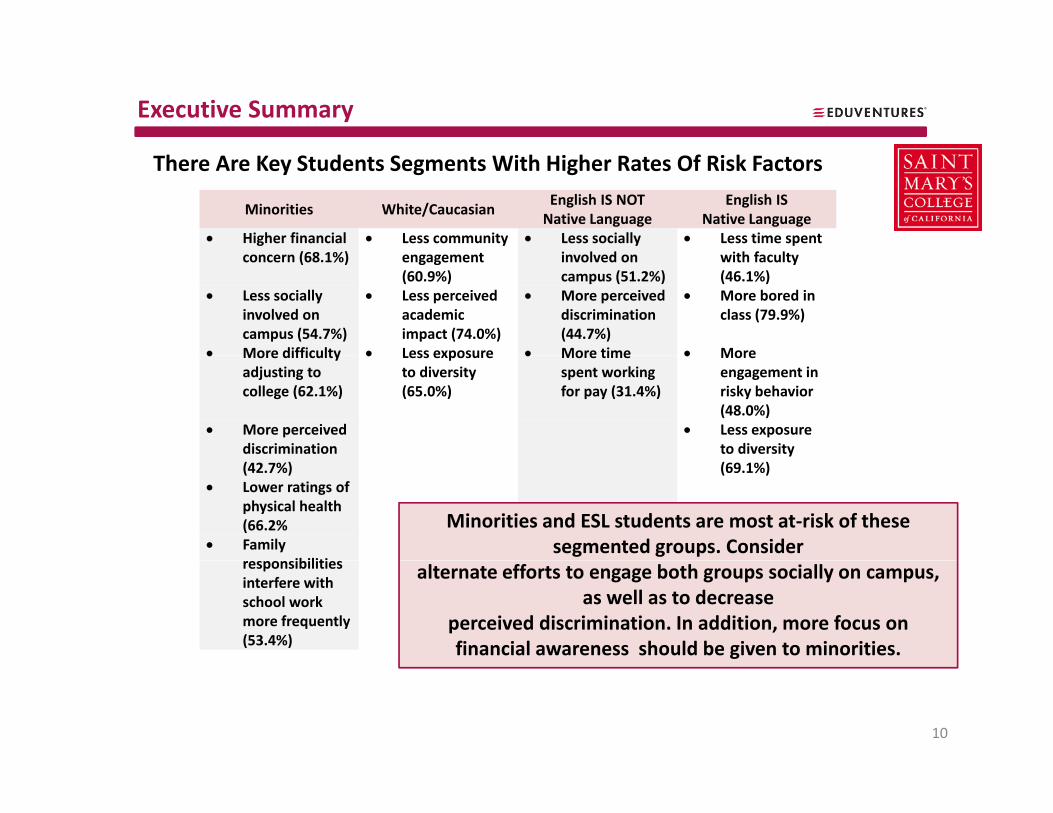
There Are Key Students Segments With Higher Rates Of Risk Factors
Minorities White/CaucasianEnglish IS NOT Native Language
English IS Native Language
Higher financial (68 1%)
Less community t
Less socially i l d
Less time spent ith f ltconcern (68.1%) engagement
(60.9%)involved on campus (51.2%)
with faculty (46.1%)
Less socially involved on campus (54.7%)
Less perceived academic impact (74.0%)
More perceived discrimination (44.7%)
More bored in class (79.9%)
More difficulty Less exposure More time More More difficulty adjusting to college (62.1%)
Less exposure to diversity (65.0%)
More time spent working for pay (31.4%)
More engagement in risky behavior (48.0%)
More perceived discrimination
Less exposure to diversity
(42.7%) (69.1%) Lower ratings of
physical health (66.2%
Family ibiliti
Minorities and ESL students are most at‐risk of these segmented groups. Consider
responsibilities interfere with school work more frequently (53.4%)
alternate efforts to engage both groups socially on campus, as well as to decrease
perceived discrimination. In addition, more focus on financial awareness should be given to minorities.
10
GRAD/PROFESSIONAL STUDENT SATISFACTION
• Low response rates to Climate Survey• Low response rates to Climate Survey
• Low response rates to new Exit Survey
• HOWEVER:
• We do know that these students also do• We do know that these students also do not feel connected in important ways to ththe campus………
11
ISSUES FOR GRAD/PROF STUDENTSISSUES FOR GRAD/PROF STUDENTS
• Lack of services available during their schoolLack of services available during their school hours – evenings/weekends, including– Business office– Business office
– Health and Wellness and Counseling Center
L k f f li i t t d i t th• Lack of feeling integrated into the campus:– Just now have a grad/professional catalog
– Often questions/issues focus only on TUGs
– “Campus‐wide” events often don’t include or take i d/ f d d f linto account grad/prof. students and faculty
– Just now have a student survey for grad/prof. 12
GOALS FOR UNDERSTANDING OUR STUDENTS’ SUCCESS
• Consistently collect data to:Consistently collect data to:– Learn more about our students, their experiences and factors contributing to their successand factors contributing to their success,
– measure progress towards student, program and institutional goals,institutional goals,
– assess alignment of our efforts with our institutional values, ,
– utilize data in program evaluation, modification, and implementation, based on our values.
13