FACTORS THAT AFFECT TRANSPORT MODE PREFERENCE FOR …jestec.taylors.edu.my/Vol 8 Issue 3 June...
13
Journal of Engineering Science and Technology Vol. 8, No. 3 (2013) 351 - 363 © School of Engineering, Taylor’s University 351 FACTORS THAT AFFECT TRANSPORT MODE PREFERENCE FOR GRADUATE STUDENTS IN THE NATIONAL UNIVERSITY OF MALAYSIA BY LOGIT METHOD ALI AHMED MOHAMMED 1,2, *, ALAA A. SHAKIR 3 1 Department of Civil and Structural Engineering, Faculty of Engineering, The National University of Malaysia (UKM), 43600 Bangi, Selangor Darul Ehsan, Malaysia 2 Ministry of Higher Education and Scientific Research- Office Reconstruction and Projects Department, Iraq 3 Department of Civil Engineering, Universiti of Tenaga Nasional, Jalan IKRAM-UNITEN, 43000, Kajang, Selangor, Malaysia *Corresponding Author: [email protected] Abstract A study was carried out to examine the perceptions and preferences of students on choosing the type of transportation for their travels in university campus. This study focused on providing personal transport users road transport alternatives as a countermeasure aimed at shifting car users to other modes of transportation. Overall 456 questionnaires were conducted to develop a choice of transportation mode preferences. Consequently, Logit model and SPSS were used to identify the factors that affect the determination of the choice of transportation mode. Results indicated that by reducing travel time by 70% the amount of private cars users will be reduced by 84%, while reduction the travel cost was found to be highly improving the public modes of utilization. This study revealed positive aspects is needed to shift travellers from private modes to public. The positive aspect contributes to travel time and travel cost reduction, hence improving the services, whereby contributing to sustainability. Keywords: Park and ride, Car reduction, University, Logit model, Modal shift. 1. Introduction Park and Ride (P&R) is a supply-side measure in which is internationally used as a mean of dealing with congestion and traffic-related pollution. P&R is used to persuade motorists to transfer to public transportation mode by offering price or time saving against the alternative of driving for the whole journey and parking in
Transcript of FACTORS THAT AFFECT TRANSPORT MODE PREFERENCE FOR …jestec.taylors.edu.my/Vol 8 Issue 3 June...

Journal of Engineering Science and Technology Vol. 8, No. 3 (2013) 351 - 363 © School of Engineering, Taylor’s University
351
FACTORS THAT AFFECT TRANSPORT MODE PREFERENCE FOR GRADUATE STUDENTS IN THE NATIONAL UNIVERSITY
OF MALAYSIA BY LOGIT METHOD
ALI AHMED MOHAMMED1,2,
*, ALAA A. SHAKIR3
1Department of Civil and Structural Engineering, Faculty of Engineering, The National
University of Malaysia (UKM), 43600 Bangi, Selangor Darul Ehsan, Malaysia 2Ministry of Higher Education and Scientific Research- Office Reconstruction
and Projects Department, Iraq 3Department of Civil Engineering, Universiti of Tenaga Nasional, Jalan IKRAM-UNITEN,
43000, Kajang, Selangor, Malaysia
*Corresponding Author: [email protected]
Abstract
A study was carried out to examine the perceptions and preferences of students on
choosing the type of transportation for their travels in university campus. This
study focused on providing personal transport users road transport alternatives as
a countermeasure aimed at shifting car users to other modes of transportation.
Overall 456 questionnaires were conducted to develop a choice of transportation mode preferences. Consequently, Logit model and SPSS were used to identify the
factors that affect the determination of the choice of transportation mode. Results
indicated that by reducing travel time by 70% the amount of private cars users
will be reduced by 84%, while reduction the travel cost was found to be highly
improving the public modes of utilization. This study revealed positive aspects is needed to shift travellers from private modes to public. The positive aspect
contributes to travel time and travel cost reduction, hence improving the services,
whereby contributing to sustainability.
Keywords: Park and ride, Car reduction, University, Logit model, Modal shift.
1. Introduction
Park and Ride (P&R) is a supply-side measure in which is internationally used as
a mean of dealing with congestion and traffic-related pollution. P&R is used to
persuade motorists to transfer to public transportation mode by offering price or
time saving against the alternative of driving for the whole journey and parking in

352 A. A. Mohammed and A. A. Shakir
Journal of Engineering Science and Technology June 2013, Vol. 8(3)
the host centre’s urban core [1]. In an attempt to reduce the parking space demand
and the environmental impacts of private cars, universities around the world are
implementing strategies to reduce dependence on private vehicles and increase
the use of alternative modes of transport [2]. In general, the private cars are the
most attractive mode of transport due to their convenience, speed; comfort and
individual freedom are just part of the list that has been frequently promoted in
car commercial. That public mode of transportation needs to adjust the service to
the attributes required by consumers in order to become more attractive [3, 4].
The private car is one of the major modes of personal transport in Malaysia
[5] mainly because it is affordable and more reliable than the other transport
available [6]. Thus, about 40% of the registered vehicles in the country are private
cars. Therefore, numbers of registered private cars have recently increased from 911,752 in 1990 to, 1,811,141 in 2004 [7]. Consequently, private car accidents
have also increased from 79.642 to 380.589 [8]. The economic toll from private
car use, such as accidents, traffic jams and environmental pollution has
encouraged the Malaysian government to explore various measures to control it
[9]. The use of public transport as bus and train was found to be the sustainable
solution [10]. The ever-increasing societal cost of private transport has made it
imperative to encourage more use of public transport. Moreover, many measures
can be used to minimize the utilization of private cars such as banning cars in
certain areas, rising the minimum driving age, increasing the cost of parking,
improving public transport and create other convenience types of public
transportation such as Park and Ride system [11].
The Park-and-Ride System is an intermodal staging location for transfers
between numerous transport modes, Park-and-ride facilities have traditionally been
viewed as only a component of the larger transit or highway auto-oriented modes
[12]. From a system perspective, a park-and-ride network can be recognized as
having unique modal characteristics neither shared by the traditional transit nor by
the highway modes [13]. Characteristics including demand patterns, service area
concepts, patron attributes, transit operating concepts, and modes of access provide
opportunities over other modes of transit for private investment and private-public
partnering [14]. A healthy park-and-ride system can be used to encourage urban
development in lower density suburban environments However, It may cause
sprawl to be continued, upon the location and design of the individual facilities
within the system [15]. This monograph has been written largely from the
perspective of the park-and-ride lot as a unique facility, to a modal system.
However, keeping in mind the unique modal characteristics of the park-and-ride
system will provide the transportation planner with valuable insights into the
specific facility-related attributes explored herein [16].
2. Study Methodology and Model Structure
The study methodology in this paper is based on the primary and secondary data.
A case study was performed in the national university of Malaysia and analytical
Model choice behaviour and the shift from private to public transportation mode
were analysed through data collection in which it is interpreted by Using SPSS
and logit model choice. Data collection was done by the survey based on a
questionnaire that collected different attributes including age, race, and Number
of members of the household and level of education either master or PhD, study

Factors that Affect Transport Mode Preference for Graduate Students 353
Journal of Engineering Science and Technology June 2013, Vol. 8(3)
cost, university bus service, thus giving a clear image of their socioeconomic and
demographic profiles. Other information collected includes: level of knowledge
(of public transport), travel time, travel cost, number of trips and the preferred
mean of transportation A total of N = 456 questionnaires were distributed and
collected throughout the process of data collection. The data was collected by
personal interview with car users because they are the target of the study. Details
of the road user's behaviour that were got from the data collection and the
procedure of the data analysis to establish the model is illustrated in Fig. 1.
Fig. 1. Design Illustration of Strategies
Used for Data Collection and Analysis.
SPSS analytical system used to determine which parts of the questionnaire
were relevant and which were not to each other. The procedure used for the
variables assesses the number of commonly used measures and also provides
information on the relationships between the individual items in the scale such as
gender, nationality, age, household size and mode of transportation and the
walking ability the explanatory variables of data collection.
The logic model was used as a final model to investigate mode choice
behaviour of travellers to highlight the trend of the travellers when considering
their mode of transport [17]. The proposed model used to determine the
dependent variables is evaluated based on the following equation.
( )
1
1 f Xy
e −=+
(1)
Determinant Variables for the Model Shift
Questionnaire Design
Survey Information Campus Trip Improving the Public
Transportation Mode
Collection & Input of Data for Analysis
Establishment of linear Choice Model
Estimation of the Model Parameters and the
Identification
Prediction of Policy Measures on Drift to
Public Transportation Usage
Recommendations for Student Drift from
Private to Public Mode of Transportation
Did the Choice Model Meet
the Required Result?
No
Yes

354 A. A. Mohammed and A. A. Shakir
Journal of Engineering Science and Technology June 2013, Vol. 8(3)
The single-layer network is identical to the logistic regression model. This
function has a continuous derivative, which allows it to be used in back-
propagation [18].
The following functional form is used to determine the dependent variables
(var )
1
1 iableP
D eα=+
(2)
/
/
1 ( , , , , )
1
t
t
m eP t a m n a
n e
τ
ττ
−
−
+=
+ (3)
The special case of the logistic function with a = 1, m = 0, n = 1, τ = 1, namely
1( )
1 tP t
e −=
+ (4)
for real parameters a, m, n, and τ. These functions find applications in a range
of fields, including economics [19].
A logistic function or logistic curve is the most common sigmoid curve. It
models the "S-shaped" curve (abbreviated S-curve) of growth of some set: P
denotes a set. P will be used to denote a function which varies over time.
Normally such a function is written P(t). However, such a function may also be
read as a set of ordered pairs of the form < t, P (t)>. The initial stage of growth is
approximately exponential; then, as saturation begins, the growth slows, and at
maturity, growth stops [6]
1
( ) ( )
1 1( ) (1 ( ))
1 1t tP t exp t
e exp
−
− −= = = + −
+ + (5)
` (1 )P p p= − (6)
The function P has the intuitively appealing quality that
1 (t) ( )P p t− = − (7)
Pilot survey data obtained from question related to proportion of people board
on minibus with respective to a series of proposed travel time reduction has been
used to calibrate the Logit model with variable = time factor [20].
(var)
1
1P
D eα=+
(8)
P(t) is the probability of success when the value of the predictor variable is t.
( )
1
1 rP
D eα=
+ (9)
Algebraic manipulation shows that
( )1 rPD e
P
α ⋅−= (10)
( )1ln ln rP
DP
α−
= + (11)

Factors that Affect Transport Mode Preference for Graduate Students 355
Journal of Engineering Science and Technology June 2013, Vol. 8(3)
The above equation investigates the calibration process based on the values of
D and α values which were extracted from ANOVA table using Microsoft Excel.
These results applied to the final equation shown below and then the results were
used for model validation according to the following equation [21]
(var )
1
1 iableP
D eα=
+ (12)
3. Results and Discussion
Results for travel time improvement for the mini bus analyzed by SPSS are
indicated in Tables 1 and 2. Table 1 shows a time reduction of (30%) in current
bus transportation servicing in university will attract (34%) of students to the bus
while, a time reduction of (70%) will attract (84%) of students to use the public
bus service (Park and Ride) as indicated in Fig. 2.
Table 1. Improving the Travel Time for the Minibus.
Valid Frequency Percent Valid Percent Cumulative Percent
10% 70 15.350 15.350 15.350
30% 85 18.640 18.640 33.991
50% 151 33.114 33.114 67.105
70% 79 17.324 17.324 84.429
90% 71 15.570 15.570 100.0
Total 456 100.0 100.0
Table 2. Illustration of Cumulative Percent %.
Travelling Time Reduction Survey Results (P) (1-P)/P ln(1-P)/P
10% 0.153 5.514 1.707
30% 0.186 4.364 1.473
50% 0.331 2.019 0.703
70% 0.173 4.772 1.562
90% 0.155 5.422 1.690
Fig. 2. Relationship between Percentage and Travel Time Reduction.

356 A. A. Mohammed and A. A. Shakir
Journal of Engineering Science and Technology June 2013, Vol. 8(3)
Results for the process of calibration which then imported to Excel to get the
ANOVA are indicated in Table 3. From ANOVA and Regression table our model
got the value of P equals to (5.66E-05) which somehow acceptable to be
significant (significant value < 0.05) while is R Square (0.99652) [22, 23]. The
high correlation between survey results and Logit model is demonstrated in Fig. 3
where both of the survey results and the modelled ones were increased with the
reduction of travel time.
Table 3. Illustration of Survey Results and Logit Model Results.
Travelling Time Reduction Survey Results
(P)
Results from Logit
model
10% 0.153 0.156
30% 0.339 0.338
50% 0.671 0.670
70% 0.844 0.842
90% 1 0.999
Fig. 3. Relationship between Probability to Shift and Reduction Time.
Results for improving the waiting facility at the bus stop are indicated in Table
4 and Fig. 4. It is as shown from Table 4 that (29%) of the people prefer using
minibus if there is (60%) reduction on the regularity of schedules while, reduction
of (36%) on the regularity of schedules will be sufficient to encourage (68%) of
the common to use minibus.
Table 4. Improving the Waiting Facility at the Bus Stop.
Valid Frequency Percent Valid Percent Cumulative Percent
5 minute 240 52.631 52.631 52.631
10 minute 81 17.763 17.763 70.394
15 minute 59 12.938 12.938 83.333
20 minute 29 6.359 6.359 89.692
25 minute 47 10.307 10.307 100
Total 456 100 100

Factors that Affect Transport Mode Preference for Graduate Students 357
Journal of Engineering Science and Technology June 2013, Vol. 8(3)
Fig. 4. Switching to Public Transport Based on Comfortable Waiting Time.
Results for the process of calibration imported to excel to get the ANOVA
table are shown in Table 5 comparatively with results obtained from survey
(shown in Table 6). It is demonstrated from Table 5 that the model used in
this study is got the value of P equals to (0.009099) which somehow
acceptable to be significant (significant value <0.05) [22, 24]. This fact is
more identified in Fig. 5 which illustrates high correlation between survey
results and the modelled one that they showed dramatic reduction with the
increase of waiting time in bus station.
Table 5. Illustration of Survey Results and Data Calibration.
Waiting time Survey Results (P) (1-P)/P ln(1-P)/P
5 minute 1 0 0
10 minute 0.638 0.567 -0.567
15 minute 0.265 2.768 1.018
20 minute 0.111 7.941 2.072
25 minute 0.039 24.333 3.191
Table 6. Illustration of Survey Results and Logit Model Results.
Waiting Time Survey Results
(P)
Results from Logit
model
5 minute 1 0.997
10 minute 0.638 0.916
15 minute 0.265 0.241
20 minute 0.111 0.068
25 minute 0.039 0.035

358 A. A. Mohammed and A. A. Shakir
Journal of Engineering Science and Technology June 2013, Vol. 8(3)
Fig. 5. Relationship between Percentages with Waiting Time.
Results for reduction in travel cost analyzed by SPSS are given in Table 7.
It is shown from Table 7 that about 39% of the students prefer using public
bus if there is 30% reduction in travel cost. However, reduction of 70% on the
travel cost will encourage around 88% from students to start using the public
bus. Relationship between percentages and reduction in travel cost is shown
in Fig. 6.
Table 7. Illustration of Survey Results and Data Calibration.
Reduction Travel
Cost Survey Results (P) (1-P)/P ln(1-P)/P
10% 0.210 3.75 1.321
30% 0.184 4.428 1.488
50% 0.335 1.980 0.683
70% 0.157 5.333 1.673
90% 0.111 7.941 2.072
Fig. 6. Relationship between Percentage and Reduction of Travel Cost.
Results for the process of calibration comparing with the survey results are
indicated in Table 8. It is as given in Table 8 that the model resulted from
Factors that Affect Transport Mode Preference for Graduate Students 359
Journal of Engineering Science and Technology June 2013, Vol. 8(3)
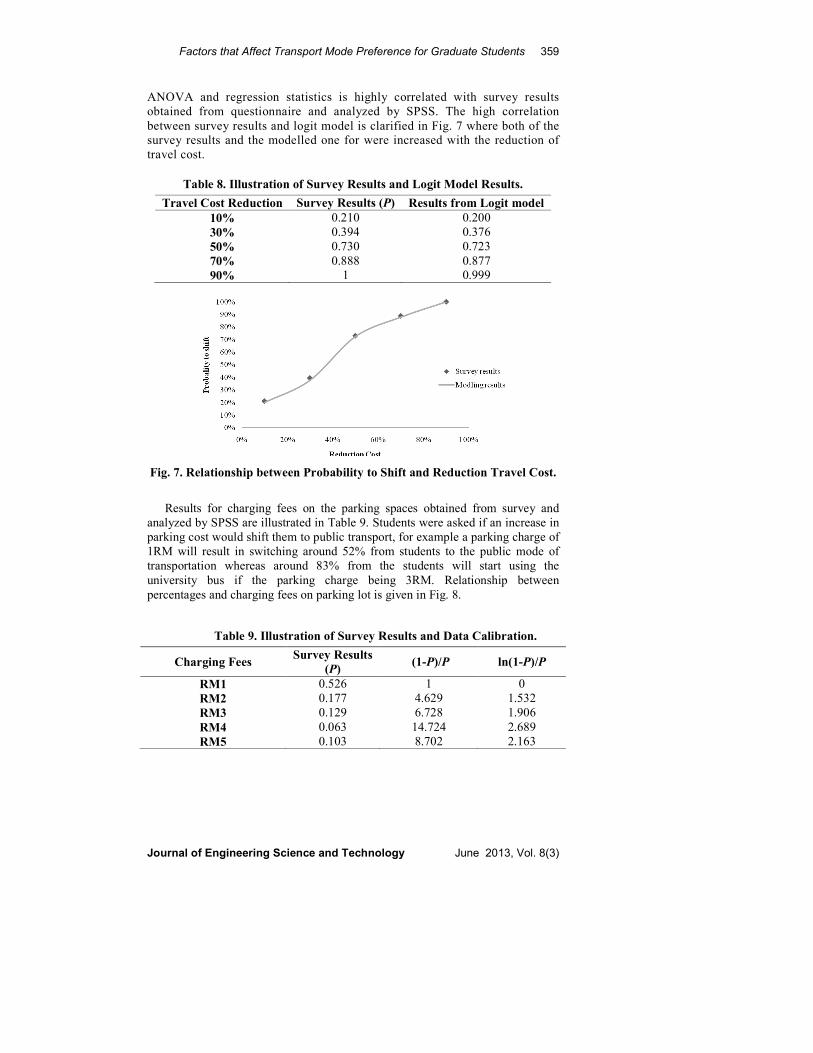
ANOVA and regression statistics is highly correlated with survey results
obtained from questionnaire and analyzed by SPSS. The high correlation
between survey results and logit model is clarified in Fig. 7 where both of the
survey results and the modelled one for were increased with the reduction of
travel cost.
Table 8. Illustration of Survey Results and Logit Model Results.
Travel Cost Reduction Survey Results (P) Results from Logit model
10% 0.210 0.200
30% 0.394 0.376
50% 0.730 0.723
70% 0.888 0.877
90% 1 0.999
Fig. 7. Relationship between Probability to Shift and Reduction Travel Cost.
Results for charging fees on the parking spaces obtained from survey and
analyzed by SPSS are illustrated in Table 9. Students were asked if an increase in
parking cost would shift them to public transport, for example a parking charge of
1RM will result in switching around 52% from students to the public mode of
transportation whereas around 83% from the students will start using the
university bus if the parking charge being 3RM. Relationship between
percentages and charging fees on parking lot is given in Fig. 8.
Table 9. Illustration of Survey Results and Data Calibration.
Charging Fees Survey Results
(P) (1-P)/P ln(1-P)/P
RM1 0.526 1 0
RM2 0.177 4.629 1.532
RM3 0.129 6.728 1.906
RM4 0.063 14.724 2.689
RM5 0.103 8.702 2.163

360 A. A. Mohammed and A. A. Shakir
Journal of Engineering Science and Technology June 2013, Vol. 8(3)
Fig. 8. Relationship between Percentage and Charging Fees on Parking Lot.
Results for the process of calibration are indicated in Table 10 along with results
obtained from survey. It is as given in Table 10 that the model resulted from
ANOVA and regression statistics is highly correlated with survey results obtained
from questionnaire and analyzed by SPSS. The high correlation between survey
results and Logit model for imposing fees on parking spaces for the private cars is
clarified in Fig. 9 where both of the survey results and the modelled one showed
high agreement from students to be shifted to public mode of transportation when
the fees on parking spaces are increased.
Table 10. Illustration of Survey Results and Logit Model Results.
Charging
Fees
Survey
Results (P)
Results from
Logit model
RM1 0.210 0.545
RM2 0.703 0.691
RM3 0.833 0.807
RM4 0.896 0.891
RM5 1 0.992
Fig. 9. Relationship between Percentage and Charging Fees.

Factors that Affect Transport Mode Preference for Graduate Students 361
Journal of Engineering Science and Technology June 2013, Vol. 8(3)
The sensitivity of the modelling has been tested by taking the public transport
services into a calibration in Table 11. It is indicated that a further 70 % of travel
time reduction for travel public transport attract 30 % of students to use the public
bus service; this indicates the possibility of an increase in the use of buses service
with 0.4 sensitivity ratio. Reduction of 70 % on the fare will encourage 30% of
students to be shifted to public transportation and the sensitivity ratio is 0.4.
Subsidizing of 69 % on the bus fare will encourage 50% of private car users to be
shifted to public bus and the sensitivity ratio is 0.72.
Table11. Results for Sensitivity Ratio
for Independent and Dependent Variables.
Changes in Independent
Variable
Changes in
Dependent Variable
Sensitivity
Ratio
70% Travel Time Reduction 30% Model Shift 0.4
70% Travel Cost reduction 30% Model Shift 0.4
69% Subsidized the Bus
Fare 50% Model Shift 0.72
3. Conclusion and Future Works
Conclusion based on the aforementioned investigation is addressed accordingly:
• It was concluded that the factors that play significant role in shifting private
cars owners to public mode are reduction in travel time, reduction in travel
cost, charging fees on parking spaces, reduce the waiting time in bus station
and improve the bus stop services. By improving those factors high
proportions of postgraduate students of UKM University will shift to public
mode of transportation whereby contribute to environmental protection and
ecological balance.
• Results for Logit model were considerably approximated to survey results in
which indicated high correlation between survey results and modelled one,
hence indicated high level of results confidential.
• Recommendations for future work can be drawn by suggesting universal
design of transportation provide the common with their need and disabilities,
providing the pedestrians with comfortable services separate them from
motorized mean of transportation for instance, cross bridges, zebra lines and
sign boards. A protection system is needed to sway darkness and drain and
protect the pedestrians from wild animals in order to encourage the public
mode of transportation.
References
1. Mohamad, J.; and Kiggundu, A.T. (2007). The rise of private car in Kuala
Lumpur, Malaysia: Assessing the policy options. IATSS Research, 31(1), 69-77.
2. PPS. (2009). Universiti Kebangsaan Malaysia, 43600 Bandar Baru Bangi,
Selangor, Malaysia. Research 25(6), 433-438.

362 A. A. Mohammed and A. A. Shakir
Journal of Engineering Science and Technology June 2013, Vol. 8(3)
3. Mohammed, A.A.; Alelweet, O.A.; Karim, M.R.; and Shams, O.A. (2012). An
optimization solution by service science management and engineering (SSME)
for using minibuses service as an alternative for private cars around Hentian
Kajang in Malaysia. Journal of Civil Engineering and Construction
Technology, 3(1), 25-41.
4. García, R.; and Marín, A. (2002). Parking capacity and pricing in park’n ride
trips: A continuous equilibrium network design problem. Annals of Operation
Research, 116(1-4), 153-187.
5. Rahmat, R.A. (2004). Urban transport management system: A case study in
National University of Malaysia. A project at UKM, Malaysia.
6. Hull, A. (2008). Policy integration: What will it take to achieve more
sustainable transport solutions in cities? Transport Policy, 15(2), 94-103.
7. Nurdeen, A.; Rahmat, R.A.; and Ismail, A. (2007). Modelling of transportation
behaviour for coercive measures for car driving in Kuala Lumpur. ARPN
Journal of engineering and Applied Sciences, 2(2), 18-24.
8. Donnelley, RR (2009). Buses for Scotland Park and ride for buses. A national
framework. The Scottish Government, Scotland.
9. Szimba, E. (2002). Passenger transport market: Segmentation, trends and
policy conclusions - Results from Think-up. Think-UP Seminar “Potentials for
modal shift: A segmented Approach for the European transport market.”
10. Nor, N.G.M.; Nor, A.R.M.; and Abdullah, A.Z. (2006). Predicting the impact
of demand- and supply- side measures on bus ridership in Putrajaya, Malaysia.
Journal of public transport, 9(5), 57-70.
11. Ortuzar, W.; Juan de Dios, Ortuzar; and Luis, G. Willumsen (2006). Modelling
transport. Third edition, John Wiley and Sons, Canada.
12. Garvill, J.; Marell A.; and Nordlund A. (2003). Effects of increased awareness
on choice of travel mode. Transportation, 30(1), 63-79.
13. Balsas, C.J.L. (2003). Sustainable transportation planning on college campuses.
Transport Policy, 10(1), 35-49.
14. Bando, M.; Hasebe, K.; Nakanishi, K.; and Nakayama, A. (1998). Analysis
of optimal velocity model with explicit delay. Physical Review E, 58(5);
5429-5435.
15. Parkhurst, G. (2000). Influence of bus-based park and ride facilities on users'
car traffic. Transport Policy, 7, 159-172.
16. Spillar, R.J. (1997). Park-and-ride planning and design guidelines. New York:
Parsons Brinckerhoff Inc.
17. Abdullah, N.; Rahmat, R.A.; and Amiruddin, I. (2007). Effect of transportation
policies on modal shift from private car to public transport in Malaysia. Journal
of applied Sciences, 7(7), 1013-1018.
18. Patterson, Z.; Ewing, G.; and Haider, M. (2005). Gender-based analysis of
work trip mode choice of commuters in Suburban Montreal, Canada, with
stated preference data. Transportation Research Record, 1924, 85-93.
19. Ahern, A.A.; and Tapley, N. (2008). The use of stated preference techniques to
model modal choices on interurban trips in Ireland. Transportation Research
Part A: Policy and Practice, 42(1), 15-27.

Factors that Affect Transport Mode Preference for Graduate Students 363
Journal of Engineering Science and Technology June 2013, Vol. 8(3)
20. Taylor, D.; and Mahmassani, H. (1996). Analysis of stated-preferences for
intermodal bicycle-transit facilities. Transportation Research No. 1556.
21. Axler, R.; Chang, W.; Gan, J.; and Kembhavi, S. (2006). Out of cars and onto
bikes: Encouraging a modal shift from cars to bicycles at the University of
Toronto. Applied Research Seminar, 2005-2006.
22. Beale, J.; and Bonsall, P. (2007). Marketing in the bus industry: A
psychological interpretation of some attitudinal and behavioural outcomes.
Transportation Research Part F: Traffic Psychology and Behaviour, 10(4),
271-287.
23. Mohammed, A.A. (2010). An optimization solution for using minibuses
service as an alternative of using private Cars around Hentian Kajang in
Malaysia. M.Sc. thesis, University Kebangsaan Malaysia.
24. Mohammed, A.A.; and Rahmat, R.A. (2012). An optimization solution for
utilization minibuses service as an alternative of utilizes private cars: A case
study around Hentian Kajang in Malaysia. International Organization of
Scientific Research Journal of Engineering, 2(5), 1032-1039.