FACTORS RELATED TO MOSCOW TEENAGERS' PURCHASE …
85
Transcript of FACTORS RELATED TO MOSCOW TEENAGERS' PURCHASE …


FACTORS RELATED TO MOSCOW TEENAGERS' PURCHASE INTENTION: A CASE STUDY OF THE SUBCULTURE CLOTHING MARKET
By
EKATERINA KISELEVA
A Thesis submitted in partial fulfillment of the requirement for the degree of
Master of Business Administration
Examination Committee :
1. Dr. Patricia Arttachariya (Advisor)
2. Dr. Witsaroot Pariyaprasert
3. Dr. Sirion Chaipoopirutana
4. Dr. Philip Nicholls
5. Assoc.Prof. Thanachai Yomjinda
Examined on: 24 November 2009 Approved for Graduation on :
(Member)
(Member)
(Member) ··~~ (MOE Representative) ..... :cr .. £'...... .... 1
Graduate School of Business Assumption University
Bangkok, Thailand November
2009

i
ABSTRACT
Globalisation is taking over the economies, communications and fashion
industries. In such times, preserving individuality and uniqueness becomes a goal for
many. Russians, having been under the Communist regime for almost 70 years,
haven’t had a chance to differentiate, and the newly-formed market economy offers
the consumers infinite choices, especially in apparel. Young consumers in Moscow
experiment with clothing more than ever and they seek ways to express themselves. A
teenager’s maximalist approach, the refusal to accept the banalities of an ordinary life
and a desire to be different and, at the same time, accepted by the peers, makes some
join a subculture, such as Goth, punk, skinhead, ska and others.
This research was done in order to find the factors which are related to the
young Moscovites’ intention to purchase subculture apparel. Several hypotheses were
brought forward, which presumed a relationship between the attitude of the teenagers
towards subculture apparel and their purchasing intention, as well as existence of a
relationship between the attitude and the subjective norm, product attributes, fashion
lifestyles and personal variables. 339 questionnaires were analysed with the Pearson
Correlation, ANOVA and the independent samples t-tests.
The results obtained from this research showed a strong positive relationship
between the attitude of the teenagers in Moscow towards the subculture apparel and
their intention to buy it. Friends and online communities ware found to be related to
the teenagers’ attitude, as well as product attributes. The marketers can use these
indicators to approach the teenager segment for subculture apparel sales though the
certain channels, like social networking sites and events specifically dedicated to a
subculture. The research has also shown that lifestyles of teenagers have no
relationship on how they look at subculture apparel, as well as brands and prices are
not an important element when the teens consider buying subculture clothing. This
could give a chance to market such products at a premium. There has been no
difference noted between the girls’ and boys’ attitude to subculture apparel, but a
marketer should approach the younger and older teenagers with a different strategy, as
their attitudes vary significantly, based on age groups.

ii
ACKNOWLEDGEMENTS
I would like to extend my gratitude to the person, who has inspired me to start
this research and has helped greatly throughout the study - my dear sister Lisa. I
would like to thank my thesis advisor, Dr. Patricia Arttachariya, who has guided me
and helped accomplish my goals. I am indebted to the person who has supported me
in all my decisions, Dr. Ismail Ali Siad. I would like to thank the committee members,
Dr. Philip Nicholls, Dr. Sirion Chaipoopirutana and Dr. Witsaroot Pariyaprasert.
This study would also be impossible without the help of my friends and
relatives in Moscow, Irina and Yanis Sipols, Irina Nikitina, Andrey Evseev, Anisia
Ananieva and Irina Konovalova, I’m grateful for their unconditional support and care.
Special thanks to my classmate Yiley for essential help and all who have participated
in the survey and supported me throughout this work.
Ekaterina Kiseleva.
Bangkok, November 2009

iii
TABLE OF CONTENTS
Chapter 1 Generalities of the Study 1 1.1 Introduction 1
1.2 Statement of the Problem 11
1.3 Research Questions 11
1.4 Research Objectives 12
1.5 Scope of research 12
1.6 Limitations 13
1.7 Significance of the study 13
1.8 Definition of Terms 14
Chapter 2 Literature Review 16 2.1 Definitions and theories related to Independent Variables 16
2.1.1 Subjective Norm 16
2.1.2 Lifestyle 18
2.1.3 Product attributes 21
2.1.4 Attitude 22
2.1.5 Demographics 24
2.2 Definition and theories related to Dependent Variable 24
2.3 Relationship of the Independent Variables to the Dependent Variable 26
2.3.1 Previous study on Purchasing Intention and Attitude towards Behaviour, Subjective Norm and External Variables 27
2.3.2 Previous Study on Consumer Characteristics and Attitudes towards Behaviour 28
2.3.3 Previous study on Purchasing Intention and Fashion Lifestyles 28
2.3.4 Previous study on consumer attitude and purchase intention 29
2.3.5 Previous Study on Product Attributes and Attitudes 29
2.4 Summary of the Theories and Previous Studies 30
Chapter 3 Research Frameworks 32 3.1 Theoretical Frameworks 32
3.2 Research Framework 35
3.3 Statement of Hypotheses 36
3.4 Operationalisation of variables 37
Chapter 4 Methodology 39 4.1 Methods of Research used 39
4.2 Respondents and Sampling Procedures 40
4.3 Instruments for Data Collection 43
4.4 Pre-test 44
4.5 Statistical Treatment of Data 45

iv
Chapter 5 Presentation of Data and Discussion of Results 48 5.1 Descriptive Statistics 48
5.2 Hypotheses Analysis 51
Chapte 6 Summary of Findings, Conclusion, and Recommendations 57 6.1 Summary of Findings 57
6.2 Summary of Hypotheses Testing and Discussion 62
6.3 Conclusion 65
6.4 Recommendations 66
6.5 Further study 67
Bibliography: 68
Questionnaire 74

v
List of Tables
Table 2.1 Summary of the Theories and Previous Studies 30
Table 3.1 Dependent and independent variables, their operational component and measurements.
37
Table 4.1 Population of Moscow for selected age groups 40
Table 4.2 Education system in Russia 42
Table 4.3 Reliability Analysis of the Questionnaire in Each Dimension 44
Table 4.4 Correlation coefficient interpretation 45
Table 4.5 Statistical Tools Used for Testing the Research Hypotheses 47
Table 5.1 Gender, Age and District Descriptive Statistics 48
Table 5.2 Analysis of Factors Related to Intention to Buy Subculture Apparel 49
Table 5.3 The Dependent Variable, Mean and Standard Deviation 50
Table 5.4 Reliability Analysis of the Questionnaire in Each Dimension 51
Table 5.5 Relationship between Subjective Norm and the Attitude 52
Table 5.6 Relationship between Product Attributes and the Attitude 52
Table 5.7 Relationship between Fashion Lifestyle and the Attitude 53
Table 5.8 Difference in the Attitude towards Subculture Apparel between age groups
53
Table 5.8 Multiple Comparisons of Age Groups 54
Table 5.9 Difference in the Attitude towards Subculture Apparel by gender 55
Table 5.10 Relationship between Attitude and Purchasing Intention 55
Table 5.11 Summary of Hypothesis Testing Results 56
Table 6.1 Fashion Lifestyles Descriptive Statistics 59
Table 6.2 Main Economic Indicators, Russian Federation 61
Table 6.2 Relationship Analysis between Attitude and each Lifestyle 63

vi
List of Figures
Figure 1.1 Retail Business Turnover by cities in the Russian Federation 3
Figure 1.2 Young Asians spending in 2005 5
Figure 1.3 Attributes of Subculture of Consumption and Brand communities 7
Figure 1.4 Punk and Emo-kid in the streets of Moscow. 10
Figure 2.1 Interests and Internet Usage of teenage girls and boys 17
Figure 2.2 Social Structure of Russian Consumers 19
Figure 2.3 Russia’s Cultural Dimensions by Hofstede 20
Figure 2.4 Three hierarchies of effects 23
Figure 2.5 Theory of Reasoned Action model 25
Figure 2.6 EBM Consumer Behaviour Model 26
Figure 3.1 Relationship between attitude, subjective norm and demographics towards purchase intention
32
Figure 3.2 Model for the intention to purchase controversial apparel 33
Figure 3.3 Model for Fashion Lifestyles and Nationality relationships to Attitude and Purchase Intention
34
Figure 3.4 Model for Attitudes towards foreign and local brands of status-seeking and non status-seeking teenagers
34
Figure 3.5 Research Framework 35
Figure 4.1 Map of Moscow with the number of secondary schools and retail areas
41
Figure 6.1 Distribution of Respondents by District of Residence 58
Figure 6.2 Russia’s real GDP growth, by quarter, 2008-09 (% change y-o-y) 61

1
CHAPTER 1
GENERALITIES OF THE STUDY
1.1 Introduction
This study will look into factors that are related to the purchasing intentions of
teenagers in Moscow towards a niche segment of clothing, called sub-culture
clothing. The different subcultures present in Russia will be explained, while societal
influence on teenagers’ attitude towards particular styles of apparel, as well as product
attributes and lifestyles of teenagers will be discussed.
As consumption is greatly affected by the present economic situation and
history, introduction to Russian economic development is essential for a better
understanding of the challenges and the course of market development. Teenagers’
profile in different countries will also be presented, together with a brief introduction
to the retail and fashion industry in Russia. As has been proven by Ajzen and Fishbein
(1980), O’Keefe (2002) and many other researchers, purchasing intention is the best
predictor of actual purchases, thus their model will be used throughout the study. The
final aim of the thesis is to look into the purchasing intention and related factors, in
order to make conclusions about the subculture apparel market potential in Moscow.
Russia’s Economic Development
Russia is populated by 160 ethnic groups, and has one of the world’s most
diverse societies. The population of approximately 142 million is widely scattered
over a vast area, so the population density is low, except in the major cities in
European Russia, near the Ural Mountains and in southwest Siberia.
Three-quarters of Russians live in cities. The two major ones are the capital
Moscow with the population of more than ten million, and St. Petersburg with more
than four million people, ethnic Russians make up to about 80% of the population,
with the largest minority groups being Tatars and Ukrainians.
For over half a century, the Russian economy and that of the members of the
Union of the Soviet Socialist Republics was centrally planned. The state controlled all
investment, production and consumption across the country. Economic policy was
shaped by the Communist Party, and when in the 1990s the transition to a market
economy took place, a lot of difficulties were encountered. Radical liberalisation
reforms and massive privatisation wiped out the living standards of millions, while

2
crime and corruption flourished and a major crisis hit the country in the 1998, when
the rouble collapsed.
After a long period of crisis, in 2007-2008 the economy started to revive due
to increased foreign investment, higher domestic consumption and political stability.
Russia became the fastest growing economy in the G8, averaging 7 per cent growth
per year since 2003. Russia emerged as the world’s leading natural gas exporter and
the second largest oil producer after Saudi Arabia. Decline in poverty, and the growth
of the middle class and the number of Russian billionaires, who now play on a global
stage, has been observed in the recent years. But economic development is seen
mostly in Moscow, while the rest, especially the rural eras, lags far behind
(www.russiatoday.com, accessed on 12/08/2009).
Moscow Market
Moscow is one of largest city economies in Europe and per year it makes
approximately 20% of Russian GDP, according to Russian Federal State Statistics. In
2007 Moscow’s economy reached 263 billion dollars. For centuries Moscow has been
the largest city in Russia and the Soviet Union. Russia’s population is declining
annually by 700,000 persons, due to a low birth rate and high mortality rate.
Substantial numbers of internal migrants make Moscow's population grow, but the
population of many other Russian cities is in decline. Moscow's strong economy
attracts a lot of migration, as the other regions are, in contrast, stagnating, it is
difficult to find a job and many productions facilities have been left to rust since the
Soviet era (www.moscow.ru, accessed on 2/09/2009). The latest census conducted in
2008, states the official population of Russia is 142 million, with Moscow
representing seven percent of the population. Young people between ages 12 and 19
total 751 thousand, with boys representing 51 percent and girls – 49 percent of the
Moscow population (www.gks.ru, accessed on 12/08/2009).
As Smetanina (2008) states, there is a real surge of interest in everything to do
with fashion today. The rapid growth of the Russian clothing market is approximately
20% per year. Moreover, Russian consumers spend on average 13% of their income
on clothing, as opposed to 6% in Europe. Clothes and footwear sales in Russia could
reach 6.3 billion US dollars in 2009.

3
Figure 1.1 Retail Business Turnover by cities in the Russian Federation in millions of roubles. January-April 2009
Source: www.gks.ru, Russian Federal State Statistics site, accessed on 12/08/2009
The chart above represents the retail business turn-over, and the dark green
areas indicate the highest turn-over in million roubles for the period of January-April
2009. Moscow (represented by the star) holds the highest turnover of retail business
activity of approximately 24 billion US dollars. Thus, the focus of this paper will be
the capital city.
Teenage Consumers
The concept of a “teenager” first appeared in 1938. In earlier times, society
was classified as comprising of just children and adults. A person reaching age
thirteen or fourteen was ready to do adult work, but reforms, which prevented child
labour and made education through to high school mandatory, lengthened the years of
pre-adulthood. Preparation for adult responsibilities was prolonged until the age of
eighteen or later. Now a teenager is defined as a person between the ages of 13 and 19
(Barnhart and Metcalf, 1997).
Marketers have also dubbed today’s teenager as 'Generation Y' (Postman,
1998). Generation Y is defined by marketers as young people less than 22 years of
Moscow, represented by star, has the highest turnover in the country, followed by Moscow region and Saint-Petersburg

4
age, meaning in the present situation, people born in 1977-1994, they are also
sometimes called as the “echo-boom” generation. Compared to past generations, the
“echo-boom” generation is more affluent, more educationally-oriented, and more
ethnically diverse (Futurist, 2001). Additionally, they tend to be comfortable with
credit cards and technology, and are more group-oriented than their predecessors born
in 1965-1976, called “Generation X” (Weiss, 2003).
Several studies have focused on teenagers, choosing respondents of ages 14 to
18 (Thomas et al, 1999), 12 to 17 (Zornow, 2003), 12-19 (Parker et al, 2004), 13 to 19
(Phau and Leng, 2007). This study will focus on the 12-19 age group. According to
Zollo (2000), global marketers are drawn to teenagers because, firstly, young people
in between ages 12-17 have significant discretionary spending power and thus are
influential trendsetters. Second, their brand loyalties are just forming, thus they are
more impressionable and easier to reach. Third, they spend family money and
influence their parents’ purchasing decisions. Fourth, the present teenage population
of 33 million people just in the United States of America makes them hard to ignore.
Moscow population of the 12-19 year-olds is 7.1% of the total population, meaning
751,000 potential consumers (www.gks.ru, accessed on 12/08/2009).
In the United States of America, as teens grow older, their annual spending
money increases from about $1,500 at age 12 to 13 to $4,500, when they are 16-17
years old. In 2003, American teens of all ages spent $112.5 billion dollars. Teens
influence household spending: parents consult the computer and market-savvy teens
in their family for large and small purchases. When it comes to clothing, 94% of teens
say that finding the right size of clothes is the most important factor when it comes to
choosing a retailer. 75% of teens search the lowest prices and 73% go for frequent
sales, showing that they are very price conscious. Eight percent of U.S. mall shoppers
are 14 to 17 years old and they spend on average forty seven dollars per mall visit.
They visit malls, averaging once a week, which is more frequent than any other age
group, and also spend the most time per visit (Zornow, 2003).
In Asia, according to Young Asians Regional Report (2005), average income
of young people (8-24 years of age) is 673 US dollars of those working full-time and
the monthly pocket money of those not working full-time is 86 US dollars. Spending

5
by categories is presented below, and it can be observed that after savings, the top
item that young people spend most money on is clothing.
Figure 1.2 Young Asians spending in 2005
Source: Young Asians Regional Report (2005), Synovate, Hong Kong
Russian teenagers are quite different from their European counterparts – they
feel less comfortable with their peers, do not respect their elders and expect to get the
best. They constantly seek for approval and depend greatly on the opinion of the
entourage. But at the same time, Russian teens are infantile – they don’t think much
about the future, preferring to spend time in a fun, rather than useful way. Most of
them dream of becoming rich, doing business, and much less than their counterparts
from other countries they think of travelling and working abroad. The similarities
observed between the Western and Russian teenagers are that they wish to live better
than their parents and are confident that they do things their way (Razdobreeva,
2008).
According to all the findings presented above, teenagers are an important
consumer group, but their consumption behaviour has not been extensively studied in
Russia and new data is not readily available, as compared to the US, Australia, China,
Korea and Japan.

6
Subculture of consumption
The subculture of consumption is a distinctive subgroup of society, where the
members adhere on the basis of a shared interest and commitment to a particular
consumption activity or product class and brand. It is also characterized as an
identifiable, hierarchical social structure; a unique ethos or set of shared beliefs and
values, and unique jargons, rituals, and ways of symbolic expression, also in the way
they dress (Schouten and McAlexandre, 1995).
Western anthropology, traditionally studying exotic cultures, has also
discovered exoticism and divergence within its own social and cultural spheres, while
observing foreign culture. Anthropologists, who study geography, race and lifestyle
choices, identified that subcultures existed within a large-scale society and the
difference in terms of value judgments, abstract systems, logic and forms of reasoning
is remarkable even within one nation (McKee, 2003). Anthropology understands and
identifies divergence within and across cultures; it also sorts the marginal groups
making it clearer to comprehend the subcultures. Subculture has also been defined as
a manifold scope of social groups and practices, leading to other definitions such as
cult or sect in some literature (Kaplan and Loow, 2002).
Figure 1.3 on the next page displays common characteristics by which one can
identify a regular brand community and a subculture of consumption. Their
similarities and differences are brought forward. The main factor which separates
these groups is the mainstream norm – brand communities follow it, whereas
subcultures oppose the norms. Commercial interests are also highlighted as a
differentiating point - subcultures of consumption do not solely focus on commercial
interests for their activities (Woodman and Govan, 2007). This thesis focuses on
purchasing intention as a predictor of commercial interests of teenagers and as a
predictor of actual purchase.

7
Figure 1.3 Attributes of Subculture of Consumption and Brand Communities
Source: Woodman, B. and Govan, B. (2007), “We do not live to buy”, International Journal
of Sociology and Social Policy, vol. 27, no. 5/6, pp. 193-207.
Consumers’ lifestyles are influenced by their belonging to a certain group
within the society at large. These groups are known as subcultures, whose members
share beliefs and common experiences that set them apart from others. Every
consumer belongs to several subcultures, which can be based on age or race
similarities, or common ethnic background, place of residence, or even a strong
identification with a certain activity or an art form (Solomon, 2004).

8
Such groups are of specific interest to consumer researchers and marketers, as
a subculture attaches a cultural meaning to certain products or activities that become a
unique style or ideology of consumption. Subculturally created styles may be shared
or imitated by a much larger audience to the core subculture, it can even be
commercialized for mass consumption. Some certain subcultures have crossed
national and cultural boundaries, racial or ethnic differences and class differences in
their scope and influence. For example, Harley-Davidson has managed to create a
subculture around its motorcycles, changing the lifestyle and preferences of people all
around the world. Consumers belonging to this subculture have a unique clothing
style (leather jackets, caps, and boots), way of life and social groups, sometimes also
called “bikers” (Schouten and McAlexandre, 1995).
As the members of these subcultures of consumption are devoted to certain
products, they tend to patronize marketers who cater to their specific needs. A
marketer who understands the structure and ethos of a subculture of consumption can
cultivate a long-lasting, mutually-dependent relationship and also assist in the
introduction and socialization of new members, facilitate communications within the
subculture, and sponsor events related to that subculture. For example, a publishing
agency organises thematic parties in Moscow, called “Animatrix”, every year for all
those devoted to Japanese animation and comics and, generally, the fans of the
Oriental culture (www.animatrixcon.ru, accessed on 27/08/2009). In return marketers
may earn increased customer loyalty, publicity, consumer feedback, acting as word-
of-mouth marketing, among other benefits. The commercialization of certain
subcultural products is not uncommon – Elvis Presley has popularized the blues
standards, rap has entered the mainstream of popular music with all its attributes (gold
chains, baggy pants, caps and so on), elements of hippie and punk style, respectively,
became popular in hair, jewelry, and clothing styles. Surfer styles repeatedly have
been copied into popular swimwear (Irwin, 1962).
The only study made on subcultures in Moscow was introduced recently, in
April 2009. “Youth Subcultures of Moscow” is compiled by Gromov D.V., and is
written by Russian sociologists, ethnographers and anthropologists of the Ethnology
and Anthropology Institute in Moscow. According to Gromov (2009), many
subcultures exist in Moscow, among which are hip-hoppers, bikers, cosplayers, emo-

9
kids, goths, hackers, skinheads, freestylers and others. Some styles present today in
Moscow are not included in the study, as it is difficult to keep track of new
subcultures, which appear each year. The authors identify some particular subcultures
which differentiate themselves among other things, by their clothing style.
Hip-hoppers are people who listen to rap, hip-hop and RnB music, dress in
oversized clothes and wear a lot of shiny accessories; bikers, as discussed previously,
are owners of big motorcycles, who like to dress in leather; cosplay has started in
Japan and is short for “costume play”, the cosplayers wear clothes that represent their
favourite Japanese animation heroes, usually these are people with childish behaviour
and brightly coloured apparel; Goths and emo-kids are related by the dark element,
both these cultures are into black colours in their attire, hair styles and accessories.
Emo is originally coming from an independent music movement in the United States
and is short for “emotional,” now it relates as much to a fashion style as a genre of
music. The followers of emo subculture dress in two-tone apparel, usually a
combination of pink and black, and wear a particular hair style of the same colour
theme. Goth is a contemporary subculture found in many countries. It began in the
United Kingdom during the early 1980s in the gothic rock scene, a branch of the post-
punk genre. This subculture has prominent tastes in music, similar attitude to
aesthetics, and fashion. Gothic music encompasses a number of different styles, but
the common tendency is the exaggeratedly mournful, mystical sound and outlook.
Styles of dress within the goth subculture range from deathrock, punk, androgynous,
Victorian, Renaissance and Medieval, or combinations of the above, most often with
black attire, makeup and hair (Hodkinson, 2002). Hackers are young people who are
good with computers and programming, they usually don’t care about their
appearance and brands of clothing. The skinhead group has been on the decline since
the 1990’s, their members represent an extremist movement related to Nazi beliefs;
they shave their heads and wear studded, aggressive apparel. In Russia skinheads first
appeared during the crisis years, mentioned previously in the chapter, due to
instability in the country, and the decline in the quality of the upbringing and
education system. On the contrary, the healthy freestyler group has been on the rise
in the past two years among the young population of Russia, the members of this
subculture attend to extreme sports, are against drugs and smoking, and usually wear
sports clothes and shoes, attire used for snowboarding, motocross bicycle racing,
street dance, etc. (Gromov, 2009, Surtaev, 1999, Levikova, 2004).

10
Kozlov (2008), a journalist from Moscow News, discusses the problem of
emo-kids and Goths, as the Russian Parliament proposed a law that emo-kids and
Goths are to be banned from appearing in public offices and state-run educational
institutions wearing their clothes and make-up. It is representative of the mid-1980s in
Russia, when youth subcultures were beginning to spread throughout the Soviet
Union on the wave of more openness in the country as a result of Gorbachev's
reforms, but as to the strong belief of uniformity, punks, metalheads, soccer fans and
others who were sticking out of the crowd, were not accepted by the society of those
times.
Figure 1.4 Punk (left) and Emo-kid (right) in the streets of Moscow.
Source: www.theotherrussia.ru, accessed on 20/08/2009
Greengard (2008) presents the potentially negative effect of one of the
subcultures, called “emo”, a subculture known for black fingernails, angled bangs and
rock music. The Department of Education of Nizhny-Novgorod called for a campaign
against a movement known as “emo”, which is growing among the teenagers 12-16
years of age in the regions of Russia. The emo ideology negatively influences the
unformed teenage personality, way of thinking and behaviour. Young people drawn to
the emo movement imagine that they have an “allergy to happiness”. Teachers were
asked to maintain vigilance and explain the negative consequences to the students of
entering into alternative civic organizations or subcultures. Maksimov (2008) brings
forth the number of victims attacked by skinheads (a group of nationalists): 112
people were murdered and 337 people were injured in 2008 in Moscow and other
regions. It can be understood that subcultures in Russia are not treated with curiosity
as a consumer group, but rather a criminal issue that has to be solved.

11
1.2 Statement of the Problem
Market challenges in approaching teenagers are in that teens have more
choices these days than ever - it is difficult to get and keep their attention. Teens
multitask media, meaning that they get access to various sources of information,
which helps them to compare and evaluate more accurately, but also makes them
skeptical (Zornow, 2003). In short-term cross-sectional studies, buying intentions
generally proved more accurate predictors of purchase behaviour than attitudes (Klein
and Lansing, 1955). Therefore in this thesis, purchasing intention will be used as an
indicator of an actual purchase of subculture apparel, which can be used by marketers.
Clothing preferences change all the time, especially in Moscow, where fashion
plays a great role in the purchasing intent of teenagers. Fashion preferences of
Russians have changed. While five years ago most Russian Fashion Week visitors
chose the trendiest brands, now they pay less attention to the label, and simply choose
the things they like (Smetanina, 2008).
This thesis also deals with a phenomenon of self-expression of the young
consumers - by associating themselves with a certain subculture, teenagers declare
themselves different from the rest of the society, but at the same time, they search for
belonging to a group that shares their interests and views (Lukov, 2002).
From these marketing problems, a research question arises - how to know the
purchasing intention of teenage consumers. As there is very limited research done in
this field in Russia, this study will help answer this question.
1.3 Research Questions
The researcher aims to answer the following:
1. Is there a relationship between a subjective norm and the attitude of Moscow
teenagers towards subculture apparel?
2. Is there a relationship between product attributes and the attitude of Moscow
teenagers towards subculture apparel?
3. Is there a relationship between fashion lifestyle and the attitude of Moscow
teenagers towards subculture apparel?

12
4. Is the attitude of Moscow teenagers towards subculture apparel different based
on personal characteristics?
5. Is there a relationship between the attitude of Moscow teenagers towards
subculture apparel and their intention to purchase subculture apparel?
1.4 Research Objectives
The purpose of this research is to study the following:
1. The relationship between a subjective norm and the attitude of Moscow
teenagers towards subculture apparel
2. The relationship between product attributes and the attitude of Moscow
teenagers towards subculture apparel
3. The relationship between fashion lifestyle and the attitude of Moscow
teenagers towards subculture apparel
4. The difference in the attitude of Moscow teenagers towards subculture apparel
based on age
5. The difference in the attitude of Moscow teenagers towards subculture apparel
based on gender
6. The relationship between the attitude of Moscow teenagers towards subculture
apparel and their purchasing intention
1.5 Scope of research
This study will focus on the purchasing intention as a dependent variable and
the subjective norm, lifestyles, product attributes and personal variables as
independent variables in a relationship model, with the attitude towards subculture
apparel acting as an intervening variable. The market of interest in this study is niche
clothing, i.e. apparel that youth subcultures wear to express their belonging to a
certain group, for example, hip-hop, Goth, punk, freestyle, etc.
The target population of this study is teenagers, both girls and boys 12-19
years old, residing in the capital city of Russia, Moscow. The survey will be carried
out in three regions of Moscow, where there is a highest concentration of retail trade,
and the highest number of secondary schools: North-West, South and South-West, but
the study will generalize the findings to the whole Moscow market, unrelated to the
districts. The sampling procedures are discussed in more detail in section 4.2.

13
1.6 Limitations
The limitations of this paper are that data collected will cover the period of
October-November, 2009 and its results might not be applicable in the future, as
society and fashion change. The researcher assumes consumers make rational and
conscious decisions that maximize their benefits. Sample size was calculated based on
population provided by the Russian federal statistic agency as of January 2008 and
would have to be recalculated for other studies in the future. As the paper is only
concerned with the age group of 12-19 year-olds, it might or might not explain the
behavior of consumers outside of this age group. Moscow is selected as the field of
study due to its highest income per capita, highest number of sophisticated consumers,
highest internet penetration in the Russian Federation, and being the city that sets
trends in the fashion business for the whole country (Smetanina, 2008). The findings
will be generalized to the whole capital, independent of the sample district and district
of residence of a respondent, as the aim of the study is to see the general picture of the
purchasing intention towards subculture apparel in Moscow. The behavior in other
Russian cities may or may not be explained by this research. Other product categories
might not be explained by the purchasing intention model of this study.
1.7 Significance of the study
The findings of this thesis will provide several benefits for many parties.
Entrepreneurs can open a retail store, catering to niche markets, with a much more
focused strategy; they will know better who to sell to and how to cater to the needs of
their customers. Based on the research findings, entrepreneurs or marketers can
further estimate the feasibility of the business. Thai apparel exporting companies can
also learn potential entry strategies from the results of this study.
Researchers will gain a better knowledge of consumer behaviour and fashion
items’ market in Russia, specifically, in Moscow. It will give a broader look on the
international markets. Since Russia is unique in its market structure and history, this
research will complement the similar studies already conducted in China, America
and other countries. The study will contribute to the informational database on
Russian consumer markets, which is scarce in the International education arena.

14
Finally, school administration could also benefit from the study, as in
Moscow, the Government planned to introduce uniforms in all the schools and failed,
the findings of this paper might explain the reasons behind the failure.
1.8 Definition of Terms
Attitude: describes a person’s enduring favourable or unfavourable cognitive
evaluations, emotional feelings and tendencies to act in a particular way toward some
object or idea (Kotler, 1999).
Communist party: advocates the application of the social principles through a
communist form of government. Karl Marx and Friedrich Engels founded the
egalitarian theory of communism, where common ownership and equality are
promoted. Communist regime in Russia, later Soviet Union, existed during years 1917
- 1991, when the market was controlled by the state and totalitarian regime
established (Volkov, 1979).
Consumer behavior: studies individuals, or organisations and the processes
consumers use to search, select, use and dispose of products and services to satisfy
their needs, as well as the impact of such consumption on the consumer and society
(Kotler, 1999).
Fashion lifestyles: segment population by the way consumers approach
apparel shopping. There are four segments in this study: “information seekers”, who
put a considerable effort into researching fashions, eager to try new trends first and
are less concerned about the functioning of clothing; “sensation seekers” valuing
aesthetic elements in clothing, such as color, design and coordination; “practical
consumers” going for comfort and functionality of the clothing, valuing these above
conspicuous elements, as they view clothing as necessity; “prestige / conspicuous
consumers” believe in brands and value prestige. And they purchase high-priced,
high-prestige brands because of the acknowledgement it brings from others
Market economy: is based on the division of labor in which the prices of
goods and services are determined by supply and demand. Market economy is the
opposite of the planned economy during socialism and communism regime (Merriam-
Webster Unabridged Dictionary, 2009)

15
Purchase intention or conation: is a tendency of an individual to undertake a
specific action or behave in a particular way with regard to the object (Schiffman and
Kanuk, 1999).
Subculture: is a distinctive subgroup of society that self-selects on the basis
of a shared commitment to a particular product class, brand or consumption activity; it
is an identifiable, hierarchical social structure, a unique ethos that uses unique
jargons, rituals and modes of symbolic expression (Schouten and Alexander, 1995).
More details about the present subcultures that exist in Moscow and their descriptions
are given on page 9.
Subjective norms: is the individual’s recognition of the opinion of the society
he/she is living and his/her way of acceptance whether to perform the behaviour under
those burdens or not. Subjective norms are based on the person’s perceptions of
whether specific others think he/she should engage in the behaviour and the
motivation to comply under such pressure (Ajzen and Fishbein, 1980).
Union of the Soviet Socialist Republics (USSR): a constitutionally socialist
state that existed in part of Eurasia from 1922 to 1991, it included 15 present
countries: Russia, Belarus, Ukraine, Moldova, Georgia, Armenia, Azerbaijan,
Kazakhstan, Uzbekistan, Turkmenistan, Kyrgyzstan, Tajikistan, Estonia, Lithuania
and Latvia. At present, eleven of these countries form Commonwealth of
Independents States (Kirill & Mefodiy Dictionary, 2000).

16
CHAPTER 2
LITERATURE REVIEW
This chapter reviews previous literature on the topic under study. The first
section gives broad definitions of the variables in the framework. The second section
presents a summary of previous studies made on relationships mentioned in the
frameworks. The last section presents whole studies made previously by academics
that directly relate to the framework.
2.1 Definitions and theories related to Independent Variables
2.1.1 Subjective Norm
A subjective norm refers to the individual’s consideration for the opinions of
others, surrounding him/her and whether to perform or not according to those
opinions. Several conceptual and empirical studies support the importance of social
referents as a factor in determining shopping and clothing purchase behaviour (Ajzen
& Fishbein, 1980). Russians, in general, are brought up in a collectivist culture, thus
opinions of others matter (Hofstede, 1996).
Ward (1974) defined consumer socialization as “processes by which young
people acquire skills, knowledge, and attitudes relevant to their functioning as
consumers in the marketplace.” And the “agents of socialization”, namely family,
peers, and the mass media have proven to have influence on the consumer
socialization and thus on attitude.
Grønhøj (2007) has studied young adults’ buying decisions and discovered
that for clothing, young consumers consult mostly with friends (47% of respondents),
advertisements (29%) and sales assistants (29%), while family plays a less significant
role (only 16% respondents claimed they use family as an information source when
deciding to buy clothes) and the Internet and consumer magazines did not have a
significant role in the decision-making process of the young consumers.
Sanders (1996) summarised in the Roper Youth Report that teenagers are
influenced by friends (57%) and TV (23%) when buying clothes and, least of all, by
parents (20%). Image is the key, as teenagers judge others by looks, sense of humour,

17
friends, personalities and athletic ability. Teenagers' viewpoints are most identifiable
in the clothing they wear, therefore parents are no longer dictating the dress code.
Nowadays, one also has to consider online communities and networking as the
source of influence. A good example of such social networking these days is
Facebook.com, or its Russian counterparts, Vkontakte.ru and Odnoklassniki.ru. On
such websites young consumers may exchange opinions and might promote one brand
over the other in the context of a conversation and may also add interactive content,
which makes products or services more attractive to the members of their network and
increases the chances of purchasing. Russian users of social networking sites spend 7
hours per month on average (www.alexa.com, accessed on 06/09/2009) and view
1,300 pages per user monthly, more than Internet users of any other country
(www.comscore.com, accessed on 03/07/2009). The social networking websites in
Russian language, VKontakte.ru and Odnoklassniki.ru, the Russian equivalents of
Facebook.com, are offering the service for classmates and old friends to share their
pictures and exchange messages. These websites were rated as the most popular social
network websites in the Russian domain. However, total Internet usage in Russia is
lower than in most developed countries, due to small nationwide Internet penetration
of 27%, compared to 60% in Western Europe (www.rian.ru, accessed on 5/09/2009).
Teenage boys, which are represented in the chart below by the darker shaded
bar spend more time interacting online than girls; the percentages of girls’ Internet
usage is given in numbers following the bars (Habbo Survey, 2008).
Figure 2.1 Interests and Internet Usage of teenage girls and boys
Source: Habbo Survey (2008), Sulake Research Agency, Finland
boys girls

18
2.1.2 Lifestyle
Lifestyle segmentation has been widely applied for fashion products, such as
clothing, accessories, and sportswear. Fashion lifestyle is defined as consumer
attitudes, interests, and opinions related to the purchase of fashion products (Ko et al.,
2006). In a study of the women’s apparel market in America, Shim and Bickle (1994)
outlined three fashion lifestyle segments: symbolic or instrumental users, who are
younger, higher social-class level, fashion-conscious and innovative; practical or
conservative users, those oriented toward comfort and function more than fashion or
appearance and are less likely to enjoy shopping; and apathetic users patronizing
discount stores. In another study by Kim and Lee (2000) six fashion lifestyles were
identified: price-consciousness, fashion-consciousness, information seeking, self-
confidence, attitude toward local stores, and time-consciousness. Ko et al. (2007)
determined that consumers could be segmented into distinct groups based on fashion
lifestyle factors. These are sensation seekers, information seekers, utilitarian and
conspicuous consumers. Wu (2003) identified several shopping lifestyles: leader,
active, knowledge searcher, computer fan, fashionable, attached to appearance, spends
time at home, and common.
A new group of consumers has also emerged in recent years, they have similar
preferences and buy similar brands that are promoted globally as well as in local
media, they are referred to as “global consumers” - they are similar to other people
even of a different nationality on the account of their lifestyle and consumption
patterns (Hassan et al., 2003). Although differences occur in culture, values, or music,
it has been brought forward that commercial advertising on mass media (e.g. TV,
magazines, internet) has contributed to the “global consumer” culture, particularly for
global and world-known brands (Ko et al.,2007).
The TNS company conducts a study every year in Russian cities with a
population over 100,000 with the aid of questionnaires on general consumption
patterns and lifestyles of 60,000 respondents. The Russian consumer has been
described, as an organised, house-bred, socially-oriented, non-conformist and shy
person (Shipkov, 2007). The following radar chart presents the findings:

19
Figure 2.2 Social Structure of Russian Consumers, Percentage
Source: Shipkov V. (2007), Social Structure of Russian Consumers, TNS Gallup Media, RF
This segmentation is similar to the famous psychographic segmentation
model, called VALS, abbreviation for values and lifestyles, which was created by the
SRI business consulting group, to explain the lifestyles of the US consumers. It
outlines the eight main psychographic types: Innovators, Thinkers, Achievers,
Experiencers, Believers, Strivers, Makers, Survivors based on the two dimensions:
primary motivation and resources (Mitchell, 1980).
TNS used two dimensions as well, namely, “individualist vs. social”,
“impulsive vs. organised”. In the neo-Freudian school of psychoanalysis, Adler
(1923) stressed that the motivating force in human life is the sense of inferiority. The
inferiority complex originates in the Self-image, the way one perceives oneself. The
compensation of the complex generates masculine protest of “individualism” (it is
displayed by the lower axis of the chart) versus feminine submission or “collectivism”
(represented by the upper axis of the chart). According to the same teaching, when
libido predominates, humans will submit into their desire (left axis of the chart), and
when conflict predominates, the desire will be suppressed and non-conformist traits
will appear (right axis of the chart). The reader can clearly see the dominant “social”
element, due to historical suppression of individualist traits in the Soviet era, as was
discussed in chapter 1. And a more dominant “organised” element.

20
Russia’s Cultural Dimension
According to Hofstede (1996), Russia ranks very high on the power distance
index, meaning that inequalities of power and wealth have been allowed to grow
within the society and this system does not allow significant upward growth.
Individualism rank is quite low, indicating a more collectivist culture with close ties
between individuals, extended families and collectives where everyone takes
responsibility for others in their group. Masculinity index is low, which means Russia
has a low level of differentiation and discrimination between genders - women are
treated equally to men in all aspects of the society. A very high uncertainty avoidance
index shows that Russians don’t tolerate uncertainty and ambiguity. This creates a
rule-oriented society that imposes laws, regulations, and controls to reduce the
amount of uncertainty and risk. An extremely low long-term orientation, shows that
changes are accepted more easily as long-term traditions and commitments do not
impede. These indicators can all as well be applied to consumer behaviour of the
Russians, and this study will try to present individualism and whether Russian teens
seek approval of others in terms of subjective norm; whether teenagers are ready to
try new subculture apparel and how open they are to change, placing an indicator for
long-term orientation; importance of product attributes, such as brand and price as
well a certain shopping behaviour will show the reader whether Russia’s youth tries to
avoid ambiguity and has a high uncertainty avoidance index as discussed above.
Figure 2.3 Russia’s Cultural Dimensions by Hofstede
Source: Hofstede, G. (1996), Cultures and Organizations: Software of the Mind: Intercultural
Cooperation and Its Importance for Survival, New York, McGraw-Hill

21
2.1.3 Product attributes
The product in the centre of this research paper is clothing, and it is defined
according to the Bearden and Etzel (1982), as a public necessity, where the product
category is not influenced by the reference groups, but the reference groups strongly
affect the consumer’s choice of a brand.
Attitudes are formed by many factors, such as economic circumstances,
education, family, age, experience, law and social background. Young consumers
attach a lot of importance to clothing, and their awareness of the symbolic and
emblematic meanings of clothing and fashion goods is very high, as was proved by
several studies (Hogg, Bruce and Hill, 1998).
Eckman et al. (1990) summarised findings from 21 studies of selection criteria
for apparel under intrinsic and extrinsic groups. Intrinsic criteria were divided into
four subgroups in order of frequency in use: product composition, performance,
quality and sex appropriateness. Style, colour, fabric and appearance were apparent
subgroups under product composition. Care, fit, durability and comfort were the top
four factors being used under the performance category. Price, brand/label, country of
origin and store image were most frequently used for extrinsic criteria. In general,
consumers use the intrinsic criteria, a practical approach to clothing, more frequently
than extrinsic criteria, which is more related to the image of the product rather than
the actual characteristics.
Lee and Burns (1993) concluded that style, quality, comfort, size/fit and price
significantly affect consumer behaviour in apparel purchase.
Grønhøj (2007) stated that it is important to young people to use “best-buy”
strategy in relation to price, they explain their attitude with the price-quality
relationships formed by their upbringing and parent’s influence; most of the young
consumers were proven to be quite brand-oriented.

22
2.1.4 Attitude
Psychologists have developed a number of models in order to understand
consumer attitudes. Each of these models provides a different perspective on the
number of component parts of an attitude and how they are related.
According to the Tri-component Attitude model, attitudes consist of three
major components: cognition, affect, and conation. Cognition is previous knowledge
or experience with the product, which allows the consumer to form perceptions or
beliefs about the product. The affective component of an attitude consists of the
consumer’s emotions or feelings. These states may enhance positive or negative
experiences for the consumer. Conation is concerned with the probability that an
individual will do a specific action or behave in a particular way with regard to the
object. The conative component includes the actual behaviour or a purchase itself. In
marketing and consumer research, the conative component is frequently treated as an
expression of the consumer’s intention to buy (Shiffman and Kanuk, 1999).
The ABC model of attitudes defines attitude as the degree the individual’s
favorableness and unfavorableness towards a psychological object (Ajzen and
Fishbein, 1980). A numbers of researchers mentioned that an attitude has three
components, namely, affect, behaviour, and cognition. Affect is defined as a way the
consumer feels about the object in question. Behaviour includes the person’s intention
to perform some action with consideration about the object in question, but intention
might not always result in an actual action. Cognition refers to the beliefs a consumer
has about the object in question. This model stresses the interconnections among
consumers’ learning, feeling and execution. Attitudes toward a product cannot be
determined by simply looking at the consumers’ beliefs on the attitude object, thus the
other two components need to be taken into consideration (Solomon, 2004).
Beaudoin et al. (1998) has tested the ABC model to identify and compare
attitudes toward the purchasing behaviour of domestic and imported apparel for two
groups of young consumers: fashion followers, who simply wear clothes to fit in
society, and fashion leaders, those who don’t seek approval and see no need to follow
social norms. The results revealed that fashion leaders had a better attitude toward
imported apparel, whereas the fashion followers had similar attitudes for imported and

23
local apparel. The study has also discussed the difference in attitudes towards
domestic and imported apparel depending on the respondent’s age. The older
generation was said to be more positive towards locally produced brands. The
researcher measured attitudes by assessing twelve attributes of each category of
clothing, for example, quality, comfort, choice of styles, durability, etc., and the
importance of those attributes to the respondent. The final attitude value was
calculated according to the Fishbein theory, as presented below in figure 2.4.
A hierarchy of effects was developed to study the relative impact of the three
components in the formation of attitude by attitude researchers. Figure 2.3 presents
three different fixed sequences of steps to form attitudes.
Figure 2.4 Three hierarchies of effects
Source: Solomon, M. (2004), Consumer Behaviour: Buying, Behaving and Being, Pearson
Prentice-Hall
In this way, according to Solomon’s Standard Learning Hierarchy, firstly a
consumer would form beliefs about subculture apparel by accumulating knowledge
regarding relevant attributes. The teenager would then evaluate these beliefs and
generate a feeling about apparel. Finally, based on those evaluations, the consumer
would engage in a relevant behaviour, such as purchasing. Differently, based on the
assumption of the Low-Involvement Hierarchy, consumers may not be knowledgeable
about subculture apparel, but believe it is popular, thus they will evaluate the purchase
and form an attitude afterwards. Lastly, Experiential Hierarchy would focus on the
emotional dimension of the consumer, for example, some consumers would just like
the feeling of wearing subculture apparel, but not pay attention to the attributes, such
as comfort and price, for example.

24
2.1.5 Demographics
In his thesis the researcher is concerned with demographic variables, such as
age, gender and area of residence in Moscow. Park, Rabolt and Jeon (2006), proved
that young/female consumers are more likely to have higher probability of purchasing
global luxury brands than older/male consumers. In the process of the study, the
researcher tries to find whether the same applies to the teenagers in Moscow.
Belikov (2002) in his book “The Skinheads” identified the most popular
regions for the subcultural groups’ gatherings in Moscow - those are the streets of
Arbat (Old Center of Moscow), where sometimes clashes between subcultural groups
can be observed, for example, skinheads may attack people dressed in hip-hop styled
clothes. Another central location near the Kremlin is the Lenin museum. Market
Gorbunova (North-Western part of Moscow), where consumers can find a lot of niche
products, starting from music CD’s and movies to subculture apparel, also attracts a
lot of young people who oppose the mainstream fashion. At the Russian University of
National Friendship (South-West of Moscow) one can also find a great variety of
subculture groups, as at this university many nationalities, cultures and minorities
meet, stirring up a cultural exchange and encouraging people to differentiate, by
different means, including the student’s choice of apparel (Belikov, 2002).
2.2 Definition and theories related to Dependent Variable
According to O’Keefe (2002), behavioral intention is the most important
determining factor that can be used to predict the individual’s behavior under most
circumstances. Intention is defined as what the person wants to do. Kotler (2003)
suggests that study of the customer’s behavioral intention can help marketers forecast
a customer’s further action and understand the process of how they satisfy their needs
by consuming goods or services. Moreover, the intention weighing device can be
applied to forecast the feasibility of individual’s behavior in the future, such as
purchasing subculture apparel or persuade others to be involved in subculture clothing
purchase.

25
Two social psychology studies by Ajzen and Fishbein (1980) and Darroch
(1971) on the relationship between the consumer intention and consumer purchase
behavior, have concluded that it was necessary to include intention as a moderator
variable even though situational variables were controlled. Behavioural intention has
been successfully predicted by the Theory of Reasoned Action in many product and
service categories (Ajzen and Fishbein, 1980). The Theory of Reasoned Action
model, presented schematically below, seldom distinguishes between intention and
behavior.
Figure 2.5 Theory of Reasoned Action model
Source: Ajzen, I. & Fishbein, M. (1980), Understanding attitudes and predicting social
behaviour, NJ: Prentice Hall
The theory of the reasoned action model is used to forecast behavior by
merging attitude and subjective norm into the construction, which results in the
behavioral intention. The Theory of Reasoned Action specifies that a person's
behaviour is influenced by his or her intention to execute the behaviour and that this
intention is a result of both his/her attitude toward the behavior and his/her subjective
norm (Ajzen and Fishbein, 1980). In the case of the present study, the actual purchase
of subculture apparel by a teenager in Moscow is assumed to be influenced by the
intention to buy, which is in turn affected by the teenager’s attitude towards the
apparel and the social pressure from the peers, parents and virtual community, or the
subjective norm.
Attitudinal belief
Normative belief
Attitude
Subjective Norm
Behavioral Intention
Actual Behavior
26
2.3 Relationship of the Independent Variables to the Dependent Variable
The relationship between the proposed independent variables, namely, product
attributes, fashion lifestyle, subjective norm, personal variables, and the intervening
variable, attitude, and its relationship with the dependant variable, purchasing
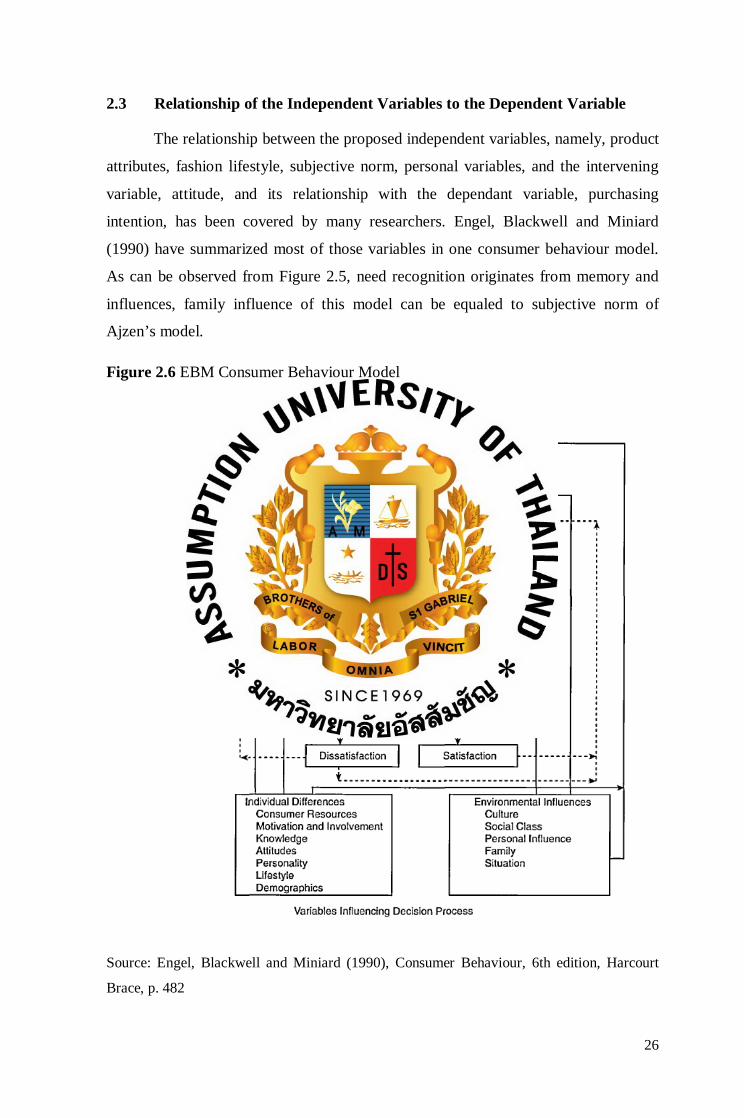
intention, has been covered by many researchers. Engel, Blackwell and Miniard
(1990) have summarized most of those variables in one consumer behaviour model.
As can be observed from Figure 2.5, need recognition originates from memory and
influences, family influence of this model can be equaled to subjective norm of
Ajzen’s model.
Figure 2.6 EBM Consumer Behaviour Model
Source: Engel, Blackwell and Miniard (1990), Consumer Behaviour, 6th edition, Harcourt
Brace, p. 482
27
Evaluation of possible alternatives is done according to one’s beliefs, attitude
and intentions (Engel et al, 1990), which again coincides with the models discussed
above. Lifestyle and demographics of EBM model are directly linked to the actual
purchase, whereas in this paper, it is linked to the attitude variable.
The paper then proceeds to bring forth the studies made in the field by other
researchers, providing the methods used for collecting the information and the results
obtained, which could be useful for completing the research framework and utilizing
the same methodology suggested by previous research.
2.3.1 Previous study on Purchasing Intention and Attitude towards Behaviour,
Subjective Norm and External Variables
Summers and Belleau (2006) have studied the relationship between the
attitude towards behavior and subjective norm towards intention to purchase alligator
leather apparel. In the process of this study 430 affluent females of age 21 and up
residing in metropolitan areas of the US were surveyed. Purchase intention was
placed as the dependent variable of the regression model and the proposed
determinants of the purchasing intention were attitude towards behavior, subjective
norm, as well as the independent variables: external variables of fashion involvement,
controversy perception, price-quality-prestige perception, personality traits and
demographics. The findings indicated that firstly, the purchasing intention was not so
strong toward alligator leather apparel - 42% of respondents indicated some level of
disagreements. Based on the mean of the attitude score, consisting of evaluations and
beliefs, respondents, in general, had a positive attitude toward purchasing American
alligator leather apparel attitude towards behavior, but did not feel strong social
pressure or encouragement to buy American alligator leather apparel. Subjective
norm, controversy perception and fashion involvement had the highest positive
indicators of relationship to the purchasing intention. Other variables in the model
produced no statistically significant relationships to consumers’ purchase intention,
they included: price/quality/prestige perception, personality traits and demographics.

28
2.3.2 Previous Study on Consumer Characteristics and Attitudes towards
Behaviour
Beaudoin et al. (1998) has compared the two groups of young respondents and
their attitudes towards fashion apparel. The groups were separated based on
characteristics, such as fashion leadership. 285 respondents of age groups 18-25 were
surveyed by the help of mail questionnaire. T-tests revealed the differences between
the group of fashion leaders and fashion followers. Fashion leaders were identified
from the fashion followers according to the following: fashion leaders are likely to
spend more money on apparel, read more fashion magazines and other such literature
and go shopping more often than followers. The results showed that the attitudes were
different between these two groups toward imported and domestic apparel. The
followers had a similar attitude to domestic and local clothing, while the fashion
leaders preferred imported clothing.
2.3.3 Previous study on Purchasing Intention and Fashion Lifestyles
Ko et al. (2007) has studied advertising effectiveness based on purchasing
intention, attitude towards ads and brand. They identified purchase intention as the
consumer behavioral component of advertising effect, which can be evaluated by
consumers’ subjective intention to buy a specific brand based on advertisements they
have seen.
A self-administered questionnaire was distributed to 210 female consumers
who were either residents or visitors to the Korean capital with the means of
convenience sampling and included four main variables: recognition of
advertisements, or attitude toward ad, and the brand, or attitude toward brand, and
advertising effectiveness measured by purchase intention and the other variables of
fashion lifestyle, and nationality.
The cluster analysis with the help of K-means was done to determine whether
consumers could be segmented into distinct groups based on fashion lifestyle factors.
Four clusters were identified: sensation seekers, information seekers, utilitarian and
conspicuous consumers. The four-cluster solution was then verified using ANOVA,
resulting in significant differences among four clusters in all fashion lifestyle factors.
These results supported the belief that there are certain fashion lifestyle segments that

29
cut across cultures. Fashion lifestyle as well had a significant effect on purchase
intention toward brand in advertising for each country. Sensation seekers and
information seekers tended to have higher indicators of purchase intentions than
utilitarian and conspicuous consumers.
2.3.4 Previous study on Consumer Attitude and Purchase Intention
Casella (2005) has studied the clothing market in Thailand, in particular the
relationship between cognitive and affective attitudes towards intention to purchase
domestic and imported brands, the relationship between the subjective norm and the
purchase intention and differences in demographics affecting the purchasing intention.
For all the relationship models, Pearson’s correlation test was used, whereas
analysis of variance was used for the demographics model. Analysis was made on 400
questionnaires, selected by judgment and convenience sampling. Buyers of domestic
and imported casual apparel, ages 25-45, earning at least 15000 Baht per month were
selected in downtown department stores. The study showed that both types of attitude
and subjective norm are positively related to purchasing intention. It has also proven
that there are differences between different age groups, gender, income and education
and their purchasing intention of imported brands, whereas, domestic brands
purchasing intention was not affected by different demographic factors, except
income.
2.3.5 Previous Study on Product Attributes and Attitudes
Phau and Leng (2008) specifically studied the teenager market for apparel and
looked into attitudes towards the purchasing of clothes based on the country of origin.
The ANOVA analysis was done separately for the following 12 apparel attributes:
good fit, durability, ease of care, comfort, good price, quality, appropriate for
occasion, colour, attractiveness, fashionableness, brand name and choice of styles; it
was used to determine if non-status seeking teenagers gave the same evaluation
toward Australian brands as they did for foreign brands.
Sample consisted of teens aged 13 to 19. The 15 to 19 year-olds were given
special attention, as the young people at this age like to express themselves and have
reached a higher maturity in the sense of knowledge and interpretation of the product

30
attributes. Survey forms were given out to 498 respondents through 11 senior high
schools in Australia. The ANOVA results showed that Australian teenagers’ attitudes
toward buying Australian brands of clothing were different than toward buying
foreign brands of clothing, due to the higher quality, fashionableness, brand name and
better choice of styles of Italian and Japanese brands. Non-status seeking teenagers
were found to have a more positive attitude toward luxury brand apparel from Italy,
Australia and Japan respectively, and a negative attitude toward luxury brand apparel
from China. Status-seeking teenagers generally had a more positive attitude toward
Italian, Japanese, and Australian luxury brand apparel respectively.
2.4 Summary of the Theories and Previous Studies
Table below presents the main theories, studies and research findings
mentioned in the chapters above which are related to the topic of this research.
Table 2.1 Summary of the Theories and Previous Studies
Author Title Findings Azjen and Fishbein (1980)
Theory of Reasoned Action
• Behavioural intention is influenced by subjective norm and attitude toward the behaviour
• Attitude is influenced by attitudinal belief • Subjective norm is influenced by normative belief • Behavioural intention directly affects the purchase
Beaudoin et al (1998)
Young fashion leaders’ and followers’ attitudes toward American and imported apparel
• Attitudes are different between two groups with different consumer characteristics.
• Fashion followers had a similar attitude to domestic and local clothing
• Fashion leaders preferred imported clothing.
Casella (2005)
Consumer attitudes and purchase intention of imported and domestic brand of casual wear apparel in Bangkok
• Both types of attitude and subjective norm are positively related to purchasing intention
• There are differences between different age groups, gender, income and education and their purchasing intention of imported brands
• Domestic brands’ purchasing intention was not affected by different demographic factors, except income
Ko et al. (2007)
Cross-national market segmentation in the fashion industry
• Fashion lifestyle had a significant effect on purchase intention toward brand in advertising for each country
• Sensation seekers and information seekers tended to have higher purchase intentions than utilitarian and conspicuous consumers.

31
Author Title Findings Park, Rabolt and Jeon (2006)
Purchasing global luxury brands among young Korean consumers
• Purchasing intention towards luxury brands influenced by conformity, consumer ethnocentrism, but other factors tested don’t affect the purchasing intention (materialism, need for uniqueness, vanity, social recognition)
• Demographics (age, pocket money) also affect the intention to buy luxury brands , shopping frequency has no effect
Parker, Hermans and Schaefer (2004)
Fashion Consciousness of Chinese, Japanese, US teens
• Females are significantly more fashion-conscious than males
• Age is positively related to fashion consciousness • Allowance is positively related to fashion
consciousness Phau and Leng (2008)
Attitudes toward domestic and foreign luxury brand apparel
• Attitude towards foreign brands from Italy and Japan was higher, because of the following attributes: higher quality, fashionabless, brand name, better choice of styles of
• Australian brands were believed to have a better price, affecting the attitude towards clothing made in Australia positively
Schiffman and Kanuk (2000)
Tri-component Attitude model
Attitude towards products formed by: • Cognition • Affect • Conation (measured by purchasing intention)
Summers, Belleau (2006)
Predicting purchase intention of a controversial luxury apparel product
• The more favorable the respondent’s attitude was toward the behavior, the higher the purchase intention.
• The stronger the respondent’s perception of social pressure on her to buy American alligator leather apparel, the more likely she was to purchase the product.
• Two external variables (Fashion involvement, social acceptance) were significantly related to purchase intention.
• Five external variable (price/quality/prestige perception, personality traits, or demographics) produced no statistically significant relationships to consumers’ purchase intention
Shipkov (2007)
Psychographic portrait of Russian consumers, Marketing Index by TNS
• Social 11% – Individual pragmatic 4% • Shy8% - Fashionable 7.2% • House bred 12%– Risk takers 5% • Conformist 5% – Non-conformist 11% • Organised 12% – Impulsive 5%

32
CHAPTER 3
RESEARCH FRAMEWORKS
This chapter presents the conceptual framework used to examine the factors
affecting the intention to purchase subculture apparel and the factors affecting the
attitude toward subculture apparel of teenagers in Moscow. The first section starts
with the theoretical frameworks developed by researchers with the similar variables,
and the second section is about the introduction of the conceptual framework. Next,
section three illustrates the specific hypotheses for examining the relationship
between each variable. Finally, the fourth section presents the operationalization of
the independent and dependent variables in detail.
3.1 Theoretical Frameworks
Several frameworks have been developed by the researchers to indicate the
relationships mentioned in the paper.
Casella (2005) proposes the framework that links attitude, subjective norm and
demographics to purchase intention of casual apparel; she has proved that cognitive
and affective attitude, as well as subjective norm was related to purchasing intention.
Figure 3.1 Relationship between attitude, subjective norm and demographics towards
purchase intention
Source: Casella (2005), A comparative study on consumer cognitive and affective attitudes
and purchase intention of imported and domestic brand name casual wear apparel in
Bangkok, Assumption University, Bangkok

33
Summers, Belleau (2006) predict purchasing intention with the attitude
towards behaviour variable and subjective norm, which in turn are affected by
external variables, such as demographics, personality traits, involvement, price versus
quality perception and controversy perception (as the product in focus of the study is
alligator leather goods).
Figure 3.2 Model for the intention to purchase controversial apparel
Source: Summers, Belleau (2006), Predicting purchase intention of a controversial luxury
apparel product, Journal of Fashion Marketing and Management, vol. 10, no. 4, pp. 405-419
Summers’ model also deals with controversial goods, which is the subject of
this paper. Subculture apparel creates controversies in the society, as it is not
following the mainstream, it does not fit in the casual, sports or official wear
categories. As presented in the first chapter, controversies around such apparel appear
in schools, where teachers object subcultural influences of their students, vote against
rebellious spirits of Russian youths and try to prevent the sometimes damaging effects
of following a subculture.

34
Ko et al. introduces the relationship between the fashion lifestyles and attitude,
as well as purchase intention, as presented below. Fashion lifestyle had a significant
effect on purchase intention, and there were differences in the purchasing intentions
among the consumers with different fashion lifestyles.
Figure 3.3 Model for Fashion Lifestyles and Nationality relationships to Attitude and
Purchase Intention
Source: Ko et al. (2007), Cross-national market segmentation in the fashion industry,
International Marketing Review, vol. 24, no. 5, 2007, pp. 629-651
Phau and Leng (2007) provide the framework with the product attributes relationship
to the attitudes. Status-seeking and non-status seeking teenagers were tested for
difference in their attitudes and product attribute evaluation. Non-status seeking
teenagers found Australian luxury brands superior to all three foreign brands with
regards to ease of care and comfort.
Figure 3.4 Model for Attitudes towards foreign and local brands of status-seeking and
non status-seeking teenagers
Source: Phau and Leng (2007), Attitudes toward domestic and foreign luxury brand apparel,
Journal of Fashion Marketing and Management, vol. 12, no. 1, pp. 68-89

35
3.2 Research Framework
Based on the frameworks discussed above and studies mentioned in the
previous chapter, the researcher proposes a framework, presented in the next section.
Below one can see the four independent variables, namely, personal characteristics of
the Moscow teenagers surveyed, such as age and gender, subjective norm, fashion
lifestyle and product attributes, linked to the intervening variable, attitude – these
connections come from the studies by Beaudoin et al. (1998), Phau and Leng (2007),
Ko et al. (2007). The second relationship in the framework between the attitude
towards subculture clothing and the dependent variable of this study, namely intention
to buy subculture clothing, comes from the Theory of Reasoned Action by Ajzen and
Fishbein (1980) and EBM Consumer Behaviour Model by Engel, Blackwell and
Miniard (1990), as well as numerous studies by Casella (2005), Summers and Belleau
(2006) and others.
Figure 3.5 Research Framework
The modified framework is constructed to portray the relationships the
researcher wants to examine in order to find whether the attitude towards subculture
apparel of teenagers in Moscow is related to their purchasing intention and whether
external factors are related to their attitude and to see how the attitude might be
different based on personal variables.
Personal Variables - Age - Gender
Subjective Norm
Fashion Lifestyle - Prestigious - Sensational - Practical - Informational
Product Attributes
Attitude towards
Subculture Clothing
Intention to Buy
Subculture Clothing

36
3.3 Statement of Hypotheses
This study is aimed to reject or fail to reject the following hypotheses:
H1 o: There is no relationship between subjective norm and the teenagers’ attitude
towards subculture apparel
H1 a: There is a relationship between subjective norm and the teenagers’ attitude
towards subculture apparel
H2 o: There is no relationship between product attributes and the teenagers’ attitude
towards subculture apparel
H2 a: There is a relationship between product attributes and the teenagers’ attitude
towards subculture apparel
H3 o: There is no relationship between fashion lifestyles and the teenagers’ attitude
towards subculture apparel
H3 a: There is a relationship between fashion lifestyles and the teenagers’ attitude
towards subculture apparel
H4 o: Attitude towards subculture apparel is not significantly different based on age
H4 a: Attitude towards subculture apparel is significantly different based on age
H5 o: Attitude towards subculture apparel is not significantly different based on gender
H5 a: Attitude towards subculture apparel is significantly different based on gender
H6 o: There is no relationship between teenagers' attitude towards subculture apparel
and the purchase intention
H6 a: There is a relationship between teenagers' attitude towards subculture apparel
and the purchase intention

37
3.4 Operationalisation of variables
Table 3.1 Dependent and independent variables, their operational component and
measurements.
Concept Definition Operational Components Measure
Subjective
Norm
Influence of others on
the decisions of
choosing apparel
Agreement to the following:
-My parents would encourage
me to buy this apparel
-My friends would encourage
me to buy this apparel
-Online communities would
encourage me to buy this
apparel
Interval
(5-point
Likert scale)
Product
Attributes
The selected
characteristics of
subculture apparel
Agreement to the following:
-Subculture apparel is
fashionable
-Subculture apparel is attractive
-Wearing sub-culture apparel is
prestigious
-Price is important when buying
subculture apparel
-Brand is important when buying
subculture apparel
Interval
(5-point
Likert scale)
Attitude
towards
subculture
apparel
Feelings about the
subculture apparel Agreement to the following:
-I like subculture apparel
-I would wear subculture
apparel as it supports my
personality
-Wearing subculture apparel
would make me feel more
confident
Interval
(5-point
Likert scale)

38
Concept Definition Operational Components Measure
Fashion
lifestyle - Prestigious
- Sensational
- Practical
- Information
Way a consumer shops
and learns about
apparel and fashion
Based on the previous
study, the 4 styles are
tested: prestigious,
sensational, practical
and informational
fashion lifestyles.
Agreement to the following:
-I believe wearing famous
brands helps me to be
acknowledged by others
-I tend to consider overall
coordination of clothes
-I usually wear clothes that are
comfortable
-I go shopping to get ideas even
though I have no intention to
buy
Interval
(5-point
Likert scale)
Personal
Variables - Gender
- Age
- District
Characteristics of a
population, such as sex,
number of years a
person has lived and the
area of the city where
the respondent currently
resides.
Gender: Male / female
Age: 12 – 13 / 14 – 15 years old
16 – 17 / 18 – 19 years old
Districts: North-West / West
South-West / Centre
North-East / East
South-East / South / North
Nominal
Ordinal
Nominal
Intention to
buy
Consumer’s eagerness
to make a purchase
Agreement to the following:
-getting subculture apparel if had
the money to buy it
- getting subculture apparel if
parents bought it
- would buy subculture apparel
next time I go shopping
Interval
(5-point
Likert scale)

39
CHAPTER 4
METHODOLOGY
This chapter explains the methodology used, sampling procedures of the target
population, data collection techniques and processing to be used after the collection of
data for the analysis. The opening section gives a general idea of the research
methodology, followed by the next section with the presentation of Russian
population statistics and the sample size selected. The third section introduces the
tools to collect the data for this study. The fourth and fifth sections describe the
statistical and computer techniques to measure and analyse the raw data collected for
the rejection of the hypotheses mentioned in the previous chapter.
4.1 Methods of Research used
The research method used for this study is descriptive, quantitative research
which is aimed at exploring the purchasing intention of teenagers towards subculture
apparel. Descriptive research, in some literature also referred to as statistical research,
describes data and characteristics about the population or phenomenon being studied.
Descriptive research answers a limited set of questions what, who, when, where and
how (Zikmund, 2003), but it does not study the underlying reasons, as is done in
causal research. In this study, the main question to answer is how teenagers’ attitude
is related to purchasing intention and external variables. Such methodology involves
systematic descriptions, frequency calculations and tendency determination.
Survey methodology is used to collect the data, a method of primary data
collection in which information is gathered by communicating with a sample of
people, representative of the population under study. The survey is conducted by
using self-administered questionnaires to collect the data. This type of technique is an
inexpensive, quick, efficient and accurate means of gathering information from a
population, but it also has its drawbacks in the form of insincere replies of
respondents and answers not being controlled by the interviewers, which may result in
many unusable or incomplete questionnaires (Zikmund, 2003).

40
4.2 Respondents and Sampling Procedures
Zikmund (2003) defined sampling as the process of using a small number of
items or groups of the whole population to make a conclusive representation for the
whole population. In this research, respondents in schools will be selected based on
convenience sampling (a technique in which units of the sample are selected on the
basis of personal judgment or convenience) and on-line respondents are selected
based on random sampling (where all samples have an equal chance of being selected
from the population). Three secondary schools are selected to distribute hard copies of
questionnaires and additional required questionnaires will be collected online.
Russia’s total population in the year 2008 was 142 million, out of which
Moscow population is 10.5 million. Population as of 1 January, 2008, in Moscow for
selected age groups below is taken from the latest census results and the
representation of age groups in Moscow is: 20% of Moscow teenage population is 12-
13 year old, 21% is 13-14 year old, 27% is 15-16 year old and 33% is 18-19 year old.
Table 4.1 Population of Moscow for selected age groups
Age Moscow population of
selected age, 2008 Boys Girls
12 76 398 39149 37249
13 74 710 38675 36035
14 71 787 37092 34695
15 82 450 42356 40094
16 91 512 47137 44375
17 109 074 55510 53564
18 118 506 59857 58649
19 126 308 61007 65301
Total
750 745 (7.1% of Moscow
population are people of ages 12-19)
380 783 (50.7% of teenage
population of Moscow is boys)
369 962 (49.2% of teenage
population of Moscow is girls)
Source: www.gks.ru, Russian Federal State statistics, accessed on 12/08/2009

41
Calculation of the sample is done with the formula (Bartlett et al, 2001):
The researcher allows for a 5% statistical error, therefore the confidence level
will be 95%, the corresponding z-value is 1.96. Considering the estimate of the
proportion of people in the group, as was presented from the statistics bureau, the
target of this thesis comprises of 7.1% of the population. When placing the values into
the formula, the following sample size is obtained:
= 1.96 * 2 (0.071 (1-0.071))
0.05 * 2
Minimum required sample size = 317 respondents
Below is the representation of the Moscow districts, shopping mall
concentration, represented by shaded area, and the number of schools in each district.
Most shopping malls are located in the centre, north-west, south-west and south of
Moscow.
Figure 4.1 Map of Moscow with the numbers of secondary schools and the most
concentrated retail areas highlighted
Sources: shopandmall.ru, accessed on 12/08/2009; www.edukids.ru, accessed on 27/10/2009
Where: s = sample size z = level of confidence p = an estimate of the proportion of people in the group e = the proportion of error

42
The researcher will conduct the survey in secondary schools, grades 6-11,
which represent the age groups concerned with the study. According to the
Generation Next – Global Research Poll (2006) by BBC News Service & Synovate
and the Teenmark Report (2000), similarities in certain ages allow the researcher to
approach the sample with 4 groups: 12-13 year olds, 14-15 year olds, 16-17 year olds
and 18-19 year olds. It can be also observed from the education system, that
placement of the pupils will be according to their age and with no more than one year
difference in the same grade.
Table 4.2 Education system in Russia
Moscow District
Number of Secondary Schools
Level of Education
Age of the Students
1. Central 1290 grade 1 7-8 2. North 1100 grade 2 8-9 3. South 1770 grade 3 9-10 4. East 1380 grade 4 10-11 5. West 1300 grade 5 11-12 6. North-East 1380 grade 6 12-13 7. North-West 1390 grade 7 13-14 8. South-East 1350 grade 8 14-15 9. South-West 1480 grade 9 15-16 grade 10 16-17 grade 11 17-19 college / university 18-22
Source: www.edukids.ru, accessed on 27/10/2009
Convenience sampling will be used for selecting the respondents. Three
schools, one in North-West, one in South-West and one in the South district, will
receive the hardcopies of the questionnaires and all willing to participate will fill-in
the forms. The remaining necessary samples will be collected online. The main
advantage of distributing in schools is the greater chance of cooperation from the
teenagers and more sincere answers, as they are asked by their peers, friends and
acquaintances to participate in the survey. In order to achieve the desired number of
completed and usable questionnaires, a higher quota is set - 330 questionnaires will be
collected in Moscow.
Primary school
Secondary school

43
4.3 Instruments for Data Collection
The questionnaire is developed based on previous studies as well as
formulations by research agencies, such as Gallup Research Organisation, Synovate
and others. It includes questions easy to understand for teenagers, simple formulations
and fill-in guidelines.
Part one: screening is done by the person who distributes the questionnaires
in their own district. They will approach a respondent by asking the age, and if the
person is below 12 years old or above 19, the survey is discontinued.
Part two: attitude towards subculture apparel is measured with three questions
on a 5-point agreement scale, with 1 indicating “strongly disagree”, 2 – “disagree”, 3-
“mixed feelings”, 4 – “agree” and 5 indicating “strongly agree”.
Part three: the independent variables are tested in this section, they include:
Product attributes evaluation, the most appropriate for subculture apparel
attributes were selected from the studies by Grønhøj (2007); Phau and Leng (2007):
fashionable, attractive, prestigious attributes of the clothing, as well as price and
brand significance were tested;
Subjective norm or the influence of parents, friends and online communities
for purchasing subcultural apparel were tested according to the proposed scheme in
the Summers and Belleau (2006) study;
Ko at al. (2007) developed a questionnaire for the test of the four prominent
lifestyle segments: brand consciousness/prestige, sensational, practical, informational
consumers, where three questions under each segment require agreement or
disagreement with a statement on a 5-point Likert scale.
Part four: dependent variable here is tested on a 5-point scale, with questions
related to how likely the respondent is to purchase subculture apparel.
Part five: deals with demographic variables, such as age, gender and the
district of residence. Clear portrayal of the Moscow district map is provided to make
it easier for the young respondents to answer, as advised by many research agencies,
like Synovate and TNS.

44
The questionnaire was first prepared in English, after which an exact
translation into Russian was made, with all the formats and scales kept intact. As there
are no open-ended questions used, solely numerical values are input back into the
system for the analysis.
4.4 Pre-test
Pre-test was done before carrying out the study in the Sothern and South-
Western districts of Moscow among girls and boys of 12-19 age groups in September
2009. The purpose of the pre-testing is to determine the reliability of the questionnaire
for the final survey. The pre-test sample should consist of at least 25 respondents
(Vanichbancha, 2003), thus the researcher analysed 30 questionnaires. Cronbach’s
coefficient alpha was used in order to test consistent reliability of multi-point scaled
items. If anα -test is less than 0.6, it means that the questions are considered poor and
unreliable. On the contrary, if an α -test is greater than 0.6, it means the questions are
considered acceptable (Sekaran, 1992). Based on the Statistical Package for Social
Science (SPSS program), a reliability test was run and the results are presented below.
Table 4.3 Reliability Analysis of the Pre-tested Questionnaire in Each Dimension
Variables Number of
items
Number of
cases
Cronbach's
Alpha
Purchase intention 3 30 0.78
Attitude 3 30 0.95
Subjective norm 3 30 0.65
Product attributes 3 30 0.80
Prestige fashion lifestyle 3 30 0.81
Sensational fashion lifestyle 3 30 0.78
Practical fashion lifestyle 3 30 0.83
Informational fashion lifestyle 3 30 0.68
As shown above, all variables show an acceptable level of α -test, thus the researcher
proceeds to collect the complete sample for the thesis.

45
4.5 Statistical Treatment of Data
Primary research needs to be done, as there is no secondary data available on
this topic in Moscow. Primary data is defined as data gathered specifically for the
research project at hand (Zikmund, 2003). Secondary data, defined by Zikmund
(2003) as data that has been previously collected for some purpose other than the one
at hand, is collected through textbooks, databases and the library of Assumption
University, academic journals, theses, as well as findings presented by research
agencies, such as Synovate, TNS, ACNielsen, Comcon, Gallup Media, etc. Many
news articles have been also reviewed and presented in this paper and web-sources
were also used extensively.
Both descriptive and inferential analyses will be employed in the statistical
treatment of data. Inferential statistics determines something about a population based
on a sample and makes conclusions based on those findings and extends it to the
whole population. Descriptive statistics is applied to transform the raw data with the
means of organising, systemizing, summarizing and presenting into a form easy to
understand and interpret for a researcher (Sekaran, 1992).
Among the descriptive statistical tools, means (the average scores, as well as
group means), percentages, and standard deviation were used to explain the
demographic information and ratios among the respondents. The collected raw data
this way can be summarized into a understandable form which is easy to interpret
(Zikmund, 2003).
Pearson correlation
The Pearson correlation coefficient is used to measure the strength and
direction of the linear relationship between the two variables, and the value describes
the linear connection between each two variables, as presented by the formula below
(Zikmund, 2003).
∑ ∑∑
−−
−−==
22 )()(
))((
yyxx
yyxx
SS
Sr
ii
ii
yx
xy
Where: r = Sample Coefficient of Correlation
Xi and Yi = Values for any sample unit i
X and Y = Means

46
Table 4.4 Correlation coefficient interpretation
Source: Hussey (1997), Business research: A practical guide for undergraduate and
postgraduate students, p.227
SPSS software provides p-value for the Pearson correlation, two-tailed
hypothesis test. If the p-value is less than 0.01, the null hypothesis would be rejected.
If the null hypothesis fails to be rejected, this will show no relationship between the
variables tested (subjective norm, product attributes, lifestyles, attitude, purchasing
intention).
Independent samples t-test
The t statistic is used to test whether the means are different and can be calculated as
follows (Fisher, 1956):
Where, Sx1x2 = grand standard deviation of group 1 and group 2
= standard error of the difference between two means
n = number of participants in each group
Degrees of freedom = 2n – 2
The researcher will use this test to see the difference in attitudes towards subculture
apparel between different genders of teenagers. The result is concluded by comparing
t value to the critical value, assuming significance value less than 0.05.

47
Analysis of variance
Analysis of variance (ANOVA), defined as the statistical test of whether the
means of several groups are equal or not, and is an extension to the t-test, where only
two independent variables can be tested. ANOVA gives more freedom of analyzing
two or more groups. F-value is the ratio of variance of the group means over mean of
the with-in group variances, as presented by the formula below (Fisher, 1956):
F = MST / MSE
Where: MST (mean squares between) = SST / degree of freedom (K – 1)
MSE (mean squares within) = SSE / degree of freedom (N-K)
K = number of groups
N = overall sample size
This test will be applied to test difference in attitudes between different age
groups. As they are more than two, the t-test is not applicable here. Null hypothesis
will be rejected if MST is larger than MSE, assuming significance level of 0.05.
Following is the summary of the null hypothesis and the methods to be used
for statistical treatment.
Table 4.5 Statistical Tools Used for Testing the Research Hypotheses
Null Hypothesis Null Hypothesis description Statistical
technique used H1 There is no relationship between subjective norm and
the teenagers’ attitude towards subculture apparel Pearson Correlation
H2 There is no relationship between product attributes and the teenagers’ attitude towards subculture apparel
Pearson Correlation
H3 There is no relationship between fashion lifestyles and the teenagers’ attitude towards subculture apparel
Pearson Correlation
H4 Attitude towards subculture apparel is not significantly different based on age
ANOVA
H5 Attitude towards subculture apparel is not significantly different based on gender
Independent samples t-test
H6 There is no relationship between teenagers' attitude towards subculture apparel and the purchase intention
Pearson Correlation

48
CHAPTER 5
PRESENTATION OF DATA AND DISCUSSION OF RESULTS
This chapter presents the results obtained from the survey that was conducted
in Moscow in October-November 2009. The primary data analysis is divided into two
sections. The first section presents descriptive statistics, such as data in forms of
frequency, percentage, and mean. The second section presents the hypothesis testing
results.
5.1 Descriptive Statistics
The tables below give the frequencies and percentages of the sample distribution of 339 completed and usable questionnaires.
Table 5.1 Gender, Age and District Descriptive Statistics
Gender Frequency Percent District Frequency Percent
Male
Female
154
185
45.4
54.6
South-West
South-East
Centre
North-West
South
West
East
North-East
North
125
40
35
31
29
23
24
22
10
37%
12%
10%
9%
9%
7%
7%
6%
3%
Age Groups Frequency Percent
12-13
14-15
16-17
18-19
41
82
80
136
12.1
24.2
23.6
40.14
Girls make up the majority of the sample (almost 55%), due to their higher
willingness to participate in the survey related to clothing. Age groups are unevenly
distributed, due to the lower rate of minors using Internet, thus having lower access to
the questionnaire online. The hardcopies have been distributed in schools mostly to
grade 6 (with 12-13 year old pupils) and grade 7 (with 14-15 year old pupils).
Sophisticated online users are mostly from 16 years old and up, thus the questionnaire
online has reached the latter two age groups. A lot of respondents participating in the
survey reside in the south-western, south-eastern and central districts of Moscow.

49
Table 5.2 Analysis of Factors Related to Intention to Buy Subculture Apparel
Variables & Questions (scale: 1 “strongly disagree” to 5 “strongly agree”) Mean Group
Mean Std.
Deviation
Atti
tude
1. I like subculture apparel 3.2537 1.27815
2. I would wear subculture apparel as it supports my personality 3.2094 3.09 1.31010
3. Wearing subculture apparel would make me feel more confident 2.8171 1.35727
Prod
uct A
ttrib
utes
4. Subculture apparel is fashionable 2.9617 1.26690
5. Subculture apparel is attractive 3.1239 1.24130
6. Wearing sub-culture apparel is prestigious 2.3717 2.77 1.19314
7. Price is important when buying subculture apparel 2.7788 1.31492
8. Brand is important when buying subculture apparel 2.6342 1.28331
Subj
. Nor
m 9. My parents would encourage me to buy this
apparel 2.6844 1.20063
10. My friends would encourage me to buy this apparel 3.2979 3.07 1.10259
11. Online communities would encourage me to buy this apparel 3.2389 1.15851
Pres
tige
FL 12. Clothes must be expensive to have class 3.1445 1.30307
13. I believe wearing famous brands helps me to be acknowledged by others 2.6106 3.74 1.24582
14. I believe that expensive clothes are good 3.0177 1.31659
Sens
atio
nal F
L 15. I have good taste in coordinating colours and designs of clothes 3.7257 1.01394
16. I have a good eye for selecting clothes 3.4867 2.92 1.06960
17. I tend to consider overall coordination of clothes 4.0206 1.02751
Prac
tical
FL 18. When selecting clothes I look for their
function rather than their design 3.0885 1.19830
19. I usually wear clothes that are comfortable 3.5074 3.30 1.18263
20. I make purchases only when there is a need 3.2920 1.22847
Info
rmat
’l FL
21. I go shopping to get ideas even though I have no intention to buy 2.6283 1.32250
22. I like to shop in many different stores 3.4425 2.80 1.21093
23. I am the first to try new fashions 2.3068 1.15397

50
Looking at the mean scores, the researcher can conclude the following: the
attitude towards subculture apparel of teenagers in Moscow in general is positive. The
majority like subculture clothing, as indicated by the mean score 3.3 out of all the 339
cases. But wearing such clothes does not contribute to increased confidence, as the
mean score of 2.8 shows. Many, despite considering subculture apparel attractive,
disagree that it is fashionable and prestigious, which confirms the definition of
subculture consumption in chapter 1, which states that subcultures do not follow
general fashion trends. Brand and price were found unimportant when it comes to
purchasing subculture apparel. Most of the surveyed teenagers disagree that their
parents would encourage them to wear subculture clothing. On the other hand, a
positive influence in the respondents’ opinion comes from their friends and the online
communities.
Fashion lifestyles that most surveyed teenagers lead are sensational and
practical, with group mean scores are 3.74, 3.29 respectively. Prestigious and
informational fashion lifestyles were found to be less popular with group mean scores
2.92 and 2.79, respectively. Most believe to be good in colour and design
coordination of their clothes, but do not see the necessity of wearing branded clothing
to be acknowledged by others. Most teenagers also look for comfort when buying
clothing. As mentioned in chapter 2, Russians are not willing to take risks and are
rather shy, which is confirmed here by the low mean scores for trying new fashions.
Table 5.3 The Dependent Variable, Mean and Standard Deviation
Variables & Questions (scale: 1 “strongly disagree” to 5 “strongly agree”) Mean Group
Mean Std.
Deviation
Purc
h. In
tent
24. I would get subculture apparel if I had the money to buy it 3.0000
1.43704
25. I would get subculture apparel if my parents bought it for me 2.7168 2.81 1.39824
26. I would buy subculture apparel next time I go shopping 2.7021
1.37271
As can be observed, most respondents have a low intention to make an
actual purchase of subculture clothing during their next visit to a store. Some
respondents provided comments that they make their own subculture clothing, thus do
not need to purchase it, while being able to differentiate themselves with a unique

51
style. The surveyed teenagers would prefer to buy subculture clothing themselves if
they had the money for it, rather than ask for their parents to do the purchase.
Reliability analysis
As can be observed from the table below, all the variables are above the
required 0.6 alpha level and are reliable.
Table 5.4 Reliability Analysis of the Questionnaire in Each Dimension
Variables Number of
items
Number of
cases
Cronbach's
Alpha
Purchase intention 3 339 0.726
Attitude 3 339 0.873
Subjective norm 3 339 0.684
Product attributes 3 339 0.691
Prestige fashion lifestyle 3 339 0.684
Sensational fashion lifestyle 3 339 0.772
Practical fashion lifestyle 3 339 0.758
Informational fashion lifestyle 3 339 0.722
5.2 Hypotheses Analysis
In this section, the results of all the 6 hypotheses tests are presented, the first 3
hypotheses and the last one were tested for relationship using Pearson Correlation.
The fourth hypothesis was tested by the Independent Samples t-test, and the fifth
hypothesis was tested by ANOVA.
H1 o: There is no relationship between subjective norm and the teenagers’ attitude
towards subculture apparel
H1 a: There is a relationship between subjective norm and the teenagers’ attitude
towards subculture apparel

52
Table 5.5 Relationship between Subjective Norm and the Attitude
Correlations
ATTITUDE SUBJ_NORM
ATTITUDE Pearson Correlation 1 .549**
Sig. (2-tailed) .000
N 339 339 SUBJ_NORM Pearson Correlation .549** 1
Sig. (2-tailed) .000 N 339 339
**. Correlation is significant at the 0.01 level (2-tailed).
Significant positive relationship is indicated by the Pearson correlation
coefficient of 0.549 and the significance value 0.000 is less than 0.01, thus the null
hypothesis is rejected. Attitude of the teenager towards subculture apparel is related to
the influence and opinions of the significant others or the subjective norm. The more
the friends and online communities, such as social networks on Facebook.com or
Vkontakte.ru, encourage teenagers to buy subculture apparel, the more positive will
be their attitude towards such clothing.
H2 o: There is no relationship between product attributes and teenagers’ attitude
H2 a: There is a relationship between product attributes and teenagers’ attitude
Table 5.6 Relationship between Product Attributes and the Attitude
Correlations
ATTITUDE PROD_ATTRIB
ATTITUDE Pearson Correlation 1 .488**
Sig. (2-tailed) .000
N 339 339 PROD_ATTRIB Pearson Correlation .488** 1
Sig. (2-tailed) .000 N 339 339
**. Correlation is significant at the 0.01 level (2-tailed).
Null hypothesis is rejected, due to the significant relationship between the
product attributes and attitude. Consideration whether subculture apparel is
fashionable, attractive and prestigious has a positive relationship with the teenager’s
attitude towards such clothing. The correlation coefficient of 0.488 indicates a
medium positive correlation, with a sig. value of 0.000 less than 0.01.

53
H3 o: There is no relationship between fashion lifestyles and the teenagers’ attitude
towards subculture apparel
H3 a: There is a relationship between fashion lifestyles and the teenagers’ attitude
towards subculture apparel
Table 5.7 Relationship between Fashion Lifestyle and the Attitude
Correlations
ATTITUDE FL
ATTITUDE Pearson Correlation 1 .025
Sig. (2-tailed) .651
N 339 339 FL Pearson Correlation .025 1
Sig. (2-tailed) .651 N 339 339
As the sig. value 0.651 is much higher than 0.01, the researcher fails to reject
the null hypothesis. This means that fashion lifestyles the teenagers lead is not related
to their attitude towards subculture apparel. The four fashion lifestyles have a very
low insignificant positive relationship with the attitude, which is indicated by the
Pearson Correlation coefficient of 0.025.
H4 o: Attitude towards subculture apparel is not significantly different based on age
H4 a: Attitude towards subculture apparel is significantly different based on age
Table 5.8 Difference in the Attitude towards Subculture Apparel between age groups
ANOVA
ATTITUDE Sum of Squares df Mean Square F Sig.
Between Groups 15.611 3 5.204 3.868 .010
Within Groups 450.653 335 1.345
Total 466.264 338
*. The mean difference is significant at the 0.05 level.
MST (mean squares between groups) is larger than MSE (mean squares
within groups) and the significance level of 0.010 is lower than 0.05, therefore, the

54
null hypothesis is rejected. Respondents of different age groups proved to have
differences in their attitude towards subculture apparel.
To see a more detailed analysis of each age group, Tukey test is applied, the
results are shown below. It can be observed that significant difference exists between
age groups of 14-15 and 16-17 year olds. Moreover, the respondents of ages 14-15
have a significantly different attitude towards subculture apparel from the respondents
who are 18-19 years of age. Teenagers of 12-13 years and 14-15 years are however
not significantly different in their attitude towards subculture apparel.
Table 5.8 Multiple Comparisons of Age Groups
Multiple Comparisons Tukey HSD
Dep. Var: ATTITUDE (I) age (J) age
Mean Difference (I-J) Std. Error Sig.
95% Confidence Interval
Lower Bound Upper Bound
12-13 years 14-15 years -.48780 .22185 .126 -1.0606 .0850
16-17 years .04624 .22277 .997 -.5289 .6214
18-19 years -.00646 .20664 1.000 -.5400 .5271 14-15 years 12-13 years .48780 .22185 .126 -.0850 1.0606
16-17 years .53404* .18227 .019 .0634 1.0046 18-19 years .48135* .16216 .017 .0626 .9000
16-17 years 12-13 years -.04624 .22277 .997 -.6214 .5289 14-15 years -.53404* .18227 .019 -1.0046 -.0634 18-19 years -.05270 .16342 .988 -.4746 .3693
18-19 years 12-13 years .00646 .20664 1.000 -.5271 .5400 14-15 years -.48135* .16216 .017 -.9000 -.0626 16-17 years .05270 .16342 .988 -.3693 .4746
*. The mean difference is significant at the 0.05 level.
H5 o: Attitude towards subculture apparel is not significantly different based on gender
H5 a: Attitude towards subculture apparel is significantly different based on gender
Table 5.9 presents the independent samples of males and females and the
comparison of their attitudes. Researcher assumes equal variances for the two-tailed
test, therefore the upper row of the table is considered. Significance value of 0.761
shown in the table is above 0.05, indicating that there is no difference in the attitudes
of teenage boys and teenage girls. Therefore, null hypothesis fails to be rejected.

55
Table 5.9 Difference in the Attitude towards Subculture Apparel by gender
Independent Samples Test
Levene's Test t-test for Equality of Means ATTITUDE
F Sig. t df Sig.
(2-tailed) Mean
Difference Std. Error Difference
95% Confidence Interval of the
Difference
Lower Upper
Equal variances assumed
1.673 .197 .304 337 .761 .03904 .12829 -.21331 .29139
Equal variances not assumed
.302 315.834 .763 .03904 .12918 -.21512 .29321
This result also proves the social portrait of Russians, which was discussed
in chapter 2, where masculinity index was quite low. The table above shows there is
no difference between genders when it comes to their attitudes towards subculture
apparel.
H6 o: There is no relationship between teenagers' attitude towards subculture apparel
and the purchase intention
H6 a: There is a relationship between teenagers' attitude towards subculture apparel
and the purchase intention
Table 5.10 Relationship between Attitude and Purchasing Intention
Correlations
ATTITUDE PURCH_INT
ATTITUDE Pearson Correlation 1 .739**
Sig. (2-tailed) .000
N 339 339 PURCH_INT Pearson Correlation .739** 1
Sig. (2-tailed) .000 N 339 339
**. Correlation is significant at the 0.01 level (2-tailed).
The table above clearly presents a significant high positive relationship
between attitude and the purchasing intention, with sig. value of 0.000 less than 0.01.
The more positive the attitude of teenagers towards the subculture apparel, the higher
would be their intention to buy it.

56
Table 5.11 Summary of Hypothesis Testing Results
Null
Hypothesis Null Hypothesis description Result
H1 There is no relationship between subjective norm and
the teenagers’ attitude towards subculture apparel Reject
H2 There is no relationship between product attributes and
the teenagers’ attitude towards subculture apparel Reject
H3 There is no relationship between fashion lifestyles and
the teenagers’ attitude towards subculture apparel Fail to reject
H4 Attitude towards subculture apparel is not significantly
different based on age Reject
H5 Attitude towards subculture apparel is not significantly
different based on gender Fail to reject
H6 There is no relationship between teenagers' attitude
towards subculture apparel and the purchase intention Reject

57
CHAPTER 6
SUMMARY OF FINDINGS, CONCLUSION, AND
RECOMMENDATIONS
In this chapter, the researcher summarizes and concludes the results which are
presented in Chapter 5. It consists of five sections. The first section contains the
summary of findings and discussion, which comprises the demographic factors,
descriptive analysis and hypotheses testing. The third section gives a conclusion of
the study. The fourth section provides recommendations based on the findings with
the last section offering suggestions for future study.
6.1 Summary of Findings
All findings provided below are based on the primary research done in the
months of October-November of 2009, in the capital of the Russian Federation. The
respondents comprise young people between ages 12 and 19, residing in Moscow.
After the screening, 339 usable and reliable questionnaires were analysed.
Summary of Demographic Factors
Out of the total sample, 45 percent were teenage boys and 55 percent were
teenage girls. No quota was set as per the gender distribution, and as the topic is
concerned with clothing, there was a higher cooperation from females during the
survey. Approximately half of the questionnaires were collected in schools, from the
pupils in grades 6-11 and another half of the data was extracted from the online
questionnaire. Age screening was done by the person distributing the questionnaires
in schools and online version of the questionnaire had a filtering question. Younger
consumers of ages 12-13 and 14-15 represent 12 percent and 24 percent, respectively;
and the older consumer groups of 16-17 years old and 18-19 year-olds make up to 24
percent and 40 percent, respectively. The census data presented in chapter 4, indicates
that the 15-19 year old group makes up the majority (60%) of teenager population of
Moscow, therefore the survey’s sample distribution is similar to that of the
population.

58
The residence of the respondents was used solely for informational purpose,
and was not tested in the study. The frequencies show that most of the teenagers
surveyed reside in the south-west and south-east of Moscow. According to the map
presented in chapter 4, the south-western district was the focus of this study due to the
highest concentration of schools and the retail trade.
Figure 6.1 Distribution of Respondents by District of Residence
Summary of the Descriptive Analysis and Discussion
Respondents have agreed that they like subculture apparel (mean score of
3.3) and that it supports their personality (mean score of 3.2). Some of the comments
that the researcher has obtained during the questionnaire collection showed that even
though teenagers follow a particular subculture, they do not necessarily display it in
their clothing style, as they are shy. Some feel very close to the idea of the Goth
culture, for example, but think that their physical appearance is not enhanced by
wearing gothic apparel. This might explain why the mean score of the last attitude
question about confidence is quite low. Subculture apparel would make a person stand
out in the public, which according to the cultural dimensions of Hofstede, presented in
figure 2.3, is not a value that is espoused by the Russian population. Due to the low
individualism score, many Russians prefer to be like others. This phenomenon has
been covered by Lukov (2002) and was also reflected in some of the comments of the
respondents – “we all want to be different from the masses and similar to our group of
reference, at the same time”.

59
Most of the teenagers surveyed agreed that subculture apparel is attractive,
but they would not call it fashionable or prestigious. As Woodman and Govan (2007)
presented in their study, subculture of consumption is different from the brand
community based on the fact that the subcultures do not embrace the mainstream
norms and are not limited to only commercial interests. This is confirmed by the low
mean scores of price (mean score of 2.8) and brand importance (mean score of 2.6) in
the present study.
According to Hofstede (1996), Russians are a collectivist culture, therefore
they listen to the opinions of others and follow the advice of the reference groups.
This study has covered 3 reference groups, which are parents, who have the lowest
say in the attitude formation of a teenager towards subculture apparel (mean score of
2.7), friends (mean score of 3.3) and online communities (mean score 3.2). The latter
reference group includes the people participating in any social networking online.
Similar results were observed in the studies of Grønhøj (2007) and Sanders (1996),
who have proved that friends have the highest influence on teenagers.
The popular fashion lifestyles that the surveyed teenagers adjourn to are the
sensational and practical styles. The table below summarises the means of each
lifestyle, which were obtained by grouping the means of the three elements or
questions under each segment:
Table 6.1 Fashion Lifestyles Descriptive Statistics
Fashion Lifestyle Group Mean
Scores
Std.
Deviation
Sensational 3.7 0.85
Prestige 2.9 1.07
Practical 3.3 0.96
Informational 2.8 0.99
The teenagers under study do not show a strong information orientation with
respect to apparel shopping. They do not spend a lot of time researching about
fashions and are not likely to go shopping, if they do not intend to make a purchase.
This is a good indicator for this study, as the teenager’s purchasing intention stands a

60
higher chance of becoming an actual purchase, rather than “window-shopping”,
visiting a store without an actual intention of buying.
The Moscow teenagers surveyed also do not show a strong conspicuous
consumption tendency – wearing branded clothing does not guarantee
acknowledgement by others for them. As Shipkov (2007) argued, the fashionable trait
is poorly developed among Russian consumers. Once again, it can be explained by the
historical situation in Russia. The closed Russian market had only limited selection of
products on offer for almost 70 years. The question about expensive goods being
“good” created mixed feelings among the respondents. This may mean that for a
teenager an inexpensive item can also be good, as obtained from some comments,
young consumers do not necessarily attach “high quality” tag to a high-priced item.
These results go against the findings of Hogg, Bruce and Hill (1998) who have
studied the conspicuous consumption of teenagers in the UK.
The sensations seekers, on the other hand, are dominating in the sample
collected (high mean score of 3.7 among all the 339 respondents). Sensation seekers
are especially interested in coordination of colours and believe they have good taste in
choosing apparel. They put a high priority on aesthetic aspects of clothing (e.g.
design, colour, coordination, matching with the body type and age) when making
purchase decisions. Some respondents have provided comments of the following
nature: “in my opinion, subculture apparel is something chaotic”. From such a
statement the researcher can conclude that for teenagers for whom matching design is
important, some apparel, like ska, emo or hippie, might not be of interest due its either
overly loud colours or baggy shapes that don’t match the body. As has been already
presented in chapter 5, the fashion lifestyles proved to have no relationship to the
attitude of teenagers towards subculture apparel.
Many of the respondents have proved to be utilitarian consumers, who are
highly concerned about comfort and functionality of the clothing. The teenagers
surveyed also indicated that they choose clothing because it is a necessity, and they
are not likely to make purchases on a whim. They weigh value and functionality
carefully. This phenomenon has been noted in many studies before (Shipkov, 2007,
Grønhøj, 2007). They state that teenagers nowadays are more careful about their
choices and have an understanding of value and “best-buy”. Moreover, Russian teens
are quite organised in their buying habits.

61
The purchasing intention has shown some weak scores. When all the three
elements are grouped, the mean score is 2.8. Among the different options of obtaining
subculture apparel the most likely one is to buy by him/herself given that the
necessary cash was at hand. Low scores for ‘intending to buy subculture apparel the
next time the respondent goes shopping’, might be explained by the current economic
crisis and tight spending situation in the country as a whole. Below is the data from
the World Bank report showing negative GDP growth this year and increased
unemployment rates. The economic crisis hit Russia in November, 2008. Since last
year, the business environment and consumption has been unstable.
Table 6.2 Main Economic Indicators, Russian Federation
Source: Bogetic, Z. (2009), Russian Economic Report, no. 20, World Bank, Russia
Consumption is represented by the middle part of the bar in the graph below
and it indicates a negative value throughout the year 2009. The forecasted positive
GDP is expected only by year 2012. This affects the household spending and the
purchasing intentions of young consumers in Moscow, in particular.
Figure 6.2 Russia’s real GDP growth, by quarter, 2008-09 (% change y-o-y)
Source: Bogetic, Z. (2009), Russian Economic Report, no. 20, World Bank, Russia

62
6.2 Summary of Hypotheses Testing and Discussion
Hypothesis one: There is a positive relationship between subjective norm and
the teenagers’ attitude towards subculture apparel
The analysis has shown Pearson correlation coefficient of 0.549, with a
significance value of 0.000 < 0.01 level. Friends act as the strongest reference group
for purchasing subculture clothes. Greengard (2008) and Maksimov (2008) bring
forward the issues related to the image of subcultures in Russia, such as criminal
records and negative influence on the unformed personality of a teen. Based on this, it
is clear why parents would not encourage their children to buy subculture clothes. The
online communities, on the other hand, is a good means for finding people with
similar interests, to share ideas and even organise events dedicated to subcultures, for
example anime parties, for the followers of Japanese comics, hip hop parties, for those
teenagers who enjoy rap, rnb and hip-hop music. Nowadays with the easy means of
communication and media sharing, subcultures can spread over vast groups of people
and capture attention easier.
Another explanation for this relationship is the peer group pressure, which is
very strong among the youth, the desire to be accepted in the society forces some to
unwillingly adopt a subculture and differentiate, creating a sort of paradox!
Hypothesis two: There is a positive relationship between product attributes
and the teenagers’ attitude towards subculture apparel
The analysis has shown Pearson correlation coefficient of 0.488, with a
significance value of 0.000 < 0.01 level. The attitude of a Moscow teens will be
different based on the product attributes. Those who consider subculture apparel
attractive would have a better attitude towards it and, in turn, a higher purchasing
intention. As price proved to be unimportant when buying subculture apparel, it can
serve as a differentiation point when marketing clothes in this segment. Brands as
well, do not play a significant role when choosing subculture apparel, which confirms
Woodman and Govan’s (2007) study.

63
Hypothesis three: There is no relationship between fashion lifestyles and the
teenagers’ attitude towards subculture apparel
The analysis has shown Pearson correlation coefficient of 0.025, with a
significance value of 0.651 > 0.01 level. The researcher expected these variables to be
related, but Russian teenagers in Moscow have indicated that their attitude towards
subculture apparel does not relate to how they do their shopping for clothes in
general. This is quite an unexpected result, as the previous studies have confirmed the
relationship between the lifestyles and the attitude towards apparel (Ko et al., 2007,
Kim and Lee, 2000, Shim and Bickle, 1994), but as all of those studies have been
carried out for casual clothing, it might not apply to the niche segment of subculture
apparel. A further analysis was made to see the relationships between each of the
fashion lifestyles and the attitude, the table below summarises the results.
Table 6.2 Relationship Analysis between Attitude and each of the Fashion Lifestyles
Relationship between
Attitude and …
Pearson
Correlation
* Sig.
at 0.05 level (2-tailed)
Sensational Fashion Lifestyle 0.111* 0.042
Prestige Fashion Lifestyle -0.136* 0.012
Practical Fashion Lifestyle 0.008 0.887
Informational Fashion Lifestyle 0.098 0.071
As can be observed from the results above, only two of the fashion lifestyles
are significantly related to attitude – sensational fashion lifestyle has a strong positive
correlation with a significance value 0.042 < 0.05; and prestige fashion lifestyle has a
strong negative correlation with a significance value of 0.012 < 0.05. The practical
fashion lifestyle and informational fashion lifestyle do not have significant
correlations with the attitude of teenagers towards subculture apparel. The
conspicuous consumption, according to these results does not go together with the
subculture consumption, which is indicated by a strong negative correlation
coefficient. Those who like to coordinate colors and pay attention to design will have
a more positive attitude towards subculture apparel, especially Gothic style, which
brings out a starker image as a whole with its dark elements and display of beauty.

64
Since the objective of the study was to treat the fashion lifestyle as a whole, the above
data is presented for the informational purpose only and the conclusion remains the
same: fashion lifestyles as a whole have no significant relationship with the attitude of
teenagers towards subculture apparel.
Hypothesis four: Attitude towards subculture apparel is significantly different
based on age
The analysis has showed F value of 3.868, with a significance value of 0.010
< 0.05 level. Teenagers, often grouped as a separate segment of consumers, might
have slight differences in attitude, depending on their age. The group of 12-13 year
olds proved to be not different from the teenagers of 14-15 years old. But the attitudes
of 14-15 year old teenagers are significantly different from those who are 16-17 years
old, with significance value of 0.019 < 0.05, and from the attitude of 18-19 year old
teenagers, with significance value of 0.017 < 0.05. Therefore, the researcher may
view the teenager segment in two groups – younger teens and older teens, as the
personality, preferences and disposable income of young people change rapidly from
when they are 12, for example, to when they become 18 years old (Zornow, 2003).
Hypothesis five: Attitude towards subculture apparel is not significantly
different based on gender
The analysis has showed the t-value of 0.304 and degree of freedom of 337,
with a significance value of 0.761 > 0.05 level. Males’ attitude was proved to be
similar to females’ attitude towards subculture apparel. The “unisex” trend in fashion
has started a long time ago, with the introduction of jeans and t-shirts, which both
men and women could wear. Subculture clothing appears to be in this category.
Hypothesis six: There is a strong positive relationship between teenagers'
attitude towards subculture apparel and the purchase intention
The analysis has shown Pearson correlation coefficient of 0.739, with a
significance value of 0.000 < 0.01 level. As a predictor for intention to purchase
subculture apparel, this result is significant. Similar result was achieved in several
studies, related to clothing and fashion items (Beaudoin et al., 1998, Casella, 2005,

65
Summers and Belleau, 2006).[U1]The more positive the attitude of Moscow teens
towards subculture apparel, the higher is their intention to buy such clothes, other
factors being constant. As has been discussed in the previous section, economic
situation in the country can be one of the factors influencing the purchasing intention
of the young population. Due to increased unemployment level, the parents of the
teenagers might not afford to buy fashion items. In times of economic downturn,
necessities, like food, become the most important items of consumption, compared to
fashion items, real estate and others (Bogetic, 2009).
6.3 Conclusion
Subcultures are spreading their influence in Russia, more and more groups
follow Japanese-origin anime subculture, English-origin emo subculture, American-
origin hip-hop subculture and many others (Gromov, 2009). Preferences and fashion
styles nowadays cut across cultures. Such a phenomenon also contributes to
Globalisation and the emergence of a “global consumer” (Hassan et al., 2003).
The present study covers factors related to the intention of teenagers in
Moscow towards purchasing subculture apparel. It was found that their attitude has a
strong correlation with their purchasing intention. The factors that are related to the
attitude towards subculture apparel are the subjective norm, or the people around
teens who influence their consumption behaviours, and product attributes, such as
attractiveness of subculture apparel, price and branding. A significant difference has
been found in the attitudes of 12-15 year old teenagers and 16-19 year old teenagers,
but gender-based differences were not supported. Thus, a marketer can present this
type of apparel as “unisex” in Moscow. Fashion lifestyles of teenagers in Moscow
were found insignificant in relationship to their attitudes towards subculture apparel,
therefore, irrespective of whether teens like to research about fashion trends, whether
they pay close attention to brand names or whether they prefer comfortable clothing,
they all may still be into wearing subculture apparel.
It is important to bear in mind that due to the limitation of this research,
conclusions are extended only to the teenage consumer group residing in Moscow and
their intention to purchase subculture apparel. Other apparel categories and other
consumer groups might have an absolutely different criteria and attitudes.

66
6.4 Recommendations
Recommendations for marketers
Based on the results of the study, marketers can segment their target market of
teenagers into two groups – the younger teen of 12-15 years old and older teens of 16-
19 years old. The approach to girls and boys will be similar, therefore, same
advertisements can be placed in both magazines for girls and guys’ magazines. The
best way to approach this segment is to approach the most influential reference groups
of the teenagers – this can be done through participation and advertising at music
festivals and concerts dedicated to subcultures. In order to sell anime-styled clothing,
marketers in Moscow should participate in events such as “Animatrix”, as discussed
in chapter 1. For Goth-styled apparel marketing, one has to participate in Goth music
concerts. Freestyler apparel can be marketed during sports events and competitions.
And an important means of communicating with the teenagers these days would be
through the social networking sites, where a themed advertisement can be placed,
capturing exactly the target audience required.
Recommendations for teachers
It was suggested in chapter 1 that the Moscow government and the Ministry of
Education have tried to enforce uniforms in schools. Based on the results of this
study, it is observed that a teenager wants to stand out and aesthetic aspects of apparel
are very important to a teenager. Uniform, on the other hand, erases these individual
differences and do not let the person express his or her personality fully, while
aesthetically they are dull and have few colours. Teenagers seek to stand out in a
“cool” way, not in a uniform way. But, as the cases of subculture groups have proven
to be unsafe for some teenagers, teachers must be aware of the potential dangers when
a teen displays his or her belonging to one of the subcultures by means of clothing. It
is advised for teachers to be well-informed about the different subcultures that exist in
Moscow.

67
6.5 Further study
The present study has revealed many interesting facts, but the researcher offers
suggestions for future studies in this area.
First, it may be of interest to future researchers how each of the subculture
groups is different from the other in their preferences and apparel purchases. As was
obtained from several comments during the survey, one subculture is very different
from the other and to understand the subcultures better, additional research has to be
done for each of them.
Second, many researchers have proved the inefficiency of the Fishbein’s
model for prediction of actual purchase (Warshaw, 1980), therefore some
modifications to the framework could be made and a purchasing behaviour model
more suitable for contemporary purchases could be obtained.
Third, future researchers should obtain more information about the current
subculture market and the goods on offer in Moscow. It is interesting to look into the
success of marketing such apparel to the young Russian consumers and their
satisfaction with the subculture clothes sold in general.
Fourth, it was discussed in chapter 1 that subcultures differentiate themselves
from other mainstream consumption not only by clothing, but music, literature and
accessories preferences. It would be useful to cover these aspects in future studies.
Finally, researchers could conduct longitudinal studies that depict present
subculture apparel consumption and the consumption after the recovery from the
crisis, which is predicted in 2012 for Russia (Bogetic, 2009).

68
Bibliography:
Adler, A. (1923), The practice and theory of individual psychology, 2nd ed., London
Ajzen, I. & Fishbein, M. (1980), Understanding attitudes and predicting social
behaviour, NJ: Prentice Hall
Ajzen, I. & Madden, T. J. (1986), Prediction of goal-directed behavior: Attitude,
intentions, and perceived behavioral control, Journal of experimental social
psychology, vol.22, pp.453-473
Baker, J., Parasuraman, A., Grewal, D., & Voss, G. (2002), The influence of multiple
store environment cues on perceived merchandise value and patronage intentions,
Journal of Marketing, vol. 66, no. 2, 120-141.
Barnhart, D. & Metcalf, A. (1997), America in So Many Words, Houghton Mifflin
Bartlett, J.E., Kotrlik, J.W. & Higgins, C. (2001), Organizational Research:
Determining Appropriate Sample Size in Survey Research, Information
Technology, Learning, and Performance Journal, vol. 19, no. 1
Bearden, W.O. & Etzel, M.J. (1982), Reference group influence on product and brand
purchase decisions, Journal of Consumer Research, vol. 9, pp. 183-94.
Beaudoin, P., Moore, M.A. & Goldsmith, R.E. (1998), Young fashion leaders’ and
followers’ attitudes toward American and imported apparel, Journal of Product &
Brand Management, vol. 7, no. 3, pp. 193-207
Belikov, S.V. (2002), The Skinheads, Journal of Literary Russia, no. 4, Moscow
Bogetic, Z. (2009), Russian Economic Report, no. 20, World Bank, Russia
Casella (2005), Consumer attitudes and purchase intention of imported and domestic
brand of casual wear apparel in Bangkok, Assumption University, Bangkok
Darroch, R.K. (1971), The prediction of intention and behaviour: a comparison of
theoretical models of the attitude-behaviour relationship using a photographic
release singing situation dissertation, University of Illinois, unpublished

69
Eckman, M., Damhorst, M.L. & Kadolph, S.J. (1990), Toward a model of the in-store
purchase decision process: Consumer use of criteria for evaluating women's
apparel, Clothing and Textiles Research Journal, vol. 8, No. 2, pp. 13-22
Engel, J.W., Blackwell, R.D. & Miniard, P.W. (1990), Consumer Behaviour, 6th ed.,
Harcourt Brace, p. 482
Fisher, R. (1956), Statistical methods and scientific inference, University of Adelaide
Futurist (2001), The rise of the millennials, vol. 35, no. 2, p. 7.
Generation Next – Global Research Poll (2006), BBC News Service & Synovate,
Global
Greengard, M. (2008), Russian Region Discovers “Emo” Subculture, The Other
Russia
Gromov, D.V. (2009), Youth Subcultures of Moscow, Ethnology and Anthropology
Institute publishing, Moscow
Grønhøj, A. (2007), The consumer competence of young adults: a study of newly
formed households, Qualitative Market Research: An International Journal, vol.
10 no. 3, pp. 243-264
Habbo Survey (2008), Sulake Research Agency, Finland
Hassan, S.S., Craft, S. and Kortam, W. (2003), Understanding the new bases for
global market segmentation, Journal of Consumer Marketing, vol. 20, no. 5, pp.
446-62.
Hodkinson, P. (2002), Goth: Identity, Style And Subculture, Gordonsville, Berg
Publishers
Hofstede, G. (1996), Cultures and Organizations: Software of the Mind: Intercultural
Cooperation and Its Importance for Survival, New York, McGraw-Hill
Hogg M., Bruce M. & Hill, A. (1998), Fashion brand preferences among young
consumers, International Journal of Retail & Distribution Management, vol. 26,
no. 8, pp. 293–300

70
Hussey, R. (1997), Business research: A practical guide for undergraduate and
postgraduate students, p.227, Macmillan.
Irwin, J.K. (1962), Surfers: a study of the growth of a deviant subculture, MA thesis,
University of California, CA.
Kaplan, J. & Loow, H. (2002), The Cultic Milieu: Oppositional Subcultures in an Age
of Globalization, AltaMira Press,Walnut Creek, CA.
Kim, Y.K. & Lee, J. (2000), Benefit segmentation of catalog shoppers among
professionals, Clothing and Textiles Research Journal, vol. 18 no. 2, pp. 111-20.
Kirill & Mefodiy Dictionary (2000), New Media Generation, Moscow
Klein, L.R. & Lansing, J.B. (1955), Decisions to purchase consumer durable goods.
Journal of Marketing, vol. 20 (2), no.109, p.132.
Ko, E. & Mok, B. (2001), A study of advertising effects by internet advertising types
and fashion lifestyle, Journal of the Korean Society of Clothing and Textiles, vol.
25 no. 7, pp. 1258-69.
Ko, E., Kim, E., Taylor, C., Kim, K.H. & Kang, I.J. (2007), Cross-national market
segmentation in the fashion industry, International Marketing Review, vol. 24 no.
5, pp. 629-651
Kotler, P. (1999), Marketing Management, 10th ed., Prentice Hall
Kozlov, V. (2008), State Duma vs. emos and goths, Moscow News, no. 30
Lee, M. & Burns, L.D. (1993), Self-consciousness and clothing purchase criteria of
Korean and U.S. college woman, Clothing and Textiles Research Journal, vol.11,
no. 4, pp. 32-40
Levikova, S.I. (2004), Youth subculture, Fair press, Moscow
Lukov, V. (2002), Peculiarities of youth subcultures, Sociology Research, no.10. pp.
79–87
Maksimov, V. (2008), March of the Skinheads, Novye Izvestiya, Moscow
McKee, A. (2003), Textual Analysis: A Beginner’s Guide, Sage, NY

71
Merriam-Webster Unabridged Dictionary (2009), UK
Mitchell, A. (1980), VALS model, SRI International consulting group, US
O’Keefe, D.J. (2002), Persuasion Theory & Research, 2nd ed., Sage Publications, CA
Park, H., Rabolt, N. & Jeon, K., (2006), Purchasing global luxury brands among
young Korean consumers, Journal of Fashion Marketing and Management, vol.
12, no. 2, 2008, pp. 244-259
Parker, R.S., Hermans, C.M. & Schaefer, A.D. (2004), Fashion consciousness of
Chinese, Japanese and American teenagers, Journal of Fashion Marketing and
Management; Southwest Missouri State University, Springfield, Missouri, USA
Phau, I. & Leng, Y.S. (2008), Attitudes toward domestic and foreign luxury brand
apparel, Journal of Fashion Marketing and Management, vol. 12, no. 1, pp. 68-89
Postman, L. (1998), Stores zero in on "Y", the next generation, Charlotte Observer,
NC
Razdobreeva, P. (2008), Youth report, Gfk Group, Russia
Sanders, J. (1996), Roper Youth Report, Gfk Group, USA
Schiffman, L. & Kanuk, L. (1999), Consumer Behavior, 7th ed., Prentice-Hall
Schouten J. & McAlexande J. (1995) Subcultures of Consumption: An Ethnography
of the New Bikers, The Journal of Consumer Research, vol. 22, no. 1, pp. 43-61
Sekaran, U. (1992), Research methods for business: A skill-building approach, 2nd
ed., New York: John Wiley & Sons, Inc.
Shim, S. & Bickle, M.L. (1994), Benefit segments of the female apparel market:
psychographics, shopping orientations, demographics, Clothing and Textiles
Research Journal, vol. 12, no. 2, pp. 1-12.
Shipkov V. (2007), Social Structure of Russian Consumers, Marketing Index, TNS
Gallup Media, Russia
Smetanina, S. (2008), Fashion: more show, more business, Russia behind Headlines

72
Solomon, M. (2004), Consumer Behaviour: Buying, Behaving and Being, Pearson
Prentice-Hall
Summers, T.A. & Belleau, B.D. (2006), Predicting purchase intention of a
controversial luxury apparel product, Journal of Fashion Marketing and
Management, vol. 10, no. 4, pp. 405-419
Surtaev, V. (1999), Youth subculture, Saint-Petersburg
Teenmark Report (2000), Mediamark Research Inc., NY
Thomas, J., Woodward, G. & Herr, D. (1999), An investigation of the effect of jean
purchase criteria and store selection on US teenagers' purchasing behaviours,
Journal of Fashion Marketing and Management, vol. 4, no.3, pp. 253-262
Vanichbancha, K. (2003), Advanced Statistic Analysis, SPSS for Windows, Bangkok
Volkov, G. N. (1979), The Basics of Marxist-Leninist Theory, Moscow
Ward, S. (1974), Consumer socialization, Journal of Consumer Research, vol. 1, pp.1-14
Warshaw, P. R. (1980), A New Model for Predicting Behavioral Intentions: An
Alternative to Fishbein, Journal of Marketing Research, vol. 17, no. 2, pp. 153-172
Weiss, M. (2003), To be about to be, American Demographics, pp. 29-36
Woodman, B. & Govan, B. (2007), We do not live to buy, International Journal of
Sociology and Social Policy, vol. 27, no. 5/6, 2007, pp. 193-207
Wu, S. (2003), The relationship between consumer characteristics and attitude toward
online shopping, Marketing Intelligence & Planning, vol.21, no.1, p. 37-44
Young Asians Regional Report (2005), Synovate, Hong Kong
Zikmund, W.G. (2003), Business research methods, 7th ed., Boston, MA: McGraw-
Hill Irwin.
Zollo, P. (2000), Getting Wiser to Teens: More insights into Marketing to Teenagers,
Teen Research Unlimited, USA
Zornow, J. (2003), Teenmark Report, Mediamark Research Inc., Gfk Group, USA

73
Web-references
www.alexa.com, web traffic metrics service, accessed on 5/09/2009
www.animatrixcon.ru, Japanese cultural festivals in Russia site, accessed on
27/08/2009
www.comscore.com, website statistics service, accessed on 7/09/2009
www.edukids.ru, Education in Moscow, accessed on 27/10/2009
www.gks.ru, Russian Federal State statistics, accessed on 12/08/2009
www.moscow.ru, Moscow International information portal, accessed on 2/09/2009
www.rian.ru, Russian social network site users are 'world's most active', RIA news,
accessed on 5/09/2009
www.russiatoday.com, Russia Today news, accessed on 12/08/2009
www.shopandmall.ru, Moscow map of the shopping centres, accessed on 12/08/2009
www.theotherrussia.org, independent news site, accessed 20/08/2009

74
Questionnaire
This questionnaire is a part of MBA thesis procedure at Assumption University. The topic of the thesis is “A Study on Moscow Teenagers’ Purchase Intention: A Case Study of the Subculture Clothing Market”. Please, fill out the questionnaire below, your answers will be used for the research purpose only and will be kept strictly confidential. Thank you. This questionnaire is for 12-19 year old respondents only! Subculture apparel in this study is defined as any piece of clothing that indicates a belonging to a subculture (Goth, hip-hop, Emo, Ska, punk, freestyler and others).
Indicate the level of your agreement with each of the statements below; where:
=Strongly Disagree = Disagree = Mixed feelings = Agree = Strongly Agree
Atti
tude
1. I like subculture apparel 2. I would wear subculture apparel as it supports my personality 3. Wearing subculture apparel would make me feel more confident
Prod
uct A
ttrib
utes
4. Subculture apparel is fashionable 5. Subculture apparel is attractive 6. Wearing sub-culture apparel is prestigious 7. Price is important when buying subculture apparel 8. Brand is important when buying subculture apparel
Subj
. Nor
m
9. My parents would encourage me to buy this apparel 10. My friends would encourage me to buy this apparel 11. Online communities would encourage me to buy this apparel
Pres
tige
FL
12. Clothes must be expensive to have class 13. I believe wearing famous brands helps me to be acknowledged by
others 14. I believe that expensive clothes are good
Sens
atio
nal F
L 15. I have good taste in coordinating colours and designs of clothes 16. I have a good eye for selecting clothes 17. I tend to consider overall coordination of clothes
Please, continue to next page…

75
Indicate the level of your agreement with each of the Fashion Lifestyle (FL) statements below; where:
=Strongly Disagree = Disagree = Mixed feelings = Agree = Strongly Agree
Prac
tical
FL
18. When selecting clothes I look for their function rather than their design
19. I usually wear clothes that are comfortable 20. I make purchases only when there is a need
Info
rmat
iona
l FL 21. I go shopping to get ideas even though I have no intention to buy
22. I like to shop in many different stores
23. I am the first to try new fashions
Purc
h. In
tent
24. I would get subculture apparel if I had the money to buy it
25. I would get subculture apparel if my parents bought it for me
26. I would buy subculture apparel next time I go shopping
27. Please, indicate your gender:
O male O female
28. Please, indicate your age group:
O 12 – 13 years old O 14 – 15 years old O 16 – 17 years old O 18 – 19 years old
29. Please, indicate the district of Moscow where you live:
Thank you!
Questionnaire – Russian Version
� 6. East
� 8. South
� 5. North- East 1. North-West �
4. South –West �
3. West �
2. Center �
� 7. South - East
� 9. North

76
Анкета
Привет! Я провожу исследование для своего диплома в международном университете в Таиланде. Тема моего исследования: «Молодое поколение Москвы – отношение к неформальной одежде». Неформальная одежда - любая одежда, указывающая на принадлежность какому-либо отличающемуся течению в современной моде, например готика, хип-хоп, ска, эмо, панк, фристайл и другие. Пожалуйста, ответь на все 29 вопросов в этой анкете. Все ответы будут храниться строго конфиденциально.
Эта анкета только для молодых парней и девушек от 12 до 19 лет!
В следующих вопросах, пожалуйста, поставь галочку в каждой строке, указав, насколько ты согласен / на или нет с каждым утверждением. Мне очень важно Ваше искреннее мнение! Спасибо! =Полностью несогласен/на = Несогласен/на = Смешанное Чувство = Согласен/на = Полностью Согласен/на
1. Мне нравится неформальная одежда (готика, ска, эмо, панк или другая) 2. Я стал/а бы носить такую одежду, так как она соответствует моей
личности 3. Я бы чувствовал/а себя более уверен/но, надевая неформальную
одежду 4. Неформальная одежда модная 5. Неформальная одежда привлекательна 6. Надевать такую одежду - престижно 7. Цена важна при покупке неформальной одежды 8. Бренд важен при покупке неформальной одежды 9. Мои родители одобрили бы мою покупку неформальной одежды 10. Мои друзья одобрили бы покупку неформальной одежды 11. Виртуальные сообщества одобрили бы покупку неформальной одежды 12. Классная одежда стоит дорого 13. Я думаю, что одежда известных марок привлекает ко мне внимание 14. Я считаю, что хорошая одежда – дорогая 15. Я хорошо умею подбирать цвет и дизайн одежды 16. У меня глаз наметан на выбор одежды 17. Мне важно, чтобы моя одежда была хорошо подобрана
Продолжение на обратной стороне…
77
Пожалуйста, продолжай ставить галочку в каждой строке, указав, насколько ты согласен / на или нет с каждым утверждением. =Полностью несогласен/на = Несогласен/на = Смешанное Чувство = Согласен/на = Полностью Согласен/на
18. При выборе одежды, я прежде смотрю на ее назначение, а не дизайн 19. Для меня главное - комфорт 20. Я делаю покупки, только когда в этом есть необходимость 21. Я хожу на шоппинг, даже если не собираюсь ничего покупать – просто
чтобы составить представление 22. Мне нравится делать покупки в разных магазинах 23. Я первой/ым пробую новые модные тенденции в одежде 24. Я бы купил/а неформальную одежду при наличии денег 25. Я бы приобрел/а неформальную одежду, если родители купили бы мне
ее 26. Я бы купил/а неформальную одежду в следующий раз, как пошел/ла бы
за покупками
27. пожалуйста, укажи кто ты:
� парень � девушка
28. а сколько тебе лет?
� 12 – 13 лет � 14 – 15 лет � 16 – 17 лет � 18 – 19 лет
29. укажи, пожалуйста, регион Москвы, в котором ты проживаешь:
Огромное спасибо за помощь!
� 6. Восток
� 8. Юг
� 5. Северо-восток 1. Северо-запад �
4. Юго-запад �
3. Запад �
2. Центр �
� 7. Юго-восток
� 9. Север