Factors Influencing Perceived Fairness in Algorithmic ...
14
Factors Influencing Perceived Fairness in Algorithmic Decision-Making: Algorithm Outcomes, Development Procedures, and Individual Differences Ruotong Wang Carnegie Mellon University [email protected] F. Maxwell Harper * Amazon [email protected] Haiyi Zhu Carnegie Mellon University [email protected] ABSTRACT Algorithmic decision-making systems are increasingly used throughout the public and private sectors to make important decisions or assist humans in making these decisions with real social consequences. While there has been substantial re- search in recent years to build fair decision-making algorithms, there has been less research seeking to understand the factors that affect people’s perceptions of fairness in these systems, which we argue is also important for their broader acceptance. In this research, we conduct an online experiment to better understand perceptions of fairness, focusing on three sets of factors: algorithm outcomes, algorithm development and de- ployment procedures, and individual differences. We find that people rate the algorithm as more fair when the algorithm predicts in their favor, even surpassing the negative effects of describing algorithms that are very biased against particular demographic groups. We find that this effect is moderated by several variables, including participants’ education level, gender, and several aspects of the development procedure. Our findings suggest that systems that evaluate algorithmic fair- ness through users’ feedback must consider the possibility of “outcome favorability” bias. Author Keywords perceived fairness, algorithmic decision-making, algorithm outcome, algorithm development CCS Concepts •Human-centered computing → Empirical studies in HCI; Collaborative and social computing; INTRODUCTION Algorithmic systems are widely used in both the public and private sectors for making decisions with real consequences on people’s lives. For example, ranking algorithms are used to automatically determine the risk of undocumented immigrants * The work was done while the author was at the University of Min- nesota, Twin Cities. Permission to make digital or hard copies of all or part of this work for personal or classroom use is granted without fee provided that copies are not made or distributed for profit or commercial advantage and that copies bear this notice and the full citation on the first page. Copyrights for components of this work owned by others than ACM must be honored. Abstracting with credit is permitted. To copy otherwise, or republish, to post on servers or to redistribute to lists, requires prior specific permission and/or a fee. Request permissions from [email protected]. CHI ’20, April 25–30, 2020, Honolulu, HI, USA. Copyright is held by the owner/author(s). Publication rights licensed to ACM. ACM ISBN 978-1-4503-6708-0/20/04 ...$15.00. http://dx.doi.org/10.1145/313831.3376813 to public safety [43]. Filtering algorithms are used in job hiring and college admission processes [5, 48]. Scoring algorithms are used in loan approval [64]. While algorithms have the potential to make decision-making more efficient and reliable [17, 27, 41, 45, 59], concerns about their fairness may prevent them from being broadly ac- cepted [2]. In one case, Amazon abandoned an algorithmic recruitment system for reviewing and ranking applicants’ re- sumes because the system was biased against women [18]. In another case, an algorithm for predicting juvenile delinquency in St. Paul, Minnesota was derailed due to public outcry from the community over concerns about bias against children of color [66]. There has been an increasing focus in the research community on understanding and improving the fairness of algorithmic decision-making systems. For example, fairness-aware (or discrimination-aware) machine learning research attempts to translate fairness notions into formal algorithmic constraints and develop algorithms subject to such constraints (e.g., [9, 15, 16, 36, 46, 54]) However, there is a disconnect between the theoretical discrimination-aware machine learning approaches and the behavioral studies investigating how people perceive fairness of algorithms that affect their lives in real-world con- texts (e.g., [52, 82]). People’s perception of fairness can be complicated and nuanced. For example, one interview study found that different stakeholders could have different notions of fairness regarding the same algorithmic decision-making system [52]. Other studies suggested disagreements in peo- ple’s fairness judgements [35, 78]. Our research attempts to connect the two lines of literature by asking how the the theo- retical fairness notion translates into perceptions of fairness in practical scenarios, and how other factors also influence people’s perception of fairness. In this research, we systematically study what factors influence people’s perception of the fairness of algorithmic decision- making processes. The first set of factors we investigate is algorithm outcomes. Specifically, we explore both the individual-level and group-level outcomes: whether the al- gorithm is favorable or unfavorable to specific individuals, and whether the algorithm is biased or unbiased against specific groups. Specifically, the biased outcome is operationalized by showing high error rates in protected groups, while the unbiased outcome is showing very similar error rates across different groups. Note that this operationalization is directly arXiv:2001.09604v1 [cs.HC] 27 Jan 2020
Transcript of Factors Influencing Perceived Fairness in Algorithmic ...
Factors Influencing Perceived Fairness in AlgorithmicDecision-Making: Algorithm Outcomes, Development
Procedures, and Individual DifferencesRuotong Wang
Carnegie Mellon [email protected]
F. Maxwell Harper∗Amazon
Haiyi ZhuCarnegie Mellon University
ABSTRACTAlgorithmic decision-making systems are increasingly usedthroughout the public and private sectors to make importantdecisions or assist humans in making these decisions withreal social consequences. While there has been substantial re-search in recent years to build fair decision-making algorithms,there has been less research seeking to understand the factorsthat affect people’s perceptions of fairness in these systems,which we argue is also important for their broader acceptance.In this research, we conduct an online experiment to betterunderstand perceptions of fairness, focusing on three sets offactors: algorithm outcomes, algorithm development and de-ployment procedures, and individual differences. We find thatpeople rate the algorithm as more fair when the algorithmpredicts in their favor, even surpassing the negative effects ofdescribing algorithms that are very biased against particulardemographic groups. We find that this effect is moderatedby several variables, including participants’ education level,gender, and several aspects of the development procedure. Ourfindings suggest that systems that evaluate algorithmic fair-ness through users’ feedback must consider the possibility of“outcome favorability” bias.
Author Keywordsperceived fairness, algorithmic decision-making, algorithmoutcome, algorithm development
CCS Concepts•Human-centered computing→Empirical studies in HCI;Collaborative and social computing;
INTRODUCTIONAlgorithmic systems are widely used in both the public andprivate sectors for making decisions with real consequenceson people’s lives. For example, ranking algorithms are used toautomatically determine the risk of undocumented immigrants*The work was done while the author was at the University of Min-nesota, Twin Cities.
Permission to make digital or hard copies of all or part of this work for personal orclassroom use is granted without fee provided that copies are not made or distributedfor profit or commercial advantage and that copies bear this notice and the full citationon the first page. Copyrights for components of this work owned by others than ACMmust be honored. Abstracting with credit is permitted. To copy otherwise, or republish,to post on servers or to redistribute to lists, requires prior specific permission and/or afee. Request permissions from [email protected] ’20, April 25–30, 2020, Honolulu, HI, USA.Copyright is held by the owner/author(s). Publication rights licensed to ACM.ACM ISBN 978-1-4503-6708-0/20/04 ...$15.00.http://dx.doi.org/10.1145/313831.3376813
to public safety [43]. Filtering algorithms are used in job hiringand college admission processes [5, 48]. Scoring algorithmsare used in loan approval [64].
While algorithms have the potential to make decision-makingmore efficient and reliable [17, 27, 41, 45, 59], concernsabout their fairness may prevent them from being broadly ac-cepted [2]. In one case, Amazon abandoned an algorithmicrecruitment system for reviewing and ranking applicants’ re-sumes because the system was biased against women [18]. Inanother case, an algorithm for predicting juvenile delinquencyin St. Paul, Minnesota was derailed due to public outcry fromthe community over concerns about bias against children ofcolor [66].
There has been an increasing focus in the research communityon understanding and improving the fairness of algorithmicdecision-making systems. For example, fairness-aware (ordiscrimination-aware) machine learning research attempts totranslate fairness notions into formal algorithmic constraintsand develop algorithms subject to such constraints (e.g., [9,15, 16, 36, 46, 54]) However, there is a disconnect between thetheoretical discrimination-aware machine learning approachesand the behavioral studies investigating how people perceivefairness of algorithms that affect their lives in real-world con-texts (e.g., [52, 82]). People’s perception of fairness can becomplicated and nuanced. For example, one interview studyfound that different stakeholders could have different notionsof fairness regarding the same algorithmic decision-makingsystem [52]. Other studies suggested disagreements in peo-ple’s fairness judgements [35, 78]. Our research attempts toconnect the two lines of literature by asking how the the theo-retical fairness notion translates into perceptions of fairnessin practical scenarios, and how other factors also influencepeople’s perception of fairness.
In this research, we systematically study what factors influencepeople’s perception of the fairness of algorithmic decision-making processes. The first set of factors we investigateis algorithm outcomes. Specifically, we explore both theindividual-level and group-level outcomes: whether the al-gorithm is favorable or unfavorable to specific individuals, andwhether the algorithm is biased or unbiased against specificgroups. Specifically, the biased outcome is operationalizedby showing high error rates in protected groups, while theunbiased outcome is showing very similar error rates acrossdifferent groups. Note that this operationalization is directly
arX
iv:2
001.
0960
4v1
[cs
.HC
] 2
7 Ja
n 20
20
aligned with the prevalent theoretical fairness notion in thefairness-aware machine learning literature, which asks for ap-proximate equality of certain statistics of the predictor, suchas false positive rates and false-negative rates, across differentgroups.
In addition to algorithm outcomes (i.e., whether an algo-rithm’s prediction or decision is favorable to specific individ-uals or groups), we also investigate development procedures(i.e., how an algorithm is created and deployed), and individ-ual differences (i.e., the education or demographics of theindividual who is evaluating the algorithm). Specifically, weinvestigate the following research questions:
• How do (un)favorable outcomes to individuals and(un)biased treatments across groups affect the perceivedfairness of algorithmic decision-making?
• How do different approaches to algorithm creation and de-ployment (e.g., different levels of human involvement) af-fect the perceived fairness of algorithmic decision-making?
• How do individual differences (e.g., gender, age, race, edu-cation, and computer literacy) affect the perceived fairnessof algorithmic decision-making?
To answer these questions, we conducted a randomized on-line experiment on Amazon Mechanical Turk (MTurk). Weshowed participants a scenario, stating “Mechanical Turk isexperimenting with a new algorithm for determining whichworkers earn for a Masters Qualification.” 1 We asked MTurkworkers to judge the fairness of an algorithm that the workerscan personally relate to. MTurk workers are stakeholders inthe problem, and their reactions are representative of laypeoplewho are affected by the algorithmâAZs decisions.
In the description we presented to the participants, we includeda summary of error rates across demographic groups and adescription of the algorithm’s development process, manipu-lating these variables to test different plausible scenarios. Weincluded manipulation check questions to ensure that the par-ticipants understood how the algorithm works. We showedeach participant a randomly chosen algorithm output (either“pass” or “fail”), to manipulate whether the outcome would bepersonally favorable or not. Participants then answered sev-eral questions to report their perception of the fairness of thisalgorithmic decision-making process. We concluded the studywith a debriefing statement, to ensure that participants under-stood this was a hypothetical scenario, and the algorithmicdecision was randomly generated.
We found that perceptions of fairness are strongly increasedboth by a favorable outcome to the individual (operationalizedby a “pass” decision for the master qualification), and by theabsence of biases (operationalized by showing very similarerror rates across different demographic groups). The effect ofa favorable outcome at individual level is larger than the effectof the absence of bias at group level, suggesting that solelysatisfying the statistical fairness criterion does not guaranteeperceived fairness. Moreover, the effect of a favorable or1“Masters” workers can access exclusive tasks that are often associ-ated with higher payments [57]).
unfavorable outcome on fairness perceptions is mitigated byadditional years of education, while the negative effect ofincluding biases across groups is exacerbated by describing adevelopment procedure with “outsourcing” or a higher level oftransparency. Overall, our findings point to the complexity ofunderstanding perceptions of fairness of algorithmic systems.
RELATED WORK AND HYPOTHESISThere is a growing body of work that aims to improve fair-ness, accountability, and interpretability of algorithms, es-pecially in the context of machine learning. For example,much fairness-aware machine learning research aims to buildpredictive models that satisfy fairness notions formalized asalgorithmic constraints, including statistical parity [25], equal-ized opportunity [36], and calibration [45]. For many of thesefairness measures there are algorithms that explore trade-offsbetween fairness and accuracy [4, 10, 26, 58]. For interpretinga trained machine learning model, there are three main tech-niques: sensitivity or gradient-based analysis [70, 47], build-ing mimic models [37], and investigating hidden layers [8,82]. However, Veale et al. found that these approaches andtools are often built in isolation of specific users and user con-text [82]. HCI researchers have conducted surveys, interviews,and analyses on public tweets to understand how real-worldusers perceive and adapt to algorithmic systems [20, 21, 29,33, 51, 53]. However, to our knowledge, the perceived fairnessof algorithmic decision-making has not been systematicallystudied.
Human Versus Algorithmic Decision-makingSocial scientists have long studied the sense of fairness inthe context of human decision-making. One key question iswhether we can apply the rich literature on the fairness ofhuman decision-making to the fairness of algorithmic decisionmaking.
On one hand, it is a fundamental truth that an algorithm isnot a person and does not warrant human treatment or attribu-tion [63]. Prior work shows that people treat these two typesof decision-making differently (e.g., [23, 50, 75]). For exam-ple, researchers describe “algorithm aversion,” where peopletend to trust humans more than algorithms even when the al-gorithm makes more accurate predictions. This is becausepeople tend to quickly lose confidence in a algorithm after see-ing that it makes mistakes [23]. Another study pointed out thatpeople attribute fairness differently: while human managers’fairness and trustworthiness were evaluated based on the per-son’s authority, algorithms’ fairness and trustworthiness wereevaluated based on efficiency and objectivity [50]. On theother hand, a series of experimental studies demonstrated thathumans mindlessly apply social rules and expectations to com-puters [63]. One possible explanation is that the human brainhas not evolved quickly enough to assimilate the fast develop-ment of computer technologies [69]. Therefore, it is possiblethat research on human decision-making can provide insightson how people will evaluate algorithmic decision-making.
In this paper, we examine the degree to which several factorsaffect people’s perception of fairness of algorithmic decision-making. We study factors identified by the literature on fair-
ness of human decision-making — algorithm outcomes, de-velopment procedures, and interpersonal differences — as webelieve that they may also apply in the context of algorithmicdecision-making.
Effects of Algorithm OutcomesWhen people receive decisions from an algorithm, they willsee the decisions as more or less favorable to themselves, andmore or less fair to others. Meta-review by Skitka et al. re-vealed that outcome favorability is empirically distinguishablefrom outcome fairness [77].
Our first hypothesis seeks to explore the effects of outcome fa-vorability on perceived fairness. Psychologists and economistshave studied perceived fairness extensively, particularly in thecontext of resource allocation (e.g., [7, 22, 56, 80]). Theyfound that the perception of fairness will increase when indi-vidual receive outcomes that are favorable to them (e.g., [80]).A recent survey study on 209 litigants showed that litigateswho receive favorable outcomes (e.g., a judge approves theirrequest) will perceive their court officials to be more fair andwill have more positive emotions towards court officials [40].Outcome favorability is also associated with fairness-relatedconsequences. Meta-analysis shows that outcome favorabilityexplains 7% of the variance in organizational commitment and24% of the variance in task satisfaction [77].
Hypothesis 1a: People who receive a favorable outcome thinkthe algorithm is more fair than people who receive an unfa-vorable outcome.
Social scientists suggest that people judge outcome fairness by“whether the proportion of their inputs to their outcomes arecomparable to the input/outcome ratios of others involved inthe social exchange” [77], often referred to as “equity theory”or “distributive justice” [3, 39, 83]. Contemporary theoristssuggest that distributive justice is influenced by which distribu-tive norm people use in the relational context (e.g., [19, 55]),the goal orientation of the allocator (e.g., [19]), the resourcesbeing allocated (e.g., [76]), and sometimes political orientation(e.g., [56]). Empirical studies show that a college admissionprocess is perceived as more fair if it does not consider genderand if it is not biased against any gender groups [62]. Anotherstudy show that an organization will be perceived as less fairwhen managers treat different employees differently [49].
In the context of algorithmic decision-making, one commonway of operationalizing equity and outcome fairness is “overallaccuracy equality”, which considers the disparity of accuracybetween different subgroups (e.g., different gender or racialgroups) [9]. The lower the accuracy disparity between differ-ent groups, the less biased the algorithm is. We hypothesizethat people will judge an algorithm to be more fair when theyknow it is not biased against any particular subgroups.
Hypothesis 1b: People perceive algorithms that are not bi-ased against particular subgroups as more fair.
Prior literature provides mixed predictions regarding the rela-tive effects of outcome favorability (i.e., whether individualsreceive favorable outcome or not) and outcome fairness (i.e.,whether different groups receive fair and unbiased treatments)
on the perceived fairness of the algorithm. A majority of theresearchers believe that individuals prioritize self-interest overfairness for everyone. Economists believe that people are ingeneral motivated by self-interest and are relatively less sensi-tive towards group fairness [72, 73]. Specifically, individualsare not willing to sacrifice their own benefits to pursue a groupcommon good in resource redistribution tasks [28]. A similarpattern has been found in the workplace. A survey of hotelworkers showed that people displayed the highest level ofengagement and the lowest rate of burnout when they wereover-benefited in their work, receiving more than they thinkthey deserved. In addition, people tend to justify an unequaldistribution when they are favored in that distribution [60].
On the other hand, research also shows that people prioritizefairness over personal benefits in certain situations. For exam-ple, bargainers might be reluctant to benefit themselves whenit harms the outcomes of others, contingent on their socialvalue orientations, the valence of outcomes, and the settingwhere they negotiate [81]. In an analysis of presidential votechoices, researchers found that voters are more likely to votefor the president who will treat different demographic sub-groups equally, independent of voters’ own group membership[61]. Whether the decision takes place in public or in privatehas a strong impact. In a study conducted by Badson et al., par-ticipants had to choose between allocation of resources to thegroup as a whole or to themselves alone. When the decisionwas public, the proportion allocated to the group was 75%.However, once the decisions became private, the allocation tothe group dropped to 30% [7].
Algorithmic decisions are often private, not under the publicscrutiny. Therefore, we hypothesize that people will prioritizeself-interest when they react to the algorithm’s decisions. As aresult, the effect of a favorable outcome will be stronger thanthe effect of an unbiased treatment.
Hypothesis 1c: In the context of algorithmic decision-making,the effect of a favorable outcome on perceived fairness islarger than the effect of being not biased against particulargroups.
Effects of Algorithm Development ProceduresProcedural fairness theories concentrate on the perceived fair-ness of the procedure used to make decisions (e.g., [31]). Forexample, Gilliland examined the procedural fairness of theemployment-selection system in terms of ten procedural rules,including job relatedness, opportunity to perform, reconsid-eration opportunity, consistency of administration, feedback,selection information, honesty, interpersonal effectiveness ofadministrator, two-way communication, propriety of questionsand equality needs [34].
Specifically, transparency of the decision-making process hasan important impact on the perceived procedural fairness. Forexample, a longitudinal analysis highlighted the importanceof receiving an explanation from the organization about howand why layoffs were conducted, in measuring the perceivedfairness of layoff decisions [84].
In the context of algorithmic decision-making, transparencyalso influences people’s perceived fairness of the algorithms.
Researchers have shown that some level of transparency ofan algorithm would increase users’ trust of the system evenwhen the user’s expectation is not aligned with the algorithm’soutcome [44]. However, providing too much informationabout the algorithm might have the risk of confusing people,and therefore reduce the perceived fairness [44].
Hypothesis 2a: An algorithmic decision-making process thatis more transparent is perceived as more fair than a processthat is less transparent.
The level of human involvement in the creation and deploy-ment of an algorithm might also play an important role indetermining perceptions of fairness. Humans have their ownbias. For example, sociology research shows that hiring man-agers tend to favor candidates that are culturally similar tothemselves, making hiring more than an objective process ofskill sorting [71].
However, in the context of algorithmic decision-making, hu-man involvement is often viewed as a mechanism for correct-ing machine bias. This is especially the case when peoplebecome increasingly aware of the limitation of algorithms inmarking subjective decisions. In tasks that require humanskills such as hiring and work evaluation, human decisionsare perceived as more fair, because algorithms are perceivedas lacking intuition and the ability to make subjective judg-ments [50]. The aversion to algorithmic decision-makingcould be mitigated when users contribute to the modificationof the algorithms [24]. Recent research on the developmentof decision-making algorithms has advocated for a human-in-the-loop approach, in order to make the algorithm moreaccountable [42, 68, 74, 86]. In sum, human involvement isoften considered as a positive influence in decision-makingsystems, due to the human’s ability to recognize factors thatare hard to quantify. Thus, it is reasonable to hypothesize thatpeople will evaluate algorithms as more fair when there arehuman insights involved in the different steps of the algorithmcreation and deployment.
Hypothesis 2b: An algorithmic decision-making process thathas more human involvement is perceived as more fair than aprocess that has less human involvement.
Effects of Individual DifferencesIn this research, we also investigate the extent to which theperceptions of algorithmic fairness are influenced by people’spersonal characteristics. Specifically, we look at two potentialinfluential factors: education and demographics.
We first consider education. We believe both general educationand computer science education may influence perceptions offairness. People with greater knowledge in general and aboutcomputers specifically may simply have a better sense for whattypes of information an algorithm might process, and how thatinformation might be processed to come to a decision. We arenot aware of research that has investigated the link betweencomputer literacy and perceptions of fairness in algorithmicdecision-making, but research has investigated related issues.For example, prior work has looked at how people form “folktheories” of algorithms’ operation, often leading to incorrectnotions of their operation and highly negative feelings about
the impact on their self interest [20]. We speculate that userswith greater computer literacy will have more realistic expec-tations, leading them to more often agree with the perspectivethat an algorithm designed to make decisions is likely to be afair process.
Pierson, et al. conducted a survey of undergraduate studentsbefore and after an hour-long lecture and discussion on al-gorithmic fairness, finding that students’ views changed; inparticular, more students came to support the idea of usingalgorithms rather than judges (who might themselves be inac-curate or biased) in criminal justice [65]. This finding suggeststhat education, particularly education to improve algorithmicliteracy, may lead to a greater perception of algorithmic fair-ness.
Hypothesis 3a: People with a higher level of education willperceive algorithmic decision-making to be more fair thanpeople with a lower level of education.
Hypothesis 3b: People with high computer literacy will per-ceive algorithmic decision-making to be more fair than peoplewith low computer literacy.
It is possible that different demographic groups have differentbeliefs concerning algorithmic fairness. Research has foundthat privileged groups are less likely to perceive problemswith the status quo; for example, the state of racial equalityis perceived differently by whites and blacks in the UnitedStates [14].
There is a growing body of examples documenting algorithmicbias against particular groups of people. For example, ananalysis by Pro Publica found that an algorithm for predictingeach defendant’s risk of committing future crime was twice aslikely to wrongly label black defendants as future criminals,as compared with white defendants [6]. In another case, analgorithmic tool for rating job applicants at Amazon penalizedresumes containing the word “women’s” [18].
There has been little work directly investigating the link be-tween demographic factors and perceptions of algorithmicfairness. One recent study did not find differences betweenmen and women in their perceptions of fairness in an algorith-mic decision-making process, but did find that men were morelikely than women to prefer maximizing accuracy over mini-mizing racial disparities in a survey describing a hypotheticalcriminal risk prediction algorithm [65].
Based on the growing body of examples of algorithmic biasagainst certain populations, we predict that different demo-graphic groups will perceive fairness differently:
Hypothesis 3c: People in demographic groups that typicallybenefit from algorithmic biases (young, white, men) will per-ceive algorithmic decision-making to be more fair than peoplein other demographic groups (old, non-white, women).
METHODTo test the hypotheses about factors influencing people’s per-ceived fairness of algorithmic decision-making, we conducteda randomized between-subjects experiment on MTurk. Thecontext for this experiment is a description of an “experimental”
algorithmic decision-making process that determines whichMTurk workers are awarded a Master qualification.
Study platformMTurk is an online crowdsourcing workplace where over500,000 workers complete microtasks and get paid by re-questers [13]. Masters workers are the “elite groups of workerswho have demonstrated accuracy on specific types of HITs onthe Mechanical Turk marketplace” [1]. Since Masters workerscan access exclusive tasks that are usually associated withhigher payments, the Master qualification is desirable amongMTurk workers [57].
The Master qualification is a black-box process to workers.According to Amazon’s FAQs page, Mechanical Turk uses“statistical models that analyze Worker performance based onseveral Requester-provided and marketplace data points” todecide which workers are qualified [1].
Experiment Design
Manipulations Conditions Descriptions shown to participantsAlgorithm Outcome (H1)
(Un)favorableOutcome
FavorableThe algorithm has processed your HIT history,and the result is positive (you passed the Master qualification test).
UnfavorableThe algorithm has processed your HIT history,and the result is negative (you did not pass the Master qualification test).
(Un)biasedTreatment
Biased
Percent errors by gender: Male 2.6%, Female 10.7%Percent errors by age: Above 45 9.8%, Between 25 and 45 3.6%, Below 25 1.2%Percent errors by race: White 0.7%, Asian 6.4%, Hispanic 5.8%,Native American 6.7%, Other 14.1%
Unbiased
Percent errors by gender: Male 6.4%, Female 6.3%Percent errors by age: Above 45 6.4%, Between 25 and 45 6.2%, Below 25 6.5%Percent errors by race: White 6.5%, Asian 6.4%, Hispanic 6.4%,Native American 6.5%, Other 6.2%
Algorithm Creation and Deployment (H2)
TransparencyHigh
The organization publishes many aspects of this computer algorithm on the web,including the features used, the optimization process, and benchmarksdescribing the process’s accuracy.
LowThe organization does not publicly provide any informationabout this computer algorithm.
DesignCS Team
The algorithm was built and optimized by a team of computer scientistswithin the organization.
OutsourcedThe algorithm was outsourced to a company that specializesin applicant assessment software
CS and HRThe algorithm was built and optimized by a team of computer scientistsand other MTurk staff across the organization.
ModelMachineLearning
The algorithm is based on machine learning techniques trained to recognizepatterns in a very large dataset of data collected by the organization over time
RulesThe algorithm has been hand-coded with rules provided bydomain experts within the organization.
DecisionMixed
The algorithm’s decision is then considered on a case-by-case basis byMTurk staff within the organization.
Algorithm-only The algorithm is used to make the final decision.
Table 1: Summary of the experimental manipulationsshown to participants.
We designed an online between-subjects experiment in whichparticipants were randomly assigned into a 2 (biased vs. un-biased treatment to groups) × 2 (favorable vs. unfavorableoutcome to individuals) × 2 (high vs. low transparency) × 3(outsourced vs. computer scientists vs. mixed design team)× 2 (machine learning vs. expert rule-based model) × 2(algorithm-only vs. mixed decision) design. These manipu-lations allow us to test the effects of algorithm outcome onperceived fairness (Hypothesis 1) and the effects of algorithmdevelopment procedures on perceived fairness (Hypothesis 2).We asked participants to provide their demographic informa-tion, which allows us to test Hypothesis 3. The experimentdesign and manipulations are summarized in Table 1.
Algorithm Outcome: We explore two aspects of algorithmoutcome, (un)favorable outcome to individual and (un)biasedtreatment to group.
• (Un)favorable outcome: Participants randomly received adecision and were told the decision was was generated bythe algorithm. The decision (“pass” or “fail”) correspondsto either a favorable or an unfavorable outcome.
• (Un)biased treatment: In both conditions, participantswere shown tables of error rates across demographic groups(see Figure 1). In the unbiased condition, participantssaw very similar error rates across different demographicgroups, which (approximately) satisfies the fairness cri-terion of âAIJoverall accuracy equalityâAI proposed byBerk et al. [9]; in the biased condition, participants sawdifferent error rates across different groups (we used errorrates from a real computer vision algorithm from a previ-ous study [12]), which violates the same statistical fairnesscriterion.
Algorithm Development Procedure: We also manipulatedthe transparency and level of human involvement in the algo-rithm creation and deployment procedure. Participants wereshown a description of the algorithm corresponding to theirrandomly-assigned conditions. The specific text of each con-dition is shown in Table 1.
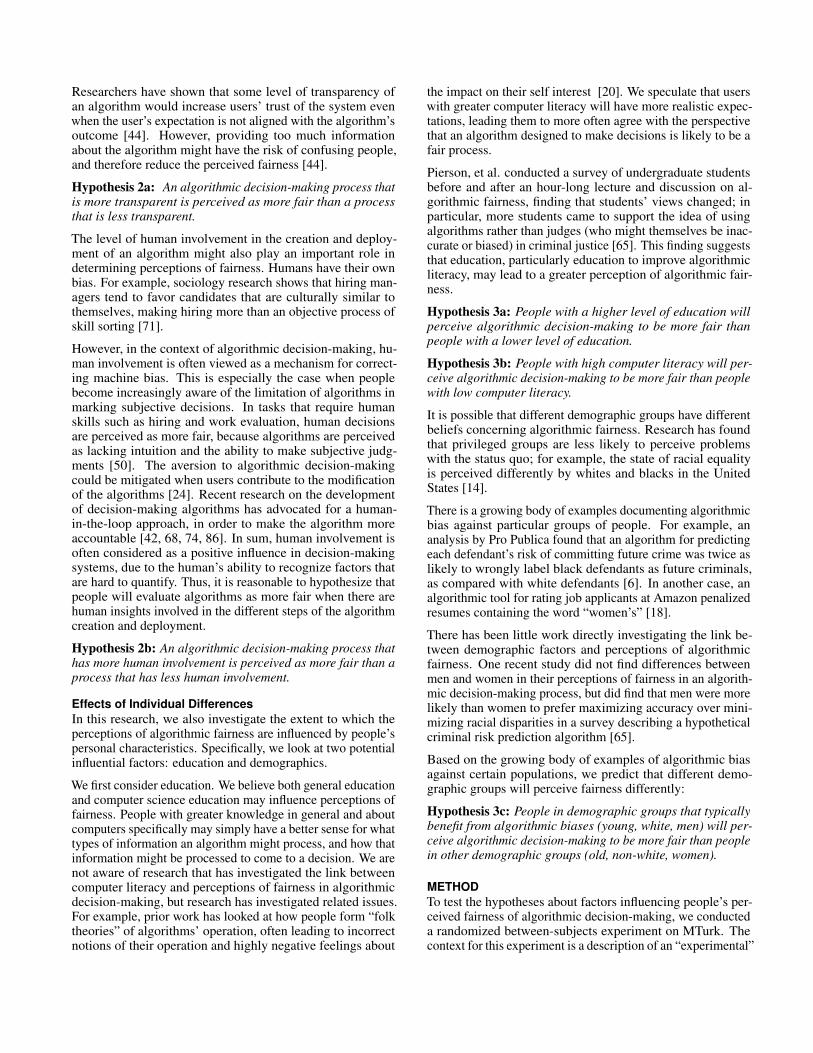
Figure 1: Overview of the procedure of the experiment foreach participant.
ProcedureThe experiment consisted of five steps, as shown in Figure 1.
Step 1. Participants were shown information about the algo-rithm in two parts. The first part provided details about thealgorithm development and design process. We created 24(3×2×2×2) different variations for this part, manipulating thefour aspects of algorithm development (transparency, design,model, and decision). The second part of the description is atable of error rates across different demographic subgroups.The error rates are either consistent or differentiated acrossgroups. Participants were required to answer quiz questions to
ensure that they paid attention to the description. If they par-ticipants gave the incorrect answer, they could go back to readthe description again. However, they could not proceed to thenext step until they answered all the quiz questions correctly.
Step 2. We asked participants to self-evaluate whether theythink the algorithm will give them a pass or fail result for aMaster qualification.
Step 3. We asked participants to submit their worker ID.We explained that our algorithm has a way to retrieve theirHIT history and that the algorithm will evaluate their Masterqualification based on their prior performance. Then, weshowed participants their outcome: pass or fail. While we toldparticipants that this result was generated by the algorithm, itwas, in fact, randomly generated (we did not feed their workerID and HIT history to an algorithm).
Step 4. We asked participants to answer a set of survey ques-tions related to the fairness of the algorithm and collected theirdemographic information. We also included the followingattention check question: “This is an attention check. ChooseDisagree”. At the end of the survey, participants were giventhe opportunity to freely express their opinions regarding thealgorithmic decision-making process in an open-ended ques-tion.
Step 5. We concluded the survey with a debriefing statement,where we clarified the deceptions in our study design. Weclearly stated that (a) the description about the MTurk Masterqualification algorithm is made-up, both in terms of the algo-rithm error rate and the development and deployment processand (b) the result of the Master qualification algorithm wasrandomly generated.
Operationalization:
Dependent variables:• Perceived fairness: Participants rated their fairness per-
ceptions towards the decision-making algorithm after theylearned the design process and experienced the outcome.Their perceived fairness is measured by six questionsadapted from previous studies [32, 51]. All questions are ona 7-point likert scale, from “strongly disagree” to “stronglyagree”. The questions included “the process described isfair”, “the process described is fair to job-seekers”, “theprocess described is fair to the employer organization”, “thedecisions that the organization makes as a result of thisprocess will be fair”, “the process described will lead the or-ganization to make great hiring decisions”, and “the processdescribed will make mistakes”. The mean for perceived fair-ness in our data is 4.0, and the median is 4.3. The internalconsistency (Cronbach’s alpha) of the six questions is 0.91,which is above the “excellent” standard of 0.9.
Independent variables:• Algorithm Outcomes:
– (Un)favorable Outcome: This variable takes the valueof 1 for participants who receive the “unfavorable”outcome, and 0 for “favorable”.
– (Un)biased Treatment: This variable takes the valueof 1 for participants who viewed “biased” error ratesacross groups, and 0 for “unbiased”.
• Algorithm Design and development:
– Transparency: This variable takes the value of 1 forparticipants who viewed the “high” transparency de-scription, and 0 for “low”.
– Design: We operationalize the three types of design(outsourced, cs, cs and hr) as two dummy variables.CS team and CS and HR, which take the value of 1 forparticipants in that respective condition.
– Model: This variable takes the value of 1 for partici-pants who viewed the “machine learning” description,and 0 for “rules”.
– Decision: This variable takes the value of 1 for par-ticipants who viewed “mixed”, and 0 for “algorithm-only”.
• Individual differences:
– Degree: We asked participants to report their highestcompleted degrees. We grouped the participants intothree categories, “above Bachelor’s degree”, “Bache-lor’s degree”, and “below Bachelor’s degree”. We use“above Bachelor’s degree” as a baseline in the analysis.
– Computer Literacy: We developed 8 questions to eval-uate participants’ computer literacy, which assessedparticipants’ computer skills, familiarity, and knowl-edge. Six questions are on a 7-point Likert scale, andtwo are on a 4-point scale. We normalized the 4-pointscale answers into 7-point scale and composited themto calculate the final literacy score. The three ques-tions on computer skills are adapted from [79] and[51]. The two questions on computer familiarity areadapted from [85]. Since our study is specifically aboutdecision-making algorithms, which is different fromprevious studies measuring computer literacy, we de-veloped three new questions focusing on participants’knowledge of algorithms. The original questionnairesare included in the supplementary material. The in-ternal consistency (Cronbach’s alpha) for all the eightquestions is 0.74, which is above the “acceptable” stan-dard. The mean for computer literacy in our data is4.94 and the median is 5. In our analysis, we groupedthe numeric computer literacy factor into a binary cat-egorical variable where scores lower than or equal to5 are labelled “Low Literacy” and otherwise “HighLiteracy” (the baseline).
– Age: We grouped the age data provided by participantsinto three categories, “below 25”, “between 25–45”,and “above 45”. We use “Between 25–45” as a base-line to create two dummy variables on age.
– Gender: We provided an optional text input box at theend of survey to allow participants to indicate their pre-ferred gender. In our analysis, we only included datafrom participants who identify themselves as eithermale or female.
– Race: We allowed participants to indicate all race cate-gories that apply to them. We then created a dummyvariable for each racial group, which resulted in fivevariables. For each variable, belonging to the racialgroup is labelled as 1 and 0 otherwise.
Control Variables:• Self-expectation: This variable takes the value of 1 for
participants who expected to pass the Master qualificationbefore receiving the algorithm outcome, and 0 for partici-pants who expected to fail.
ParticipantsWe recruited 590 participants from MTurk in January andFebruary 2019. All participants are based in the United Statesand have overall HIT approval rates of at least 80%. Eachparticipant received $1.50 as a compensation after finishingthe experiment. We excluded 11 participants who failed theattention check question in our data analysis, leaving 579responses. 153 participants reported a self-expectation of“fail”, while the remaining 426 answered “pass”. The randomalgorithm gave 292 passes and 287 fails; 287 participantsreceived an outcome that aligned with their self-expectationwhile 292 received decisions that did not align.
RESULTS
Descriptive Statistics and Statistical Analysis
Categorical Variables
Age Gender Degree ComputerLiteracy
Above 45 423 Female 205 Above 70 High 264Btw 25-45 107 Male 335 Bachelor 247 Low 315Below 25 49 Other 39 Below 262
Continuous VariableMin 1st Qu. Median Mean 3rd Qu. Max S.D.
Perceived Fairness 1.0 2.8 4.3 4.0 5.2 7.0 1.5
Table 2: Descriptive statistics of the 579 responses
The descriptive statistics of major variables are shown in Table2. We used linear regression models to analyze the data andtest our hypotheses, with perceived fairness as the dependentvariable, and algorithm outcomes, development procedures,and interpersonal differences as the independent variables. Wealso controlled for the self-assessment of whether they willpass or not. We report coefficients, p-values, standard errors,R2 and adjusted R2 values.
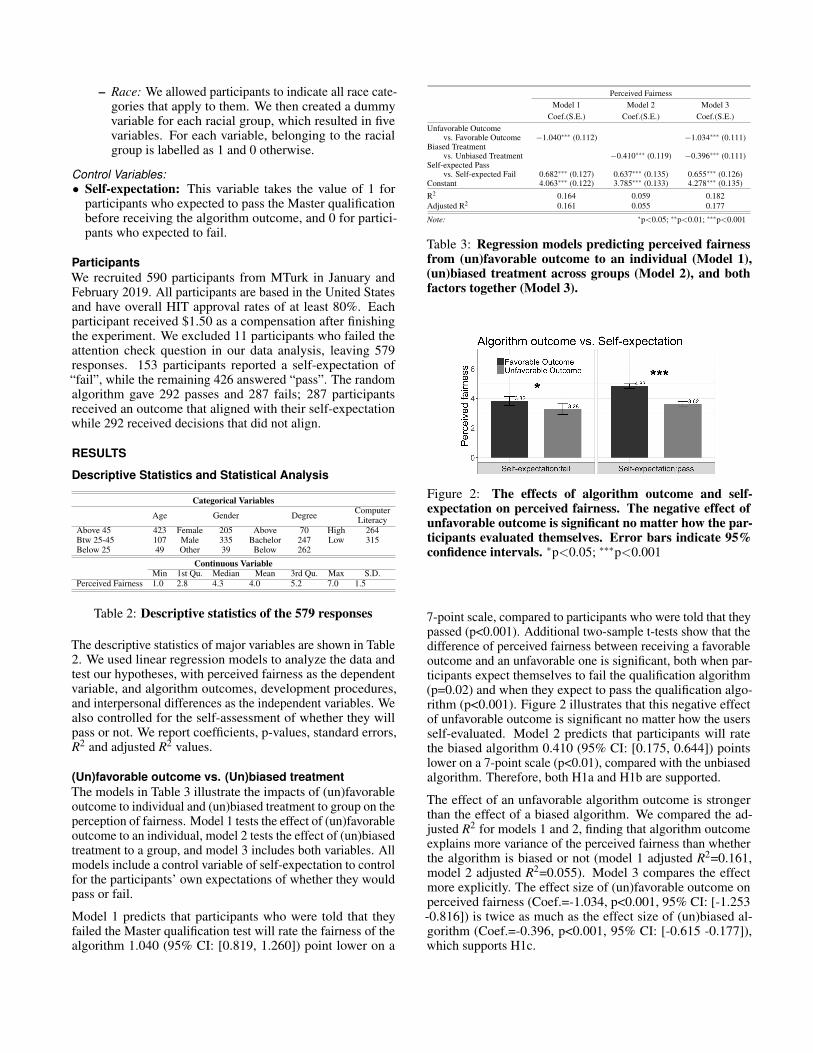
(Un)favorable outcome vs. (Un)biased treatmentThe models in Table 3 illustrate the impacts of (un)favorableoutcome to individual and (un)biased treatment to group on theperception of fairness. Model 1 tests the effect of (un)favorableoutcome to an individual, model 2 tests the effect of (un)biasedtreatment to a group, and model 3 includes both variables. Allmodels include a control variable of self-expectation to controlfor the participants’ own expectations of whether they wouldpass or fail.
Model 1 predicts that participants who were told that theyfailed the Master qualification test will rate the fairness of thealgorithm 1.040 (95% CI: [0.819, 1.260]) point lower on a
Perceived FairnessModel 1 Model 2 Model 3
Coef.(S.E.) Coef.(S.E.) Coef.(S.E.)Unfavorable Outcome
vs. Favorable Outcome −1.040∗∗∗ (0.112) −1.034∗∗∗ (0.111)Biased Treatment
vs. Unbiased Treatment −0.410∗∗∗ (0.119) −0.396∗∗∗ (0.111)Self-expected Pass
vs. Self-expected Fail 0.682∗∗∗ (0.127) 0.637∗∗∗ (0.135) 0.655∗∗∗ (0.126)Constant 4.063∗∗∗ (0.122) 3.785∗∗∗ (0.133) 4.278∗∗∗ (0.135)
R2 0.164 0.059 0.182Adjusted R2 0.161 0.055 0.177
Note: ∗p<0.05; ∗∗p<0.01; ∗∗∗p<0.001
Table 3: Regression models predicting perceived fairnessfrom (un)favorable outcome to an individual (Model 1),(un)biased treatment across groups (Model 2), and bothfactors together (Model 3).
Figure 2: The effects of algorithm outcome and self-expectation on perceived fairness. The negative effect ofunfavorable outcome is significant no matter how the par-ticipants evaluated themselves. Error bars indicate 95%confidence intervals. ∗p<0.05; ∗∗∗p<0.001
7-point scale, compared to participants who were told that theypassed (p<0.001). Additional two-sample t-tests show that thedifference of perceived fairness between receiving a favorableoutcome and an unfavorable one is significant, both when par-ticipants expect themselves to fail the qualification algorithm(p=0.02) and when they expect to pass the qualification algo-rithm (p<0.001). Figure 2 illustrates that this negative effectof unfavorable outcome is significant no matter how the usersself-evaluated. Model 2 predicts that participants will ratethe biased algorithm 0.410 (95% CI: [0.175, 0.644]) pointslower on a 7-point scale (p<0.01), compared with the unbiasedalgorithm. Therefore, both H1a and H1b are supported.
The effect of an unfavorable algorithm outcome is strongerthan the effect of a biased algorithm. We compared the ad-justed R2 for models 1 and 2, finding that algorithm outcomeexplains more variance of the perceived fairness than whetherthe algorithm is biased or not (model 1 adjusted R2=0.161,model 2 adjusted R2=0.055). Model 3 compares the effectmore explicitly. The effect size of (un)favorable outcome onperceived fairness (Coef.=-1.034, p<0.001, 95% CI: [-1.253-0.816]) is twice as much as the effect size of (un)biased al-gorithm (Coef.=-0.396, p<0.001, 95% CI: [-0.615 -0.177]),which supports H1c.
Perceived FairnessModel 1 Model 2
Coef. (S.E.) Coef. (S.E.)Unfavorable Outcome vs. Favorable Outcome −1.041∗∗∗ (0.113) −0.887∗∗∗ (0.258)Biased Treatment vs. Unbiased Treatment −0.395∗∗∗ (0.113) −1.068∗∗∗ (0.257)CS Team vs. Outsourced 0.131 (0.138) −0.614∗ (0.240)CS and HR vs. Outsourced 0.201 (0.137) −0.352 (0.224)Machine Learning vs. Rules 0.138 (0.112) 0.086 (0.189)High Transparency vs. Low Transparency −0.154 (0.114) 0.056 (0.191)Mixed Decision vs. Algorithm-only 0.090 (0.113) 0.220 (0.189)Unfavorable Outcome × CS team 0.426 (0.272)Unfavorable Outcome × CS and HR 0.015 (0.273)Unfavorable Outcome ×Machine Learning −0.238 (0.220)Unfavorable Outcome × High Transparency 0.106 (0.224)Unfavorable Outcome ×Mixed Decision −0.420 (0.221)Biased Treatment × CS team 0.971∗∗∗ (0.272)Biased Treatment × CS and HR 1.070∗∗∗ (0.271)Biased Treatment ×Machine Learning 0.343 (0.220)Biased Treatment × High Transparency −0.486∗ (0.224)Biased Treatment ×Mixed Decision 0.174 (0.221)Self-expected Pass vs. Self-expected Fail 0.659∗∗∗ (0.127) 0.616∗∗∗ (0.125)Constant 4.131∗∗∗ (0.178) 4.438∗∗∗ (0.235)
R2 0.190 0.235Adjusted R2 0.178 0.210
Note: ∗p<0.05; ∗∗p<0.01; ∗∗∗p<0.001
Table 4: Regression models predicting perceived fairnessfrom algorithm outcomes and development procedures.Model 1 shows the main effects, and Model 2 includes in-teraction terms.
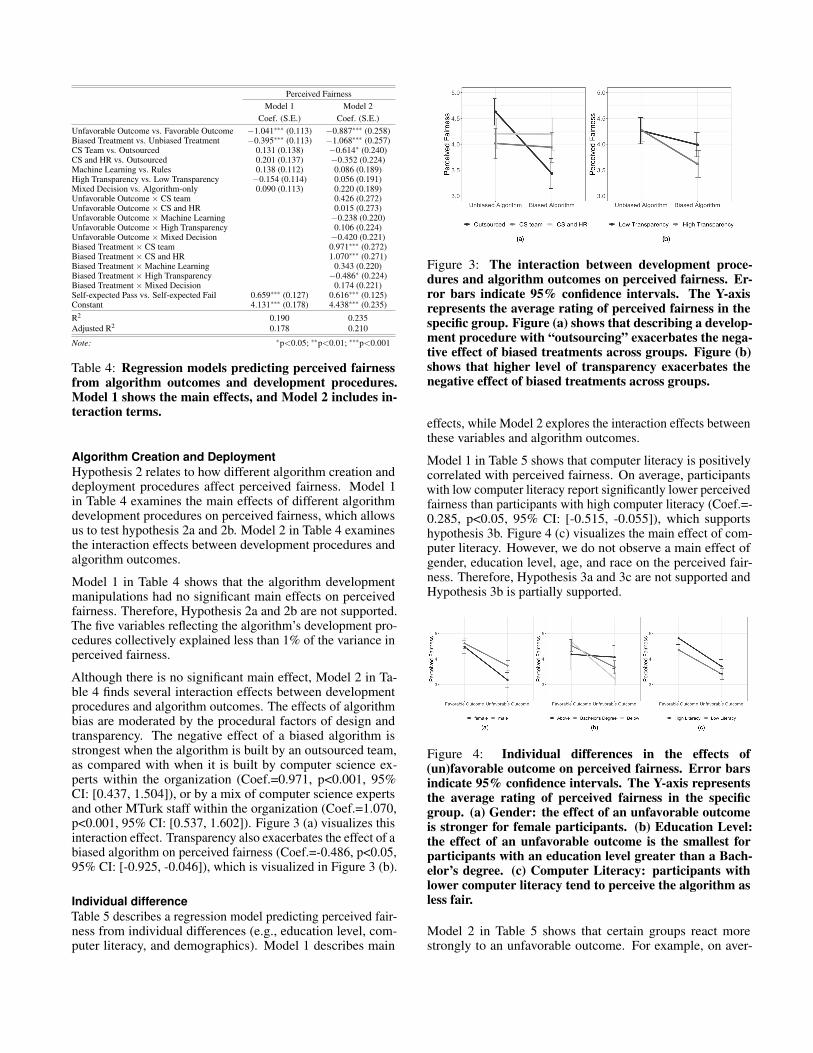
Algorithm Creation and DeploymentHypothesis 2 relates to how different algorithm creation anddeployment procedures affect perceived fairness. Model 1in Table 4 examines the main effects of different algorithmdevelopment procedures on perceived fairness, which allowsus to test hypothesis 2a and 2b. Model 2 in Table 4 examinesthe interaction effects between development procedures andalgorithm outcomes.
Model 1 in Table 4 shows that the algorithm developmentmanipulations had no significant main effects on perceivedfairness. Therefore, Hypothesis 2a and 2b are not supported.The five variables reflecting the algorithm’s development pro-cedures collectively explained less than 1% of the variance inperceived fairness.
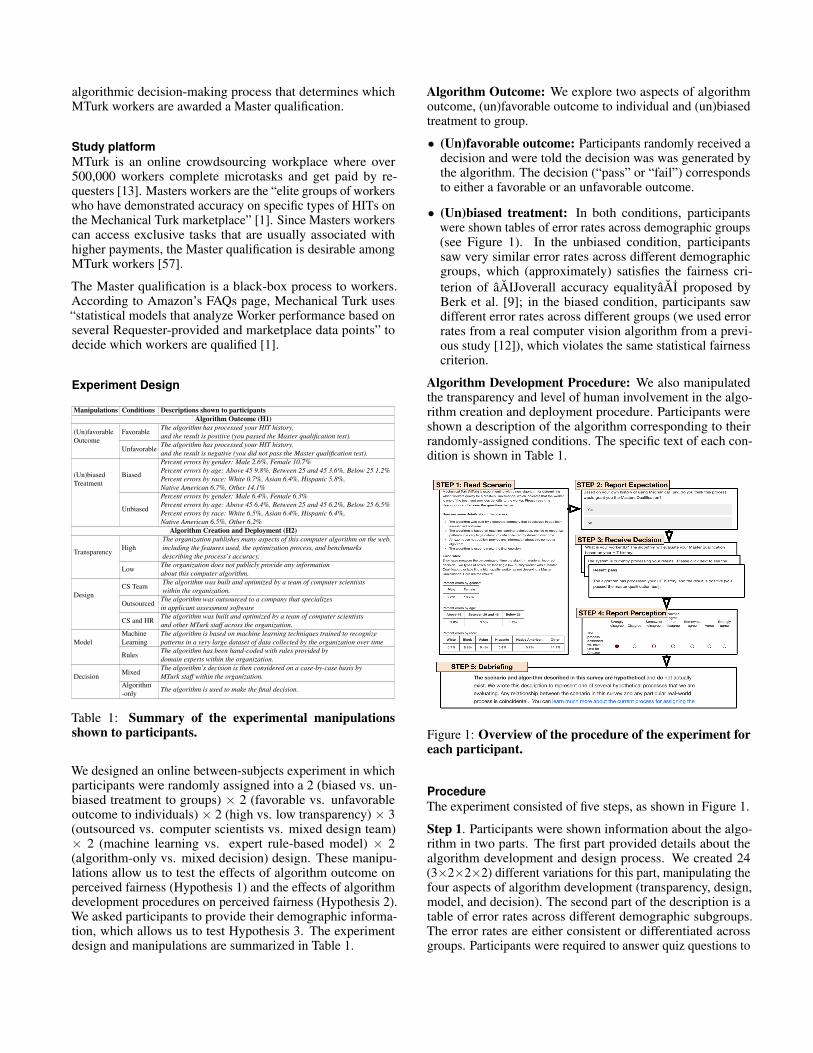
Although there is no significant main effect, Model 2 in Ta-ble 4 finds several interaction effects between developmentprocedures and algorithm outcomes. The effects of algorithmbias are moderated by the procedural factors of design andtransparency. The negative effect of a biased algorithm isstrongest when the algorithm is built by an outsourced team,as compared with when it is built by computer science ex-perts within the organization (Coef.=0.971, p<0.001, 95%CI: [0.437, 1.504]), or by a mix of computer science expertsand other MTurk staff within the organization (Coef.=1.070,p<0.001, 95% CI: [0.537, 1.602]). Figure 3 (a) visualizes thisinteraction effect. Transparency also exacerbates the effect of abiased algorithm on perceived fairness (Coef.=-0.486, p<0.05,95% CI: [-0.925, -0.046]), which is visualized in Figure 3 (b).
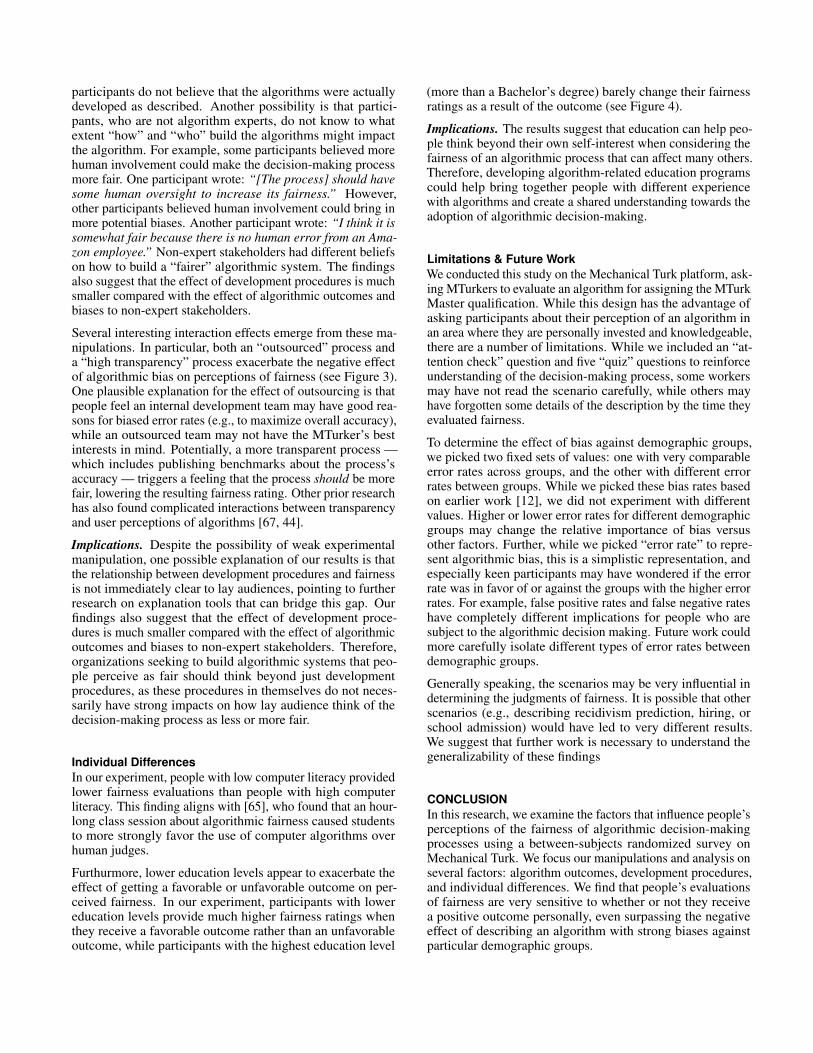
Individual differenceTable 5 describes a regression model predicting perceived fair-ness from individual differences (e.g., education level, com-puter literacy, and demographics). Model 1 describes main
Figure 3: The interaction between development proce-dures and algorithm outcomes on perceived fairness. Er-ror bars indicate 95% confidence intervals. The Y-axisrepresents the average rating of perceived fairness in thespecific group. Figure (a) shows that describing a develop-ment procedure with “outsourcing” exacerbates the nega-tive effect of biased treatments across groups. Figure (b)shows that higher level of transparency exacerbates thenegative effect of biased treatments across groups.
effects, while Model 2 explores the interaction effects betweenthese variables and algorithm outcomes.
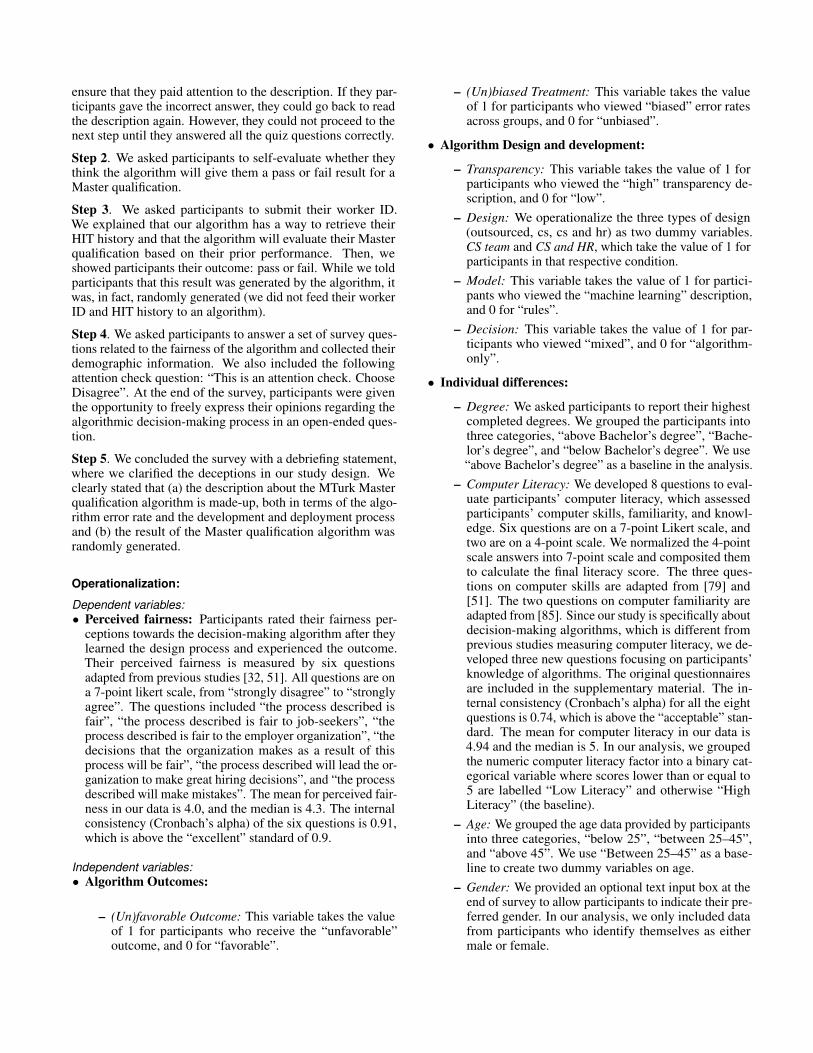
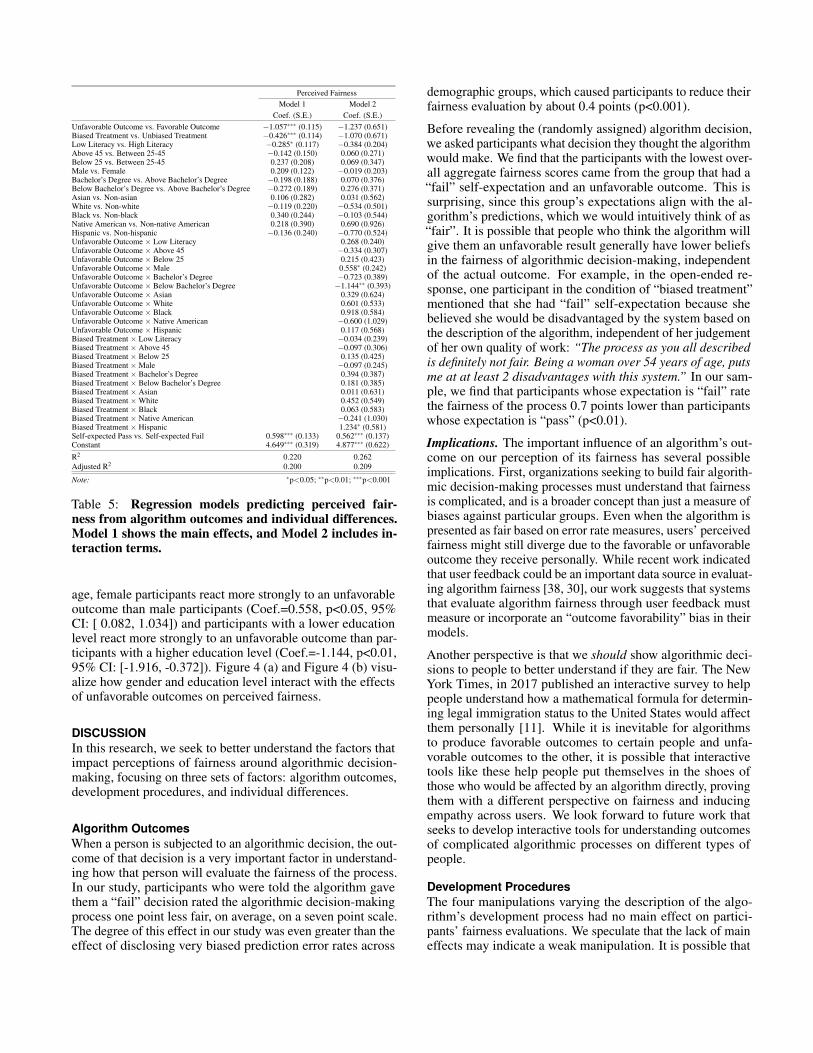
Model 1 in Table 5 shows that computer literacy is positivelycorrelated with perceived fairness. On average, participantswith low computer literacy report significantly lower perceivedfairness than participants with high computer literacy (Coef.=-0.285, p<0.05, 95% CI: [-0.515, -0.055]), which supportshypothesis 3b. Figure 4 (c) visualizes the main effect of com-puter literacy. However, we do not observe a main effect ofgender, education level, age, and race on the perceived fair-ness. Therefore, Hypothesis 3a and 3c are not supported andHypothesis 3b is partially supported.
Figure 4: Individual differences in the effects of(un)favorable outcome on perceived fairness. Error barsindicate 95% confidence intervals. The Y-axis representsthe average rating of perceived fairness in the specificgroup. (a) Gender: the effect of an unfavorable outcomeis stronger for female participants. (b) Education Level:the effect of an unfavorable outcome is the smallest forparticipants with an education level greater than a Bach-elor’s degree. (c) Computer Literacy: participants withlower computer literacy tend to perceive the algorithm asless fair.
Model 2 in Table 5 shows that certain groups react morestrongly to an unfavorable outcome. For example, on aver-
Perceived FairnessModel 1 Model 2
Coef. (S.E.) Coef. (S.E.)Unfavorable Outcome vs. Favorable Outcome −1.057∗∗∗ (0.115) −1.237 (0.651)Biased Treatment vs. Unbiased Treatment −0.426∗∗∗ (0.114) −1.070 (0.671)Low Literacy vs. High Literacy −0.285∗ (0.117) −0.384 (0.204)Above 45 vs. Between 25-45 −0.142 (0.150) 0.060 (0.271)Below 25 vs. Between 25-45 0.237 (0.208) 0.069 (0.347)Male vs. Female 0.209 (0.122) −0.019 (0.203)Bachelor’s Degree vs. Above Bachelor’s Degree −0.198 (0.188) 0.070 (0.376)Below Bachelor’s Degree vs. Above Bachelor’s Degree −0.272 (0.189) 0.276 (0.371)Asian vs. Non-asian 0.106 (0.282) 0.031 (0.562)White vs. Non-white −0.119 (0.220) −0.534 (0.501)Black vs. Non-black 0.340 (0.244) −0.103 (0.544)Native American vs. Non-native American 0.218 (0.390) 0.690 (0.926)Hispanic vs. Non-hispanic −0.136 (0.240) −0.770 (0.524)Unfavorable Outcome × Low Literacy 0.268 (0.240)Unfavorable Outcome × Above 45 −0.334 (0.307)Unfavorable Outcome × Below 25 0.215 (0.423)Unfavorable Outcome ×Male 0.558∗ (0.242)Unfavorable Outcome × Bachelor’s Degree −0.723 (0.389)Unfavorable Outcome × Below Bachelor’s Degree −1.144∗∗ (0.393)Unfavorable Outcome × Asian 0.329 (0.624)Unfavorable Outcome ×White 0.601 (0.533)Unfavorable Outcome × Black 0.918 (0.584)Unfavorable Outcome × Native American −0.600 (1.029)Unfavorable Outcome × Hispanic 0.117 (0.568)Biased Treatment × Low Literacy −0.034 (0.239)Biased Treatment × Above 45 −0.097 (0.306)Biased Treatment × Below 25 0.135 (0.425)Biased Treatment ×Male −0.097 (0.245)Biased Treatment × Bachelor’s Degree 0.394 (0.387)Biased Treatment × Below Bachelor’s Degree 0.181 (0.385)Biased Treatment × Asian 0.011 (0.631)Biased Treatment ×White 0.452 (0.549)Biased Treatment × Black 0.063 (0.583)Biased Treatment × Native American −0.241 (1.030)Biased Treatment × Hispanic 1.234∗ (0.581)Self-expected Pass vs. Self-expected Fail 0.598∗∗∗ (0.133) 0.562∗∗∗ (0.137)Constant 4.649∗∗∗ (0.319) 4.877∗∗∗ (0.622)
R2 0.220 0.262Adjusted R2 0.200 0.209
Note: ∗p<0.05; ∗∗p<0.01; ∗∗∗p<0.001
Table 5: Regression models predicting perceived fair-ness from algorithm outcomes and individual differences.Model 1 shows the main effects, and Model 2 includes in-teraction terms.
age, female participants react more strongly to an unfavorableoutcome than male participants (Coef.=0.558, p<0.05, 95%CI: [ 0.082, 1.034]) and participants with a lower educationlevel react more strongly to an unfavorable outcome than par-ticipants with a higher education level (Coef.=-1.144, p<0.01,95% CI: [-1.916, -0.372]). Figure 4 (a) and Figure 4 (b) visu-alize how gender and education level interact with the effectsof unfavorable outcomes on perceived fairness.
DISCUSSIONIn this research, we seek to better understand the factors thatimpact perceptions of fairness around algorithmic decision-making, focusing on three sets of factors: algorithm outcomes,development procedures, and individual differences.
Algorithm OutcomesWhen a person is subjected to an algorithmic decision, the out-come of that decision is a very important factor in understand-ing how that person will evaluate the fairness of the process.In our study, participants who were told the algorithm gavethem a “fail” decision rated the algorithmic decision-makingprocess one point less fair, on average, on a seven point scale.The degree of this effect in our study was even greater than theeffect of disclosing very biased prediction error rates across
demographic groups, which caused participants to reduce theirfairness evaluation by about 0.4 points (p<0.001).
Before revealing the (randomly assigned) algorithm decision,we asked participants what decision they thought the algorithmwould make. We find that the participants with the lowest over-all aggregate fairness scores came from the group that had a“fail” self-expectation and an unfavorable outcome. This issurprising, since this group’s expectations align with the al-gorithm’s predictions, which we would intuitively think of as“fair”. It is possible that people who think the algorithm willgive them an unfavorable result generally have lower beliefsin the fairness of algorithmic decision-making, independentof the actual outcome. For example, in the open-ended re-sponse, one participant in the condition of “biased treatment”mentioned that she had “fail” self-expectation because shebelieved she would be disadvantaged by the system based onthe description of the algorithm, independent of her judgementof her own quality of work: “The process as you all describedis definitely not fair. Being a woman over 54 years of age, putsme at at least 2 disadvantages with this system.” In our sam-ple, we find that participants whose expectation is “fail” ratethe fairness of the process 0.7 points lower than participantswhose expectation is “pass” (p<0.01).
Implications. The important influence of an algorithm’s out-come on our perception of its fairness has several possibleimplications. First, organizations seeking to build fair algorith-mic decision-making processes must understand that fairnessis complicated, and is a broader concept than just a measure ofbiases against particular groups. Even when the algorithm ispresented as fair based on error rate measures, users’ perceivedfairness might still diverge due to the favorable or unfavorableoutcome they receive personally. While recent work indicatedthat user feedback could be an important data source in evaluat-ing algorithm fairness [38, 30], our work suggests that systemsthat evaluate algorithm fairness through user feedback mustmeasure or incorporate an “outcome favorability” bias in theirmodels.
Another perspective is that we should show algorithmic deci-sions to people to better understand if they are fair. The NewYork Times, in 2017 published an interactive survey to helppeople understand how a mathematical formula for determin-ing legal immigration status to the United States would affectthem personally [11]. While it is inevitable for algorithmsto produce favorable outcomes to certain people and unfa-vorable outcomes to the other, it is possible that interactivetools like these help people put themselves in the shoes ofthose who would be affected by an algorithm directly, provingthem with a different perspective on fairness and inducingempathy across users. We look forward to future work thatseeks to develop interactive tools for understanding outcomesof complicated algorithmic processes on different types ofpeople.
Development ProceduresThe four manipulations varying the description of the algo-rithm’s development process had no main effect on partici-pants’ fairness evaluations. We speculate that the lack of maineffects may indicate a weak manipulation. It is possible that
participants do not believe that the algorithms were actuallydeveloped as described. Another possibility is that partici-pants, who are not algorithm experts, do not know to whatextent “how” and “who” build the algorithms might impactthe algorithm. For example, some participants believed morehuman involvement could make the decision-making processmore fair. One participant wrote: “[The process] should havesome human oversight to increase its fairness.” However,other participants believed human involvement could bring inmore potential biases. Another participant wrote: “I think it issomewhat fair because there is no human error from an Ama-zon employee.” Non-expert stakeholders had different beliefson how to build a “fairer” algorithmic system. The findingsalso suggest that the effect of development procedures is muchsmaller compared with the effect of algorithmic outcomes andbiases to non-expert stakeholders.
Several interesting interaction effects emerge from these ma-nipulations. In particular, both an “outsourced” process anda “high transparency” process exacerbate the negative effectof algorithmic bias on perceptions of fairness (see Figure 3).One plausible explanation for the effect of outsourcing is thatpeople feel an internal development team may have good rea-sons for biased error rates (e.g., to maximize overall accuracy),while an outsourced team may not have the MTurker’s bestinterests in mind. Potentially, a more transparent process —which includes publishing benchmarks about the process’saccuracy — triggers a feeling that the process should be morefair, lowering the resulting fairness rating. Other prior researchhas also found complicated interactions between transparencyand user perceptions of algorithms [67, 44].
Implications. Despite the possibility of weak experimentalmanipulation, one possible explanation of our results is thatthe relationship between development procedures and fairnessis not immediately clear to lay audiences, pointing to furtherresearch on explanation tools that can bridge this gap. Ourfindings also suggest that the effect of development proce-dures is much smaller compared with the effect of algorithmicoutcomes and biases to non-expert stakeholders. Therefore,organizations seeking to build algorithmic systems that peo-ple perceive as fair should think beyond just developmentprocedures, as these procedures in themselves do not neces-sarily have strong impacts on how lay audience think of thedecision-making process as less or more fair.
Individual DifferencesIn our experiment, people with low computer literacy providedlower fairness evaluations than people with high computerliteracy. This finding aligns with [65], who found that an hour-long class session about algorithmic fairness caused studentsto more strongly favor the use of computer algorithms overhuman judges.
Furthurmore, lower education levels appear to exacerbate theeffect of getting a favorable or unfavorable outcome on per-ceived fairness. In our experiment, participants with lowereducation levels provide much higher fairness ratings whenthey receive a favorable outcome rather than an unfavorableoutcome, while participants with the highest education level
(more than a Bachelor’s degree) barely change their fairnessratings as a result of the outcome (see Figure 4).
Implications. The results suggest that education can help peo-ple think beyond their own self-interest when considering thefairness of an algorithmic process that can affect many others.Therefore, developing algorithm-related education programscould help bring together people with different experiencewith algorithms and create a shared understanding towards theadoption of algorithmic decision-making.
Limitations & Future WorkWe conducted this study on the Mechanical Turk platform, ask-ing MTurkers to evaluate an algorithm for assigning the MTurkMaster qualification. While this design has the advantage ofasking participants about their perception of an algorithm inan area where they are personally invested and knowledgeable,there are a number of limitations. While we included an “at-tention check” question and five “quiz” questions to reinforceunderstanding of the decision-making process, some workersmay have not read the scenario carefully, while others mayhave forgotten some details of the description by the time theyevaluated fairness.
To determine the effect of bias against demographic groups,we picked two fixed sets of values: one with very comparableerror rates across groups, and the other with different errorrates between groups. While we picked these bias rates basedon earlier work [12], we did not experiment with differentvalues. Higher or lower error rates for different demographicgroups may change the relative importance of bias versusother factors. Further, while we picked “error rate” to repre-sent algorithmic bias, this is a simplistic representation, andespecially keen participants may have wondered if the errorrate was in favor of or against the groups with the higher errorrates. For example, false positive rates and false negative rateshave completely different implications for people who aresubject to the algorithmic decision making. Future work couldmore carefully isolate different types of error rates betweendemographic groups.
Generally speaking, the scenarios may be very influential indetermining the judgments of fairness. It is possible that otherscenarios (e.g., describing recidivism prediction, hiring, orschool admission) would have led to very different results.We suggest that further work is necessary to understand thegeneralizability of these findings
CONCLUSIONIn this research, we examine the factors that influence people’sperceptions of the fairness of algorithmic decision-makingprocesses using a between-subjects randomized survey onMechanical Turk. We focus our manipulations and analysis onseveral factors: algorithm outcomes, development procedures,and individual differences. We find that people’s evaluationsof fairness are very sensitive to whether or not they receivea positive outcome personally, even surpassing the negativeeffect of describing an algorithm with strong biases againstparticular demographic groups.
ACKNOWLEDGMENTSWe want to thank Zhiwei Steven Wu, Hao-Fei Cheng, andmembers of the GroupLens Lab for their help in this project.This work was supported by the National Science Foundation(NSF) under Award No. IIS-2001851 and No. IIS-2000782,and the NSF Program on Fairness in AI in collaboration withAmazon under Award No. IIS-1939606.
REFERENCES[1] 2019a. Amazon Mechanical Turk. (2019).
https://www.mturk.com/worker/help
[2] 2019b. NSF Program on Fairness in ArtificialIntelligence in Collaboration with Amazon (FAI)(nsf19571). (2019).https://www.nsf.gov/pubs/2019/nsf19571/nsf19571.htm
[3] J Stacy Adams. 1965. Inequity in social exchange. InAdvances in experimental social psychology. Vol. 2.Academic Press, 267–299.
[4] Alekh Agarwal, Alina Beygelzimer, Miroslav Dudík,John Langford, and Hanna Wallach. 2018. A reductionsapproach to fair classification. arXiv preprintarXiv:1803.02453 (2018).
[5] Ifeoma Ajunwa, Sorelle Friedler, Carlos E Scheidegger,and Suresh Venkatasubramanian. 2016. Hiring byalgorithm: predicting and preventing disparate impact.Available at SSRN (2016).https://papers.ssrn.com/abstract=2746078
[6] Julia Angwin, Jeff Larson, Surya Mattu, and LaurenKirchner. 2016. Machine Bias. (May 2016).https://www.propublica.org/article/
machine-bias-risk-assessments-in-criminal-sentencing
[7] C Daniel Batson, Nadia Ahmad, Jodi Yin, Steven JBedell, Jennifer W Johnson, and Christie M Templin.1999. Two threats to the common good: Self-interestedegoism and empathy-induced altruism. Personality andSocial Psychology Bulletin 25, 1 (1999), 3–16.
[8] David Bau, Bolei Zhou, Aditya Khosla, Aude Oliva, andAntonio Torralba. 2017. Network dissection:Quantifying interpretability of deep visualrepresentations. In Proceedings of the IEEE Conferenceon Computer Vision and Pattern Recognition.6541–6549.
[9] Richard Berk, Hoda Heidari, Shahin Jabbari, MichaelKearns, and Aaron Roth. 2018a. Fairness in criminaljustice risk assessments: The state of the art.Sociological Methods & Research (2018).
[10] Richard Berk, Hoda Heidari, Shahin Jabbari, MichaelKearns, and Aaron Roth. 2018b. Fairness in criminaljustice risk assessments: The state of the art.Sociological Methods & Research (2018), 1–24.
[11] Quoctrung Bui. 2017. How Many Americans WouldPass an Immigration Test Endorsed by Trump? The NewYork Times (2017).https://www.nytimes.com/interactive/2017/08/23/
upshot/immigration-quiz-raise-act-trump.html
[12] Joy Buolamwini and Timnit Gebru. 2018. Gendershades: Intersectional accuracy disparities incommercial gender classification. In Conference onFairness, Accountability and Transparency. 77–91.
[13] Pew Research Center. 2016a. Mechanical Turk:Research in the Crowdsourcing Age. (July 2016).https://www.pewinternet.org/2016/07/11/
research-in-the-crowdsourcing-age-a-case-study/
[14] Pew Research Center. 2016b. On Views of Race andInequality, Blacks and Whites Are Worlds Apart. (June2016). https://www.pewsocialtrends.org/2016/06/27/on-views-of-race-and-inequality-blacks-and-whites-are-worlds-apart/.
[15] Alexandra Chouldechova and Aaron Roth. 2018. Thefrontiers of fairness in machine learning. arXiv preprintarXiv:1810.08810 (2018).
[16] Sam Corbett-Davies, Emma Pierson, Avi Feller, SharadGoel, and Aziz Huq. 2017. Algorithmic decision makingand the cost of fairness. In Proceedings of the 23rd ACMSIGKDD International Conference on KnowledgeDiscovery and Data Mining. ACM, 797–806.
[17] Bo Cowgill. 2018. Bias and Productivity in Humans andAlgorithms: Theory and Evidence from ResumeScreening. Columbia Business School, ColumbiaUniversity 29 (2018).
[18] Jeffrey Dastin. 2018. Amazon scraps secret AI recruitingtool that showed bias against women. Reuters (Oct.2018). https://www.reuters.com/article/us-amazon-com-jobs-automation-insight/amazon-scraps-secret-ai-recruiting-tool-that-showed-bias-against-women-idUSKCN1MK08G.
[19] Morton Deutsch. 1985. Distributive justice: Asocial-psychological perspective. Vol. 437. YaleUniversity Press New Haven, CT.
[20] Michael A DeVito, Darren Gergle, and JeremyBirnholtz. 2017. Algorithms ruin everything:#RIPTwitter, folk theories, and resistance to algorithmicchange in social media. In Proceedings of the 2017 CHIConference on Human Factors in Computing Systems.ACM, 3163–3174.
[21] Michael A DeVito, Ashley Marie Walker, and JeremyBirnholtz. 2018. ’Too Gay for Facebook’: PresentingLGBTQ+ Identity Throughout the Personal SocialMedia Ecosystem. Proceedings of the ACM onHuman-Computer Interaction 2, CSCW (2018), 44.
[22] Kristina A Diekmann, Steven M Samuels, Lee Ross, andMax H Bazerman. 1997. Self-interest and fairness inproblems of resource allocation: allocators versusrecipients. Journal of personality and social psychology72, 5 (1997), 1061.
[23] Berkeley J Dietvorst, Joseph P Simmons, and CadeMassey. 2015. Algorithm aversion: People erroneouslyavoid algorithms after seeing them err. Journal ofExperimental Psychology: General 144, 1 (2015), 114.
[24] Berkeley J Dietvorst, Joseph P Simmons, and CadeMassey. 2016. Overcoming algorithm aversion: Peoplewill use imperfect algorithms if they can (even slightly)modify them. Management Science 64, 3 (2016),1155–1170.
[25] Cynthia Dwork, Moritz Hardt, Toniann Pitassi, OmerReingold, and Richard Zemel. 2012. Fairness throughawareness. In Proceedings of the 3rd innovations intheoretical computer science conference. ACM,214–226.
[26] Cynthia Dwork, Nicole Immorlica, Adam Tauman Kalai,and Max Leiserson. 2018. Decoupled classifiers forgroup-fair and efficient machine learning. In Conferenceon Fairness, Accountability and Transparency. 119–133.
[27] Isil Erel, Lea H. Stern, Chenhao Tan, and Michael S.Weisbach. 2018. Research: Could Machine LearningHelp Companies Select Better Board Directors?Harvard Business Review (April 2018).https://hbr.org/2018/04/research-could-machine-learning-help-companies-select-better-board-directors.
[28] Justin Esarey, Timothy C Salmon, and CharlesBarrilleaux. 2012. What Motivates Political Preferences?Self-Interest, Ideology, and Fairness in a LaboratoryDemocracy. Economic Inquiry 50, 3 (2012), 604–624.
[29] Motahhare Eslami, Karrie Karahalios, ChristianSandvig, Kristen Vaccaro, Aimee Rickman, KevinHamilton, and Alex Kirlik. 2016. First I like it, then Ihide it: Folk theories of social feeds. In Proceedings ofthe 2016 CHI conference on human factors incomputing systems. ACM, 2371–2382.
[30] Motahhare Eslami, Kristen Vaccaro, Min Kyung Lee,Amit Elazari Bar On, Eric Gilbert, and KarrieKarahalios. 2019. User Attitudes towards AlgorithmicOpacity and Transparency in Online ReviewingPlatforms. In Proceedings of the 2019 CHI Conferenceon Human Factors in Computing Systems. ACM, 494.
[31] Robert Folger and Jerald Greenberg. 1985. Proceduraljustice: An interpretive analysis of personnel systems.(1985).
[32] Nikolaus Franke, Peter Keinz, and KatharinaKlausberger. 2013. “Does this sound like a fair deal?”:Antecedents and consequences of fairness expectationsin the individual’s decision to participate in firminnovation. Organization science 24, 5 (2013),1495–1516.
[33] Megan French and Jeff Hancock. 2017. What’s the folktheory? Reasoning about cyber-social systems.Available at SSRN (2017).https://papers.ssrn.com/abstract=2910571
[34] Stephen W Gilliland. 1993. The perceived fairness ofselection systems: An organizational justice perspective.Academy of management review 18, 4 (1993), 694–734.
[35] Nina Grgic-Hlaca, Elissa M Redmiles, Krishna PGummadi, and Adrian Weller. 2018. Human perceptionsof fairness in algorithmic decision making: A case studyof criminal risk prediction. In Proceedings of the 2018World Wide Web Conference. International World WideWeb Conferences Steering Committee, 903–912.
[36] Moritz Hardt, Eric Price, Nati Srebro, and others. 2016.Equality of opportunity in supervised learning. InAdvances in neural information processing systems.3315–3323.
[37] Lisa Anne Hendricks, Zeynep Akata, Marcus Rohrbach,Jeff Donahue, Bernt Schiele, and Trevor Darrell. 2016.Generating visual explanations. In European Conferenceon Computer Vision. Springer, 3–19.
[38] Kenneth Holstein, Jennifer Wortman Vaughan, HalDaumé III, Miro Dudik, and Hanna Wallach. 2019.Improving fairness in machine learning systems: Whatdo industry practitioners need?. In Proceedings of the2019 CHI Conference on Human Factors in ComputingSystems. ACM, 600.
[39] George C Homans. 1974. Social behavior: Itselementary forms. (1974).
[40] Youyang Hou, Cliff Lampe, Maximilian Bulinski, andJames J Prescott. 2017. Factors in Fairness and Emotionin Online Case Resolution Systems. In Proceedings ofthe 2017 CHI Conference on Human Factors inComputing Systems. ACM, 2511–2522.
[41] Dan Hurley. 2018. Can an Algorithm Tell When KidsAre in Danger? The New York Times (Jan. 2018).https://www.nytimes.com/2018/01/02/magazine/
can-an-algorithm-tell-when-kids-are-in-danger.html
[42] Joichi Ito. 2016. Society in the Loop ArtificialIntelligence. Joi Ito’s Web (June 2016). DOI:http://dx.doi.org/10.31859/20160623.1937
[43] Anil Kalhan. 2013. Immigration policing and federalismthrough the lens of technology, surveillance, and privacy.Ohio St. LJ 74 (2013), 1105.
[44] René F Kizilcec. 2016. How much information?: Effectsof transparency on trust in an algorithmic interface. InProceedings of the 2016 CHI Conference on HumanFactors in Computing Systems. ACM, 2390–2395.
[45] Jon Kleinberg, Himabindu Lakkaraju, Jure Leskovec,Jens Ludwig, and Sendhil Mullainathan. 2017. Humandecisions and machine predictions. The quarterlyjournal of economics 133, 1 (2017), 237–293.
[46] Jon Kleinberg, Sendhil Mullainathan, and ManishRaghavan. 2016. Inherent trade-offs in the fairdetermination of risk scores. arXiv preprintarXiv:1609.05807 (2016).
[47] Pang Wei Koh and Percy Liang. 2017. Understandingblack-box predictions via influence functions. InProceedings of the 34th International Conference onMachine Learning-Volume 70. JMLR. org, 1885–1894.
[48] Nathan R Kuncel, David M Klieger, and Deniz S Ones.2014. In hiring, algorithms beat instinct. Harvardbusiness review 92, 5 (2014), 32. https://hbr.org/2014/05/in-hiring-algorithms-beat-instinct
[49] Kai Lamertz. 2002. The social construction of fairness:Social influence and sense making in organizations.Journal of Organizational Behavior 23, 1 (2002), 19–37.
[50] Min Kyung Lee. 2018. Understanding perception ofalgorithmic decisions: Fairness, trust, and emotion inresponse to algorithmic management. Big Data &Society 5, 1 (2018), 1–16.
[51] Min Kyung Lee and Su Baykal. 2017. Algorithmicmediation in group decisions: Fairness perceptions ofalgorithmically mediated vs. discussion-based socialdivision. In Proceedings of the 2017 ACM Conferenceon Computer Supported Cooperative Work and SocialComputing. ACM, 1035–1048.
[52] Min Kyung Lee, Ji Tae Kim, and Leah Lizarondo. 2017.A human-centered approach to algorithmic services:Considerations for fair and motivating smart communityservice management that allocates donations tonon-profit organizations. In Proceedings of the 2017CHI Conference on Human Factors in ComputingSystems. ACM, 3365–3376.
[53] Min Kyung Lee, Daniel Kusbit, Evan Metsky, and LauraDabbish. 2015. Working with machines: The impact ofalgorithmic and data-driven management on humanworkers. In Proceedings of the 2015 CHI Conference onHuman Factors in Computing Systems. ACM,1603–1612.
[54] Bruno Lepri, Nuria Oliver, Emmanuel Letouzé, AlexPentland, and Patrick Vinck. 2018. Fair, transparent, andaccountable algorithmic decision-making processes.Philosophy & Technology 31, 4 (2018), 611–627.
[55] Melvin J Lerner. 1974. The justice motive:“Equity” and“parity” among children. Journal of Personality andSocial Psychology 29, 4 (1974), 539.
[56] Brenda Major and Kay Deaux. 1982. Individualdifferences in justice behavior. In Equity and justice insocial behavior. Academic Press, 43–76.
[57] Louise Matsakis. 2016. The Unknown, Poorly PaidLabor Force Powering Academic Research. (Feb. 2016).https://motherboard.vice.com/en_us/article/8q8ggb/
the-unknown-poorly-paid-labor-force-powering-academic-research
[58] Aditya Krishna Menon and Robert C Williamson. 2018.The cost of fairness in binary classification. InConference on Fairness, Accountability andTransparency. 107–118.
[59] Alex P. Miller. 2018. Want Less-Biased Decisions? UseAlgorithms. Harvard Business Review (July 2018).https://hbr.org/2018/07/
want-less-biased-decisions-use-algorithms
[60] Carolina Moliner, Vicente Martínez-Tur, José M Peiró,José Ramos, and Russell Cropanzano. 2013. Perceived
Reciprocity and Well-Being at Work inNon-Professional Employees: Fairness or Self-Interest?Stress and Health 29, 1 (2013), 31–39.
[61] Diana C Mutz and Jeffery J Mondak. 1997. Dimensionsof sociotropic behavior: Group-based judgements offairness and well-being. American Journal of PoliticalScience (1997), 284–308.
[62] Rupert W Nacoste. 1987. But do they care aboutfairness? The dynamics of preferential treatment andminority interest. Basic and Applied Social Psychology8, 3 (1987), 177–191.
[63] Clifford Nass and Youngme Moon. 2000. Machines andmindlessness: Social responses to computers. Journal ofsocial issues 56, 1 (2000), 81–103.
[64] Rachel O’Dwyer. 2018. Algorithms are making thesame mistakes as humans assessing credit scores. (2018).https://qz.com/1276781/algorithms-are-making-the-same-mistakes-assessing-credit-scores-that-humans-did-a-century-ago/.
[65] Emma Pierson. 2017. Demographics and discussioninfluence views on algorithmic fairness. arXiv preprintarXiv:1712.09124 (2017).
[66] Carrie Pomeroy. 2019. How community members inRamsey County stopped a big-data plan from flaggingstudents as at-risk. (Feb. 2019).https://www.tcdailyplanet.net/how-community-members-in-ramsey-county-stopped-a-big-data-plan-from-flagging-students-as-at-risk/.
[67] Forough Poursabzi-Sangdeh, Daniel G Goldstein,Jake M Hofman, Jennifer Wortman Vaughan, and HannaWallach. 2018. Manipulating and measuring modelinterpretability. arXiv preprint arXiv:1802.07810(2018).
[68] Iyad Rahwan. 2018. Society-in-the-loop: programmingthe algorithmic social contract. Ethics and InformationTechnology 20, 1 (2018), 5–14.
[69] Byron Reeves and Clifford Ivar Nass. 1996. The mediaequation: How people treat computers, television, andnew media like real people and places. Cambridgeuniversity press.
[70] Marco Tulio Ribeiro, Sameer Singh, and CarlosGuestrin. 2016. Why should i trust you?: Explaining thepredictions of any classifier. In Proceedings of the 22ndACM SIGKDD international conference on knowledgediscovery and data mining. ACM, 1135–1144.
[71] Lauren A Rivera. 2012. Hiring as cultural matching:The case of elite professional service firms. Americansociological review 77, 6 (2012), 999–1022.
[72] Ismael Rodriguez-Lara and Luis Moreno-Garrido. 2012.Self-interest and fairness: self-serving choices of justiceprinciples. Experimental Economics 15, 1 (2012),158–175.
[73] E Elisabet Rutström and Melonie B Williams. 2000.Entitlements and fairness:: an experimental study ofdistributive preferences. Journal of Economic Behavior& Organization 43, 1 (2000), 75–89.
[74] Gunar Schirner, Deniz Erdogmus, Kaushik Chowdhury,and Taskin Padir. 2013. The future of human-in-the-loopcyber-physical systems. Computer 1 (2013), 36–45.
[75] Daniel B Shank. 2012. Perceived Justice and Reactionsto Coercive Computers. In Sociological Forum, Vol. 27.Wiley Online Library, 372–391.
[76] Linda J Skitka. 1999. Ideological and attributionalboundaries on public compassion: Reactions toindividuals and communities affected by a naturaldisaster. Personality and Social Psychology Bulletin 25,7 (1999), 793–808.
[77] Linda J Skitka, Jennifer Winquist, and SusanHutchinson. 2003. Are outcome fairness and outcomefavorability distinguishable psychological constructs? Ameta-analytic review. Social Justice Research 16, 4(2003), 309–341.
[78] Megha Srivastava, Hoda Heidari, and Andreas Krause.2019. Mathematical Notions vs. Human Perception ofFairness: A Descriptive Approach to Fairness forMachine Learning. arXiv preprint arXiv:1902.04783(2019).
[79] Meng-Jung Tsai, Ching-Yeh Wang, and Po-Fen Hsu.2019. Developing the computer programmingself-efficacy scale for computer literacy education.Journal of Educational Computing Research 56, 8(2019), 1345–1360.
[80] Tom R Tyler. 2000. Social justice: Outcome andprocedure. International journal of psychology 35, 2(2000), 117–125.
[81] Ilja Van Beest and Eric Van Dijk. 2007. Self-interest andfairness in coalition formation: A social utility approachto understanding partner selection and payoff allocationsin groups. European Review of Social Psychology 18, 1(2007), 132–174.
[82] Michael Veale, Max Van Kleek, and Reuben Binns.2018. Fairness and accountability design needs foralgorithmic support in high-stakes public sectordecision-making. In Proceedings of the 2018 CHIConference on Human Factors in Computing Systems.ACM, 440.
[83] Elaine Walster, G William Walster, and Ellen Berscheid.1978. Equity: Theory and research. (1978).
[84] Connie R Wanberg, Mark B Gavin, and Larry W Bunce.1999. Perceived fairness of layoffs among individualswho have been laid off: A longitudinal study. PersonnelPsychology 52, 1 (1999), 59–84.
[85] Ann Wilkinson, Julia Roberts, and Alison E While.2010. Construction of an instrument to measure studentinformation and communication technology skills,experience and attitudes to e-learning. Computers inHuman Behavior 26, 6 (2010), 1369–1376.
[86] Haiyi Zhu, Bowen Yu, Aaron Halfaker, and LorenTerveen. 2018. Value-sensitive algorithm design:Method, case study, and lessons. Proceedings of theACM on Human-Computer Interaction 2, CSCW (2018),194.


![Debating Algorithmic Fairness* - UC Davis School of Law · 2019-11-15 · 2019] Debating Algorithmic Fairness 263 INTRODUCTION Automated risk assessment is the trendy model in the](https://static.fdocuments.in/doc/165x107/5ecec17302646746d80fa835/debating-algorithmic-fairness-uc-davis-school-of-law-2019-11-15-2019-debating.jpg)