Factors Influencing the Selection of Business Majors as ...
200
Louisiana State University LSU Digital Commons LSU Historical Dissertations and eses Graduate School 1990 Factors Influencing the Selection of Business Majors as Perceived by University Business Students. E. Evaline Echols Louisiana State University and Agricultural & Mechanical College Follow this and additional works at: hps://digitalcommons.lsu.edu/gradschool_disstheses is Dissertation is brought to you for free and open access by the Graduate School at LSU Digital Commons. It has been accepted for inclusion in LSU Historical Dissertations and eses by an authorized administrator of LSU Digital Commons. For more information, please contact [email protected]. Recommended Citation Echols, E. Evaline, "Factors Influencing the Selection of Business Majors as Perceived by University Business Students." (1990). LSU Historical Dissertations and eses. 4981. hps://digitalcommons.lsu.edu/gradschool_disstheses/4981
Transcript of Factors Influencing the Selection of Business Majors as ...
Louisiana State UniversityLSU Digital Commons
LSU Historical Dissertations and Theses Graduate School
1990
Factors Influencing the Selection of BusinessMajors as Perceived by University BusinessStudents.E. Evaline EcholsLouisiana State University and Agricultural & Mechanical College
Follow this and additional works at: https://digitalcommons.lsu.edu/gradschool_disstheses
This Dissertation is brought to you for free and open access by the Graduate School at LSU Digital Commons. It has been accepted for inclusion inLSU Historical Dissertations and Theses by an authorized administrator of LSU Digital Commons. For more information, please [email protected].
Recommended CitationEchols, E. Evaline, "Factors Influencing the Selection of Business Majors as Perceived by University Business Students." (1990). LSUHistorical Dissertations and Theses. 4981.https://digitalcommons.lsu.edu/gradschool_disstheses/4981
INFORMATION TO USERS
The most advanced technology has been used to photograph and reproduce this manuscript from the microfilm master. UMI films the text directly from the original or copy submitted. Thus, some thesis and dissertation copies are in typewriter face, while others may be from any type of computer printer.
The quality of this reproduction is dependent upon the quality of the copy submitted. Broken or indistinct print, colored or poor quality illustrations and photographs, print bleedthrough, substandard margins, and improper alignment can adversely affect reproduction.
In the unlikely event that the author did not send UMI a complete manuscript and there are missing pages, these will be noted. Also, if unauthorized copyright material had to be removed, a note will indicate the deletion.
Oversize materials (e.g., maps, drawings, charts) are reproduced by sectioning the original, beginning at the upper left-hand corner and continuing from left to right in equal sections with small overlaps. Each original is also photographed in one exposure and is included in reduced form at the back of the book.
Photographs included in the original manuscript have been reproduced xerographically in this copy. Higher quality 6" x 9" black and white photographic prints are available for any photographs or illustrations appearing in this copy for an additional charge. Contact UMI directly to order.
University M icrofilms In ternational A Bell & Howell Inform ation C o m p an y
3 0 0 N orth Z e e b R oad . Ann Arbor, Ml 48106-1346 USA 313 /761-4700 80 0 /5 2 1 -0 6 0 0
O rder N u m b er 9112228
Factors influencing the selection o f business m ajors as perceived by university business Btudents
Echols, E. Evaline, Ph.D.
The Louisiana State University and Agricultural and Mechanical Col., 1990
UMI300 N. Zeeb Rd.Ann Aibor, MI 48106
FACTORS INFLUENCING THE SELECTION OF BUSINESS MAJORS AS PERCEIVED BY UNIVERSITY BUSINESS STUDENTS
A DissertationSubmitted to the Graduate Faculty of the
Louisiana State University and Agricultural and Mechanical College
in partial fulfillment of the requirements for the degree of
Doctor of Philosophy
inThe School of Vocational Education
byEvaline Echols
B.S., Lee College, 1970 M.Ed., University of Tennessee, 1981
August 1990
ACKNOWLEDGEMENTS When one reaches a goal, it is seldom without the support
and assistance of colleagues, friends, and family. This study is no exception.
The author would like to thank Dr. Michael F. Burnett, major professor and doctoral advisory committee chairman, for his example of excellence in teaching and his expertise in research and statistics. His enthusiasm to do research has been inspiring, and his genuine concern for his students has been reassuring and encouraging.
To Dr. Betty C. Harrison, committee member and friend, the author would like to express appreciation for her time, support, and expertise in research and writing. Special gratitude is expressed to Dr. James W. Trott, committee member and Director of the School of Vocational Education, for his support in providing a teaching assistantship, as well as his guidance in the study.
Appreciation is extended to Dr. William B. Richardson, committee member and Associate Dean of the College of Agriculture, for his consistent support and his willingness to provide summer teaching assistantships in the embryonic stage of the author's program. Dr. John M. Butler, minor professor of Journalism, is also due a special word of thanks for his willingness to share his expertise in journalism and public relations. He has been an excellent role model,mentor, and friend.
The author would like to thank Dr. Paul Conn, President of Lee College, and the Lee College Board of Directors for their assistance in providing a one-year sabbatical leave. Special appreciation is also due Dr. Ollie J. Lee, Vice President and Dean of the College, for his encouragement and motivation to achieve this goal. Dewayne Thompson is also due special thanks for holding down the fort in the Business Department at Lee College in my absence. Other friends and colleagues at Lee College, as well as LSU, have provided words of encouragement when they were needed.
Thanks to Bill and Annette Wilson and their daughters, Regina and Teresa, for not only providing a "home away from home" but a warmth, love, and prayerful support that will not be forgotten soon. The author also wishes to thank others who have shared their homes for briefer periods of time: Dr.Correne Newton, who recruited me to LSU in the summer of 1984; Ronald and Becky Wood; and Becky and Randy Tassin.
Last, but not least, a special thanks to my family for their love and support: my daughter, Sharon; my son Eddie andhis wife, Sherry, and grandsons, Darren and Drew; my four sisters, Wanda, Billie, Marie, and Carolyn; and my brother, W.C. Without their encouragement and patience, this study would not have been possible.
Most of all, I thank God for His strength and guidance to achieve this goal.
TABLE OF CONTENTSACKNOWLEDGEMENTS ........... . . . . . . iiTABLE OF CONTENTS.......................................... ivLIST OF T A B L E S ..............................................XA B S T R A C T .................................................xiiiCHAPTER I ............................................... 1
INTRODUCTION ....................................... 1Statement of the P r o b l e m ................... 10O b j e c t i v e s .................................. 10
CHAPTER I I ............................................. 12REVIEW OF RELATED LITERATURE ..................... 12
Introduction ................................ 12History of Business Teacher Education . . . . 17
The Colonial P e r i o d ................... 17The Early National Period-1775-1860 . . 18The Period from 1860-1900 ........ 18The Period from 1900 to the Modern Era . 20
Business Education: Description, Goals, andObjectives.............................. 21
Present Enrollment Status of Business TeacherE d u c a t i o n .............................. 25
Why Do People Choose Different Majors/O ccupations............................ 27Conceptual Framework of Occupational
C h o i c e ........................... 28
Review of Vocational Choice Theories . . 29The Ginzberg T h eory............... 29The Super T h e o r y ................. 30The Roe T h e o r y ................... 32The Holland T h e o r y ............... 33The Trait-Factor Theory ........... 34
Research on Career Decision Making ......... 34Research on Selection of Teaching as a
Career.................................. 36Freshmen Interest in Teaching Trends from
1966 to 1988 41CHAPTER I I I ............................................. 44
M E T H ODOLOGY ....................................... 44P r o c e d u r e s .................................. 44Population and Sample ........................ 44Instrumentation ................... . . . . . 46Data Collection ............................ 48Data Analysis................................ 49
CHAPTER I V ............................................. 53FINDINGS OF THE S T U D Y ............................ 53
Objective 1 .................................. 53Demographic Characteristics.. .......... 53Academic Majors of Respondents ......... 57
Objective 2 .................................. 61Gender by Groups of M a j o r s ............. 62Marital Status by Groups of Majors . . . 62
v
Population Status Where Respondents WereReared by Groups of Majors . . . . 64
Occupation of Respondents' Parents byMajor G r o u p .................... 66
Age of Respondents by Groups of Majors . 70GPA of Respondents by Groups of Majors . 70
Objective 3 .................................. 74Respondents' Perceived Degree of
Desirability of Various BusinessM a j o r s ........................ 74
Respondents1 Perceptions Regarding theMost Desirable Business Major . . . 76
Objective 4 ............................... 78Mean Perceived Degree of Desirability of
Each Business Major by Groups ofBusiness Majors ................... 78
Objective 5 ............................... 81Perceived Influence of Selected Factors
on Students' Choice of a BusinessM a j o r .......................... 81
Respondents' Perceptions Regarding the Most Influential Factor on Students' Choicesof a Business M a j o r ........... 84
Objective 6 86
Mean Perceived Degree of Influence of Selected Factors on Choice of a Business Major by Groups of Majors
Objective 7 ..................................Perceived Influence of Selected Factors
on Students' Decisions Not to Choose Business Education as a Major . . .
Respondents' Perceptions Regarding the Most Influential Factor on Students' Decisions Not to Choose BusinessEducation as a Major .............
Objective 8 . . . . . ........................Respondents' Perceptions Toward Various
Careers and Business Majors . . . . Respondents' Perception Subscores Toward
Specific Business Majors .........Objective 9 ..................................
Comparison of Overall Perception Mean Scores by Groups of BusinessMajors ............................
Comparison of Mean Perception Subscores Toward Specific Business Majors byGroups of Majors .................Accounting ........................Business Administration ...........Finance ............................
8691
91
9294
96
105108
109
110 110 110 110
vii
General Business ................. 110M a n a g e m e n t .......................... IllMarketing............................ IllOffice Administration/Office
Management...................... IllCHAPTER V .................................................. 115
SUMMARY, FINDINGS, CONCLUSIONS, ANDRECOMMENDATIONS .............................. 115Summary......................................... 115F i n d i n g s ....................................... 117Conclusions and Recommendations ............. 122
R E F E R E N C E S ................................................132APPENDIX A ................................................142
QUESTIONNAIRE AND COVER LETTERS ................. 142APPENDIX B ................................................152
MAJOR G R O U P I N G S ..................................... 152APPENDIX C ................................................154
CLASSIFICATION OF OCCUPATIONS ................... 154APPENDIX D ................................................157
OTHER REASONS FOR SELECTING A M A J O R ................157APPENDIX E ................................................160
OTHER REASONS NOT TO SELECT BUSINESS EDUCATION ASA M A J O R ......................................... 160
APPENDIX F ................................................163OCCUPATION OF MOTHER .............................. 163
viii

APPENDIX G ................................................172OCCUPATION OF FATHER .............................. 172
V I T A ...................................................... 181
LIST OF TABLESTable 1. Age of Respondents........................... 54Table 2. Marital Status of Respondents............... 54Table 3. Population Status of Community Where Respondents
Were R e a r e d ................................ 55Table 4. Grade Point Average of Respondents .......... 56Table 5 - Occupation of P a r e n t s ....................... 58Table 6. Academic Majors of Respondents............... 59Table 7. Majors of Respondents by Groups of Business
Majors .................................... 61Table 8. Gender by Groups of M ajors ................... 63Table 9. Marital Status by Groups of M a j o r s.......... 65Table 10. Population Status Where Respondents Were Reared
by Groups of M a j o r s ....................... 67Table 11. Occupation of Respondents' Mothers by Academic
Major G roups ................................ 68Table 12. Occupation of Respondents' Fathers by Academic
Major Groups ............................ . . . . . 71Table 13. Analysis of Variance of Age of Respondents' by
Groups of Majors ................................ 72Table 14. Analysis of Variance of Respondents' GPA by
Groups of Majors ................................ 73Table 15. Mean Grade Point Average by Groups of Majors 74Table 16. Respondents' Perceived Degree of Desirability
of Various Business Majors ........................ 75
x
Table 17. Respondents' Perceptions Regarding the MostDesirable Business Major .......................... 77
Table 18. Mean Perceived Degree of Desirability of EachBusiness Major by Groups of Majors ............... 80
Table 19. Perceived Influence of Selected Factors onStudents' Choice of a Business Major ............. 83
Table 20. Respondents' Perceptions Regarding the Most Influential Factor on Students' Choices of aBusiness Major ..................................... 85
Table 21. Mean Perceived Degree of Influence of Selected Factors on Choice of a Business Major by Groups ofM a j o r s ............................................. 88
Table 22. Perceived Influence of Selected Factors onStudents' Decisions Not to Choose Business Educationas a M a j o r ......................................... 93
Table 23. Respondents' Perceptions Regarding the Most Influential Factor on Students' Decision Not toChoose Business Education as a Major ........... 95
Table 24. Respondents' Perceptions toward Various Careersand Business M a j o r s .............................. 98
Table 25. Respondents' Perception Subscores TowardSpecific Business Majors .......................... 107
Table 26. Respondents' Overall Perception Scores byGroups of M a j o r s ..................................... 108
xi

Table 27. Analysis of Variance of Overall Perception MeanScores by Groups of Business Majors ............. 109
Table 28. Comparison of Mean Perception Subscores TowardSpecific Business Majors by Groups of Majors . . 112
xii
ABSTRACTThe objectives of this study were to: describe business
majors in Tennessee universities affiliated with the National Association of Business Teacher Education (NABTE), compare the demographic characteristics of business students among groups of majors, determine the perceived degree of desirability of various business majors, determine the perceived influence of various factors on the selection of a college major by business students and groups of business majors, determine why business students did not choose business teacher education as a major, determine student perceptions toward careers and majors, and compare student perceptions toward careers and majors among different groups of business majors.
A researcher designed guestionnaire was administered to a modified cluster sample of 366 business students in six NABTE affiliated universities in Tennessee. Two junior level core business classes at each of the six universities participated in the study.
Findings indicated that the largest number (97 or 2 6.5%) of business students chose Accounting as their major while only 4 (1.1%) chose Business Education. When comparing the five groups of majors, the Management/Marketing group had the largest number of majors (123 or 33.6%).
xiii
Three factors were perceived to be most influential in choosing a business major: (1) potential income, (2) offersbroad job opportunities, and (3) type of work involved in this field. Business students perceived the following three factors as most influential in their decision not to choose business teacher education as a major: (1) potential income,(2) I am not familiar with business education as a major, and(3) the type of work involved in teaching.
The researcher recommends that colleges and universities strengthen their recruitment program in business teacher education, emphasizing the new or different career options available to business education graduates. Further research to determine why students are choosing an Accounting major is recommended.
xiv
CHAPTER I INTRODUCTION
Historically, the goal of business teacher education was to prepare secondary school business education teachers. In the 1990's this goal is restrictive, since secondary school enrollments are declining and the opportunities for business teacher education graduates are expanding. The goal must now include preparing business teachers for positions in all educational settings (Kaliski, 1987).
Calhoun (1981) points out that business education has different emphases at various levels. In colleges and universities, the focus is on development of administrative and managerial competence or on teacher education for business. Junior colleges and vocational schools tend to specialize in job preparation. At the secondary level, a twofold emphasis stresses: (1) academic subject matter intended to develop broad business-economic understandings needed by all responsible citizens and (2) vocational knowledges and skills designed to prepare one for initial employment in a business career.
Milbergs (1982) emphasized the challenge in business education to meet the business needs of the future. He stated that business teachers play a crucial role in preparing students to understand the key issues involved in the transition to the new information technologies pervading all areas of society. Teaching students to be flexible and to
1
2cope with the dynamics of change in the work setting will become more crucial in the 1990s than in previous years.
Clayton (1980) emphasized that the increased demands for students in the world of business and related areas are probably without precedent. Therefore, it is a basic assumption and/or principle that with these demands, there should be a co-existing demand for pre-service and in-service programs to supply students (prospective and experienced teachers) to assist in fulfilling these demands.
In an "Action Plan" by the Policies Commission for Business and Economic Education (1987), suggestions for strengthening business teacher education called for program improvements, professional liaisons, and student recruitment. The concluding statement in the "Action Plan" reminded business educators that "as we work to strengthen our position and to effect positive change at all levels of business education, we must remain aware of the fact that we, as a profession, are only as strong as our business teacher education programs" (p. 11).
In the 1980s, four-year colleges and universities in the United States experienced a trend of decreased enrollments in a number of business teacher education program. According to Calhoun (1983), collegiate level business teacher education programs may be facing the most serious recruitment challenge in their history.
3In a paper presented at the American Vocational
Association Meeting in 1985, Gades emphasized that, in the face of increased demands for students in the world of business, business teacher education enrollments continued to show great declines during the 1980s. In the wake of the declining enrollments in business teacher education, the United States Department of Labor projections of worker needs for the 1980s and 1990s indicate that administrative support employees will comprise the largest single employment group (Maedke, 1982).
Declining enrollments at the public school and college levels are affecting all teacher education programs at a time when competition for the higher education dollar is at its peak. Because of escalating college costs, several colleges of business administration have discontinued business education/office administration programs, contending that such programs are not viewed as basic to the mission of the business school (Calhoun, 1983).
Friedheim (1982) observed that nationwide many programs to prepare future business education teachers were being cut back or eliminated. Disagreements among faculty and administrators, as well as declining enrollments, were blamed for the discontinuance of these programs. Friedheim contended that as a result of these actions it is difficult to fill vacant positions with qualified teachers in business education.
4Business teacher educators are concerned about the
depressing enrollment figures in business teacher education, as well as the number of programs which are being eliminated (Gades and Culver, 1982). In a study conducted by Gades and Culver (1982) to identify some of the problems and solutions, one solution which received high marks was the development of a strong recruitment program. The National Business Education Association Task Force on Critical Issues also included recruiting as one of their critical issues for business teacher education (Hosier, 1984).
Calhoun (1983) stated that public relations responsibilities and strategies have become crucial to the survival of business teacher education, as well as business education in the public schools. New or different career options in business education must be emphasized to attract students to the field. Examples of the broader areas of education to be emphasized are training needs in business, industry, government, medicine, and the military. Quality candidates may be recruited from at least four groups: highschool students, junior college students, college students who have not declared a major, and college students in related fields such as business, economics, or journalism (Calhoun, 1983).
In the face of declining enrollments in business teacher education, the U. S. Department of Education (1986), confirmed that 26% of college freshmen in 1984 indicated
business as their probable major field. Included in this percentage were students enrolling in the area of business administration, which has shown a dramatic increase during the recent past. Caballero and Dickinson (1986) contend that students may be choosing business administration over business teacher education because of the differences in salaries paid by industry and by education.
With rapidly growing enrollments in schools of business, an understanding of the career exploration process may have a significant impact on the design of the business curricula. Greenhaus and Connolly (1982) questioned whether a student's decision to enroll in a business program is based on a careful assessment of personal characteristics or primarily on the perception that jobs in business are more plentiful, lucrative, or socially acceptable than other career options?
The Statistical Report on the Condition of Education (1982) reported that population size is perhaps the single most important factor contributing to enrollment change for each level of schooling. Because of the increase in birth rate following World War II, enrollment at all levels increased rapidly in the 1960s and subsequently declined or stabilized during the 1970s.
According to the Digest of Education Statistics (1987), college enrollment increased more than 40 percent between 1970 and 1980. At the same time, the number of college students going into teacher education programs fell dramatically during
6the seventies. Since 1980, enrollments have risen more slowly. Between 1980 and 1985, enrollment increased only about one percent from 12.1 million to 12.2 million (p. 115).
Enrollment in colleges and universities rose to a record level of 12.8 million in fall 1987 and remained at this high level in 1988. According to Digest of Education Statistics (1989) college enrollment is expected to remain steady through the 1990s because of the high attendance rates of younger age groups and the large number of older students.
The number of bachelor's degrees conferred in the occupational areas has increased and the number of degrees conferred in the traditional liberal arts areas has decreased (Digest of Education Statistics. 1987) .
From 1974-75 to 1984-85, the number of bachelor's degrees conferred in business and management rose by 75 percent. The number of degrees in computer and information services jumped by 672 percent.Of the 979,000 bachelor's degrees conferred in 1984-85, the largest numbers of degrees (233,000) were conferred in the fields of business and management (p. 16).Of the 991,000 bachelor's degrees conferred in 1986-87,
the largest number of degrees (241,000) were in the fields of business and management. At the master's level, the second largest number of degrees (67,000) were in business and management (Digest of Education Statistics. 1989).
7According to the Occupational Outlook Handbook (1986-87)
the number of new graduates available to teach at the secondary level has dropped sharply. Computer programming teachers, as well as science and mathematics teachers, are in short supply because employers in private industry and government offer higher salaries to people trained in these fields.
Cooper (1984) contended that unless more college students went into teaching, the nation could be faced with a teacher shortage within the next few years. Increasing student enrollments in the schools and declining enrollments in teacher education programs in colleges and universities are factors contributing to this trend.
In 1972 the number of graduates from teacher education programs was at an all-time high— 317,000. By 1980, the number had fallen to 154,000, a decrease of 52 percent in just eight years (Cooper, 1984, p. 469).Astin, Green, and Korn (1987) assert that there has been
a dramatic decline over the past 15 years in the proportion of freshmen interested in teacher education. This declining interest in teaching, along with the drop in the overall size of the college-age cohort, suggests a significant decrease in the population of prospective teachers.
One educational reform report (Carnegie Forum on Education and the Economy, 1986) estimated that nearly 1.3 million new teachers will be needed by the 1990s, or nearly
one out of every four new college graduates by 1992. Another report, A Call for Change in Teacher Education, indicated that between 1980 and 1990 the number of 18-year-olds would drop by some 800,000 persons, reducing the overall pool from which teacher educators could be recruited (National Commission for Excellence in Teacher Education, 1985).
Since 1966, the Cooperative Institutional Research Program (CIRP), sponsored by the American Council on Education and UCLA (University of California at Los Angeles) , has surveyed some 6,000,000 freshmen entering postsecondary institutions. Each year around 275,000 students in roughly 550 two-year and four-year colleges have participated in the CIRP freshman survey program. This survey revealed that the number of freshmen interested in teaching careers has declined precipitously. In the fall of 1988, an estimated 144,300 freshmen hoped to pursue careers in teaching, down from an estimated 252,400 freshmen in 1966. This estimate indicated a drop of 43 percent in the number of freshmen interested in teaching between 1966 and 1988 (Opp, 1989).
The 8.8 percent of freshmen interested in teaching careers in 1988 is well below the estimate of the Carnegie Forum that 23 percent of all college graduates will be needed to fulfill the demand for teachers for the nation's classrooms in the 1990s (Carnegie Forum on Education and the Economy,1986). This gap between supply and demand suggests that the
nation may be facing a substantial shortfall of teachers in the 1990s (Opp, 1989).
The correlation between freshmen interest in education majors (as measured by the CIRP survey) and the actual number of undergraduate degrees earned in education (as reported in Higher Education General Information Survey data) is high (.827). This high correlation provides evidence that the CIRP data on freshmen preference for education majors is an accurate predictor of the actual numbers of seniors graduating each year with education as their undergraduate major (Opp, 1989).
Employment of secondary school teachers was expected to decline throughout the 1980s and to start increasing during the early 1990s. The National Center for Education Statistics projects that enrollment in secondary schools will continue to decline through 1990. Enrollments will begin increasing after 1990, reflecting the rise in births beginning in the mid-1970s (cited by Opp, 1989).
Culver (1980) contends that business teacher education has always been subject to the influence of such forces as accrediting agencies, state departments of education, and professional associations. However, many of the forces in the 1980s resulted from political, social, and economic influences and conditions. " Colleges and universities must make sure that they provide quality business teacher education programs which meet the criteria of the agencies and equip the
10graduates of these programs to compete successfully for teaching positions" (Culver, p. 241).
The ability of graduates of business teacher education programs to move with ease between the classroom and business will continue to be a major advantage (Culver, 1980). Therefore, inquiry as to why students are choosing various business majors and why they are not choosing business teacher education is needed.
Statement of the ProblemThe purpose of this study was to identify the factors
which influence students to select various business majors in Tennessee universities with membership in the National Association of Business Teacher Education (NABTE). In addition, the study sought to determine factors which influence student decisions regarding business teacher education.
ObjectivesSpecific objectives of the study were:1. To describe students majoring in business curricula
in National Association of Business Education (NABTE) member universities in Tennessee on selected demographic characteristics.
2. To compare the demographic characteristics of business students among the groups of business majors in NABTE member universities in Tennessee.
113. To determine the degree of desirability of the
various business majors as perceived by business students enrolled in NABTE member universities in Tennessee.
4. To compare the perceived degree of desirability ofbusiness majors among students enrolled in different groups of business majors.
5. To determine the influence of various factors onthe selection of a college major by business students in NABTE member universities in Tennessee.
6. To compare the perceived influence of variousfactors on the selection of a major among students enrolled in different groups of business majors.
7. To determine why business students did not choosebusiness education as a major in NABTE member universities in Tennessee.
8. To determine student perceptions toward careers andmajors in business.
9. To compare student perceptions among differentgroups of business majors in NABTE member universities in Tennessee.
CHAPTER II REVIEW OF RELATED LITERATURE
IntroductionChange is a phenomenon that is an inescapable fact.
Toffler in his book, The Third Wave. (1980) emphasized that failure to change certain things rapidly enough has serious implications and high costs. He referred to three waves of change: the first wave of change which occurred ten thousandyears ago by the invention of agriculture, the second wave which was touched off by the industrial revolution, and the third wave of current times— the information age.
Toffler speaks of the third wave of change "altering the nature of work in factory and office, and ultimately, carrying us toward the transfer of work back into the home" (p. 223). These waves of technological change in our global-competitive society have been highly visible in the office and in business education departments in colleges and schools since the 1960s.
In the 1980s the economy shifted from an industrial to a global information economy. This fundamental change posed important questions for business educators. Many graduates enter the world of work with career assumptions and business skills preparing them for a corporate ladder that no longer exists (Seel, 1985)
Daggett and Branigan (1987) assert that business education programs which were developed during the sixties and seventies responded well to the needs of business and
12
13industry of the industrial era; however, these programs are no longer appropriate responses to the emerging technological society. In order to meet the needs of students and to continue to be relevant through the remainder of the century and beyond, business educators must respond to the metamorphosis occurring in society, according to Daggett and Branigan (1987).
Kaliski (1987) believes the traditional classroom must, of necessity, move outside the walls of the school to the business world. The outside world reflects the changes as they occur and will allow business education programs to survive in the wake of declining enrollments while offering a comprehensive education. The outside world, particularly business and industry, will also serve as learning laboratories for current office technology.
Daggett and Branigan (1987) contend that business education must not only develop broad-based, transferable skills, but must blend business and marketing education. "Students need a multifaceted program to meet the demands of an information/technological age" (p. 13).
The 1970s brought obsolescence of some occupations, the emergence of new occupations, and increased job specialization. Based on labor market data, occupational analysis, and curriculum planning, business educators modified their programs. As a result of occupational analysis, distinctions were made among positions between and
14within job clusters, such as secretarial and general office clerical (Selden and Swatt, 1971). Necessity extended the scope of offerings to include general business administration.
In A Nation at Risk (1983), the National Commission on Excellence in Education emphasized the need for educators to respond to change. According to Seel (1985):
Public education has historically been saddled with the responsibility of meeting social needs— of responding to the greatest concern of the times— in the fifties it was the Russians in space, in the sixties it was social equality, in the seventies everyone was off being narcissistic, and now in the eighties it's global competitiveness. We’re a nation at risk because we can't keep up with the Japanese (p. 4).America would have to turn the clock back a hundred years
(to 1886 when the typewriter first entered the office) to parallel the degree of change since the 1960s in business education. The passage of the Vocational Education Act of 1963, which authorized the use of federal funds for all gainful occupations, was the turning point for business education. Business Education, for the first time, benefited from federal funds to maintain and improve programs (Sculley,1987).
Sculley (1987) criticized the K through 12 education system in America today, saying it is rooted in the industrial
15age economy. He further stated that jobs in the twenty-first century will require thinking skills— the ability to analyze information. He states:
It is very realistic to expect that young people will not have one career but may well have three or four or five careers during their lifetime. It means that education, and especially business education, has a responsibility not to end at the boundaries of the institutions but to be able to extend beyond the boundaries of the institution and become a life-long experience (p. 61).According to Daggett and Branigan (1987), delivery
systems must move past the classroom walls to satellite communications, computer-assisted instruction, television, apprenticeships, and work-study programs. "Creativity, critical thinking, synthesis, application, organization and reference skills, and evaluation and analysis skills are as significant as the 'three R's' in the information/ technological age" (p. 13).
According to Tonne (1961), some educators conclude that the need for change and modification in business education has been the result of (l) the dominant influence toward pressuring the high-ability student into taking more units of science and mathematics; (2) the admission to college by the arbitrary system requiring as many traditional academic subjects as possible; (3) the increased complexity of the
16economic world tending to shift the business education program upward; and (4) the application of automation creating fewer opportunities for the routine worker and more opportunities for the broadly trained person.
The Information Age has transformed the mechanical office into what now is called the "electronic office." The changes in the electronic office are likely to affect most workers in the future (Kupsh and Whitcomb, 1987).
Predictions are that 90 percent of all workers will require a knowledge and understanding of the electronic office to function in their chosen careers. Thus, whether they are office workers or workers in other fields that make use of the electronic office, such as law, medicine, or architecture, people need to acquire the basic skills that are the foundation of the electronic office (Kupsh and Whitcomb, 1987, p. 244).The author questions what implication the electronic
office will have on the future of business teacher education. According to Carley (1985) the curriculum must make provisions to include technological processes as well as maintaining traditional skill and knowledge bases. In order to meet the challenge of the electronic office, Stoufer (1982) identified the following areas of importance: (1) language arts skills,(2) communications skills (oral and written), and (3) word/ information processing systems.
17According to Culver (1980), the challenge of preparing
students to adapt to the changing office environment will be met by providing quality business teacher education programs. Because the secondary and postsecondary schools are the major sources of new office personnel, educational institutions are presented with a tremendous opportunity to prepare competent personnel for the electronic office.
History of Business Teacher Education This section will give a brief historical sketch of
business teacher education, beginning with the colonial period and continuing through the modern era— the 1930s.The Colonial Period
During the colonial period, business-teacher training was given principally by the apprenticeship method or by private instruction (Haynes and Jackson, 1935). Jessie Graham (1933), in her study of the evolution of business education and the training of teachers for this field, sums up the available information as follows:
Little or nothing is known of the educational and practical qualifications of the teachers of business education. . .during this period. It is more than probable that they, like their pupils, depended on private instruction, crude and elementary textbooks, apprenticeship training, and actual experience for learning the relatively simple business procedures demanded by the times. Gradually, however, as
18facilities for the enlargement and exchange of knowledge improved, it is likely that the qualifications of teachers improved also, thus laying the foundation for a more systematic instruction in business knowledge during the next period of our national life (Graham, 1933, p. 23).
The Earlv National Period-1775-1860During the early national period, the principle of public
education had been accepted, and the private schools and academies had led the way for business education. However, there was no formal teacher education program available for prospective business teachers who were preparing to teach in the secondary schools (Haynes, 1935).
Business teachers during this period of history were a heterogeneous group who secured their training in various ways— "in the same type of institution in which they were called upon to teach, in the business office, or through self- instruction" (Haynes, 1935, p. 126).The Period from 1860-1900
The invention of the typewriter in 1867 by Christopher Latham Sholes marked the beginning of a new period in business education at the high school and collegiate levels (Wanous, 1977). By 1871, 23 universities and colleges, located in the Midwest for the most part, were offering commercial-business courses. The Scott-Brown School, New York City, was the first school to offer typewriting in 1878 (Wanous, 1977).
19The first successful collegiate school of business in the
United States was the Wharton School of Finance and Commerce established in 1881 by the University of Pennsylvania (Wanous, 1977). In 1898, both the University of California and the University of Chicago opened their colleges of commerce (Graham, 1933). That same year Drexel Institute of Philadelphia offered the first course for the training of teachers of business subjects. During the next twenty-five years, only thirty-seven schools started courses for "commercial" teachers (Graham, 1933).
In spite of the great increase in the demand for business education teachers during the last forty years of the nineteenth century, no great progress was made in educating teachers for this work (Haynes, 1935). Hill described the situation as follows:
The commercial teachers of those years may be grouped . . . in four classes, not one of which was adequately prepared for the responsibilities of the position.
In the first group were the victims of circumstances who had the teaching of business thrust upon them. They had no specific preparation for their work and often became acquainted with the subjects by keeping two chapters ahead of the classes.
Next we find the high school graduate with a few months of business training in stenography and bookkeeping who entered the profession of commercial teaching for various reasons.
Another type was the product of the university school of business who had an excellent preparation for the higher phases of business activities but who lacked an understanding of the needs of the secondary school, as well as training in teaching methods. . .
The fourth group consisted of graduates of normal schools, who, in addition to the regular normal course, had taken a course or two in business subjects.
.Few, if any, institutions of higher learning offered work designed to prepare for the teaching of business in the secondary schools (cited by Haynes, 1935, pp. 127-128).
The Period from 1900 to the Modern EraAt the opening of the twentieth century, business
teachers were occasionally obtained from the collegiate schools of business. By this time there were some three-year normal schools, which graduated many qualified teachers (Tonne, 1939). However, Tonne states that, in general, normal schools were unable to provide adequate training for business teachers since it was difficult to force more than a few
21technical business courses into a curriculum that was designed primarily for elementary-school teachers (Tonne, 1939).
Little progress was made in providing business teacher education training until the 1920s. Graham, in 1929, found by a search through 685 catalogues of degree-granting institutions in the United States, that 138 of them (20.1%) provided courses in business teacher education (Haynes and Jackson, 1935).
Business Education: Description, Goals, and Objectives Nichols (1933) defined commercial-business education as
"a type of training which, while playing its part in the achievement of the general aims of education on any given level, has for its primary objective the preparation of people to enter upon a business career, or having entered upon such a career, to render more efficient service therein and to advance from their present levels of employment to higher levels” (p. 51).
Tonne (1961) contends that if general education is thought of as the adjustment of the individual to his/her environment, business education must be thought of as the adjustment of the individual to his/her business environment.
Calhoun identified two major objectives of business education: vocational or career preparation, and general or personal-use education (Calhoun, 1980). For those individuals who are planning a career in business or who are already employed in a business career, the goals are:
221. to develop occupational competencies for obtaining
a job and/or advancing in a career2. to adjust to occupational change3. to promote career awareness and exploration preceding
occupational preparation4. to establish a foundation for further study of the
field of business5. to provide knowledge and understanding of the free
enterprise system (Calhoun, p. 4).Calhoun further states that business education goals for
all individuals should relate to:1. promoting career awareness and exploration of business
careers2. preparing students to be competent consumers of goods
and service3 providing a basic knowledge of economics and the free
enterprise system4. developing skills and knowledge needed in managing
personal business affairs5. further competencies of a business nature that have
special supportive value in other professions6. inspiring respect for the value and dignity of honest
work7. providing general business knowledge, skills, and
understanding (pp. 4-5).
23Business education programs are offered in comprehensive
high schools that combine both traditional and vocational offerings, in traditional high schools that focus primarily on academic or college-preparatory programs, and in vocational high schools or centers that offer job-oriented courses (Calhoun, 1980).
The objective of business education in area vocational- technical centers is to prepare students for employment as secretaries, accountants, data processors, office clerks, or managers in business. In addition to practical application skills, students develop basic competencies in business English and communication, psychology, human relations, and business mathematics (Calhoun, 1980).
Business education at the college and university undergraduate level is concerned with preparing teachers for middle school, secondary, and postsecondary levels. Other broad areas of business education at the collegiate level include business administration, accounting, economics, insurance, finance, marketing, office administration, data processing, statistics, and real estate (Calhoun, 1980).
Calhoun (1980) admits that the current emphasis in most business education programs is on salability and transferability of specific applied skills, but that the emphasis is likely to change in years to come as the more salable skills become the more theoretical ones. As career lines have changed from single to serial occupations, workers
24have found that their initial occupation is unlikely to last a working lifetime. These observations emphasize the need to train for entry-level business occupations and, at the same time, to provide a basis for continuing business education (Calhoun, 1980).
The goals and objectives of business education in the 1980s changed rapidly. Daggett and Branigan (1987) contend that the hard, engineering mode of teaching has become antiquated by the computer. Students must be provided opportunities to choose their own style of mastery in a computer culture.
With a multiple-options approach to living in general, students will need a more personalized education to meet individual abilities, values, and goals. . . Students must develop an ability to adapt, to modify, to learn, to relearn, and to adjust to changing circumstances" (Daggett and Branigan, p. 14).Kaliski (1987) points out that the goal of business
teacher education in colleges and universities in the past has been to prepare upper secondary school business education teachers. He contends that such a restrictive role may be inappropriate in the changing society of the eighties and nineties. The primary goal must now be to prepare business teachers for positions in all educational settings— which includes all levels of schools and all other settings in which business teaching skills are required.
25Kaliski (1987) further contends that in addition to
teaching business skills and concepts at all levels from the elementary school through the four-year college and university, business education graduates should be prepared to teach business in such settings as business and industry, prisons, Indian reservations, government-sponsored programs, and mass media.
According to Kaliski (1987), business teacher education graduates should be prepared to be mobile in their careers. He contends that an industry training option or component can serve as a powerful recruiting tool to attract students to business teacher education. Kaliski further asserts that while business educators cannot directly affect social, economic, and demographic trends, they can educate students to watch for these trends and to understand their implications.
Based on the expanded need for business teachers in diverse settings, the researcher will review the present enrollment status of business teacher education programs in the United States.
Present Enrollment Status of Business Teacher EducationVaughn (1988) points out that enrollments in business
teacher education programs declined rapidly in the 1980s. This decline has been seen in secondary schools, as well as postsecondary colleges and universities. This trend is particularly distressing in view of the Occupational Outlook
26Handbook (1985) predictions of increasing demand for secretarial and other support staff employees who receive their training in business education programs.
According to Lydeen (1986) the reasons business education enrollments declined in the 1980s were "demographics, economic trends, educational trends such as the return to the basics, and changes in technology" (p. 46). He further contends that declining enrollment is a myth because, in actuality, the clientele are changing, and business educators have not changed the methods of delivery of education to fit the needs of society. He points out that only teachers who are computer literate, technologically up- to-date, and who are willing to change and adapt their teaching methods will survive.
Dossett and Tucker (1984) write that "the pool of students is continually shrinking because of declining population and the feminist movement and because students are being counseled and encouraged to enter alternate career fields" (p. 7).
According to the U. S. Department of Education, more students are now leaving high school before they graduate than in previous years. These statistics reveal that the national graduation rate declined from 77.2 percent to 72.8 percent between 1972 and 1982. This represents a dropout rate of 27.2 percent. The Digest of Education Statistics (1989) states that the number of high school graduates in 1987-88 totaled
27about 2.8 million, which was a decline from 3.2 million in 1976-77.
Seel (1985) contends that business education enrollments do not have to decline if institutions are willing to change their programs and their methods of delivery of education to fit the changing needs of society. Seel emphasized that articulation between secondary and postsecondary schools is an absolute necessity for this to occur.
Why Do People Choose Different Majors/Occupations?One of the most important career relevant decisions
confronting individuals entering college is the choice of a college major and eventually an occupation. Marks (1972) contends that this educational decision is salient to career development for at least two reasons: (1) the act of choosinga college major and the requirements for making this choice are a clearly identified behavior and environmental condition, respectively; and (2) the choice of a college major tends to limit the number of subsequent career options available to the individual.
The results of Marks' study (1972) of 1,098 new freshmen at Pennsylvania State University indicated that students entering natural science/mathematics programs tend to be oriented more toward the concrete and visible outcomes of an education and a career than are students not choosing this type of program. The study also revealed that nonscience

28students value the interpersonal and usefulness to society outcomes of their educational and vocational pursuits. Conceptual Framework of Occupational Choice
Representatives from three disciplines— psychology, economics and sociology— collaborated in the development of a conceptual framework for occupational choice (Blau, Gastad, Jessor, Parnes, and Wilcock, 1971). The authors emphasized that the function of a conceptual scheme of occupational choice and selection is to call attention to different kinds of antecedent factors— not to develop a systematic theory. The exact relationships between these factors must be determined before a systematic theory can be developed.
According to Blau, Gustad, Jessor, Parnes, and Wilcock (1971) occupational choice is a developmental process that extends over many years. There is no single time when persons decide upon one out of all possible careers, but there are crossroads at which their lives take decisive turns which narrow the range of alternatives and thus influence the ultimate choice of a major or an occupation.
The qualifications and other characteristics of the person do have a direct influence on selection decisions, but so do other factors which are beyond one's control, such as economic conditions and employment policies. Therefore, the process of selection, as well as the process of choice, must be considered when explaining why people end up in various occupations (Blau, Gustad, Jessor, Parnes, and Wilcock, 1971).
29Occupational choice can be conceptualized as "a process
involving a series of decisions to present oneself to employers or other selectors as a candidate for a number of more or less related occupations" (Blau, Gustad, Jessor, Parnes, and Wilcock, 1971, p. 161). The conceptual scheme is not a substitute for theory of occupational choice and selection, but merely a framework for systematic research which can lead to the construction of a theory.Review of Vocational Choice Theories
Bordin, Nachmann and Segal (1962) purport that allvocational choice theories take either one or both of twoviews of the individual— the structural and the developmental. The structural view analyzes occupations within some framework for conceiving personality organization. The developmental view attempts to portray the kinds of shaping experiences that can account for personality organization and concomitant vocational pattern.
Despite the fact that some contemporary writers (Woodring, 1973) feel that many students have no sound reason for being in college, there are many theories regarding motivation for career choice. Several general vocational choice theories are reviewed in an effort to show relatedness and as a universal explanation of the career choicephenomenon.
The Ginzbera Theory. In 1951, Ginzberg developed a theory of career decision-making in which he conceptualized
30vocational choice as a developmental process. Ginzberg's theory contends that parent-child relationships have a direct influence on career choice. The Ginzberg Theory (1951) contains four basic elements:
1. Occupational choice is a developmental process which takes place over a period of years (usually ten).
2. The experience involves time, money and ego and produces change in the individual that cannot be undone.
3. The process of occupational choice results in a compromise between interest, capabilities, opportunities, and values.
4. There are three periods of occupational choice: a fantasy period, a tentative period, and a realistic period. It is an on going process that has different meaning at each period.
Katona, Strumpel and Zahn (1971) support theories that indicate that a child's education is related to the father's occupation. These studies influenced the decision to elicit demographic data regarding the occupation of parents.
The Super Theory. Donald Super (1970) added his contribution to vocational choice theories by naming ten propositions which make up his theory:
1. People differ in their abilities, interest, and personalities.
2. By virtue of the three preceding factors, individuals are qualified for a number of occupations.
313. Each of these occupations requires a pattern of
abilities, interest and personality traits.4. Vocational preference and competencies change with
time and experience, making choice and adjustment a continuous process.
5. The choice making process may be summed up in a series of life stages— growth, exploration (fantasy, tentative and reality), establishment (trial and stable), maintenance, and decline.
6. The nature of the career pattern is determined by several factors, including the individual's parental socioeconomic level, personality characteristics and opportunity,
7. Vocational development can be guided by maturation, reality testing of abilities, and the development of self concept.
8. The process of vocational development involves developing and implementing a self concept.
9. Role playing is often utilized in the process of compromising between individual and social factors.
10. Work satisfactions and life satisfactions depend upon the extent to which individuals find outlets for their abilities, interests, personality traits, and values.
Super also lists the following elements that must be considered when developing a theory of occupational choice: individual differences, multi-potentiality, occupational ability patterns, role models, life states, job satisfaction,
32and individual differences. He considered self-concept as the most important influence in career development. A person selects from a series of alternative occupations the one occupation that is most congruent with his self-concept.
Greenhaus (1971) concluded that high self-esteem persons tend to look at their own needs and relevant attributes in determining the satisfaction with their occupational choice, whereas low self-esteem people look more toward external cues. Since his study included college freshmen and sophomores in various majors, their responses would be considered occupational preferences rather than occupational choices.
The Roe Theory. Anne Roe (1971) postulated that there is a definite link between a person's early experiences and subsequent vocational choice. She outlined five hypotheses to indicate a pattern of early experiences that have different effects on vocational choice:
1. The hereditary bases for intelligence, special abilities, interests, attitudes, and other personality variables seem usually to be nonspecific.
2. The pattern of development of special abilities is primarily determined by the directions in which psychic energy comes to be expended involuntarily. This emphasizes the fact that the things which individuals do automatically are keys to the person's total behavior.
333. Early satisfactions and frustrations play a key role
in the developing pattern of need primacies or relative strengths.
4. The major determinant of the field or fields to which a person will apply himself/herself is the eventual pattern of psychic energies.
5. All accomplishment is based on unconscious as well as on conscious needs. However, it does not imply that these needs are necessarily neurotic.
According to Roe's Theory, vocational choice is not influenced by supply and demand or by aptitude unless this aptitude was nurtured through early experiences and interactions.
The Holland Theory. Holland's theory, (1966) which is based on personality types and the congruence of one's view of self with occupational preferences, assumes that it is useful to assess people in terms of six personality types: (l) realistic, (2) investigative, (3) artistic, (4) social, (5) enterprising, and (6) conventional.
According to Holland, the key variables involved in choosing a vocation included interests, occupational stereotypes, and information about self, careers, and the environment. His theory has been modified over time but is still considered a major conceptual structure for considering choice, persistence, and performance in educational and occupational settings (Herr and Cramer, 1988).
34Holland's theory (1985) views vocational interests as
expressions of personality and contends that individuals will make occupational choices which will place them in environments that are compatible with their predominant personality characteristics. This theory has particular potential for predicting vocational preferences among business students.
The Trait-Factor Theory. In 1909 Frank Parsons advanced his three-stage scientific approach to vocational counseling. Vocational counseling practice was dominated by this Trait- Factor approach of matching individuals to jobs through the early 1950s (Scott, 1983)
The Trait-Factor Theory assumes that a straightforward matching of an individual's abilities and interests with the vocational opportunities can be accomplished, and once accomplished solves the problems of vocational choice for that individual (Osipow, 1973). Many of the well known inventories such as Strong Vocational Interest Blank and the Gilford- Zimmerman Aptitude are based on the Trait-Factor Theory.
Research on Career Decision Making Kotrlik and Harrison (1989) examined the career decision
making patterns of 3,858 high school students in Louisiana. The findings of this study focused on persons and factors that influenced students in individual secondary vocational programs (which included business education). The data revealed that the persons who had the greatest influence on
35the students' career decisions were the mother, father, person in the occupation, and friend, in that order. Of the 330 business students who participated in the survey, almost one- half (46.9%) indicated that their business and office occupations teacher had influenced their career decision.
The most influential factors in selecting a career, according to Kotrlik and Harrison's study (1989), were "interest in this work," "working conditions," "personal satisfaction," and "salary or wages," in that order. In addition to these factors, the 330 business students also rated the following factors as influential in their career decisions: "availability of jobs," "work experience," and"status and reputation of occupation." The influence on their career decisions by friends, parents, or relatives working in the profession was substantially low (36.2 %).
Martin and Bartol (1986) state that relatively little research has focused on predicting vocational choices among business students. Their reason for this is that business students typically also choose an area of concentration such as finance, marketing, etc. Their area of concentration then serves as a primary basis for the types of positions they seek upon graduation and, therefore, more adequately defines their future career direction. Unfortunately, theories which hold some promise of facilitating such concentration choices among business students have not been adequately tested among specialties within business.
36In 1986, Martin and Bartol did a study with 168 new
master of business administration enrollees (96 males and 72 females) who declared an MBA concentration in one of the following six areas: accounting, finance, informationsystems, management, management science/operations research, or marketing. Preferences for the six Holland personality categories were measured using the Vocational Preference Inventory (Holland, 1978). The results of this investigation support Holland's theory as a significant predictor of concentration area among MBA students.
The results of Williams' (1972) study of male graduate students in 18 departments at the University of North Dakota were found to be generally consistent with the theoretical formulations for each category of Holland's classification system and appeared to be significantly related to occupational choice, as indicated by their major area of concentration. These findings provided support for the theory that a person, when choosing a major area of concentration or making a career choice, searches for environments which satisfy personal needs and orientations (Holland, 1966).
Research on Selection of Teaching as a Career Berry (1986) states that most researchers and policy
makers attribute the cause of the problems in the teacher labor market to: (l) low salaries relative to otheroccupations, (2) the opening of career alternatives to women and minorities, (3) few incentives and the lack of career
37advancement within the occupation, and (4) the social respect for teachers. Intuitively, this assessment is correct. However, Berry's study of the career expectations of noneducation college seniors revealed the lack of financial reward in teaching to be the less influential factor in their decisions not to teach.
Berry's (1986) study included eighty students in the major fields of business, chemistry, math, engineering, social science, and biology. Business students, more than others in the study, expected their degree choice to secure financial security and wealth for them. Therefore, low salaries and lack of career advancement within teaching inhibited them from considering a career as a public school teacher. However, other factors may have been more influential in their decision not to teach. For example, some business students, especially those who were average achievers, chose their career primarily because of child or teenage work experiences. Other business students, especially those who were high achievers, chose their career primarily because of the expectations of their parents (who were in business themselves).
Further, Berry's case study revealed that college students from different backgrounds— distinguished by their gender, socioeconomic status, or institution attended— could be influenced to teach. Female students were more likely to consider teaching because the present work life of teachers
38(when compared to business and industry) is more conducive to rearing a family.
The study of Berry (1986) also revealed that college students who came from rural or lower socioeconomic backgrounds were encouraged by both their communities and their parents to find a "good job not too far from home." On the other hand, some college students from urban and upper- middle socioeconomic backgrounds were encouraged by their parents and their teachers to pursue academic, intellectual, and/or professional careers.
While Berry's study did reveal how background variables may set the conditions for these college students to consider teaching as a career alternative, more often than not, other variables appeared to be more influential. The public school experiences of college students may have the most influence on their perceptions of the teaching profession and their unwillingness to consider teaching as a career. In some cases, their negative lessons about teaching as a career were taught through the experiences of their teachers, as well as their high school counselors. In other cases, these negative lessons were taught through their own social experiences in school. More importantly, Berry's study revealed that the brightest of these students had been taught that public school teaching is not an occupation which will allow one to use his or her analytical or creative abilities.
39Johnson (1986) studied a total of 415 students enrolled
at Eastern Michigan University in the College of Education and the College of Business to determine differences between students selecting teaching as a career and students selecting business as a career. The study was organized around three areas: academic differences, demographic differences, andmotivational differences.
The results of Johnson's study revealed no statistically significant difference in university grade point average (GPA) between the candidates for degrees in College of Education and candidates for degrees in the College of Business.
Jantzen (1981) did five surveys (in 1946, 1949, 1951,1956, and 1979) of college students who were preparing to become teachers, to discover why they chose teacher education as a major. He wanted to find out if the factors that influenced their decision to teach were "income," " the possibility for advancement," " the desire to serve others," or were there other reasons.
Of the population that responded to the 1979 survey, 79% were women while 21% were men. In the 1979 survey, 95% of women selected an "interest in dealing with children" as a reason for teaching— a significant upward shift from earlier surveys. Other upward shifts for women involved selection of "lifelong opportunity to learn," "an opportunity for individual initiative," "enthusiasm of a former teacher," " service to mankind," and " ethics of the teaching
40profession." On the other hand, in the 1979 survey approximately one-fourth (24%) of the women selected the item "a reasonable assurance of an adequate income," as their reason for choosing to teach, which was a downward shift from the earlier surveys.
During each of the five surveys the men rated "interest in children" the number-one item, but the 1979 percentage rating for this item was higher than in previous surveys. The "enthusiasm of a former teacher" category ranked fourth in the last of the surveys, 1979, with a one percent upward trend of significance. Downward shifts in the 1979 survey at the one percent level included "a summer for travel, study, and relaxation" and "a reasonable assurance of an adequate income."
Vaughn's (1988) study of students majoring in business education in three Texas universities revealed the following reasons for choosing this major:
Like business courses (59.7%)Interesting work (58.1%)Opportunities for advancement (46.2%)Plentiful jobs (41.1%)Good salaries (34.4%)Other (10.7)Approximately one-half (51%) of the business education
students in Vaughn's study were influenced in their career decision by friends or acquaintances who were working or
41majoring in this field, while 49% were influenced by parents and other relatives. High school business teachers also played a significant part in helping students make career choices.Freshmen Interest in Teaching Trends from 1966 to 1988
According to Opp (1989), data from CIRP (Cooperative Institutional Research Program) research indicates that the number of all freshmen females interested in teaching has decreased by over one-half (from 33.4% in 1966 to 13.3% in1988). Among all freshmen males, the percentage interested in teaching has decreased by over two-thirds (from 10.9% in 1966 to 3.4% in 1988). Opp asserts that the steep decline in interest in teaching among freshmen women reflects, among other things, the increase in other career opportunities for women. These trends suggest that teaching can no longer count on a "captive" labor force of talented women to ease the impending shortage of teachers (Sedlak and Schlossman, 1986). Also, the even steeper decline of interest in teaching careers among freshmen men suggests that there will be even fewer male role models in classrooms of the future.
Since males interested in teaching have traditionally preferred to teach at the secondary level, the declining interest in teaching among freshmen males will undoubtedly exacerbate the shortage of teachers at the secondary level (Opp, 1989).
42Among freshmen attending universities, the percentage
interested in teaching has declined by almost three-quarters (from 16.2% in 1966 to 4.3% in 1988). Among freshmen attending four-year colleges, the percentage interested in teaching has declined by over one-half— from 23.3% in 1966 to 10.9% in 1988 (Opp, 1989).
Opp (1989) believes the dramatic decline in interest in teaching among freshmen attending universities is a cause of some concern. Perhaps this trend is a reflection of Weavers' finding that "talent follows opportunity" (Weaver, 1981).
According to Opp, freshmen interest in teaching has declined both for probable education and arts or science majors. The percentage of freshmen with probable majors in education who are interested in teaching has declined very little (from 83.3% in 1966 to 81.1% in 1988). Among freshmen with probable majors in an arts or science, the percentage interested in teaching has declined by over four-fifths (from 24% in 1966 to 4.1% in 1988) (Opp, 1989).
Since both the Holmes Group and the Carnegie Forum have called for the elimination of the undergraduate major in education (Holmes Group, 1986; Carnegie Forum on Education and the Economy, 1986), the dramatic decrease in the percentage of arts or science majors interested in teaching has profound implications for the profession. Conventional wisdom suggests that majoring in an arts or science major is better subject- matter preparation than majoring in education. However, some
43teacher educators argue that there is little difference between the education and the arts or science major in subject-matter preparation (Jacobson, 1986).
Some teacher educators are concerned that eliminating the undergraduate education major may serve to exacerbate the impending shortage of teachers (Opp, 1989). Research has indicated that students who major in education tend to remain in education from the freshman to senior year (Astin and Panos, 1969). If teacher education students are forced to major in an arts or science major rather than education, this may have an influence on the number of college students interested in pursuing a teaching career.
The literature supports the premise that students choose different majors and careers for various reasons, and that fewer students are choosing to major in business teacher education today than in the past. The findings of this study, as reported in Chapter IV, will address factors that influenced major/career decisions in business and perceptions of various business majors.
CHAPTER III METHODOLOGY Procedures
This descriptive study addressed the factors which influence students to select various business majors in Tennessee universities with membership in NABTE (National Association of Business Teacher Education). In addition, the study sought to determine factors which influence student decisions regarding business teacher education.
This section describes the procedures for : (1)identifying the population and sample of the study, (2) developing and field testing the instruments, (3) collecting the data, and (4) analyzing the data.
Population and SampleThe target population for this study was junior level
students in business-related majors at universities with membership in the National Association of Business Teacher Education (NABTE) in Tennessee. Junior level students were chosen, since most students are committed to a specific major by the time they reach their junior year. Universities affiliated with the National Association of Business Teacher Education (NABTE) were selected because NABTE is the primary professional association for business teacher educators.
Using Cochran's sample size determination formula (Snedecor & Cochran, 1977), the minimum required sample size
44
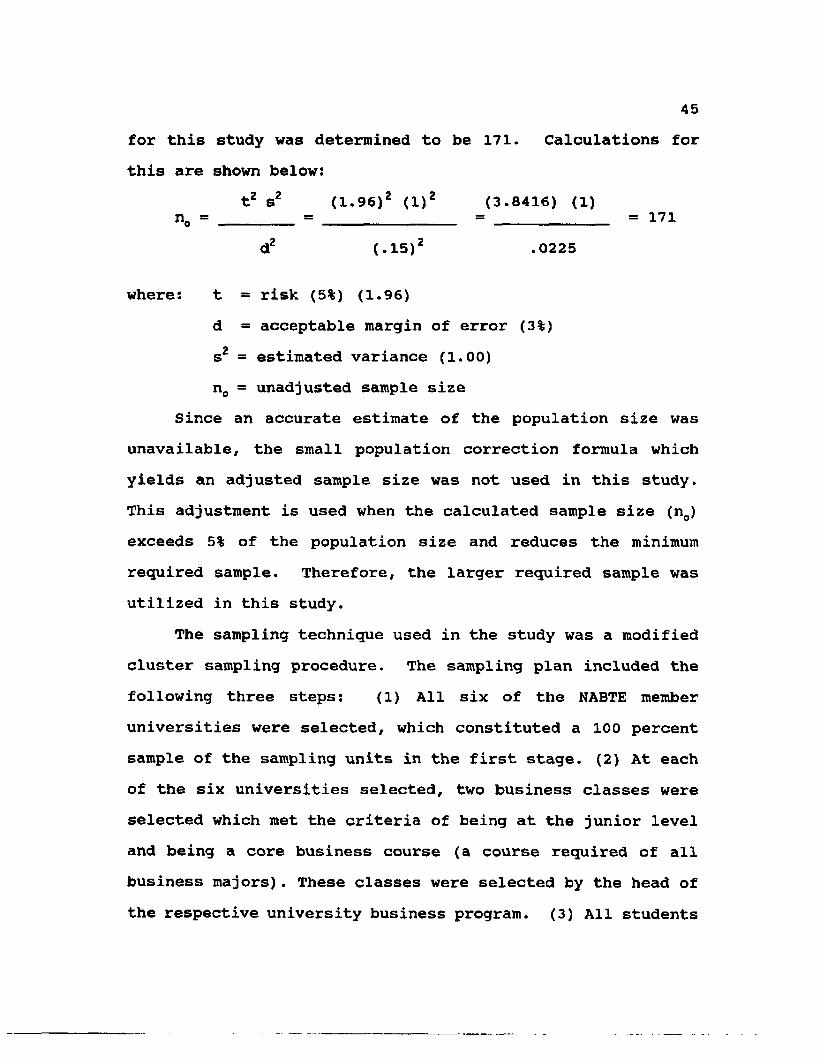
45for this study was determined to be 171. Calculations for this are shown below:
t2 s2 (1.96)2 (l)2 (3.8416) (l)n0 = ________ = ______________ = _____________ =171
d2 (.15)2 .0225
where: t = risk (5%) (1.96)d = acceptable margin of error (3%) s2 = estimated variance (1.00) n0 - unadjusted sample size
Since an accurate estimate of the population size was unavailable, the small population correction formula which yields an adjusted sample size was not used in this study. This adjustment is used when the calculated sample size (n0) exceeds 5% of the population size and reduces the minimum required sample. Therefore, the larger required sample was utilized in this study.
The sampling technique used in the study was a modified cluster sampling procedure. The sampling plan included the following three steps: (l) All six of the NABTE memberuniversities were selected, which constituted a 100 percent sample of the sampling units in the first stage. (2) At each of the six universities selected, two business classes were selected which met the criteria of being at the junior level and being a core business course (a course required of all business majors). These classes were selected by the head of the respective university business program. (3) All students
46present on the day of data collection in the two identified classes in each university were included in the sample.
Data were collected from 366 business students at the junior level who were present on the day the researcher visited the campus and collected the data in the selected core business classes. These business students were selected as the sample by the head of business without any knowledge of their specific majors in business.
InstrumentationThe review of literature revealed no instrument
available that accomplished the objectives of this study. Therefore, the instrument used was a researcher designed questionnaire (see Appendix A) . However, parts of the questionnaire were patterned after a related study which was done at Virginia Tech, entitled A Model for Determining the Effectiveness of Vocational and Technical Recruiting Methods (Heath, 1980). The instrument designed by Heath was designed to determine recruitment methods which attracted students into teacher education programs within the areas of Agricultural Education, Industrial Arts Education, and Marketing and Distributive Education. Another related study done by Gades (1985) addressed the most effective recruiting practices for business teacher education programs, and also included several questions to determine the present status of business education programs and trends in these programs.
47The research instrument developed by this researcher
consisted of three parts. Part I asked questions which were designed to determine respondents' specific choice of major, their perceptions of the degree of desirability of the various business majors, and factors which influenced his/her choice of major. The desirability scale employed a 5-point Likert- type scale with "1" indicating lowest desirability and "5" indicating highest desirability. The influence scale used a 5-point Likert-type scale with "1" indicating lowest importance and "5" indicating highest importance.
Part II of the instrument asked questions which dealt with general perceptions regarding careers in business. A Likert-type scale of "1" to "5" was used, with "l" indicating strongly disagree and "5" indicating strongly agree. Part III included questions regarding demographic characteristics.
The content validity of the instrument was established using a panel of experts. This panel consisted of vocational teacher educators at Louisiana State University, a representative from the Louisiana State Department of Education, and experts in business teacher education throughout the United States. These experts included National Business Education Association (NBEA) Executive Officers and Board Representatives from each of the five regions of the United States, twelve representatives from the National Association of Business Teacher Education (NABTE), and a
48department chair and faculty member from a university in Georgia.
During the spring of 1989, the same representatives from NBEA and NABTE who were involved in validating the instrument were asked to field test the instrument by administering the questionnaire to a sample of their business students. A total of 54 responses were received and served as a field test of the instrument. Suggestions made by the panel of experts and results of the field test were used by the researcher in making needed revisions to the instrument. The Cronbach's alpha procedure was used to assess the reliability of the instrument from the field test data. The overall reliability was determined to be a=.80. Moore (1983) states that reliability coefficients above .80 generally indicate good consistency.
After the revisions were made on the research instrument, a revised copy was submitted to the researcher's doctoral committee members for individual review before the final draft of the questionnaire was prepared for administration to business students in the six universities.
Data CollectionIn the spring of 1989, the researcher contacted the head
of the business program at each of the six NABTE affiliated universities in Tennessee by telephone to obtain permission to conduct the study in each of these universities in the fall of 1989. The researcher requested that the head of the
49business program at each of the six universities select two core business classes at the junior level to be surveyed. A follow-up letter and a copy of the questionnaire were sent to each faculty member whose class was being surveyed. A definite date in September or October, 1989, was established for the researcher to visit each university to collect the data. The week of the visit, the researcher made one additional contact by telephone to each participating faculty member to reaffirm the date for data collection.
The researcher visited the six NABTE institutions in Tennessee and collected the data during the fall (September and October) of 1989. The students completed thequestionnaire in approximately 25 minutes.
When the instrument was administered, the questionnaire was distributed, instructions reviewed with the students, and the importance of the completion of all items emphasized. A total of 366 business students who were enrolled in a core business class at the junior level at six Tennessee universities participated in the survey.
Data AnalysisThe alpha level was set at .05 a priori. Procedures for
statistical analyses were as follows:1. The subjects were described on the variables of
major, age, gender, marital status, the population status where they were reared, grade point average (GPA), and occupation of parents. Variables which are measured on a
50nominal scale (major, gender, marital status, population status of where they were reared, and parents' occupations) were summarized using frequencies and percentages. Variables which are measured on an interval scale (age, GPA) were summarized using means and standard deviations.
In addition, the majors were grouped into five groups of related areas. These groupings were based on headings common to business programs at the college and university level, and were validated from administrative structures as listed in catalogs at seven colleges and universities. These groupings of majors were then summarized using frequencies and percentages.
2. Demographic variables which are measured on a nominal scale were compared among the groups of majors using the Chi Square procedures. Those variables that are measured on an interval scale were compared using analysis of variance (ANOVA) with Tukey's procedures as the posthoc multiple comparison test utilized as appropriate.
3. Overall means and deviations for each of the identified majors were calculated and were presented in descending order of the mean desirability value. In addition, the frequency and percentage of majors identified as the most desirable major were presented.
4. The mean degree of desirability of each major was calculated for each group of majors. In addition, the greatest degree of difference among these groups was
51determined for each major. The group means were presented for each major in descending order of the greatest degree of difference. No statistical comparisons were made on these items to avoid excessive inflation of experiment-wise error. However, a scale of practical significance difference was established by the researcher to use in interpreting this data.
5. Overall means and deviations for each of the identified factors were calculated and were presented in descending order of the mean influence value. In addition, the frequency, and percentage, of factors identified as the most influential factor were presented.
6. The mean degree of influence of each factor was calculated for each group of majors. In addition, the greatest degree of difference among these groups was determined for each factor. The group means were presented for each factor in descending order of the greatest degree of difference. No statistical comparisons were made on these items to avoid excessive inflation of experiment-wise error. However, a scale of practical significance was established by the researcher to use in interpreting this data.
7. Overall means and deviations for each of the identified factors which influenced students not to select business education were calculated and were presented in descending order of the mean influence values. In addition,
52the frequency and percentage of factors identified as the most influential factor were presented.
8. Part II of the questionnaire included 88 statements about the various majors to which respondents were asked their extent of agreement. Approximately half of the items were worded favorably and half were worded unfavorably. A mean score was calculated for each of the 88 items, and the mean scores were presented in descending order. Then those items worded unfavorably (reverse scale) were recoded such that all the items had the higher values associated with those statements which had been determined as reflecting favorable perceptions.
An overall perception score was then calculated toward business majors. In addition, items dealing with specific majors were grouped into subscores, and the means and standard deviations of each of the subscores were presented in descending order.
9. The overall mean perception score and the subscores for the majors were then calculated for each of the groups of majors represented by respondents. The scores (overall and subscores) among the groups of majors were then compared statistically using the ANOVA procedures with Tukey's posthoc multiple comparison. To minimize the problem of inflation of experiment-wise error, the alpha level of .01 was used for these analyses.
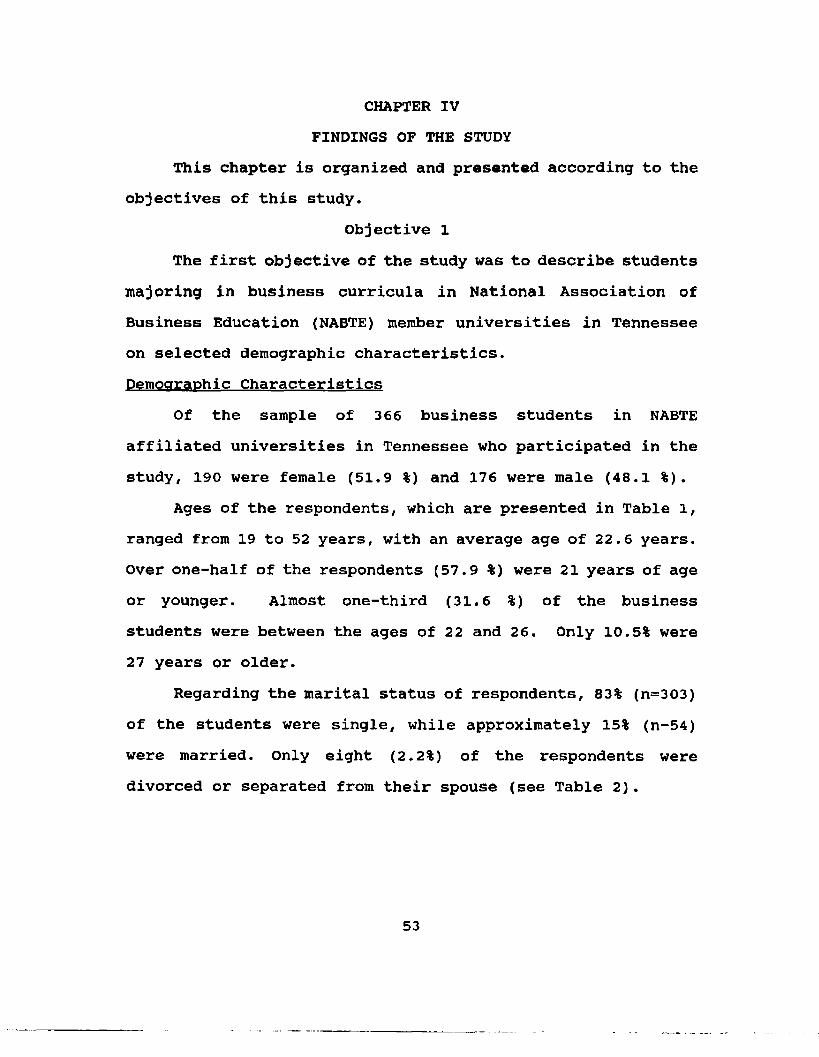
CHAPTER IV FINDINGS OF THE STUDY
This chapter is organized and presented according to the objectives of this study.
Objective 1The first objective of the study was to describe students
majoring in business curricula in National Association of Business Education (NABTE) member universities in Tennessee on selected demographic characteristics.Demographic Characteristics
Of the sample of 366 business students in NABTE affiliated universities in Tennessee who participated in the study, 190 were female (51.9 %) and 176 were male (48.1 %).
Ages of the respondents, which are presented in Table l, ranged from 19 to 52 years, with an average age of 22.6 years. Over one-half of the respondents (57.9 %) were 21 years of age or younger. Almost one-third (31.6 %) of the businessstudents were between the ages of 22 and 26. Only 10.5% were 27 years or older.
Regarding the marital status of respondents, 83% (n=303) of the students were single, while approximately 15% (n-54) were married. Only eight (2.2%) of the respondents were divorced or separated from their spouse (see Table 2).
53
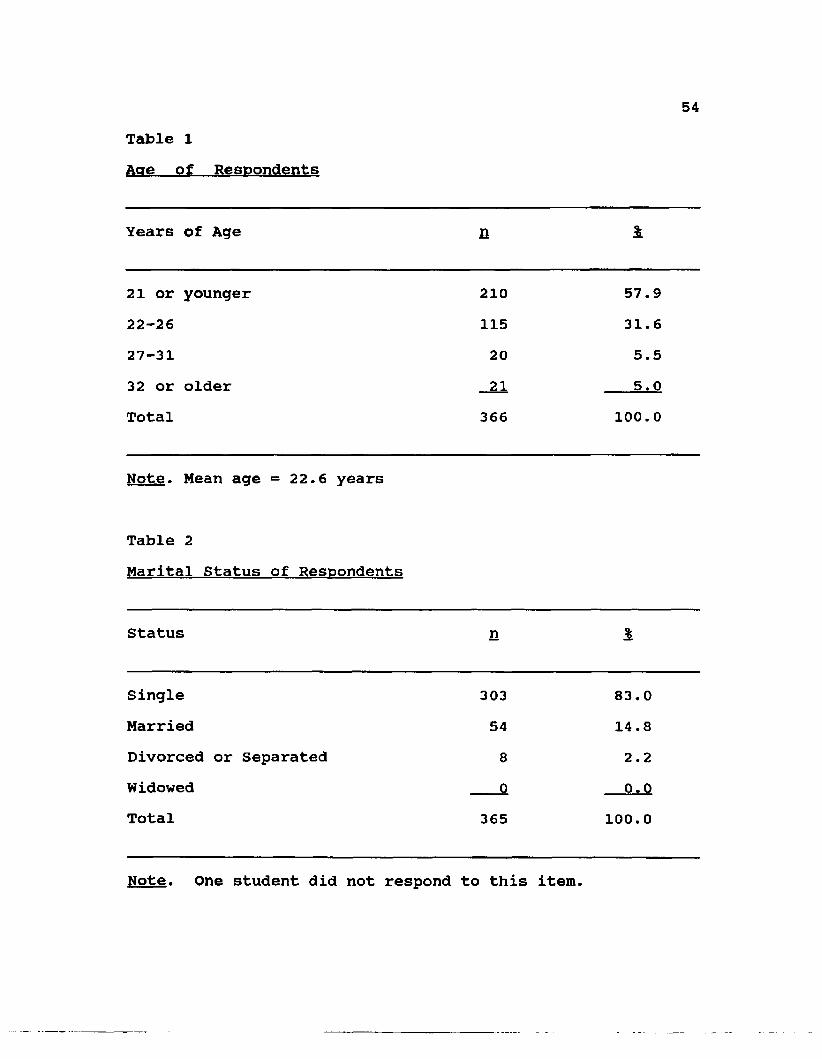
54Table 1Age of Respondents
Years of Age n 1
21 or younger 210 57.922-26 115 31.627-31 20 5.532 or older 21 5.0Total 366 100.0
Note. Mean acre = 22.6 vears
Table 2Marital Status of Respondents
Status n 1
Single 303 83.0Married 54 14.8Divorced or Separated 8 2.2Widowed 0 0.0Total 365 100. 0
Note. One student did not respond to this item.
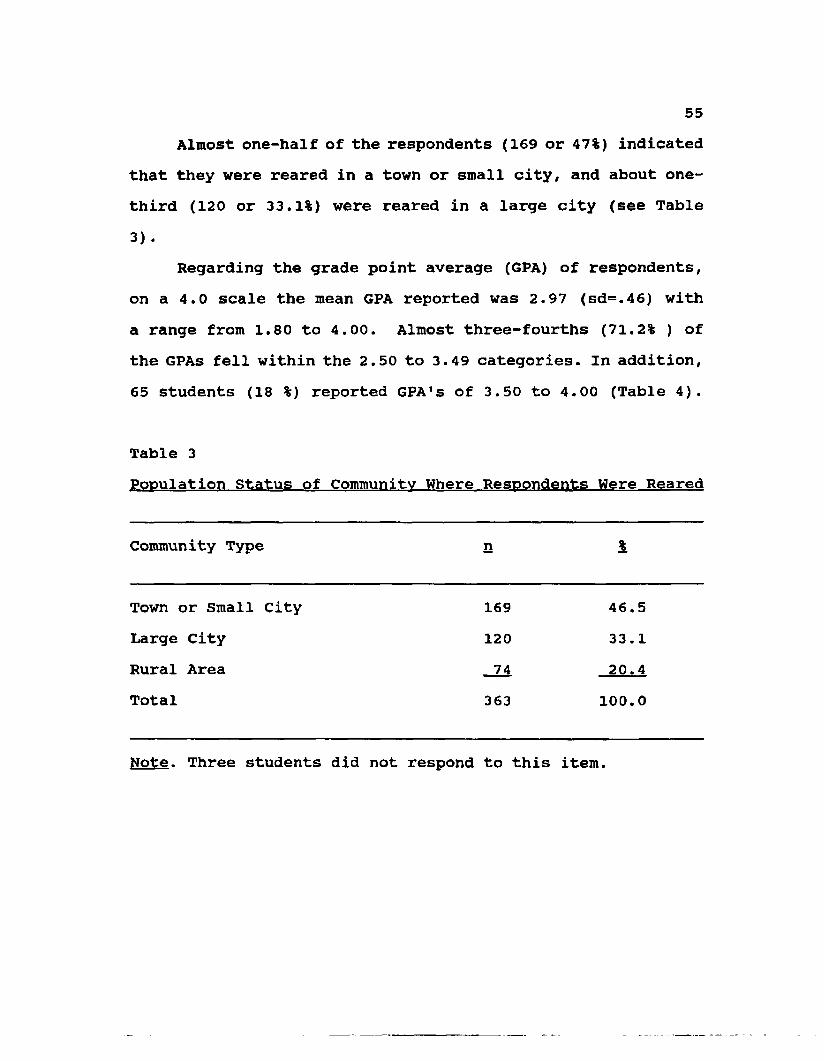
55Almost one-half of the respondents (169 or 47%) indicated
that they were reared in a town or small city, and about one- third (120 or 33.1%) were reared in a large city (see Table 3) .
Regarding the grade point average (GPA) of respondents, on a 4.0 scale the mean GPA reported was 2.97 (sd=.46) with a range from 1.80 to 4.00. Almost three-fourths (71.2% ) of the GPAs fell within the 2.50 to 3.49 categories. In addition, 65 students (18 %) reported GPA's of 3.50 to 4.00 (Table 4).
Table 3Population Status of Community Where Respondents Were Reared
Community Type n i
Town or Small City 169 46.5Large City 120 33.1Rural Area 74 20.4Total 363 100.0
Note. Three students did not respond to this item.
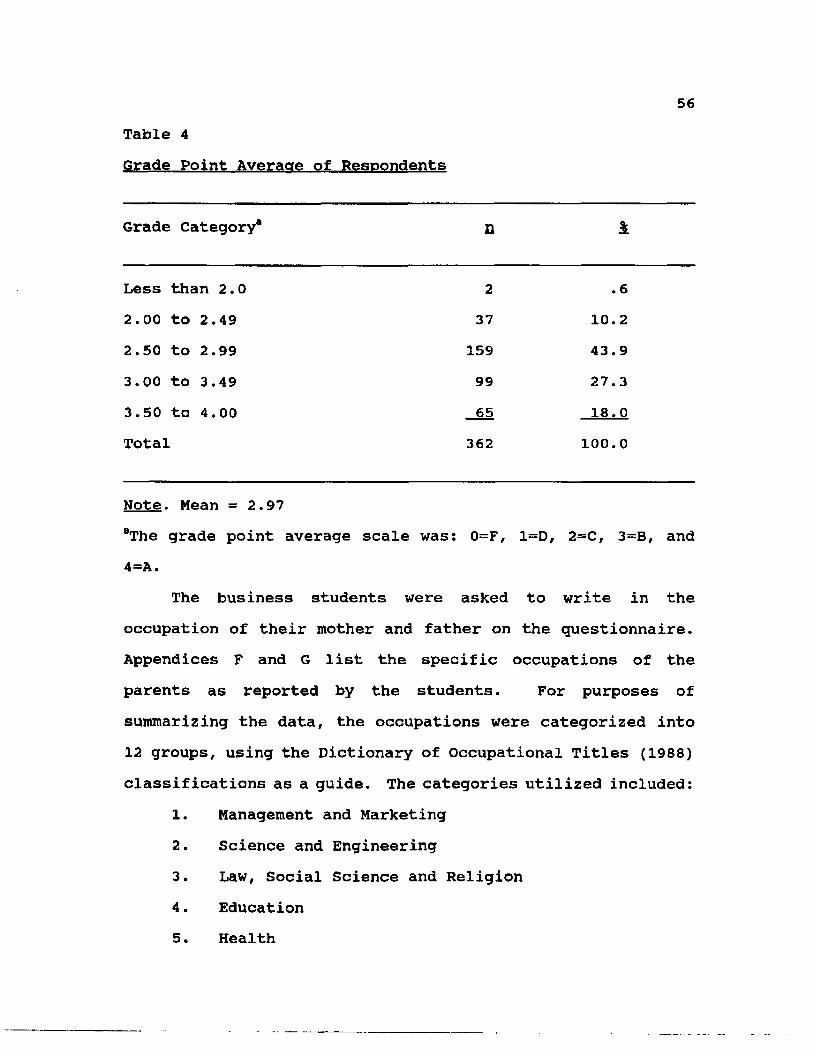
Table 4Grade Point Average of Respondents
56
Grade Category* a £
Less than 2.0 2 .62.00 to 2.49 37 10.22.50 to 2.99 159 43.93.00 to 3.49 99 27.33.50 to 4.00 65 18.0Total 362 100. 0
Note. Mean = 2.97“The grade point average scale was: 0=F, 1=D, 2=C, 3=B, and 4=A.
The business students were asked to write in the occupation of their mother and father on the questionnaire. Appendices F and G list the specific occupations of the parents as reported by the students. For purposes ofsummarizing the data, the occupations were categorized into12 groups, using the Dictionary of Occupational Titles (1988) classifications as a guide. The categories utilized included:
1. Management and Marketing2. Science and Engineering3. Law, Social Science and Religion4. Education5. Health
576. Communications7. Administrative Support8. Service and Agriculture9. Production and Transportation10. Mechanics and Construction11. Armed Forces12. RetiredOver one-third (127 or 38.7%) of the respondents
indicated that their father's occupation was in the Management/Marketing area, as compared to 16.1% of the mother's in this same area. Approximately 50% of the respondents' mother was employed in two areas: (1) Serviceand Agriculture (101 or 29.5%), and (2) Administrative Support (67 or 19.6%). Forty-four (12.9%) of the respondents' mothers were employed in Education, while only 11 (3.4%) of thefathers were in this category.
With the exception of the Armed Forces category, the occupation category with the least number of parents (mothers and fathers) represented in employment was the area of communications (see Table 5).Academic Majors of Respondents
Data regarding the choice of academic major of students in the study are presented in Table 6. The major reported by the largest number of students was Accounting with 97 or 26.5%. In addition, each of the majors, Management and
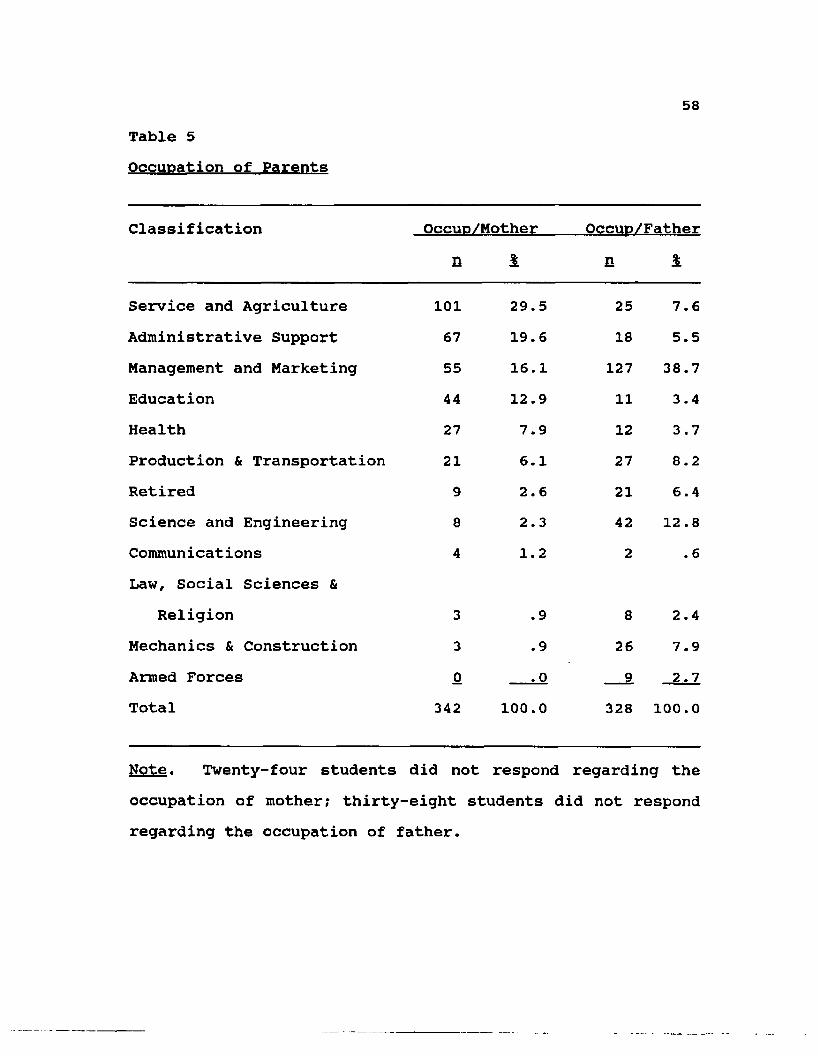
58Table 5Occupation of Parents
Classification Occuo/Mothe r Occuo/Fathern £ n £
Service and Agriculture 101 29.5 25 7.6Administrative Support 67 19.6 18 5.5Management and Marketing 55 16.1 127 38.7Education 44 12.9 11 3.4Health 27 7.9 12 3.7Production & Transportation 21 6.1 27 8.2Retired 9 2.6 21 6.4Science and Engineering 8 2.3 42 12 .8CommunicationsLaw, Social Sciences &
4 1.2 2 .6
Religion 3 .9 8 2.4Mechanics & Construction 3 .9 26 7.9Armed Forces 0 .0 9 2.7Total 342 100.0 328 100.0
Note. Twenty-four students did not respond regarding the occupation of mother; thirty-eight students did not respond regarding the occupation of father.
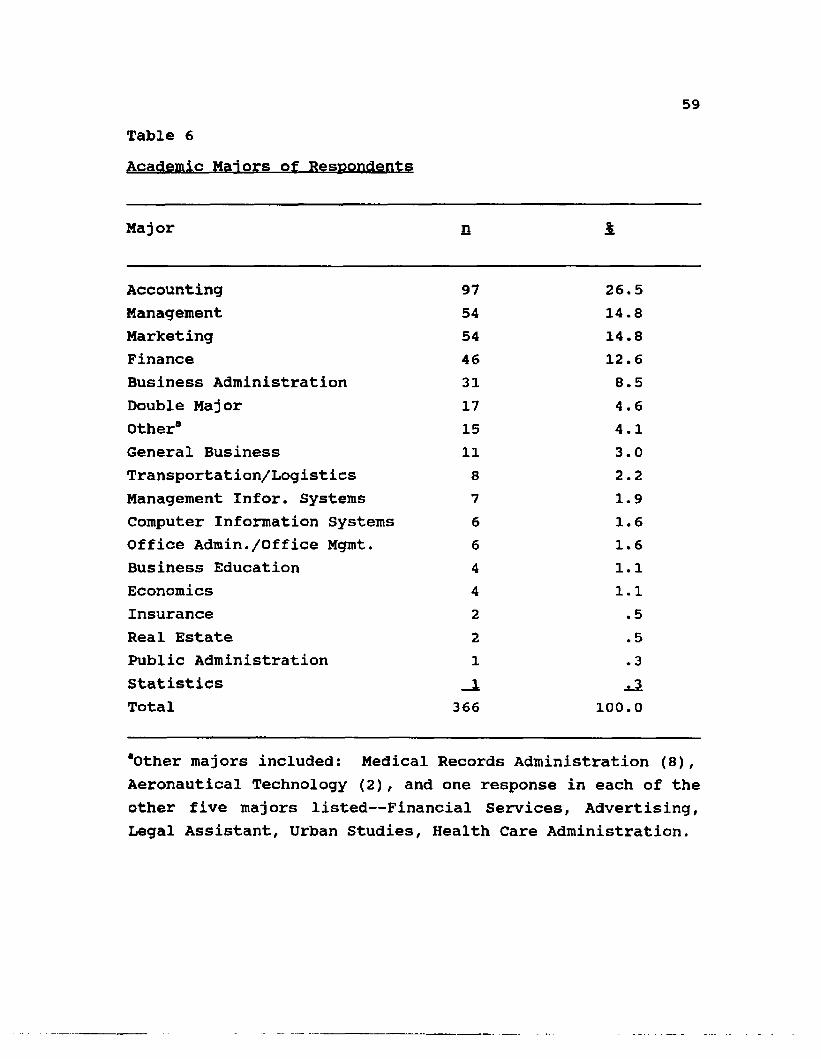
Table 6Academic Majors of Respondents
59
Major n 1
Accounting 97 26.5Management 54 14.8Marketing 54 14.8Finance 46 12.6Business Administration 31 8.5Double Major 17 4.6Other" 15 4.1General Business 11 3.0Transportation/Logistics 8 2.2Management Infor. Systems 7 1.9Computer Information Systems 6 1.6Office Admin./Office Mgmt. 6 1.6Business Education 4 1.1Economics 4 1.1Insurance 2 .5Real Estate 2 .5Public Administration 1 .3Statistics 1 .3Total 366 100.0
“other majors included: Medical Records Administration (8),Aeronautical Technology (2), and one response in each of the other five majors listed— Financial Services, Advertising, Legal Assistant, Urban Studies, Health Care Administration.
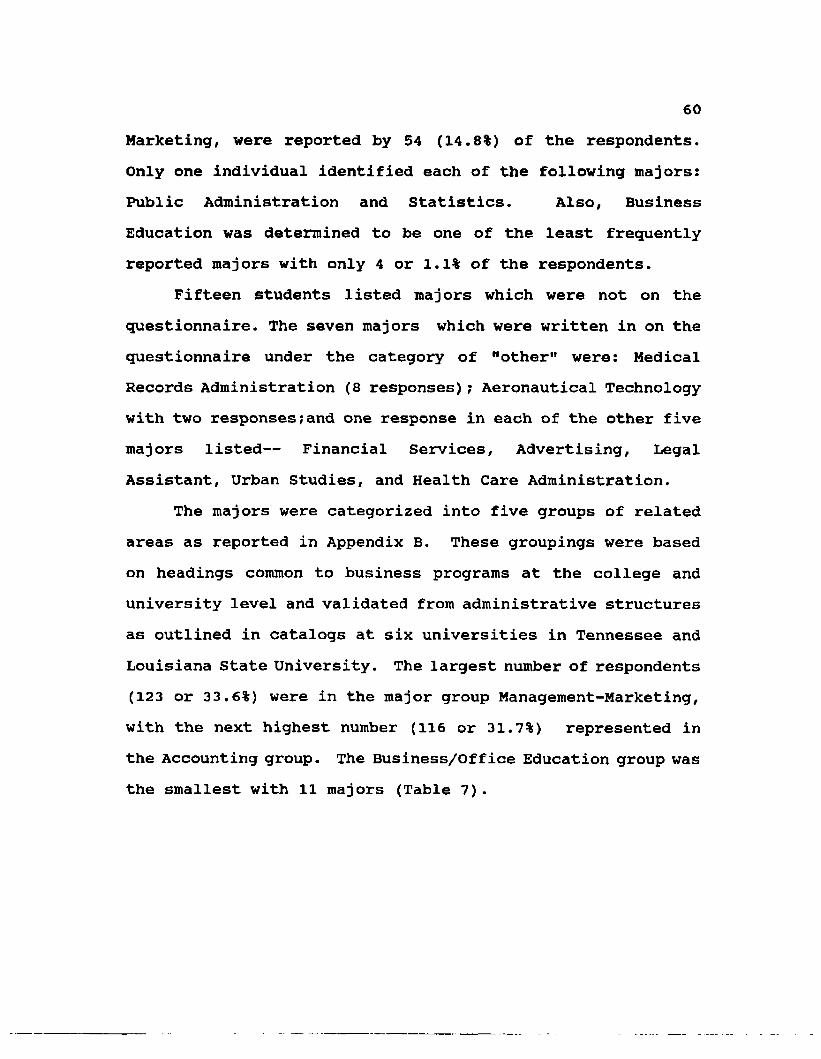
60Marketing, were reported by 54 (14.8%) of the respondents. Only one individual identified each of the following majors: Public Administration and Statistics. Also, Business Education was determined to be one of the least frequently reported majors with only 4 or 1.1% of the respondents.
Fifteen students listed majors which were not on the questionnaire. The seven majors which were written in on the questionnaire under the category of "other" were: Medical Records Administration (8 responses); Aeronautical Technology with two responses;and one response in each of the other five majors listed— Financial Services, Advertising, Legal Assistant, Urban Studies, and Health Care Administration.
The majors were categorized into five groups of related areas as reported in Appendix B. These groupings were based on headings common to business programs at the college and university level and validated from administrative structures as outlined in catalogs at six universities in Tennessee and Louisiana State University. The largest number of respondents (123 or 33.6%) were in the major group Management-Marketing, with the next highest number (116 or 31.7%) represented in the Accounting group. The Business/Office Education group was the smallest with 11 majors (Table 7).
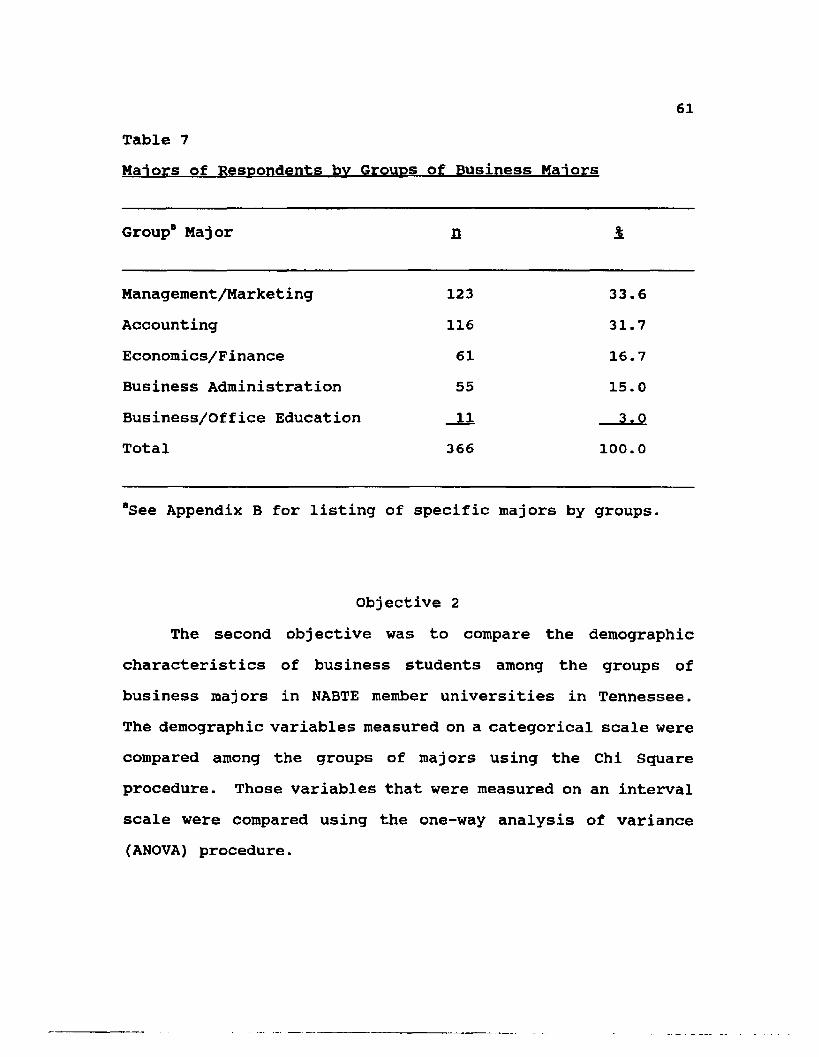
Table 7Majors of Respondents by Groups of Business Majors
61
Group" Major n £
Management/Market i ng 123 33.6Accounting 116 31.7Economics/Finance 61 16.7Business Administration 55 15.0Business/Office Education -11 3 . 0Total 366 100. 0
"See Appendix B for listing of specific majors by groups.
Objective 2The second objective was to compare the demographic
characteristics of business students among the groups of business majors in NABTE member universities in Tennessee. The demographic variables measured on a categorical scale were compared among the groups of majors using the Chi Square procedure. Those variables that were measured on an interval scale were compared using the one-way analysis of variance (ANOVA) procedure.
62Gender bv Groups of Majors
The Chi Square test was used to determine if the variables "gender" and "major group" were independent. Results of the test revealed that the variables were not independent (X2(4)=17.5, p=.002).
The nature of the association between the variables was such that respondents in the Accounting, Business/Office Education, and Business Administration major groups had a higher representation of females while Economics/ Finance and Management/Marketing had a higher representation of males (see Table 8).Marital Status bv Groups of Manors
The majority (85%) of the business students were single. Since only eight (2.2%) of the respondents were in the divorced/separated category, this group was not used for the comparison among groups.
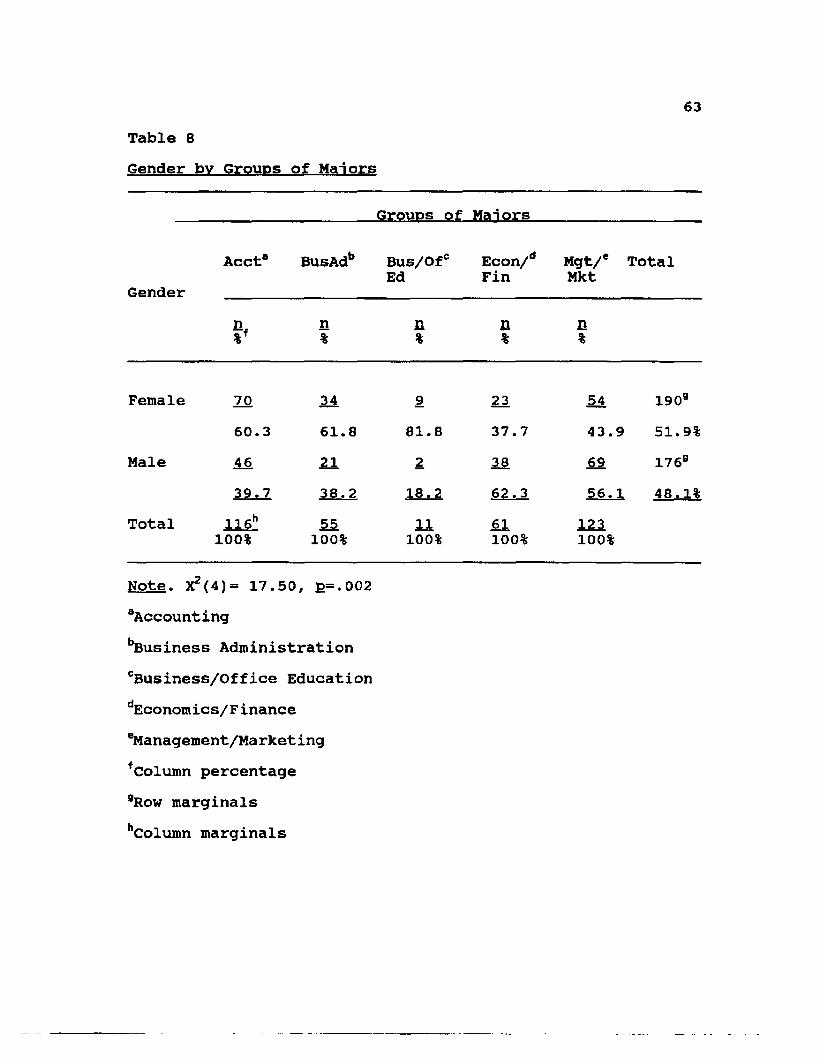
63Table 8Gender bv Groups of Majors
GrouDs of Manors
GenderAcct“ BusAdb Bus/Ofc
EdEcon/dFin
Mgt/eMkt
Total
%fn%
n%
n% n%
Female 70 34 9 23 54 190®60.3 61.8 81.8 37.7 43.9 51.9%
Male 46 21 2 38 69 176®39.7 38. 2 18.2 62.3 56.1 48.1%
Total 116h 55 11 61 123100% 100% 100% 100% 100%
Note. XZ(4) = 17.50, £=.002 AccountingbBusiness Administration cBusiness/Office Education dEconomics/Finance eManagement/Market ing fColumn percentage ®Row marginals hColumn marginals
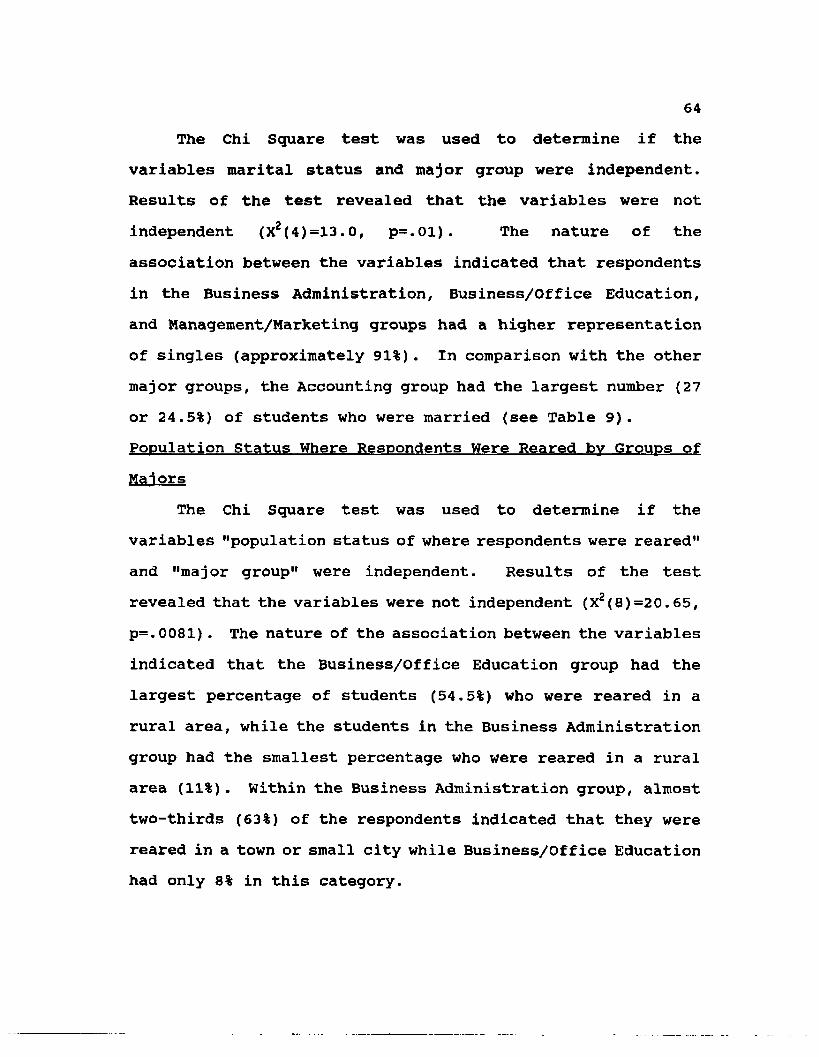
64The Chi Square test was used to determine if the
variables marital status and major group were independent. Results of the test revealed that the variables were not independent (Xz(4)=13.0, p=.01). The nature of theassociation between the variables indicated that respondents in the Business Administration, Business/Office Education, and Management/Marketing groups had a higher representation of singles (approximately 91%). In comparison with the other major groups, the Accounting group had the largest number (27 or 24.5%) of students who were married (see Table 9). Population Status Where Respondents Were Reared bv Groups of Mai ors
The Chi Square test was used to determine if the variables "population status of where respondents were reared" and "major group" were independent. Results of the test revealed that the variables were not independent (X2(8)=20.65, p=.0081). The nature of the association between the variables indicated that the Business/Office Education group had the largest percentage of students (54.5%) who were reared in a rural area, while the students in the Business Administration group had the smallest percentage who were reared in a rural area (11%). Within the Business Administration group, almost two-thirds (63%) of the respondents indicated that they were reared in a town or small city while Business/Office Education had only 8% in this category.
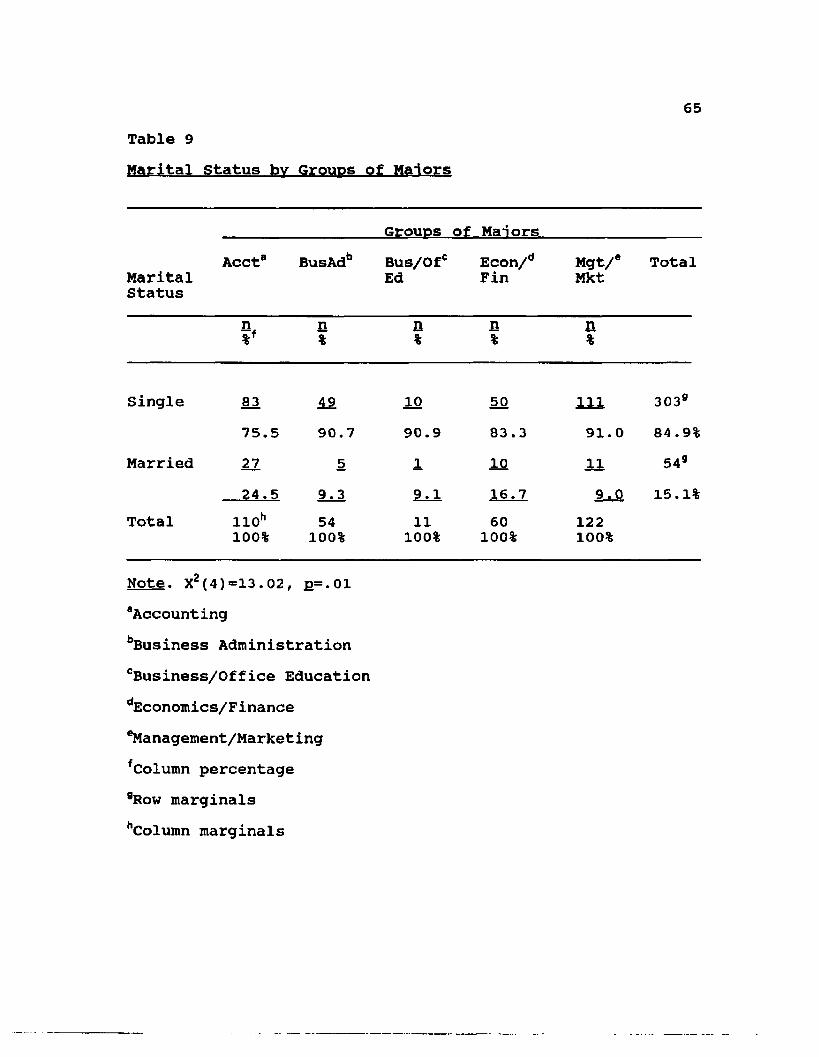
Table 9Marital Status bv Groups of Majors
65
MaritalStatus
Groups of MaiorsACCta BusAdb Bus/Ofc
EdEcon/dFin
Mgt/eMkt
Total
n n n n n%f % % % %
Single 83 49 10 50 i n 303975.5 90.7 90.9 83.3 91.0 84.9%
Married 27 5 1 10 11 54"24.5 9.3 16.7 9.0 15.1%
Total 110h 54 11 60 122100% 100% 100% 100% 100%
Note. X2(4)=13.02, p=.01 "AccountingbBusiness AdministrationcBusiness/Office EducationdEconomics/Finance"Management/MarketingfColumn percentage"Row marginalshColumn marginals
66Over one-third (39%) of the Accounting group of students
were reared in a large city, which was slightly higher than the other groups of majors. Business Administration majors comprised the lowest number of students reared in a large city with about 26% (see Table 10).Occupation of Respondents1 Parents bv Maior Group
The occupations of the students' mother and father were grouped into 12 categories according to the classifications in the Dictionary of Occupational Titles (DOT). Chi Square analysis was not used with the parents' occupations because of the large number of empty cells in the relevant contingency table. Table 11 shows the occupations of the mother (number and percentage) in the DOT categories by major groups.
Nearly one-half (n=5l or 46.8%) of the respondents in the Accounting group indicated that their mothers' occupation was in one of two categories: service and agriculture (28 or25.7%) or administrative support (23 or 21.1%) . Almost one- half (26 or 48.1%) of the Business Administration group had mothers whose occupation was in the Service and Agriculture category. Four out of ten (40%) of the Business Education group indicated that their mother worked in the area of Administrative Support. One-third (18 or 32.7%) of the Economics/Finance group indicated that their mother's occupation was in the Service and Agriculture classification. Over three-fifths (62.3%) of the Management/Marketing group respondents indicated that their mothers' occupation was
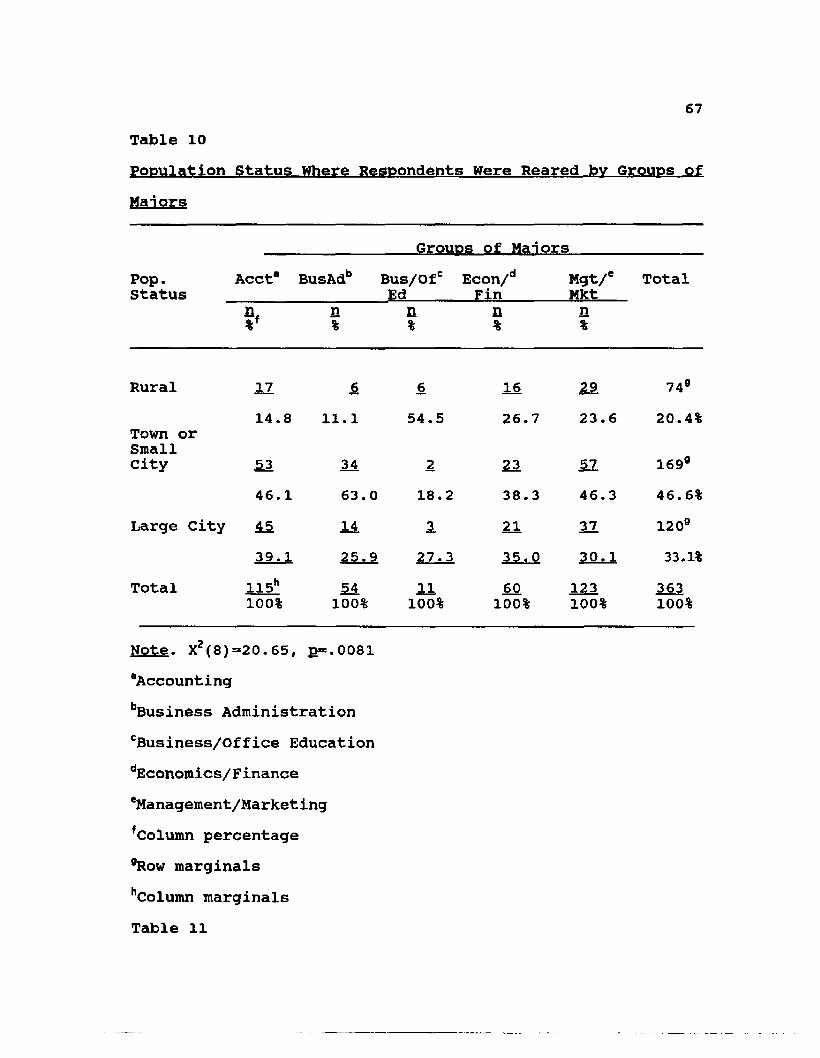
67Table 10Population Status Where Respondents Were Reared bv Groups ofMajors
Pop.Status
Groups of ManorsAcct“ BusAdb Bus/Ofc
Ed Econ/dFin
Mgt/eMkt
Total
%fn%
n%
n%
n%
Rural 17 6 6 16 29 74914.8 H•HH 54.5 26.7 23.6 20.4%
Town orSmallCity 53 34 2 23 5Z 169°
46.1 63.0 18.2 38.3 46.3 46. 6%Large City 45 14 3 21 37 12 09
39.1 25.9 27. 3 35.0 30.1 33.1%Total 115h 54 11 60 123 363
100% 100% 100% 100% 100% 100%
Note. X2(8)=20.65, £=.0081 “AccountingbBusiness Administration cBusiness/Office Education dEconom ics/Finance “Management/Marketing fColumn percentage 9Row marginals hColumn marginals Table 11
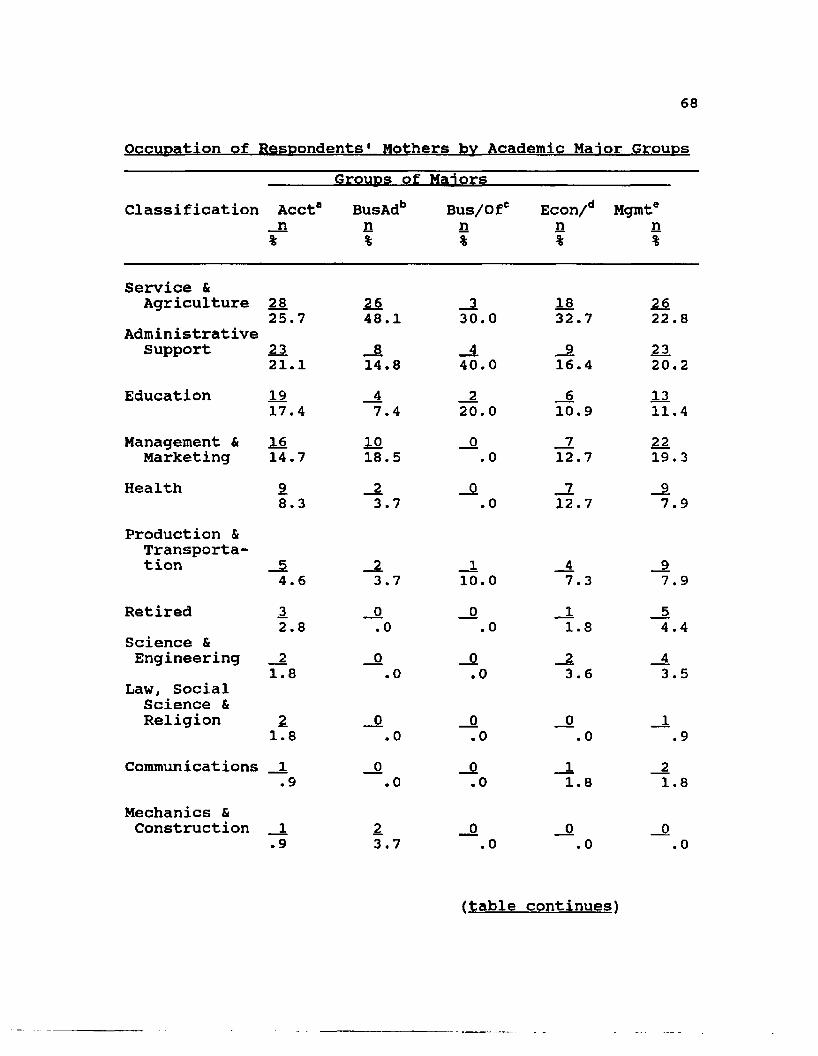
68
Occupation of Respondents1 Mothers by Academic Maior GroupsGroups of Majors
Classification Acct* BusAdb Bus/Ofc Econ/d Mgmten n n n n% % % % %
Service &Agriculture 23 26
25.7 48.1Administrative
Support 23. _821.1 14.8
Education 19 _417.4 7.4
Management & 16 10Marketing 14.7 18.5
Health 9 _28.3 3.7
Production &Transportation _5 _2
4.6 3.7Retired 3. _o
2.8 .0Science &Engineering __2 _0
1.8 .0Law, Social
Science &Religion 2 _0
1.8 .0Communications _1 _0
.9 .0Mechanics &Construction _1 2
.9 3.7
3 18 2630.0 32.7 22.84 9 23
40.0 16.4 20.22 6 13
20.0 10.9 11.40 7 22.0 12.7 19.3
0 7 9.0 12.7 7.9
1 4 910.0 7.3 7.90 1 5.0 1.8 4.4
0 2 4.0 3.6 3.5
0 0 1.0 .0 .90 1 2.0 1.8 1.8
0 0 0.0 .0 .0
ftable continues)
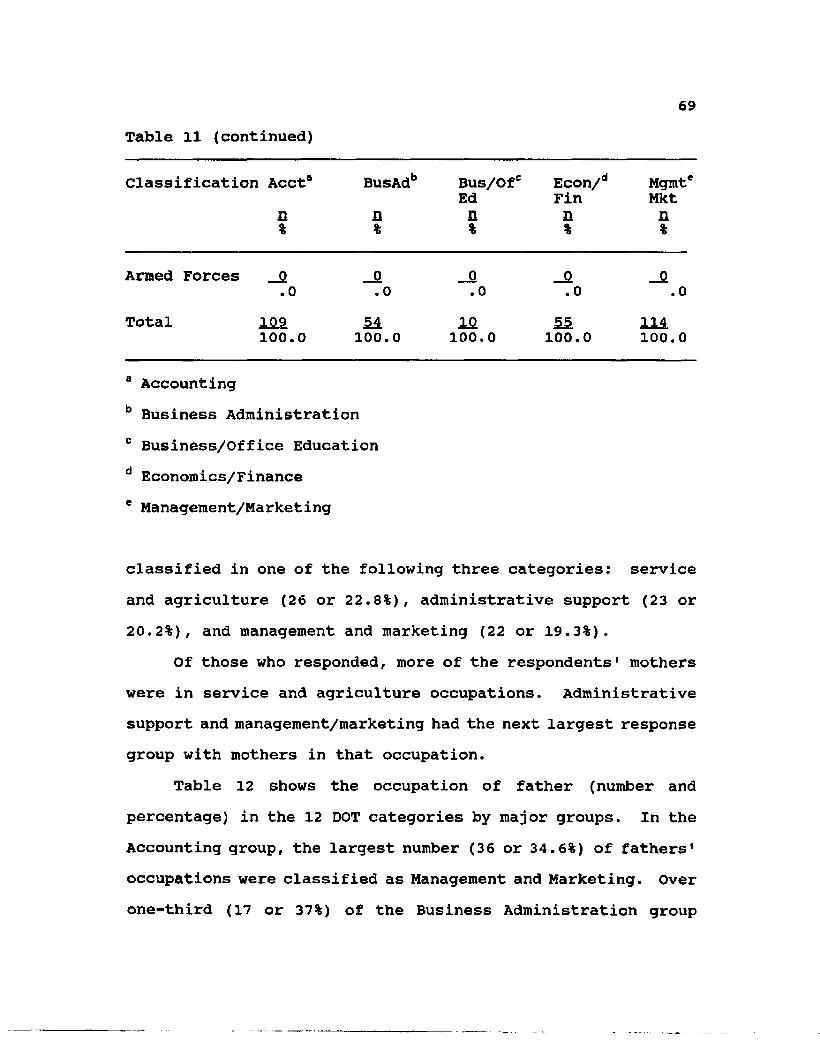
69Table 11 (continued)
Classification Acct“ BusAdb Bus/Ofc Econ/d Mgmt*Ed Fin Mkt
n n n n n% % % % %
Armed Forces __0 0 0 _0 0.0 .0 .0 .0 .0
Total J09 M 10 55 114100.0 100.0 100.0 100.0 100.0
a Accountingb Business Administration c Business/Office Education d Economics/Finance e Management/Marketing
classified in one of the following three categories: serviceand agriculture (26 or 22.8%), administrative support (23 or 20.2%), and management and marketing (22 or 19.3%).
Of those who responded, more of the respondents' mothers were in service and agriculture occupations. Administrative support and management/marketing had the next largest response group with mothers in that occupation.
Table 12 shows the occupation of father (number and percentage) in the 12 DOT categories by major groups. In the Accounting group, the largest number (36 or 34.6%) of fathers' occupations were classified as Management and Marketing. Over one-third (17 or 37%) of the Business Administration group
70indicated that their fathers were employed in management or marketing occupations. six of the 10 (60%) in theBusiness/Office Education group had a father whose occupation was classified as either Management and Marketing (3 or 30%) or Science and Engineering (3 or 30%) . The fathers of 24 (42.1%) of the Economics/Finance group had occupations in the Management and Marketing category. Over two-fifths (47 or 42.3%) of the respondents in the Management/Marketing group indicated that their fathers' occupation was in the area of Management and Marketing.Age of Respondents bv Groups of Manors
Since the variable age was measured on an interval scale, the Analysis of Variance (ANOVA) procedure was used to compare the groups. The test revealed that the major groups were not significantly different on the variable age (F4 358=l.75, p=.14) (see Table 13).GPA of Respondents bv Groups of Majors
The Analysis of Variance (ANOVA) procedure was used to compare the groups on the variable GPA (grade point average). The test revealed that the major groups were significantly different on the variable GPA (FA, 357=17 . 62, p=.001). In order to know where the differences were among the groups, Tukey's posthoc multiple comparison test was used as a follow-up procedure to the ANOVA. The test revealed a significant
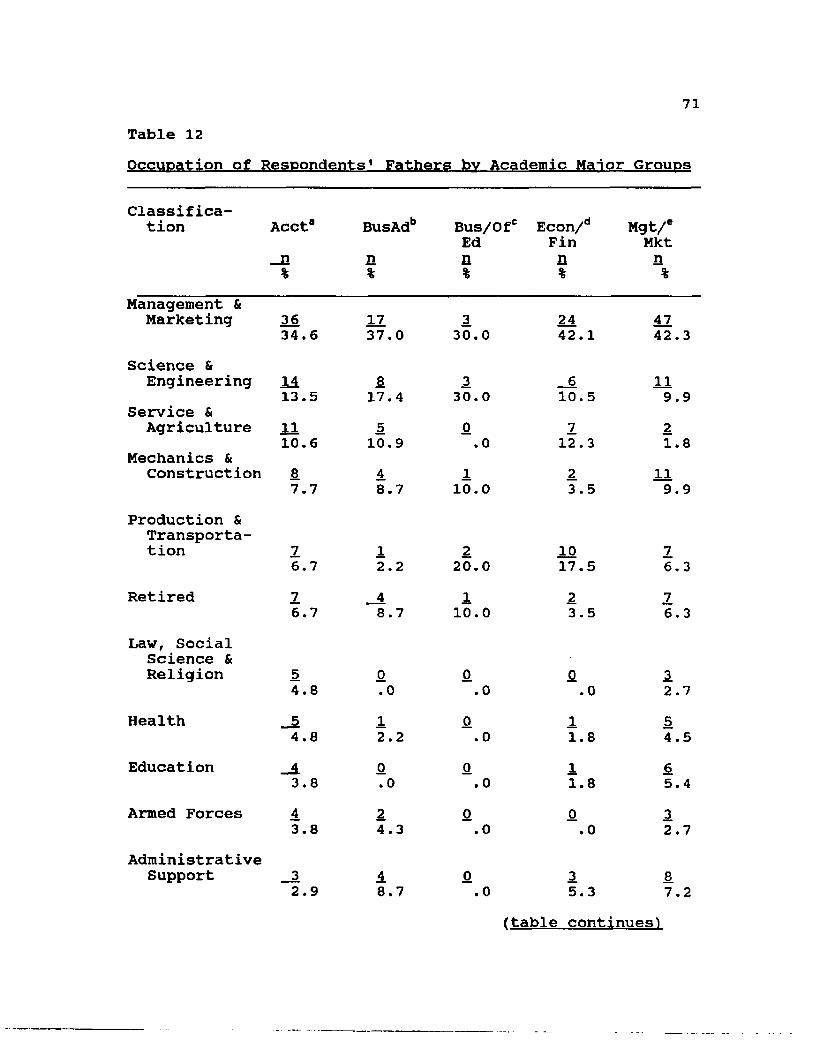
71Table 12Occupation of Respondents1 Fathers bv Academic Maior Groups
Classification Acct8 BusAdb Bus/Ofc Econ/d Mgt/e
Ed Fin Mktn H n n n% % % % %
Management &Marketing 36 12
34.6 37.0Science &
Engineering 14 813.5 17.4
Service &Agriculture XI 5
10.6 10.9Mechanics &
Construction 8 47.7 8.7
Production &Transportation 7 1
6.7 2.2Retired 7 _4
6.7 8.7Law, Social
Science &Religion 5 0
4.8 .0Health _5 l
4.8 2.2Education __4 o
3.8 .0Armed Forces 4 2
3.8 4.3Administrative
Support __3 42.9 8.7
3 24 4730.0 42.1 42.3
3 6 1130.0 10.5 9.90 7 2.0 12.3 1.8
1 2 1110.0 3.5 9.9
2 10 720.0 17.5 6.31 2 710.0 3.5 6.3
0 0 3.0 .0 2.7
0 1 5.0 1.8 4.5
0 1 6.0 1.8 5.4
0 0 3.0 .0 2.7
0 3 8.0 5.3 7.2
(table continues^
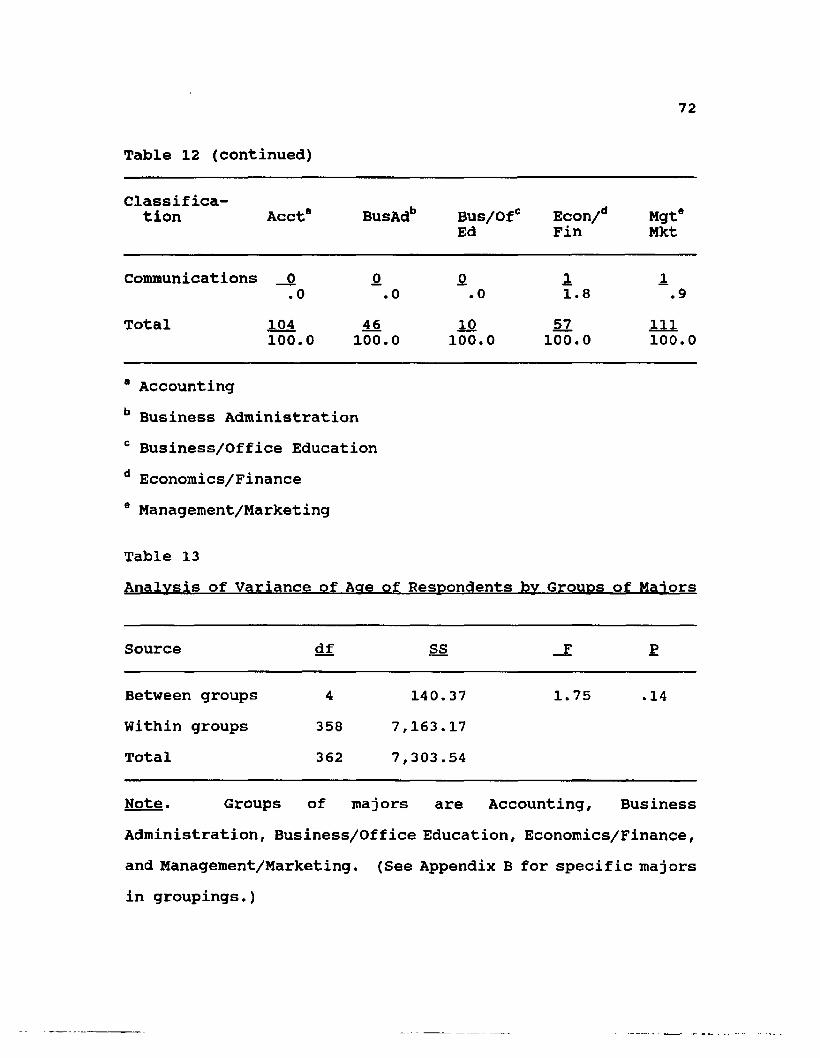
72
Table 12 (continued)
Classification Acct* BusAdb Bus/0fc
EdEcon/dFin Mgte
Mkt
Communications _0 o a. 1 1.0 o•o• 1.8 .9
Total 104 46 10 57 111100.0 100.0 100.0 100.0 100.0
* Accountingb Business Administrationc Business/Office Educationd Economics/Financee Management/Marketing
Table 13Analvsis of Variance of Aae of Respondents bv Grouos of Manors
Source df ss _F p
Between groups 4 140.37 1.75 .14Within groups 358 7,163.17Total 362 7,303.54
Note. Groups of majors are Accounting, BusinessAdministration, Business/Office Education, Economics/Finance, and Management/Marketing. (See Appendix B for specific majors in groupings.)
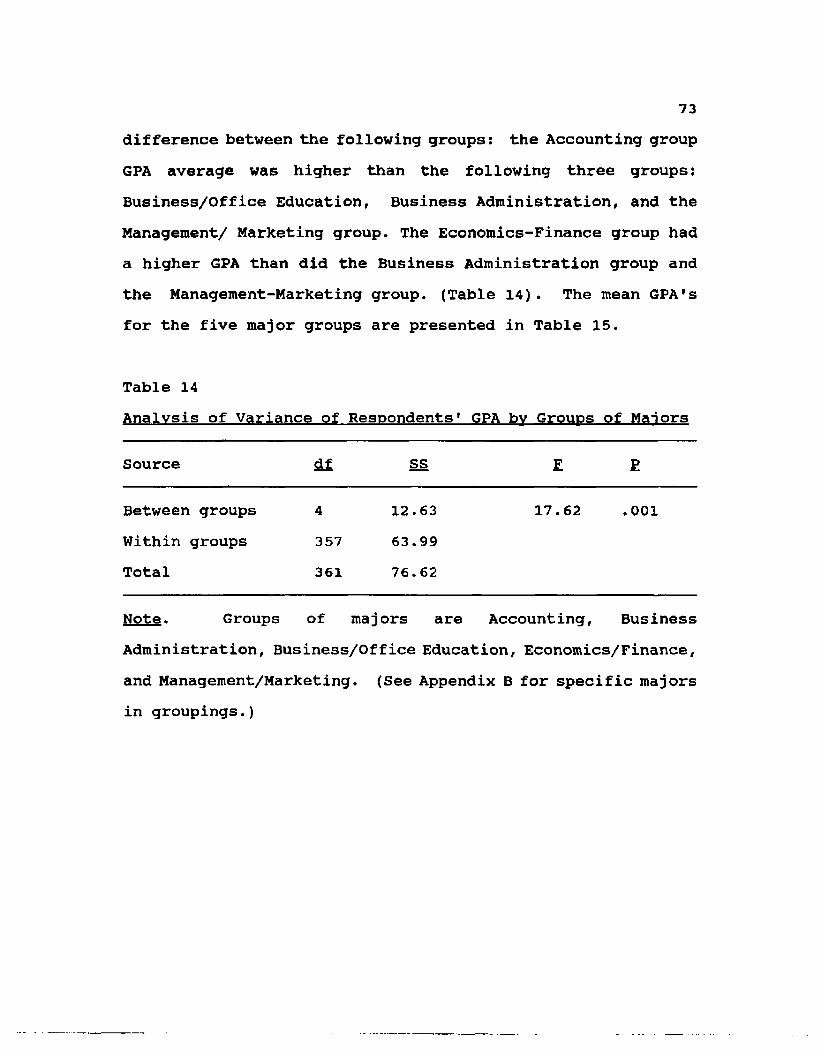
73difference between the following groups: the Accounting groupGPA average was higher than the following three groups: Business/Office Education, Business Administration, and the Management/ Marketing group. The Economics-Finance group had a higher GPA than did the Business Administration group and the Management-Marketing group. (Table 14). The mean GPA's for the five major groups are presented in Table 15.
Table 14Analysis of Variance of Respondents1 GPA bv Groups of Majors
Source df SS F P
Between groups 4 12.63 17.62 .001Within groups 357 63.99Total 361 76.62
Note. Groups of majors are Accounting, BusinessAdministration, Business/Office Education, Economics/Finance, and Management/Marketing. (See Appendix B for specific majors in groupings.)
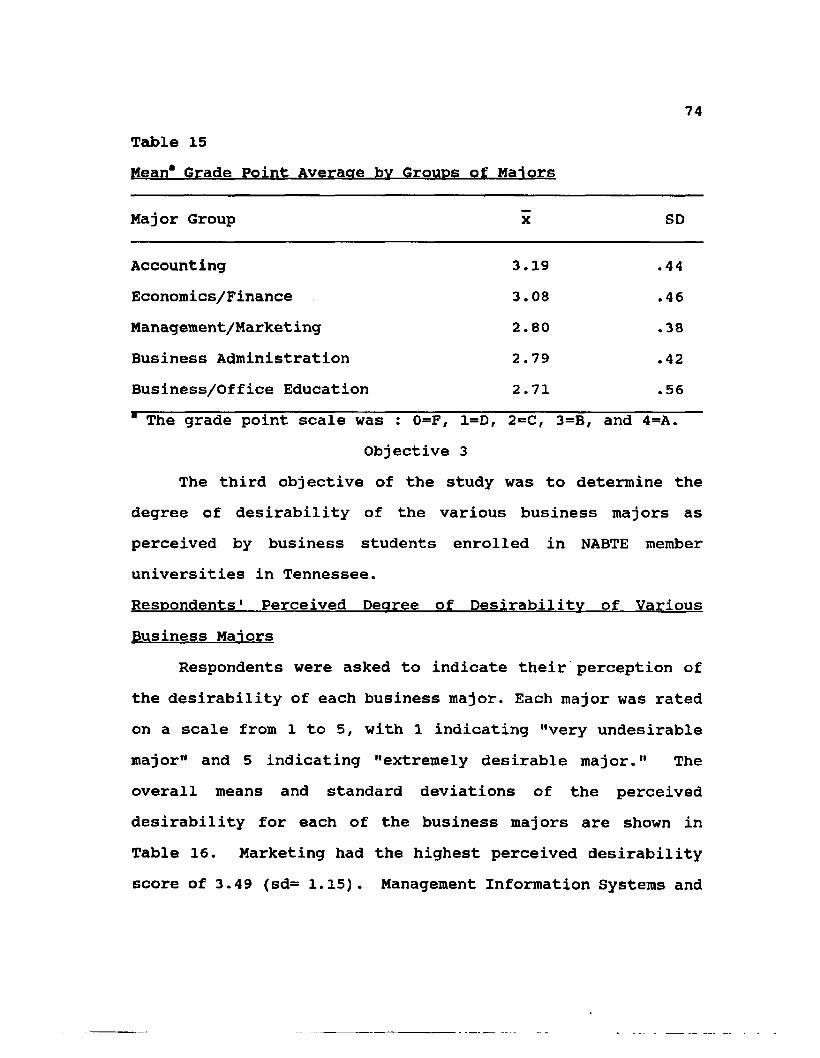
74Table 15Mean" Grade Point Average bv Groups of Majors
Major Group X SD
Accounting 3.19 .44Economics/Finance 3.08 .46Management/Market ing 2.80 .38Business Administration 2.79 .42Business/Office Education 2.71 .56" The grade point scale was : 0=F , 1=D, 2=C, 3=B, and 4=A.
Objective 3The third objective of the study was to determine the
degree of desirability of the various business majors as perceived by business students enrolled in NABTE member universities in Tennessee.Respondents1 Perceived Degree of Desirability of Various Business Manors
Respondents were asked to indicate their perception of the desirability of each business major. Each major was rated on a scale from l to 5, with 1 indicating "very undesirable major" and 5 indicating "extremely desirable major." The overall means and standard deviations of the perceived desirability for each of the business majors are shown in Table 16. Marketing had the highest perceived desirability score of 3.49 (sd= 1.15). Management Information Systems and
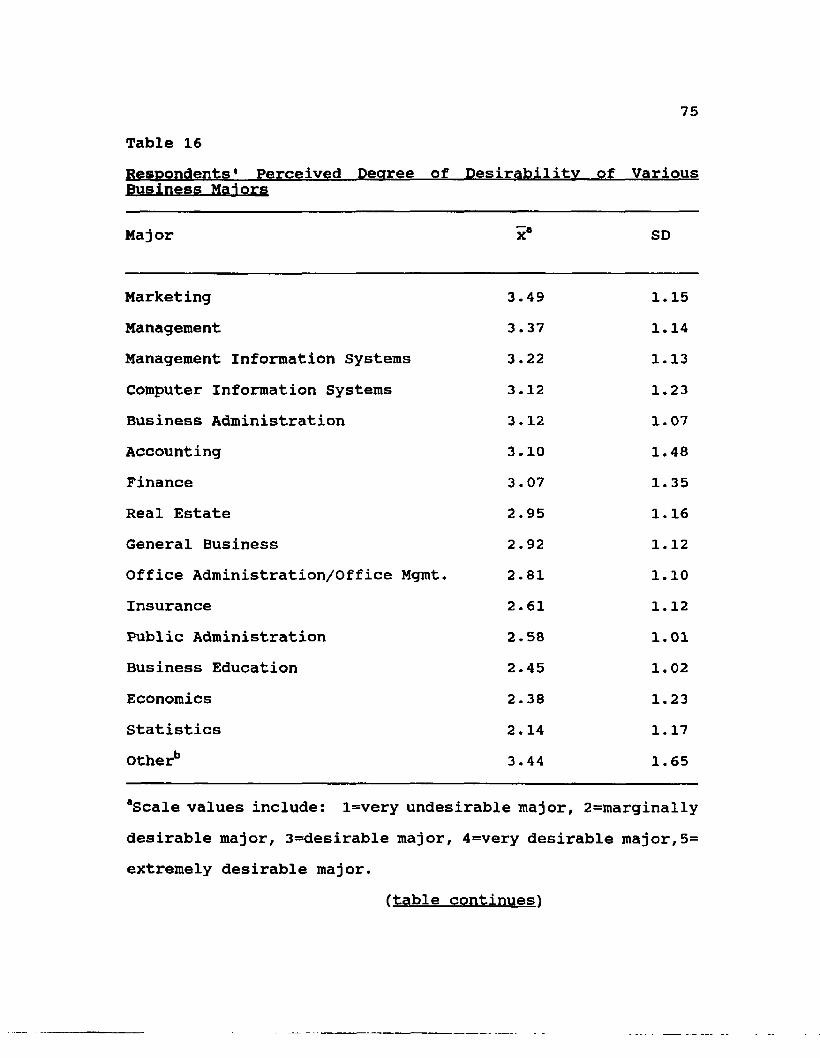
75Table 16Respondents1 Perceived Degree of Desirability of VariousBusiness Majors
Major x8 SD
Marketing 3.49 1.15Management 3.37 1.14Management Information Systems 3.22 1.13Computer Information Systems 3.12 1.23Business Administration 3.12 1.07Accounting 3.10 1.48Finance 3.07 1.35Real Estate 2.95 1.16General Business 2.92 1.12Office Administration/Office Mgmt. 2.81 1.10Insurance 2.61 1.12Public Administration 2.58 1.01Business Education 2.45 1.02Economics 2.38 1.23Statistics 2.14 1.17Otherb 3.44 1.65
aScale values include: l=very undesirable major, 2=marginallydesirable major, 3=desirable major, 4=very desirable major,5= extremely desirable major.
(table continues^
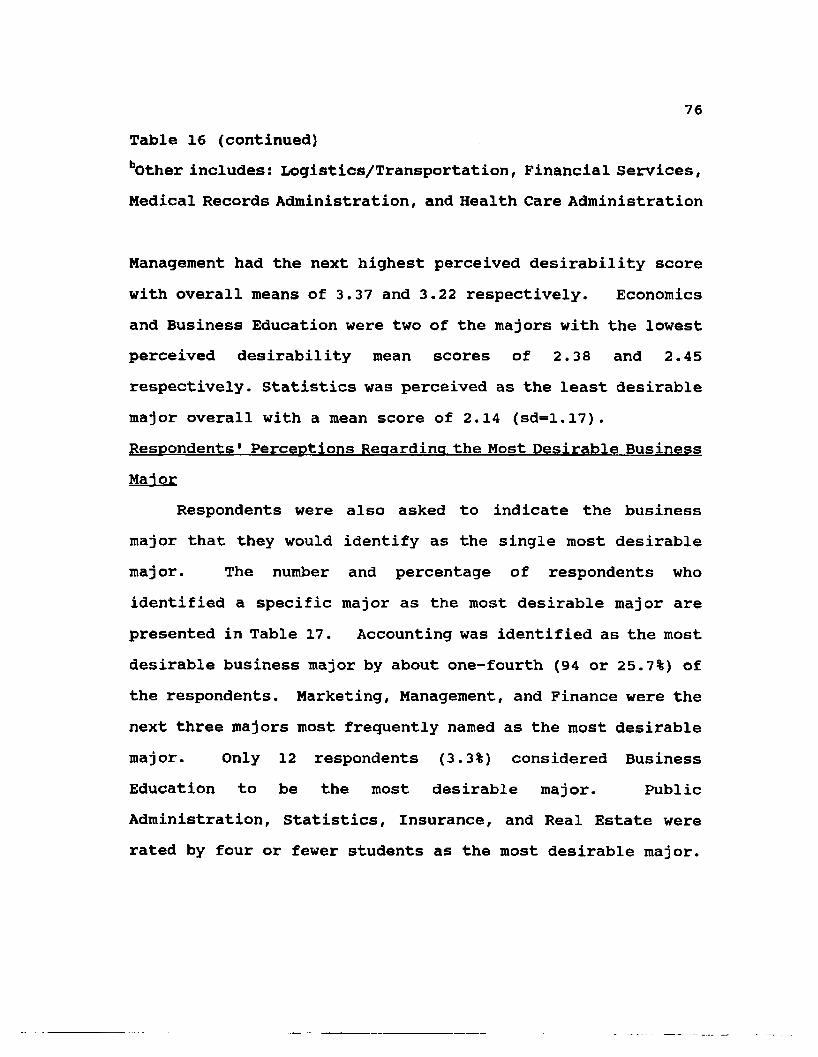
76Table 16 (continued)bOther includes: Logistics/Transportation, Financial Services, Medical Records Administration, and Health Care Administration
Management had the next highest perceived desirability score with overall means of 3.37 and 3.22 respectively. Economics and Business Education were two of the majors with the lowest perceived desirability mean scores of 2.3 8 and 2.45 respectively. Statistics was perceived as the least desirable major overall with a mean score of 2.14 (sd=l.l7). Respondents1 Perceptions Regarding the Most Desirable Business Manor
Respondents were also asked to indicate the business major that they would identify as the single most desirable major. The number and percentage of respondents whoidentified a specific major as the most desirable major are presented in Table 17. Accounting was identified as the most desirable business major by about one-fourth (94 or 25.7%) of the respondents. Marketing, Management, and Finance were the next three majors most frequently named as the most desirable major. Only 12 respondents (3.3%) considered BusinessEducation to be the most desirable major. Public Administration, Statistics, Insurance, and Real Estate were rated by four or fewer students as the most desirable major.
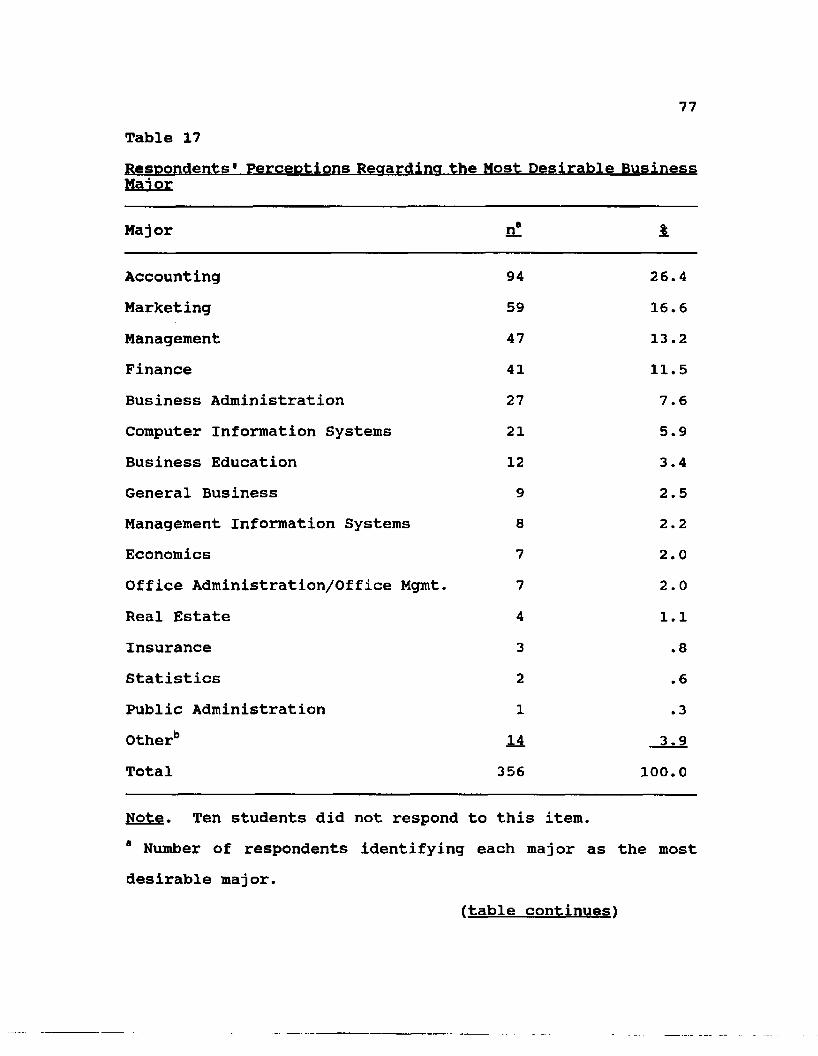
77Table 17
Mai or
Major n!
Accounting 94 26.4Marketing 59 16.6Management 47 13.2Finance 41 11.5Business Administration 27 7.6Computer Information Systems 21 5.9Business Education 12 3.4General Business 9 2.5Management Information Systems 8 2.2Economics 7 2.0Office Administration/Office Mgmt. 7 2.0Real Estate 4 1.1Insurance 3 .8Statistics 2 .6Public Administration 1 .3Otherb 14 3.9Total 356 100.0
Note. Ten students did not respond a Number of respondents identifying
to this item, each major as the most
desirable major.(table continues1
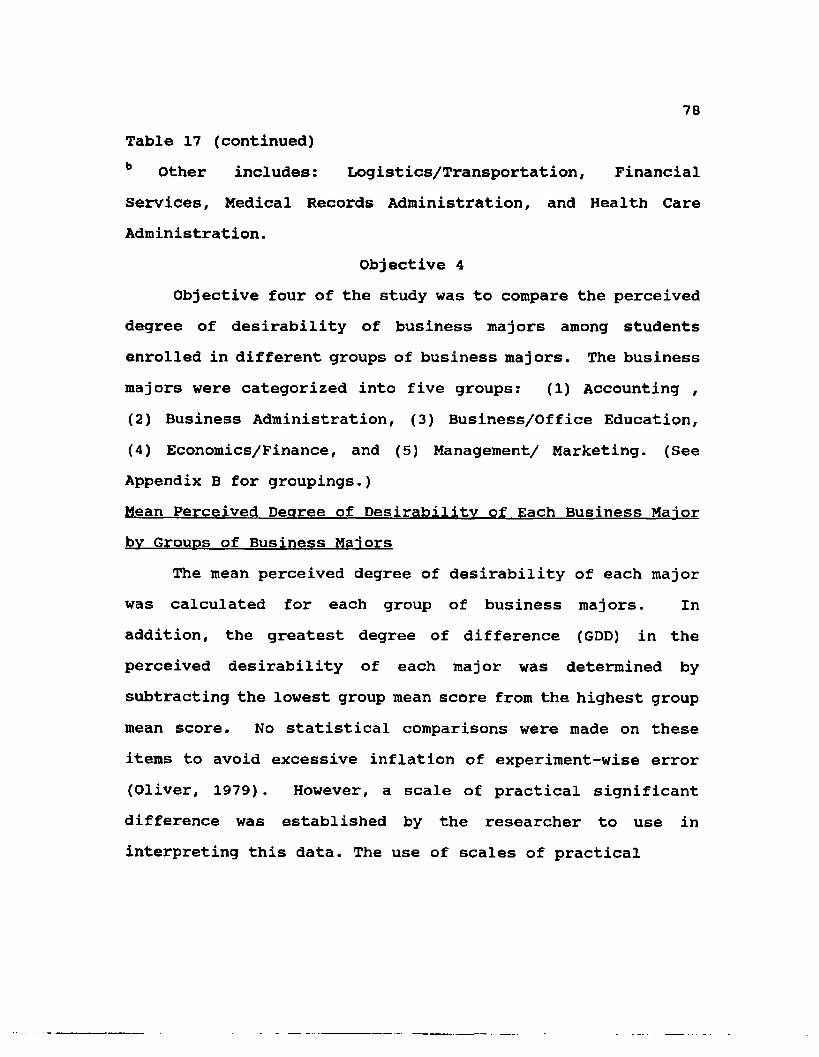
78Table 17 (continued)b Other includes: Logistics/Transportation, FinancialServices, Medical Records Administration, and Health Care Administration.
Objective 4Objective four of the study was to compare the perceived
degree of desirability of business majors among students enrolled in different groups of business majors. The business majors were categorized into five groups: (1) Accounting ,(2) Business Administration, (3) Business/Office Education, (4) Economics/Finance, and (5) Management/ Marketing. (See Appendix B for groupings.)Mean Perceived Degree of Desirability of Each Business Maior bv Groups of Business Manors
The mean perceived degree of desirability of each major was calculated for each group of business majors. In addition, the greatest degree of difference (GDD) in the perceived desirability of each major was determined by subtracting the lowest group mean score from the highest group mean score. No statistical comparisons were made on these items to avoid excessive inflation of experiment-wise error (Oliver, 1979). However, a scale of practical significant difference was established by the researcher to use in interpreting this data. The use of scales of practical
79significance and/or common sense interpretations of data have been suggested by Hays (1963) , Gold (1969) , and Saladaga (1981).
The scale of practical significance was established as follows:
Difference in Scores Degree of Difference>1.25 High1.00-1.25 Substantial.75- .99 Moderate.50- .74 Low
<•50 NegligibleTable 18 lists the group means for each major in
descending order of greatest degree of difference among these groups. The major for which the highest difference was found was Accounting (GDD=2.09). According to the scale of practical significance, 2.09 was considered a high degree of difference. Two additional majors had a high degree of difference. These were Finance (GDD=1.87) and Office Administration/Office Management (GDD=1.30). Two majors, Marketing and Business Administration, were considered to have a substantial degree of difference (1.00-1.25). Five majors were considered to have a moderate degree of difference (.75- .99). Five majors fit into the low level of difference category (.50-.74) , with Insurance being the lowest (GDD=.59) .
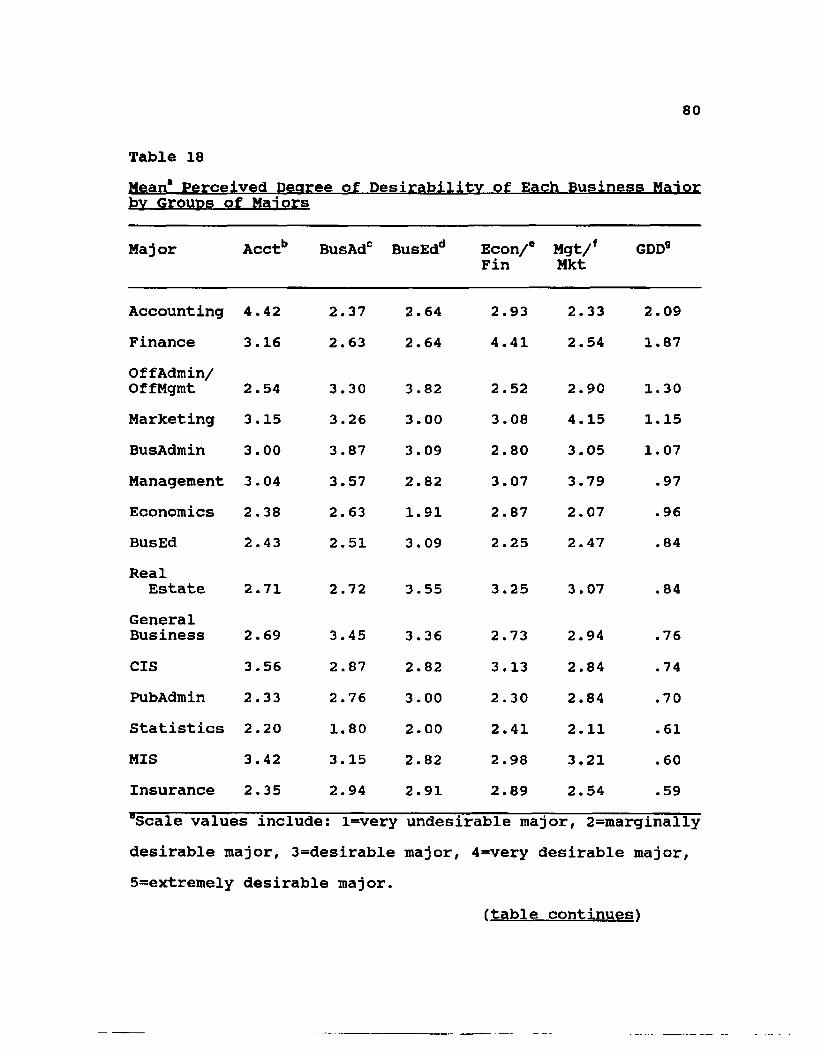
80
Table 18Mean" Perceived Degree of Desirability of Each Business Maior bv Groups of Majors
Major Acctb BusAd0 BusEdd Econ/e Mgt/f GDD9Fin Mkt
Accounting 4.42 2.37 2.64 2.93 2.33 2.09Finance 3.16 2.63 2.64 4.41 2.54 1.87OffAdmin/ OffMgmt 2.54 3.30 3.82 2.52 2.90 1.30Marketing 3.15 3.26 3.00 3.08 4.15 1.15BusAdmin 3.00 3.87 3.09 2.80 3.05 1.07Management 3.04 3.57 2.82 3.07 3.79 .97Economics 2.38 2.63 1.91 2.87 2.07 .96BusEd 2.43 2.51 3 . 09 2 .25 2.47 .84Real
Estate 2.71 2.72 3.55 3.25 3.07 .84GeneralBusiness 2.69 3.45 3.36 2.73 2.94 .76CIS 3.56 2.87 2.82 3.13 2.84 .74PubAdmin 2.33 2.76 3.00 2.30 2.84 .70Statistics 2 .20 1.80 2.00 2.41 2.11 .61MIS 3.42 3.15 2.82 2.98 3.21 .60Insurance 2.35 2.94 2.91 2.89 2.54 .59“Scale values include: l=very undesirable major, 2=marginally desirable major, 3=desirable major, 4=very desirable major, 5=extremely desirable major.
(table continues^
81Table 18 (continued) bAccounting'Business Administration dBusiness/Office Education •Economics/Finance fManagement/Marketing9GDD=Greatest Degree of Difference (highest group mean minus lowest group mean)
Only three of the majors were not perceived as having highest desirability by the group within which their major was grouped: public administration (mean=2.76), statistics(mean=2.20), and insurance (mean=2.89).
Objective 5The fifth objective of the study was to determine the
perceived influence of selected factors on the selection of a college major by business students in NABTE member universities in Tennessee.Perceived Influence of Selected Factors on Students1 Choice of a Business Maior
Respondents were asked to indicate how much importance various factors had on their decision to select a specific business major. The scale of importance utilized was: l=noimportance, 2=little importance, 3=some importance, 4=much importance, and 5=very much importance.
Table 19 lists the overall means and standard deviations for each of the identified factors influencing students to
choose their business major. To facilitate the interpretation of this data, a scale was established for these mean importance values. The scale of practical significance included:
1.00-1.50 No importance1.51-2.50 Little importance2.51-3.49 Some importance3.50-4.49 Much importance4.50-5.00 Very much importanceThe data are presented in descending order of the mean
value of the importance of the factor. “Potential income" was the factor which was found to have the highest mean score of 4.16. Four additional factors were considered to be of "much importance":
(1) Offers broad job opportunities (mean=4.14)(2) Type of work involved in this field (mean=4.13)(3) Demand for people with this degree (mean=3.70)(4) Prestige of the job (mean=3.51).There were four factors considered to be of "some
importance" (2.51-3.49) in the selection of a choice of major:(1) To be of service to people (mean=3.31)(2) To start my own business (mean=3.1l)(3) Potential travel opportunities (mean=2.77)(4) Opportunities to return home to a position
(mean=2.59)
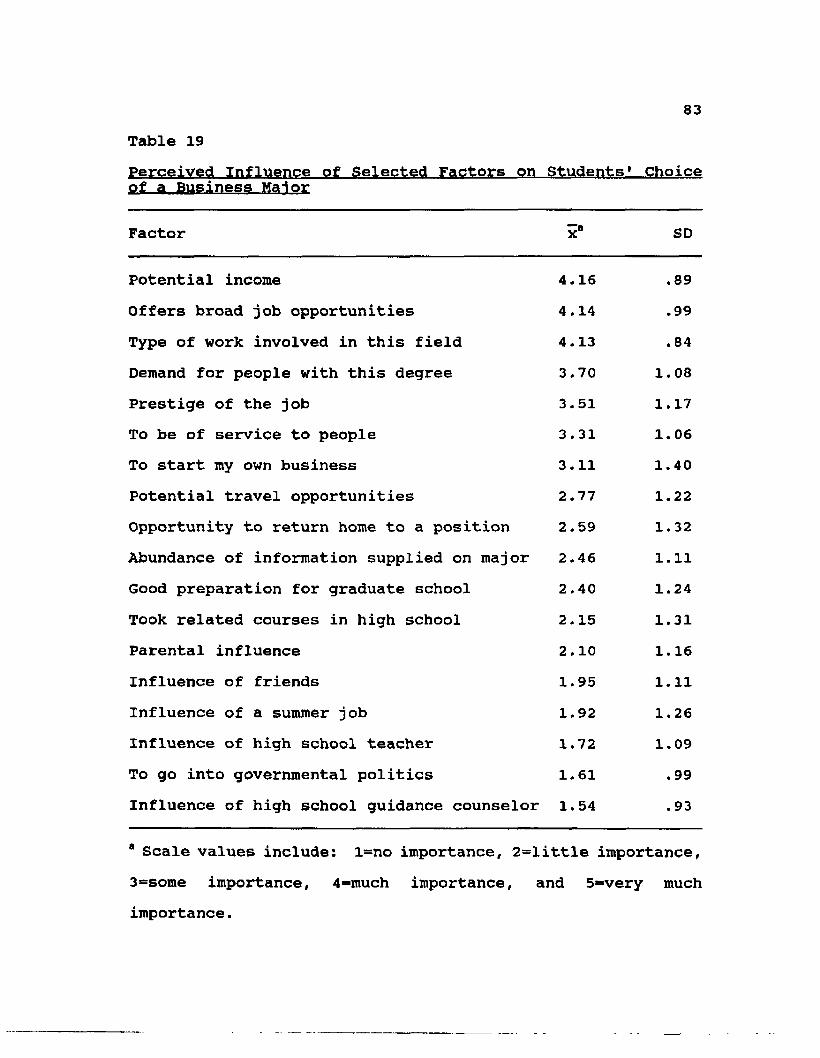
Table 19Perceived Influence of Selected Factors on Students' Choiceof a Business Maior
Factor x8 SD
Potential income 4.16 .89Offers broad job opportunities 4.14 .99Type of work involved in this field 4.13 .84Demand for people with this degree 3.70 1.08Prestige of the job 3.51 1.17To be of service to people 3.31 1.06To start my own business 3.11 1.40Potential travel opportunities 2.77 1.22Opportunity to return home to a position 2.59 1.32Abundance of information supplied on major 2.46 1.11Good preparation for graduate school 2.40 1.24Took related courses in high school 2.15 1.31Parental influence 2.10 1.16Influence of friends 1.95 1.11Influence of a summer job 1.92 1.26Influence of high school teacher 1.72 1.09To go into governmental politics 1.61 .99Influence of high school guidance counselor 1.54 .93
8 Scale values include: l=no importance, 2=little importance,3-some importance, 4=much importance, and 5=very muchimportance.
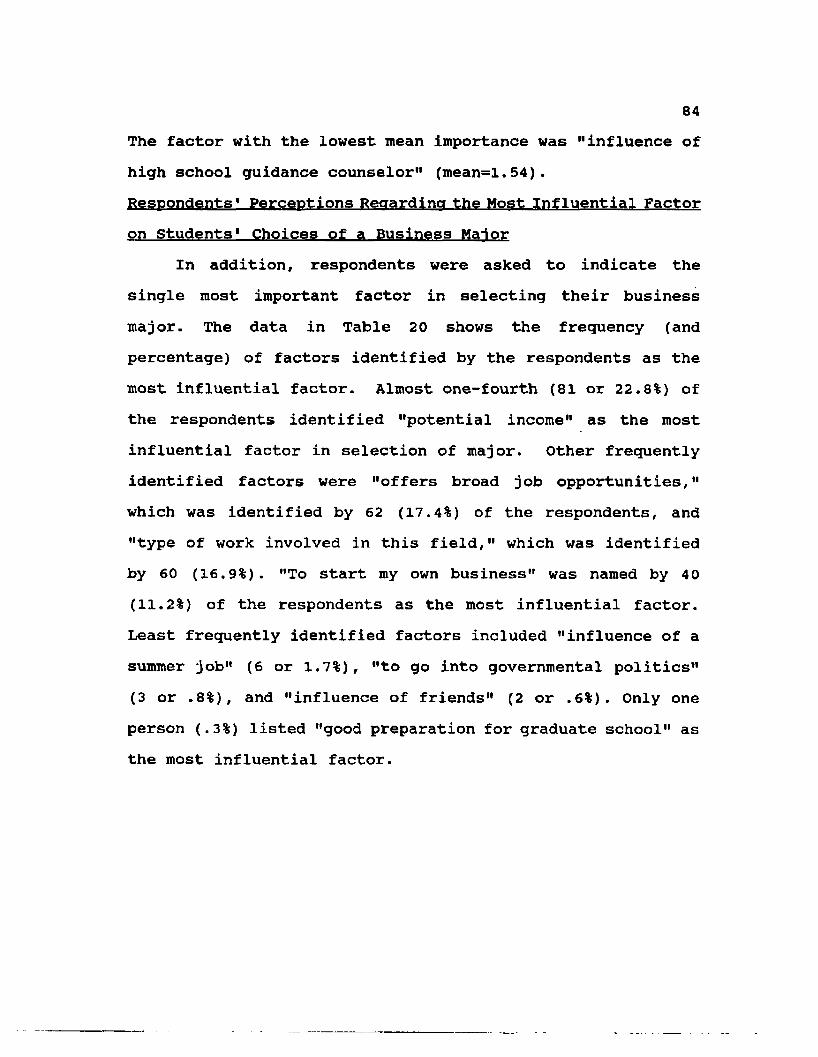
84The factor with the lowest mean importance was "influence of high school guidance counselor" (mean=1.54).Respondents1 Perceptions Regarding the Most Influential Factor on Students' Choices of a Business Maior
In addition, respondents were asked to indicate the single most important factor in selecting their business major. The data in Table 20 shows the frequency (and percentage) of factors identified by the respondents as the most influential factor. Almost one-fourth (81 or 22.8%) of the respondents identified "potential income" as the most influential factor in selection of major. Other frequently identified factors were "offers broad job opportunities," which was identified by 62 (17.4%) of the respondents, and "type of work involved in this field," which was identified by 60 (16.9%). "To start my own business" was named by 40(11.2%) of the respondents as the most influential factor. Least frequently identified factors included "influence of a summer job" (6 or 1.7%), "to go into governmental politics" (3 or .8%), and "influence of friends" (2 or .6%). Only one person (.3%) listed "good preparation for graduate school" as the most influential factor.
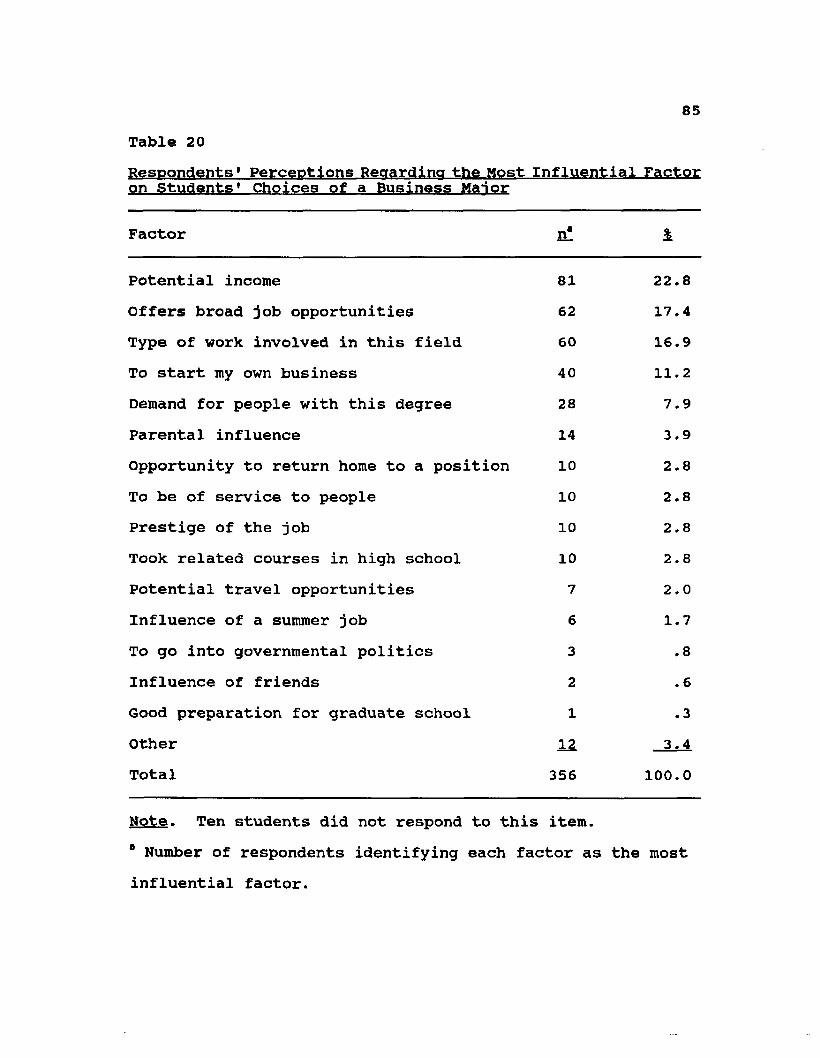
85Table 20Respondents' Perceptions Regarding the Most influential Factor on Students' Choices of a Business Maior
Factor 4
Potential income 81 22.8Offers broad job opportunities 62 17.4Type of work involved in this field 60 16.9To start my own business 40 11.2Demand for people with this degree 28 7.9Parental influence 14 3.9Opportunity to return home to a position 10 2.8To be of service to people 10 2.8Prestige of the job 10 2.8Took related courses in high school 10 2.8Potential travel opportunities 7 2.0Influence of a summer job 6 1.7To go into governmental politics 3 .8Influence of friends 2 .6Good preparation for graduate school 1 .3Other 12 3.4Total 356 100.0
Note. Ten students did not respond to this item.* Number of respondents identifying each factor as the most influential factor.
86Objective 6
Objective six was to compare the perceived influence of various factors on the selection of a major among students enrolled in different groups of business majors.Mean Perceived Degree of Influence of Selected Factors on Choice of a Business Maior bv Groups of Majors
The mean for the degree of perceived influence of each factor on the selection of a major was calculated for each group of majors. In addition, the greatest degree of difference in the perceived influence of various factors on the selection of a major among these groups was determined for each factor by subtracting the lowest group mean from the highest group mean. The group mean for each factor was presented in descending order according to the greatest degree of difference. No statistical comparisons were made on these items to avoid excessive inflation of experiment-wise error. However, a scale of practical significant difference (same scale as was used in objective four) was established by the researcher to use in interpreting this data.
A substantial degree of difference among the groups in perception was found on the following five factors: "to beof service to people" (GDD=1.13), "prestige of the job" (GDD=1.12), "influence of a summer job" (GDD=l,08), "potential income" (GDD=1.06), and "potential travel opportunities" (GDD=1.04).
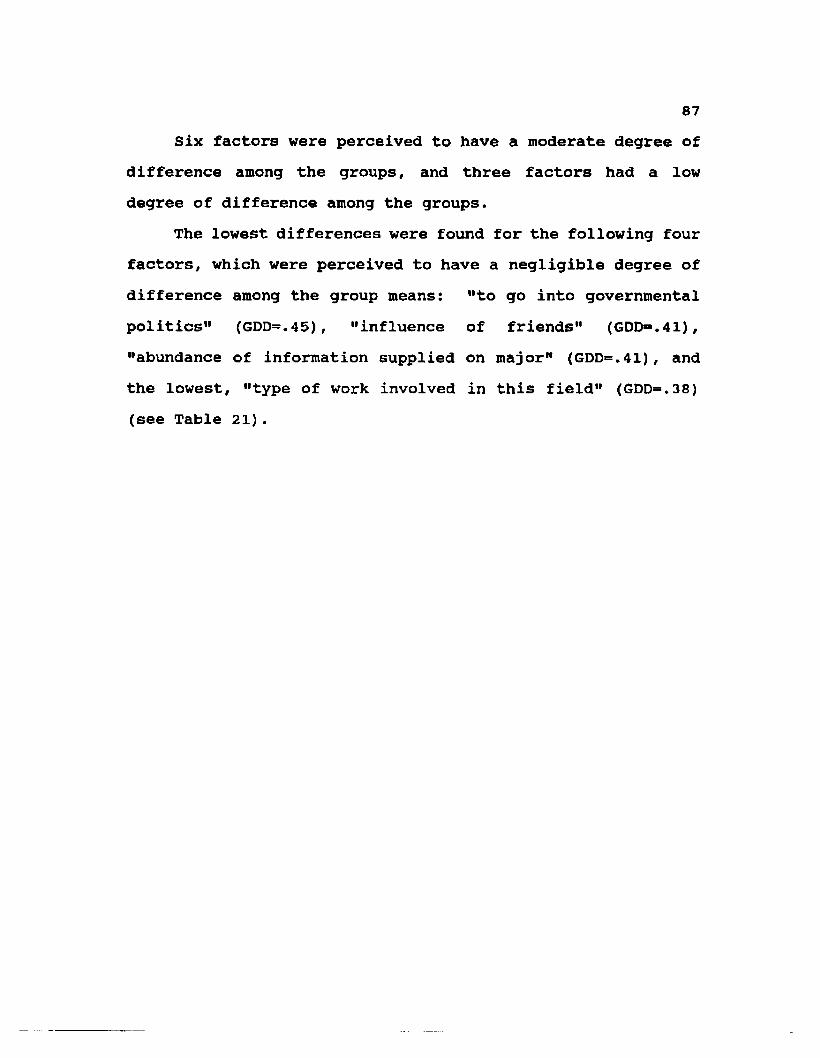
87Six factors were perceived to have a moderate degree of
difference among the groups, and three factors had a low degree of difference among the groups.
The lowest differences were found for the following four factors, which were perceived to have a negligible degree of difference among the group means: "to go into governmentalpolitics" (GDD=.45), "influence of friends" (GDD=.41), "abundance of information supplied on major" (GDD=.41), and the lowest, "type of work involved in this field" (GDD=.38) (see Table 21).
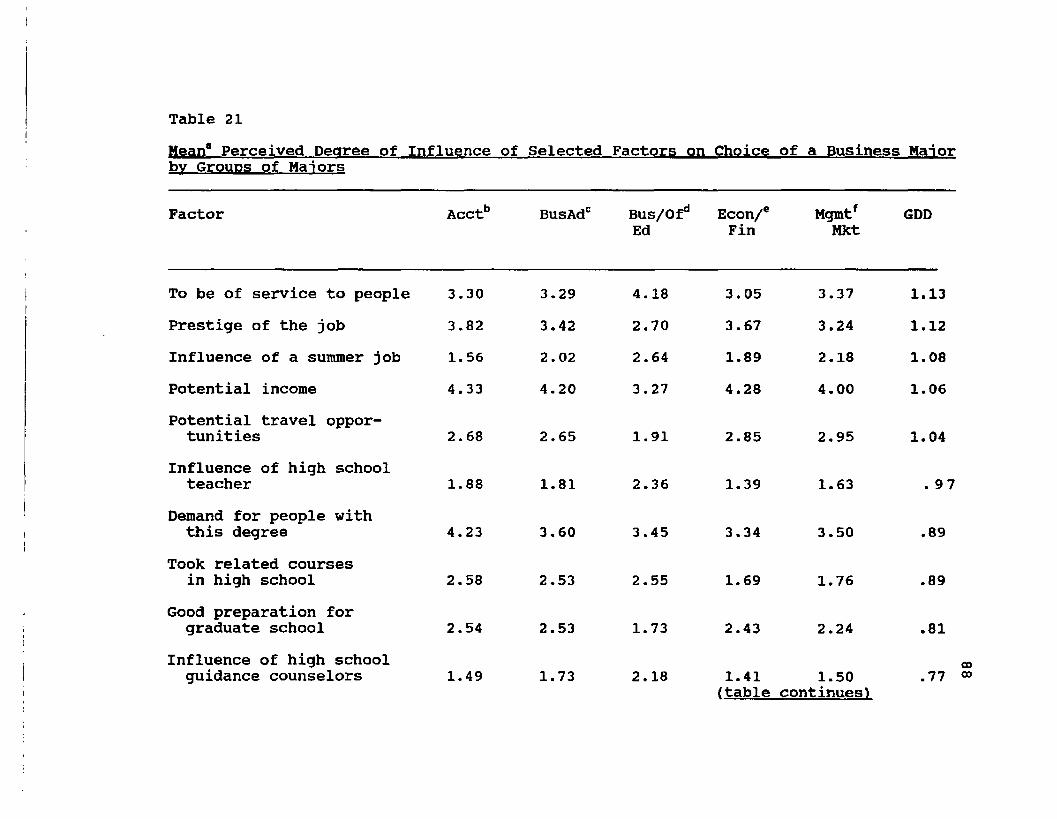
Table 21Mean8 Perceived Degree of Influence of Selected Factors on Choice of a Business Maiorbv GrouDs of Maiors
Factor Acctb BusAdc Bus/Of*1Ed
Econ/eFin
MgmtfMkt
GDD
To be of service to people 3.30 3.29 4.18 3.05 3.37 1.13Prestige of the job 3.82 3.42 2.70 3.67 3.24 1.12Influence of a summer job 1.56 2.02 2.64 1.89 2.18 1.08Potential income 4.33 4.20 3.27 4.28 4.00 1.06Potential travel opportunities 2.68 2.65 1.91 2.85 2.95 1.04
Influence of high school teacher 1.88 1.81 2.36 1.39 1.63 . 97
Demand for people with this degree 4.23 3.60 3.45 3.34 3.50 .89
Took related courses in high school 2.58 2.53 2.55 1.69 1.76 .89
Good preparation for graduate school 2.54 2.53 1.73 2.43 2.24 .81
Influence of high school guidance counselors 1.49 1.73 2.18 1.41 1.50
(table continues).77
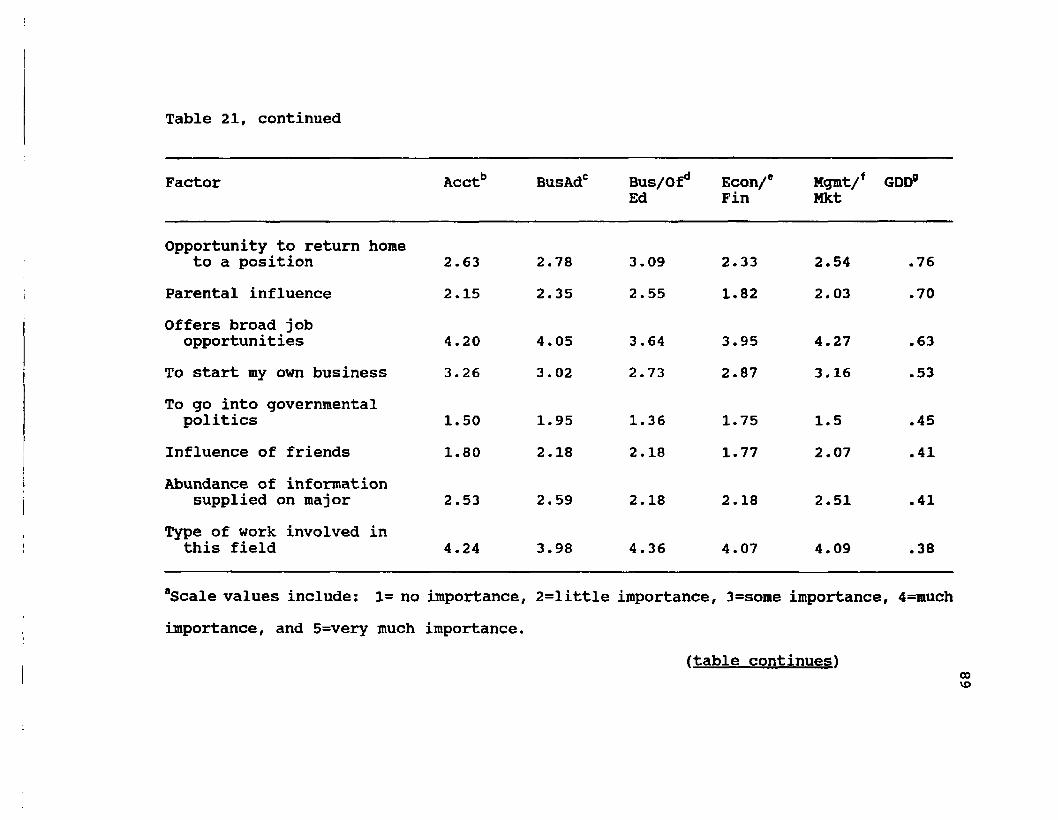
Table 21, continued
Factor Acctb BusAdc Bus/Of*1Ed
Econ/eFin
Mgmt/fMkt
GDD9
Opportunity to return home to a position 2.63 2.78 3.09 2.33 2.54 .76
Parental influence 2.15 2.35 2.55 1.82 2.03 .70Offers broad job
opportunities 4.20 4.05 3.64 3.95 4.27 .63To start my own business 3.26 3.02 2.73 2.87 3.16 .53To go into governmental
politics 1.50 1.95 1.36 1.75 1.5 .45Influence of friends 1.80 2.18 2.18 1.77 2.07 .41Abundance of information
supplied on major 2.53 2.59 2.18 2.18 2.51 .41Type of work involved in
this field 4.24 3.98 4.36 4.07 4.09 .38
"Scale values include: 1= no importance, 2=little importance, 3=some importance, 4=muchimportance, and 5=very much importance.
ftable continues)
Table 21 (continued)“AccountingbBusiness Administration cBusiness/Office Education dEconomics/Finance “Management/Market ingfGDD=Greatest degree of difference mean)
(highest group mean minus lowest group
91Objective 7
Objective seven was to determine why business students did not choose business education as a major in NABTE member universities in Tennessee.Perceived Influence of Selected Factors on Students1 Decisions Not to Choose Business Education as a Maior
Respondents who were not business education majors were asked to indicate the level of importance that various factors had on their decision not to select Business Education as a major. Table 22 presents overall means and standard deviations (in descending order of the mean importance value) for each of the identified factors which influenced students not to select business education as a major. The scale of importance used was: l=no importance, 2=little importance,3=some importance, 4=much importance, and 5=very much importance.
In interpreting the data, the following interpretive scale was established:
Mean Level of Importance1.00-1.50 No importance1.51-2.50 Little importance2.51-3.49 Some importance3.50-4.49 Much importance4.50-5.00 Very much importanceThe highest factors in influencing students not to choose
business education as a major were in the "some importance"
92(2.51-3.49) category. Those four factors included:"potential income" (mean=3.13), "does not offer broad job opportunities" (mean=3.03), "type of work involved in teaching" (mean=2.96), and "I am not familiar with business education as a major" (mean=2.73).
According to the interpretive scale, 11 factors were of "little importance" (1.51-2.50) in influencing students not to choose business education as a major, and three factors were identified as having "no importance" (1.00-1.50) in influencing the decision of students not to select Business Education as a major. The factor having the least importance was "my friends did not choose this major" (mean=1.27). Respondents1 Perceptions Regarding the Most Influential Factor on Students’ Decisions Not to Choose Business Education as a Maior
Respondents who were not Business Education majors were also asked to indicate the single most important factor which influenced them not to choose Business Education as a major. Table 23 presents the frequency and percentage of factors identified as the most important factor in not choosing Business Education as a major.
Seventy-seven of the respondents (22.9 percent) identified "potential income" as the most influential factor in not choosing Business Education. "I am not familiar with Business Education as a major" was named the most influential factor by 68 of the respondents (20.2 percent), and "the type
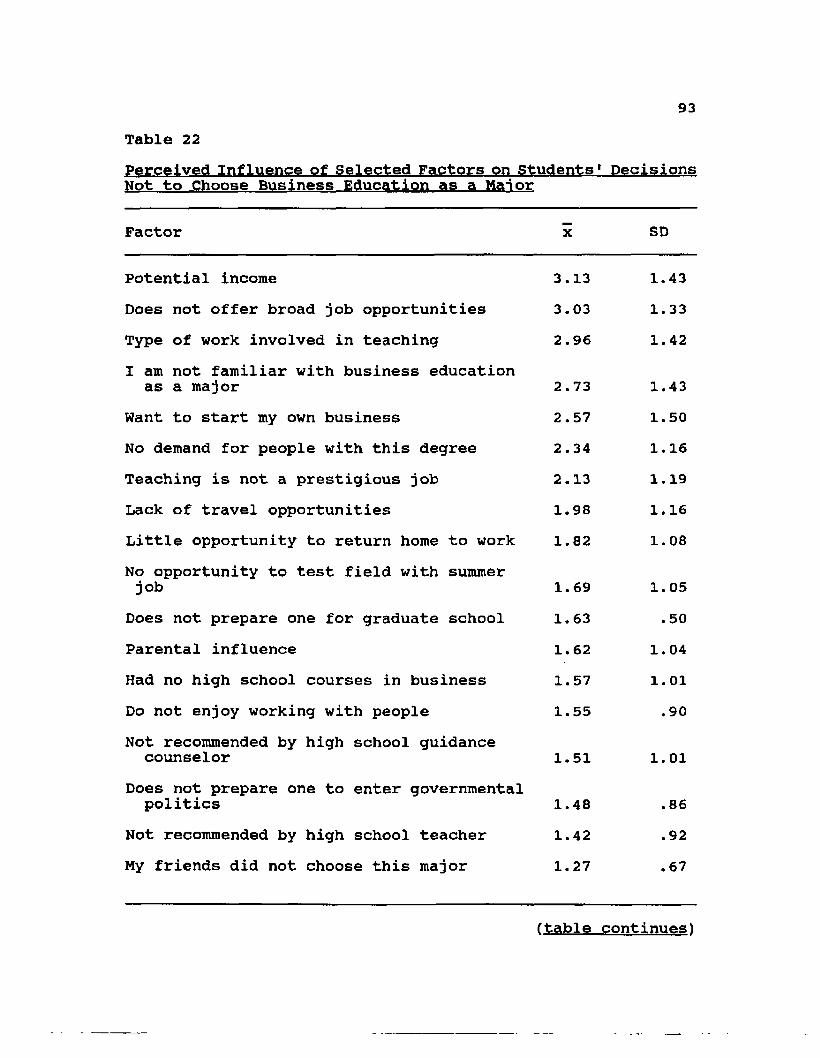
93Table 22
Not to Choose Business Education as a Maior
Factor X SD
Potential income 3.13 1.43Does not offer broad job opportunities 3.03 1.33Type of work involved in teaching 2.96 1.42I am not familiar with business education
as a major 2.73 1.43Want to start my own business 2.57 1.50No demand for people with this degree 2.34 1.16Teaching is not a prestigious job 2.13 1.19Lack of travel opportunities 1.98 1.16Little opportunity to return home to work 1.82 1.08No opportunity to test field with summer job 1.69 1. 05
Does not prepare one for graduate school 1.63 .50Parental influence 1.62 1.04Had no high school courses in business 1.57 1.01Do not enjoy working with people 1.55 .90Not recommended by high school guidance
counselor 1.51 1.01Does not prepare one to enter governmental
politics 1.48 .86Not recommended by high school teacher 1.42 .92My friends did not choose this major 1.27 .67
(table continues)
94Table 22 (continued)Note. This does not include business education majors. "Scale values include: l=no importance, 2=little importance,3-some importance, 4=much importance, and 5=very much importance.
of work involved in teaching" was the response of 60 students (17.9 percent). Only one student chose the factor, "does not prepare one to enter governmental politics," and one other student chose the factor, "my friends did not choose this major." None of the students chose the following two factors to be important in their decision not to choose Business Education as a major: "had no high school courses in business" and "not recommended by high school teacher."
Objective 8The eighth objective was to determine student perceptions
of careers and majors in business. Respondents were asked to indicate their degree of agreement or disagreement with each of the 88 perception statements, using the following scale: l=strongly disagree, 2=disagree, 3=undecided, 4=agree, and 5- strongly agree. Each of the items on the questionnaire related to one of the specific business majors.
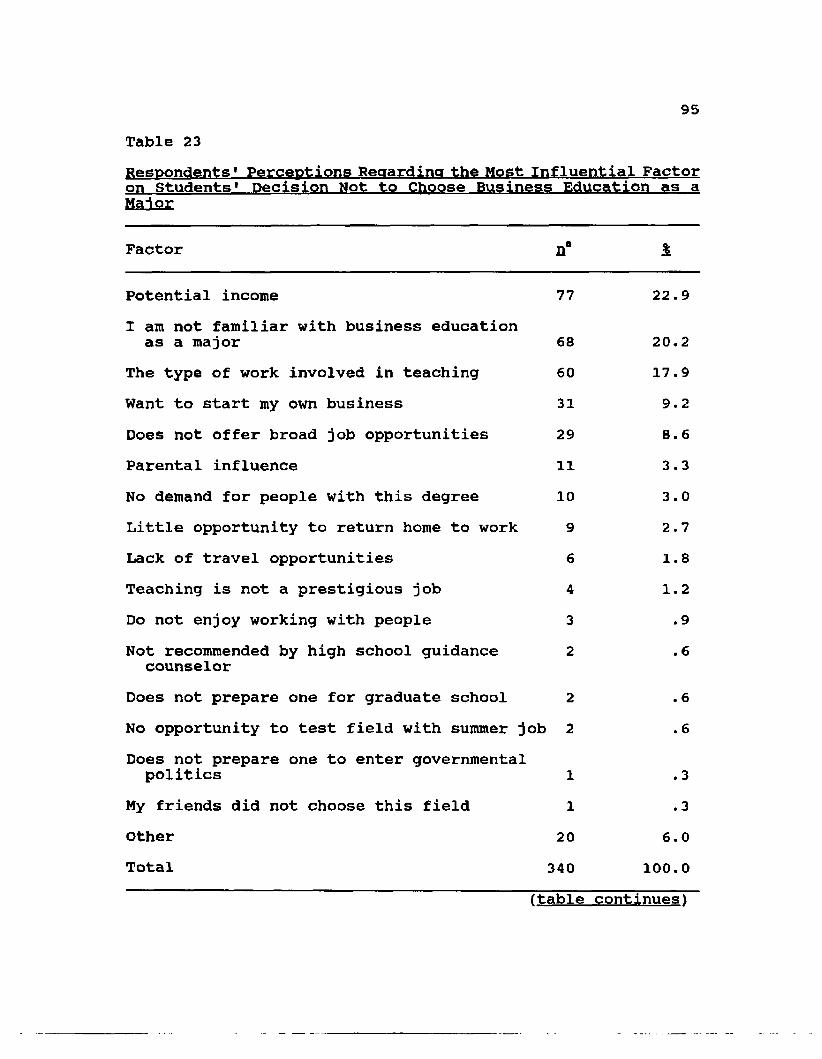
95Table 23Respondents1 Perceptions Regarding the Most Influential Factoron Students1 Decision Not to Choose Business Education as aMai or
Factor n* 1
Potential incomeI am not familiar with business education
77 22.9
as a major 68 20.2The type of work involved in teaching 60 17.9Want to start my own business 31 9.2Does not offer broad job opportunities 29 8.6Parental influence 11 3.3No demand for people with this degree 10 3.0Little opportunity to return home to work 9 2.7Lack of travel opportunities 6 1.8Teaching is not a prestigious job 4 1.2Do not enjoy working with people 3 .9Not recommended by high school guidance
counselor2 .6
Does not prepare one for graduate school 2 .6No opportunity to test field with summer job 2 Does not prepare one to enter governmental
.6
politics 1 .3My friends did not choose this field 1 .3Other 20 6.0Total 340 100.0
ftable continues\
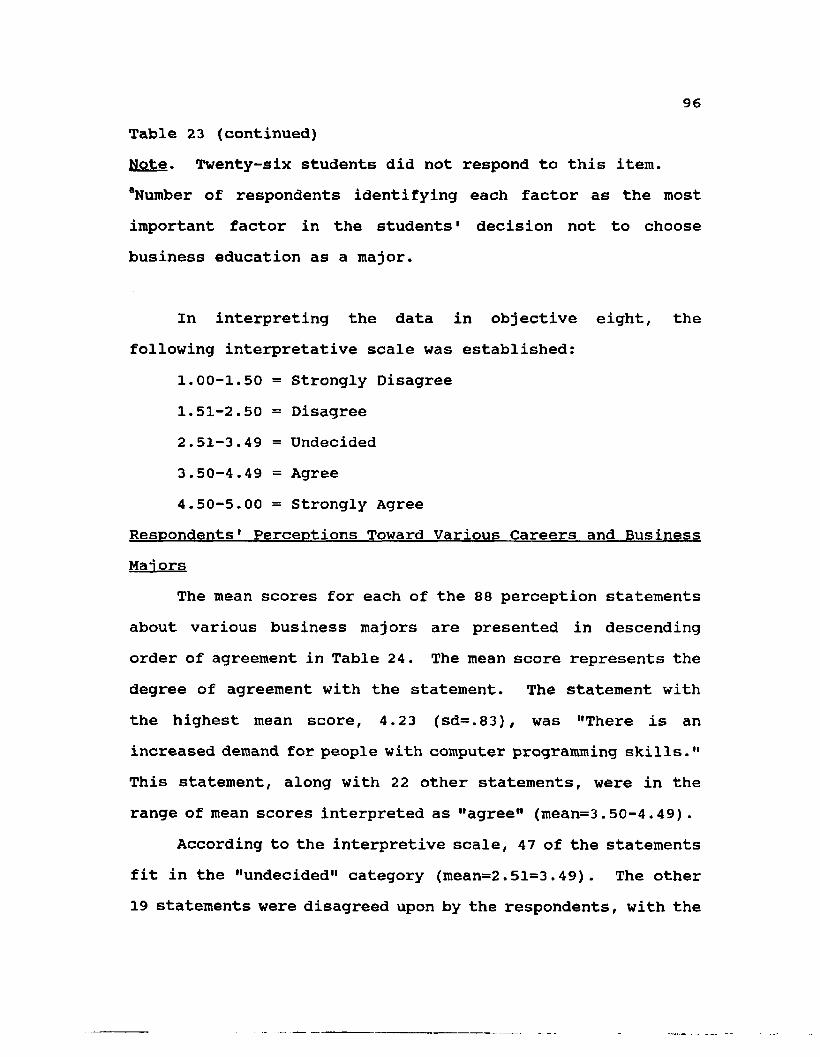
96Table 23 (continued)Note. Twenty-six students did not respond to this item. aNumber of respondents identifying each factor as the most important factor in the students' decision not to choose business education as a major.
In interpreting the data in objective eight, the following interpretative scale was established:
1.00-1.50 = Strongly Disagree1.51-2.50 = Disagree2.51-3.49 = Undecided3.50-4.49 = Agree4.50-5.00 = Strongly Agree
Respondents' Perceptions Toward Various Careers and Business Man ors
The mean scores for each of the 88 perception statements about various business majors are presented in descending order of agreement in Table 24. The mean score represents the degree of agreement with the statement. The statement with the highest mean score, 4.23 (sd=.83), was "There is anincreased demand for people with computer programming skills." This statement, along with 22 other statements, were in the range of mean scores interpreted as "agree" (mean=3.50-4.49).
According to the interpretive scale, 47 of the statements fit in the "undecided" category (mean=2.51=3.49). The other 19 statements were disagreed upon by the respondents, with the

97statement, "Computer science is the field of choice for nerds," receiving the lowest mean score of 1.72 (sd=.87).
No items fit in the strongly agree or strongly disagree categories.
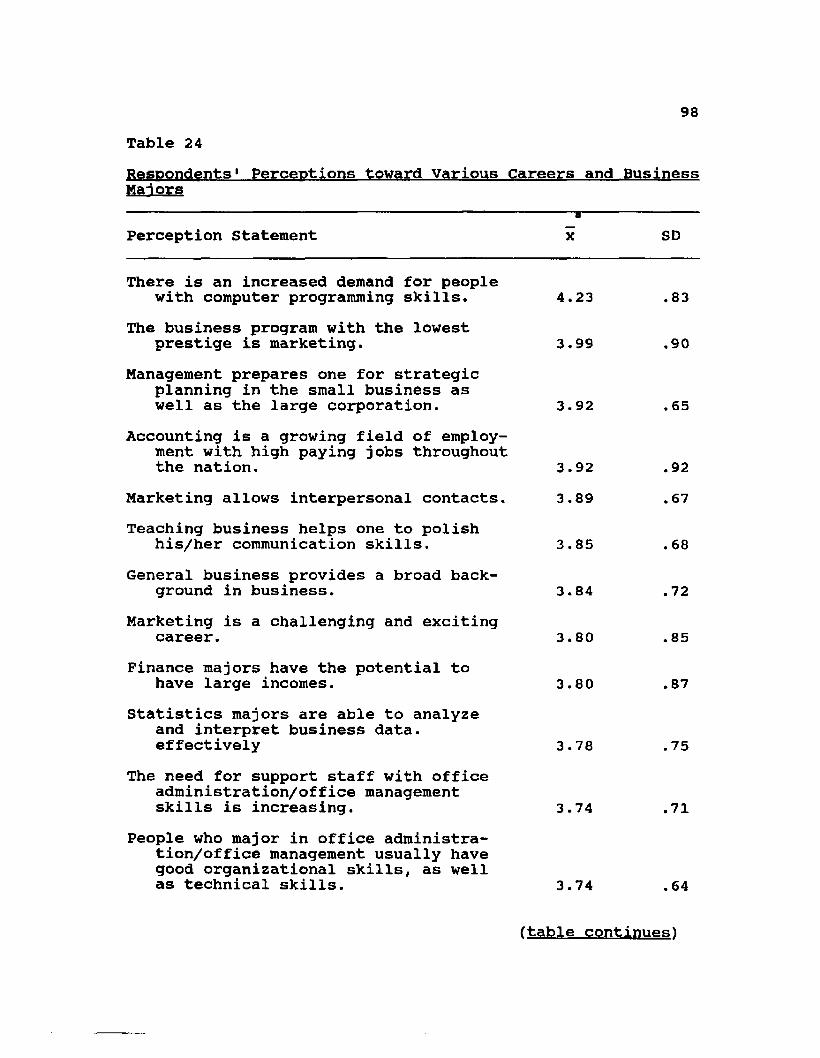
98Table 24Respondents1 Perceptions toward Various Careers and BusinessManors
Perception StatementB
X SD
There is an increased demand for people with computer programming skills. 4.23 .83
The business program with the lowest prestige is marketing. 3.99 .90
Management prepares one for strategic planning in the small business as well as the large corporation. 3.92 .65
Accounting is a growing field of employment with high paying jobs throughout the nation. 3.92 .92
Marketing allows interpersonal contacts. 3.89 .67Teaching business helps one to polish
his/her communication skills. 3.85 .68General business provides a broad back
ground in business. 3.84 .72Marketing is a challenging and exciting
career. 3.80 .85Finance majors have the potential to
have large incomes. 3.80 .87Statistics majors are able to analyze
and interpret business data, effectively 3.78 .75
The need for support staff with office administration/office management skills is increasing. 3.74 .71
People who major in office administration/office management usually have good organizational skills, as well as technical skills. 3.74 .64
ftable continues^
99Table 24 (continued)
Perception Statement x SD
A major in economics provides an excellentbackground for work with the government. 3.71 .75
The interaction with students as a business education teacher is a rewarding experience. 3.69 .79
Computer information systems/management information systems prepare one forbroad job opportunities. 3.69 .87
Economics majors have a good understandingof the world system. 3.67 .80
A major in management sharpens one'scommunications skills. 3.67 .89
Business administration prepares one notonly for a career but for everyday life 3.65 .78
People with insurance majors can findemployment in a variety of locations. 3.65 .71
Business administration is more widelyaccepted than general business. 3.61 .78
General business prepares students fora wide spectrum of jobs. 3.53 .85
Public administration majors increase their opportunities for working in agovernment/non-profit setting. 3.50 .67
Creative persons tend to major in marketing. 3.50 .90
There are high level positions in insurance. 3.49 .81
Real estate is a high risk career. 3.48 .97In order to succeed in marketing, one
often practices situational ethics. 3.48 .77
(table continues)
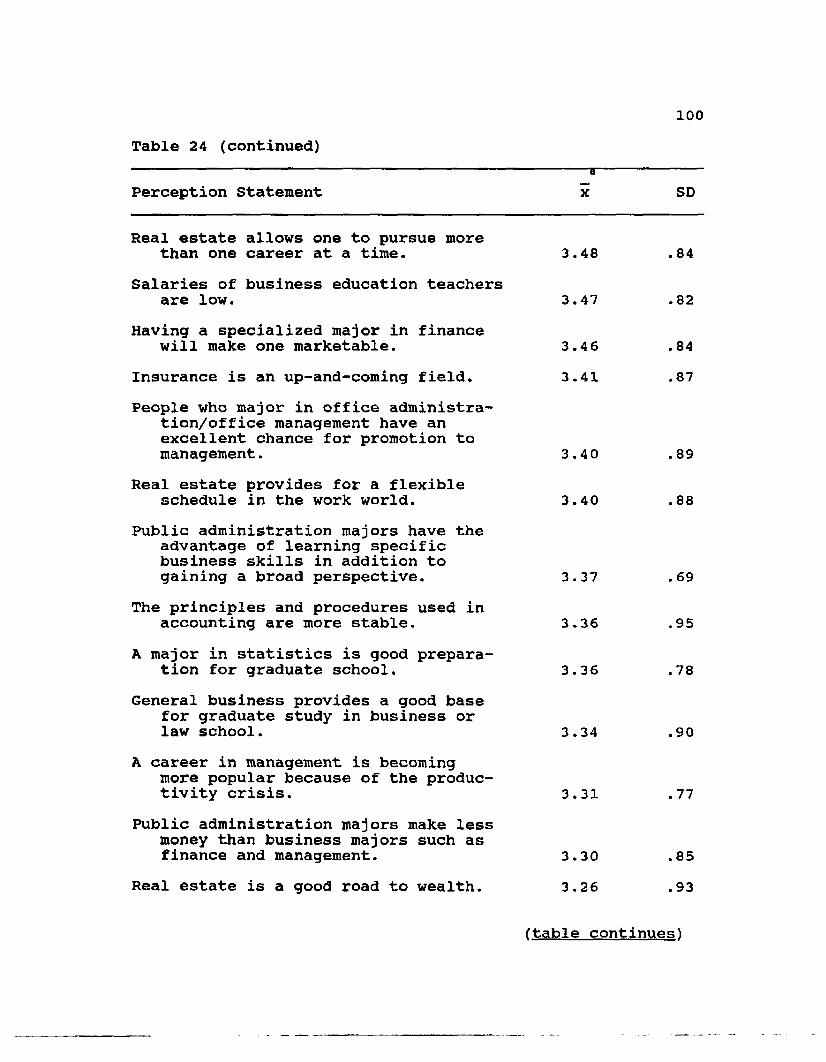
100Table 24 (continued)--------------------------------------------------a-----------Perception Statement x SD
Real estate allows one to pursue morethan one career at a time. 3.48 .84
Salaries of business education teachersare low. 3.47 .82
Having a specialized major in financewill make one marketable. 3.46 .84
Insurance is an up-and-coming field. 3.41 .87People who major in office administra
tion/office management have an excellent chance for promotion tomanagement. 3.40 .89
Real estate provides for a flexibleschedule in the work world. 3.40 .88
Public administration majors have the advantage of learning specific business skills in addition togaining a broad perspective. 3.37 .69
The principles and procedures used inaccounting are more stable. 3.36 .95
A major in statistics is good preparation for graduate school. 3.36 .78
General business provides a good base for graduate study in business orlaw school. 3.34 .90
A career in management is becomingmore popular because of the productivity crisis. 3.31 .77
Public administration majors make less money than business majors such asfinance and management. 3.30 .85
Real estate is a good road to wealth. 3.26 .93
ftable continues^
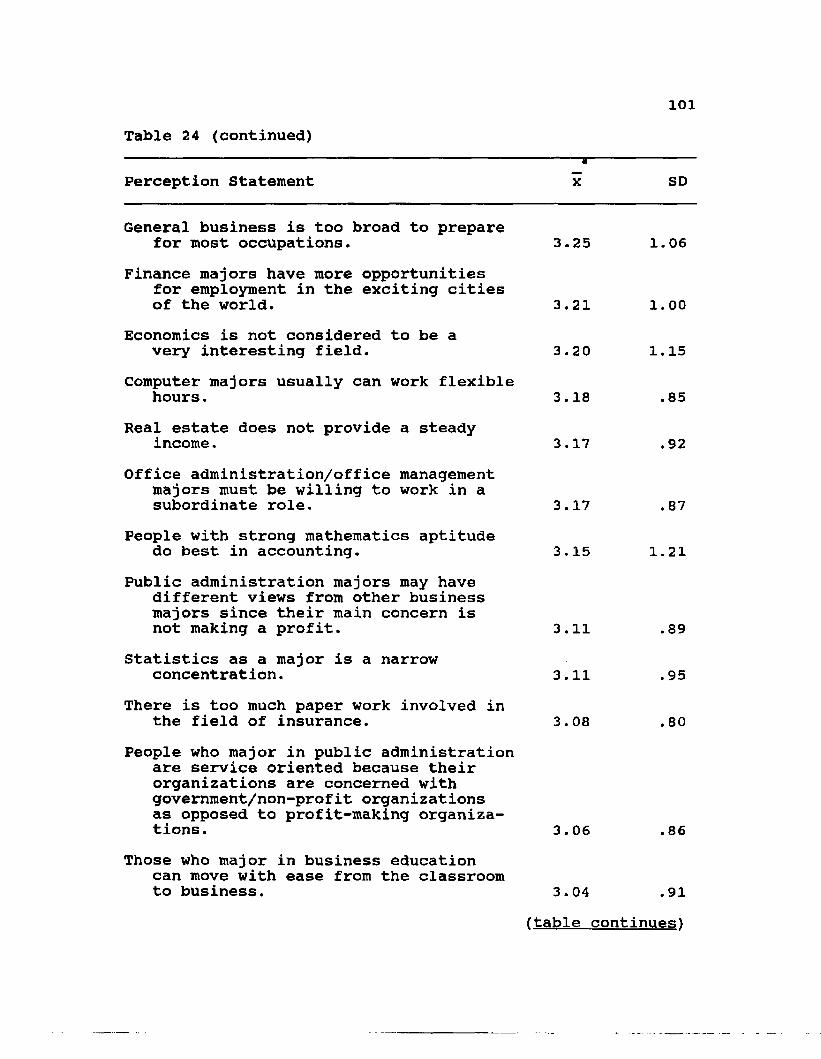
101Table 24 (continued)---------------------------------------------------------------------------------------a-------------------Perception Statement x SD
General business is too broad to preparefor most occupations. 3.25 1.06
Finance majors have more opportunities for employment in the exciting citiesof the world. 3.21 l.oo
Economics is not considered to be avery interesting field. 3.20 1.15
Computer majors usually can work flexiblehours. 3.18 .85
Real estate does not provide a steadyincome. 3.17 .92
Office administration/office management majors must be willing to work in asubordinate role. 3.17 .87
People with strong mathematics aptitudedo best in accounting. 3.15 1.21
Public administration majors may have different views from other business majors since their main concern isnot making a profit. 3.11 .89
Statistics as a major is a narrowconcentration. 3.11 .95
There is too much paper work involved inthe field of insurance. 3.08 .80
People who major in public administration are service oriented because their organizations are concerned with government/non-profit organizations as opposed to profit-making organizations. 3.06 .86
Those who major in business education can move with ease from the classroomto business. 3.04 .91
(table continues!
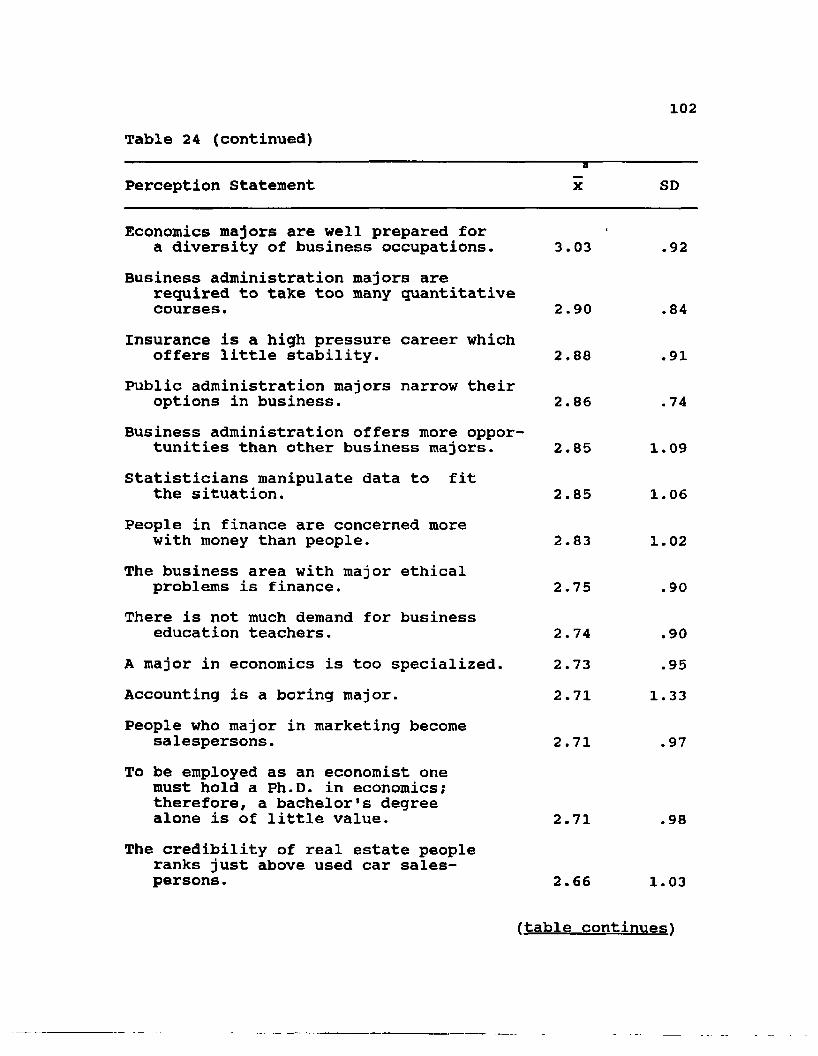
102Table 24 (continued)
TPerception Statement x SD
Economics majors are well prepared fora diversity of business occupations. 3.03 .92
Business administration majors arerequired to take too many quantitativecourses. 2.90 .84
Insurance is a high pressure career whichoffers little stability. 2.88 .91
Public administration majors narrow theiroptions in business. 2.86 .74
Business administration offers more opportunities than other business majors. 2.85 1.09
Statisticians manipulate data to fitthe situation. 2.85 1.06
People in finance are concerned morewith money than people. 2.83 1.02
The business area with major ethicalproblems is finance. 2.75 .90
There is not much demand for businesseducation teachers. 2.74 .90
A major in economics is too specialized. 2.73 .95Accounting is a boring major. 2.71 1.33People who major in marketing become
salespersons. 2.71 .97To be employed as an economist one
must hold a Ph.D. in economics; therefore, a bachelor's degreealone is of little value. 2.71 .98
The credibility of real estate people ranks just above used car salespersons. 2.66 1.03
(table continues\
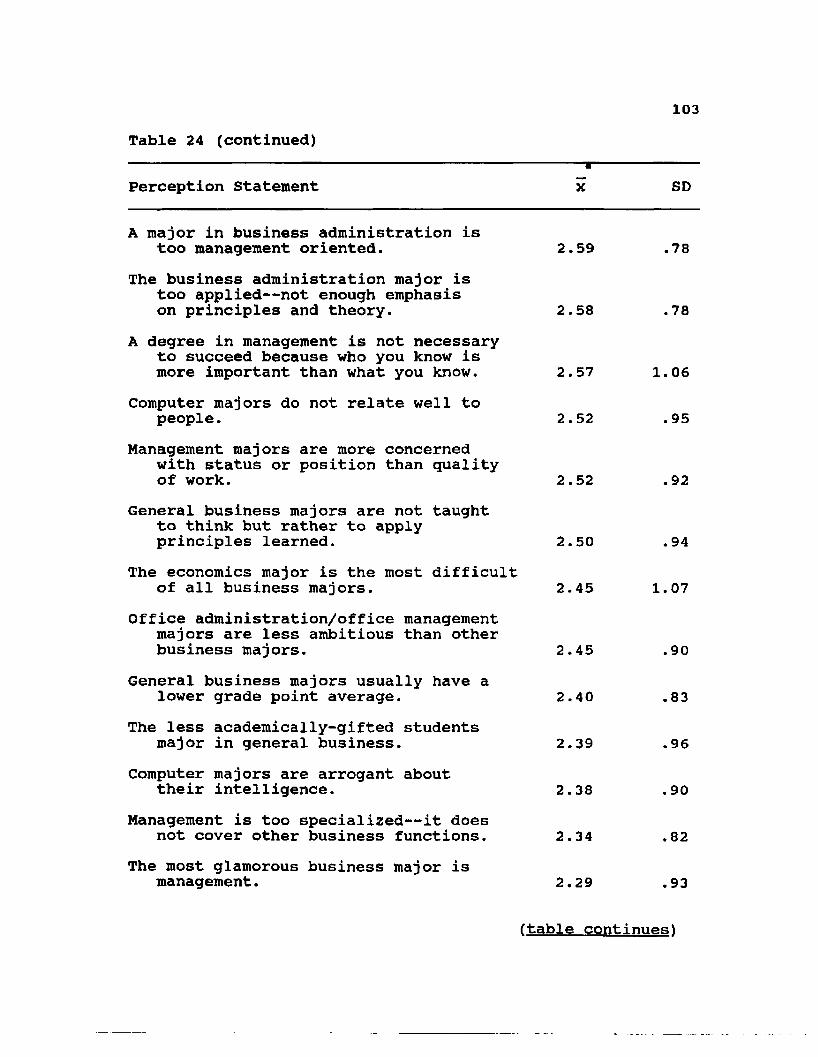
103Table 24 (continued)-------------------------------------------------------------------a---------------Perception statement x SD
A major in business administration istoo management oriented. 2.59 .78
The business administration major is too applied— not enough emphasison principles and theory. 2.58 .78
A degree in management is not necessary to succeed because who you know ismore important than what you know. 2.57 1.06
Computer majors do not relate well topeople. 2.52 .95
Management majors are more concerned with status or position than qualityof work. 2.52 .92
General business majors are not taught to think but rather to applyprinciples learned. 2.50 .94
The economics major is the most difficultof all business majors. 2.45 1.07
Office administration/office management majors are less ambitious than otherbusiness majors. 2.45 .90
General business majors usually have alower grade point average. 2.40 .83
The less academically-gifted studentsmajor in general business. 2.39 .96
Computer majors are arrogant abouttheir intelligence. 2.38 .90
Management is too specialized— it doesnot cover other business functions. 2.34 .82
The most glamorous business major ismanagement. 2.29 .93
(table continues^
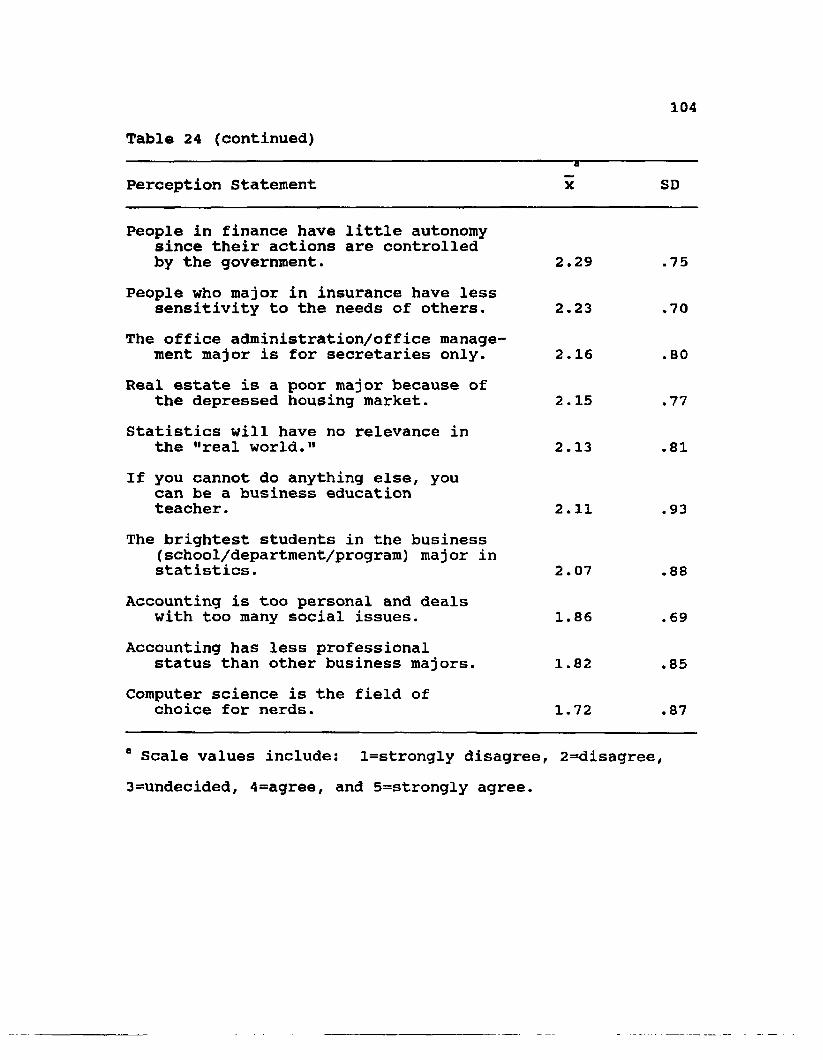
104Table 24 (continued)
Perception StatementaX SD
People in finance have little autonomy since their actions are controlled by the government. 2.29 .75
People who major in insurance have less sensitivity to the needs of others. 2.23 .70
The office administration/office management major is for secretaries only. 2.16 .80
Real estate is a poor major because of the depressed housing market. 2.15 .77
Statistics will have no relevance in the "real world." 2.13 .81
If you cannot do anything else, you can be a business education teacher. 2.11 .93
The brightest students in the business (school/department/program) major in statistics. 2.07 .88
Accounting is too personal and deals with too many social issues. 1.86 .69
Accounting has less professionalstatus than other business majors. 1.82 .85
Computer science is the field of choice for nerds. 1.72 .87
8 Scale values include: l=strongly disagree, 2=disagree,3=undecided, 4=agree, and 5=strongly agree.
105Respondents* Perception Subscores Toward Specific BusinessMajors
In order to compute overall perception scores toward specific business majors, items which were related to each of the specific majors (favorable and unfavorable) were grouped together to obtain subscores. The subscores consisted of approximately six items related to each specific major. (Computer Information Systems and Management Information Systems majors were grouped together in this case.) Approximately half of the items on the instrument were worded favorably and half were worded unfavorably regarding their perception of specific majors. Therefore, prior to calculation of subscores, those items worded unfavorably (reverse scale) were recoded such that all the items had the higher values associated with more favorable perceptions.
Table 25 presents data showing the mean overall perception score for specific business majors in descending order. The following interpretive scale was used forinterpreting the data:
1.00 - 1.50 = Strongly unfavorable1.51 - 2.50 = Unfavorable2.51 - 3.49 = Undecided3.50 - 4.49 = Favorable4.50 - 5.00 = Strongly Favorable
These descriptors were used to more accurately represent the findings reported here.

106
Four majors— Computer Information Systems/Management Information Systems, Accounting, and Office Administration/ Office Management, and Marketing— had mean scores between 3.75 and 3.50, indicating "favorable" agreement with the perception statements. General Business, Finance, and Management were within the 3.45 to 3.41 mean range, which indicated "undecided." The three majors with the lowest mean scores (3.24 to 3.15) were Real Estate, Statistics, and Public Administration, which also fit into the "undecided" category All of the other majors fell into the undecided category according to the interpretive scale adopted by the researcher. There were no items in the "unfavorable" or "strongly unfavorable" categories.
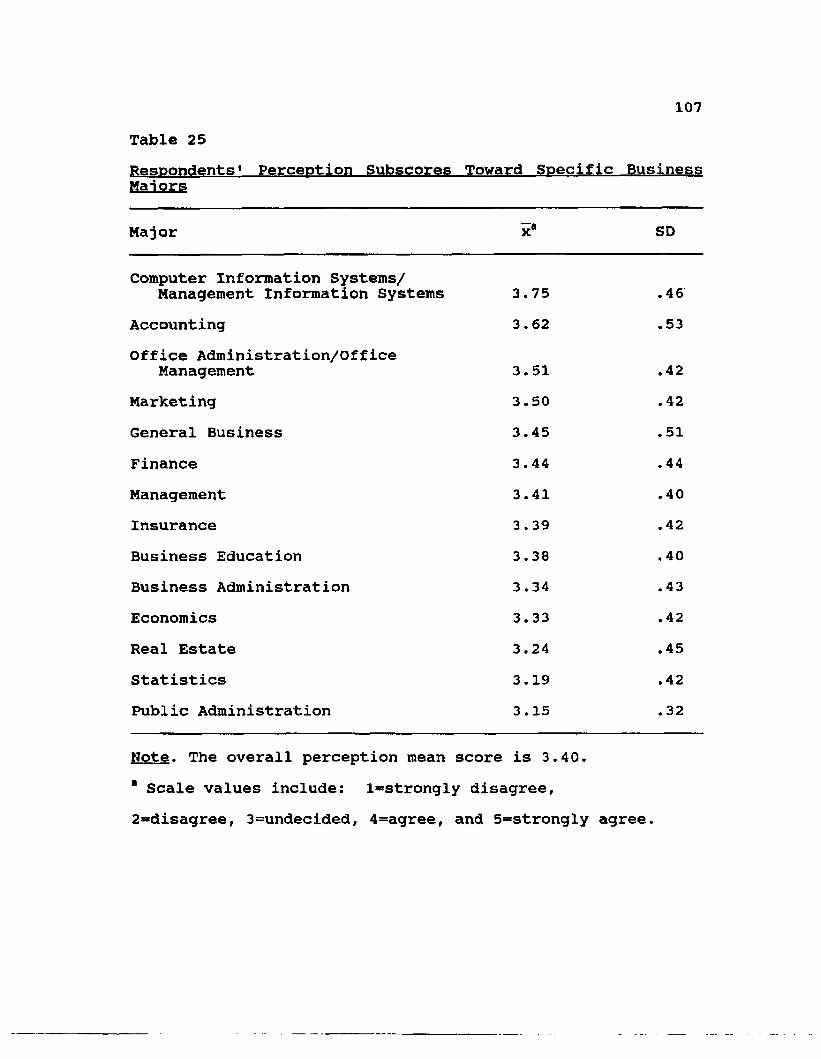
107Table 25
Mai ors
Major X* SD
Computer Information Systems/Management Information Systems 3.75 .46
Accounting 3.62 .53Office Administration/Office
Management 3.51 .42Marketing 3.50 .42General Business 3.45 .51Finance 3.44 .44Management 3.41 .40Insurance 3.39 .42Business Education 3.38 .40Business Administration 3.34 .43Economics 3.33 .42Real Estate 3.24 .45Statistics 3.19 .42Public Administration 3.15 .32
Note. The overall perception mean score is 3.40.* Scale values include: l=strongly disagree,2=disagree, 3=undecided, 4=agree, and 5=strongly agree.
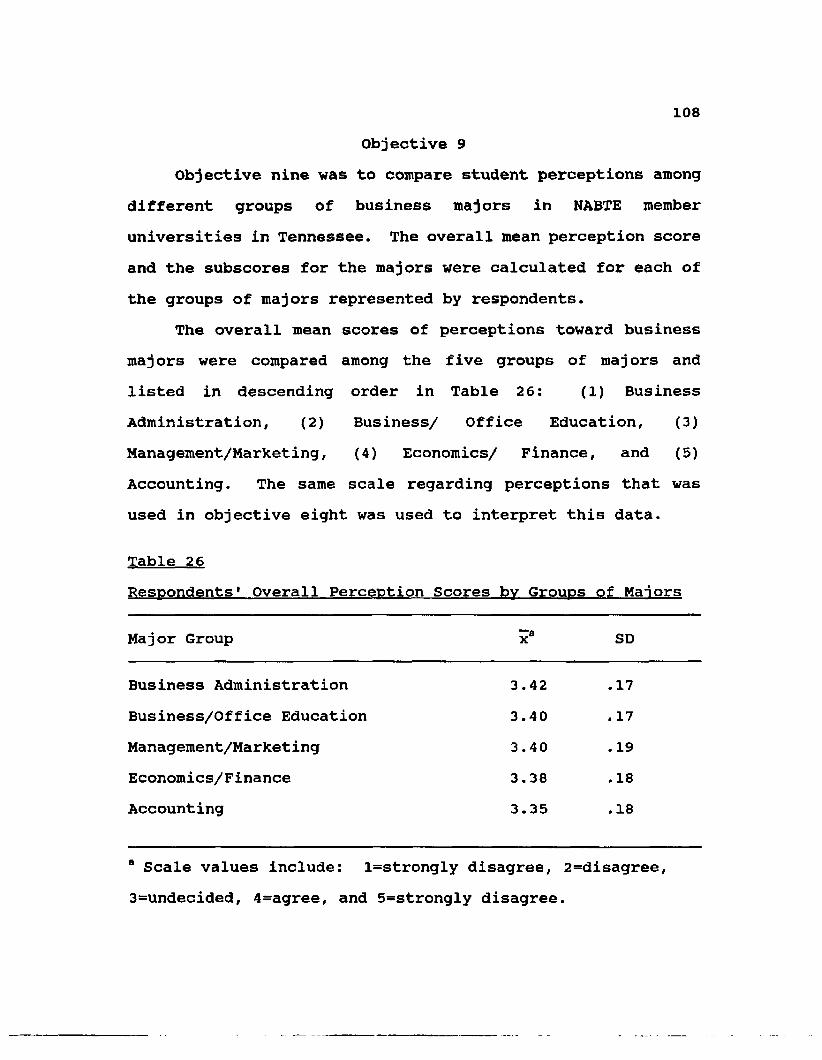
108Objective 9
Objective nine was to compare student perceptions among different groups of business majors in NABTE member universities in Tennessee. The overall mean perception score and the subscores for the majors were calculated for each of the groups of majors represented by respondents.
The overall mean scores of perceptions toward business majors were compared among the five groups of majors and listed in descending order in Table 26: (l) BusinessAdministration, (2) Business/ Office Education, (3) Management/Marketing, (4) Economics/ Finance, and (5) Accounting. The same scale regarding perceptions that was used in objective eight was used to interpret this data.
Table 26Respondents1 Overall Perception Scores bv Groups of Manors
Major Group x8 SD
Business Administration 3.42 .17Business/Office Education 3.40 . 17Management/Marketing 3.40 .19Economics/Finance 3.38 .18Accounting 3.35 .18
" Scale values include: l=strongly disagree, 2=disagree,3=undecided, 4=agree, and 5=strongly disagree.
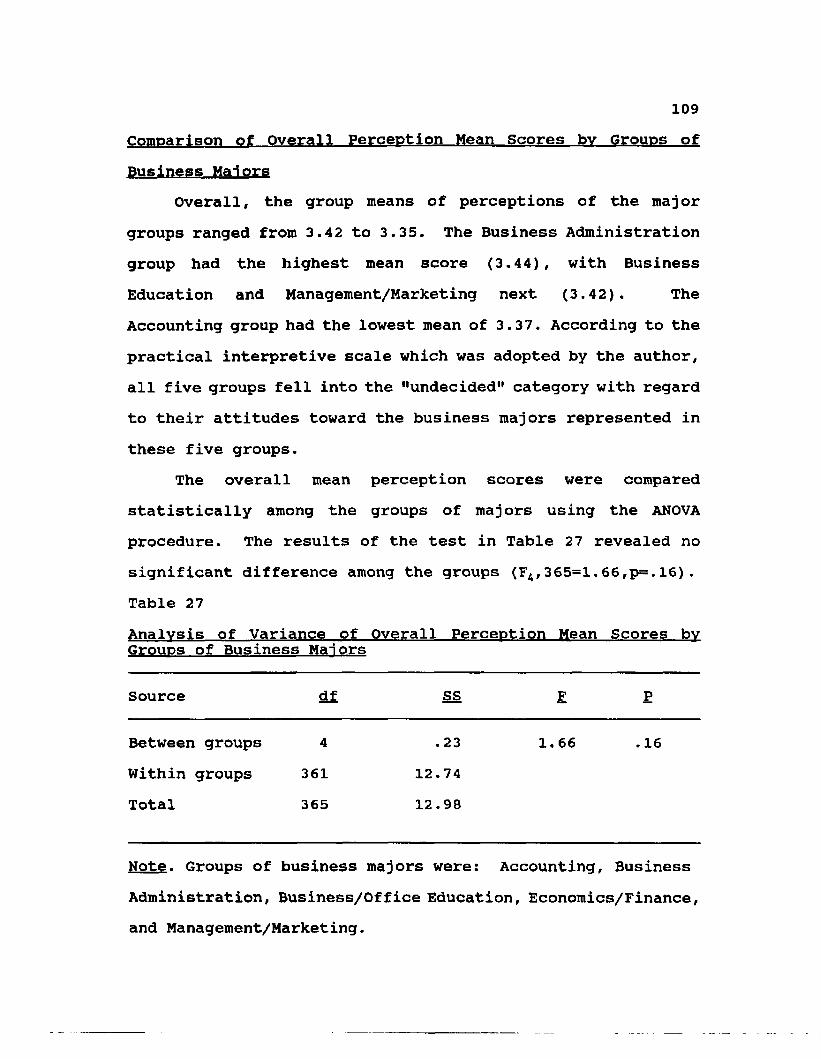
109Comparison of Overall Perception Mean Scores bv Groups of Business Majors
Overall, the group means of perceptions of the major groups ranged from 3.42 to 3.35. The Business Administration group had the highest mean score (3.44), with Business Education and Management/Marketing next (3.42). The Accounting group had the lowest mean of 3.37. According to the practical interpretive scale which was adopted by the author, all five groups fell into the "undecided" category with regard to their attitudes toward the business majors represented in these five groups.
The overall mean perception scores were compared statistically among the groups of majors using the ANOVA procedure. The results of the test in Table 27 revealed no significant difference among the groups (FA,365=1.66,p=.16). Table 27Analysis of Variance of Overall Perception Mean Scores by Groups of Business Manors
Source df SS F P
Between groups 4 .23 1.66 .16Within groups 361 12.74Total 365 12.98
Note. Groups of business majors were: Accounting, BusinessAdministration, Business/Office Education, Economics/Finance, and Management/Marketing.
110Comparison of Mean Perception Subscores Toward Specific Business Manors bv Groups of Majors
The mean and standard deviation of the perception subscore for each major by groups is presented in Table 28. The subscores among the groups of majors were compared statistically using the ANOVA procedures with Tukey's posthoc multiple comparison. To minimize the problem of inflation of experiment-wise error, the alpha level of .01 was used for these analyses.
The results of the ANOVA test revealed that there were significant differences in the group means of the perceptions of the statements toward seven of the business majors:
Accounting. When comparing the perception of the five groups toward the Accounting major, the mean score of the Accounting Group was significantly higher than the other four groups (p=.001).
Business Administration. The perception score of the Business Administration Group toward the Business Administration major was significantly higher than three of the groups— Accounting, Economics/Finance, and Management/ Marketing (p =.001).
Finance. The perception score of the Economics-Finance Group toward the Finance major was significantly higher than the other four groups (p =.001).
General Business. The perception toward the General Business major of the Business Administration Group was
Illsignificantly higher than the perceptions of three of the groups— Accounting, Economics/Finance, and Management/ Marketing (p=.001)). The perception score of the Management/ Marketing Group toward General Business was significantly higher than the Accounting Group (p =.001).
Management. The perception score toward the Management major was significantly different among the following groups: the Management/Marketing and the Business Administration Groups were significantly higher than the Economics/Finance and the Accounting Groups (p =.001).
Marketing. The perception toward the Marketing major was significantly higher for the Management/Marketing group than for each of the other four groups. There were no significant differences among the other four groups (p=.001).
Office Administration/Office Management. The perception toward the Office Administration/ Office Management major was significantly different as follows: Business/Office Education group was higher from three groups— Accounting, Economics/ Finance, and Management/Marketing Groups. The Business Administration Group was significantly higher than Accounting and Economics/Finance (p=.001).
No two groups were significantly different at the .01 alpha level in their perception toward the following majors: Business Education, Computer Information Systems/Management Information Systems, Economics, Insurance, Real Estate, Public Administration, and Statistics.
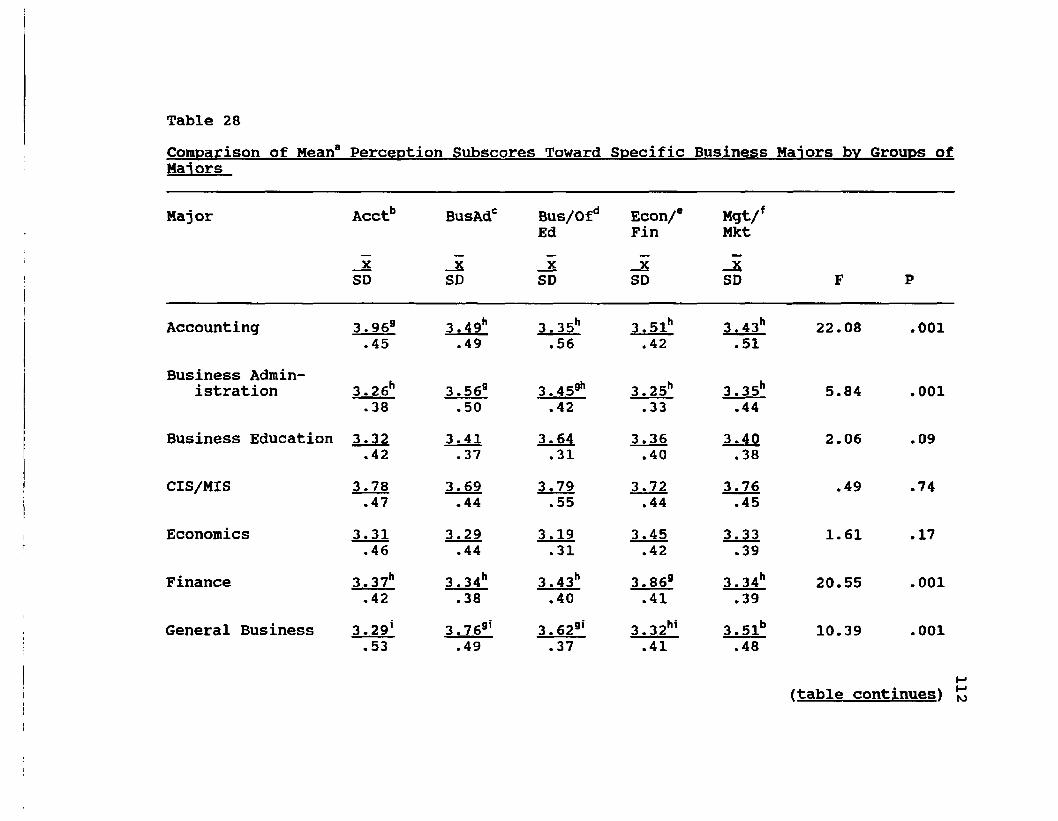
Table 28Comparison of Mean8 Perception Subscores Toward Specific Business Majors bv Groups of Majors
Major Acctb
XSD
BusAdc
XSD
Bus/Ofd EdXSD
Econ/*FinX
SD
Mgt/fMktXSD F P
Accounting 3.969 3.49h 3.35h 3.51h 3.43h 22.08 .001.45 .49 .56 .42 .51
Business Administration 3.26h 3.569 3.45911 3.25h 3.35h 5.84 .001
.38 .50 .42 .33 .44Business Education 3.32 3.41 3.64 3.36 3.40 2.06 .09
.42 .37 .31 .40 .38CIS/MIS 3.78 3.69 3.79 3.72 3.76 .49 .74
.47 .44 .55 .44 .45Economics 3.31 3.29 3.19 3.45 3.33 1.61 .17
.46 .44 .31 .42 .39Finance 3.37h 3.34h 3.43h 3.869 3.34h 20.55 .001
.42 .38 .40 .41 .39General Business 3.29' 3.769’ 3.629' 3.32hi 3.51b 10.39 .001
.53 .49 .37 .41 .48
(table continues\
112
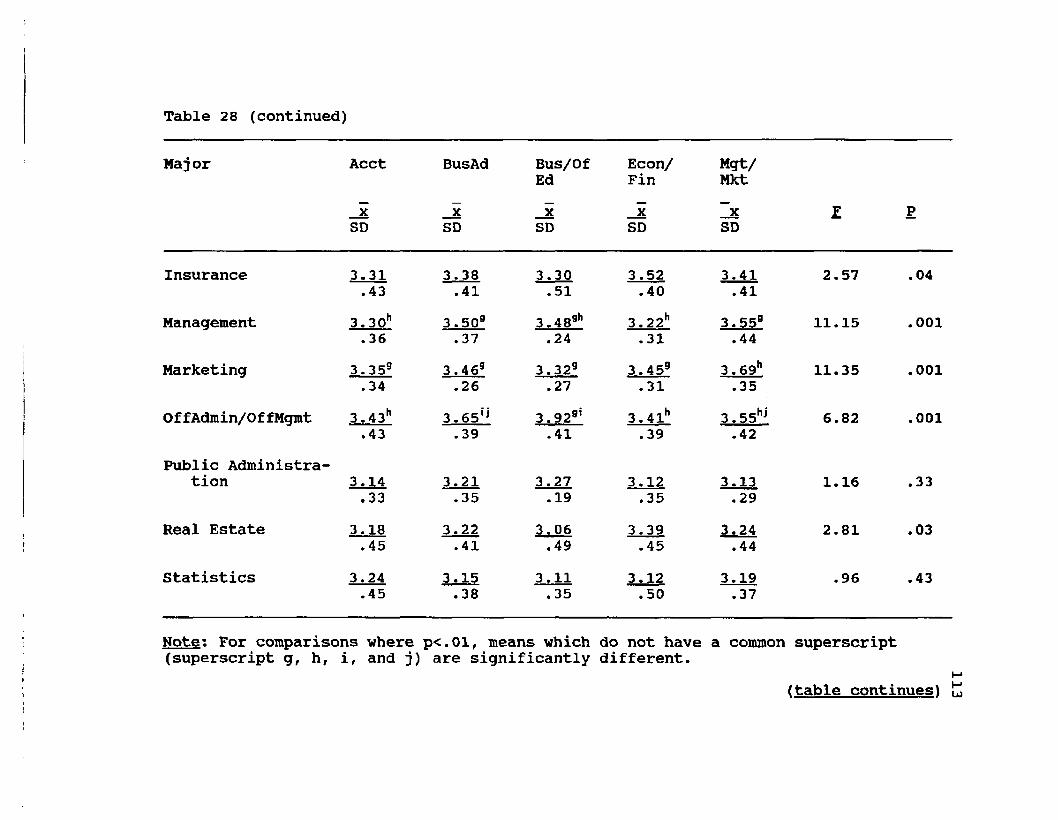
Table 28 (continued)
Major Acct
XSD
BusAd
XSD
Bus/OfEdXSD
Econ/FinXSD
Mgt/MktX
SDF P
Insurance 3.31 3.38 3.30 3.52 3.41 2.57 .04.43 .41 .51 .40 .41
Management 3.30h 3.509 3.48gh 3.22h 3.559 11.15 .001.36 .37 .24 .31 .44
Marketing 3.359 3.46s 3.329 3.459 3 .69h 11.35 .001.34 .26 .27 .31 .35
OffAdmin/OffMgmt 3.43h 3.65ij 3.929’ 3.41h 3.55hj 6.82 .001.43 .39 .41 .39 .42
Public Administration 3.14 3.21 3.27 3.12 3.13 1.16 .33
.33 .35 .19 .35 .29Real Estate 3.18 3.22 3.06 3.39 3.24 2.81 .03
.45 .41 .49 .45 .44Statistics 3.24 3.15 3.11 3.12 3.19 .96 .43
.45 .38 .35 .50 .37
Note: For comparisons where pc.Ol, means which do not have a common superscript (superscript g, h, i, and j) are significantly different.
(table continues!
113
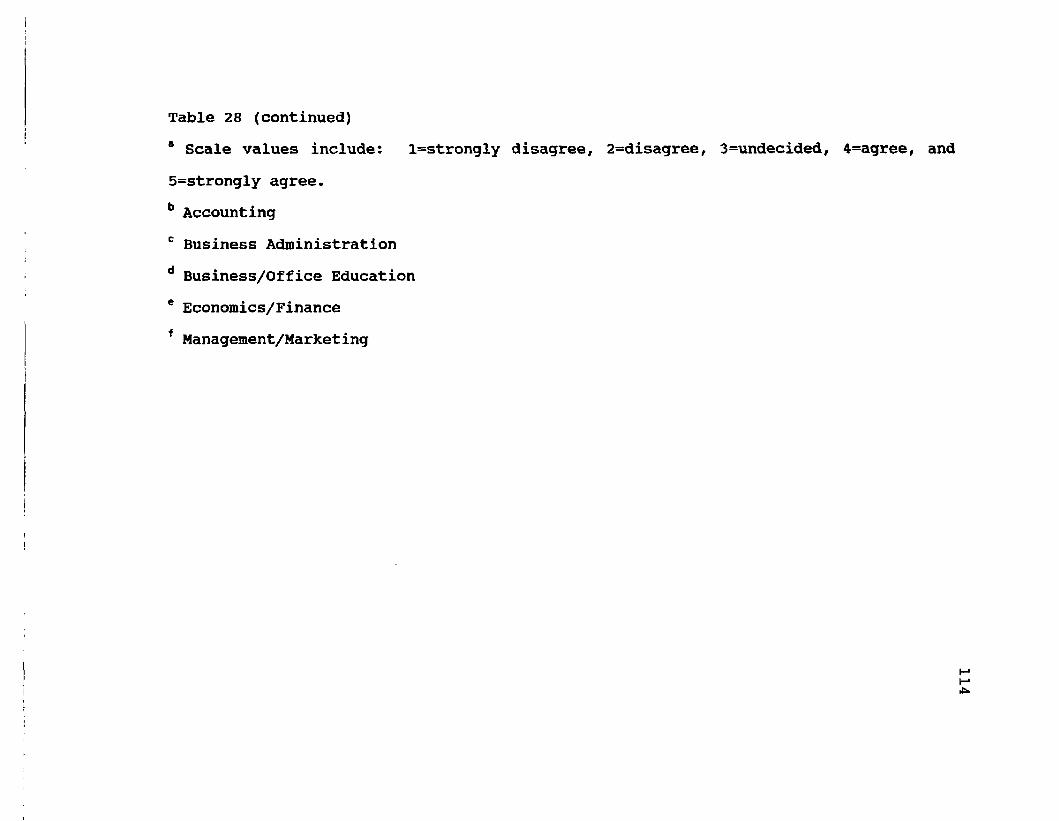
Table 28 (continued)* Scale values include: l=strongly disagree, 2=disagree, 3=undecided, 4=agree, and5=strongly agree. b Accountingc Business Administration d Business/Office Education e Economics/Finance f Management/Marketing
114
CHAPTER VSUMMARY, FINDINGS, CONCLUSIONS, AND RECOMMENDATIONS
SummaryThe purpose of this study was to identify the factors which
influence students to select various business majors in Tennessee universities with membership in NABTE (National Association of Business Teacher Education). In addition, the study sought to determine factors which influence student decisions regarding business teacher education.
Specific objectives of the study were:1. To describe students majoring in business curricula in
National Association of Business Education (NABTE) member universities in Tennessee on selected demographic characteristics.
2. To compare the demographic characteristics of business students among the groups of business majors in NABTE member universities in Tennessee.
3. To determine the degree of desirability of the various business majors as perceived by business students enrolled in NABTE member universities in Tennessee.
4. To compare the perceived degree of desirability of business majors among students enrolled in different groups of business majors.
5. To determine the influence of various factors on the selection of a college major by business students in NABTE member universities in Tennessee.
115
1166. To compare the perceived influence of various factors
on the selection of a major among students enrolled indifferent groups of business majors.
7. To determine why business students did not choosebusiness education as a major in NABTE member universities inTennessee.
8. To determine student perceptions toward careers and majors in business.
9. To compare student perceptions among different groups of business majors in NABTE member universities in Tennessee.
The target population for this study was junior level students in business-related majors at Tennessee universities with membership in NABTE. All six Tennessee universities with membership in NABTE were included in the study. The accessible population included two core business classes at the junior level which were required of all majors (including business teacher education) at each of the six institutions.
Data were collected from 366 business students at the NABTE affiliated universities in Tennessee using a researcher designed questionnaire, which was validated with a panel of experts in vocational education and representatives from NBEA (National Business Education Association) and NABTE (National Association of Business Teacher Education). The questionnaire was field tested with a sample of 54 business students throughout the United States.
117The instrument consisted of three parts. Part I asked
questions which described business majors on their specific choice of major, the degree of desirability of the various business majors as perceived by business students, and factors which influenced choice of major; Part II asked questions which dealt with general perceptions regarding careers in business; and Part III included questions regarding demographics.
Descriptive statistics were used to describe the demographic characteristics of the students, the perceived desirability of various business majors, and the perceived influence of selected factors on students' choice of a business major, and the perceptions regarding business careers and majors. The Chi Square and ANOVA tests were used for comparisons when appropriate, with Tukey's posthoc comparison test.
FindingsThe following is a summary of the major findings of the
study:1. Almost 9 out of 10 (89.5%) of the business students
were 26 years old or younger. The mean age was 22.6.2. Almost one-half (46.5%) of the respondents were reared
in a town or small city .3. Almost three-fourths (71.2%) of the students had GPA's
which ranged from 2.50 to 3.49. The average GPA was 2.97 with a standard deviation of .46.
1184. Over one-third (127 or 38.7%) of the students had
fathers whose occupations were in the Management/ Marketing area. Approximately 50% of the students' mothers were employed in two areas: (l) Service andAgriculture (101 or 29.5%), and (2) Administrative Support (67 or 19.6%).
5. Accounting was the major reported by the largest number of students (97 or 26.5%).
6. Business Education was determined to be one of the least frequently reported majors with only 4 (1.1%).
7. When grouping the majors into five categories, the Management/Marketing group had the largest number (123 or 33.6%) of respondents.
8. When grouped together, Business Education and Office Administration/Office Management had the smallest number of respondents (11 or 3.0%).
9. The ANOVA test and Tukey's posthoc multiple comparison test revealed that the mean GPA (3.19) of the Accounting group was significantly higher than three groups: Business/Office Education (2.71), BusinessAdministration (2.79), and Management/Marketing (2.80).
10. The three majors with the highest perceived desirability score were Marketing (mean=3.49), Management (mean=3.37), and Management Information Systems (mean=3.22).
11911. Accounting was perceived to be the most desirable
business major by the largest number of respondents (94 or 25.7%).
12. Only 12 respondents (3.4%) perceived Business Education to be the single most desirable business major.
13. When comparing the perceived degree of desirability of business majors among students enrolled in different groups of majors, the Accounting (mean=4.42) major showed the greatest degree of difference among these groups (GDD=2.09), which was considered to be a high level of significance.
14. Five factors were perceived to have "much importance" (3,50-4.49) on the business students in selecting their major:(1) potential income (mean=4.16)(2) offers broad job opportunities (mean=4.14)(3) type of work involved in this field (mean=4.13)(4) demand for people with this degree (mean=3.70)(5) prestige of the job (mean=3.51)
15. The top three factors perceived as the single most influential in selecting a business major were:(1) potential income (n=81, 22.8%)(2) offers broad job opportunities (n=62, 17.4%)(3) type of work involved in this field (n=60, 16.9%)
12016. The top four factors which were of "some importance"
in influencing students not to choose business education as a major were:(1) potential income (mean=3.13)(2) does not offer broad job opportunities (mean=3.03)(3) type of work involved in teaching (mean=2.96)(4) I am not familiar with business education as a
major (mean=2.73).17. The top three factors perceived as the single most
influential in not selecting business education as a major were:(1) potential income(2) I am not familiar with business education as a
major(3) the type of work involved in teaching
18. The following four perception statements about businesscareers or majors received the highest mean scores:(1) There is an increased demand for people with
computer programming skills (mean=4.23).(2) The business program with the lowest prestige is
marketing (mean=3.99).(3) Management prepares one for strategic planning in
the small business as well as the large corporation (mean=3.92).
121(4) Accounting is a growing field of employment with
high paying jobs throughout the nation (mean=3.92).
19. The four majors with the highest overall group mean subscores of agreement with perception statements were:(1) Computer Information Systems/Management
Information Systems (mean=3.75)(2) Accounting (mean=3.62)(3) Office Administration/Office Management
(mean=3.51)(4) Marketing (mean=3.50).
20. When comparing the perception scores of groups of majors toward specific majors, there was a narrow range of mean scores (3.42 to 3.35), which fit into the "undecided" category. Business Administration had the highest mean score (3.42).
21. When comparing the perception subscores toward specific business majors by groups of majors, the mean score of the Accounting group was significantly higher than the other four groups (p=.001). The perception subscores of the Business Administration group toward the Business Administration major were significantly higher than three of the groups— Accounting, Economics/Finance and Management/Marketing (p=.001).
12222. The perception subscore of the Business/Office
Education group toward the Office Administration/ Office Management major was significantly higher than three groups— Accounting, Economics/Finance andManagement/Marketing.
Conclusions and RecommendationsBased on the findings of this study, the researcher makes
the following conclusions and recommendations:1. The majority of the respondents were 26 years old or
younger.This conclusion is based on the finding that 89.5 percent
of the business students were 26 years old or younger.2. More of the respondents were reared in a town or small
city than in other population areas.This conclusion is based on the findings that 46.5% of
the students were reared in a town or small city.3. The GPA of the majority of the business students was
above average.This conclusion is based on the finding that 71.2 percent
of the students had GPAs which ranged from 2.50 to 3.49, with an average GPA of 2.97.
4. The most prevalent father's occupation was in the area of Management and Marketing. The mother of the students was employed more in two areas: (a) Service and Agriculture, and (b) Administrative Support.
123This conclusion is based on the findings that 38.7% of the
students had a father whose occupation was in the Management and Marketing area. Approximately one-half of the mothers' occupations fit into two categories: (a) Service andAgriculture (29.5%) and (b) Administrative Support (19.6%).
5. Accounting was the most prevalent major selected by the business students.
This conclusion is based on the finding that the largest group of respondents (97 or 26.5%) reported Accounting as their major.
6. Business Education was perceived to be one of the least desirable business majors and was infrequently chosen as a major.
This conclusion is based on the finding that only 12 respondents (3.4%) perceived Business Education to be the single most desirable business major, and only 4 students (1.1%) reported Business Education as their major.
This conclusion is similar to the findings of Calhoun (1983); Friedheim (1982); Astin, Green, and Korn (1987); and Gades and Culver(1982). All of these studies reported that business teacher education enrollments are declining in colleges and universities in the United States. The "Action Plan" by the Policies Commission for Business and Economic Education (1987) called for improvements in student recruitment for business education.
124Based on these findings and this conclusion, the
researcher would recommend that colleges and universities develop a strong recruitment program, emphasizing the new or different career options for business education graduates. Some of the career options, as outlined by Kaliski (198), are to teach business at all levels (from elementary school through the four-year college and university), as well as in other settings such as business and industry, prisons, Indian reservations, government-sponsored programs, and mass media. Further, that a public relations program be developed to improve the image of and to stress the need for Business Education. This program might emphasize the following:
(1) Training needs in business, industry, government, medicine, and the military.
(2) The possibility of a teacher shortage within the next few years in the area of business education (Calhoun, 1983) .
(3) The ease with which business education graduates can move from the classroom to the business world (Culver, 1980).
7. Of the five groups of business majors, the largest number of students were in the Management/Marketing group.
This conclusion is based on the finding that 123 or 33.6% of the students were in the Management/Marketing area.
This conclusion is consistent with the findings of Caballero and Dickinson (1986) that students may choose
125business administration over business teacher education because of the differences in salaries paid by industry and by education. This conclusion is also supported by statistics from the Digest of Education Statistics (1987) which state that the number of bachelor's degrees conferred in business and management rose by 75% from 1974-75 to 1984-85. The Digest of Education Statistics (1989) states that the largest number of degrees conferred in 1986-87 were in the fields of business and management.
8. Of the five groups of business majors, the Business/ Office Education group had the smallest number of respondents.
This conclusion is based on the finding that 11 or 3% of the students majored in Business Education and Office Administration/Office Management.
This conclusion supports the premise that in spite of the projections of the United States Department of Labor regarding increased demands in the business world for students in the administrative support area, the number of students majoring in Business Education and Office Administration/Office Management is decreasing (Clayton, 1980, and Gades, 1985). This conclusion also raises questions concerning why these enrollments are declining. This is also similar to studies by Daggett and Branigan (1987), Seel (1985), and Kaliski (1987) who state that delivery systems in business and office education must move past the classroom walls and that
126articulation between secondary and postsecondary schools must be improved.
9. The GPA of students in the Accounting group was higher than the GPA of most other groups of business majors.
This conclusion is based on the findings that the mean GPA (3.19) of the Accounting group was significantly higher (according to the ANOVA and Tukey's posthoc multiple comparison test) than three groups: Business/Office Education(2.71), Business Administration (2.79), and Management/ Marketing (2.80).
Based on this finding and conclusion, the researcher recommends that further research be done to see if this finding can be further substantiated. If it can be, an attempt should be made to find out why there are differences in the GPAs of Accounting majors when compared with other business majors.
10. Three majors— Marketing, Management, and Management Information Systems— were perceived to be highly desirable majors.
This conclusion is based on the findings that the three majors with the highest perceived desirability rating were Marketing (mean=3.49), Management (mean=3.37), and Management Information Systems (mean=3.22).
This conclusion is consistent with the statistics in the Digest of Education Statistics (1987), which reported that the number of degrees conferred in computer and information
127systems jumped by 672 percent from 1974-75 to 1984-85, and the degrees conferred In business and management rose by 75 percent during the same period.
11. Accounting was perceived to be the most desirable business major.
This conclusion is based on the findings that 94 or 25.7% of the business students perceived accounting to be the most desirable business major.
Based on this finding and conclusion, the researcher would recommend that further research be conducted to determine specifically why students perceive accounting to be the most desirable business major.
12. Five factors were perceived to have "much importance" on business students' decisions in selecting their major. These included:
(1) potential income(2) offers broad job opportunities(3) type of work involved in this field(4) demand for people with this degree(5) prestige of the job
This conclusion is based on the findings that five factors had perceived mean importance scores in the "much importance" range (3.50-4.49). These included:
(1) potential income (mean=4.16)(2) offers broad job opportunities (mean~4.14)(3) type of work involved in this field (mean=4.13)
128(4) demand for people with this degree (mean=3.70)(5) prestige of the job (mean=3.51)
The conclusions regarding "potential income" and "prestige of the job" are similar to other studies (Caballero and Dickinson, 1986; Kotrlik and Harrison, 1989). The conclusion regarding "potential income," and "offers broad job opportunities" is similar to the study of Vaughn (1988).
Based on these findings and conclusions, with regard to Business/Office Education, the researcher recommends that the curriculum be broadened to include more courses in management, communications, computer information systems, and management information systems. These curricular offerings should help to prepare business students for more job opportunities, should help to increase the demand for people with the degree, and should improve the image (prestige of the job) of the major.
13. Three factors which were perceived as the most influential in selecting a business major included:
(1) potential income(2) offers broad job opportunities(3) type of work involved in this field
This conclusion is based on the findings that the top three factors perceived as the single most influential in selecting a business major were:
(1) potential income (n=81, 22.8%)(2) offers broad job opportunities (n=62, 17.4%)
129(3) type of work involved in this field (n=60, 16.9%)
14. Four factors were perceived to have "some importance" in influencing students not to choose business education as a major, including:
(1) potential income(2) does not offer broad job opportunities(3) type of work involved in teaching(4) I am not familiar with business education as a
major.These conclusions are based on the finding that the top
four perceived factors which were in the "some importance" category in influencing students not to choose business education as a major were:
(1) potential income (mean=3.13)(2) does not offer broad job opportunities (mean=3.03)(3) type of work involved in teaching (mean=2.96)(4) I am not familiar with business education as a
major (mean=2.73).15. Three factors— potential income, unfamiliarity with
business education as a major, and type of work involved in teaching— were perceived as being the most influential in business students' decisions not to select business education as a major.
These conclusions are based on the finding that the top three factors perceived as the single most influential in not selecting business education as a major were:
130(1) potential income (n=77 or 22.9%)(2) I am not familiar with business education as a
major (n=68 or 20.2%)(3) the type of work involved in teaching (n=60 or
17.9%)This conclusion is similar to an assertion by Calhoun
(1983) that business education needs to strengthen the recruitment program. The study by Gades and Culver (1982) which reaffirmed the need of a strong recruitment program for business education is also similar to this conclusion.
Based on these findings and conclusions, the researcher recommends that business educators develop an aggressive recruitment program to familiarize current students, as well as prospective students, with the new, emerging, or different career options available to business education graduates.
16. Computer Information Systems/Management Information Systems, Accounting, Office Administration/Office Management, and Marketing had favorable ratings by the respondents on perception statements regarding business majors or careers.
This conclusion is based on the finding that the four majors with the highest overall group mean subscores of agreement with perception statements were:
(1) Computer Information Systems/Management Information Systems (mean=3.75)
(2) Accounting (mean=3.62)
131(3) Office Administration/Office Management
(mean=3.51)(4) Marketing (mean=3.50).
17. Overall, the respondents were generally "undecided" regarding their perceptions of whether the business majors were favorable or unfavorable.
This conclusion is based on the finding that the mean scores (when comparing the perception scores of groups of majors toward specific majors) ranged from 3.42 to 3.35, with Business Administration having the highest score (3.42) . There was no significant statistical difference among the mean scores of the groups.
This conclusion is in keeping with what Caballero and Dickinson (1986) pointed out about students choosing Business Administration.
18. The different groups of majors were similar in their overall perceptions of business majors.
This conclusion is based on the finding that the perception mean scores had a narrow range (3.42 to 3.35).
REFERENCESAn Action Plan by the Policies Commission for Business and
Economic Education (1987, October). Business Education Forum. 42 (1), 11.
Astin, A. W., Green, K. c., & Korn, W. S. (1987). The American freshman: Twenty year trends. Los Angeles: Cooperative Institutional Research Program.
Astin, A. W., & Panos, R. J. (1969). The educational andvocational development of college students. Washington, DC: American Council on Education.
Berry, B. (1986). Why bright college students won't teach. The Urban Review. 18(4), 269-280.
Blau, P. M., Gustad, J. W., Jessor, R., Parnes, H. S, & Wilcock, R. C. (1971). Occupational choice: A conceptual framework. In H. Peters & J. Hansen (Eds), Vocational guidance and career development (pp. 155- 170). New York: The MacMillan Co.
Bordin, E., Nachmann, B., & Segal, S. (1963). An articulated framework for vocational development. Journal of Counseling Psychology. 10(2), 107-116.
Caballero, M., & Dickinson, R. (1986, May). Four-year undergraduate business administration. Journal of Business Education. 6(8), 354-359.
Calhoun, C. C. (1980). Managing the learning process in business education (1st ed.). Belmont, California: Wadsworth.
132
133Calhoun, C. C. (1981). Planning a career in business
teaching. Business Education Forum. If(1), 29-34.Calhoun, C. C. (1983). Promoting business education through
business teacher education programs. Business Education Forum. 12(8), 69-74.
Carley, P. Z. (1985). Perceptions of Louisiana's educators and businesses regarding skills and knowledges of future office workers. Unpublished master's thesis, Louisiana State University, Baton Rouge.
Carnegie Forum on Education and the Economy, Task Force on Teaching as a Profession. (1986). A nation prepared: Teachers for the 21st Century. Hyattsville, MD.
Carnegie Foundation for the Advancement of Teaching.(1987). Prospective teachers: Career choices. Change, 19(2), 31-34.
Clayton, D. (1980). Philosophical contest for business teacher education. A symposium: Business teachereducation. Lawrenceville, New Jersey: Rider College, November 19-21, 1980, p. 40.
Cooper, J. M. (1984). Student enrollments and teachersupply: Implications of the new baby boom. Education and Urban Society. 16(4), 463-475.
Culver, G. F. (1980). Business teacher education day aftertomorrow. The changing office environment. Reston, Virginia: National Business Education Association.
134Daggett, W. R., & Branigan, H. M. (1987). Projections and
implications of social, economic, and demographic changes for business education. In Business education for a changing world (pp 1-15). Reston, Virginia: National Business Education Association.
Dorsett, K. G., & Tucker, S. H. (1984, April). Wantedbusiness education students. Business Education Forum. 38(7), 7-8.
Friedheim, S. (1982). Do you care about the future ofbusiness education? Business Education World. 62(5), 3- 5.
Gades, R. E. (1985, December). Improving enrollments inbusiness teacher education programs. Paper presented at the Meeting of the American Vocational Education Association, Atlanta, Georgia, December 6-10, 1985.
Gades, R. E., & Culver, G. F. (1982, March). Image/status of business education. An independent study paper completed at the University of Nebraska-Lincoln.
Ginzberg, E., Ginsburg, S. W., Axelrad, S., & Jenna, J. L. (1951). Occupational choice: An approach to a general theory. New York: Columbia University Press.
Gold, D. (1969). Statistical tests and substantivesignificance. The American Sociologist. 4.(1), 42-46.
Graham, J. (1933). The evolution of business education in the United States. Los Angeles: University of SouthernCalifornia Press.
135Greenhaus, J. H. (1971). Self-esteem as an Influence on
occupational choice and occupational satisfaction. Journal of Vocational Behavior. 1 (1)/ 75-83.
Greenhaus, J. H., & Connolly, T. F. (1982). An investigation of career exploration among undergraduate business students. Journal of College Student Personnel. 23.(4) , 314-319.
Haynes, B. R., & Jackson, H. 0. (1935). A history ofbusiness-education in the United States. Cincinnati: South-Western Publishing Co.
Hays, W. L. (1963). Statistics for Psychologists. New York: Holt, Rinehart, and Winston.
Heath, B. (1980) A model for determining the effectiveness of vocational and technical education recruiting methods. Blacksburg, Virginia: Virginia Polytechnic Institute and State University.
Herr, E. L., & Cramer, S. H. (1988). Career guidance and counseling through the life span: Systematicapproaches. Boston: Scott, Foresman, and Company.
Holland, J. L. (1978) The vocational preference inventory (6th Rev.). Iowa City, Iowa: Educational Research Associates.
Holland, J. L. (1966). The psychology of vocational choice: A theory of types and model environments. Waltham, Hass.: Blaisdell.
136Holland, J. L. (1971). A theory of vocational choice. In
H. Peters & J. Hansen (Eds). Vocational guidance and career development (2nd ed) (pp. 141-154). New York:The MacMillan Company.
Holland, J. L. (1985). Making vocational choices: A theory of vocational personalities and work environments (2nd ed). Englewood Cliffs, New Jersey: Prentice-Hall.
Hosier, M. M. (1984, November). NBEA Task Force on Critical Issues: A report. Business Education Forum. 2£(2), 6.
Jacobson, R. (1986, June 18). Some college officials balk at proposal to drop education major. Chronicle of Higher Education. 22(16), 23.
Jantzen, J. M. (1981). Why college students choose toteach: A longitudinal study. Journal of Teacher
Education.31(2). 45-48.Johnson, R. A. (1986). Factors influencing career choice of
students in the College of Education and the College of Business at Eastern Michigan University. Unpublished doctoral dissertation, Wayne State University, Detroit, Michigan.
Kaliski, B. S. (1987). Implications of Change for EffectiveTeaching. In Business education for a changing world(pp. 163-168). Reston, VA: National Business Education Association.
Katona, G., Strumpel, B., & Zahn, E. (1971). Aspirations and affluence. New York: McGraw-Hill.
Kotrlik, J. W., & Harrison, B. C. (1989). Career decision patterns of high school seniors in Louisiana. Journal of Vocational Education Research. JL4 (2) , 47-65.
Kupsh, J., & Whitcomb, S. (1987). The electronic office.Mission Hills, California: Glencoe Publishing Company.
Lydeen, J. B. (1986). Declining enrollments in business education. Business Education Forum. 40(8), 46-50.
Maedke, W. (1982) Trends in business education, spring 1982. Sacramento, California: California State Department of Education. (ERIC Document Reproduction Service No. ED 211 848).
Marks, E. (1972). Some considerations related to thechoice of an educational program. Journal of Vocational Behavior. 2.(1) , 1-11.
Martin, D. C., & Bartol, K. M. (1986). Holland's Vocational Preference Inventory and the Myers-Briggs Type Indicator as predictors of vocational choice among master's of business administration. Journal of Vocational Behavior. 2jJ(l) , 51-65.
Milbergs, E. (1982). Business needs of the future: The challenge to business education. Business Education Forum. 26(8), 3-4
Moore, G. W. (1983). Developing and evaluating educational research. Boston: Little, Brown and Company.
138National Center for Education Statistics. (1981). High
school and bevond: A national longitudinal study for the 1980s. Washington, DC: Author.
National Center for Education Statistics (1986). Digest of Education Statistics. U. S. Department of Education, Office of Educational Research and Improvement. Washington, D.C.: U. S. Government Printing Office.
National Center for Education Statistics (1987). Digest of Education Statistics. U. S. Department of Education, Office of Educational Research and Improvement. Washington, D. C.: U. S. Government Printing Office.
National Center for Education Statistics (1989). Digest of Education Statistics. U. S. Department of Education, Office of Educational Research and Improvement. Washington, D. C.: U. S. Government Printing Office.
National Commission for Excellence in Teacher Education. (1985). A call for change in teacher education. Washington, DC: American Association of Colleges forTeacher Education.
National Commission on Excellence in Education. (1983) A nation at risk: The imperative for educational reform. Washington, DC: U. S. Department of Education.
Nichols, F. G. (1933) Commercial education in the high school. New York: D. Appleton-Century Company.
139Oliver, J. D. (1979, November). Improving Agricultural
Education Research. Paper presented at the National Agricultural Education Research Meeting, Anaheim, CA.
Opp, R. D. (1989). Freshmen interest in teaching: Recenttrends. Journal of Teacher Education. 40(4), 43-48.
Osipow, S. H. (1973). Theories of career development (2nd ed). Englewood Cliffs, New Jersey: Prentice-Hall.
Roe, A. (1971). Early determinants of vocational choice.In H. Peters & J. Hansen (Eds.). Vocational guidance and career development (pp. 123-131). New York: The MacMillan Company.
Saladaga, F. (1981). Professional Competencies Needed. Levels Attained and Training Sources as Perceived bv Louisiana Vocational Agriculture Teachers. Unpublished doctoral dissertation, Louisiana State University, Baton Rouge.
Scott, G. J. (1983). Career search, selection and entry.In W. Walsh & S. Osipow (Eds.). In Handbook of vocational psychology (Vol 2.) (pp. 77-97). Hillsdale, New Jersey: Lawrence Erlbaum Associates.
Sculley, J. (1987). Looking forward to the twenty-first century. Delta Pi Epsilon Journal. 29(3), 59-66.
Sedlak, M., & Schlossman, S. (1986). Who will teach? Historical perspectives on the changing appeal of teaching as a profession. Santa Monica, CA: The RAND Corporation.
140Seel, J. (1985). Education: The gatekeeper in a changing
economy. Business Education Forum. Afi(l) 3-6.Selden, W., & Swatt, K. A. (1971, October). Pressures for
change in a new decade. The Journal of Business Education. 47 (1), 24-26.
Snedecor, G. W., & Cochran, W. G. (1980). Statistical Methods. (7th ed). Ames, Iowa: The Iowa State University Press.
Stoufer, B. S. (1982). The identification and comparison of business educators1 perceptions of critical issues arising from the office of the future concept in relation to 2-vear postsecondarv office technology programs. Doctoral dissertation, Kent State University, Kent, Ohio.
Super, D. (1970). A theory of vocational development. InH. Peters & J. Hansen (Eds.). In Vocational guidance and career development (2nd Ed.) (pp. 111-122). New York: The MacMillan Company.
The Holmes Group (1966). Tomorrow's teachers: A report of the Holmes Group. East Lansing, MI: Author.
Toffler, A. (1980). The third wave. New York: William Morrow and Company, Inc.
Tonne, H. A. (1964). Current thinking about the future of business education. The Journal of Business Education. 2£(4), 140-142.
141Tonne, H. A. (1939). Business education basic principles
and trends. New York: The Gregg Publishing Company. Tonne, H. A. (1961). The changing business program in the
high school. Business Education Forum. 15(5), 19-29.U. S. Department of Education. (1982). The condition of
education. Washington, DC: Author.U. S. Department of Labor, Occupational Outlook Handbook.
1980. Washington, D.C.: Superintendent of Documents.U. S. Department of Labor, Occupational Outlook Handbook.
1984-85. Washington, D.C.: Superintendent of Documents. U. S. Department of Labor, Occupational Outlook Handbook.
1986-87. Washington, D.C.: Superintendent of Documents. Vaughn, J. W. (1988). How to promote business education: A
study of students' perceptions. NABTE REVIEW. (15), 5-9. Wanous, S. J. (1977). A chronology of business education in
the United States. Reston, Virginia: National Business Education Association.
Weaver, W. T. (1981). The talent pool in teacher education.Journal of Teacher Education. 12(3), 32-36.
Williams, C. M. (1972). Occupational choice of male graduate students as related to values and personality: A test of Holland's theory. Journal of Vocational Behavior. H(2) , 45-48.
Woodring, P. (1973, March). Who should go to college. Education Digest. 38(7), 12-15.
APPENDIX A Questionnaire and Cover Letters
142
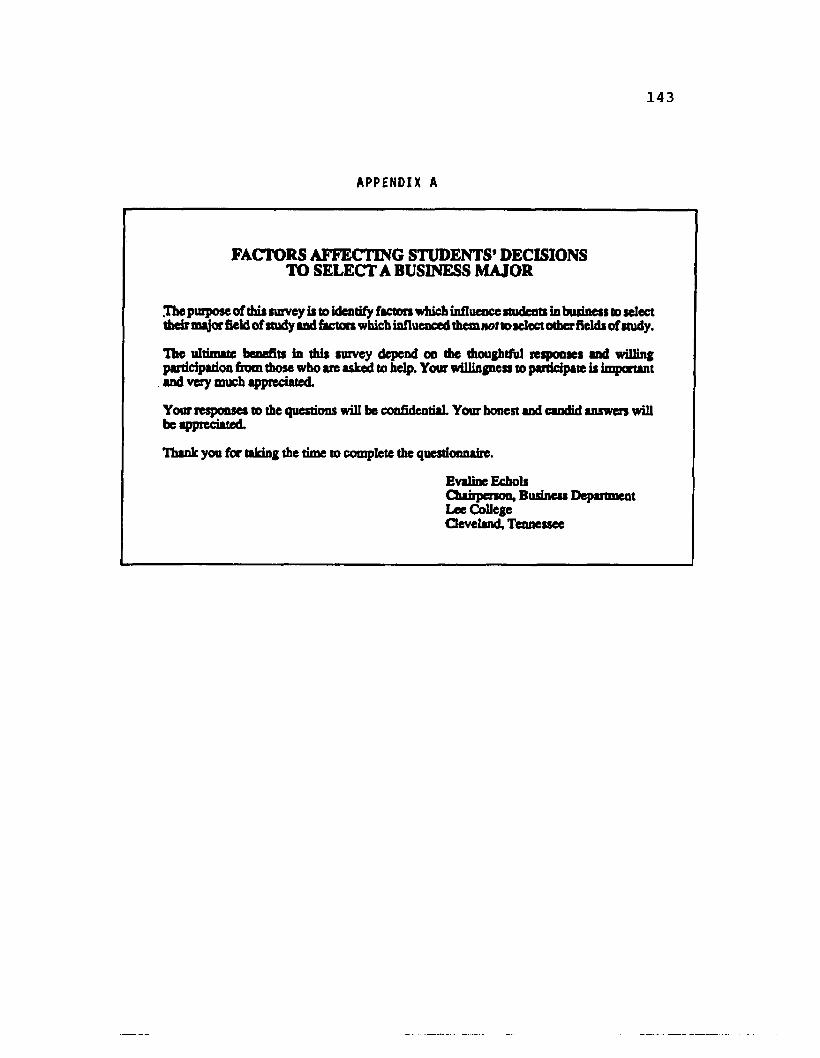
143
APPENDIX A
FACTORS AFFECTING STUDENTS' DECISIONS TO SELECT A BUSINESS MAJOR
The purpose of this survey is to identify factors which influence student! in business to select their major field of study tod factors which influenced them not to select other fields of study.
The ultimate benefits in this survey depend on the thoughtful responses and willing participation from those who are asked to help. Your willingness to participate is important and very much appreciated.
Your responses to the questions will be confidential Your honest and candid answers will be appreciated.
Thank you for taking the time to complete the questionnaire.
Evaline EcholsChairperson, Business Department Lee College Cleveland, Tennessee
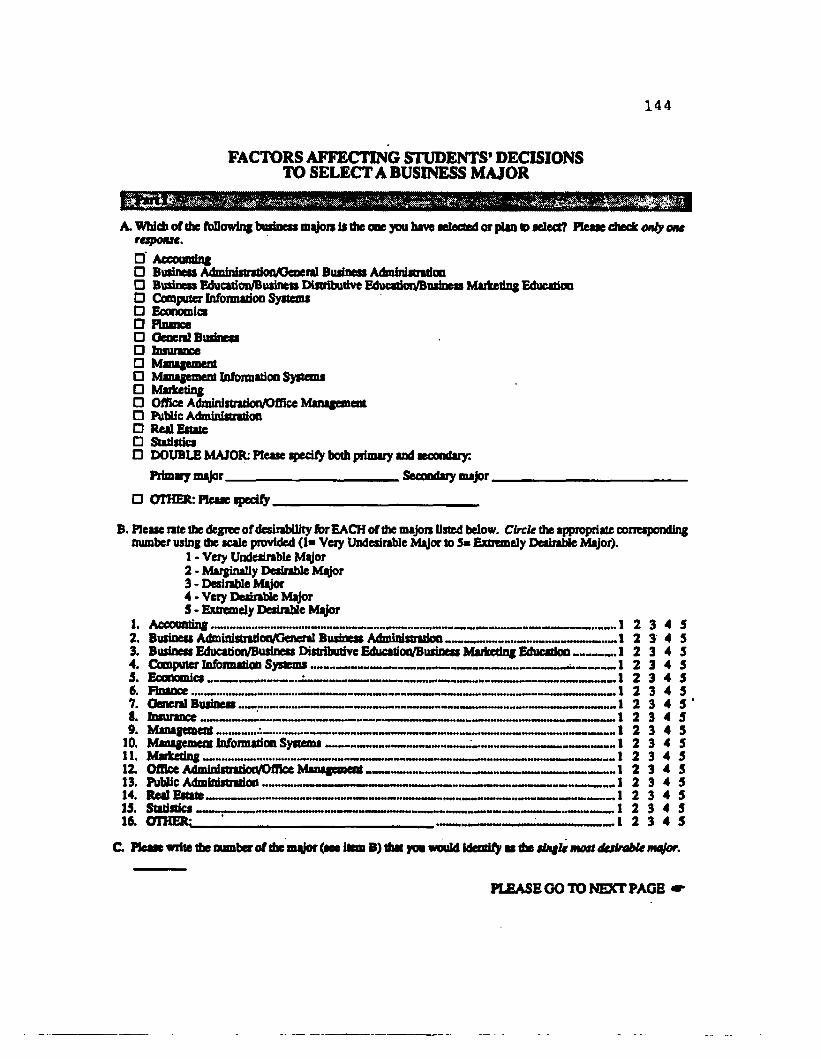
144
FACTORS AFFECTING STUDENTS' DECISIONS TO SELECT A BUSINESS MAJOR
A. Which of the following business majors is the one you have selected or plan to select? Please check only one response.□ Accounting□ Butineu AdministrationA3eneral Business Administration□ Business Education/Business Distributive Education/Business Marketing Education□ Computer Information Systems□ Economics□ Hnance□ General Business□ Insurance□ Management□ Management Information Systems□ Marketing□ Office Administration/Oflice Management□ Public Administration□ Real Estate□ Statistics□ DOUBLE MAJOR: Please qrecify both primary and secondary:
Primary major________________________ Secondary major___________________________
□ OTHER: Please specify____________________________
B. Please rate the degree of desirability for EACH of the majors listed below. Circle the appropriate corresponding number using the scale provided (la Very Undesirable Msjor to 5a Extremely Desirable Major).
1 - Very Undesirable Mqjor2 - Marginally Desirable Mqjor3 • Desirable M jor4 - Very Desirable Mqjor5 - Extremely Desirable Major
11 Accounting ......... 1 2 3 42. Business AdministrationAjeneral Business Adminisnstioo________ 1 2 3 43. Business EducatiorVBusineis Distributive Education/Business Marketing Education______1 2 3 44. Computer Information Systems ,__ ,__________________ .____ _ 1 2 3 45. Economics____________ u----------------------------------- 1 2 3 4
7. Genera] Business------------------------------------------------------------------------------1 2 3 48. Insurance ____1________________________ ;_______ 1 2 3 49. Management _________________________ _,______ 1 2 3 4
10. Management Information Systems 1 2 3 411. Marketing I 2 3 412. Office Admin!grattan/office Management 1 2 3 413. ftiMie AHmfarifWftfm 1 2 3 414. Real Estate — 1 2 3 415. Statistics *____ - I 2 3 416. OTHER: ; 1 2 3 4
C. Please write the number of the nuifor (see item B) that yon would identify as the single most destrobte mqfor.
PLEASE GO TO NEXT PAGE
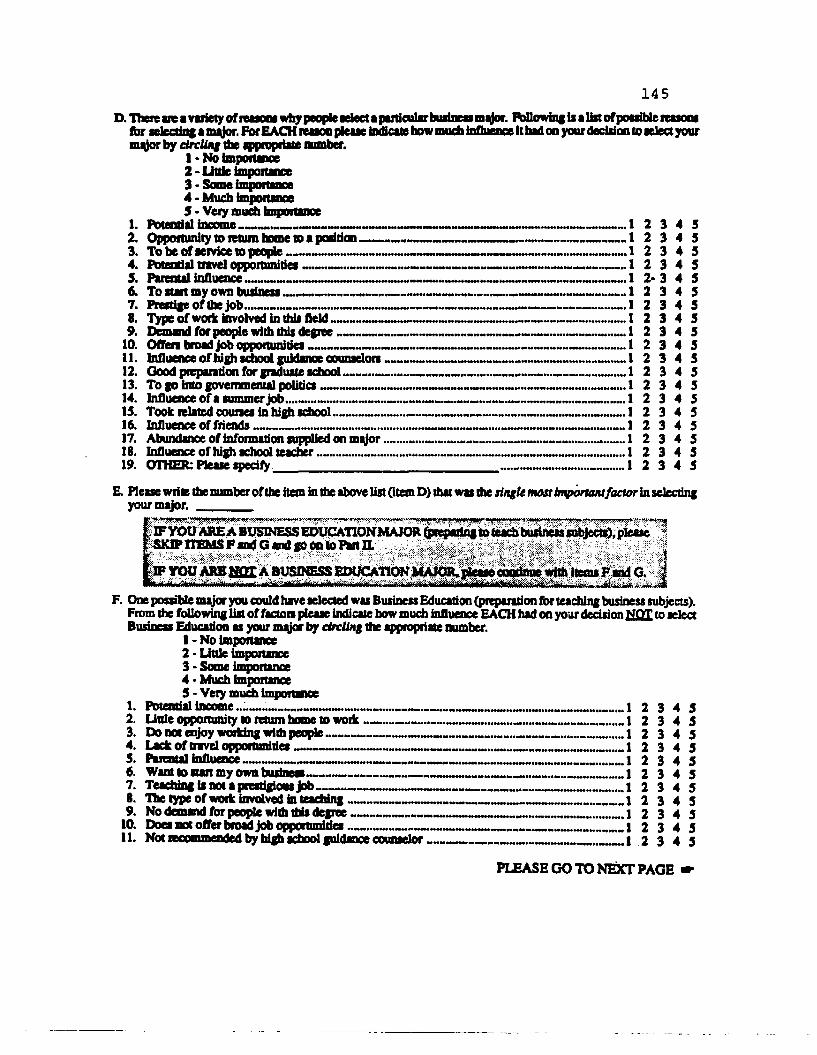
145D. There are a variety of reasons why people select aparticularbusineisniejor. Following ii a lift of possible reasons
for selecting a mijor. For EACH reaaoo pleaae indicate how much influence it had on your decision to aelect your m ^ by circling dm appropriate mimber.
1 - No Importance2 - Little importance3 - Some importance4 - Much importance5 - Very much importance
1. Potential income --- —-------_ ----------------------1 2 3 4 52. Opportunity to return home to a position3. To be of aetvice to people__________________ -________________ — ...... 1 2 3 4 54. Potential travel opportunities__________________ -___.._____________________1 2 3 4 55. Parental influence . 1 2 - 3 4 56. To start my own business __ _— .. 1 2 3 4 57. Prestige of the job________________________ .-. . _~.l 2 3 4 58. Type of work involved in thil field - 1 2 3 4 59. Demand for people with this degree_______________________________________ 1 2 3 4 5
10. OfTen broad job opportunities___________________ 1 2 3 4 511. Influence of high school guidance counselor* __________ ........___ 1 2 3 4 512. Good preparation for graduate school mWMIMWmHWWWWMWtMWWWMMtHMHWMIWWWWIHWim 1 2 3 4 313. To go into governmental politics _ 1 2 3 4 514. Influence of a rommer job.......................... ..........a.......... . . . . . . . . . . . . 1 2 3 4 515. Took related courses in high school...... „.l 2 3 4 516. Influence of friends...» ..... ................................... 1 2 3 4 517. Abundance of infonnation supplied on m^jor ________ .....__ 1 2 3 4 5
E. Please write the number of the item in the above list Otem D) that was the tingle most important factor in selecting your major. _______
ilFYOUAREABUSINESSEDUCATlONMAJOR (preparing to teach busineas mbjects), please •
F. One possible major you could have aelectcd was Business Education (preparation for teaching business subjects). From the following list of facton pleaae indicate bow much influence EACH had on voar decision NOT to select Business Education as your m jor by circling the appropriate number.
1 - No importance2 - Little importance3 - Some importance4 • Much importance5 - Vety much importance
1. Potential income -------- — — — ■■ ■ - HTTiTiinii m m mri ii tin mini ii mi iiiiminmiii 1 2 3 4 32. Little opportunity to return home to woric----------------------------------------------------- 1 2 3 4 53. Do nos enjoy woriting with people 1 2 3 4 54. Lack of travel oppoitunitiea--------- — 1 2 3 4 55. Parental influence------------------------------------------------_ 1 2 3 4 56. Want to start my own business----------------------------------------------------------------- 1 2 3 4 57. Teaching is not a prestigious job 1 2 3 4 58. The type of woric involved In teaching ,,, T | 2 3 4 59. No demand for people with this degree-------------------------------------------------------- 1 2 3 4 510. Does not offer broad job opportunities______________________________________] 2 3 4 511. Not recommended by high school guidance counselor | 2 3 4 5
18. Influence of high school teacher19. OTHER: Please specify_____
1 2 3 4 1 2 3 4
PLEASE GO TO NEXT PAGE *■
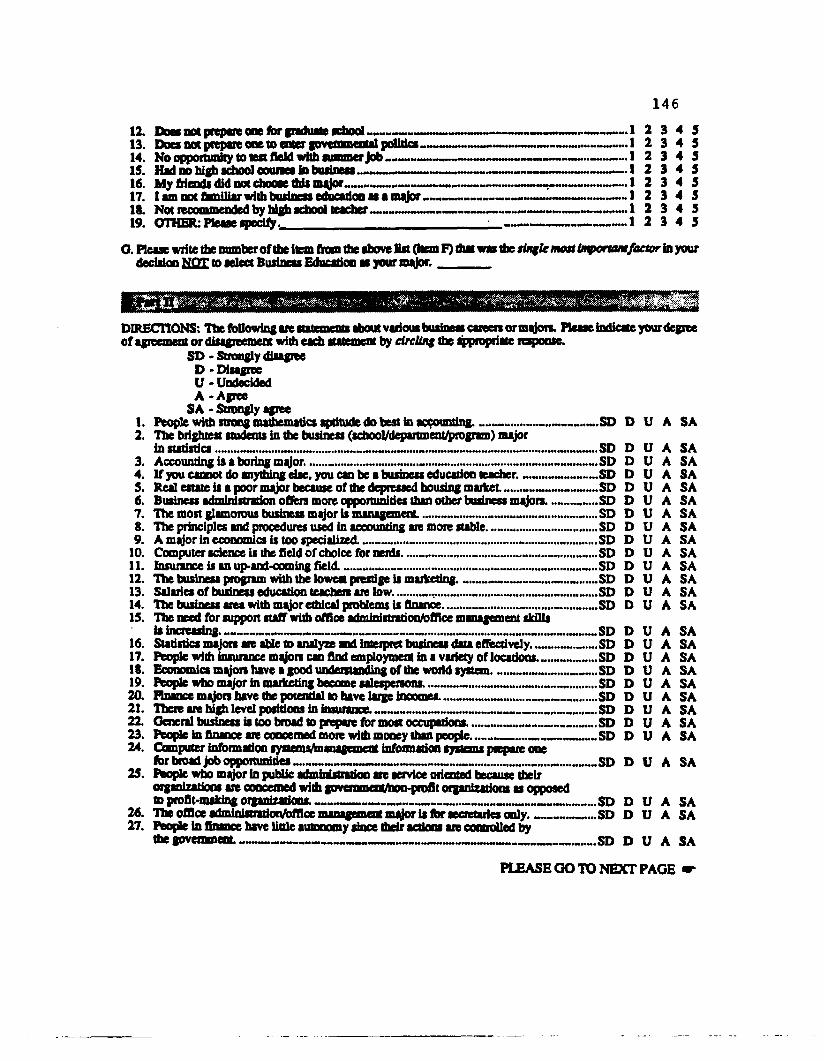
14612. Doei not prepare one for graduate acbool---------- 1 2 3 4 513. Does not prepare one to ereer governmental politics ------—.....— —---------------1 2 3 4 514. Wo opportunity to lea field with summer Job....________________ ....___ 1 2 3 4 515. Hid do high school count* la business ------------------. ----- 1 2 3 4 516. My friends did not choose this major--------- ..------------------------------ ,— <— .--------1 2 3 4 517. 1 am not familiar with business education is » major------------------------------- 1 2 3 4 518. Mnt iwnmmwvtfjl hy high fhnrd 1 2 3 4 519. OTHER: Please specify. 1 2 3 4 5
O. Please write the number of the Item from the above Hat 0tem F) that was tfae single most bt onant factor in your decision MQI <o aelcct Busineu Education as your major. _ _ _ _ _
DIRECTIONS: The following are statements about various business careen or majors. Please indicate your degree of agreement or disagreement with each statement by circling the appropriate response.
SD • Strongly disagree D 'Disagree U 'Undecided A 'Agree
SA * Strongly agree1. People witb strong mathematics aptitude do best in ac^ocmting...............---- --------- ..SD D U A SA2. The brightest students in the business (scbool/department irognm) major
in statistics .... ...... ........... ............ .................. -— — ___ __ ____ _ .SI) D U A SA3. Accounting is a boring osajor. .................................................................h... .SD D U A SA4. If you cannot do anything else, you can be a business education teacher. - ...... .......—.SD D U A SA5. Real estate is a poor major because of the depressed housing market........«......— ....SD D u A SA6. Business administration offers more opportunities than other business majors..... ...... D u A SA7. The glamotniM toxtne** major if mf"*gf»»«M..... .................... .SD D u A SA8. The principle* and procedure? wed in accounting **e more ftaWe. ..... D u A SA9. A major in economics is too specialized.___ ......— ______ ______ _—................ .SD D u A SA
10. Computer science is the field of choice for nerds......... —................. ..................... .SD D u A SA11. Insurance is an up-and-coming field.__ ......................... ................... «...___ ___....SD D u A SA12. The business program with the lowest prestige is marketing....__ ______— ...__ .SD D u A SA13. Salaries of business education teachers are low....... ..........................................«... .SD D u A SA14. The business area with nujor ethical problems is finance.................... „....... ........... .SD D u A SA15. The need for support staff with office administration/office management skills
is increasing....................................................................................................................SD D u A SA16. Statistics majors are able to analyze aid interpret business data effectively.............__ D u A SA17. Ifeople with insurance majors can find employment in a variety of locations.__ ____ .SD D u A SA18. Economics majors have a good undemanding of the world system__ ...................__....SD D u A SA19. People who major in marketing become salespersons_______________________ .SD D u A SA20. Finance majors have the potential to have large incomes.__ ................................. D u A SA21. There are high level positions in insurance.......................................... ........... D u A SA22. General busineu is too broad to prepare for most occupations._____........_______ .SD D u A SA23. People in finance are concerned more with money than people_________ _______.SD D u A SA24. Comjxrter information systemtfnanagement information systems prepare one
forhmad jobappoitunlfie* ............. ........ ........................................... .SD D u A SA25. People who major in puhlic administration are service oriented because theirorganizations are concerned with govenanem/hon-profit organizations as opposedto profit-making organizations...... ......................... .................... .................. .SD D u A SA26. The office administrationfoffice management nujor is for secretaries only.____ ___ .SD D u A SA27. People in finance have little autonomy since their actions are controlled bythe government.. .... .. ......... ....... ^ .......... ..... . .SD D u A SA
PLEASE GO TO NEXT PAGE
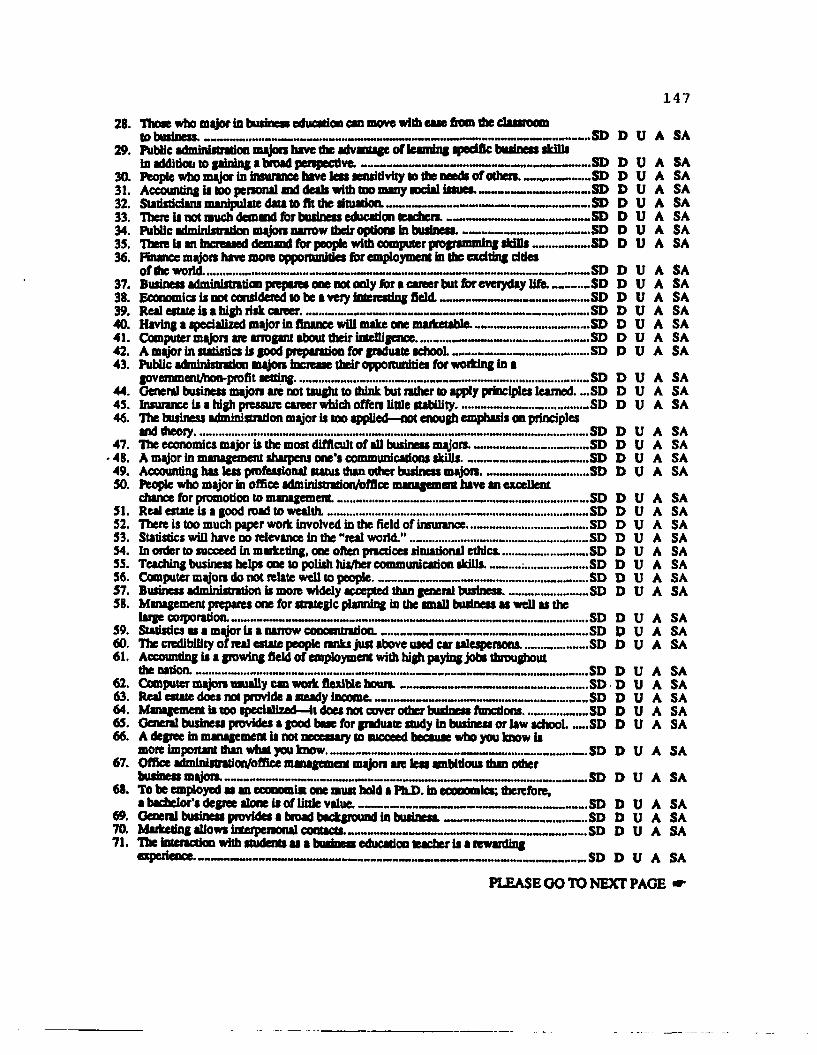
14728. Thc»e who major in busineu education can move with ease ftom the classroom
tO busineu. H WW.MWM Slj D U A SA29. Public administration majors hive the advantage of learning specific busineu tkilli
In addition to gaining a broad perspective._..— ... ——---------------------SD D I) A SA30. People who major in insurance hive less seruitivtty to tbe need* or others---- „ SD D U A SA31. Accounting is too personal md deals with too many social issues------------------- ....... SD D U A SA32. Statisticians manipulate <Uu to fit the situation.-----------..----------- -.. SD D U A SA33. There ii not much demand for busineu educed on teacher*.---------------------------..-SD D U A SA34. Public administration majors narrow their options in business. ,—.----------------- SD D U A SA33. There U an increased demand for people with computer programming skills SD D U A SA36. Finance majors have more opportunities for employment in the exciting cities
Oflhe W0rid.l4H«n.lH..IHH«.HH.MI.HHIIMMIHMHMMHHI.H.NNNHHWNMlMMIItMHMMHtMMMhMMtMMM.SD ^ U A SA37. Business administration prepares one not only for a career but for everyday life._____ SD D U A SA38. Economics it not considered to be a very interning field. SD D U A SA39. Real estate is thigh risk career.» SD D U A SA40. Hiving a specialized major in finance will make one marketable. — ___ SD D U A SA41. Computer majors aie arrogant about their intelligence________________________SD D U A SA42. A major in statistics ii good preparation for graduate school____ —..— ..................... SD D U A SA43. Public administration majors increase their opportunities for working in ■
govemmenifoon-profit setting ...SD D U A SA44. General business majors are not taught to think but rather to apply principles teamed. _.SD D U A SA43. Insurance is l high pressure career which often little stability SD D U A SA46. The business administration major is too applied—not enough emphasis on principles
and theory SD D U A SA47. The economics major is the most difficult of all business majors. SD D U A SA
■48. A major in management sharpens one's communications skills.-------------------- .SD D U A SA49. Accounting has less professional status than other business majors— ........... SD D U A SA30. People who major in office administration/office management have an excellent
chance for promotion to management. __.... -...SD D U A SA31. Real estate is a good road to wealth. SD D U A SA32. There is too much paper work involved in the field of insurance SD D U A SA33. Statistic* will have no relevance in the "real wortd." SD D U A SA34. In order to succeed in marketing, one often practices situational ethics. SD D U A SA33. Teaching business helps one to polish his/her communication skills ...SD D U A SA36. Computer majors do not relate well to people. SD D U A SA57. Business administration is mote widely accepted than general business. .....SD D U A SA58. Management prepares one for strategic planning in the small business as well as the
large corpoi ation............. . . . . . . . . . . . . . mm . . . . . . . . m ».............. ........................ SD D U A SA59. Statistics as a major is a narrow concentration.------------------------------------------ SD D U A SA60. The credibility of real estate people ranks just above used car salespersons. SD D U A SA61. Accounting is a growing field of employment with high paying jobs throughout
the nation. SD D U A SA62. Computer majors usually can work flexible hours. SD D U A SA63. Real estate does not provide a steady income.-------------------------------------------- SD D U A SA64. Management is too specialized—it does not oover other business functions. SD D U A SA63. General busineu provides a good base for graduate study in business or law schooL SD D U A SA66. A degree in management is not necessary to succeed because who you know is
more important than what you know-------------------------------------------------------SD D U A SA67. Office administration/office management majors are leu ambitious than other
busineu majors......».......................«..............................................—.................................... SD D U A SA68. To be employed u an economist one must hold a PhD. in economics; therefore,
a bachelor’* degree alone is of little value. ,„„,SP D U A SA69. General busineu provides a broad background in business.___________________ SD D U A SA70. Marketing allows interpersonal contacts._________________________________SD D U A SA71. The interaction with students u a busineu education teacher is a rewarding
experience--------------------------------------------------------------------------------_SD D U A SA
PLEASE GO TO NEXT PAGE *
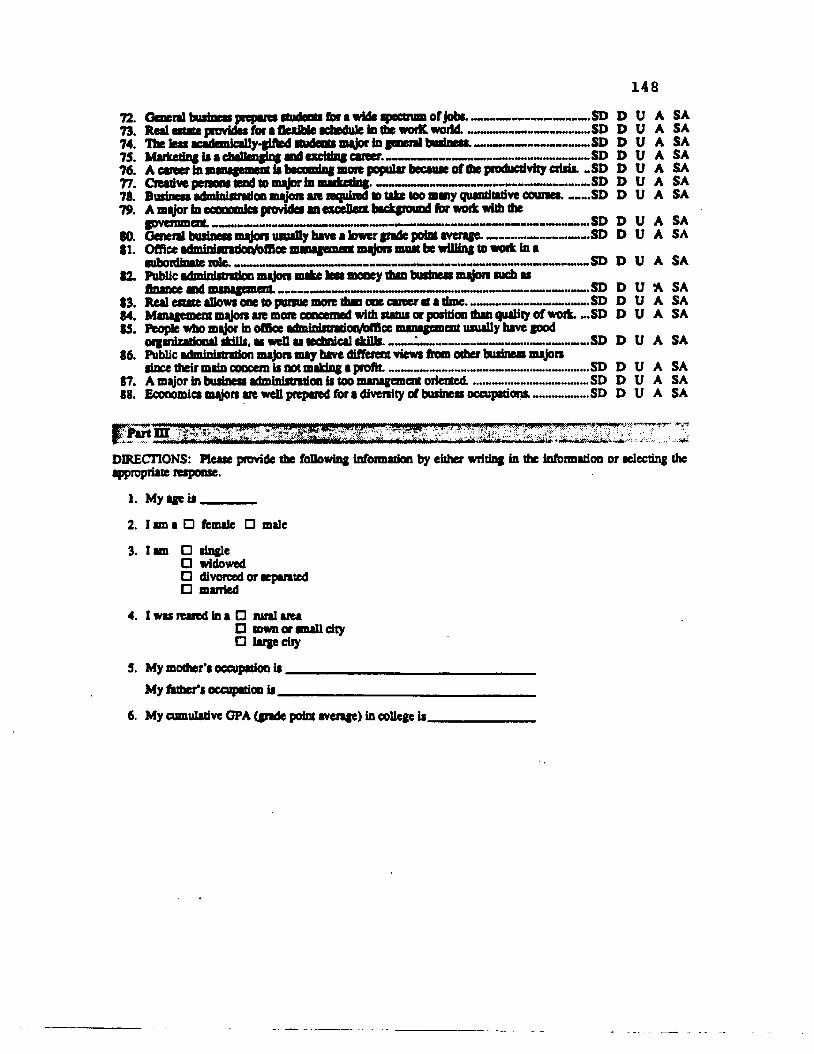
14872. flwiml p*p«H wiulww far ■ wMe ■peetmm afjnln-------------------------- SD D U A SA73. Real estate provides for a flexible schedule in the worK world SD D U A SA74. The leas academically-gifted students nutfor in general business.------------------------SD D U A SA75. M«*wli^ l» ■ chrikmgtng m l netting owef. SD D U A SA76. A career in management is becoming more popular because of the productivity crisis. ..SD D U A SA77. Creative persons tend to m jor in marketing.------------------------.---------.--------- ..SD D U A SA78. Business administration m^jota ate required to take too many quantitative coureea.___ SD D U A SA79. A m jor in economics provides an eactHwi background for work with the
government. , — . SD D U A SA80. General business majors usually have a lower grade point average-----------------------SD D U A SA11. Office adminiJtntioofolHce management majors must be willing to wort in a
subordinate rote.-------------------- - -------------------------- . SD D U A SA82. Public administration majors make less money than business majors such ai
tinance and management.-----------------------------------------------------------------SD D U A SA83. Real allows one to pursue more tban one career at a time.....---------------------- SD D U A SA84. Management majors are more ooooemed with tutus or position than quality of work. „.SD D U A SA85. People who m jor in office administratiot DfAce management usually have good
organizational skills, M well ai technical (kills L. — ....... ......— SD D U A SA86. Public administration majors may have different views from other busineaa majors
aince their main concern is not making a profit--------------- .....-------- ....—-— ....SD D U A SA87. A nutfor in business administration is too management oriented. — ----------... SD D U A SA88. Economica majors are well prepared for a diversity of business occupations.------------SD D U A SA
p r a n m v. - r . . *.DIRECTIONS: Pleaae provide die following information by either writing in the information or (electing the appropriate reqtonse.
1. My age ia _ _ _ _ _
2. lama □ female □ male
3. lam □ aingle□ widowed□ divorced or aepareted□ married
4. I was reared in a □ rural area□ town or anall dry□ large city
S. My mother’s occupation ia. My fuher's occupation is _
6. My cumulative GPA (grade point average) in college is.
May 26, 1969
D epartm en t o f Business
Lee College
FIELD TESTING OF BUSINESS EDUCATION QUESTIONNAIRE
As a part of my Ph.D. program at Louisiana state university, I am doing a survey to determine the factors which are affecting students' decisions to select a Business major. Zn the fall I will collect the data in six universities in the state of Tennessee— those with membership in the National Association of Business Teacher Education. At the present time 1 am field testing the questionnaire, and I need your help.Dr. Gary Moore, my major professor at LSU., and I have chosen you as one of 21 persons to evaluate the questionnaire and administer it to 8 or 10 students during the next three weeks. If you will not be teaching in the summer and your spring semester has ended, please evaluate the questionnaire and send me your comments.My goal is to complete the field testing of this questionnaire by June 23. Therefore, if you can return your comments, along with the 8 or 10 completed questionnaires (if you are presently teaching) by June 21, I would appreciate it.Thank you very much for your assistance.Sincerely,
Evallne Echols, chairperson Business DepartmentEE/eswEnclosures
CLEVELAND. T EN N ES SEE 3 7 3 1 1 / TEL EPH O N E . 6 1 5 /4 7 2 -2 1 1 1
D epartm en t o f Business
Lee CoLLeqe
September 5, 1989
Dear Dr.Today I spoke with you by phone about coming to your campus sometime in September to survey two of your business classes. Enclosed is a copy of the questionnaire for your information.Please call me as soon as you have been able to finalize the date for me to administer the questionnaire to two core business classes, preferably at the junior level.You may call me (collect) at 615-478-7350 or 615-472-6483.Thank you for your cooperation. I look forward to visiting your campus.
valine Echols, ChairpersonBusiness DepartmentEE/lasEnclosure
CLEVELAND, T £ N N E :w E E 3 7 3 1 1 I T E I.F P H O N E 6 1 S M 7 2 -2 IM
D epartm en t o f Business
Lee CoLLeqe
September 15, 1989
Dear Mr.Dr, -------- has indicated that you have agreed for me to do thesurvey in your class on . Thank you for yourcooperation.Enclosed is a copy of the questionnaire I will use for the survey.I look forward to visiting __________________________.Sincerely,
Evaline Echols, Chairperson Business DepartmentEE/lawEnclosure
CLEVELAND. TE N N E SSEE 3 7 3 1 1 / TEL EPH O N E 6 1 5 M 7 2 -2 1 1 1

APPENDIX B MAJOR GROUPINGS
152
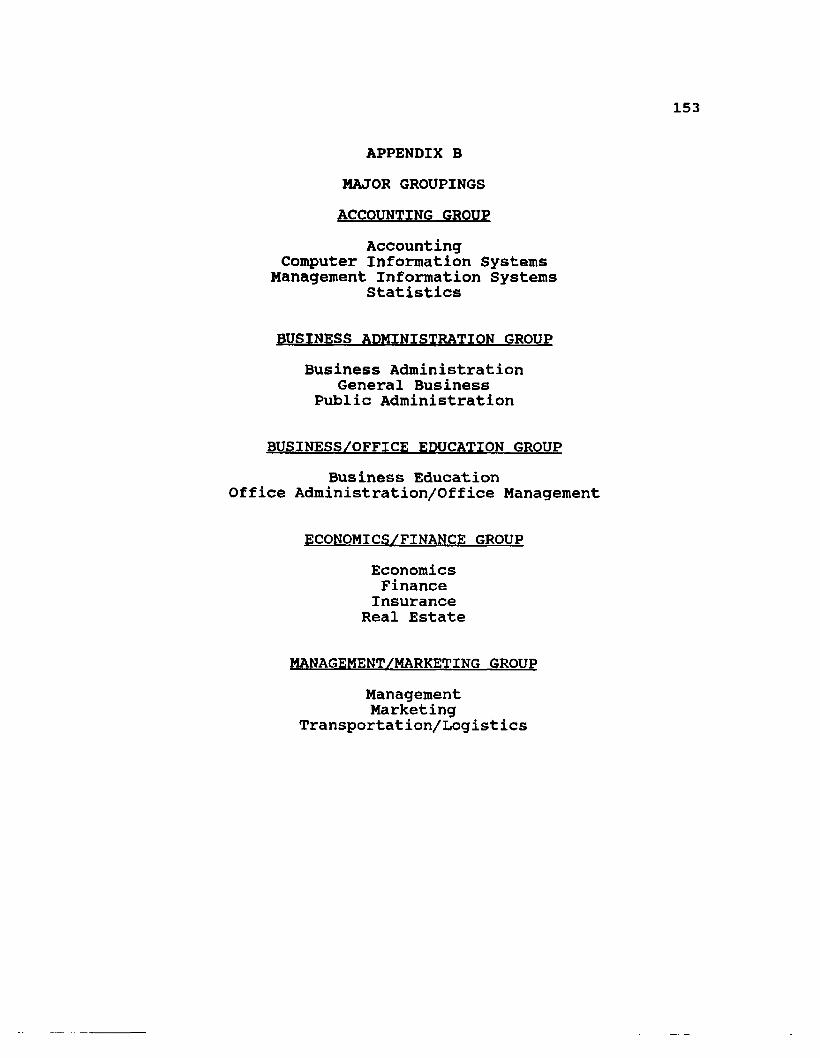
APPENDIX BMAJOR GROUPINGSACCOUNTING GROUP
Accounting Computer Information Systems
Management Information Systems Statistics
BUSINESS ADMINISTRATION GROUPBusiness Administration
General Business Public Administration
BUSINESS/OFFICE EDUCATION GROUPBusiness Education
Office Administration/Office Management
ECONOMICS/FINANCE GROUPEconomics Finance Insurance
Real Estate
MANAGEMENT/MARKETING GROUPManagement Marketing
Transportation/Logistics

APPENDIX C CLASSIFICATION OF OCCUPATIONS
154
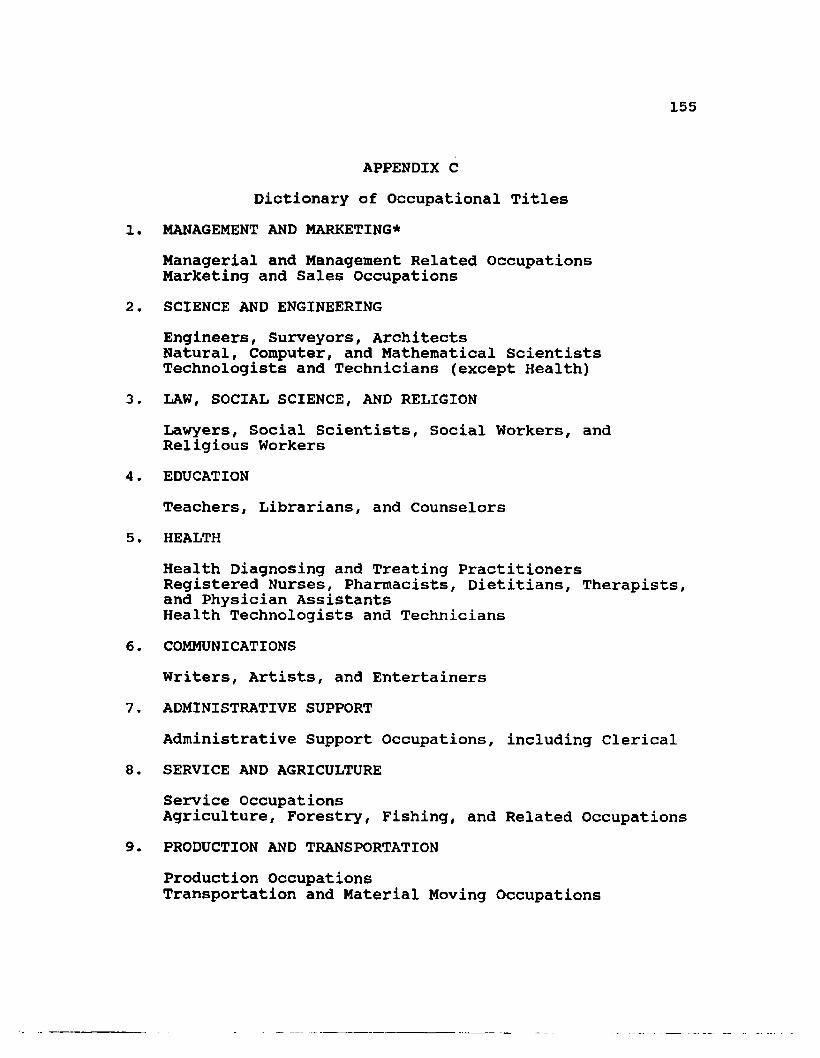
155
APPENDIX C Dictionary of Occupational Titles
1. MANAGEMENT AND MARKETING*Managerial and Management Related Occupations Marketing and Sales Occupations
2. SCIENCE AND ENGINEERINGEngineers, Surveyors, ArchitectsNatural, Computer, and Mathematical ScientistsTechnologists and Technicians (except Health)
3. LAW, SOCIAL SCIENCE, AND RELIGIONLawyers, Social Scientists, Social Workers, and Religious Workers
4. EDUCATIONTeachers, Librarians, and Counselors
5. HEALTHHealth Diagnosing and Treating Practitioners Registered Nurses, Pharmacists, Dietitians, Therapists, and Physician Assistants Health Technologists and Technicians
6. COMMUNICATIONSWriters, Artists, and Entertainers
7. ADMINISTRATIVE SUPPORTAdministrative Support Occupations, including Clerical
8. SERVICE AND AGRICULTURE Service OccupationsAgriculture, Forestry, Fishing, and Related Occupations
9. PRODUCTION AND TRANSPORTATION Production OccupationsTransportation and Material Moving Occupations
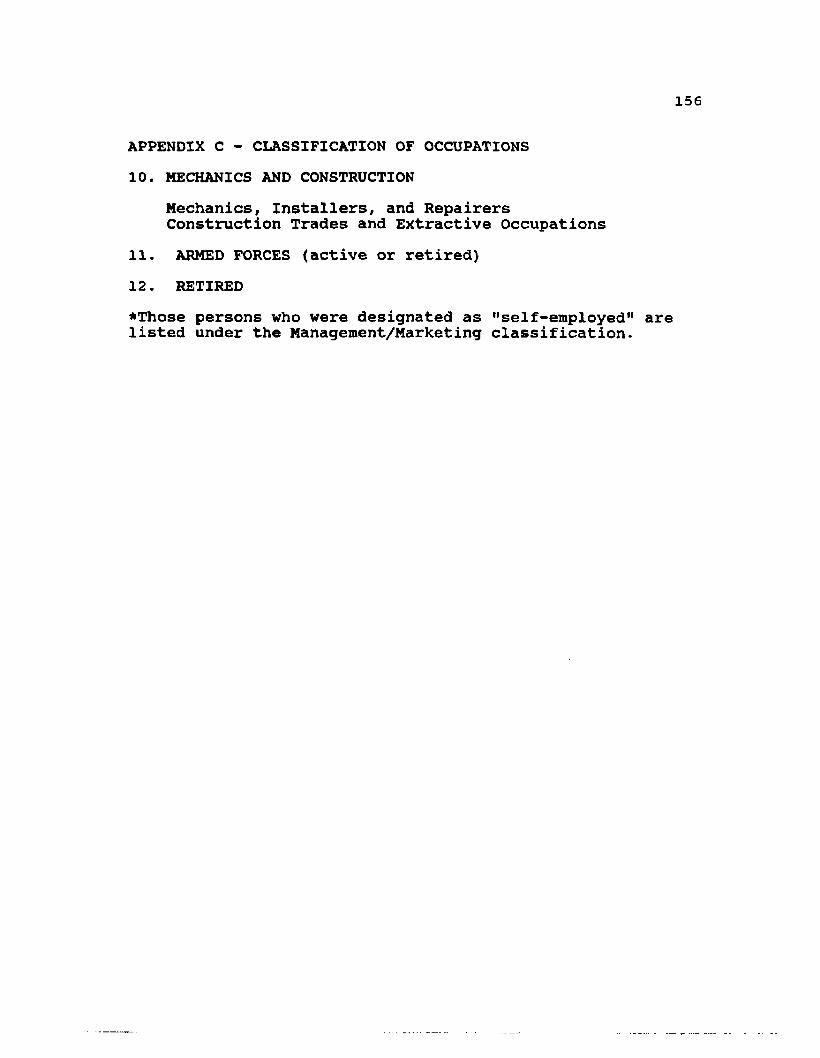
156
APPENDIX C - CLASSIFICATION OF OCCUPATIONS10. MECHANICS AND CONSTRUCTION
Mechanics, Installers, and Repairers Construction Trades and Extractive Occupations
11. ARMED FORCES (active or retired)12. RETIRED*Those persons who were designated as "self-employed" are listed under the Management/Marketing classification.

APPENDIX D OTHER REASONS FOR SELECTING A MAJOR
QUESTIONNAIRE - Part I-D
157
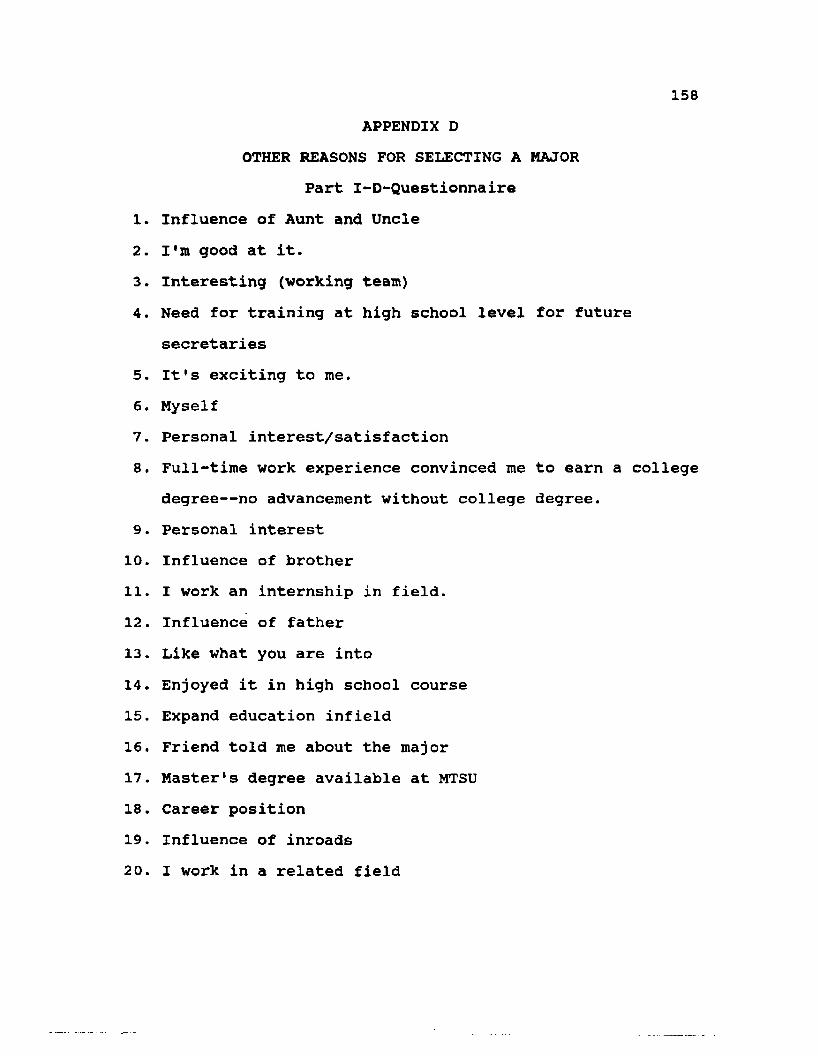
1.2.3.4.
5.6 .
7.8 .
9.10.11.12 .
13.14.15.16.17.18.19.20 .
158APPENDIX D
OTHER REASONS FOR SELECTING A MAJOR Part I-D-Questionnaire
Influence of Aunt and Uncle I'm good at it.Interesting (working team)Need for training at high school level for futuresecretariesIt's exciting to me.MyselfPersonal interest/satisfactionFull-time work experience convinced me to earn a college degree— no advancement without college degree.Personal interestInfluence of brotherI work an internship in field.Influence of father Like what you are into Enjoyed it in high school course Expand education infield Friend told me about the major Master's degree available at MTSU Career position Influence of inroads I work in a related field
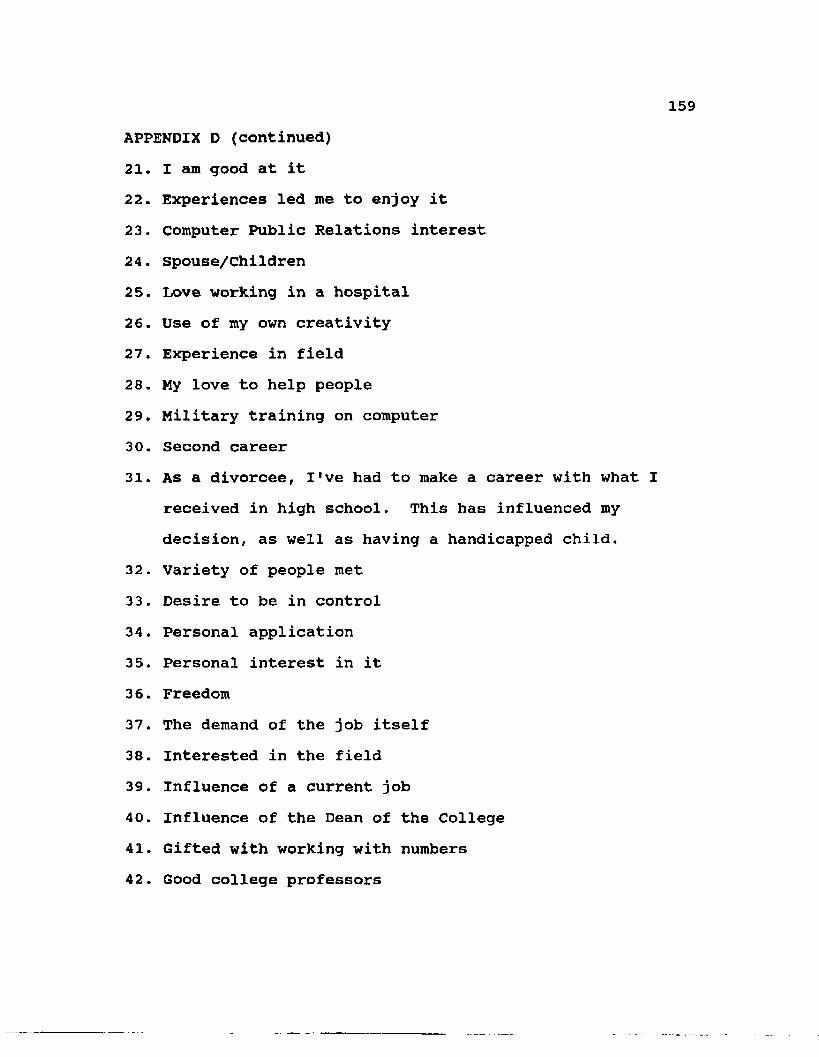
APPENDIX D (continued)21. I am good at it22. Experiences led me to enjoy it23. Computer Public Relations interest24. spouse/children25. Love working in a hospital26. Use of my own creativity27. Experience in field28. My love to help people29. Military training on computer30. Second career31. As a divorcee, I've had to make a career with what
received in high school. This has influenced my decision, as well as having a handicapped child.
32. Variety of people met33. Desire to be in control34. Personal application35. Personal interest in it36. Freedom37. The demand of the job itself38. Interested in the field39. Influence of a current job40. Influence of the Dean of the College41. Gifted with working with numbers42. Good college professors
APPENDIX EOTHER REASONS NOT TO SELECT BUSINESS EDUCATION AS A MAJOR
Questionnaire- Part I-F
160
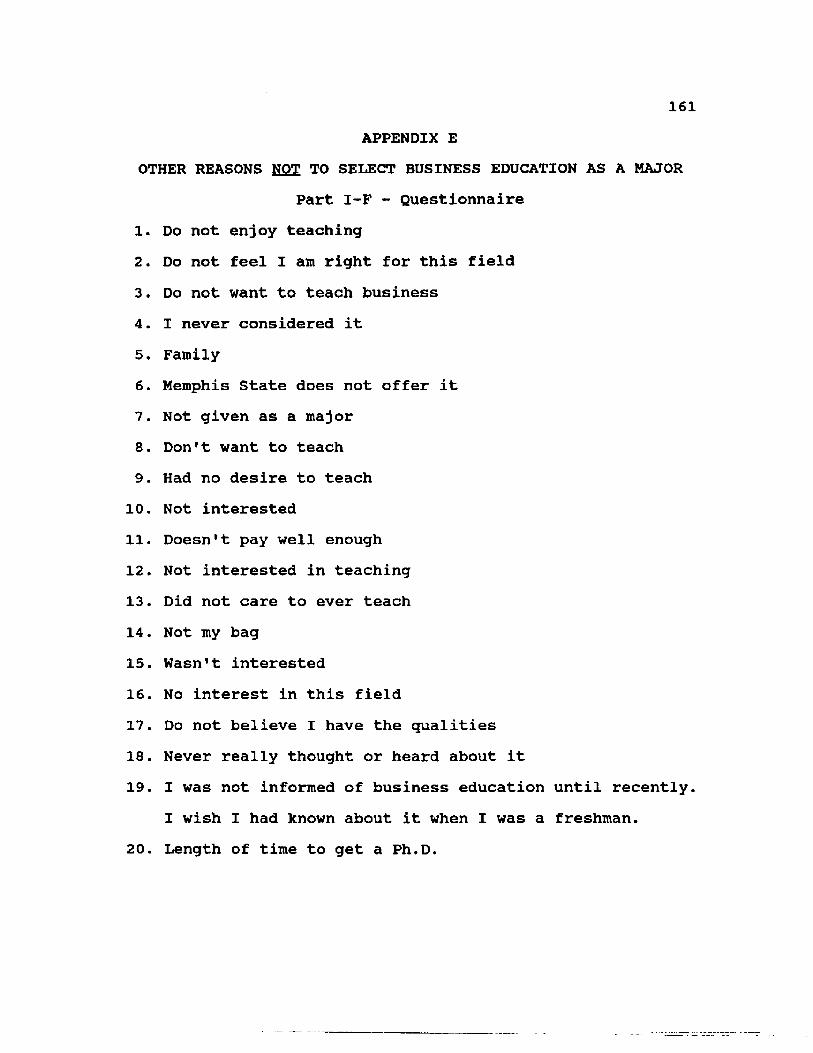
161APPENDIX E
OTHER REASONS NOT TO SELECT BUSINESS EDUCATION AS A MAJORPart I-F - Questionnaire
1. Do not enjoy teaching2. Do not feel I am right for this field3. Do not want to teach business4. I never considered it5. Family6. Memphis State does not offer it7. Not given as a major8. Don't want to teach9. Had no desire to teach10. Not interested11. Doesn't pay well enough12. Not interested in teaching13. Did not care to ever teach14. Not my bag15. Wasn't interested16. No interest in this field17. Do not believe I have the qualities18. Never really thought or heard about it19. I was not informed of business education until recently.
I wish I had known about it when I was a freshman.20. Length of time to get a Ph.D.
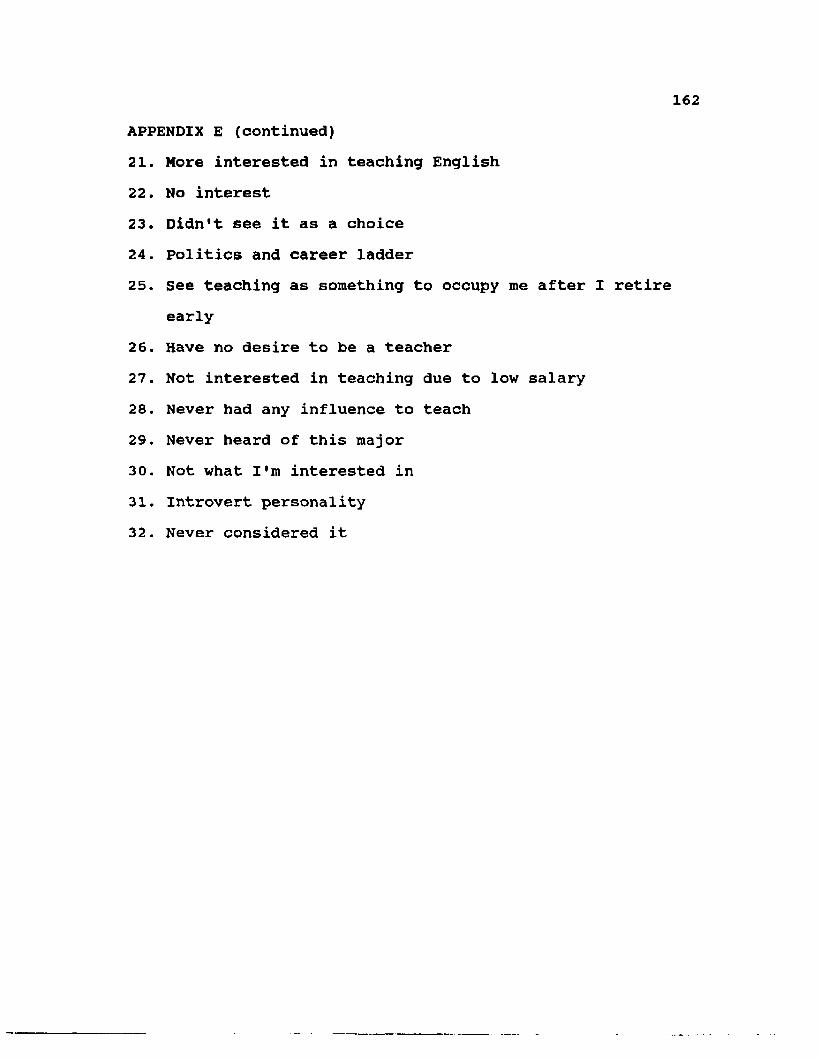
162APPENDIX E (continued)21. More interested in teaching English22. No interest23. Didn't see it as a choice24. Politics and career ladder25. See teaching as something to occupy me after I retire
early26. Have no desire to be a teacher27. Not interested in teaching due to low salary28. Never had any influence to teach29. Never heard of this major30. Not what I'm interested in31. Introvert personality32. Never considered it

APPENDIX F OCCUPATION OF MOTHER
Questionnaire - Part III-5
163
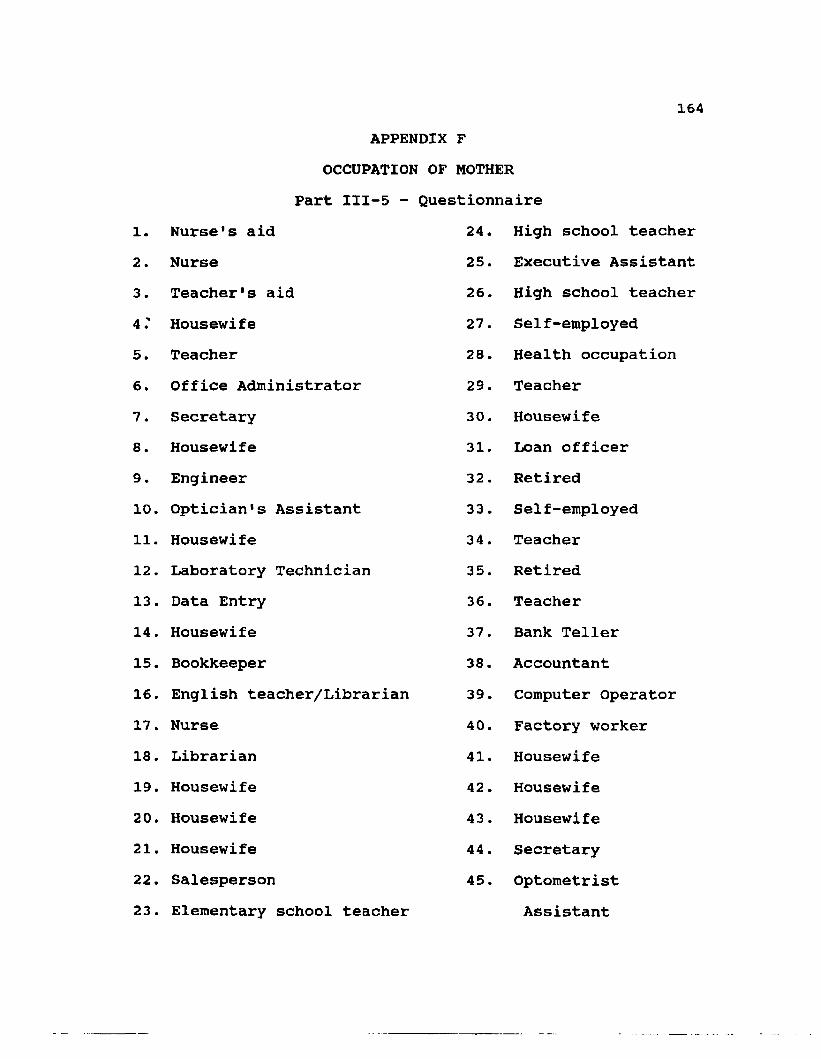
164APPENDIX F
OCCUPATION OF MOTHER Part III-5 - Questionnaire
1. Nurse's aid 24. High school teacher2. Nurse 25. Executive Assistant3. Teacher's aid 26. High school teacher4.' Housewife 27. Self-employed5. Teacher 28. Health occupation6. Office Administrator 29. Teacher7. Secretary 30. Housewife8. Housewife 31. Loan officer9. Engineer 32. Retired10. Optician's Assistant 33. Self-employed11. Housewife 34. Teacher12. Laboratory Technician 35. Retired13. Data Entry 36. Teacher14. Housewife 37. Bank Teller15. Bookkeeper 38. Accountant16. English teacher/Librarian 39. Computer Operator17. Nurse 40. Factory worker18. Librarian 41. Housewife19. Housewife 42. Housewife20. Housewife 43. Housewife21. Housewife 44. Secretary22. Salesperson 45. Optometrist23. Elementary school teacher Assistant
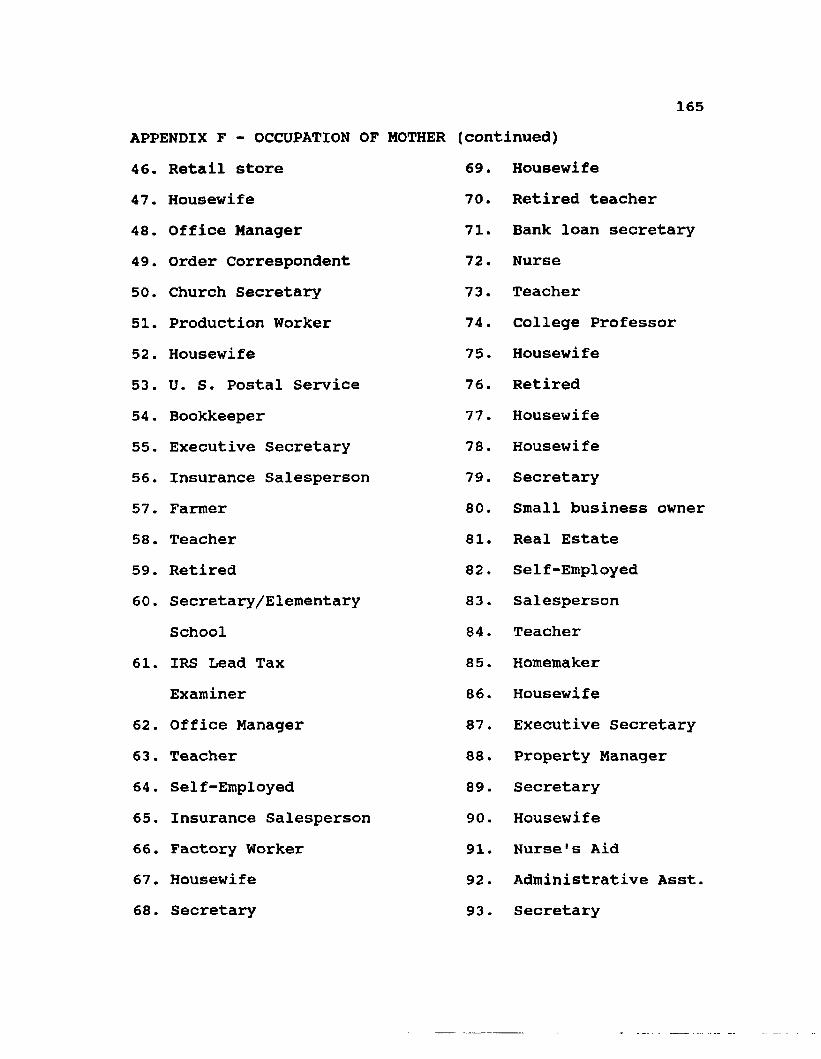
165APPENDIX F - OCCUPATION OF MOTHER (continued)46. Retail store 69. Housewife47. Housewife 70. Retired teacher48. Office Manager 71. Bank loan secretary49. Order Correspondent 72. Nurse50. Church Secretary 73. Teacher51. Production Worker 74. College Professor52. Housewife 75. Housewife53. U. S. Postal Service 76. Retired54. Bookkeeper 77. Housewife55. Executive Secretary 78. Housewife56. Insurance Salesperson 79. Secretary57. Fanner 80. Small business owner58. Teacher 81. Real Estate59. Retired 82. Self-Employed60. Secretary/Elementary 83. Salesperson
School 84. Teacher61. IRS Lead Tax 85. Homemaker
Examiner 86. Housewife62. Office Manager 87. Executive Secretary63. Teacher 88. Property Manager64. Self-Employed 89. Secretary65. Insurance Salesperson 90. Housewife66. Factory Worker 91. Nurse's Aid67. Housewife 92. Administrative Asst.68. Secretary 93. Secretary
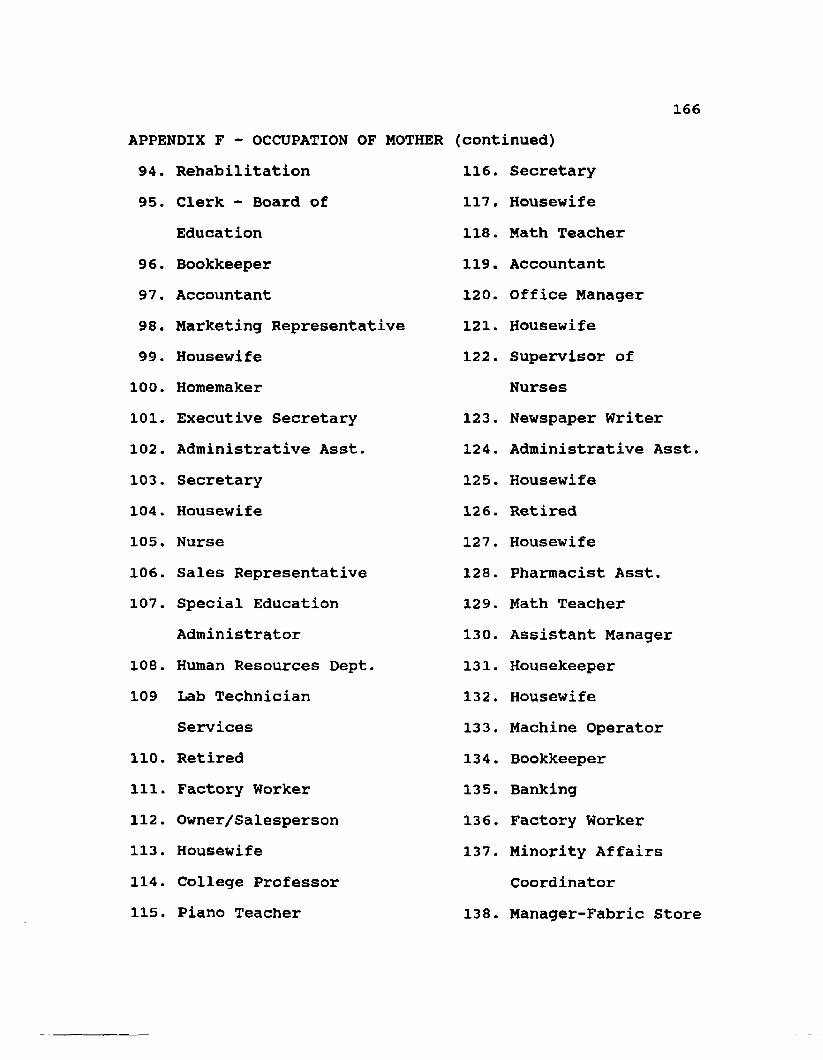
166APPENDIX F - OCCUPATION OF MOTHER (continued)94. Rehabilitation 116. Secretary95. Clerk - Board of 117. Housewife
Education 118. Math Teacher96. Bookkeeper 119. Accountant97. Accountant 120. Office Manager98. Marketing Representative 121. Housewife99. Housewife 122. Supervisor of100. Homemaker Nurses101. Executive Secretary 123. Newspaper Writer102. Administrative Asst. 124. Administrative Asst.103. Secretary 125. Housewife104. Housewife 126. Retired105. Nurse 127. Housewife106. Sales Representative 128. Pharmacist Asst.107. Special Education 129. Math Teacher
Administrator 130. Assistant Manager108. Human Resources Dept. 131. Housekeeper109 Lab Technician 132. Housewife
Services 133. Machine Operator110. Retired 134. Bookkeeper111. Factory Worker 135. Banking112. Owner/Salesperson 136. Factory Worker113. Housewife 137. Minority Affairs114. College Professor Coordinator115. Piano Teacher 138. Manager-Fabric Store
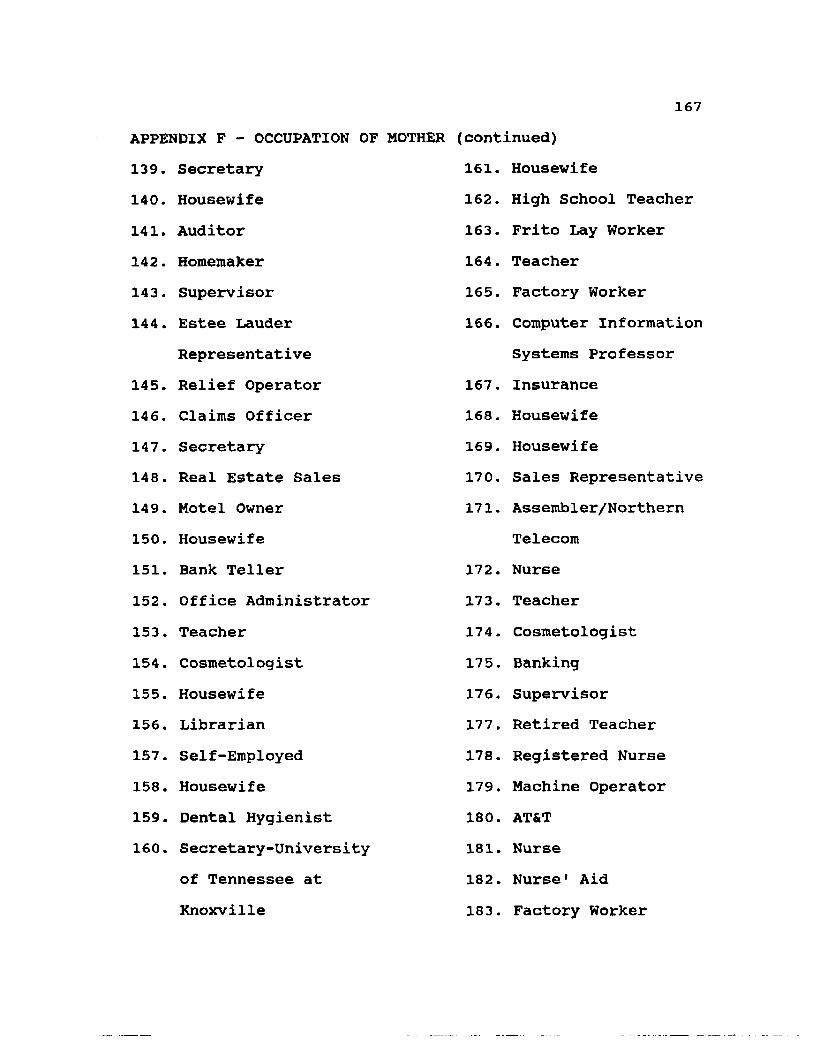
167APPENDIX F - OCCUPATION OF MOTHER (continued)139. Secretary 161. Housewife140. Housewife 162. High School Teacher141. Auditor 163. Frito Lay Worker142. Homemaker 164. Teacher143. Supervisor 165. Factory Worker144. Estee Lauder 166. Computer Information
Representat ive Systems Professor145. Relief Operator 167. Insurance146. Claims Officer 168. Housewife147. Secretary 169. Housewife148. Real Estate Sales 170. Sales Representative149. Motel Owner 171. Assembler/Northern150. Housewife Telecom151. Bank Teller 172. Nurse152. Office Administrator 173. Teacher153. Teacher 174. Cosmetologist154. Cosmetologist 175. Banking155. Housewife 176. Supervisor156. Librarian 177. Retired Teacher157. Self-Employed 178. Registered Nurse158. Housewife 179. Machine Operator159. Dental Hygienist 180. AT&T160. Secretary-University 181. Nurse
of Tennessee at 182. Nurse1 AidKnoxville 183. Factory Worker
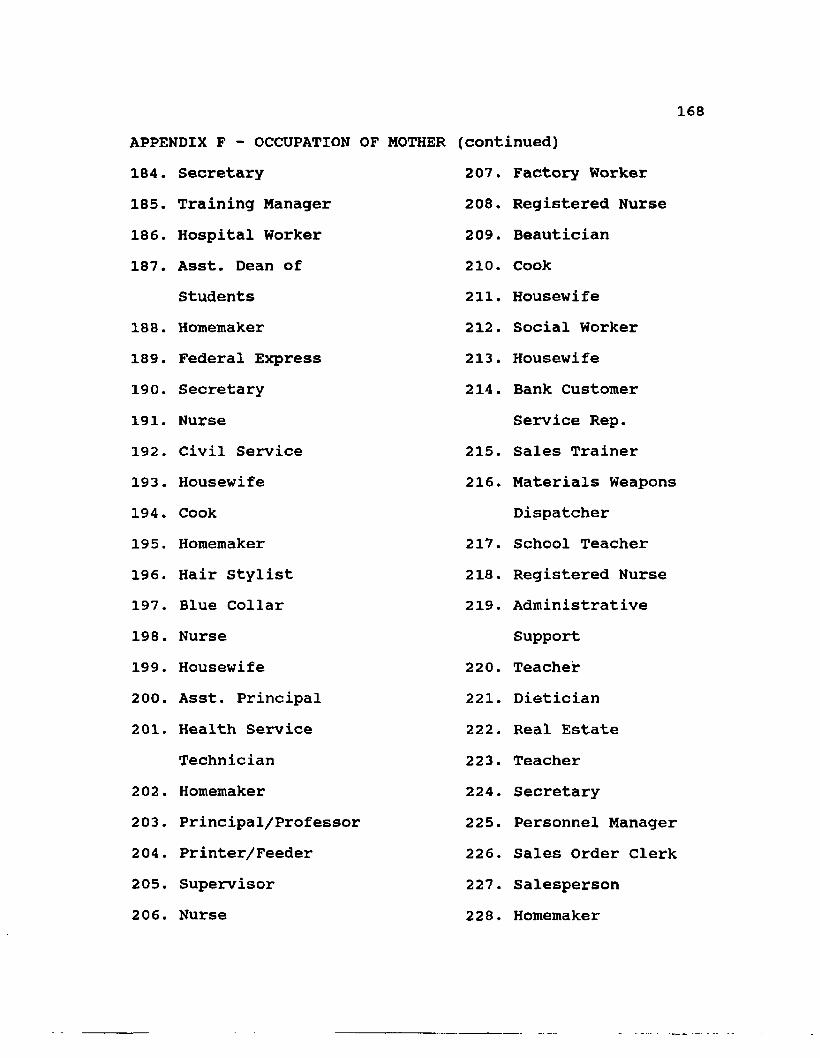
168APPENDIX F - OCCUPATION OF MOTHER (continued)184. Secretary 207. Factory Worker185. Training Manager 208. Registered Nurse186. Hospital Worker 209. Beautician187. Asst. Dean of 210. Cook
Students 211. Housewife188. Homemaker 212. Social Worker189. Federal Express 213. Housewife190. Secretary 214. Bank Customer191. Nurse Service Rep.192. Civil Service 215. Sales Trainer193. Housewife 216. Materials Weapons194. Cook Dispatcher195. Homemaker 217. School Teacher196. Hair Stylist 218. Registered Nurse197. Blue Collar 219. Administrative198. Nurse Support199. Housewife 220. Teacher200. Asst. Principal 221. Dietician201. Health Service 222. Real Estate
Technician 223. Teacher202. Homemaker 224. Secretary203. Principal/Professor 225. Personnel Manager204. Printer/Feeder 226. Sales Order Clerk205. Supervisor 227. Salesperson206. Nurse 228. Homemaker
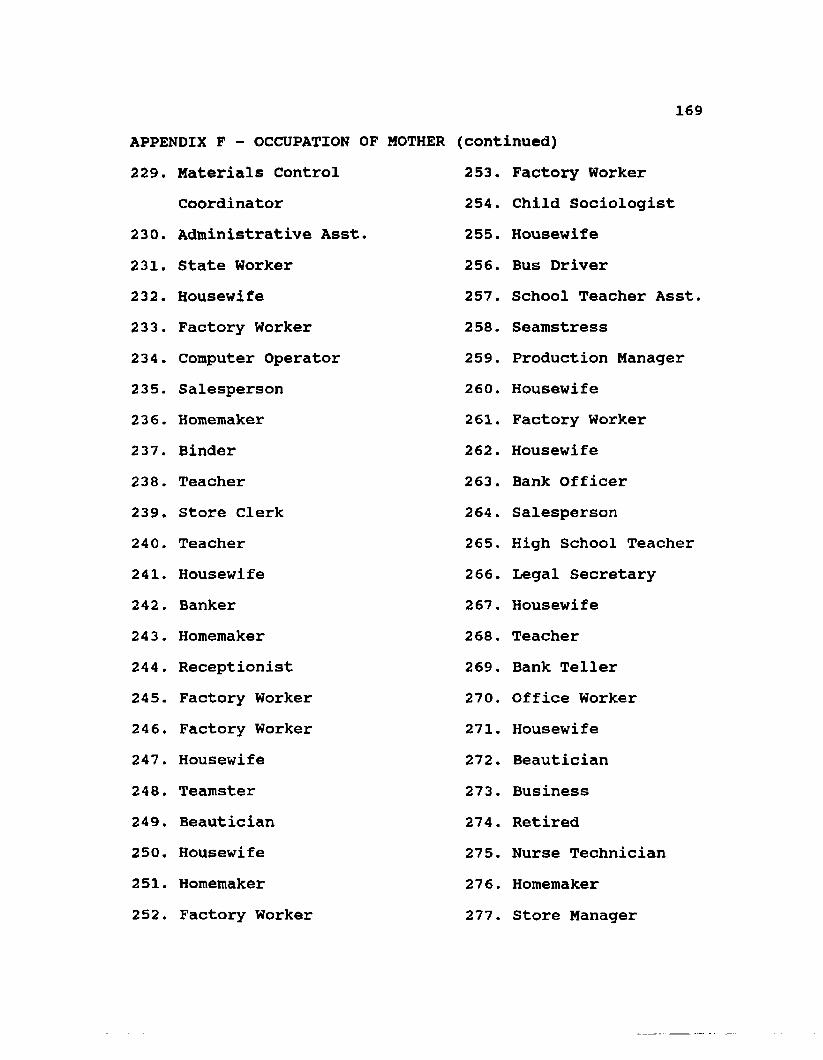
169APPENDIX F - OCCUPATION OF MOTHER (continued)229. Materials Control 253. Factory Worker
Coordinator 254. Child Sociologist230. Administrative Asst. 255. Housewife231. State Worker 256. Bus Driver232. Housewife 257. School Teacher Asst233. Factory Worker 258. Seamstress234. Computer Operator 259. Production Manager235. Salesperson 260. Housewife236. Homemaker 261. Factory Worker237. Binder 262. Housewife238. Teacher 263. Bank Officer239. Store Clerk 264. Salesperson240. Teacher 265. High School Teacher241. Housewife 266. Legal Secretary242. Banker 267. Housewife243. Homemaker 268. Teacher244. Receptionist 269. Bank Teller245. Factory Worker 270. Office Worker246. Factory Worker 271. Housewife247. Housewife 272. Beautician248. Teamster 273. Business249. Beautician 274. Retired250. Housewife 275. Nurse Technician251. Homemaker 276. Homemaker252. Factory Worker 277. Store Manager
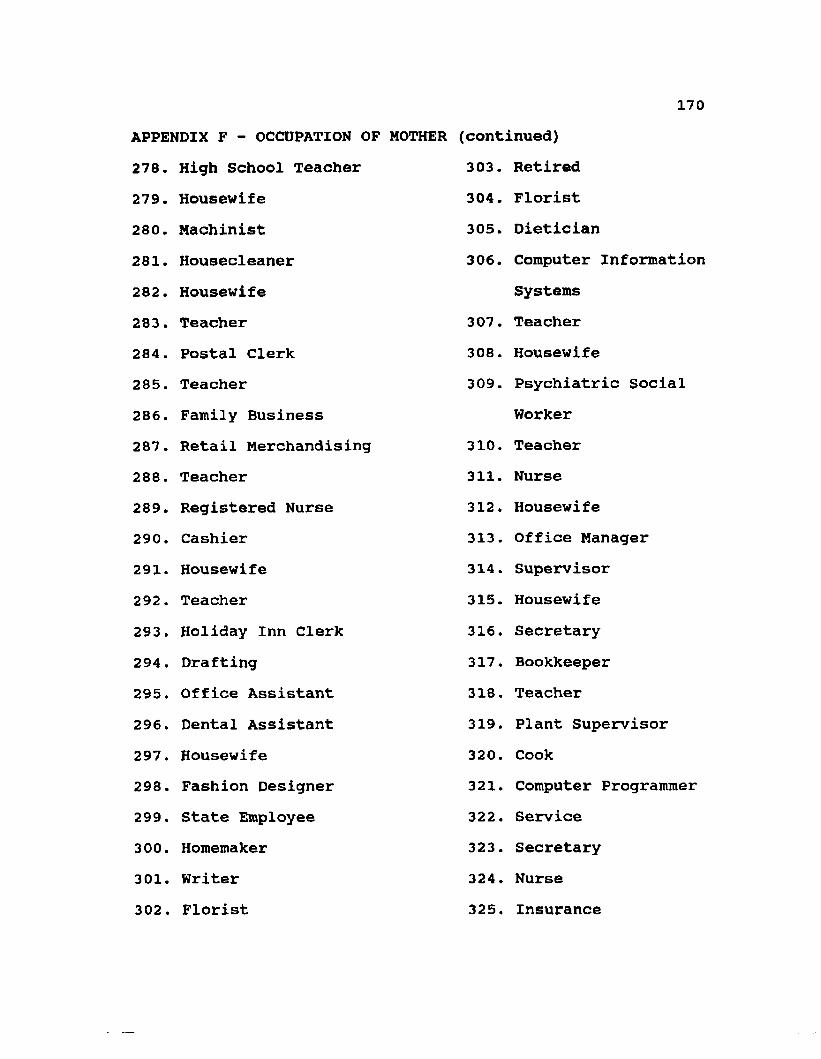
170APPENDIX F - OCCUPATION OF MOTHER (continued)278. High School Teacher 303. Retired279. Housewife 304. Florist280. Machinist 305. Dietician281. Housecleaner 306. Computer Information282. Housewife Systems283. Teacher 307. Teacher284. Postal Clerk 308. Housewife285. Teacher 309. Psychiatric Social286. Family Business Worker287. Retail Merchandising 310. Teacher288. Teacher 311. Nurse289. Registered Nurse 312. Housewife290. Cashier 313. Office Manager291. Housewife 314. Supervisor292. Teacher 315. Housewife293. Holiday Inn Clerk 316. Secretary294. Drafting 317. Bookkeeper295. Office Assistant 318. Teacher296. Dental Assistant 319. Plant Supervisor297. Housewife 320. Cook298. Fashion Designer 321. Computer Programmer299. State Employee 322. Service300. Homemaker 323. Secretary301. Writer 324. Nurse302. Florist 325. Insurance
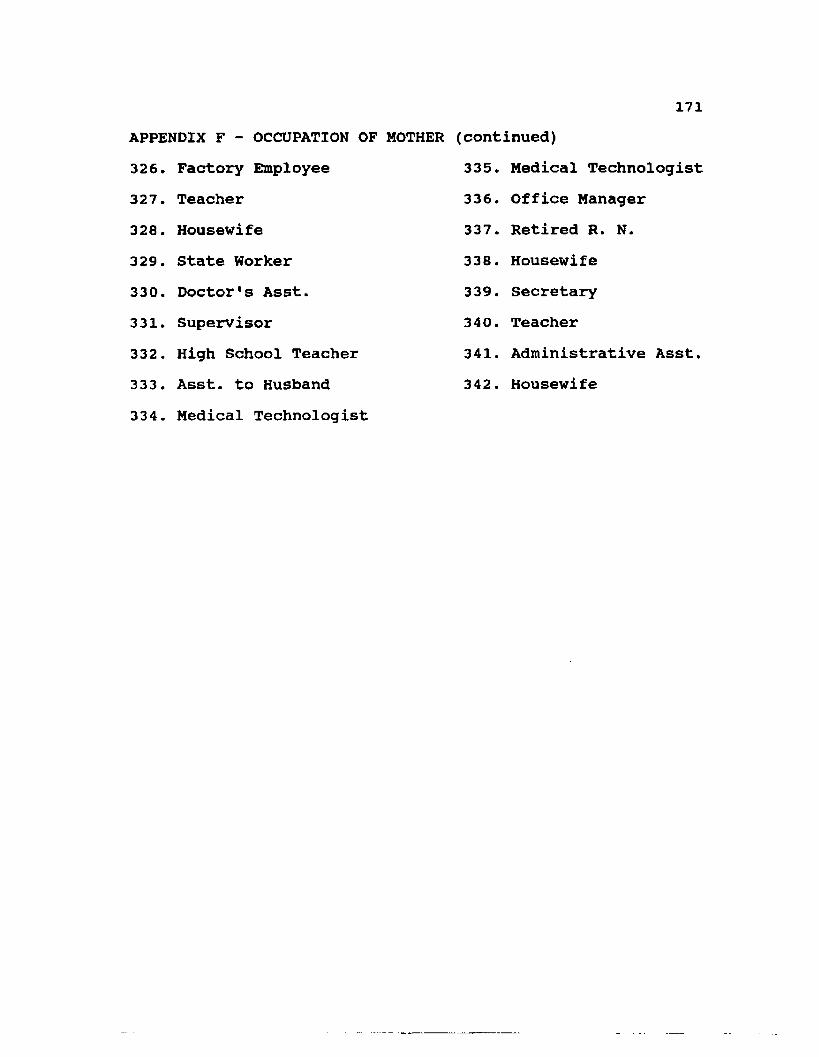
171APPENDIX F - OCCUPATION OF MOTHER (continued)326. Factory Employee 335. Medical Technologist327. Teacher 336. Office Manager328. Housewife 337. Retired R. N.329. State Worker 338. Housewife330. Doctor's Asst. 339. Secretary331. Supervisor 340. Teacher332. High School Teacher 341. Administrative Asst.333. Asst, to Husband 342. Housewife334. Medical Technologist

APPENDIX G OCCUPATION OF FATHER
Questionnaire - Part III-5
172
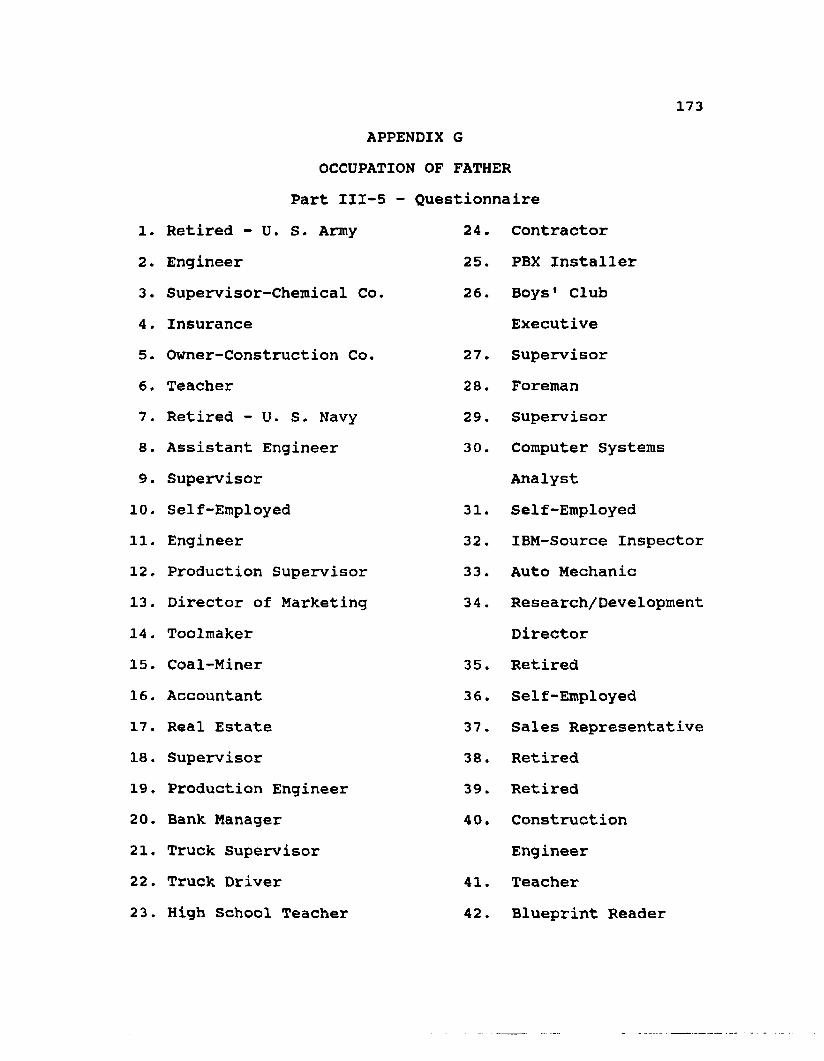
173APPENDIX 6
OCCUPATION OF FATHER Part III-5 - Questionnaire
1. Retired - U. S. Army 24. Contractor2. Engineer 25. PBX Installer3. Supervisor-Chemical Co. 26. Boys' Club4. Insurance Executive5. Owner-Construction Co. 27. Supervisor6. Teacher 28. Foreman7. Retired - U. S. Navy 29. Supervisor8. Assistant Engineer 30. Computer Systems9. Supervisor Analyst10. Self-Employed 31. Self-Employed11. Engineer 32. IBM-Source Inspector12. Production Supervisor 33. Auto Mechanic13. Director of Marketing 34. Research/Development14 . Toolmaker Director15. Coal-Miner 35. Retired16. Accountant 36. Self-Employed17. Real Estate 37. Sales Representative18. Supervisor 38. Retired19. Production Engineer 39. Retired20. Bank Manager 40. Construction21. Truck Supervisor Engineer22. Truck Driver 41. Teacher23. High School Teacher 42. Blueprint Reader
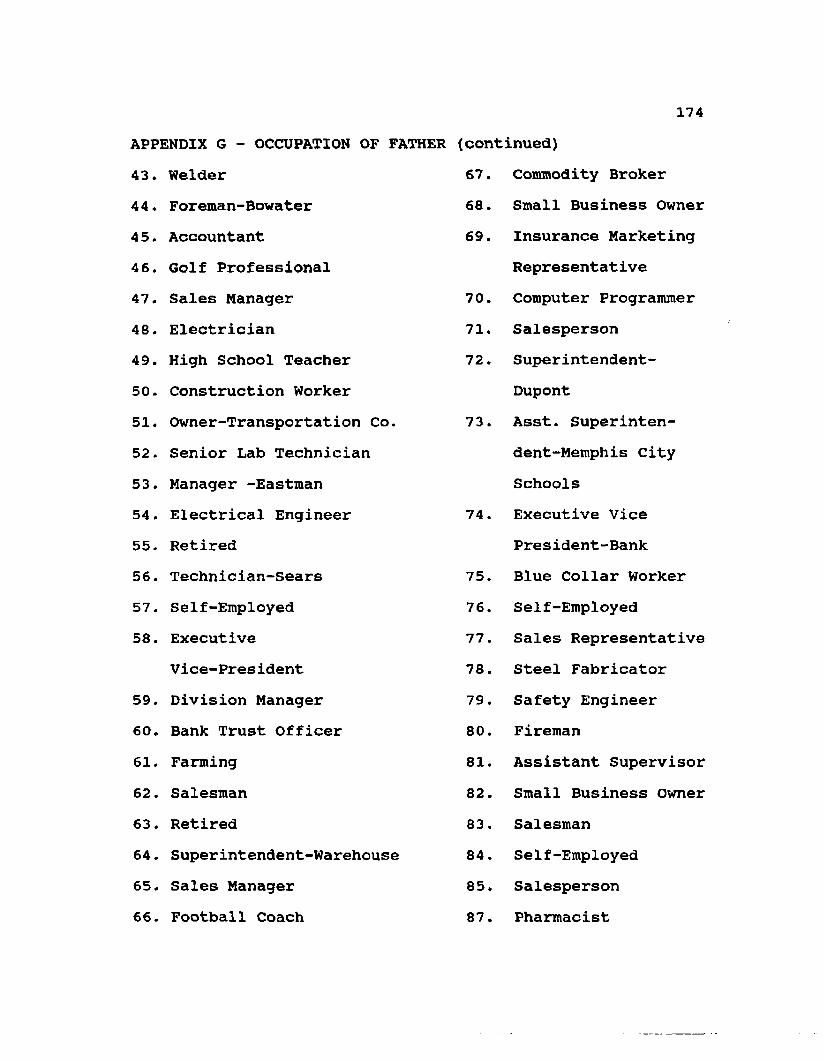
174APPENDIX G - OCCUPATION OF FATHER (continued)43. Welder 67. Commodity Broker44. Foreman-Bowater 68. Small Business Owner45. Accountant 69. Insurance Marketing46. Golf Professional Representat ive47. Sales Manager 70. Computer Programmer48. Electrician 71. Salesperson49. High School Teacher 72. Superintendent-50. Construction Worker Dupont51. Owner-Transportation Co. 73. Asst. Superinten-52. Senior Lab Technician dent-Memphis city53. Manager -Eastman Schools54. Electrical Engineer 74. Executive Vice55. Retired President-Bank56. Technician-Sears 75. Blue Collar Worker57. Self-Employed 76. Self-Employed58. Executive 77. Sales Representative
Vice-President 78. Steel Fabricator59. Division Manager 79. Safety Engineer60. Bank Trust officer 80. Fireman61. Farming 81. Assistant Supervisor62. Salesman 82. Small Business Owner63. Retired 83. Salesman64. Superintendent-Warehouse 84. Self-Employed65. Sales Manager 85. Salesperson66. Football Coach 87. Pharmacist
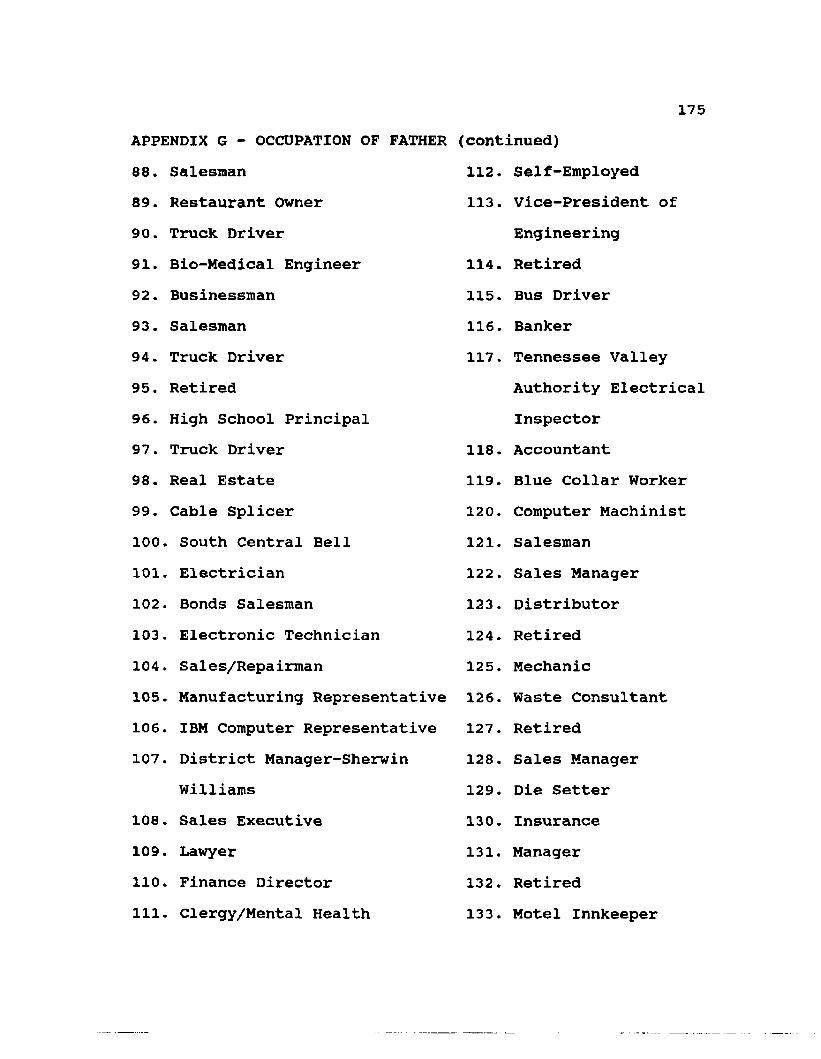
175APPENDIX G - OCCUPATION OF FATHER (continued)
•0000 Salesman 112. Self-Employed89. Restaurant Owner 113. Vice-President of90. Truck Driver Engineering91. Bio-Medical Engineer 114. Retired92. Businessman 115. Bus Driver93. Salesman 116. Banker94. Truck Driver 117. Tennessee Valley95. Retired Authority Electrical96. High School Principal Inspector97. Truck Driver 118. Accountant98. Real Estate 119. Blue Collar Worker99. Cable Splicer 120. Computer Machinist100 . South Central Bell 121. Salesman101 . Electrician 122. Sales Manager102 . Bonds Salesman 123. Distributor103 . Electronic Technician 124. Retired104 . Sales/Repairman 125. Mechanic105 . Manufacturing Representative 126. Waste Consultant106 . IBM Computer Representative 127 . Retired107 . District Manager-Sherwin 128. Sales Manager
Williams 129. Die Setter108 . Sales Executive 130. Insurance109 . Lawyer 131. Manager110 . Finance Director 132. Retired111 . Clergy/Mental Health 133. Motel Innkeeper
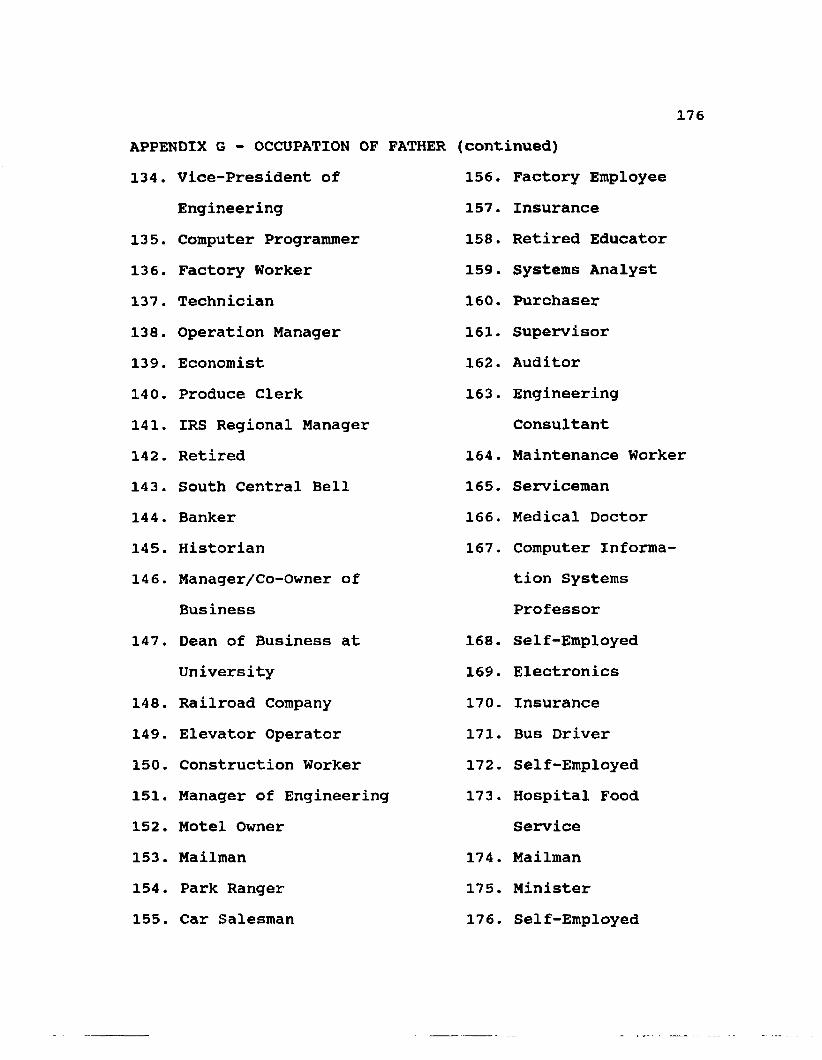
176APPENDIX G - OCCUPATION OF FATHER (continued)134. Vice-President of 156. Factory Employee
Engineering 157. Insurance135. Computer Programmer 158. Retired Educator136. Factory Worker 159. Systems Analyst137. Technician 160. Purchaser138. Operation Manager 161. Supervisor139. Economist 162. Auditor140. Produce Clerk 163. Engineering141. IRS Regional Manager Consultant142. Retired 164. Maintenance Worker143 . South Central Bell 165. Serviceman144. Banker 166. Medical Doctor145. Historian 167. Computer Informa146. Manager/Co-Owner of tion Systems
Business Professor147. Dean of Business at 168. Self-Employed
University 169. Electronics148. Railroad Company 170. Insurance149. Elevator Operator 171. Bus Driver150. Construction Worker 172. Self-Employed151. Manager of Engineering 173. Hospital Food152. Motel Owner Service153. Mailman 174. Mailman154. Park Ranger 175. Minister155. Car Salesman 176. Self-Employed
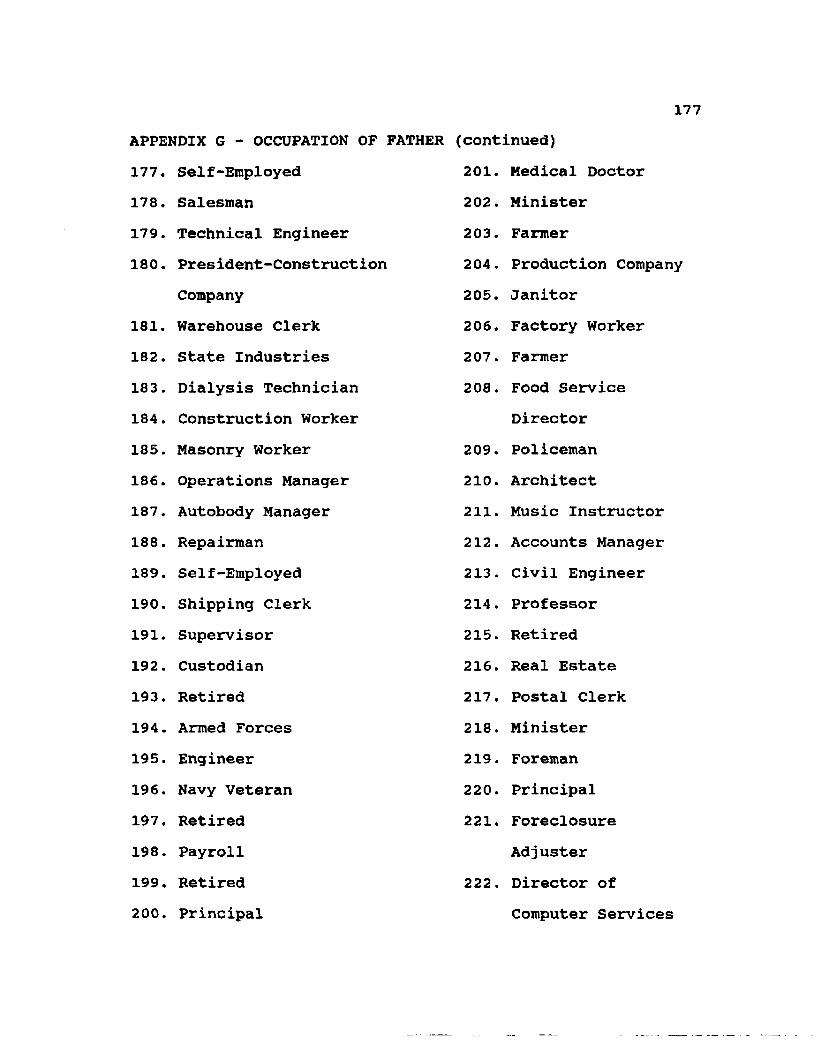
177APPENDIX G - OCCUPATION OF FATHER (continued)177. Self-Employed 201. Medical Doctor178. Salesman 202. Minister179. Technical Engineer 203. Farmer180. President-Construction 204. Production Company
Company 205. Janitor181. Warehouse Clerk 206. Factory Worker182. State Industries 207. Farmer183. Dialysis Technician 208. Food Service184. Construction Worker Director185. Masonry Worker 209. Policeman186. Operations Manager 210. Architect187. Autobody Manager 211. Music Instructor188. Repairman 212. Accounts Manager189. Self-Employed 213. Civil Engineer190. Shipping Clerk 214. Professor191. Supervisor 215. Retired192. Custodian 216. Real Estate193. Retired 217. Postal Clerk194. Armed Forces 218. Minister195. Engineer 219. Foreman196. Navy Veteran 220. Principal197. Retired 221. Foreclosure198. Payroll Adjuster199. Retired 222. Director of200. Principal Computer Services
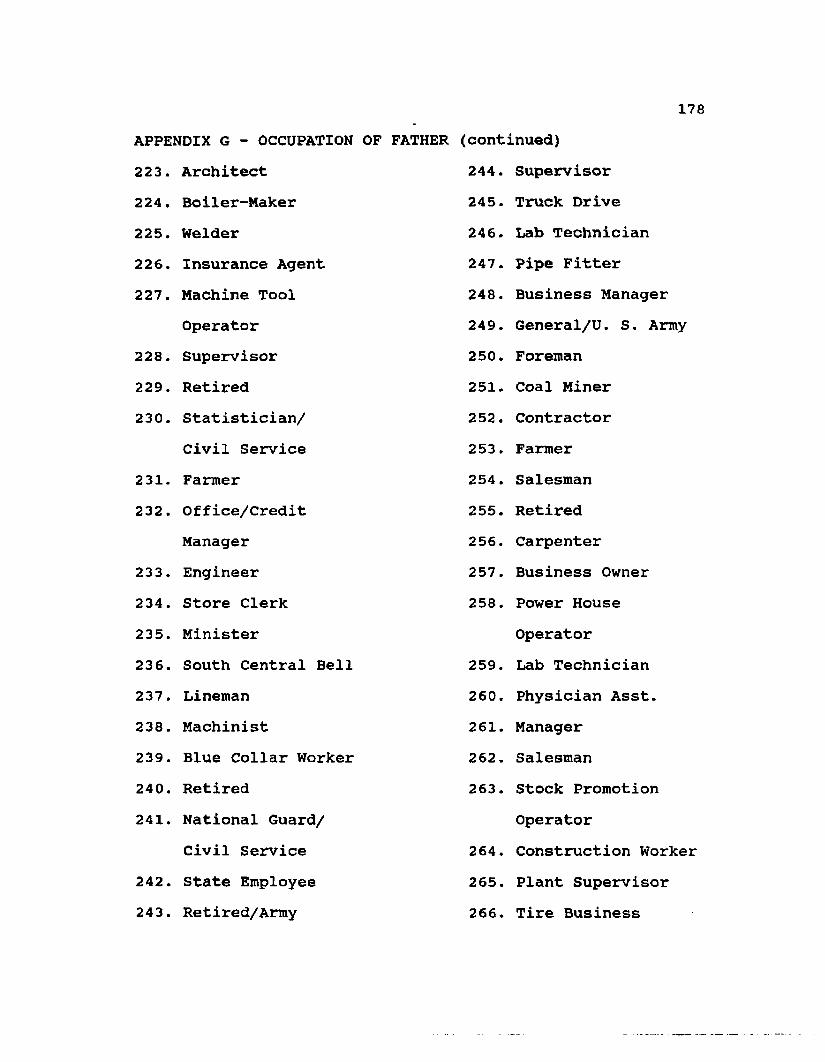
APPENDIX G - OCCUPATION OF FATHER (continued)223. Architect 244. Supervisor224. Boiler-Maker 245. Truck Drive225. Welder 246. Lab Technician226. Insurance Agent 247. Pipe Fitter227. Machine Tool 248. Business Manager
Operator 249. General/U. S. Army228. Supervisor 250. Foreman229. Retired 251. Coal Miner230. Statistician/ 252. Contractor
Civil Service 253. Farmer231. Farmer 254. Salesman232. Office/Credit 255. Retired
Manager 256. Carpenter233. Engineer 257. Business Owner234. Store Clerk 258. Power House235. Minister Operator236. South Central Bell 259. Lab Technician237. Lineman 260. Physician Asst.238. Machinist 261. Manager239. Blue Collar Worker 262. Salesman240. Retired 263. Stock Promotion241. National Guard/ Operator
Civil Service 264. Construction Worker242. State Employee 265. Plant Supervisor243. Retired/Army 266. Tire Business
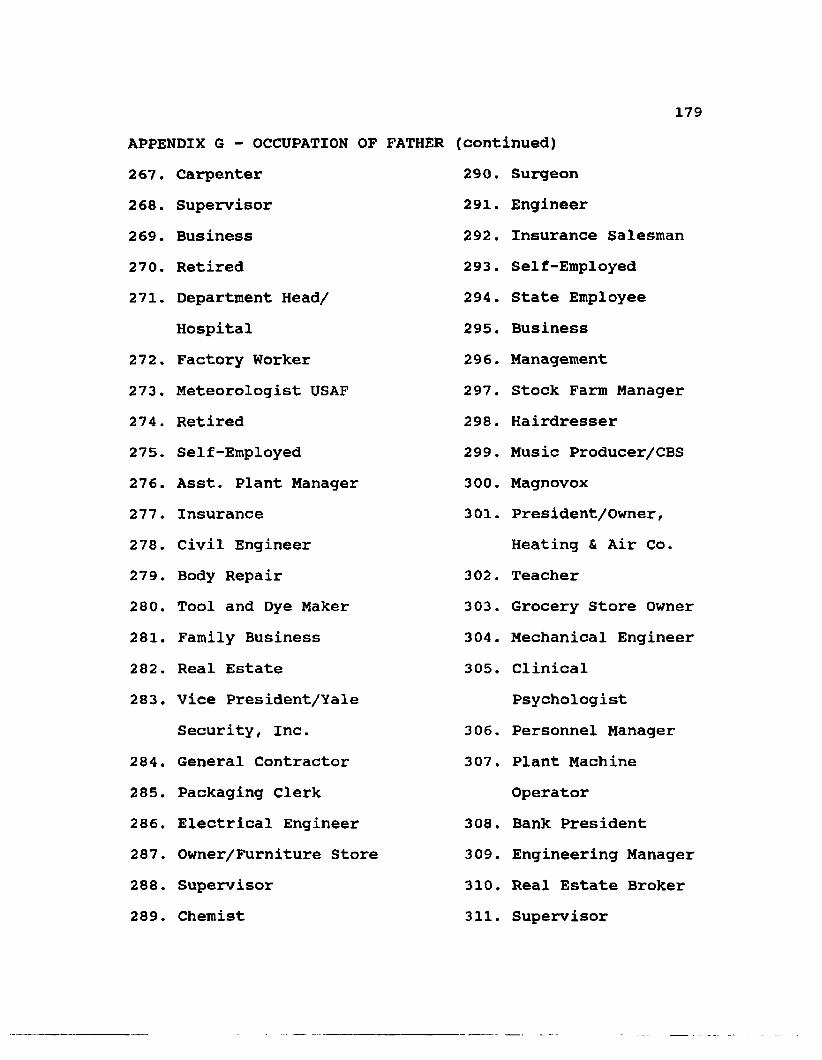
179APPENDIX G - OCCUPATION OF FATHER (continued)267. Carpenter 290. Surgeon268. Supervisor 291. Engineer269. Business 292. Insurance Salesman270. Retired 293. Self-Employed271. Department Head/ 294. State Employee
Hospital 295. Business272. Factory Worker 296. Management273. Meteorologist USAF 297. Stock Farm Manager274. Retired 298. Hairdresser275. Self-Employed 299. Music Producer/CBS276. Asst. Plant Manager 300. Magnovox277. Insurance 301. President/Owner,278. Civil Engineer Heating & Air Co.279. Body Repair 302. Teacher280. Tool and Dye Maker 303. Grocery Store Owner281. Family Business 304. Mechanical Engineer282. Real Estate 305. Clinical283. Vice President/Yale Psychologist
Security, Inc. 306. Personnel Manager284. General Contractor 307. Plant Machine285. Packaging Clerk Operator286. Electrical Engineer 308. Bank President287. Owner/Furniture Store 309. Engineering Manager288. Supervisor 310. Real Estate Broker289. Chemist 311. Supervisor
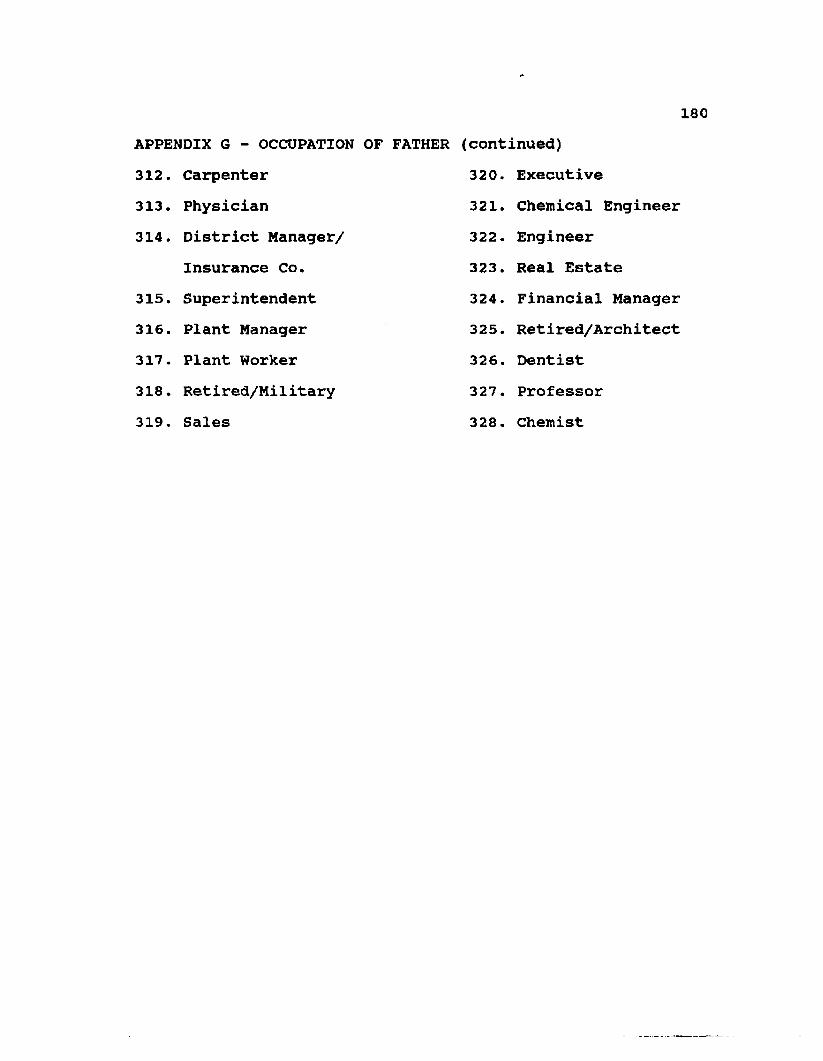
APPENDIX G - OCCUPATION OF FATHER (continued)312. Carpenter313. Physician314. District Manager/
Insurance Co.315. Superintendent316. Plant Manager317. Plant Worker318. Retired/Military319. Sales
180
320. Executive321. Chemical Engineer322. Engineer323. Real Estate324. Financial Manager325. Retired/Architect326. Dentist327. Professor328. Chemist
VITAEvaline Echols is a native Alabamian. She graduated from
Emma Sansom High School in Gadsden, Alabama as salutatorian of her class. She received her Bachelor of Science in Business degree from Lee College, Cleveland, Tennessee, where she graduated with honors (Summa Cum Laude). Her Master of Education in Business Education was earned at the University of Tennessee at Chattanooga.
For over twenty-five years she served as secretary/ administrative assistant to the president of Lee College, during which time she taught part-time in the business department at the college and continued her education. She is listed in “Outstanding Young Women of America" and was named "Secretary of the Year" in Cleveland, Tennessee during her tenure as secretary/administrative assistant.
She presently serves as Chairperson of the Business Department and Associate Professor of Business at Lee College (Cleveland, Tennessee) , a post which she has held for the past six years. For one year, while pursuing her doctorate, she taught business education courses at Louisiana State University as part of a graduate assistantship.
As a writer and speaker, she is frequently asked to participate in professional meetings and seminars. She has written one book, Climb Up Through Your Valleys, published by Pathway Press, Cleveland, Tennessee, and recently completed a second manuscript, Mount Up With Wings, for publication.
181
182She has contributed frequently to publications of her church denomination.
Evaline has two children, Eddie and Sharon, who live in Atlanta, Georgia. Eddie and his wife, Sherry, have two children, Darren and Drew.
DOCTORAL EXAMINATION AND DISSERTATION REPORT
Candidate: E v a lin e E ch o ls
Major Field: V o c a tio n a l E d u c a tio n
Title of Dissertation: F a c to r s I n f lu e n c in g th e S e l e c t io n o f B u s in e ss M ajo rs a s P e rc e iv e d by U n iv e r s i ty B u s in e ss S tu d e n ts
Approved:
Dean of the Graduate School
EXAMINING COMMITTEE:
Date of Examination: Ju n e 27 , 1990