Factors Influencing Technical Efficiencies among Selected
33
Factors Influencing Technical Efficiencies among Selected Wheat Farmers in Uasin Gishu District, Kenya By James Njeru Department of Economics Moi University AERC Research Paper 206 African Economic Research Consortium, Nairobi November 2010 THIS RESEARCH STUDY was supported by a grant from the African Economic
Transcript of Factors Influencing Technical Efficiencies among Selected

Factors Influencing Technical Efficiencies among
Selected Wheat Farmers in Uasin Gishu District, Kenya
By
James NjeruDepartment of Economics
Moi University
AERC Research Paper 206African Economic Research Consortium, Nairobi
November 2010THIS RESEARCH STUDY was supported by a grant from the African Economic

Research Consortium. The findings, opinions and recommendations are those of the author, however, and do not necessarily reflect the views of the Consortium, its indi-vidual members or the AERC Secretariat.
Published by: The African Economic Research Consortium P.O. Box 62882 - City Square Nairobi 00200, Kenya
Printed by: Regal Press (K) Ltd P.O. Box 46166 - GPO Nairobi 00100, Kenya
ISBN 9966-778-76-4
© 2010, African Economic Research Consortium.
ContentsList of tables ivAcknowledgements vAbstract vi
1. Introduction 1
2. Literature review 4
3. The model 8
4. Empirical results 13
5. Conclusions and recommendations 18
Notes 20
References 21
iii

List of tables1. Domestic production and consumption, 19902003 22. A comparison of small and large-scale farming characteristics 143. MLE estimates of stochastic frontier production function for wheat farming 154. Empirical estimates of factors that influence technical inefficiencies 16
iv
AcknowledgementsI am very grateful for the financial and technical support of the African Economic Research Consortium (AERC) awarded towards the carrying out of this research and ultimately production of this report. I would like to thank the resource persons in thematic group D, the peer reviewers and fellow researchers for their invaluable comments and inputs to the initial drafts of the study. Special thanks go to professors Francis Mwega, Eugene Kuassi and Melvin Ayogu for their stewardship through the critical stages of the study. I am also grateful to the field supervisor Mr Elvis Kiano. However, I remain solely responsible for the views, errors and omissions in this paper.
v

AbstractThis study examined the factors influencing technical efficiency in wheat farming in Kenya using a stochastic frontier production function in which technical inefficiency effects were assumed to be functions of both socioeconomic characteristics of the farmer and farm-specific characteristics. The paper used random sampling to interview 160 farmers comprising 97 large-scale farmers and 63 small-scale farmers.
The results revealed existence of significant levels of technical inefficiencies in wheat production, especially among the large-scale farmers. The study found that the magnitude of technical efficiency varied from one farmer to another and ranged from 48.9% to 95.1%, with a mean of 87.2%. This implied that farmers lost close to 13% of the potential output to technical inefficiencies. There was variation depending on the size of farm with small-scale farmers attaining higher technical efficiency than the large-scale farmers. The main factors that influenced the degree of inefficiency were education levels, access to credit, and ownership of the capital equipment. Higher levels of education (12 years and above or secondary and above) significantly reduced inefficiency as did access to credit facilities and owning the farm equipment. The study recommended that farmers be educated on the use of better techniques such as use of certified seeds and application of recommended levels of fertilizer.
JEL classificationKey words: Productivity, technical efficiencies, stochastic frontier functions, and wheat farming in Kenya
vi

Factors InFluencIng technIcal eFFIcIencIes among selected Wheat Farmers In uasIn gIshu dIstrIct, Kenya 1
1
1. Introduction
Wheat is the third most important cereal crop in the world after maize and rice.1 In Kenya, wheat is the second most important cereal crop after maize (GoK,
2005). Wheat products are mainly consumed by the urban population and by the majority of middle and high-income earners in the rural areas and its demand exceeds domestic production by more that 50% (Nyangito et al., 2002). Originally, wheat production was predominantly large scale. However, the sub-divisions and redistributions of most of the former wheat farms in the 1970s led to the emergence of small-scale wheat farming.
Since the introduction of small-scale farming, the national output of wheat increased from an average of 160,000 tonnes (t) in the 1960s to 220,000t in the 1970s and 1980s and to the current levels of slightly over 300,000t (Gitu and Nzuma, 2003; GoK, 2003a). Currently, the wheat industry contributes about 2.2% of the gross domestic product (GDP) and employs over 200,000 people (Gitu and Nzuma, 2003). However, the average production is still below the estimated average potential of about 600,000t that could be achieved if the current cultivated land were to be optimally utilized and farmers planted hybrid seed varieties developed by Kenya Agriculture Research Institute (KARI). The hybrid seed varieties have a potential yield of about 6.42t/ha and since the national average yield continues to remain low, averaging about 3.21 t/ha, there is a potential of 50% that can be substantially improved (Nyoro and Jayne, 1999). Owuor (1999) estimated that the yield range from 1.1 t/ha in low potential small farms to about 4.0 t/ha in high potential large farms. This implies that under the current acreage under wheat cultivation, Kenya can produce enough wheat to meet her domestic demand.
To exploit the current potential, farmers need to operate at the utmost efficiency levels. By estimating the magnitude of technical efficiencies and examining the factors that influence such resultant inefficiency levels, this paper aims to provide the way forward to increasing productivity.
Wheat farming in Kenya started at the beginning of the 20th century when the colonial farmers settled in the Kenyan highlands, a high potential agro-ecological zone. Currently, wheat is grown in both high and low potential agro-ecological zones in the Rift Valley Province (Uasin Gishu, Narok, Nakuru, Laikipia, Samburu, Nyandarua and
2 research PaPer 206
Trans-Nzoia). Before independence, production was predominantly undertaken by white farmers on a large scale. This scenario changed immediately after independence when a few Asian and African farmers embarked on wheat production on a small scale. Today, wheat production is undertaken by both the small-scale and large-scale farmers.2
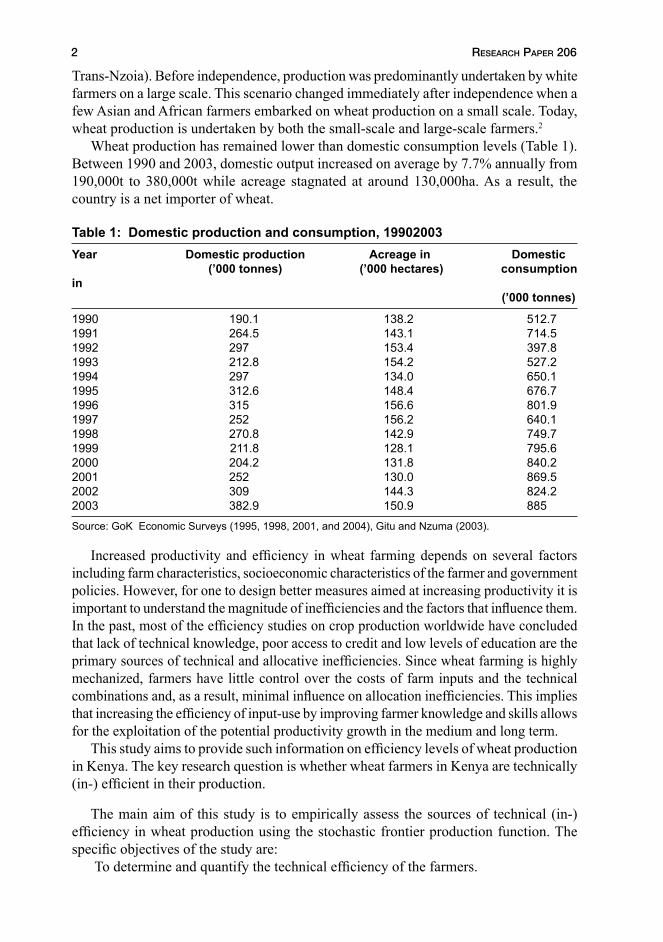
Wheat production has remained lower than domestic consumption levels (Table 1). Between 1990 and 2003, domestic output increased on average by 7.7% annually from 190,000t to 380,000t while acreage stagnated at around 130,000ha. As a result, the country is a net importer of wheat.
Table 1: Domestic production and consumption, 19902003Year Domestic production Acreage in Domestic (’000 tonnes) (’000 hectares) consumption in (’000 tonnes)
1990 190.1 138.2 512.71991 264.5 143.1 714.51992 297 153.4 397.81993 212.8 154.2 527.21994 297 134.0 650.11995 312.6 148.4 676.71996 315 156.6 801.91997 252 156.2 640.11998 270.8 142.9 749.71999 211.8 128.1 795.62000 204.2 131.8 840.22001 252 130.0 869.52002 309 144.3 824.22003 382.9 150.9 885
Source: GoK Economic Surveys (1995, 1998, 2001, and 2004), Gitu and Nzuma (2003).
Increased productivity and efficiency in wheat farming depends on several factors including farm characteristics, socioeconomic characteristics of the farmer and government policies. However, for one to design better measures aimed at increasing productivity it is important to understand the magnitude of inefficiencies and the factors that influence them. In the past, most of the efficiency studies on crop production worldwide have concluded that lack of technical knowledge, poor access to credit and low levels of education are the primary sources of technical and allocative inefficiencies. Since wheat farming is highly mechanized, farmers have little control over the costs of farm inputs and the technical combinations and, as a result, minimal influence on allocation inefficiencies. This implies that increasing the efficiency of input-use by improving farmer knowledge and skills allows for the exploitation of the potential productivity growth in the medium and long term.
This study aims to provide such information on efficiency levels of wheat production in Kenya. The key research question is whether wheat farmers in Kenya are technically (in-) efficient in their production.
The main aim of this study is to empirically assess the sources of technical (in-) efficiency in wheat production using the stochastic frontier production function. The specific objectives of the study are: To determine and quantify the technical efficiency of the farmers.
Factors InFluencIng technIcal eFFIcIencIes among selected Wheat Farmers In uasIn gIshu dIstrIct, Kenya 3
• To identify and examine the effects of socioeconomic characteristics of farmers on technical efficiency.
The key hypotheses in the study are:• Wheat farmers in Uasin Gishu District are technically efficient in their production
levels.• Farmers’ socioeconomic variables have no influence on their technical efficiency.
The rest of the study is organized as follows. Section 2 gives a brief review of the literature of related theoretical and empirical studies and the theoretical framework used to measure technical efficiencies and inefficiencies. In Section 3, we discuss the empirical model estimated in this study. The results are provided and discussed in Section 4. Finally, Section 5 gives the conclusion and recommendations of the study.
4 research PaPer 206
2. Literature reviewDefinition of technical efficiency
One of the basic thrusts of economics of agricultural production at the micro level is to assist individual farmers or a group of farmers to attain their objectives through efficient intra-farm allocation of resources at a particular time or over
a period. Efficiency is achieved either by maximizing output from given resources or by minimizing the resources required for producing a given output (Varian, 1992). In economic theory, production efficiency comprises technical and allocative efficiencies, with technical efficiency reflecting the ability of a farm to maximize output for a given set of resource inputs while allocative (factor price) efficiency reflects the ability of the farm to use the inputs in optimal proportions given their respective prices and production technology (Farrell, 1957).
Technical efficiency can either be output or input-oriented. An output-oriented technical efficiency occurs when the maximum amount of an output is produced for a given set of inputs while an input-oriented technical efficiency occurs when the minimum amount of inputs are required to produce a given output level (Farrell, 1957). Therefore, technical efficiencies are derived from production function or production possibility frontiers.
Approaches for measuring technical efficiencies
Several approaches have been followed in estimating technical efficiencies. The most commonly used approaches include: the Malmquist index, the Data Envelopment
Analysis (DEA) and the stochastic frontiers. DEA, attributed to Charnes et al. (1978), is a non-parametric (i.e., non-statistical)
or mathematical programming approach for considering optimum solutions relative to individual units (e.g., firms) rather than assuming, as in optimized regression, that a solution applies to each decision-making unit. There are two primary orientations of the DEA approach to assess technical and economic efficiency: input- and output-oriented. The input-based measure considers how inputs may be reduced relative to a desired output level. The output-based measure indicates how output could be expanded given the input levels. This approach has been adopted by Fulginiti and Perrin (1997; 1998), Arnade (1998), Rao and Coelli (1998), Nin et al. (2003) and Trueblood and Coggins (2003). A recognized limitation of using DEA to assess technical efficiency is that recommendations for decreasing input usage or expanding output levels are in terms of scalar valued ratios which are held constant (i.e., recommendations are in terms of
4

Factors InFluencIng technIcal eFFIcIencIes among selected Wheat Farmers In uasIn gIshu dIstrIct, Kenya 5
fixed proportions).The Malmquist productivity index introduced by Caves et al. (1982a; 1982b) is a
binary comparison of two entities the input and output distance functions. Färe et al. (1994) extended the index to allow for productivity comparison between one sector and another and for decomposition of total factor productivity into change in technical efficiency and technological change. The approach measures productivity change by comparing observed change in output with the imputed change in output that would have been possible from the observed input changes. The imputation is based on the production possibility set for either the current or the subsequent period. During the computations, it makes use of DEA to generate the ratio of two distance functions (input and output distance functions) and their geometric mean (Färe et al., 1994). Several empirical studies have adopted this approach (Grifell-Tatjé and Lovell, 1995; Fulginiti and Perrin, 1997; Coelli and Rao, 2003).
The stochastic frontier approach specifies the relationship between output and input levels using two error terms. One error term is the traditional normal error term in which the mean is zero and the variance is constant. The other error term represents technical inefficiency and may be expressed as a half-normal, truncated normal, exponential, or two-parameter gamma distribution. Technical efficiency is subsequently estimated via maximum likelihood of the production function subject to the two error terms [Aigner, et al., (1977) and Meeusen and Van den Broeck (1977)]. Empirical studies that use the stochastic frontier production function follow either the two-step approach that first estimates the stochastic frontier production function to determine the technical efficiency indicators and thereafter, these indicators are regressed on explanatory variables, which usually represent the farms’ specific characteristics, using the ordinary least square (OLS) method. Like many other approaches, the estimation of this approach is not free of limitation. Its major drawback is the assumption that the inefficiency effects are independent and identically distributed. To overcome this, Reifschneider and Stevenson (1991) developed a model in which inefficiency effects are defined as an explicit function of certain factors specific to the farm, and all the parameters are estimated in one step using the maximum likelihood procedure, and hence the one-step approach. This one-step approach has been used by other researchers (see Huang and Liu, 1994; Battese and Coelli, 1995). Using either the two-step approach or the one-step approach to estimate technical efficiency (inefficiency) specific empirical studies have identified several factors including socioeconomic and demographic factors, plot-level characteristics, environmental factors and non-physical factors as the likely determinants of technical efficiency among farmers. However, the magnitudes of these factors differ from country to country or from one study to another.
Out of these approaches, the stochastic frontier approach is the most preferred in agricultural economics because the basic assumption of the non-parametric approach and deterministic frontiers that all deviations from the frontier are due to farms’ inefficiency is highly unrealistic in the agricultural sector. Variability in agricultural output is attributable to climatic hazards, plant pathology and insect pests, government policies, international markets etc. Moreover, given the low education status of most farmers, information gathered on production statistics may sometimes be inaccurate. Furthermore, the non-stochastic approaches are extremely sensitive to outliers and if

6 research PaPer 206
the outliers are a reflection of the above, they heavily distort the estimated frontier and the efficiency measures derived from it. Most empirical analyses of stochastic frontier approaches follow that of Aigner et al. (1977) reproduced below.
(1)
(1a)
where y is the level of output, x is the value of input k, e = n - m is the composite error term, v is a two-sided error term and m is a one-sided error term. The random (symmetric) error term v, represents random variations in the economic environment facing production units, reflecting luck, weather, machine breakdown and variable input quality; measurement errors and omitted variables from the functional form (Aigner et al., 1977). However, the error term m, represents a variety of features that reflect idiosyncratic effects that are specific to the production unit and that could enter the model with either sign a negative entry implies inefficiency. The specific features include: Farm-specific knowledge the will, skills, and effort of management and employees; work stoppages; material bottlenecks; and other disruptions to production (Aigner et al., 1977; Page, 1980).
Given that the frontier (or efficient production) for any particular farm is ( ) ¡¡ +|xf , then m is the inefficiency term, the random variable of interest. Since the data in Equation 1 are in log terms, m is a measure of the percentage by which the particular observation fails to achieve the frontier, ideal production rate. If mi=0, the production lies on the stochastic frontier (Equation 1a) and is technically efficient; if mi>0, production lies below the frontier and is inefficient. The magnitude of the inefficiency term depends on the specification of the distribution taken. Previous studies identify several forms of possible distributions for the inefficiency term, the absolute value of a normally distributed variable, an exponentially distributed variable, a truncated normally distributed variable and the gamma density (Wang, 2002).
Methods for identifying determinants of technical efficiencies
After estimating technical efficiency, based on the stochastic production frontier, literature proposes two main approaches to analysing the factors influencing
technical efficiency sources the two-stage estimation procedure and the one-stage simultaneous estimation approach. The two-stage approach requires one to first estimate the stochastic production function to determine technical efficiency indicators and then, secondly, regress the derived efficiency scores on explanatory variables which usually
Factors InFluencIng technIcal eFFIcIencIes among selected Wheat Farmers In uasIn gIshu dIstrIct, Kenya 7
represent the farm’s specific characteristics using ordinary least square (OLS) method or Tobit regression. The major drawback with this approach is in the fact that, in the first step, the inefficiency effects (mj) are assumed to be independent and identically distributed in order to use the approach of Jondrow et al. (1982) to predict the values of technical efficiency indicators. In the second step however, the technical efficiency indicators thus obtained are assumed to depend on a certain number of factors specific to the farm, which implies that the mjs are not identically distributed, unless all the coefficients of the factors considered happen simultaneously.
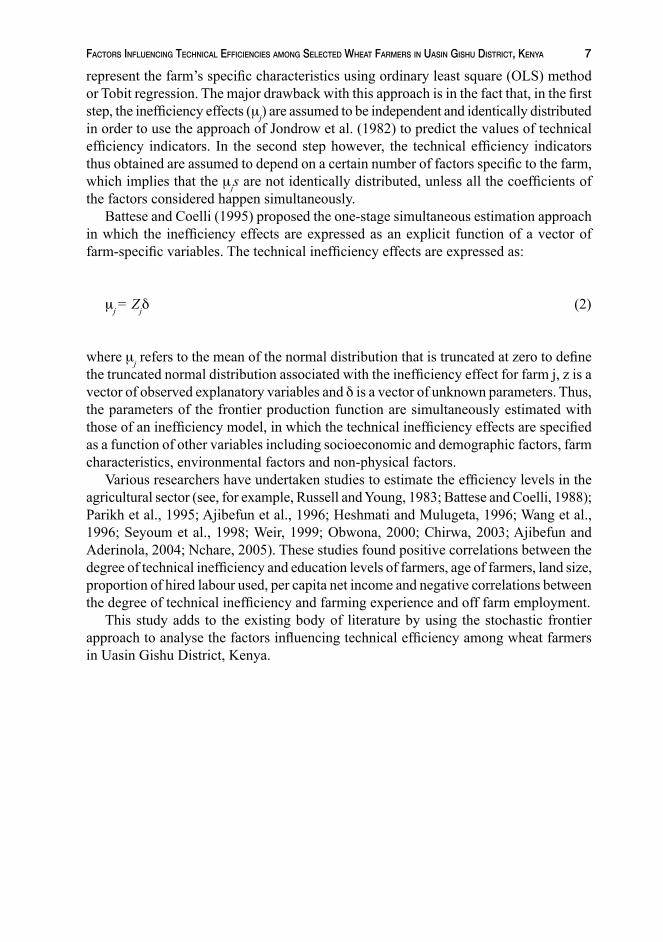
Battese and Coelli (1995) proposed the one-stage simultaneous estimation approach in which the inefficiency effects are expressed as an explicit function of a vector of farm-specific variables. The technical inefficiency effects are expressed as:
mj = Zjd (2)
where mj refers to the mean of the normal distribution that is truncated at zero to define the truncated normal distribution associated with the inefficiency effect for farm j, z is a vector of observed explanatory variables and d is a vector of unknown parameters. Thus, the parameters of the frontier production function are simultaneously estimated with those of an inefficiency model, in which the technical inefficiency effects are specified as a function of other variables including socioeconomic and demographic factors, farm characteristics, environmental factors and non-physical factors.
Various researchers have undertaken studies to estimate the efficiency levels in the agricultural sector (see, for example, Russell and Young, 1983; Battese and Coelli, 1988); Parikh et al., 1995; Ajibefun et al., 1996; Heshmati and Mulugeta, 1996; Wang et al., 1996; Seyoum et al., 1998; Weir, 1999; Obwona, 2000; Chirwa, 2003; Ajibefun and Aderinola, 2004; Nchare, 2005). These studies found positive correlations between the degree of technical inefficiency and education levels of farmers, age of farmers, land size, proportion of hired labour used, per capita net income and negative correlations between the degree of technical inefficiency and farming experience and off farm employment.
This study adds to the existing body of literature by using the stochastic frontier approach to analyse the factors influencing technical efficiency among wheat farmers in Uasin Gishu District, Kenya.

8 research PaPer 206
3 The modelEmpirical model
Since measurement of technical efficiencies relies on the estimation of production frontiers, as derived from a given production function, there is a need to first specify the proposed functional form of the wheat production function to be estimated.
The most commonly used production function in econometric estimations (due to its simplicity) is the Cobb-Douglas function. It assumes that the elasticity of substitution between factors is always equal to one, implying that capital and labour are substitutable in both the short and the long run. Other commonly used functions are the Constant Elasticity of Substitution (CES) and the Transcendental Logarithmic (Translog). CES permits one to vary the elasticity of substitution while the Translog (a more general function due to its flexible function form) permits the partial elasticities of substitution between inputs to vary, i.e., the elasticity of scale can vary with output and factor proportions, permitting its long-run average cost curve to take the traditional U-shape.
After preliminary testing for the most suitable functional forms of the model under the data set available, the Cobb-Douglas function was adopted in favour of the more commonly used Translog function. The main focus of measures of the technical inefficiencies is on the error term. The study adopts the one-stage estimation procedure proposed by Battese and Coelli (1995) and subsequently by Chirwa (2003) to estimate a stochastic frontier production. The one-stage procedure allows for simultaneous estimation of the parameters of frontier production function with those of the inefficiency model.
The equations are defined as:
(3)
where ln is a natural logarithm, Yj is the total quantity of wheat harvested (in kgs); Xi represents the quantity of input i used in the production process such as labour, farm size, capital, fertilizers, seed; Di represents dummy variables introduced to capture access to credit as source of income for investment, the differences in education levels, and use of certified seeds; Vj represents the random variable with zero mean and unknown
represents the non-negative random term representing the technical
8
Factors InFluencIng technIcal eFFIcIencIes among selected Wheat Farmers In uasIn gIshu dIstrIct, Kenya 9
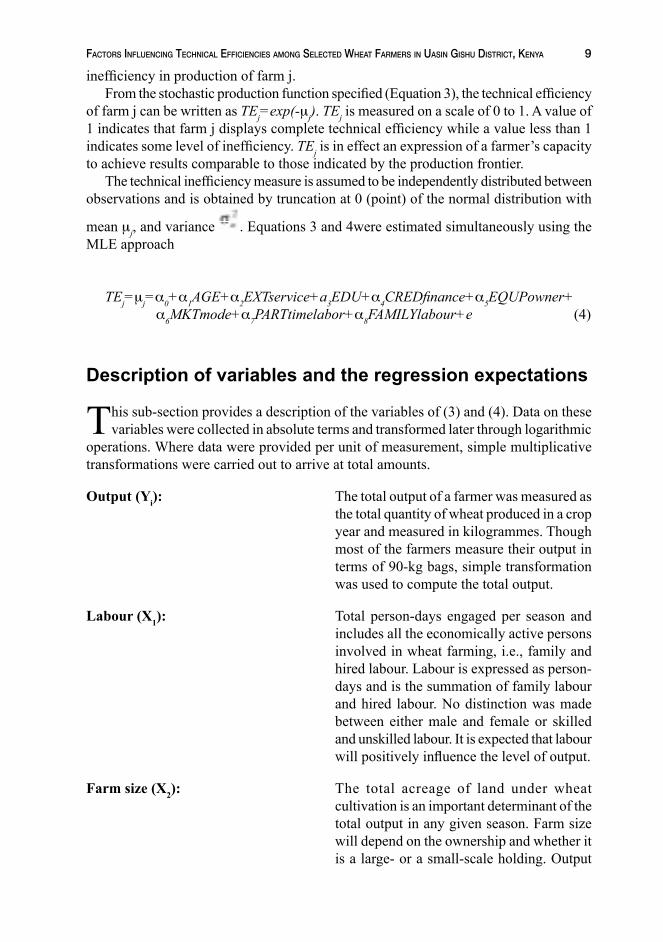
inefficiency in production of farm j.From the stochastic production function specified (Equation 3), the technical efficiency
of farm j can be written as TEj=exp(-mj). TEj is measured on a scale of 0 to 1. A value of 1 indicates that farm j displays complete technical efficiency while a value less than 1 indicates some level of inefficiency. TEj is in effect an expression of a farmer’s capacity to achieve results comparable to those indicated by the production frontier.
The technical inefficiency measure is assumed to be independently distributed between observations and is obtained by truncation at 0 (point) of the normal distribution with
mean mj, and variance . Equations 3 and 4were estimated simultaneously using the MLE approach
TEj=mj=a0+a1AGE+a2EXTservice+a3EDU+a4CREDfinance+a5EQUPowner+ a6MKTmode+a7PARTtimelabor+a8FAMILYlabour+e (4)
Description of variables and the regression expectations
This sub-section provides a description of the variables of (3) and (4). Data on these variables were collected in absolute terms and transformed later through logarithmic
operations. Where data were provided per unit of measurement, simple multiplicative transformations were carried out to arrive at total amounts.
Output (Yi): The total output of a farmer was measured as
the total quantity of wheat produced in a crop year and measured in kilogrammes. Though most of the farmers measure their output in terms of 90-kg bags, simple transformation was used to compute the total output.
Labour (X1): Total person-days engaged per season and
includes all the economically active persons involved in wheat farming, i.e., family and hired labour. Labour is expressed as person-days and is the summation of family labour and hired labour. No distinction was made between either male and female or skilled and unskilled labour. It is expected that labour will positively influence the level of output.
Farm size (X2): The total acreage of land under wheat cultivation is an important determinant of the total output in any given season. Farm size will depend on the ownership and whether it is a large- or a small-scale holding. Output

10 research PaPer 206
will be expected to depend positively on the size of land under cultivation.
Capital equipment (X3): A capital index measuring the total machine-hours from the combination of all the capital equipment tractors and combine harvesters either hired or owned by a farmer. Wheat farming is a capital intensive activity and availability of the different machinery is important.
Fertilizer (X4): Total quantity of fertilizer used. It is measured in kilogrammes as the sum of all the various types of fertilizers consumed nitrogen, phosphorus and potassium (NPK), diammonium phosphate (DAP), nitrogen fertilizer (Urea), and calcium ammonium nitrate (CAN). Use of the recommended quantities of fertilizer is critical and will have a positive effect on output. The recommended quantities will be as defined by the Ministry of Agriculture officials in collaboration with KARI researchers. These differ from one agricultural zone to another.
Hybrid seeds (X5): The total quantity of seeds measured
in kilogrammes. Different varieties of seeds are recommended (by Ministry of Agriculture officials in collaboration with KARI researchers) for different ecological zones. Use of high yield hybrid seeds purchased from recommended dealers will have a positive effect on production.
Dummy variable (D1): Focuses on credit as one of the sources of finances used by farmers to pay for various wheat farming activities. It captures the different levels of sources of income for investment and assumes a value of 1 if credit is accessed, otherwise 0. Availability of credit is important as farmers incur high expenses when they purchase farm inputs like seeds, fertilizer and chemicals. In addition, some farmers hire capital equipment.
Dummy variable (D2): Captures the differences in education levels. The dummy assumes a value 1 if education
Factors InFluencIng technIcal eFFIcIencIes among selected Wheat Farmers In uasIn gIshu dIstrIct, Kenya 11
level is secondary and above (12 years and above), 0 otherwise.
Dummy variable (D3): Captures the differences in usage of certified/hybrid seeds and uncertified/locally cured seeds. It assumes a value of 1 if farmers planted certified seeds purchased from authorized dealers, 0 otherwise.
Farming experience (EXP): A farmer’s wheat farming experience is measured in years of wheat farming. Literature reviews on farming experience on efficiency have given mixed results. Farming experience could have negative or positive effects on the efficiency of the farmer. Parikh et al. (1995) reported a positive relationship between the age of the farmers (which is positively correlated with farming experience) and the efficiency of farmers in Pakistan and Ethiopia. These findings stem from the fact that farmers with more experience and who are older are likely to be more conservative and therefore less willing to adopt new practices, thus leading to low efficiencies in production. Coelli and Battese (1996) reported negative production elasticity with respect to farming experience for farmers in two villages in India, thus suggesting that older farmers are relatively more efficient and vice versa.
Age (AGE): The farmer’s age is measured in years.
Education (EDU): Studies have shown that farmers with formal education have a great ability to adopt new technology and innovation. This is expected to have a positive influence on their level of efficiency. Coelli and Battese (1996) have confirmed the positive influence of education on farmers’ production efficiency. The dummy assumes a value 1 if the education level is secondary and above (12 years and above), 0 otherwise.
Ownership of equipment (EQUPowner): Whereas some farmers own all

12 research PaPer 206
the required capital equipment, others rely on hired ones. The capacity of the capital equipment differs from one model to another. The dummy assumes a value 1 if capital equipment is hired by farmer and 0 otherwise.
Mode of marketing (MKTmode): Farmers can either sell their produce through
government agencies or privately to millers and middlemen. The dummy assumes a value 1 if privately marketed and 0 otherwise.
Part-time farmer (PARTtime): Some farmers engage in wheat farming part-time and switch from wheat farming to maize farming from time to time. This category of farmers differs from those farmers who consistently engage in wheat farming regardless of the prevailing market prices of wheat at the end of the season. The dummy assumes a value 1 if part-time and 0 otherwise.
Use of family Labour (FAMILYlabour): Family and hired labour play an important role in agricultural production, especially in developing economies where capital equipment is less significant. The dummy assumes a value 1 if only family labour is used and 0 otherwise.
Extension services (EXTservice): Availability of agricultural extension services influence the adoption of better farming methods and especially the use of the right quantities of fertilizer, seeds and pesticides. The dummy assumes a value 1 if a farmer received at least one extension services visit, 0 otherwise.

Factors InFluencIng technIcal eFFIcIencIes among selected Wheat Farmers In uasIn gIshu dIstrIct, Kenya 13
4. Empirical results
This section presents the data analysis and results from the empirical estimation of the empirical model discussed in the previous section. Data were collected through a field survey conducted in April 2005 in Uasin Gishu District in Eldoret. The
sample survey comprised of 160 randomly selected wheat farmers. Farmers were classified into two categories based on the size of their farms: (i) Small farms and (ii) Large farms. Small farms were defined as those whose wheat growing area range between 0.2ha and 8ha and the large farms as those with wheat growing area of over 8ha (the study did not distinguish between medium- and large-scale farmers). The 160 farmers analysed in the study comprised 63 small-scale farmers (40%) of the respondents and 97 large-scale farmers (60%) of the farmers. Questionnaires were administered to the individuals involved in the day-to-day overall decision making and management of the farms. Thus the respondents were either the head of the household or the manager of the farm. The study focused on the 2004 crop year and therefore relied on recall information. The study benefited from the fact that most of the farmers were, at the time of data collection, preparing their farms for the 2005 crop year and hence could easily recall the process they underwent during the previous season.
Descriptive statistical analysis of the variables
Before econometric estimation, the descriptive characteristics of the data collected (Table 2) were examined. An analysis of the socioeconomic characteristics
of the farmers revealed that small-scale farmers were relatively young with a mean age of 42 years compared with 55 years for the large-scale farmers. In addition, small-scale farmers were the more educated of the two categories. Only 3.2% of the interviewed small-scale farmers had no education at all compared with 28.9% of the large-scale farmers. More small-scale farmers (69.8%) had secondary education and above than the large-scale farmers (45.8%). On farm ownership, 14.2% of the small-scale farmers hired their farms compared with 8.3% of the large-scale farmers. Of the sampled farmers, 52% opted to use their own sources of income instead of credit compared with 48% who accessed credit facilities (comprising of 27% small-scale and 61.4% large-scale farmers.The main reasons given were: High cost of credit and difficulties in repaying the loans; lack of collateral; too many conditions; and farms too small. A comparison of farming characteristics of the selected farmers is presented in Table 2.
Table 2: A comparison of small and large-scale farming characteristics
13
14 research PaPer 206
Small scale (N=63) Large scale (N=97)
Mean Std. Std. Mean Std. Std. deviation error deviation error Mean Mean
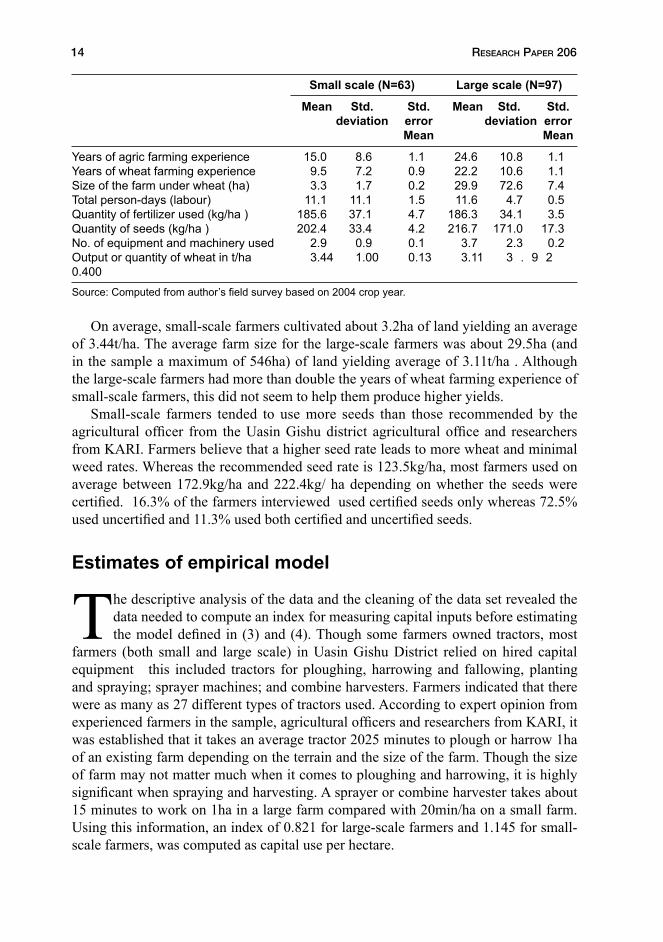
Years of agric farming experience 15.0 8.6 1.1 24.6 10.8 1.1Years of wheat farming experience 9.5 7.2 0.9 22.2 10.6 1.1Size of the farm under wheat (ha) 3.3 1.7 0.2 29.9 72.6 7.4Total person-days (labour) 11.1 11.1 1.5 11.6 4.7 0.5Quantity of fertilizer used (kg/ha ) 185.6 37.1 4.7 186.3 34.1 3.5Quantity of seeds (kg/ha ) 202.4 33.4 4.2 216.7 171.0 17.3No. of equipment and machinery used 2.9 0.9 0.1 3.7 2.3 0.2Output or quantity of wheat in t/ha 3.44 1.00 0.13 3.11 3 . 9 2 0.400
Source: Computed from author’s field survey based on 2004 crop year.
On average, small-scale farmers cultivated about 3.2ha of land yielding an average of 3.44t/ha. The average farm size for the large-scale farmers was about 29.5ha (and in the sample a maximum of 546ha) of land yielding average of 3.11t/ha . Although the large-scale farmers had more than double the years of wheat farming experience of small-scale farmers, this did not seem to help them produce higher yields.
Small-scale farmers tended to use more seeds than those recommended by the agricultural officer from the Uasin Gishu district agricultural office and researchers from KARI. Farmers believe that a higher seed rate leads to more wheat and minimal weed rates. Whereas the recommended seed rate is 123.5kg/ha, most farmers used on average between 172.9kg/ha and 222.4kg/ ha depending on whether the seeds were certified. 16.3% of the farmers interviewed used certified seeds only whereas 72.5% used uncertified and 11.3% used both certified and uncertified seeds.
Estimates of empirical model
The descriptive analysis of the data and the cleaning of the data set revealed the data needed to compute an index for measuring capital inputs before estimating the model defined in (3) and (4). Though some farmers owned tractors, most
farmers (both small and large scale) in Uasin Gishu District relied on hired capital equipment this included tractors for ploughing, harrowing and fallowing, planting and spraying; sprayer machines; and combine harvesters. Farmers indicated that there were as many as 27 different types of tractors used. According to expert opinion from experienced farmers in the sample, agricultural officers and researchers from KARI, it was established that it takes an average tractor 2025 minutes to plough or harrow 1ha of an existing farm depending on the terrain and the size of the farm. Though the size of farm may not matter much when it comes to ploughing and harrowing, it is highly significant when spraying and harvesting. A sprayer or combine harvester takes about 15 minutes to work on 1ha in a large farm compared with 20min/ha on a small farm. Using this information, an index of 0.821 for large-scale farmers and 1.145 for small-scale farmers, was computed as capital use per hectare.

Factors InFluencIng technIcal eFFIcIencIes among selected Wheat Farmers In uasIn gIshu dIstrIct, Kenya 15
Technical efficiencies of wheat framers
In order to examine the technical efficiencies of the selected farmers, the stochastic production frontier model was estimated. The maximum likelihood estimates (MLE) of the parameters are presented in Table 3. To separate the stochastic and the pure technical efficiency effects in the model, the study first selected the distributional assumption for uj (Bauer, 1990). Based on the literature on technical efficiency estimation, four distributional assumptions have been proposed: an exponential distribution, i.e.,
(Meeusen and van der Broeck, 1977); a normal distribution truncated at
zero, for example, (Aigner, et al., 1977); a half-normal distribution
truncated at zero, i.e., (Jondrow et al., 1982); and a two-parameter Gamma/normal distribution (Greene, 1980; 1990).
This study assumed that the stochastic errors follow an exponential distribution. Compared with other forms of distributions, the exponential distribution allows for more farmers to operate at higher levels of efficiency. The exponential distribution assumption puts the mode at zero, implying that a high proportion of the farmers being examined is perfectly efficient.
In the process of regression and analysing the results, it was established that the variable measuring the size of farms (acreage under wheat farming measured in hectares) was highly correlated with those variables generated through multiplicative operation that involved number of hectares. As a result, the variable was dropped in the final regression.
Table 3: MLE estimates of stochastic frontier production function for wheat farming
Explanatory variable Parameter Coef. Std. err. Z
Constant b0 5.639* 0.6491 8.690Labour inputs (person days) b1 0.3633* 0.0704 5.160Capital inputs (hours) b2 0.1265** 0.0571 2.250Quantity of fertilizer (kg) b3 0.2743* 0.0668 4.110Quantity of seeds b4 -0.1566 0.1265 -0.120Credit access as a source of finance b5 0.0074 0.0039 1.870Education level b6 0.0740* 0.0245 3.020Certified seed dummy b7 0.2039 0.0526 3.880Variances parameters s2 0.0641 ¡ 0.5806 Log (likelihood) -6.400Technical efficiency 0.8728
The results reveal that use of fertilizer; labour inputs, capital inputs, education levels, and certified seeds are major determinants of the level of output. The findings concur with those by Evenson and Mwabu (1998) that demonstrated positive and significant relationship between fertilizer use and productivity. Access to credit as a source of finance though important was not statistically significant at 5% level.

16 research PaPer 206
The likelihood ratio test that there is no inefficiency was rejected at a 5% level of significance. The estimated value for the variance parameter ã of the frontier function was less than 1 and statistically significant from 0. This implies existence of technical inefficiencies among the wheat farmers and justifies the need to include the technical inefficiency model during the estimation of the empirical model. The mean technical efficiency was computed as 87.2%. These findings indicate that farmers lose close to 13% of the potential output to technical inefficiencies. The magnitude of technical efficiency varies from one farmer to another ranging from 48.9% to 95.1%, with a mean of 86.6% for the large-scale farmers and 71.7% to 94.9% with a mean of 88.2% for the small-scale farmers. The results suggest that the small-scale farmers are slightly more technically efficient than the large-scale farmers. Furthermore, a look at the frequency distribution of the levels of inefficiencies revealed that about 15% of the large-scale farmers experienced inefficiency levels of over 20% compared with only 5% of the small-scale farmers.
Determinants of technical efficiencies
The differences in technical efficiencies observed earlier may be attributed to farmer-specific characteristics. This is particularly true given the high level of mechanization of wheat farming and the finding that the use of farm inputs was almost equal among all the farmers. A farmer’s ability to acquire, manage and handle the farm inputs and implements could influence technical efficiency. To assess the determinant of technical efficiency, the estimation of an inefficiency model was performed simultaneously with that of the stochastic production frontier model and the results are presented in Table 4.
Table 4: Empirical estimates of factors that influence technical inefficienciesExplanatory variable Parameter Coefficient. Std. err. Z
Constant a0 -11.358 2.611 -4.350Age a1 0.0590* 0.020 2.860Extension services dummy a2 -0.2321 0.532 -0.440Education level dummy a3 -0.6484 0.6514 -1.000Credit access as a source of finance dummy a4 -1.2553 0.774 -1.620Equipments ownership dummy a5 2.2233* 0.8180 2.720Mode of marketing a6 0.8778* 0.4108 2.140Part-time farmer a7 1.007 0.5369 1.880Family labour a8 -0.2439 0.1814 -1.340
The main factors that influence the degree of inefficiency are ownership of capital equipment, the mode of marketing adopted, whether the farmer engages in full-time or part-time wheat farming, and, to a lesser extent, access to credit as a source of finance and level of education. Hiring of capital equipment significantly increases the level of technical inefficiencies of farmers and so does the reliance on private marketing of wheat. The age of the farmer and the years of wheat farming experience were strongly correlated and hence the model retained age of the farmer as the explanatory variable. Surprisingly, as the farmers grew older, their inefficiencies increased. This could be because most of the elderly farmers continued to utilize uncertified seeds which they
Factors InFluencIng technIcal eFFIcIencIes among selected Wheat Farmers In uasIn gIshu dIstrIct, Kenya 17
preserved from their best crop. In addition, these farmers had low levels of education, often provided poor supervision and were slow in responding to emergencies such as outbreaks of crop disease. Higher levels of education (12 years and above or secondary and above), though not statistically significant, reduced inefficiency as did access to agricultural extension services. The access credit as a source of finance also reduced inefficiency but was only significant at about 10%.
Summary of the empirical findings
The empirical findings revealed that wheat farmers in Uasin Gishu District experienced significant levels of technical inefficiencies. The mean technical efficiency was computed at 0.872 but this could go to as lower as 0.489 or 0.717 depending on whether the farmer is large- or small-scale respectively. The maximum efficiency level was estimated at 0.951. The small-scale farmers had a higher technical efficiency than the large-scale farmers.
The mean inefficiency was about 13.3% for large-scale farmers and 11.7% for small-scale farmers. This means that close to 13% of the potential output cannot be exploited due to inefficiency of the farmers. The main causes of inefficiency were identified as education level, access to credit, age of the farmer, and ownership of the capital
18 research PaPer 206
equipment. An improvement in higher education levels and access to credit (that is assumed to be utilized in the purchase of farm equipment and high quality seeds) would increase wheat productivity in the district and in the country at large.
5. Conclusion and recommendations
Measurements of technical efficiency have received increasing attention in recent years due to the important role improved efficiency plays in growth of institutions/industries. But what is efficiency and how can we improve it?
Efficiency is the ability to attain outputs with a minimum level of resources. It is therefore related to productivity which is commonly defined as the ratio of outputs to inputs.
In order to manage and improve efficiency, we first need to measure it. Efficiency improvement is a continuous process. Economists usually measure the efficiency of an industry/farm based on the production function, which specifies the relationship between the observed inputs and output. To estimate technical efficiency levels, one defines a production frontier from a specified production function. A production frontier indicates the maximum output that can be produced under different input combinations; the ratio of the unit’s output to the maximum possible output gives a measure of efficiency (range between 0 and 1).
This paper provides an assessment of technical efficiency among selected wheat farmers in Uasin Gishu District. The study analysed the factors that influence such efficiency levels by estimating a stochastic frontier production function. The explanatory variables of the technical inefficiencies were also estimated. The study found that the average farm sizes of the small-scale farmers were close to one-tenth of those cultivated by the large-scale farmers. In addition, it was established that the large-scale farmers had more than double the years of wheat farming experience of small-scale farmers, but this did not seem to help them produce higher yields.
The empirical results predict that technical inefficiency effects were significant in explaining the yield for both small- and large-scale farmers. The mean technical efficiency was estimated at 87.2%. The inefficiency model indicated that all farmers were less efficient in their production and lost to the tune of 13% of their potential output. These losses differ from one farmer to another. The small-scale farmers had a slightly higher technical efficiency than the large-scale farmers. The mean technical efficiency for the small-scale farmers was 0.88 compared with 0.86 for the large-scale farmers.
The main factors that influence the degree of inefficiency are ownership of the capital equipment, the mode of marketing adopted, whether the farmer engages in full-time or part-time wheat farming, access to credit as a source of finance, and, to a lesser extent, the level of education. Contrary to expectations, the age of the farmer, which was meant
18

Factors InFluencIng technIcal eFFIcIencIes among selected Wheat Farmers In uasIn gIshu dIstrIct, Kenya 19
to proxy for experience, seems to increase inefficiency. The study recommends:
• That in order to enhance productivity there is need to emphasize improvement of the socioeconomic characteristics of farmers. Since education levels significantly influenced output, the focus should be on better training for the farmers and on encouraging the use of better farm inputs. This would discourage the farmers’ belief that use of traditionally treated seeds leads to high yields. Training of farmers can be intensified by increased extension services via demonstration farms within the vicinity of most farmers.
• On access to credit as a source of finance, the agricultural finance institutions should focus on provision of credit for purchase of equipment and farm inputs. This can be done through farmers’ cooperatives and other organizations at the local level.
• That the Ministry of Agriculture adopts appropriate measures that will ensure availability of fertilizer at affordable rates to farmers. The study established that farmers indicated that shortages and high costs of fertilizer were a major limitation to their productivity. The Ministry of Agriculture, through the National Cereals and Produce Board, should import and distribute fertilizers to depots within the vicinity of farmers and introduce a price cap on the costs.

20 research PaPer 206
• That the National Cereals and Produce Board be mandated to purchase all the produce of farmers and open up temporary purchase depots within the vicinity of farms.
Notes1. See Wikipedia, the free encyclopedia, for recent trends.
2. Small-scale farmers grow wheat area ranging between 0.2 hectares and 12 hectares (or 29.6
20

Factors InFluencIng technIcal eFFIcIencIes among selected Wheat Farmers In uasIn gIshu dIstrIct, Kenya 21
acres) while the large-scale farmers have over 20 hectares and a few over 1,000 hectares (GoK, 2004)
ReferencesArnade, C. 1998. "Using a Programming Approach to Measure International Agricultural
Efficiency and Productivity". Journal of Agricultural Economics, 49: 6784.Aigner, D.J., C.A.K. Lovell and P. Schmidt. 1977. “Formulation and estimation of stochastic
frontier production function models”. Journal of Econometrics, 6: 2137.Ajibefun, I. A., G..E. Battese and A. Kadar. 1996. Centre for Efficiency and Productivity Analysis.
A Working Paper. Dept. of Econometrics, University of New England. 120.Ajibefun, A.I. and A.E. Aderinola. 2004. “Determinants of technical efficiency and policy
implications in traditional agricultural production: Empirical study of Nigerian food crops farmers”. AERC final report.
Battese, G.E. and T.J. Coelli. 1988. “Prediction of farm-level technical efficiencies with a generalized frontier production and panel data”. Journal of Econometrics, 38: 38799.
Battese, G.E. and T.J. Coelli. 1995. “A model of technical inefficiency effects in a stochastic frontier production function for panel data”. Empirical Economics, 20: 32532.
Battese E.G. and A.G. Daramola. 1996. “Investigation of factors influencing the technical efficiencies of smallholder croppers in Nigeria”. CEPA Working Paper 10/96. University of New England, Armidale, Austrialia.
Bauer, P. 1990. “Recent developments in the econometric estimation of frontiers”. Journal of Econometrics, 46(12): 3956.
Caves, D.W., L.R. Christensen and W.E. Diewert. 1982a. Multilateral comparisons of outputs, input and productivity using superlative index numbers. Economic Journal, 92: 7386.
Caves, D.W., L.R. Christensen and W.E. Diewert. 1982b. “The economic theory of index numbers and the measurement of input, output and productivity”. Econometrica, 50(6): 13931414.
Charnes, A., W.W. Cooper and E. Rhodes. 1978. “Measuring the efficiency of decision making units”. European Journal of Operational Research, 2: 42944.
Chirwa, E.W. 2003. “Sources of technical efficiency among smallholder maize farmers in southern Malawi”. Draft final report presented at the biannual research workshop of AERC, Nairobi, December 2003.
Coelli T.J. and D.S.P. Rao. 2003. “Total factor productivity growth in agriculture: A Malmquist index analysis of 93 countries, 19802000”. CEPA Working Paper Series WP022003. School of Economics, University of Queensland, Australia.
Evenson, R.E. and G. Mwabu. 1998. “The effects of agricultural extension on farm yields in Kenya”. Center Discussion Paper No. 708. Economic Growth Center, Yale University.
Färe, R., S. Grosskopf, M. Norris and Z. Zhang. 1994. “Productivity growth, technical progress and efficiency changes in industrialized countries”. American Economic Review, 84: 6683.
Farrell, M.J. 1957. “The measurement of productive efficiency”. Journal of Royal Statistical
21

22 research PaPer 206
Society, 120(3): 25381.Fulginiti, L.E. and R.K. Perrin. 1997. “LDC agriculture: Nonparametric Malmquist productivity
indexes”. Journal of Development Economics, 53: 37390.Fulginiti, L.E. and R.K. Perrin. 1998. “Agricultural productivity in developing countries”. Journal
of Agricultural Economics, 19: 4551.GoK. 2003. The Economic Recovery Strategy for Wealth and Employment Creation (ERS).
Government of Kenya. Nairobi: Government Printer. Gitu, K.W. and J.M. Nzuma. 2003. Data Compendium for Kenya’s Agricultural Sector. Kenya
Institute of Public Policy Research and Analysis. Special Report. Nairobi, Kenya. GoK. 2003. Annual report 2003. Crop Division, Ministry of Agriculture, Government of
Kenya GoK 2004. Statistical Abstracts, Government Printer, Nairobi, Kenya. GoK. 2005. The Strategy for the Revitalization of Agriculture (SRA) in Kenya. Ministry of
Agriculture, Government of Kenya. Nairobi: Government Printer. GoK. 1995. Economic Survey. Government of Kenya. Nairobi: Government Printer.GoK.1998. Economic Survey. Government of Kenya. Nairobi: Government Printer.GoK.2001. Economic Survey. Government of Kenya. Nairobi: Government Printer.GoK.2004. Economic Survey. Government of Kenya. Nairobi: Government Printer.Greene, W.H. 1980. “Maximum likelihood estimation of econometric frontier functions”. Journal
of Econometrics, 13: 2756.Greene, W. 1990. “A gamma distributed stochastic frontier model”. Journal of Econometrics,
46: 14164.Grifell-Tatjé, E. and C.A.K. Lovell. 1995. “A note on the Malmquist productivity index”.
Economics Letters, 47: 16975.Heshmati, A. and Y. Mulugeta. 1996. “Technical efficiency of the Ugandan matoke farms”.
Applied Economic Letters, 3: 49194.Huang, C.J. and J.T. Liu. 1994. “Estimation of a non-stochastic frontier production function”.
Journal of Productivity Analysis, 4: 17180. Jondrow, J., C.A.K. Lovell, I.S. Materov and P. Schmidt. 1982. “On the estimation of technical
inefficiency in stochastic frontier production function model”. Journal of Econometrics, 19: 23338
Meeusen, W. and J. van den Broeck. 1977. “Efficiency estimation from Cobb-Douglas production function with composed error”. International Economic Review, 18: 43544.
Nchare, A. 2005. “Analysis of factors affecting technical efficiency of Arabica coffee producers in Cameroon”. AERC final report 2005.
Nin, A., C. Arndt and P.V. Preckel. 2003. “Is agricultural productivity in developing countries really shrinking? New evidence using a modified nonparametric approach”. Journal of Development Economics, 71: 395415.
Nyangito, H., M.M. Ikiara and E. Ronge. 2002. “Performance of Kenya’s wheat industry and prospects for regional trade in wheat products”. KIPPRA Discussion Paper DP/17/2002. Kenya Institute for Public Policy Research and Analysis, Nairobi.
Nyoro, J.K. and T.S. Jayne. 1999. “Trends in regional agricultural productivity in Kenya”. Kenya Agricultural Marketing and Policy Analysis Project. Tegemeo Institute/Michigan State University.
Obwona, M. 2000. “Determinants of technical efficiency differentials amongst small and medium scale farmers in Uganda: A case of tobacco growers”. Final report presented at the AERC biannual workshop, Nairobi, Kenya.
Owuor, J. 1999. “Determinants of agricultural productivity in Kenya”. Kenya Agricultural Marketing and Policy Analysis Project. Tegemeo Institute/Michigan State University
Page, J.M. 1980. “Technical efficiency and economic performance: Some evidence from Ghana”.

Factors InFluencIng technIcal eFFIcIencIes among selected Wheat Farmers In uasIn gIshu dIstrIct, Kenya 23
Oxford Economic Papers, 32: 31939.Parikh, A., F. Ali and M.K. Shah. 1995. “Measurement of economic efficiency in Pakistani
agriculture”. American Journal of Agricultural Economics, 77(8): 67585.Rao, D.S.P. and T.J. Coelli. 1998. Catch-up and convergence in global agricultural productivity,
19801995. CEPA Working Papers No. 4/98. School of Economics, University of Queensland, Australia.
Reifschneider, D. and R. Stevenson. 1991. “Systematic departures from the frontier: A framework for the analysis of farm inefficiency”. International Economic Review, 32, 71523.
Russell, N.P. and T. Young. 1983. “Frontier production functions and the measurement of technical efficiency”. Journal of Agricultural Economics, 34: 13950.
Seyoum, E.T., E.G. Battese and E.M. Fleming. 1998. “Technical efficiency and productivity of maize producers in eastern Ethiopia: A study of farmers within and outside the Sasakawa-Global 2000 project”. Agricultural Economics, 19: 34148.
Trueblood, M.A. and J. Coggins. 2003. “Intercountry agricultural efficiency and productivity: A Malmquist index approach”. Mimeo. The World Bank, Washington, D.C.
Varian, R.H. 1992. Microeconomic Analysis. 3rd edition. New York: W.W Norton and Company.
Wang, H.J. 2002. “Heteroskedasticity and non-monotonic efficiency effects of a stochastic frontier model”. Journal of Productivity Analysis, 18: 24153.
Wang, J., J.G. Cramer and E.J. Wailes. 1996. “Productive efficiency of Chinese agriculture: Evidence from rural household survey data”. Agricultural Economics, 15: 1728.

24 research PaPer 206
Other recent publications in the AERC Research Papers Series:
Determinants of Private Investment Behaviour in Ghana, by Yaw Asante, Research Paper 100.An Analysis of the Implementation and Stability of Nigerian Agricultural Policies, 1970–1993, by P. Kassey
Garba, Research Paper 101.Poverty, Growth and Inequality in Nigeria: A Case Study, by Ben E. Aigbokhan, Research Paper 102.Effect of Export Earnings Fluctuations on Capital Formation, by Godwin Akpokodje, Research Paper
103.Nigeria: Towards an Optimal Macroeconomic Management of Public Capital, by Melvin D. Ayogu,
Research Paper 104.International Stock Market Linkages in South Africa, by K.R. Jefferis, C.C. Okeahalam and T.T. Matome,
Research Paper 105.An Empirical Analysis of Interest Rate Spread in Kenya, by Rose W. Ngugi, Research Paper 106.The Parallel Foreign Exchange Market and Macroeconomic Performance in Ethiopia, by Derrese Degefa,
Reseach Paper 107.Market Structure, Liberalization and Performance in the Malawi Banking Industry, by Ephraim W. Chirwa,
Research Paper 108.Liberalization of the Foreign Exchange Market in Kenya and the Short-Term Capital Flows Problem, by
Njuguna S. Ndung’u, Research Paper 109.External Aid Inflows and the Real Exchange Rate in Ghana, by Harry A. Sackey, Research Paper 110.Formal and Informal Institutions’ Lending Policies and Access to Credit by Small-Scale Enterprises in
Kenya: An Empirical Assessment, by Rosemary Atieno, Research Paper 111.Financial Sector Reform, Macroeconomic Instability and the Order of Economic Liberalization: The Evidence
from Nigeria, by Sylvanus I. Ikhinda and Abayomi A. Alawode, Research Paper 112.The Second Economy and Tax Yield in Malawi, by C. Chipeta, Research Paper 113.Promoting Export Diversification in Cameroon: Toward Which Products? by Lydie T. Bamou, Research
Paper 114.Asset Pricing and Information Efficiency of the Ghana Stock Market, by Kofi A. Osei, Research Paper
115.An Examination of the Sources of Economic Growth in Cameroon, by Aloysius Ajab Amin, Research Paper
116.Trade Liberalization and Technology Acquisition in the Manufacturing Sector: Evidence from Nigeria, by
Ayonrinde Folasade, Research Paper 117.Total Factor Productivity in Kenya: The Links with Trade Policy, by Joseph Onjala, Research Paper 118.Kenya Airways: A Case Study of Privatization, by Samuel Oyieke, Research Paper 119.Determinants of Agricultural Exports: The Case of Cameroon, by Daniel Gbetnkon and Sunday A. Khan,
Research Paper 120.Macroeconomic Modelling and Economic Policy Making: A Survey of Experiences in Africa, by Charles
Soludo, Research Paper 121.Determinants of Regional Poverty in Uganda, by Francis Okurut, Jonathan Odwee and Asaf Adebua,
Research Paper 122.Exchange Rate Policy and the Parallel Market for Foreign Currency in Burundi, by Janvier D. Nkurunziza,
Research Paper 123.Structural Adjustment, Poverty and Economic Growth: An Analysis for Kenya, by Jane Kabubo-Mariara
and Tabitha W. Kiriti, Research Paper 124.Liberalization and Implicit Government Finances in Sierra Leone, by Victor A.B. Davis, Research Paper
125.Productivity, Market Structure and Trade Liberalization in Nigeria, by Adeola F. Adenikinju and Louis N.
Chete, Research Paper 126.Productivity Growth in Nigerian Manufacturing and Its Correlation to Trade Policy Regimes/Indexes
(1962–1985), by Louis N. Chete and Adeola F. Adenikinju, Research Paper 127.Financial Liberalization and Its Implications for the Domestic Financial System: The Case of Uganda, by
Louis A. Kasekende and Michael Atingi-Ego, Research Paper 128.Public Enterprise Reform in Nigeria: Evidence from the Telecommunications Industry, by Afeikhena
Jerome, Research Paper 129.Food Security and Child Nutrition Status among Urban Poor Households in Uganda: Implications for
Poverty Alleviation, by Sarah Nakabo-Sswanyana, Research Paper 130.Tax Reforms and Revenue Mobilization in Kenya, by Moses Kinyanjui Muriithi and Eliud Dismas Moyi,
Research Paper 131.

Factors InFluencIng technIcal eFFIcIencIes among selected Wheat Farmers In uasIn gIshu dIstrIct, Kenya 25
Trade Reform and Efficiency in Cameroon’s Manufacturing Industries, by Ousmanou Njikam, Research Paper 133.
Efficiency of Microenterprises in the Nigerian Economy, by Igbekele A. Ajibefun and Adebiyi G. Daramola, Research Paper 134.
The Impact of Foreign Aid on Public Expenditure: The Case of Kenya, by James Njeru, Research Paper 135.
The Effects of Trade Liberalization on Productive Efficiency: Some Evidence from the Electoral Industry in Cameroon, by Ousmanou Njikam, Research Paper 136.
How Tied Aid Affects the Cost of Aid-Funded Projects in Ghana, by Barfour Osei, Research Paper 137.Exchange Rate Regimes and Inflation in Tanzania, by Longinus Rutasitara, Research Paper 138.Private Returns to Higher Education in Nigeria, by O.B. Okuwa, Research Paper 139.Uganda's Equilibrium Real Exchange Rate and Its Implications for Non-Traditional Export
Performance, by Michael Atingi-Ego and Rachel Kaggwa Sebudde, Research Paper 140.Dynamic Inter-Links among the Exchange Rate, Price Level and Terms of Trade in a Managed Floating
Exchange Rate System: The Case of Ghana, by Vijay K. Bhasin, Research Paper 141.Financial Deepening, Economic Growth and Development: Evidence from Selected Sub-Saharan African
Countries, by John E. Udo Ndebbio, Research Paper 142.The Determinants of Inflation in South Africa: An Econometric Analysis, by Oludele A. Akinboade, Franz
K. Siebrits and Elizabeth W. Niedermeier, Research Paper 143.The Cost of Aid Tying to Ghana, by Barfour Osei, Research Paper 144.A Positive and Normative Analysis of Bank Supervision in Nigeria, by A. Soyibo, S.O. Alashi and M.K.
Ahmad, Research Paper 145.The Determinants of the Real Exchange Rate in Zambia, by Kombe O. Mungule, Research Paper 146.An Evaluation of the Viability of a Single Monetary Zone in ECOWAS, by Olawale Ogunkola, Research
Paper 147.Analysis of the Cost of Infrastructure Failures in a Developing Economy: The Case of Electricity Sector in
Nigeria, by Adeola Adenikinju, Research Paper 148.Corporate Governance Mechanisms and Firm Financial Performance in Nigeria, by Ahmadu Sanda, Aminu
S. Mikailu and Tukur Garba, Research Paper 149.Female Labour Force Participation in Ghana: The Effects of Education, by Harry A. Sackey, Research
Paper 150.The Integration of Nigeria's Rural and Urban Foodstuffs Market, by Rosemary Okoh and P.C. Egbon,
Research Paper 151.Determinants of Technical Efficiency Differentials amongst Small- and Medium-Scale Farmers in Uganda:
A Case of Tobacco Growers, by Marios Obwona, Research Paper 152.Land Conservation in Kenya: The Role of Property Rights, by Jane Kabubo-Mariara, Research Paper
153.Technical Efficiency Differentials in Rice Production Technologies in Nigeria, by Olorunfemi Ogundele,
and Victor Okoruwa, Research Paper 154.The Determinants of Health Care Demand in Uganda: The Case Study of Lira District, Northern Uganda,
by Jonathan Odwee, Francis Okurut and Asaf Adebua, Research Paper 155.Incidence and Determinants of Child Labour in Nigeria: Implications for Poverty Alleviation, by Benjamin
C. Okpukpara and Ngozi Odurukwe, Research Paper 156.Female Participation in the Labour Market: The Case of the Informal Sector in Kenya, by Rosemary
Atieno, Research Paper 157.The Impact of Migrant Remittances on Household Welfare in Ghana, by Peter Quartey, Research Paper
158.Food Production in Zambia: The Impact of Selected Structural Adjustment Policies, by Muacinga C.H.
Simatele, Research Paper 159.Poverty, Inequality and Welfare Effects of Trade Liberalization in Côte d'Ivoire: A Computable General
Equilibrium Model Analysis, by Bédia F. Aka, Research Paper 160.The Distribution of Expenditure Tax Burden before and after Tax Reform: The Case of Cameroon, by Tabi
Atemnkeng Johennes, Atabongawung Joseph Nju and Afeani Azia Theresia, Research Paper 161.Macroeconomic and Distributional Consequences of Energy Supply Shocks in Nigeria, by Adeola F.
Adenikinju and Niyi Falobi, Research Paper 162.

26 research PaPer 206
Extent and Determinants of Child Labour in Uganda, by Tom Mwebaze, Research Paper 167.Oil Wealth and Economic Growth in Oil Exporting African Countries, by Olomola Philip Akanni, Research
Paper 168.Implications of Rainfall Shocks for Household Income and Consumption in Uganda, by John Bosco Asiimwe,
Research Paper 169.Relative Price Variability and Inflation: Evidence from the Agricultural Sector in Nigeria, by Obasi O.
Ukoha, Research Paper 170.A Modelling of Ghana's Inflation: 1960–2003, by Mathew Kofi Ocran, Research Paper 171.The Determinants of School and Attainment in Ghana: A Gender Perspective, by Harry A. Sackey, Research
Paper 172.Private Returns to Education in Ghana: Implications for Investments in Schooling and Migration, by Harry
A. Sackey, Research Paper 173.Oil Wealth and Economic Growth in Oil Exporting African Countries, by Olomola Philip Akanni, Research
Paper 174.Private Investment Behaviour and Trade Policy Practice in Nigeria, by Dipo T. Busari and Phillip C.
Omoke, Research Paper 175.Determinants of the Capital Structure of Ghanaian Firms, by Joshua Abor, Research Paper 176.Privatization and Enterprise Performance in Nigeria: Case Study of Some Privatized Enterprises, by
Afeikhena Jerome, Research Paper 177.Sources of Technical Efficiency among Smallholder Maize Farmers in Southern Malawi, by Ephraim W.
Chirwa, Research Paper 178.Technical Efficiency of Farmers Growing Rice in Northern Ghana, by Seidu Al-hassan, Research Paper
179.Empirical Analysis of Tariff Line-Level Trade, Tariff Revenue and Welfare Effects of Reciprocity under an
Economic Partnership Agreement with the EU: Evidence from Malawi and Tanzania, by Evious K. Zgovu and Josaphat P. Kweka, Research Paper 180.
Effect of Import Liberalization on Tariff Revenue in Ghana, by William Gabriel Brafu-Insaidoo and Camara Kwasi Obeng, Research Paper 181.
Distribution Impact of Public Spending in Cameroon: The Case of Health Care, by Bernadette Dia Kamgnia, Research Paper 182.
Social Welfare and Demand for Health Care in the Urban Areas of Côte d'Ivoire, by Arsène Kouadio, Vincent Monsan and Mamadou Gbongue, Research Paper 183.
Modelling the Inflation Process in Nigeria, by Olusanya E. Olubusoye and Rasheed Oyaromade, Research Paper 184.
Determinants of Expected Poverty Among Rural Households in Nigeria, by O.A. Oni and S.A. Yusuf, Research Paper 185.
Exchange Rate Volatility and Non-Traditional Exports Performance: Zambia, 1965–1999, by Anthony Musonda, Research Paper 186.
Macroeconomic Fluctuations in the West African Monetary Union: A Dynamic Structural Factor Model Approach, by Romain Houssa, Research Paper 187.
Price Reactions to Dividend Announcements on the Nigerian Stock Market, by Olatundun Janet Adelegan, Research Paper 188.
Does Corporate Leadership Matter? Evidence from Nigeria, by Olatundun Janet Adelegan, Research Paper 189.
Determinants of Child Labour and Schooling in the Native Cocoa Households of Côte d'Ivoire, by Guy Blaise Nkamleu, Research Paper 190.
Poverty and the Anthropometric Status of Children: A Comparative Analysis of Rural and Urban Household in Togo, by Kodjo Abalo, Research Paper 191.
Measuring Bank Efficiency in Developing Countries: The Case of the West African Economic and Monetary Union (WAEMU), by Sandrine Kablan, Research Paper 192.
Economic Liberalization, Monetary and Money Demand in Rwanda: 1980–2005, by Musoni J. Rutayisire, Research Paper 193.
Determinants of Employment in the Formal and Informal Sectors of the Urban Areas of Kenya, by Wambui R. Wamuthenya, Research Paper 194.
An Empirical Analysis of the Determinants of Food Imports in Congo, by Léonard Nkouka Safoulanitou

Factors InFluencIng technIcal eFFIcIencIes among selected Wheat Farmers In uasIn gIshu dIstrIct, Kenya 27
and Mathias Marie Adrien Ndinga, Research Paper 195.Determinants of a Firm's Level of Exports: Evidence from Manufacturing Firms in Uganda, by Aggrey
Niringiye and Richard Tuyiragize, Research Paper 196. Supply Response, Risk and Institutional Change in Nigerian Agriculture, by Joshua Olusegun Ajetomobi,
Research Paper 197.Multidimensional Spatial Poverty Comparisons in Cameroon, by Aloysius Mom Njong, Research Paper
198.Earnings and Employment Sector Choice in Kenya, by Robert Kivuti Nyaga, Research Paper 199.Convergence and Economic Integration in Africa: the Case of the Franc Zone Countries, by Latif A.G.
Dramani, Research Paper 200.Analysis of Health Care Utilization in Côte d'Ivoire, by Alimatou Cisse, Research Paper 201.Financial Sector Liberalization and Productivity Change in Uganda's Commercial Banking Sector, by
Kenneth Alpha Egesa, Research Paper 202.Competition and performace in Uganda's Banking System, by Adam Mugume, Research Paper 203.Parallel Market Exchange Premiums and Customs and Excise Revenue in Nigeria, by Olumide S. Ayodele
and Frances N. Obafemi, Research Paper 204.Fiscal Reforms and Income Inequality in Senegal and Burkina Faso: A Comparative Study , by Mbaye
Diene, Research Paper 205.