Factors influencing soil organic matter content in human...
77
1 Factors influencing soil organic matter content in human- disturbed soils Edoardo A.C. Costantini Consiglio per la ricerca e la sperimentazione in agricoltura, CRA-ABP, Firenze, Italy [email protected] European Society for Soil Conservation http://www.essc.sk/
Transcript of Factors influencing soil organic matter content in human...
1
Factors influencing soil organic matter content in human-
disturbed soils
Edoardo A.C. CostantiniConsiglio per la ricerca e la sperimentazione in agricoltura, CRA-ABP, Firenze, Italy
European Society for Soil Conservationhttp://www.essc.sk/
Outline
Why soil organic carbon mattersCauses of variationsEffects of land use changesMonitoring: the Agroscenari projectEffects of soil managementSensor based monitoring to detecteffects of mangement variations.
21/09/2013
3
Soils provide provisioning and regulating ecosystem services relevant to major challenge areas of 1)climate change adaptation and mitigation, 2)food and energy security, 3)water protection, 4)biotechnology for human health,5)ecological sustainability, and 6)slowing of desertification.
Soil and ecosystem services
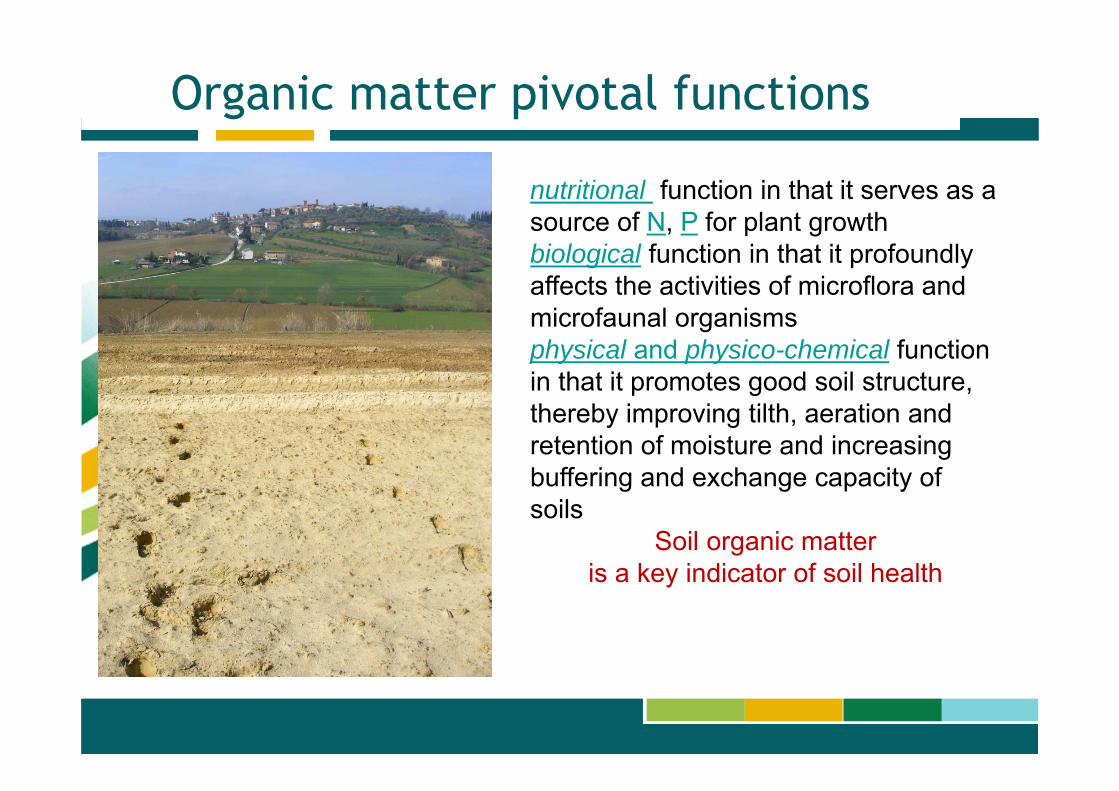
Organic matter pivotal functions
nutritional function in that it serves as a source of N, P for plant growthbiological function in that it profoundly affects the activities of microflora and microfaunal organismsphysical and physico-chemical function in that it promotes good soil structure, thereby improving tilth, aeration and retention of moisture and increasing buffering and exchange capacity of soils
Soil organic matteris a key indicator of soil health
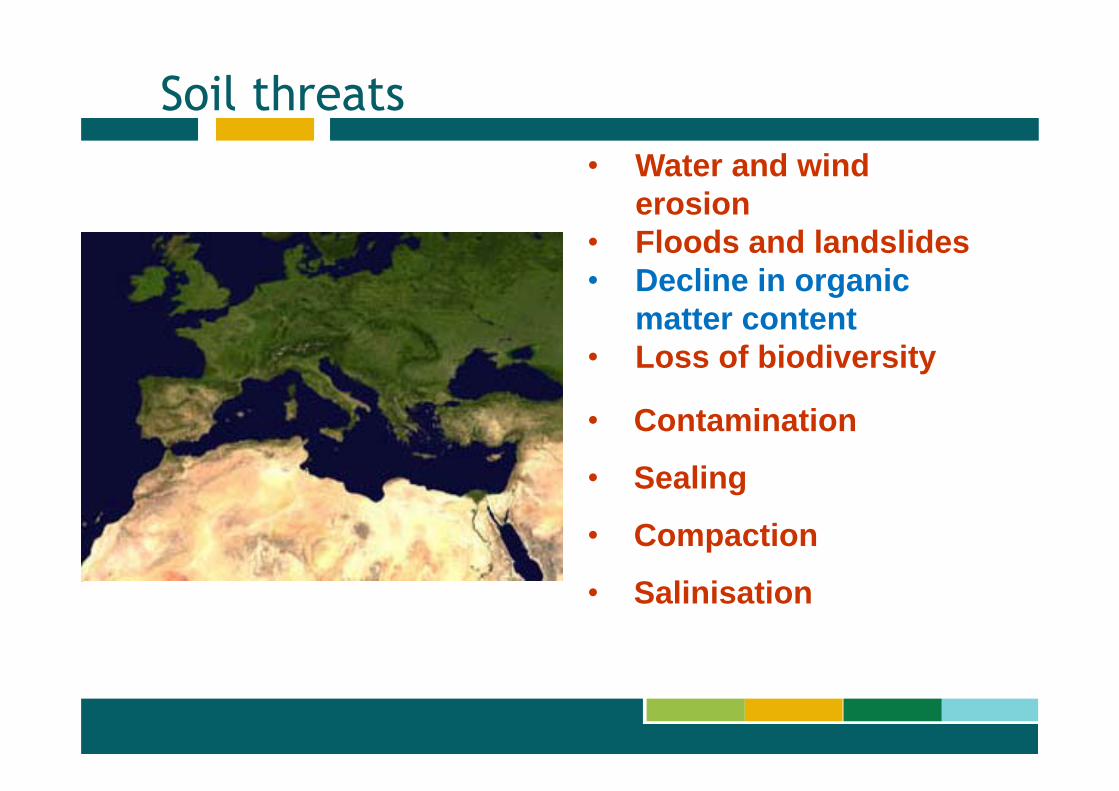
Soil threats
• Contamination
• Sealing
• Compaction
• Salinisation
• Water and wind erosion
• Floods and landslides• Decline in organic
matter content• Loss of biodiversity
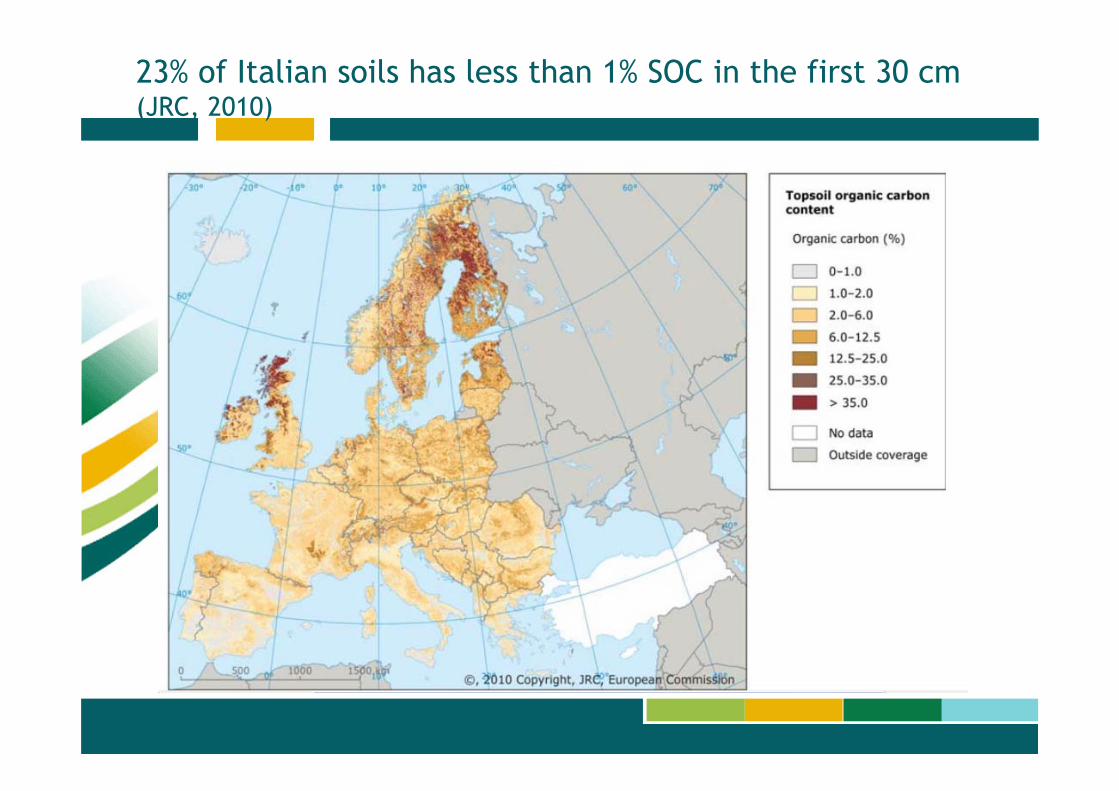
23% of Italian soils has less than 1% SOC in the first 30 cm (JRC, 2010)
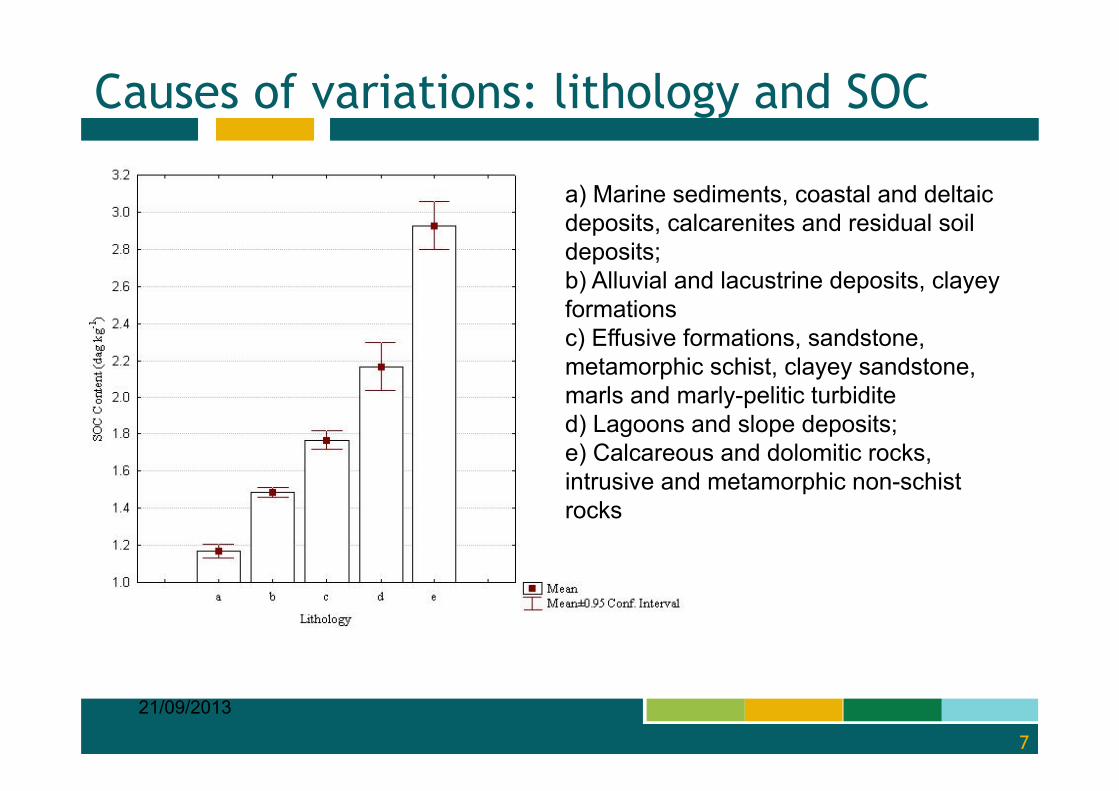
Causes of variations: lithology and SOC
21/09/2013
7
a) Marine sediments, coastal and deltaic deposits, calcarenites and residual soil deposits;b) Alluvial and lacustrine deposits, clayey formationsc) Effusive formations, sandstone, metamorphic schist, clayey sandstone, marls and marly-pelitic turbidited) Lagoons and slope deposits;e) Calcareous and dolomitic rocks, intrusive and metamorphic non-schist rocks
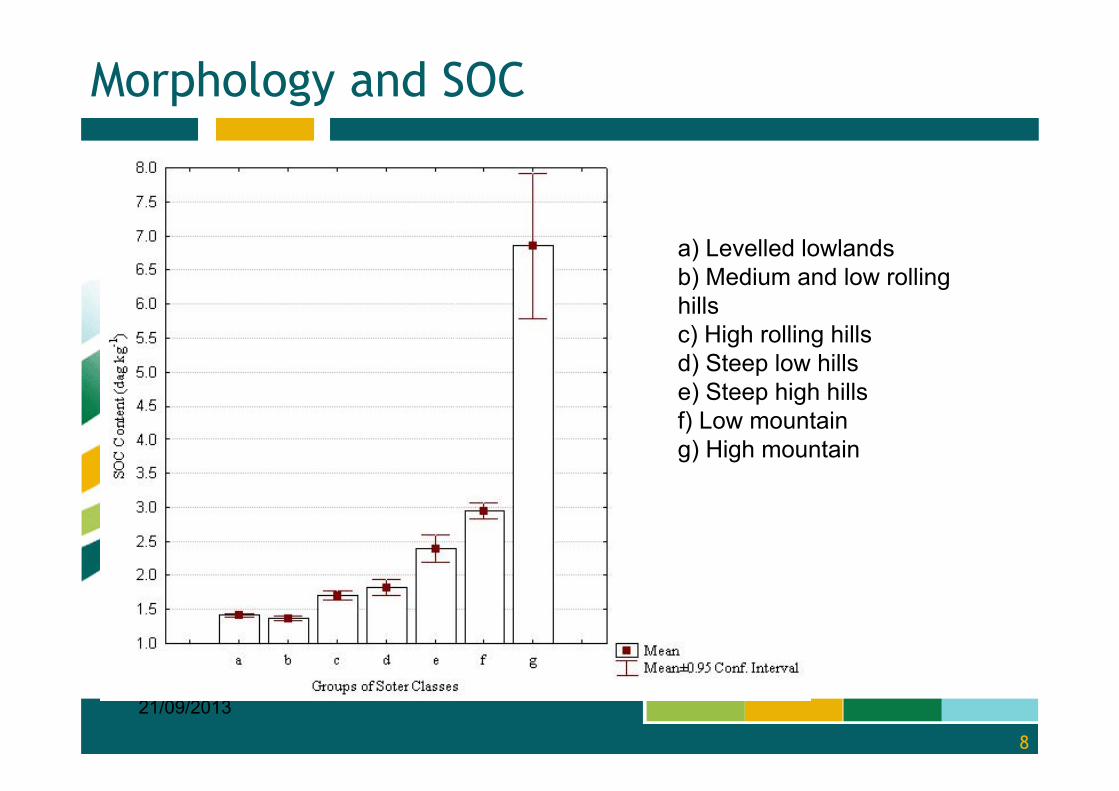
Morphology and SOC
21/09/2013
8
a) Levelled lowlands b) Medium and low rolling hillsc) High rolling hillsd) Steep low hillse) Steep high hillsf) Low mountaing) High mountain
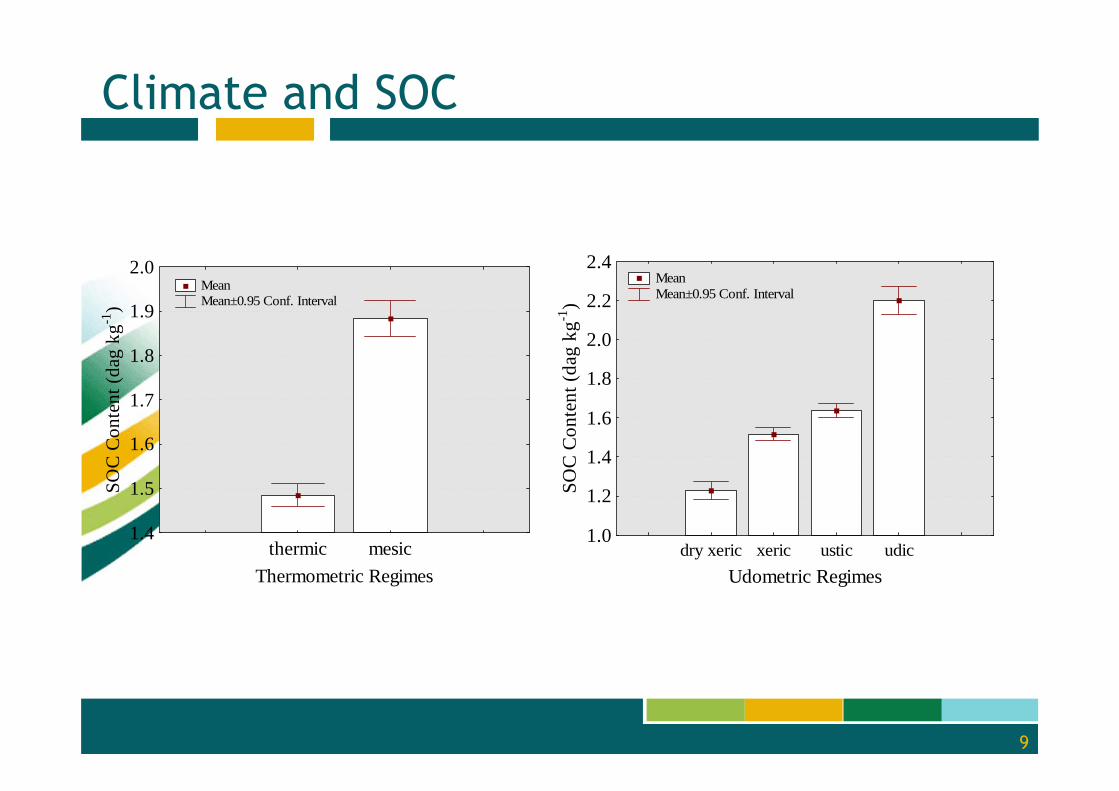
Climate and SOC
9
dry xeric xeric ustic udicUdometric Regimes
1.0
1.2
1.4
1.6
1.8
2.0
2.2
2.4
SOC
Con
tent
(dag
kg-1
)
Mean Mean±0.95 Conf. Interval
thermic mesicThermometric Regimes
1.4
1.5
1.6
1.7
1.8
1.9
2.0
SOC
Con
tent
(dag
kg-1
)
Mean Mean±0.95 Conf. Interval
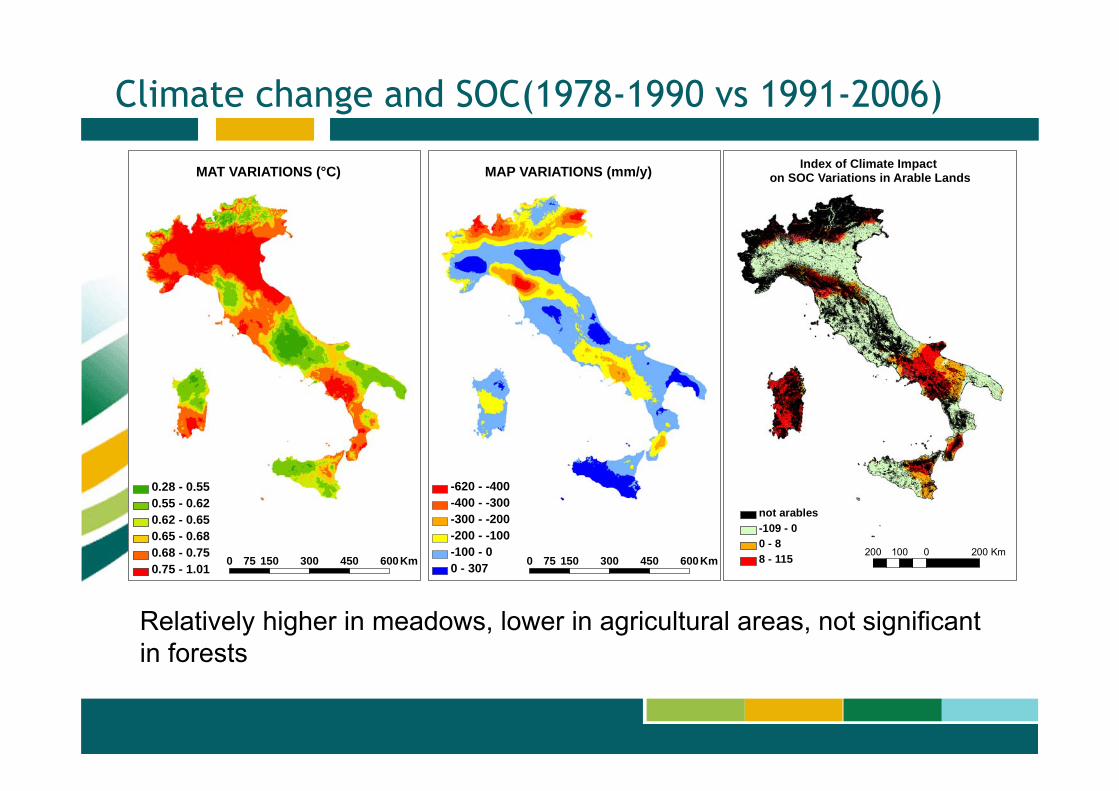
Climate change and SOC(1978-1990 vs 1991-2006)
200 0 200100 Km
not arables -109 - 00 - 88 - 115
Index of Climate Impact on SOC Variations in Arable Lands
0 150 300 450 60075 Km
0.28 - 0.550.55 - 0.620.62 - 0.650.65 - 0.680.68 - 0.750.75 - 1.01
MAT VARIATIONS (°C)
-620 - -400-400 - -300-300 - -200-200 - -100-100 - 00 - 307 0 150 300 450 60075 Km
MAP VARIATIONS (mm/y)
Relatively higher in meadows, lower in agricultural areas, not significant in forests
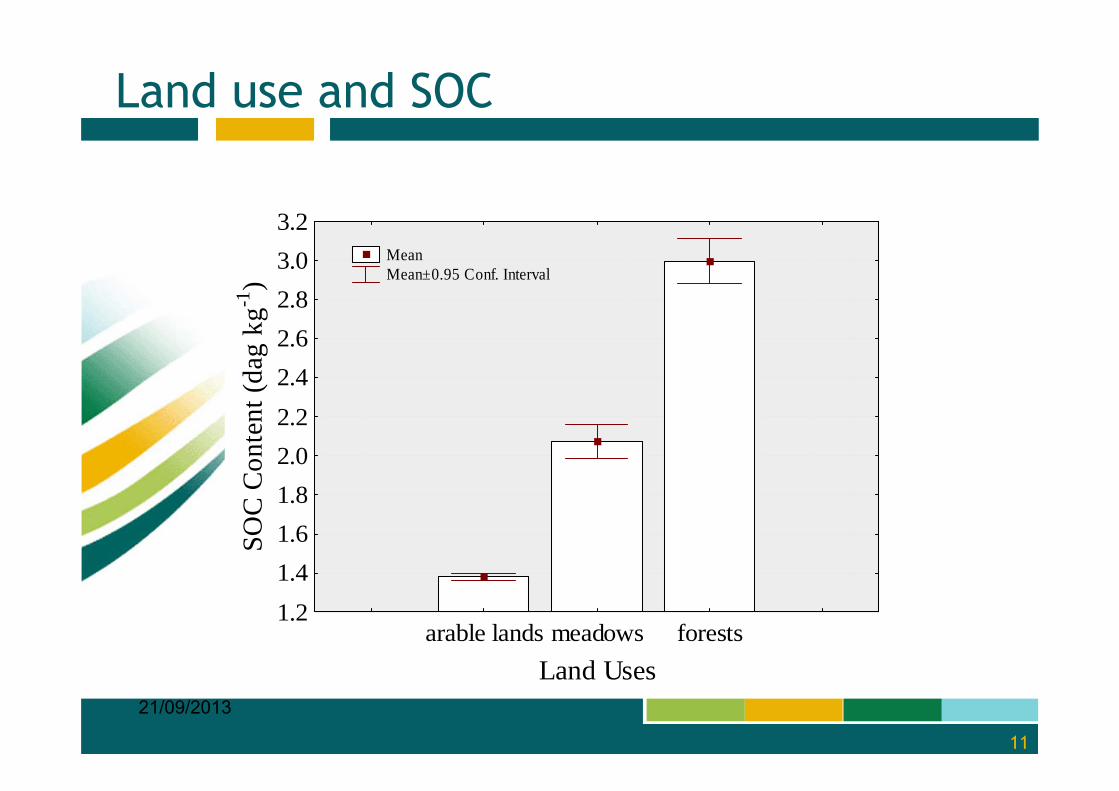
Land use and SOC
arable lands meadows forestsLand Uses
1.21.41.61.82.02.22.42.62.83.03.2
SOC
Con
tent
(dag
kg-1
) Mean Mean±0.95 Conf. Interval
21/09/2013
11
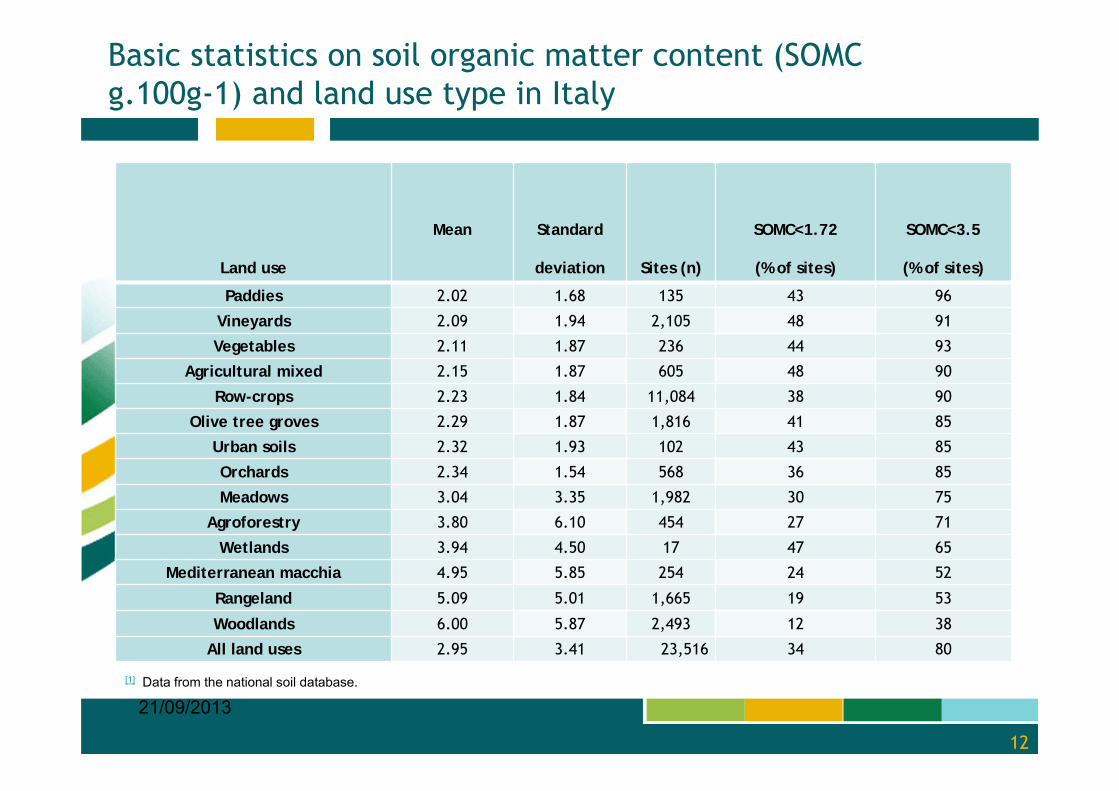
Basic statistics on soil organic matter content (SOMC g.100g-1) and land use type in Italy
Land use
Mean Standard
deviation Sites (n)
SOMC<1.72
(% of sites)
SOMC<3.5
(% of sites)
Paddies 2.02 1.68 135 43 96
Vineyards 2.09 1.94 2,105 48 91
Vegetables 2.11 1.87 236 44 93
Agricultural mixed 2.15 1.87 605 48 90
Row-crops 2.23 1.84 11,084 38 90
Olive tree groves 2.29 1.87 1,816 41 85
Urban soils 2.32 1.93 102 43 85
Orchards 2.34 1.54 568 36 85
Meadows 3.04 3.35 1,982 30 75
Agroforestry 3.80 6.10 454 27 71
Wetlands 3.94 4.50 17 47 65
Mediterranean macchia 4.95 5.85 254 24 52
Rangeland 5.09 5.01 1,665 19 53
Woodlands 6.00 5.87 2,493 12 38
All land uses 2.95 3.41 23,516 34 80
21/09/2013
12
[1] Data from the national soil database.
21/09/2013
13
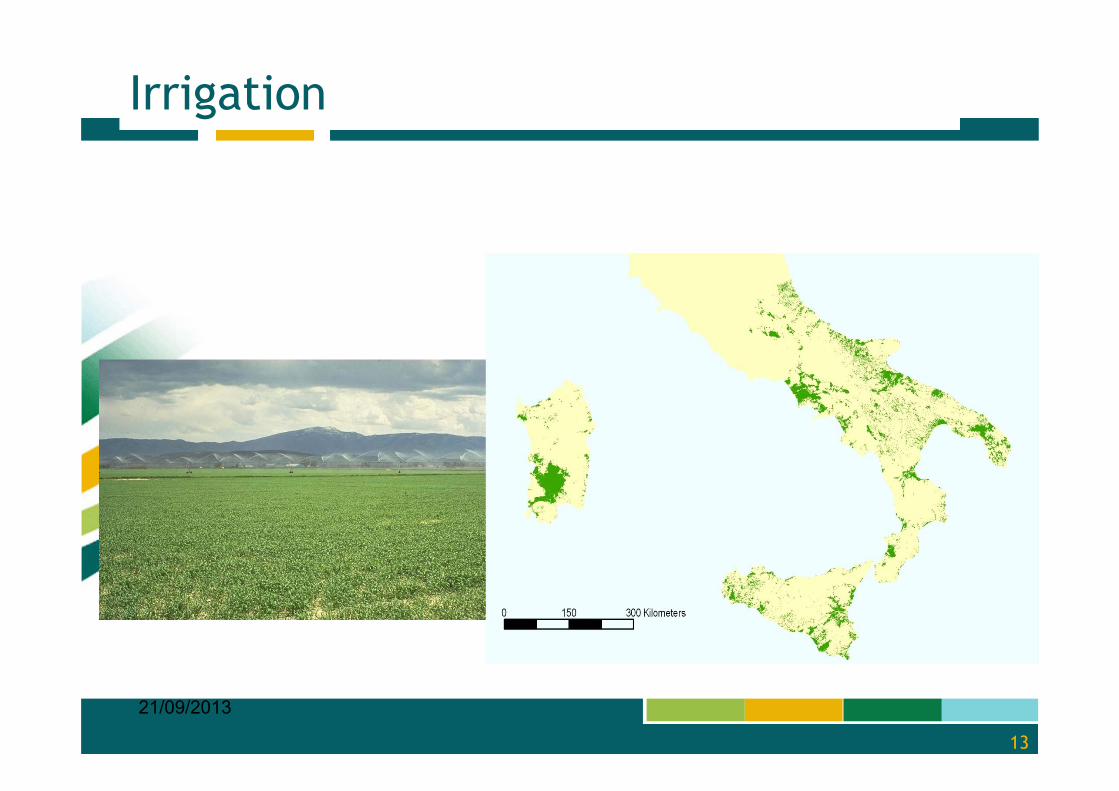
Irrigation
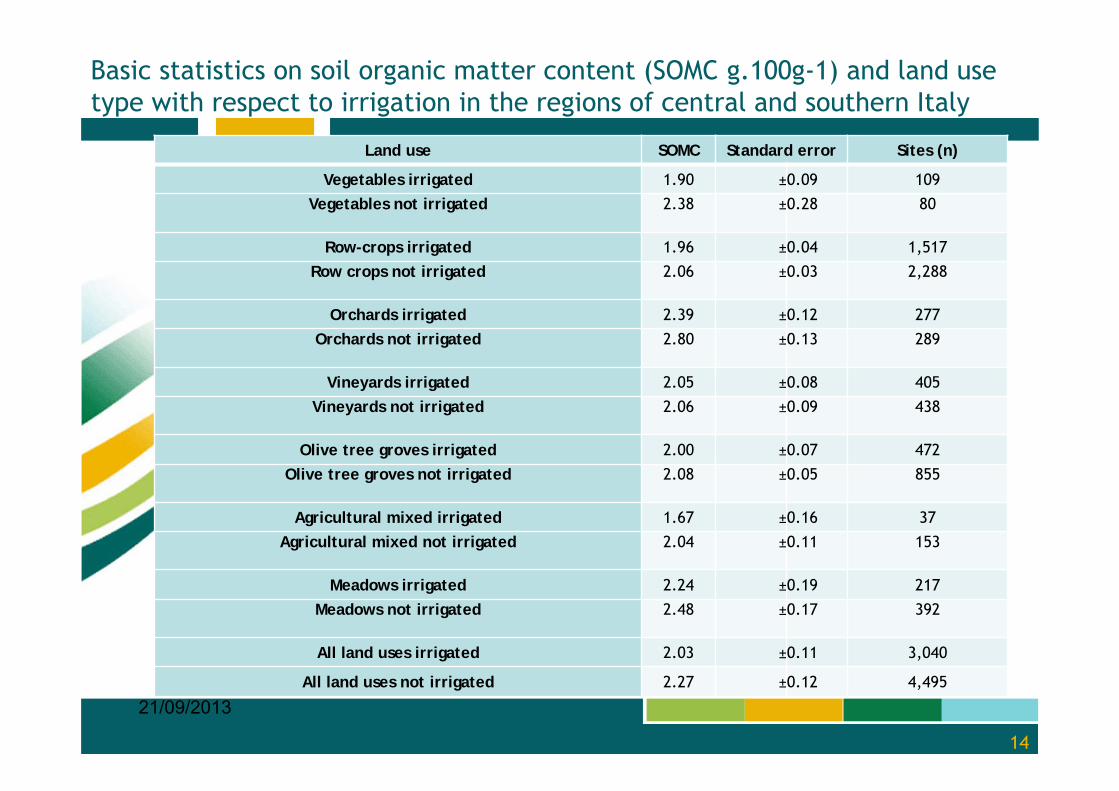
Basic statistics on soil organic matter content (SOMC g.100g-1) and land use type with respect to irrigation in the regions of central and southern Italy
Land use SOMC Standard error Sites (n)
Vegetables irrigated 1.90 ±0.09 109
Vegetables not irrigated 2.38 ±0.28 80
Row-crops irrigated 1.96 ±0.04 1,517
Row crops not irrigated 2.06 ±0.03 2,288
Orchards irrigated 2.39 ±0.12 277
Orchards not irrigated 2.80 ±0.13 289
Vineyards irrigated 2.05 ±0.08 405
Vineyards not irrigated 2.06 ±0.09 438
Olive tree groves irrigated 2.00 ±0.07 472
Olive tree groves not irrigated 2.08 ±0.05 855
Agricultural mixed irrigated 1.67 ±0.16 37
Agricultural mixed not irrigated 2.04 ±0.11 153
Meadows irrigated 2.24 ±0.19 217
Meadows not irrigated 2.48 ±0.17 392
All land uses irrigated 2.03 ±0.11 3,040
All land uses not irrigated 2.27 ±0.12 4,495
21/09/2013
14
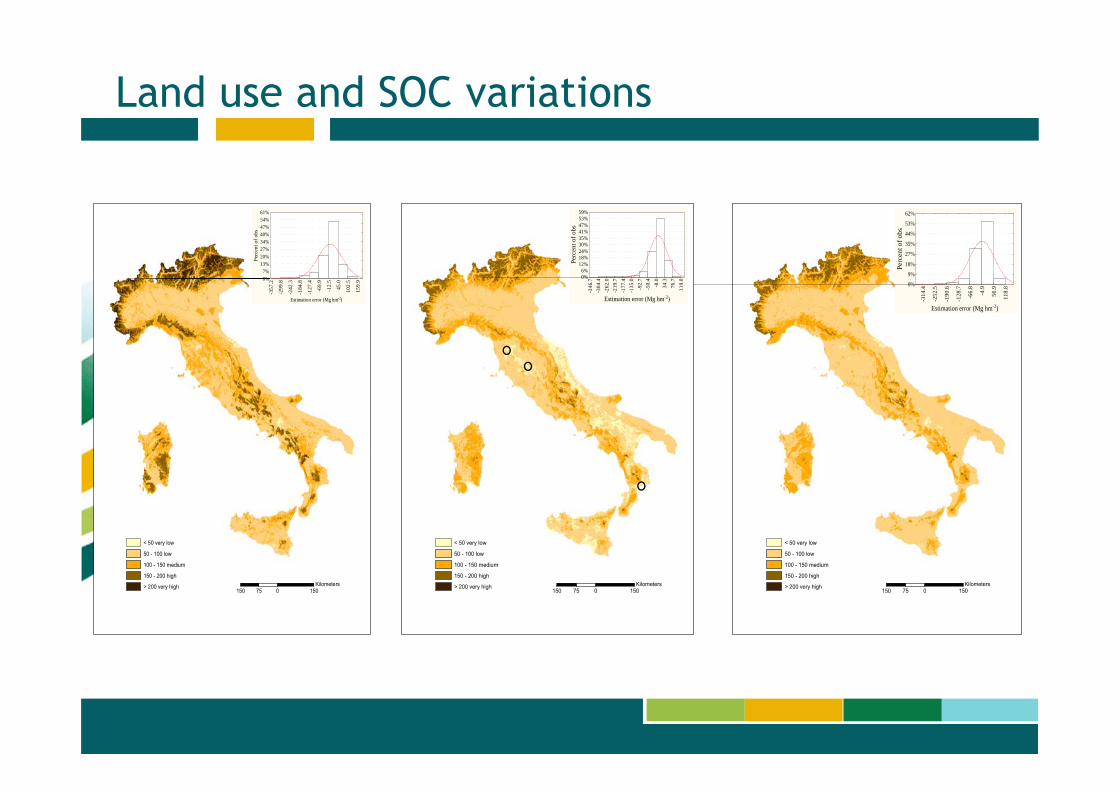
Land use and SOC variations
150 0 15075Kilometers
< 50 very low
50 - 100 low
100 - 150 medium
150 - 200 high
> 200 very high
-357
.2
-299
.8
-242
.3
-184
.8
-127
.4
-69.
9
-12.
5
45.0
102.
5
159.
9
Estimation error (Mg hm-2)
0%7%
13%20%27%34%40%47%54%61%
Perc
ent o
f obs
150 0 15075Kilometers
< 50 very low
50 - 100 low
100 - 150 medium
150 - 200 high
> 200 very high
-314
.4
-252
.5
-190
.6
-128
.7
-66.
8
-4.9
56.9
118.
8
Estimation error (Mg hm-2)
0%
9%
18%
27%
35%
44%
53%
62%
Perc
ent o
f obs
150 0 15075Kilometers
< 50 very low
50 - 100 low
100 - 150 medium
150 - 200 high
> 200 very high-3
46.7
-304
.4-2
62.0
-219
.7-1
77.4
-135
.0-9
2.7
-50.
4-8
.034
.376
.711
9.0
Estimation error (Mg hm-2)
0%6%
12%18%24%30%35%41%47%53%59%
Perc
ent o
f obs
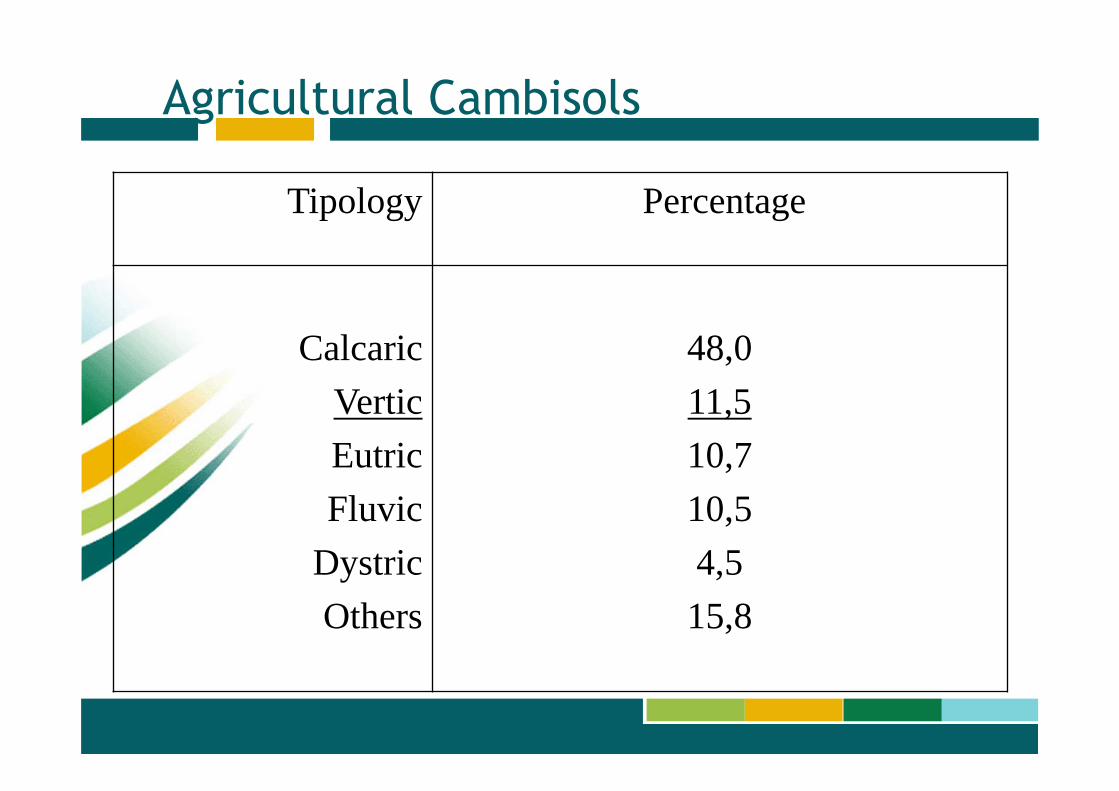
Agricultural Cambisols
Tipology Percentage
CalcaricVerticEutricFluvic
DystricOthers
48,011,510,710,54,5
15,8
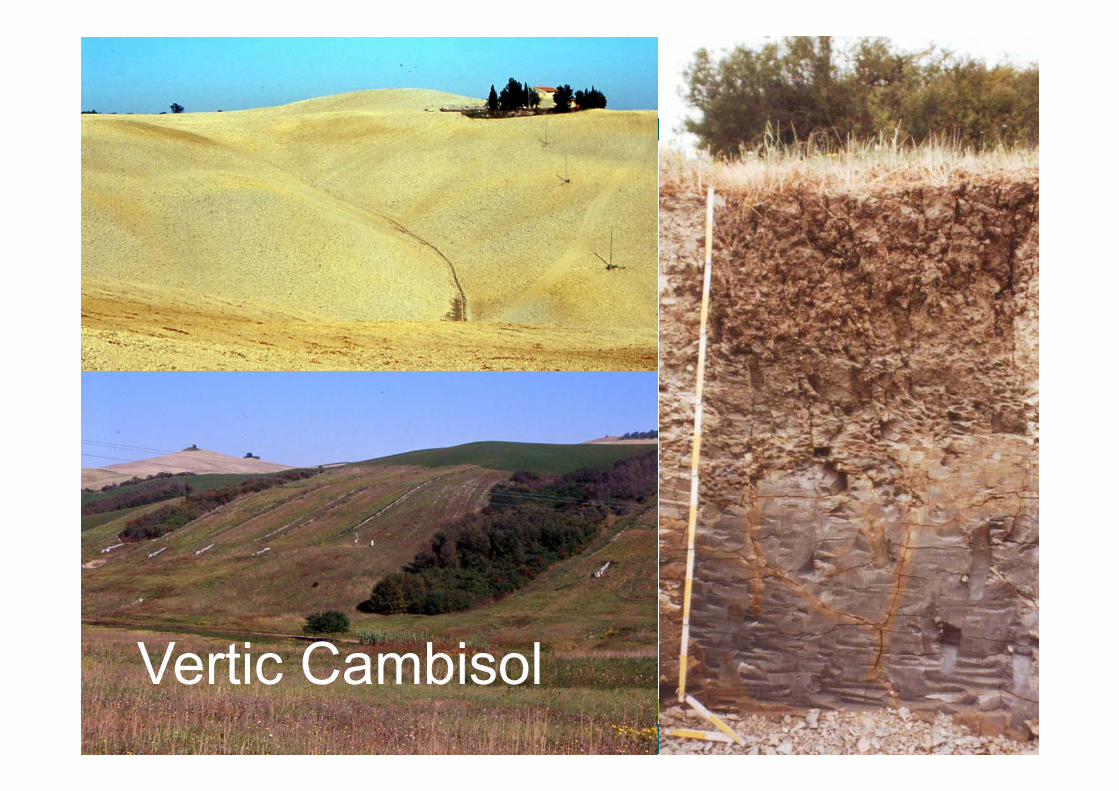
Vertic Cambisol
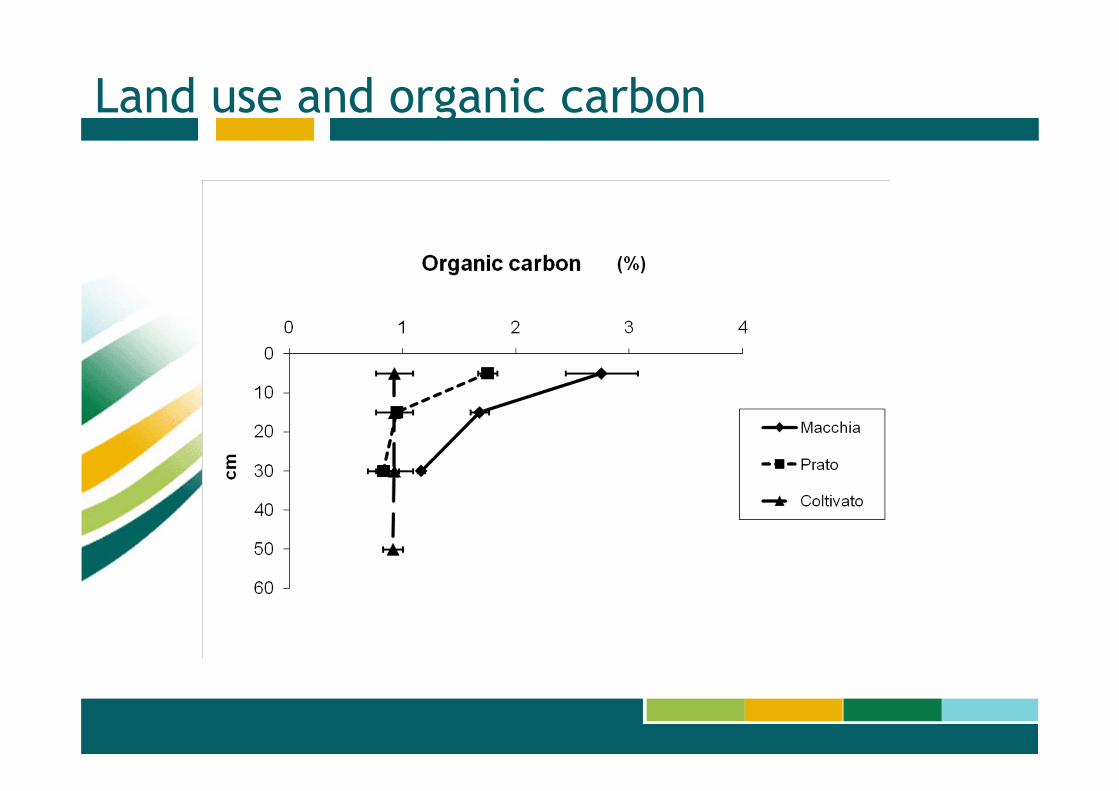
Land use and organic carbon
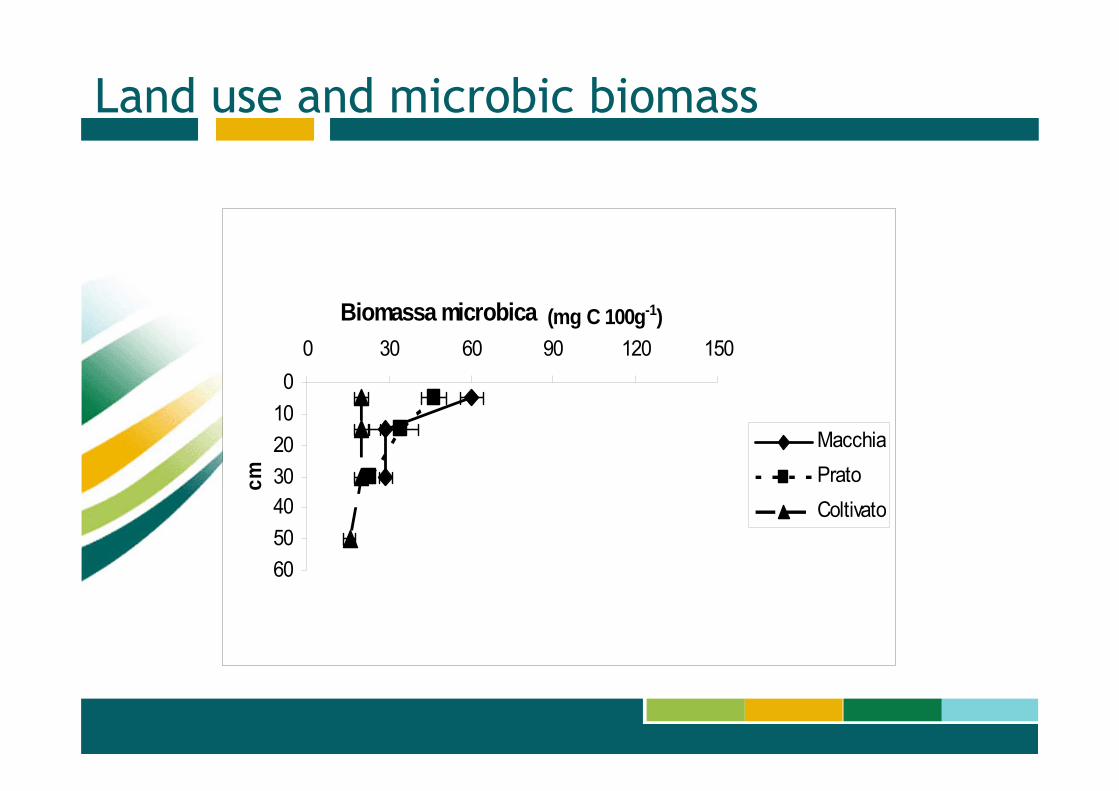
Land use and microbic biomass
Biomassa microbica
0102030405060
0 30 60 90 120 150(mg C 100g-1)
cm
MacchiaPrato Coltivato
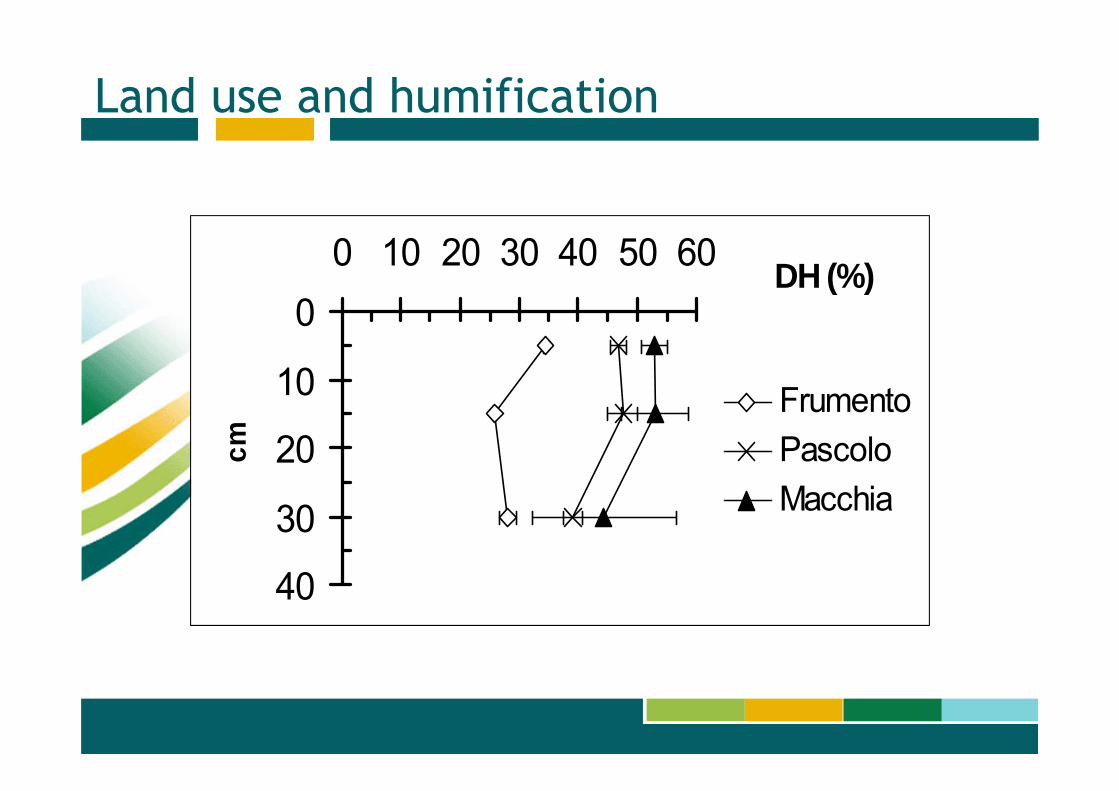
Land use and humification
DH (%)0
10
20
30
40
0 10 20 30 40 50 60cm
FrumentoPascoloMacchia
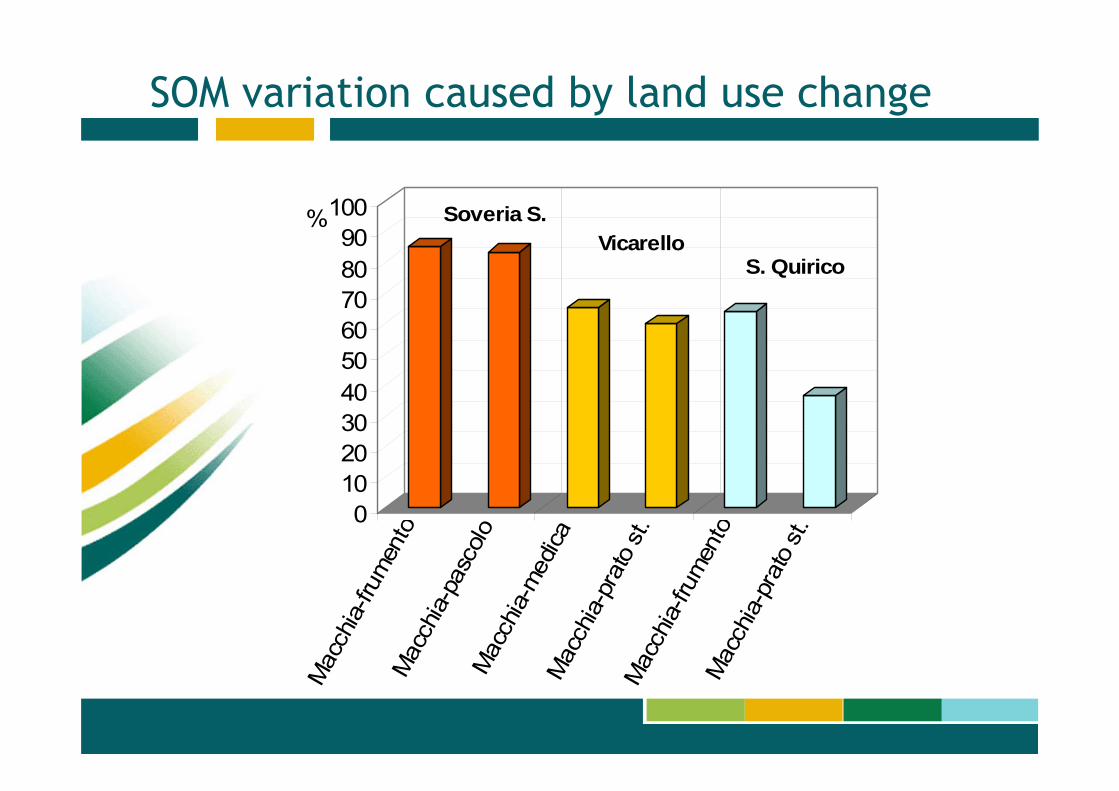
SOM variation caused by land use change
0102030405060708090
100%
Mac
chia
-frum
ento
Mac
chia-
pasc
olo
Mac
chia
-med
icaM
acch
ia-p
rato
st.
Mac
chia
-frum
ento
Mac
chia
-pra
to st
.
Soveria S.Vicarello
S. Quirico
21/09/2013
24
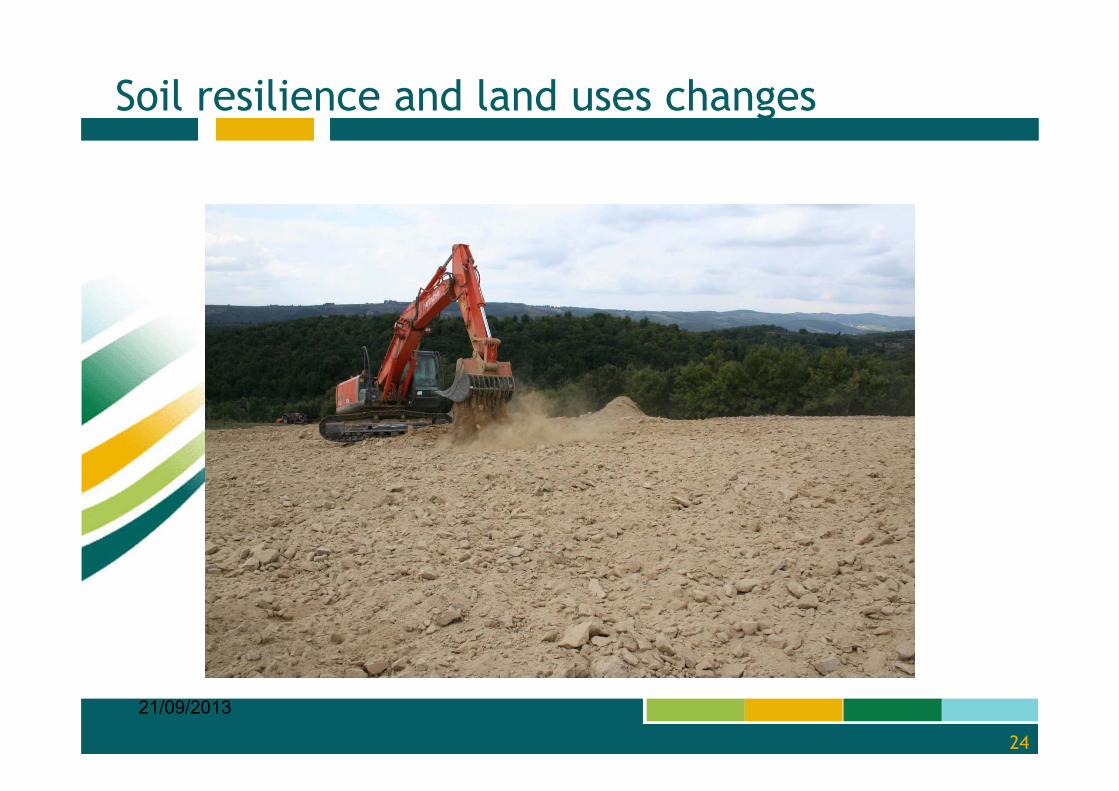
Soil resilience and land uses changes
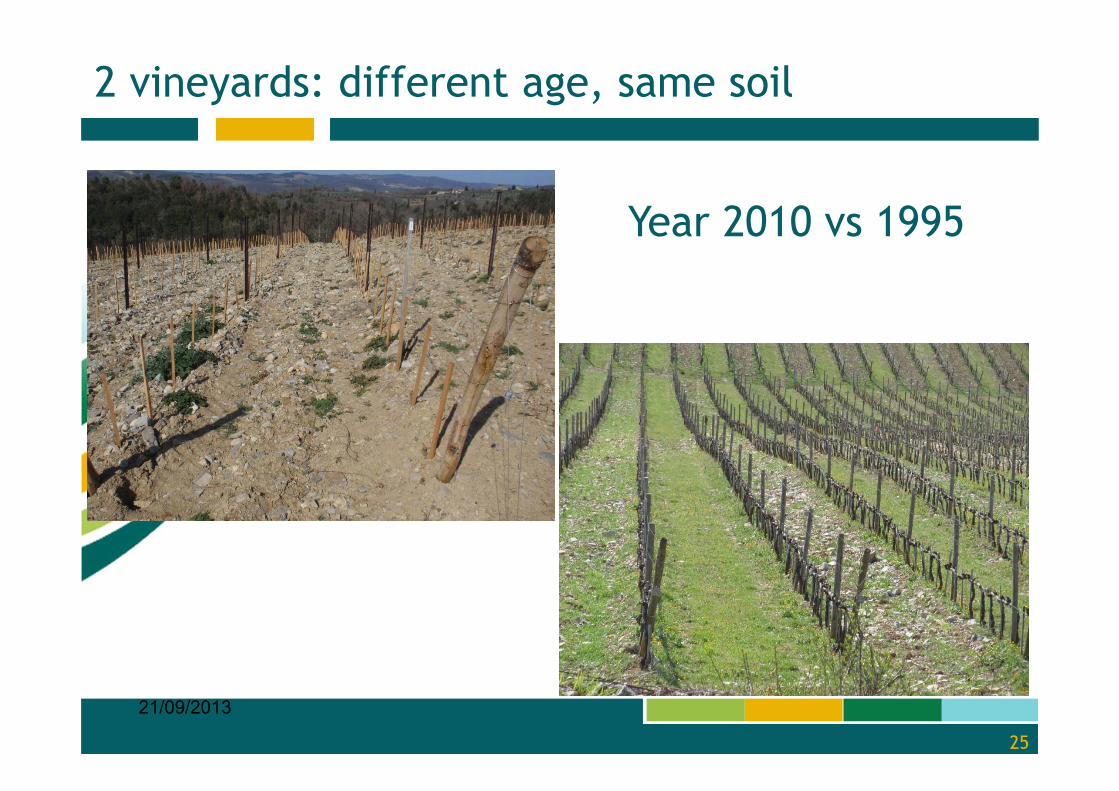
2 vineyards: different age, same soil
21/09/2013
25
Year 2010 vs 1995
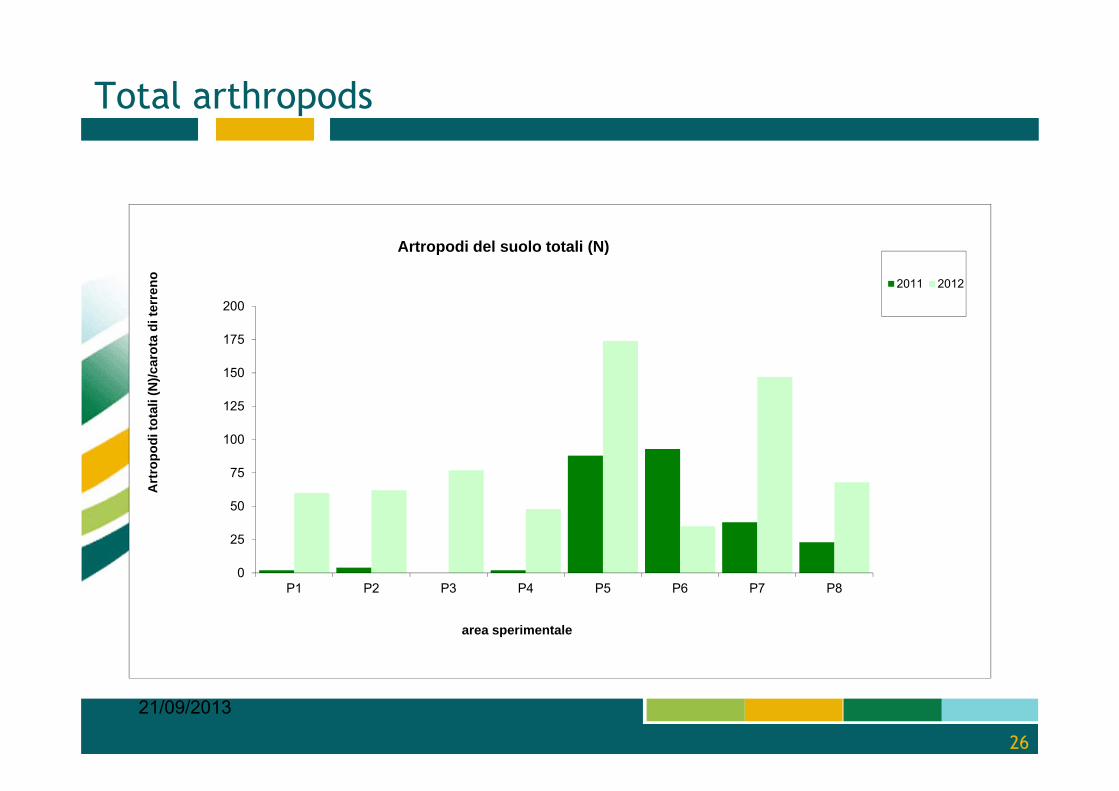
Total arthropods
21/09/2013
26
0
25
50
75
100
125
150
175
200
P1 P2 P3 P4 P5 P6 P7 P8
Art
ropo
di to
tali
(N)/c
arot
a di
terr
eno
area sperimentale
Artropodi del suolo totali (N)
2011 2012
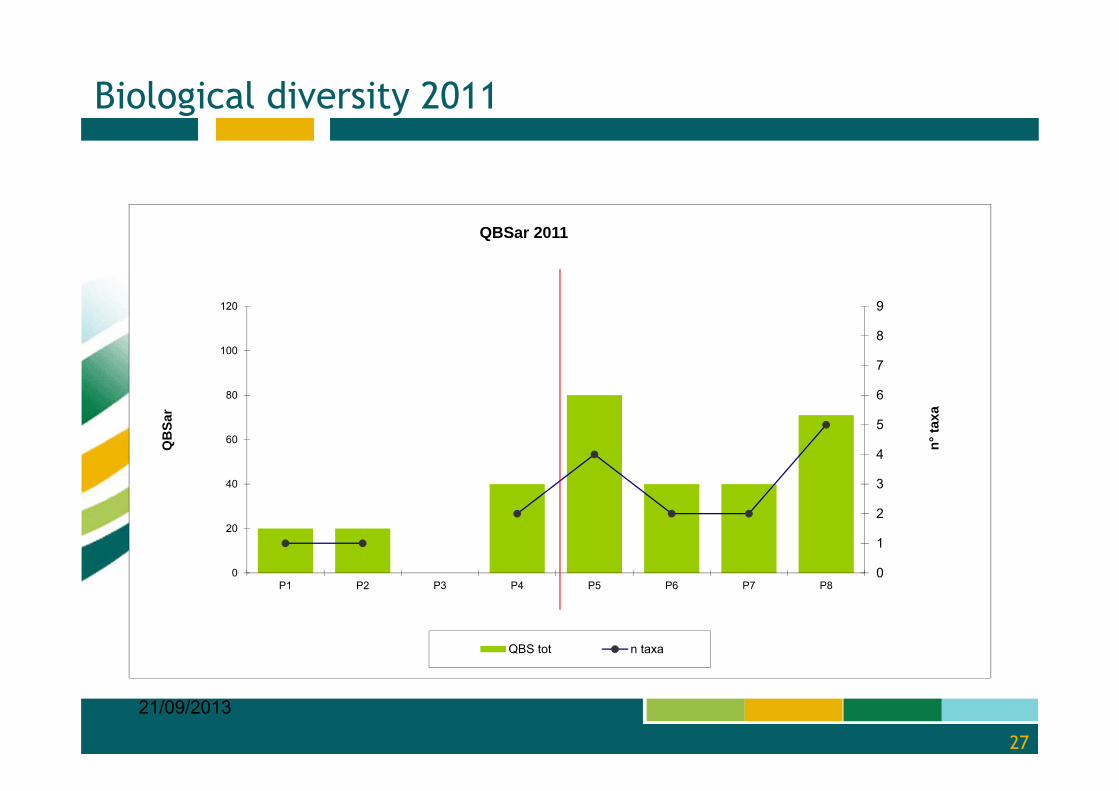
Biological diversity 2011
21/09/2013
27
0
1
2
3
4
5
6
7
8
9
0
20
40
60
80
100
120
P1 P2 P3 P4 P5 P6 P7 P8
n°ta
xa
QB
Sar
QBSar 2011
QBS tot n taxa
21/09/2013
28
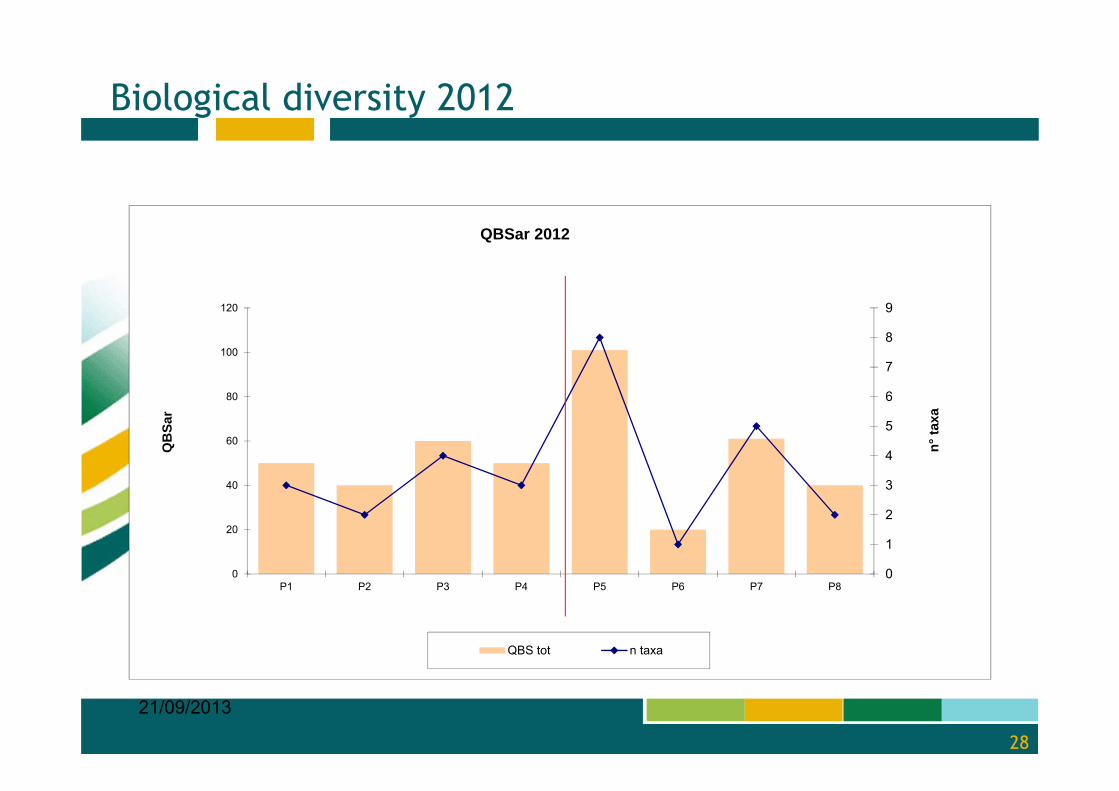
0
1
2
3
4
5
6
7
8
9
0
20
40
60
80
100
120
P1 P2 P3 P4 P5 P6 P7 P8
n°ta
xa
QB
Sar
QBSar 2012
QBS tot n taxa
Biological diversity 2012
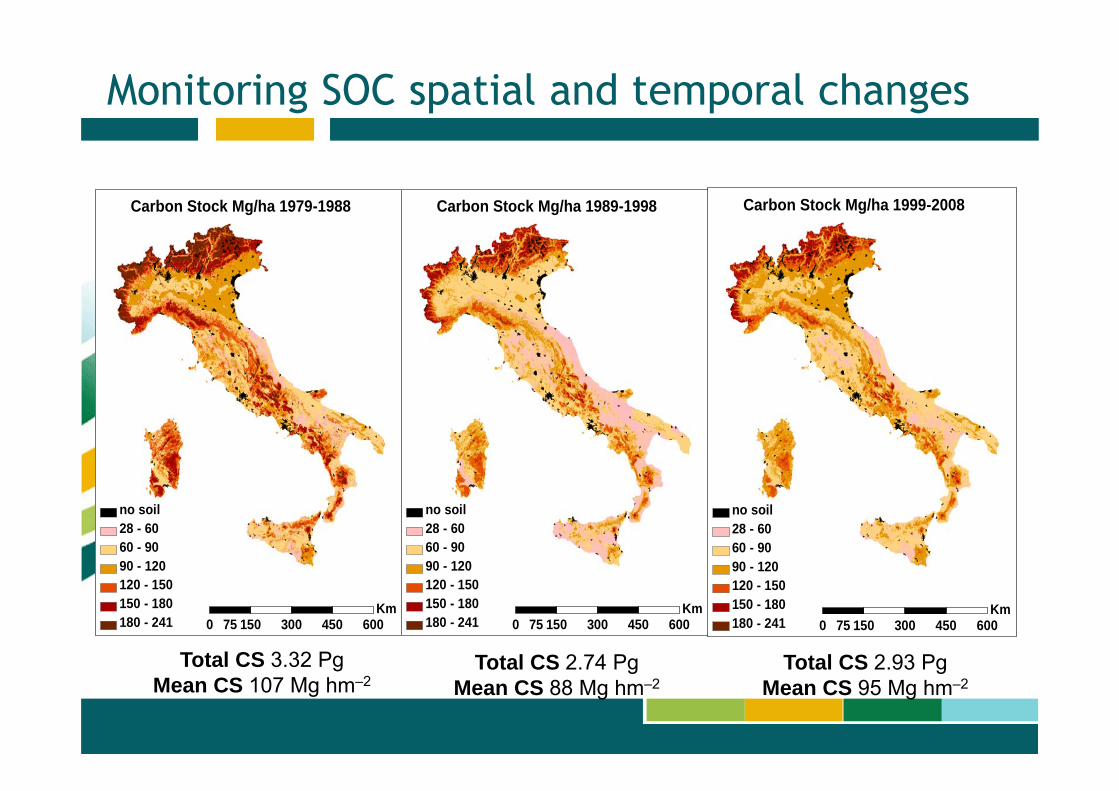
0 150 300 450 60075Km
no soil28 - 6060 - 9090 - 120120 - 150150 - 180180 - 241
Carbon Stock Mg/ha 1979-1988
0 150 300 450 60075Km
no soil28 - 6060 - 9090 - 120120 - 150150 - 180180 - 241
Carbon Stock Mg/ha 1989-1998
0 150 300 450 60075Km
no soil28 - 6060 - 9090 - 120120 - 150150 - 180180 - 241
Carbon Stock Mg/ha 1999-2008
Total CS 3.32 Pg Mean CS 107 Mg hm–2
Total CS 2.74 Pg Mean CS 88 Mg hm–2
Total CS 2.93 Pg Mean CS 95 Mg hm–2
Monitoring SOC spatial and temporal changes
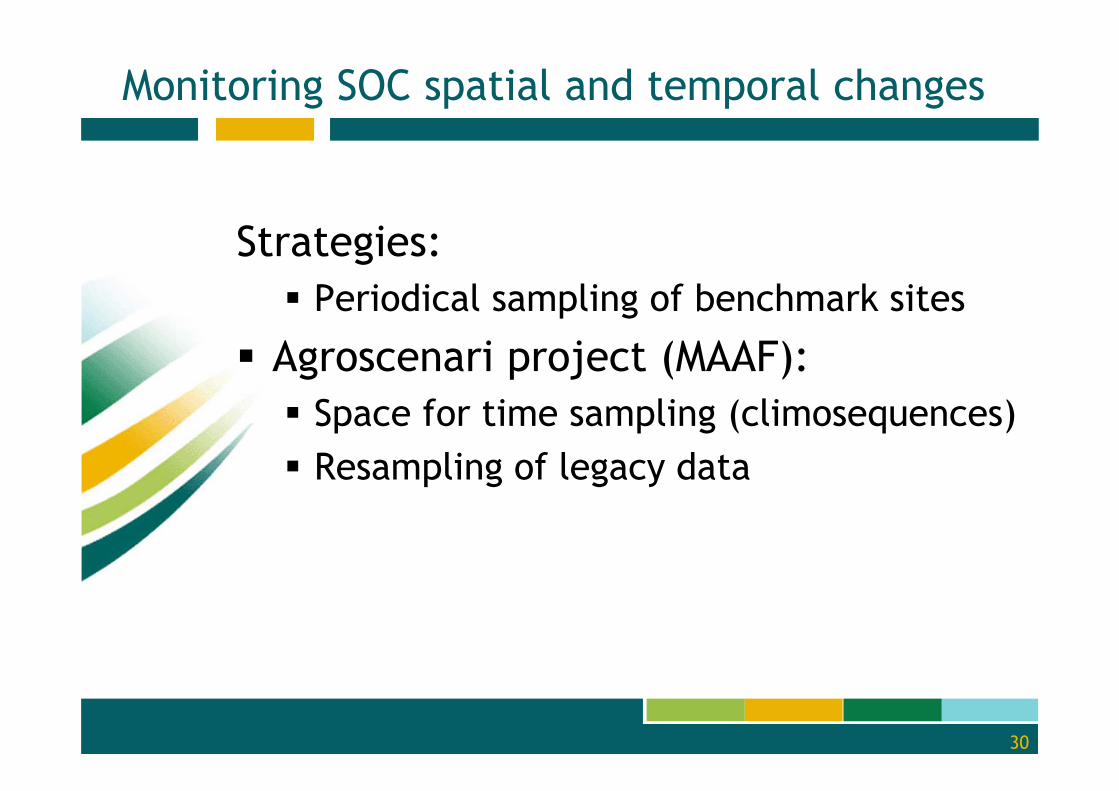
Monitoring SOC spatial and temporal changes
Strategies:Periodical sampling of benchmark sites
Agroscenari project (MAAF): Space for time sampling (climosequences)Resampling of legacy data
30
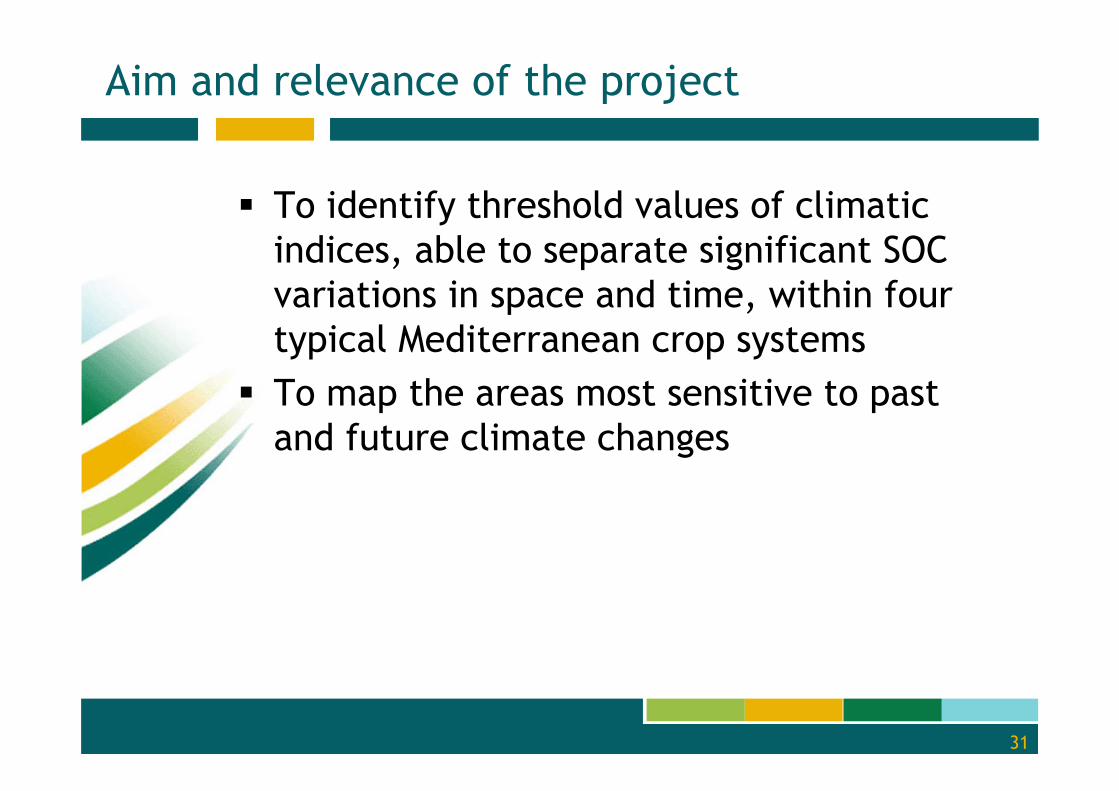
Aim and relevance of the project
To identify threshold values of climatic indices, able to separate significant SOC variations in space and time, within four typical Mediterranean crop systemsTo map the areas most sensitive to past and future climate changes
31
32
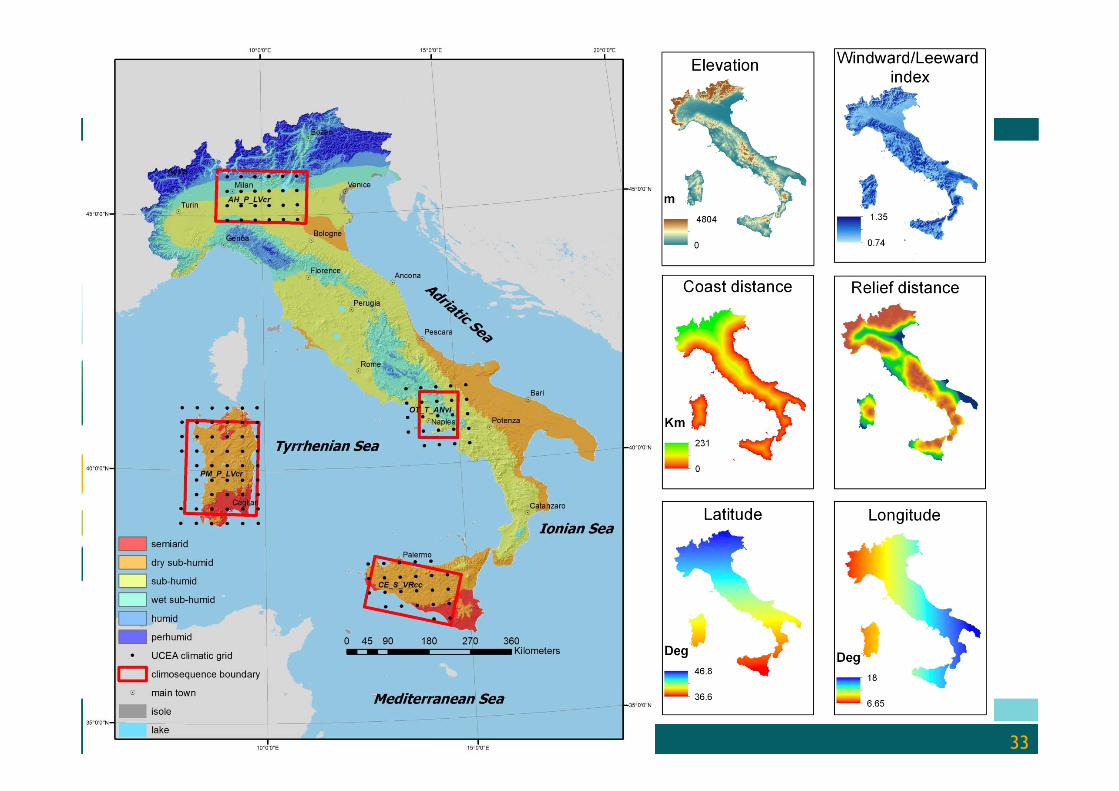
►Climatic parameters from the national grid (30x30 km), ► monthly values from 1961 to 2010, ► downscaling to a 1 km grid by Geographical Weighted Regression using auxiliary variables, i.e., distance from the coast and relieves, elevation, dominant wind direction, (leeward/windward effect), latitude and longitude. ► two reference long-term climates: 1961-1990 (t1) and 1981-2010 (t2)► De Martonne index (IDM) as reference climate indicator
Materials and methods
21/09/2013
33
34
►147 soils sampled along climatic gradients (climosequences) ► 3-4 replications according to local variability►SOC analysed with Springer and Klee (g dag-1)► IDM values of the sites in each climosequenceclustered in 2 groups and SOC of the sites in the 2 clusters submitted to analysis of variance► 69 legacy sites, surveyed in the years 1960-2000, resampled and analysed in 2011. ► Land use permanence checked by remote sensing analysis. Uniform SOC analysis► ∆SOC minimum detectable differences assessment
Materials and methods
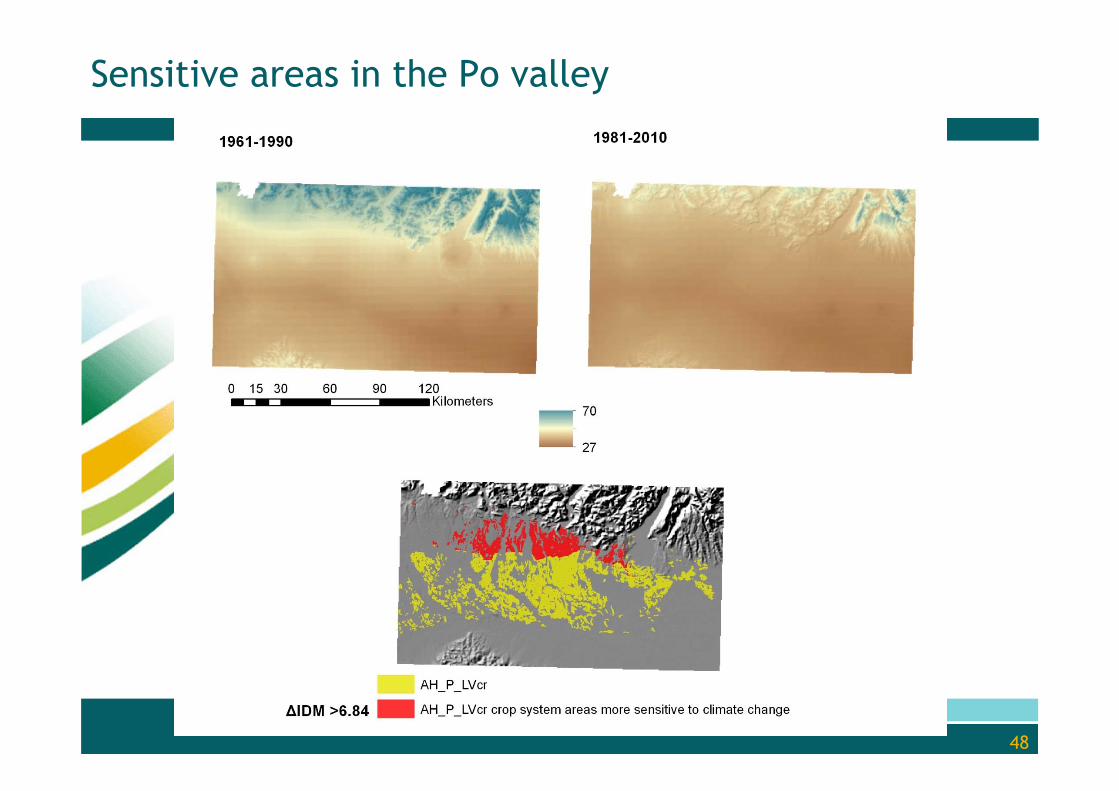
35
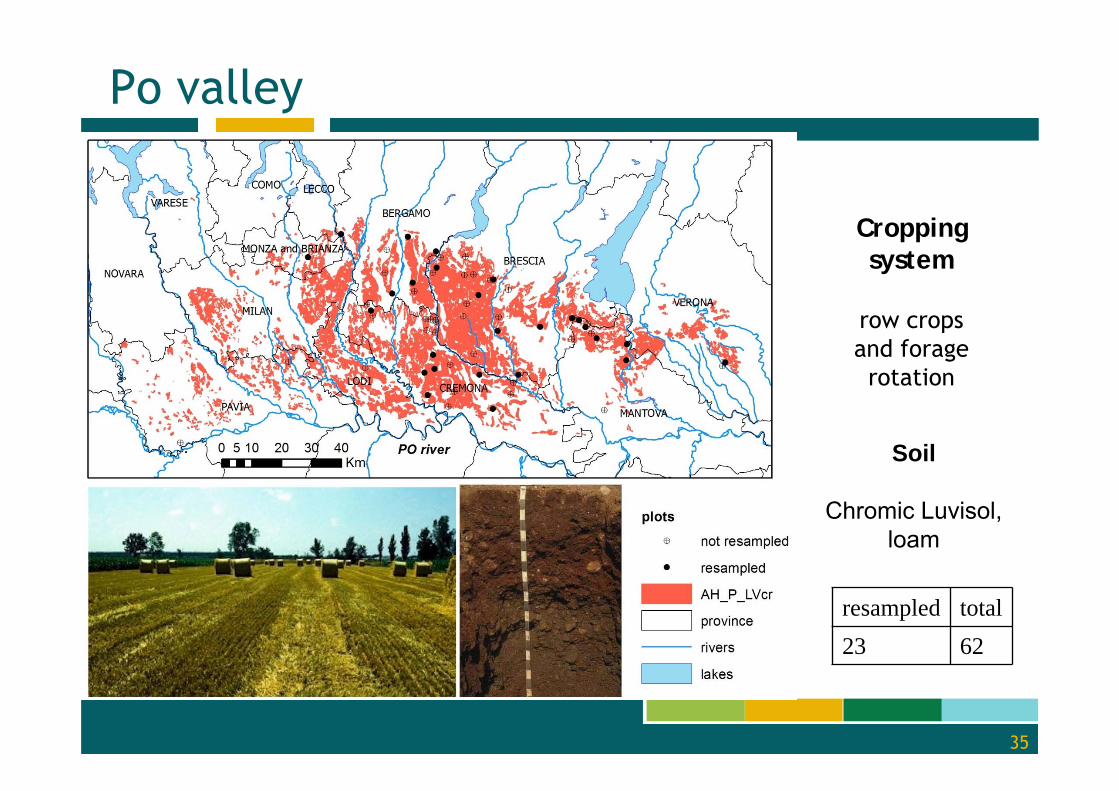
Po valley
resampled total23 62
Soil
Chromic Luvisol, loam
Croppingsystem
row crops and forage rotation
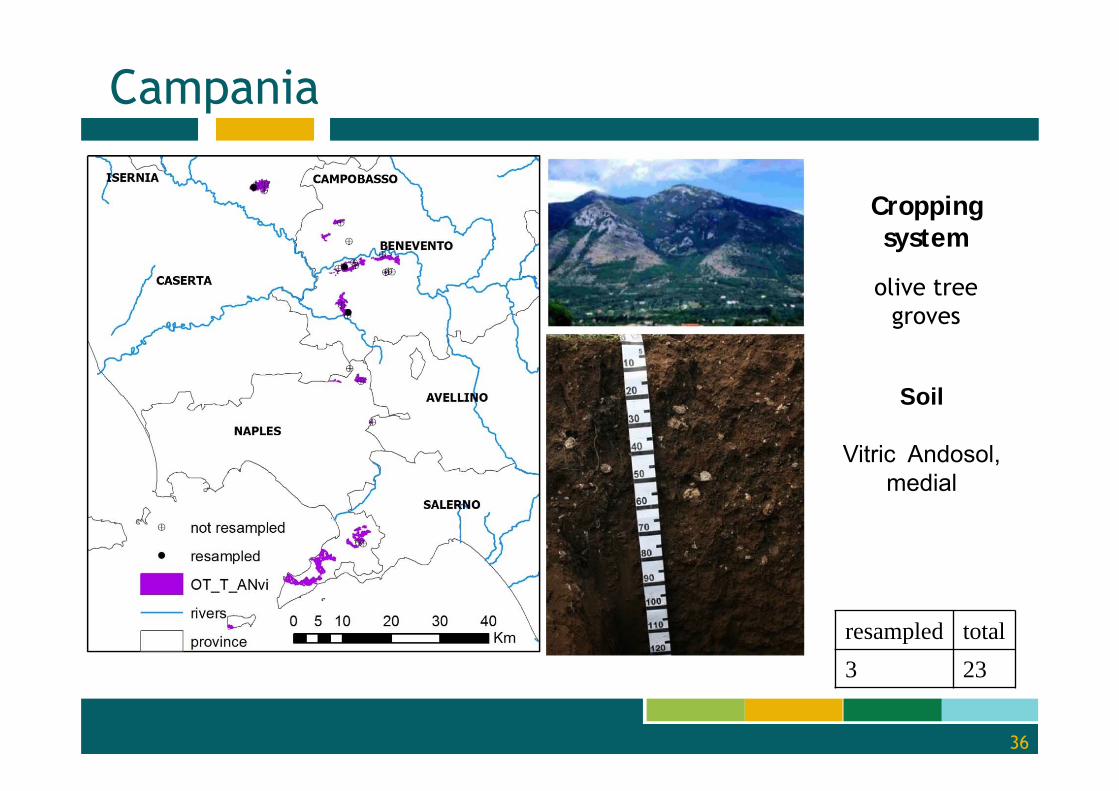
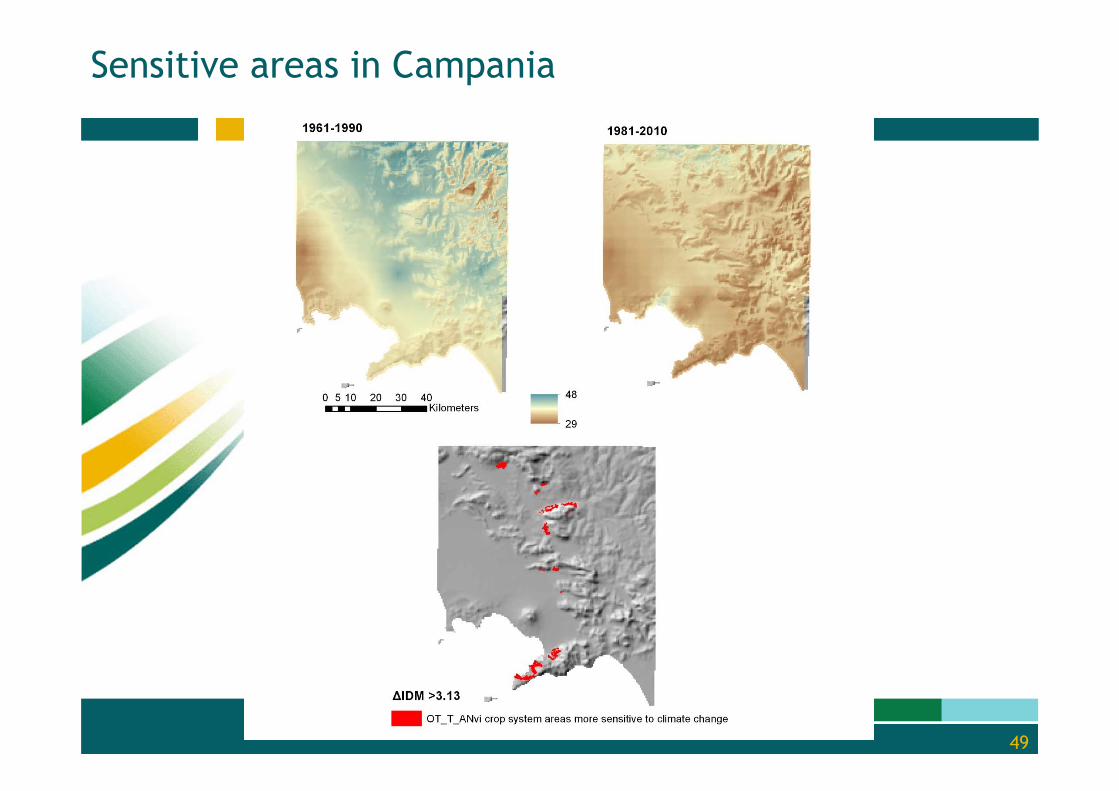
36
resampled total3 23
Campania
Soil
Vitric Andosol, medial
Croppingsystem
olive treegroves
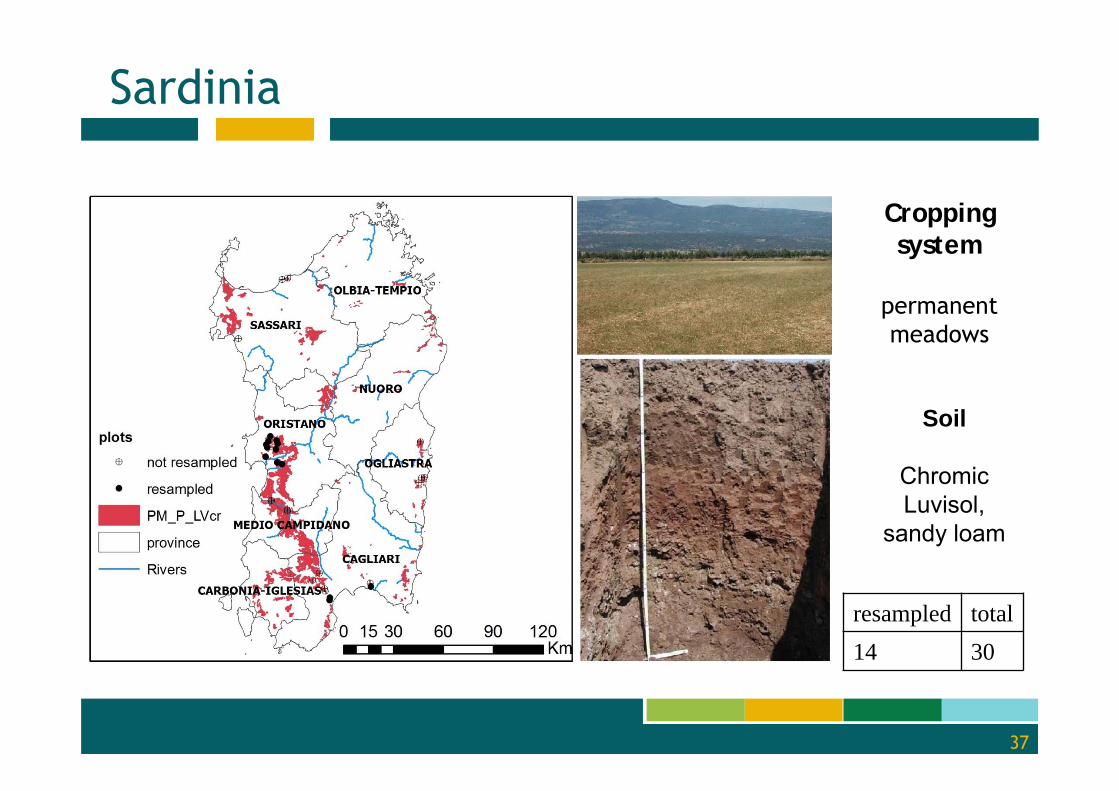
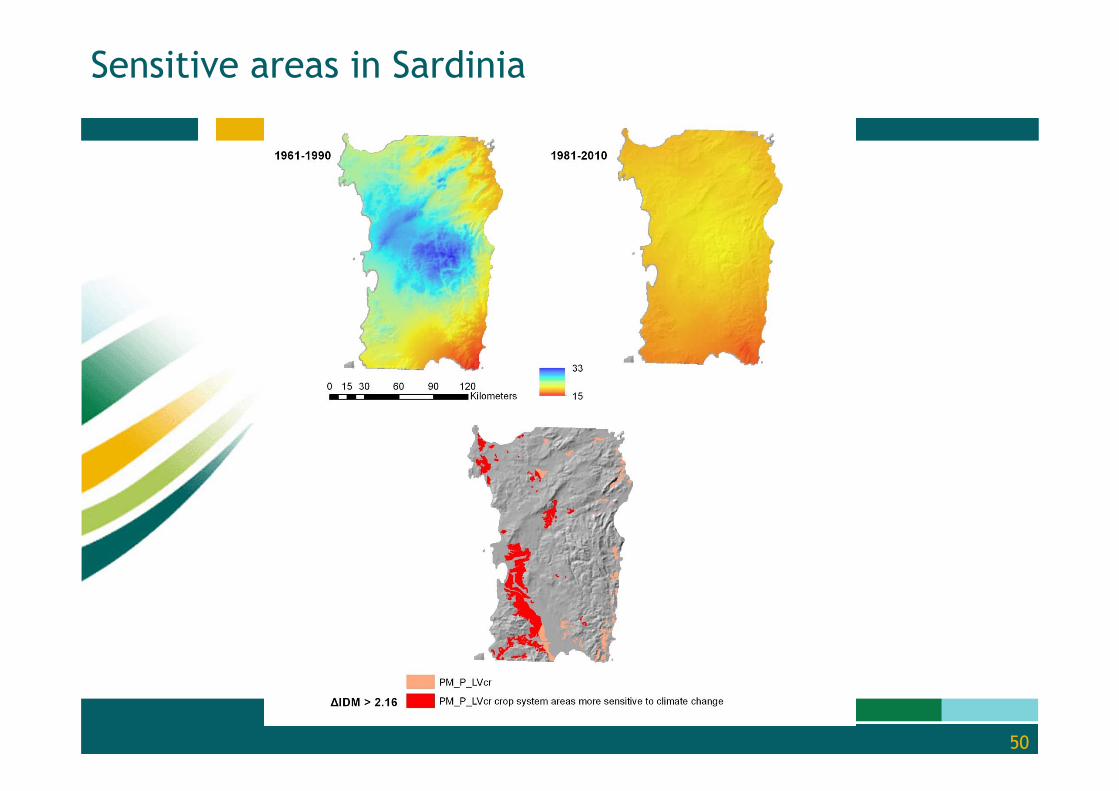
37
resampled total14 30
Sardinia
Soil
Chromic Luvisol,
sandy loam
Croppingsystem
permanentmeadows
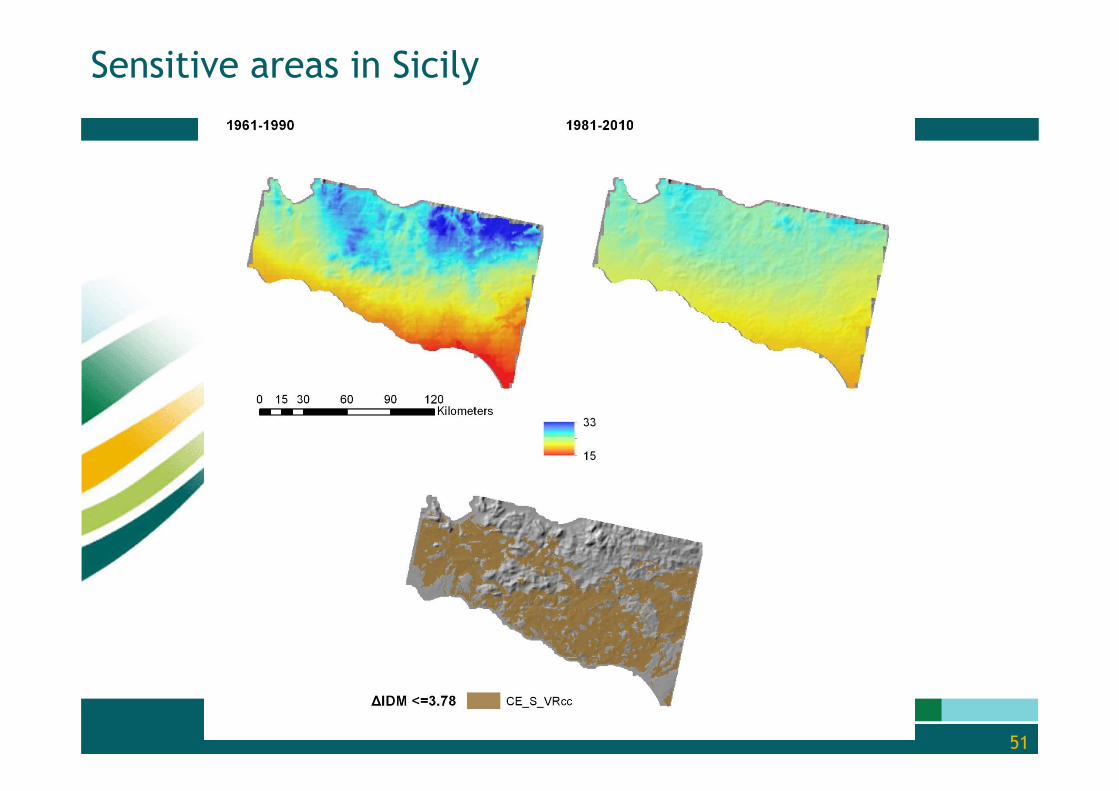
21/09/2013
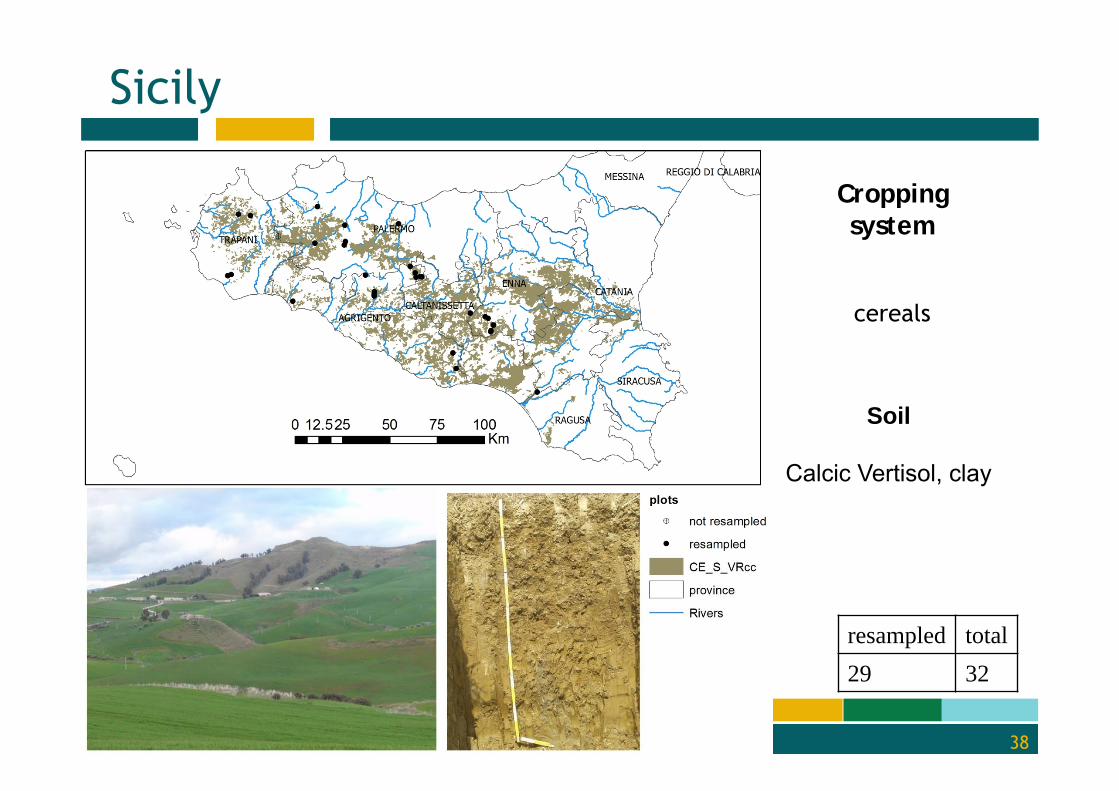
38
resampled total29 32
Soil
Calcic Vertisol, clay
Sicily
Croppingsystem
cereals
39
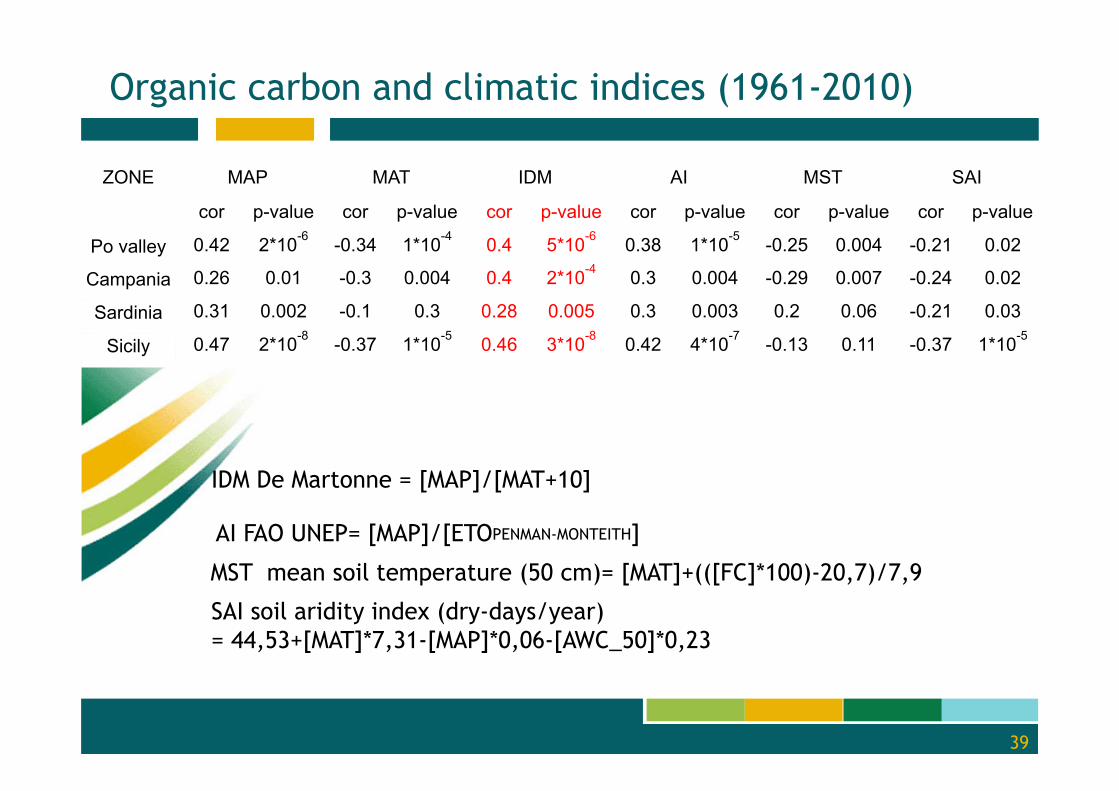
Organic carbon and climatic indices (1961-2010)
ZONE MAP MAT IDM AI MST SAI
cor p-value cor p-value cor p-value cor p-value cor p-value cor p-value
Po valley 0.42 2*10-6 -0.34 1*10-4 0.4 5*10-6 0.38 1*10-5 -0.25 0.004 -0.21 0.02
Campania 0.26 0.01 -0.3 0.004 0.4 2*10-4 0.3 0.004 -0.29 0.007 -0.24 0.02
Sardinia 0.31 0.002 -0.1 0.3 0.28 0.005 0.3 0.003 0.2 0.06 -0.21 0.03
Sicily 0.47 2*10-8 -0.37 1*10-5 0.46 3*10-8 0.42 4*10-7 -0.13 0.11 -0.37 1*10-5
SAI soil aridity index (dry-days/year)= 44,53+[MAT]*7,31-[MAP]*0,06-[AWC_50]*0,23
MST mean soil temperature (50 cm)= [MAT]+(([FC]*100)-20,7)/7,9
AI FAO UNEP= [MAP]/[ETOPENMAN-MONTEITH]
IDM De Martonne = [MAP]/[MAT+10]
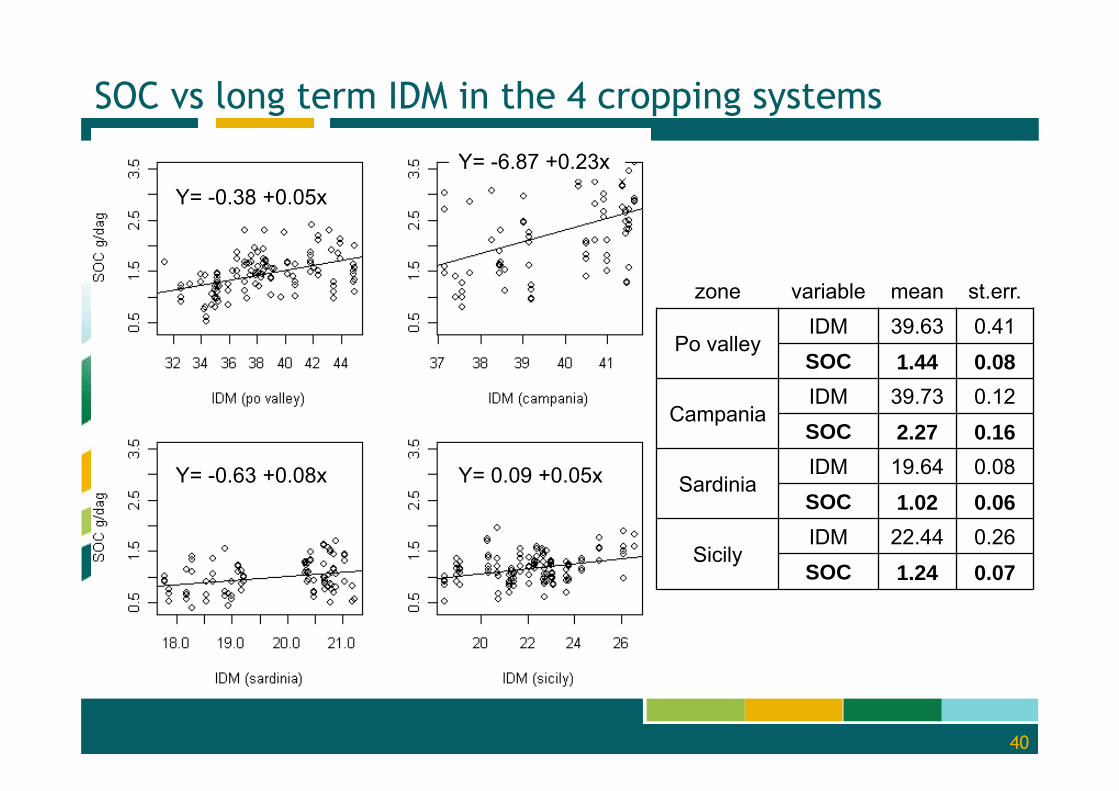
SOC vs long term IDM in the 4 cropping systems
40
zone variable mean st.err.
Po valleyIDM 39.63 0.41SOC 1.44 0.08
CampaniaIDM 39.73 0.12SOC 2.27 0.16
SardiniaIDM 19.64 0.08SOC 1.02 0.06
SicilyIDM 22.44 0.26SOC 1.24 0.07
Y= -0.38 +0.05x
Y= 0.09 +0.05xY= -0.63 +0.08x
Y= -6.87 +0.23x
41
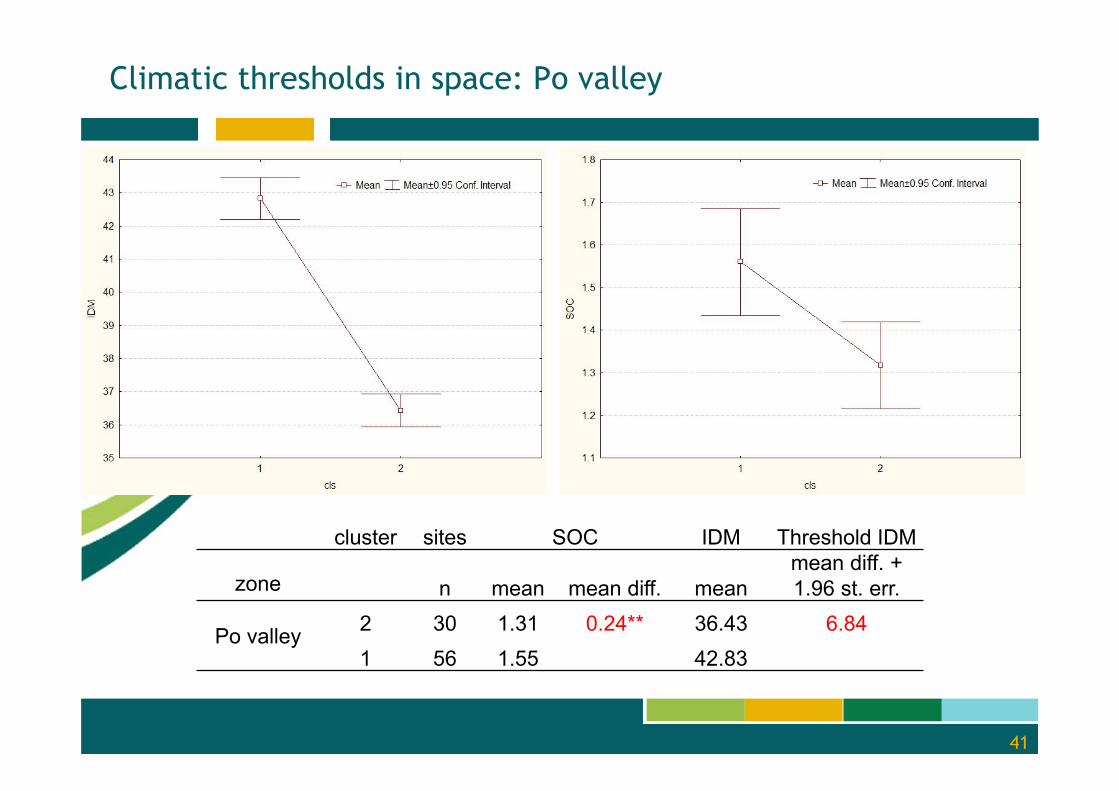
Climatic thresholds in space: Po valley
cluster sites SOC IDM Threshold IDM
zone n mean mean diff. meanmean diff. + 1.96 st. err.
Po valley 2 30 1.31 0.24** 36.43 6.841 56 1.55 42.83
42
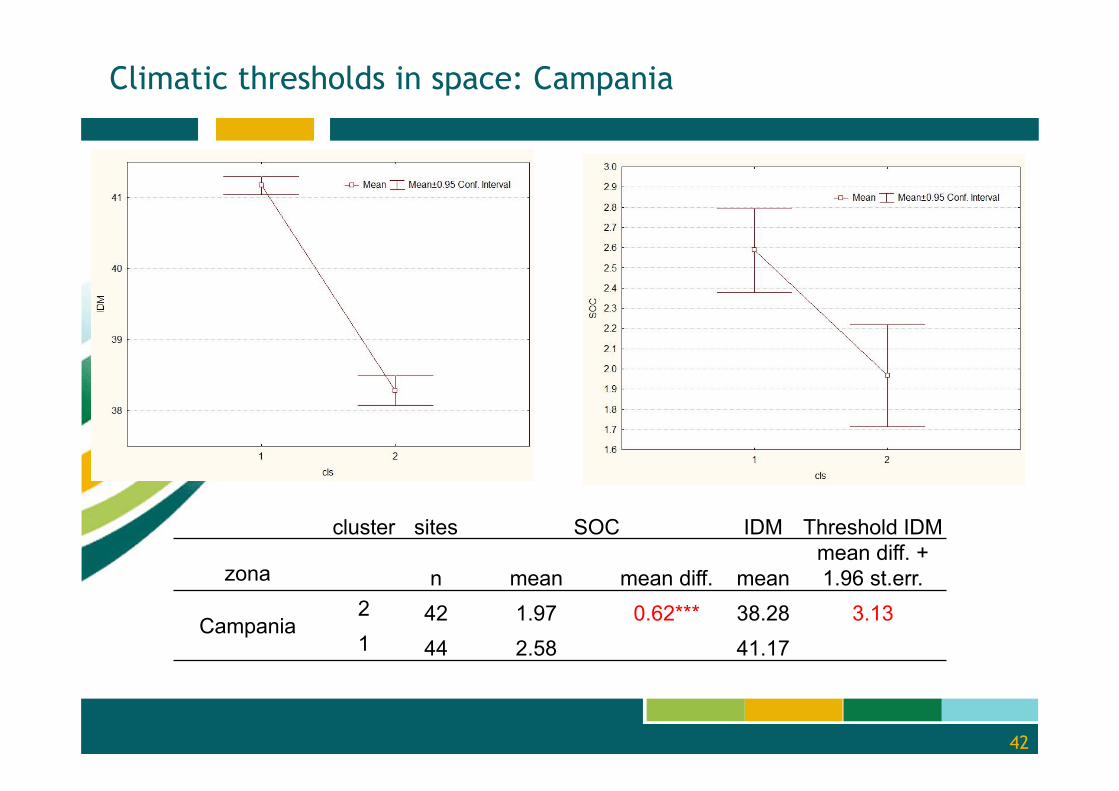
Climatic thresholds in space: Campania
cluster sites SOC IDM Threshold IDM
zona n mean mean diff. meanmean diff. + 1.96 st.err.
Campania2 42 1.97 0.62*** 38.28 3.131 44 2.58 41.17
43
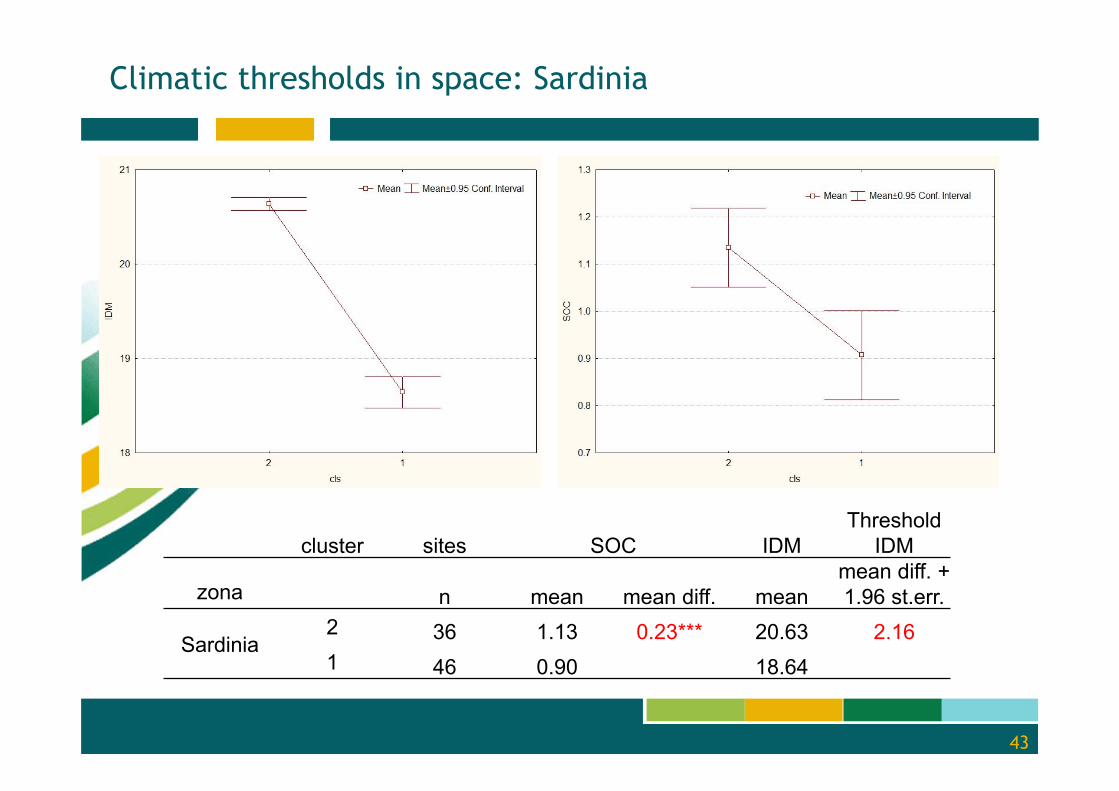
Climatic thresholds in space: Sardinia
cluster sites SOC IDMThreshold
IDM
zona n mean mean diff. meanmean diff. + 1.96 st.err.
Sardinia2 36 1.13 0.23*** 20.63 2.161 46 0.90 18.64
44
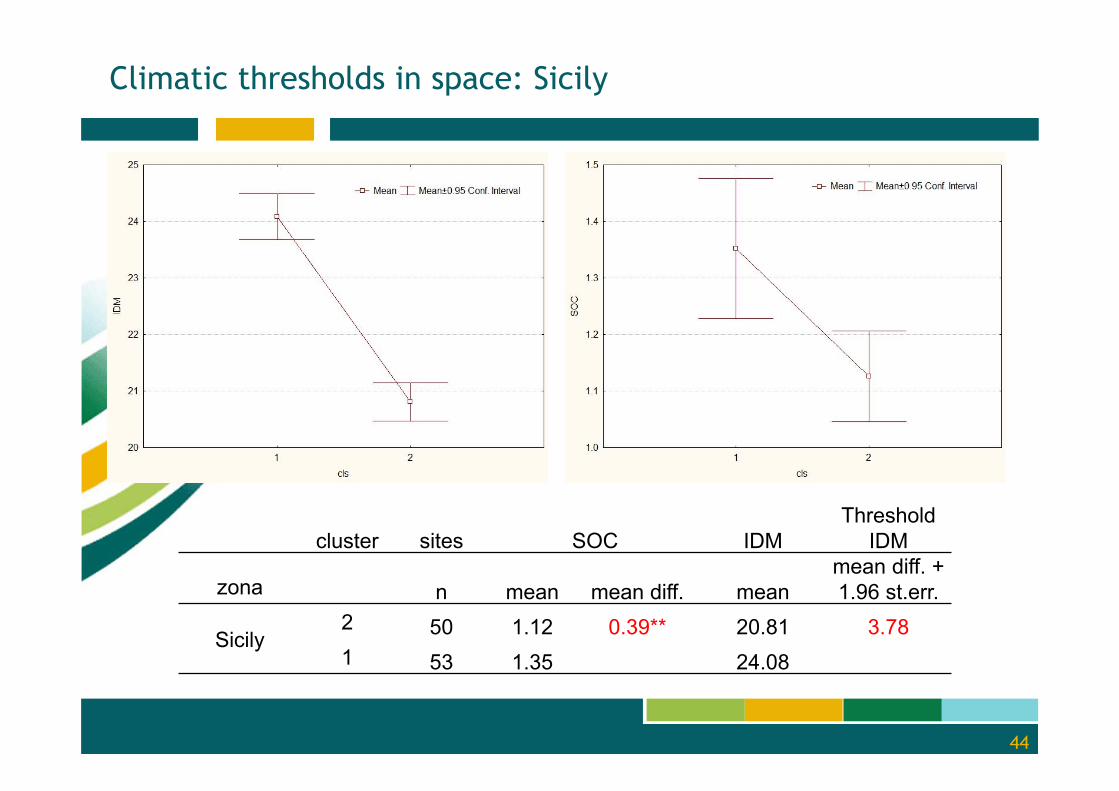
Climatic thresholds in space: Sicily
cluster sites SOC IDMThreshold
IDM
zona n mean mean diff. meanmean diff. + 1.96 st.err.
Sicily2 50 1.12 0.39** 20.81 3.781 53 1.35 24.08
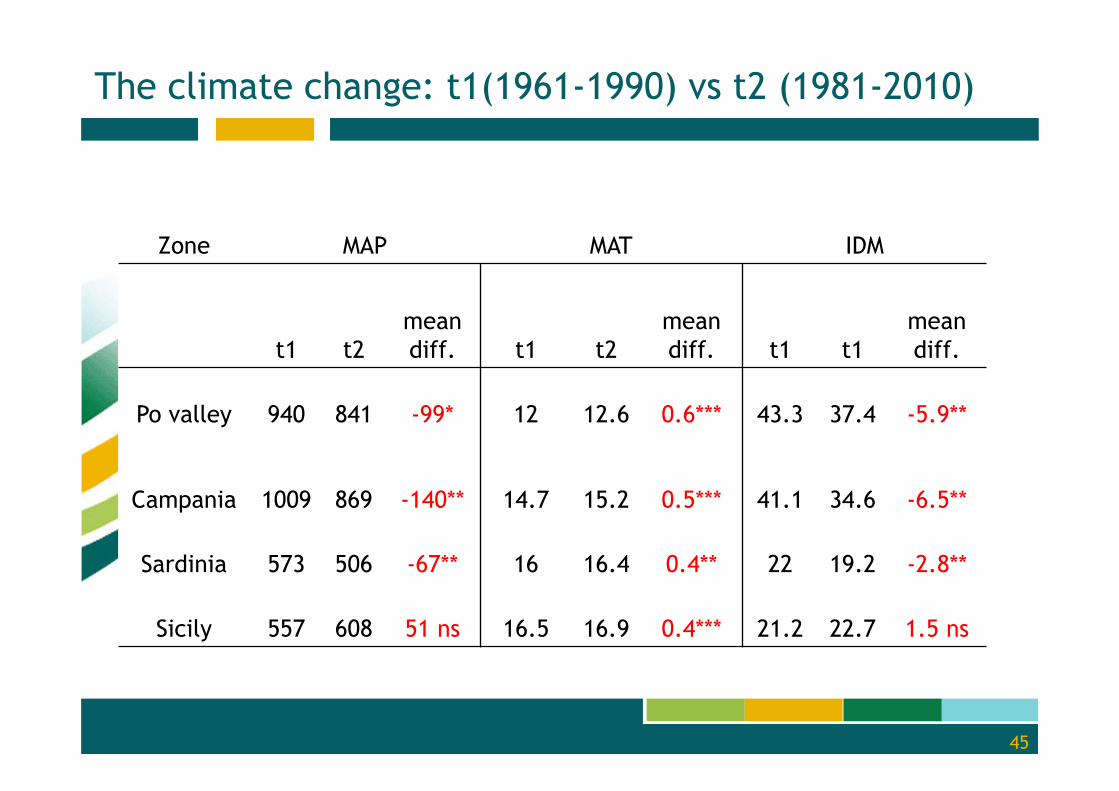
The climate change: t1(1961-1990) vs t2 (1981-2010)
Zone MAP MAT IDM
t1 t2meandiff. t1 t2
meandiff. t1 t1
meandiff.
Po valley 940 841 -99* 12 12.6 0.6*** 43.3 37.4 -5.9**
Campania 1009 869 -140** 14.7 15.2 0.5*** 41.1 34.6 -6.5**
Sardinia 573 506 -67** 16 16.4 0.4** 22 19.2 -2.8**
Sicily 557 608 51 ns 16.5 16.9 0.4*** 21.2 22.7 1.5 ns
45
46
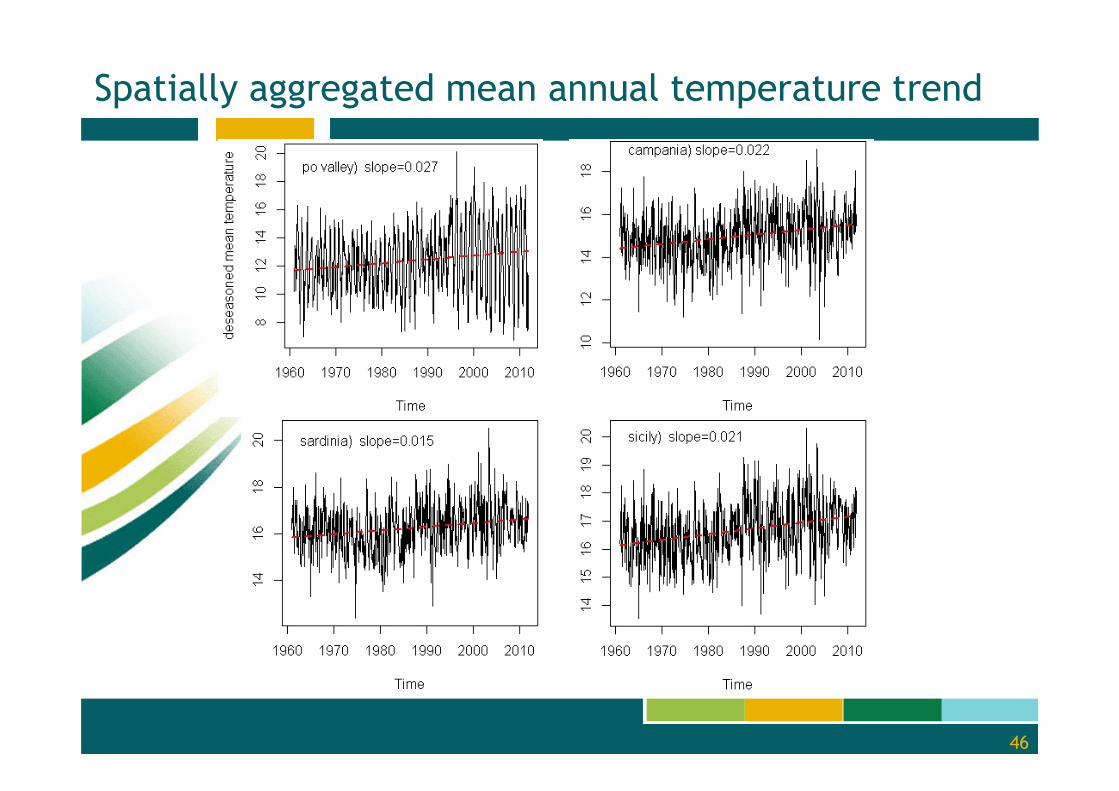
Spatially aggregated mean annual temperature trend
47
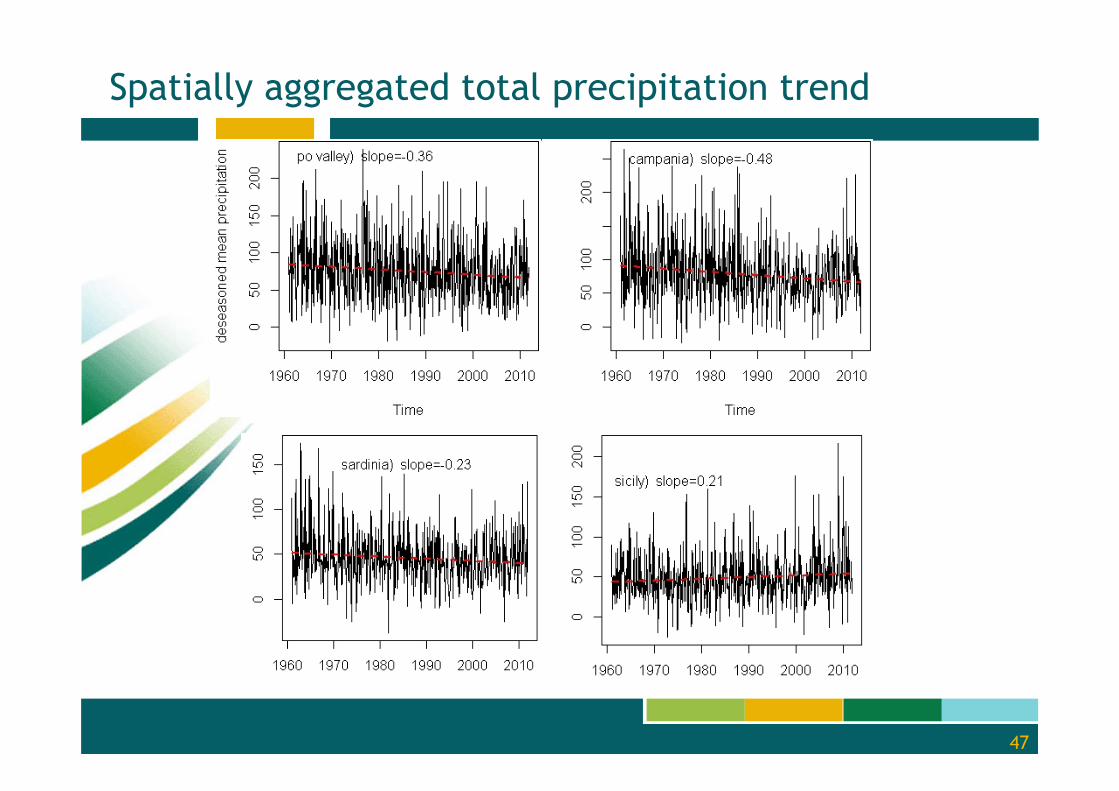
Spatially aggregated total precipitation trend
48
Sensitive areas in the Po valley
49
Sensitive areas in Campania
50
Sensitive areas in Sardinia
51
Sensitive areas in Sicily
21/09/2013
52
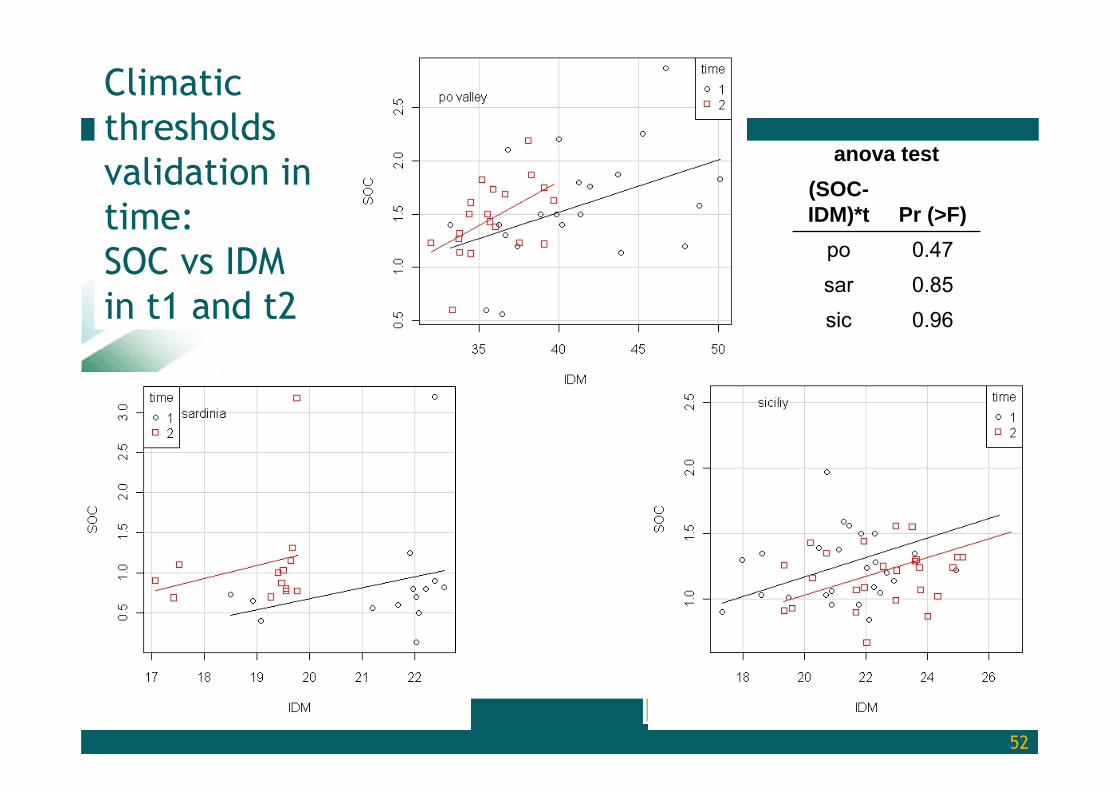
Climatic thresholds validation in time: SOC vs IDM in t1 and t2
anova test(SOC-IDM)*t Pr (>F)
po 0.47sar 0.85sic 0.96
53
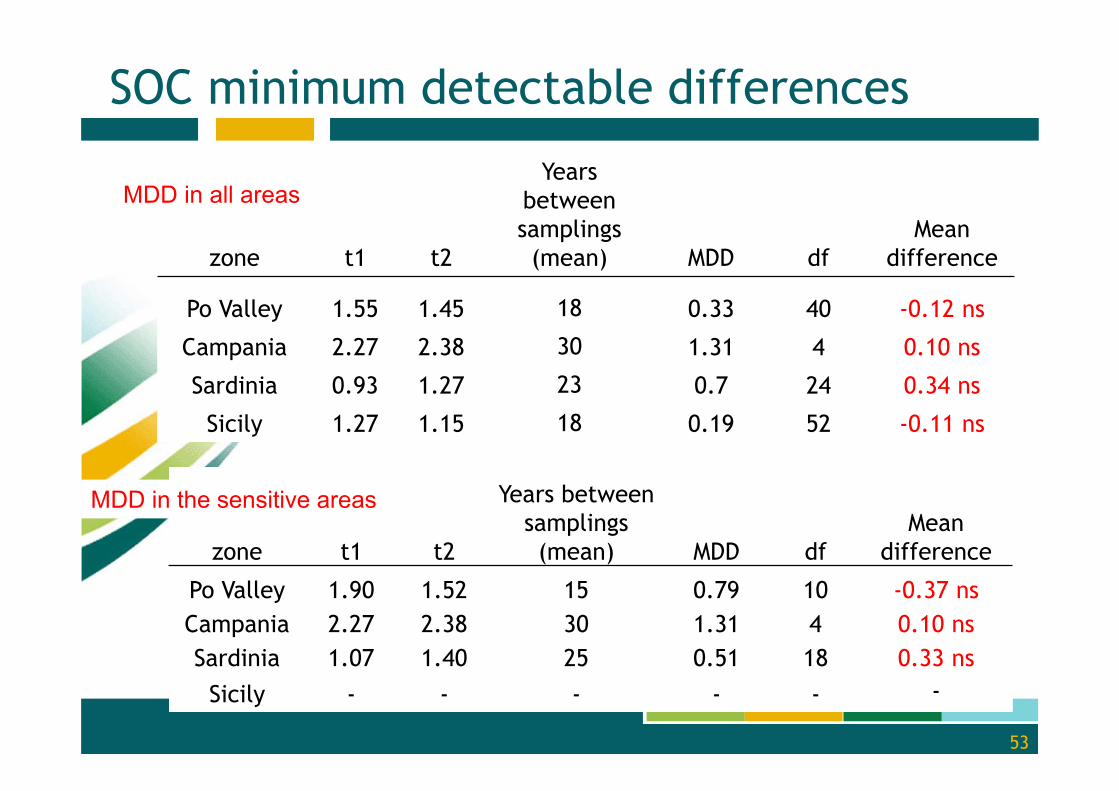
SOC minimum detectable differences
zone t1 t2
Yearsbetweensamplings(mean) MDD df
Meandifference
Po Valley 1.55 1.45 18 0.33 40 -0.12 ns
Campania 2.27 2.38 30 1.31 4 0.10 ns
Sardinia 0.93 1.27 23 0.7 24 0.34 ns
Sicily 1.27 1.15 18 0.19 52 -0.11 ns
zone t1 t2
Years betweensamplings(mean) MDD df
Mean difference
Po Valley 1.90 1.52 15 0.79 10 -0.37 ns Campania 2.27 2.38 30 1.31 4 0.10 ns Sardinia 1.07 1.40 25 0.51 18 0.33 ns
Sicily - - - - - -
MDD in the sensitive areas
MDD in all areas
54
Conclusions
SOC actually varies with long term climate in the 4 studied cropping systems:
IDM thresholds along climosequences correspond to significant SOC variationThresholds and SOC variations are different in each cropping systemMost sensitive soils: Vitric Andosols of CampaniaSOC variations are less than pronounced that climatic variations
55
Conclusions and perspectives
Climatic thresholds were surpassed with time in 3 out of 4 regions, with the exception of SicilyThe SOC vs IDM relationship did not change with timeSOC content in the resampled sites did not significantly change
High local variability? Change of management practices in the same cropping system?
"We are dealing with 10 global issues at the moment: food security; availability of water;
climate change; energy demand; wastedisposal; extinction of biodiversity; soil
degradation and desertification; poverty; political and ethnic instability; and rapid
population increase. The solution to all of these lies in soil
management" Rattal Lal, Ohio Agricultural Research and Development Center
Measures to combat SOC decline
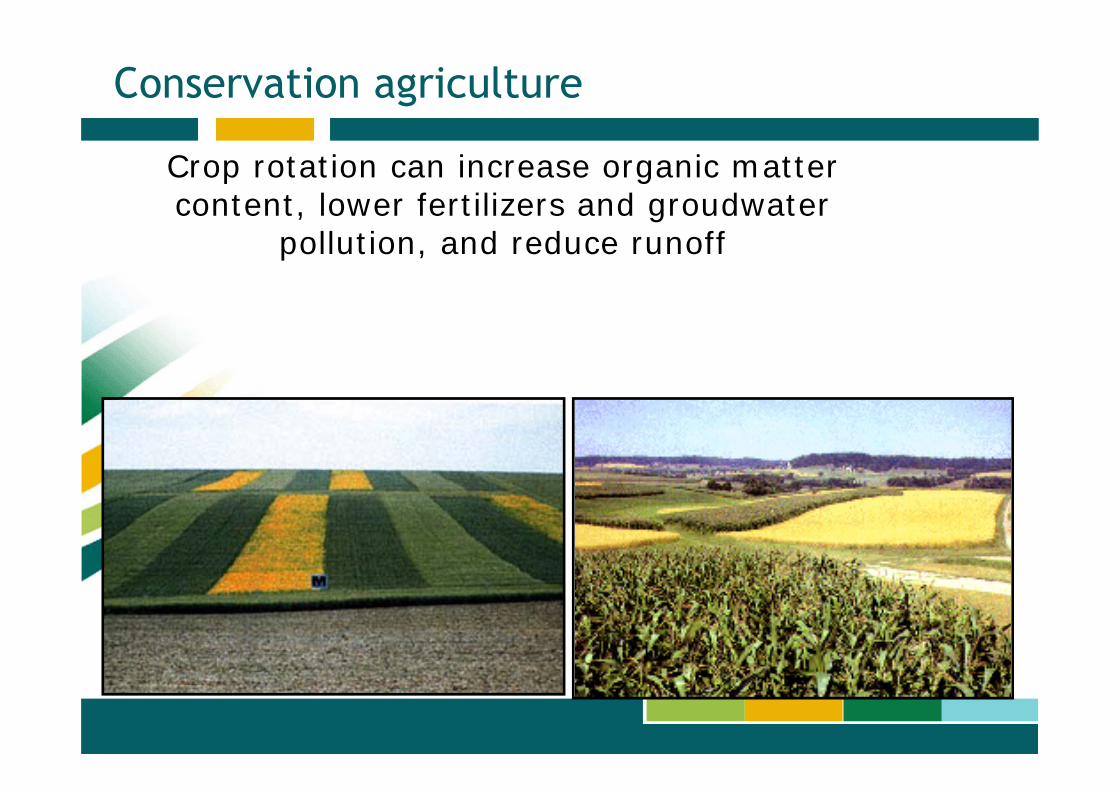
Conservation agriculture
Crop rotation can increase organic mattercontent, lower fertilizers and groudwater
pollution, and reduce runoff
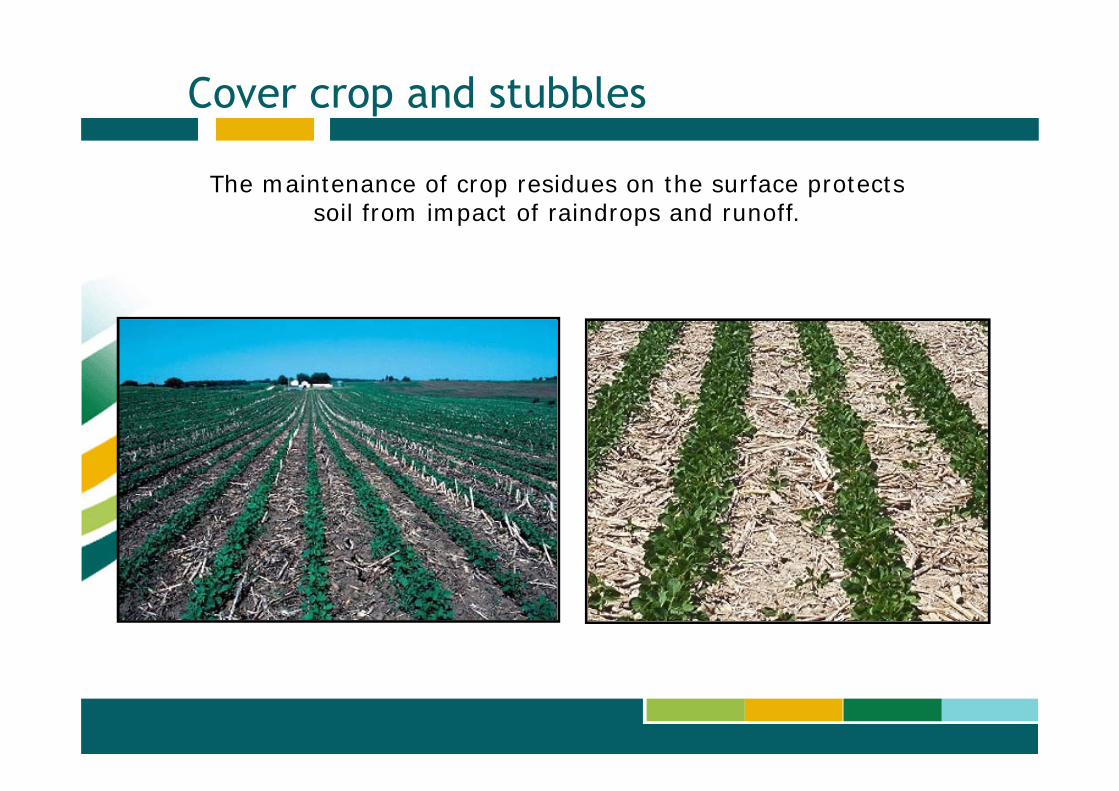
Cover crop and stubbles
The maintenance of crop residues on the surface protects soil from impact of raindrops and runoff.
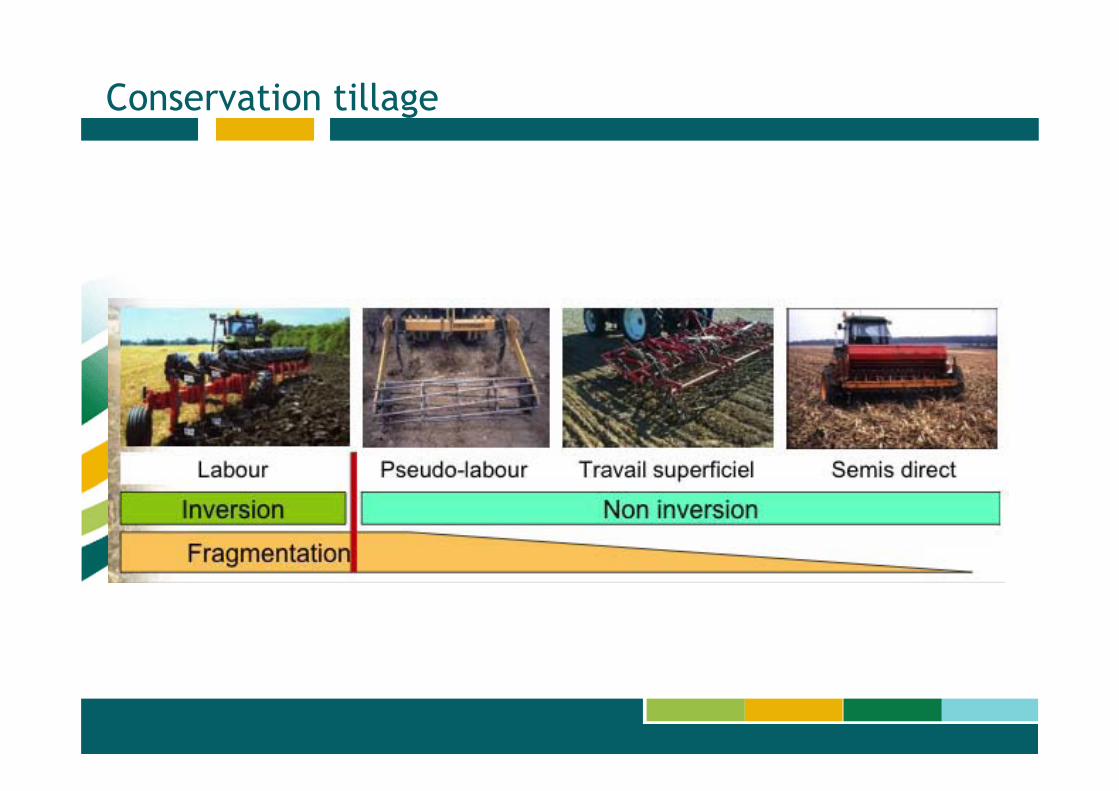
Conservation tillage
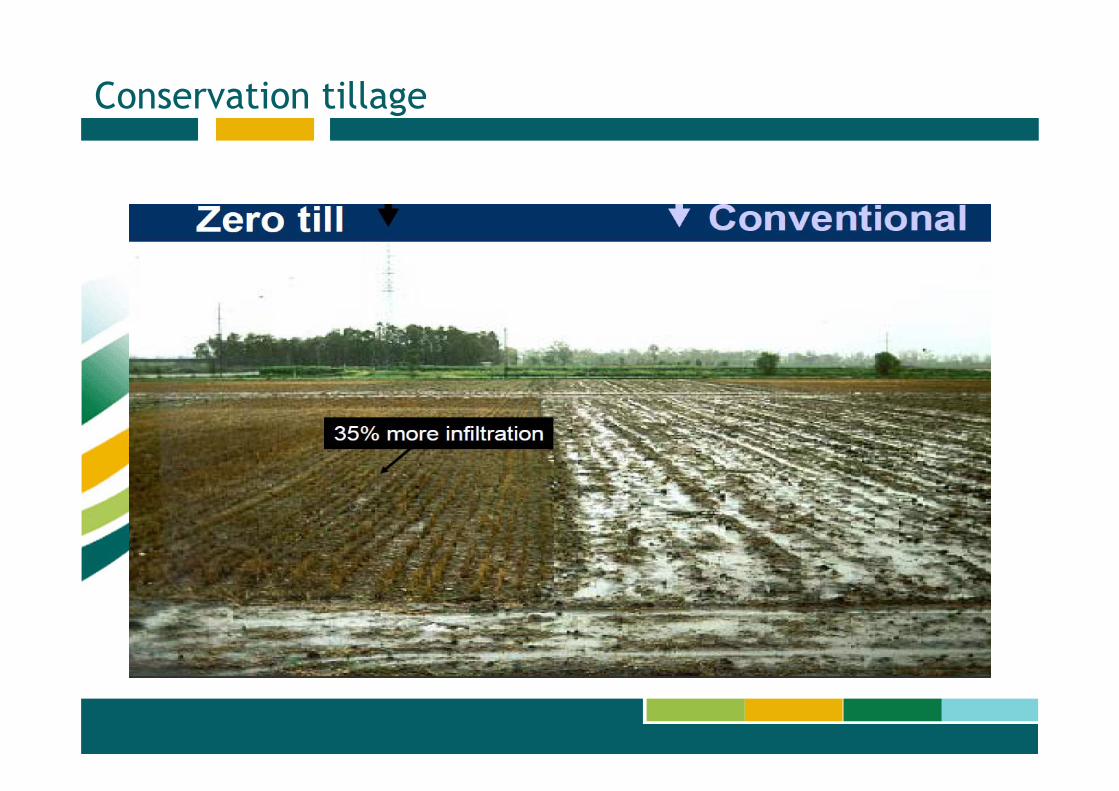
Conservation tillage
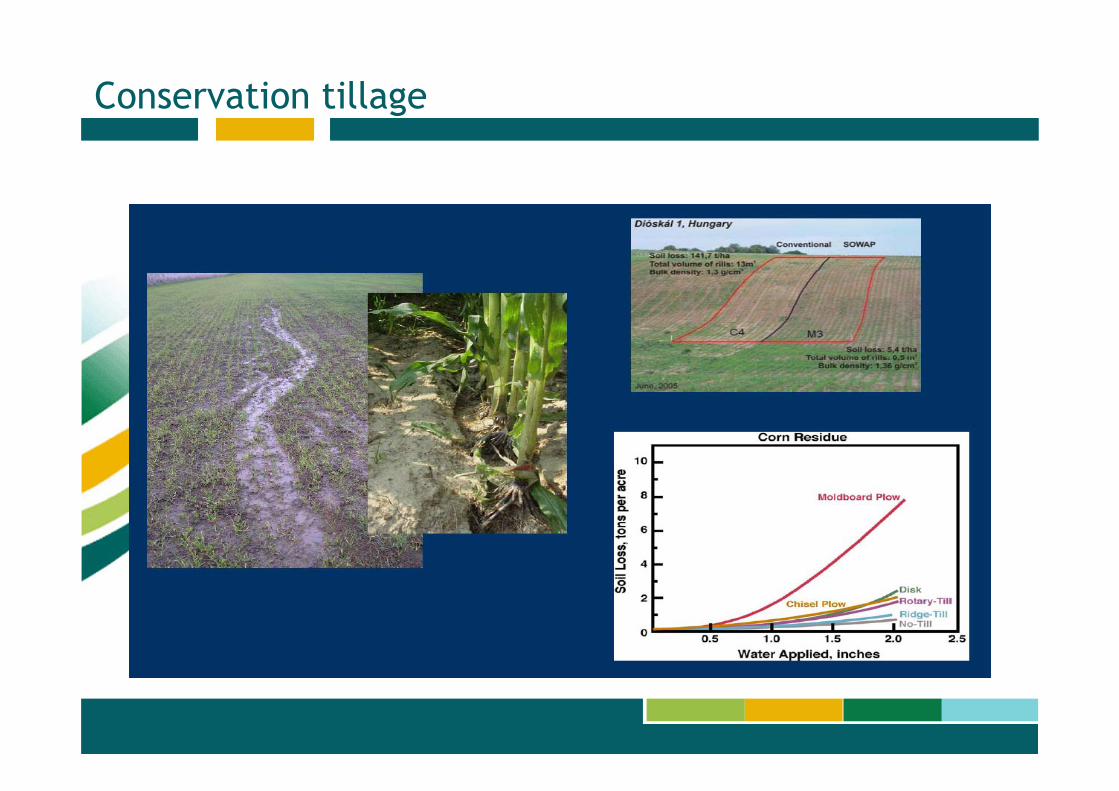
Conservation tillage
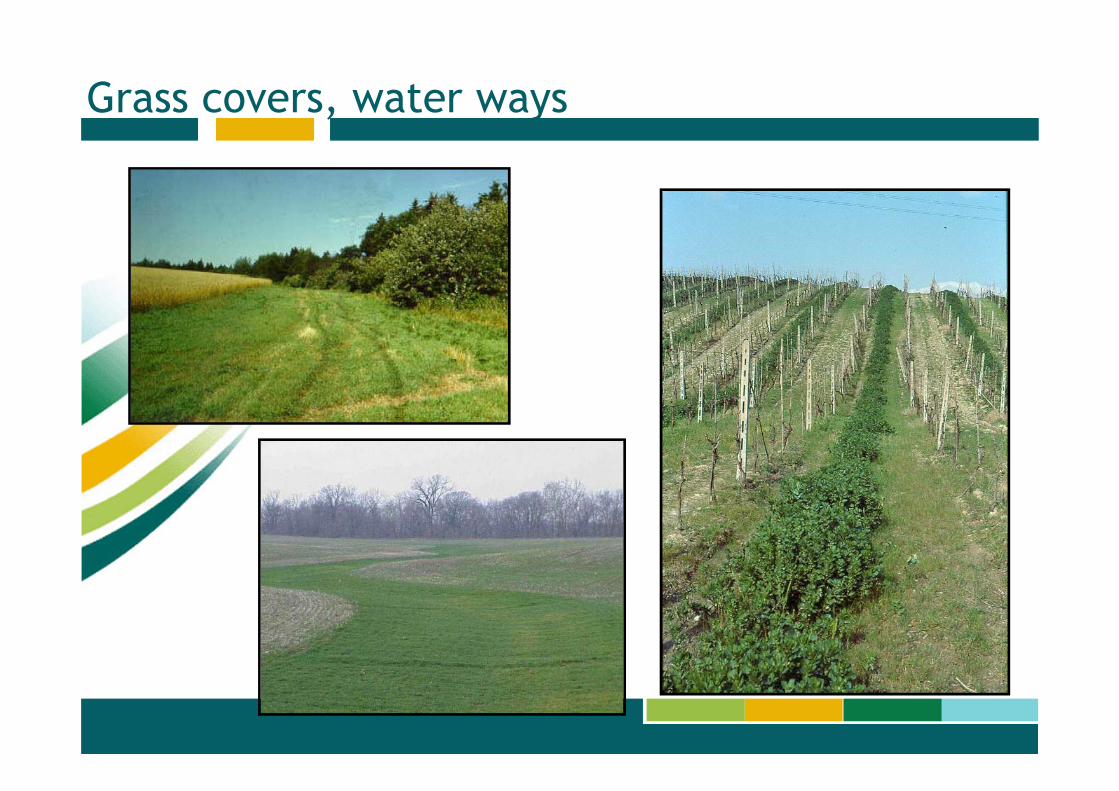
Grass covers, water ways
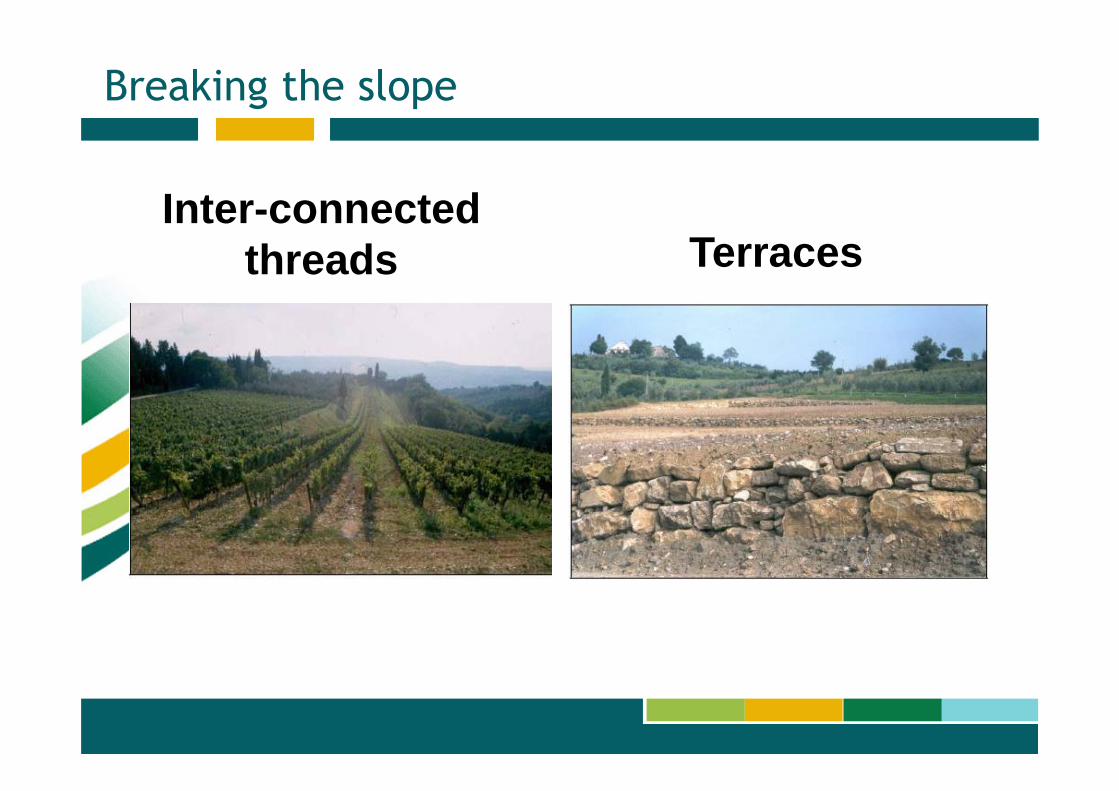
Inter-connected threads Terraces
Breaking the slope
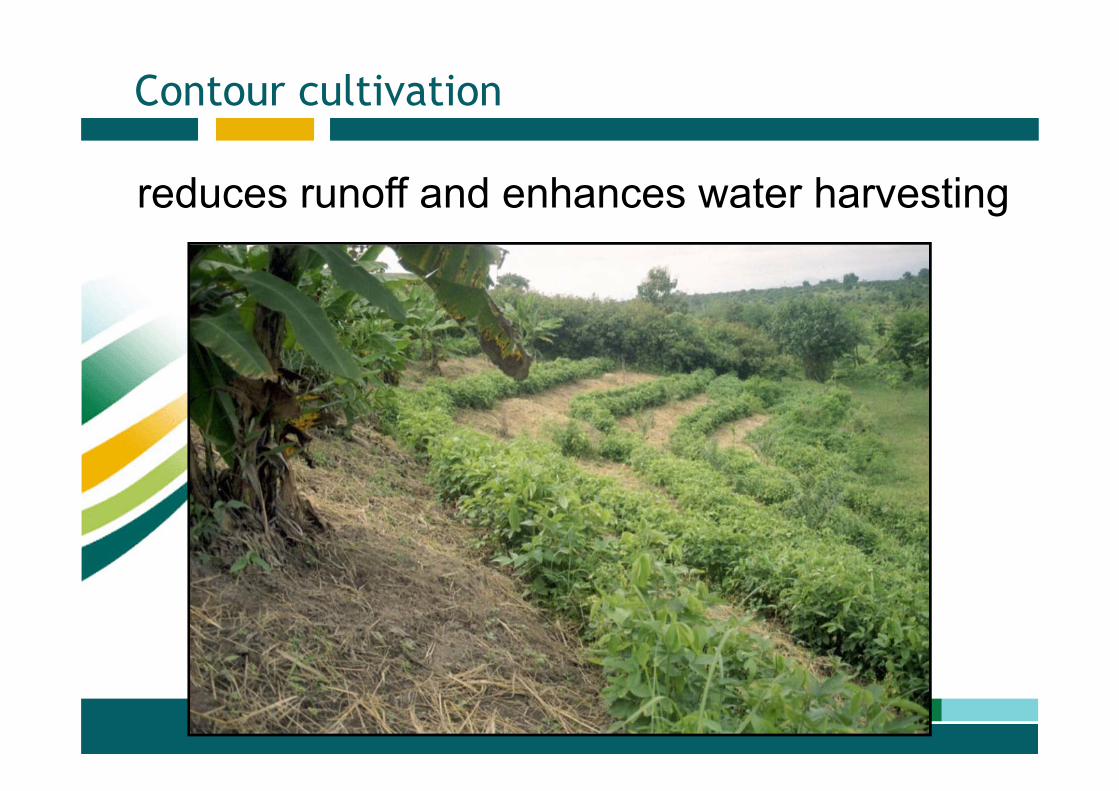
Contour cultivation
reduces runoff and enhances water harvesting
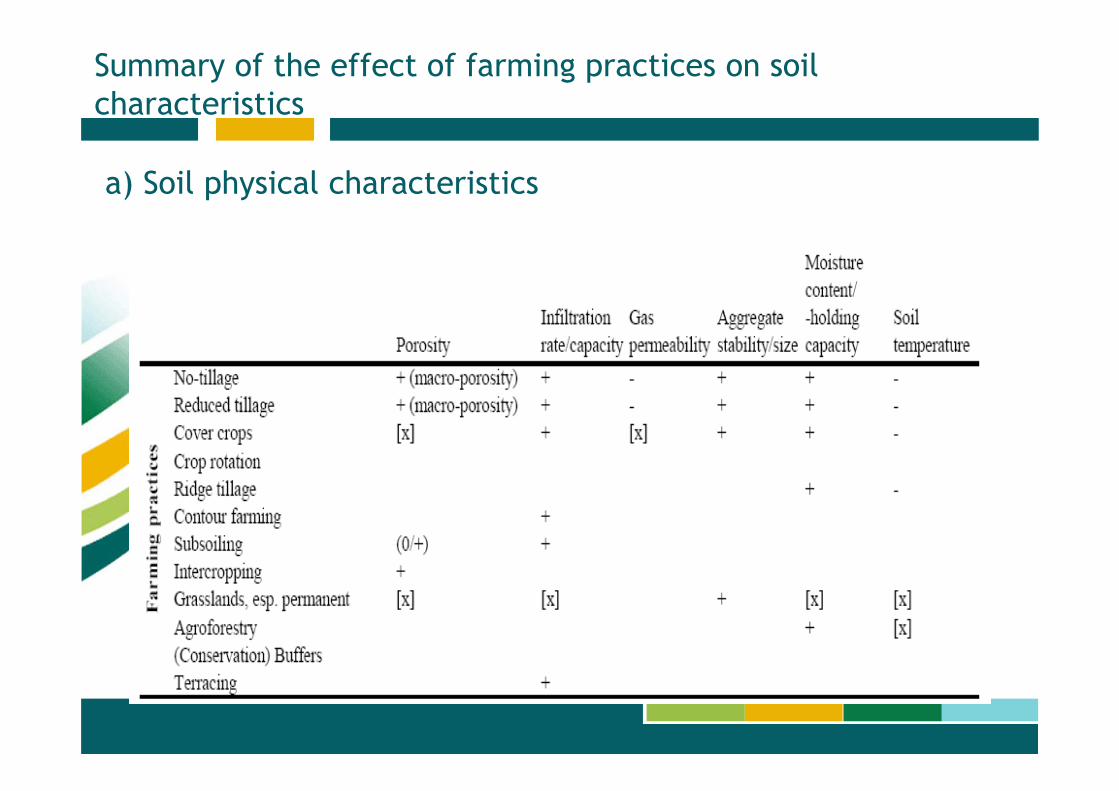
Summary of the effect of farming practices on soil characteristics
a) Soil physical characteristics
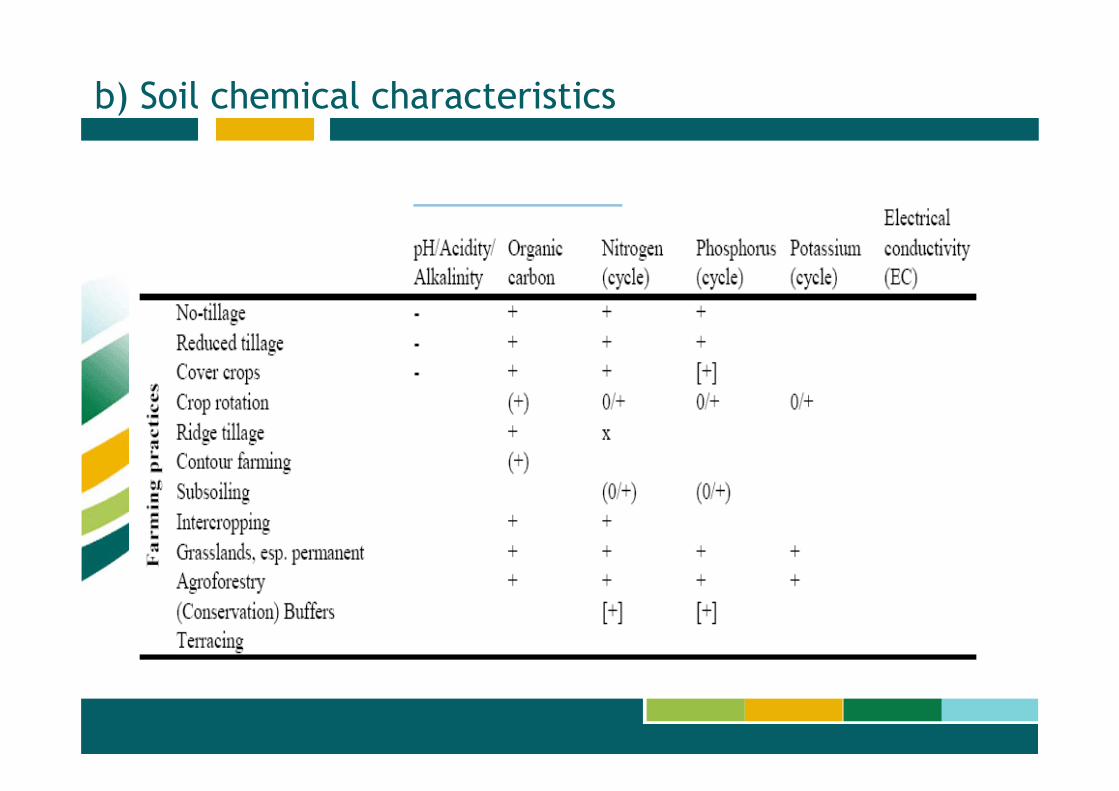
b) Soil chemical characteristics
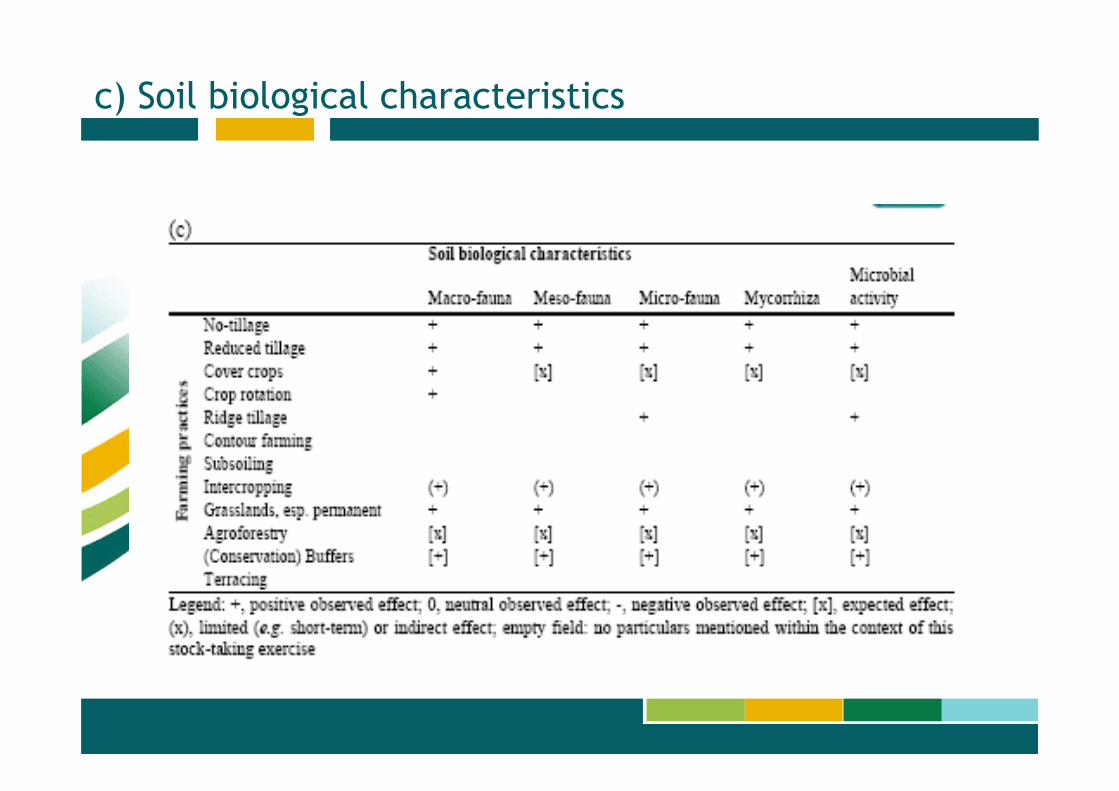
c) Soil biological characteristics
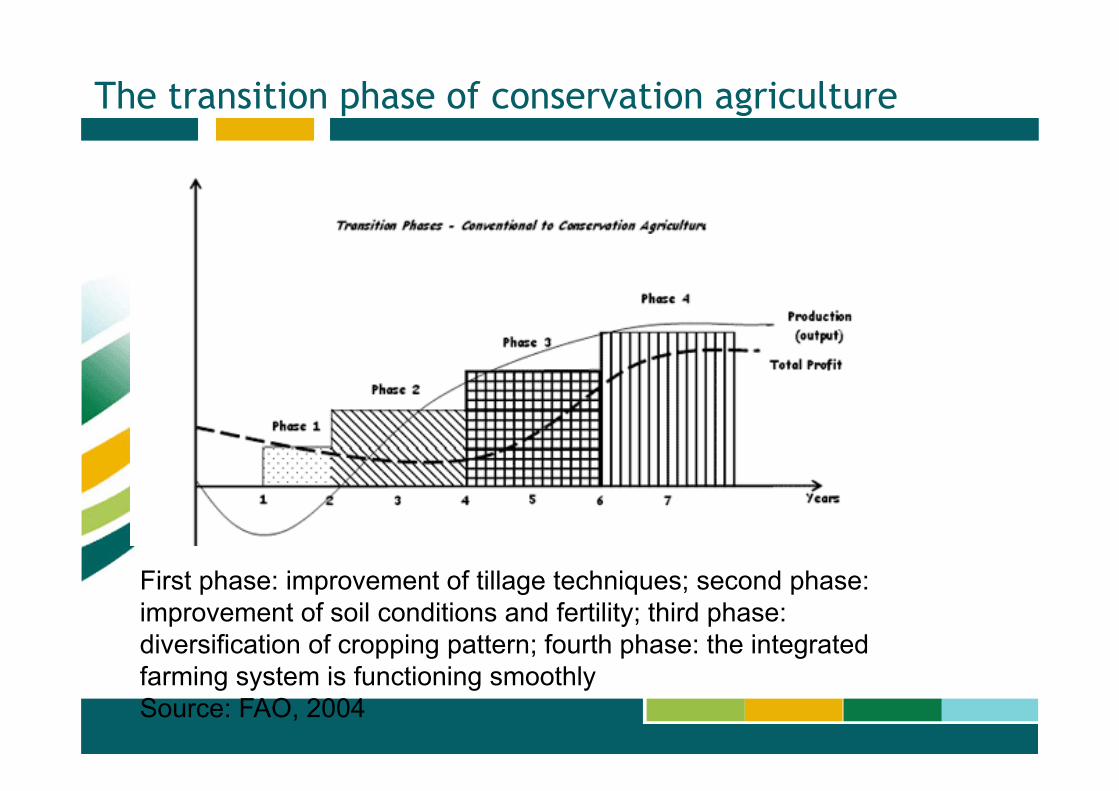
The transition phase of conservation agriculture
First phase: improvement of tillage techniques; second phase: improvement of soil conditions and fertility; third phase: diversification of cropping pattern; fourth phase: the integrated farming system is functioning smoothlySource: FAO, 2004
Monitoring organic carbon variations due to changes in management.
Spatial interpolation with the use of
Soil Proximal Sensing
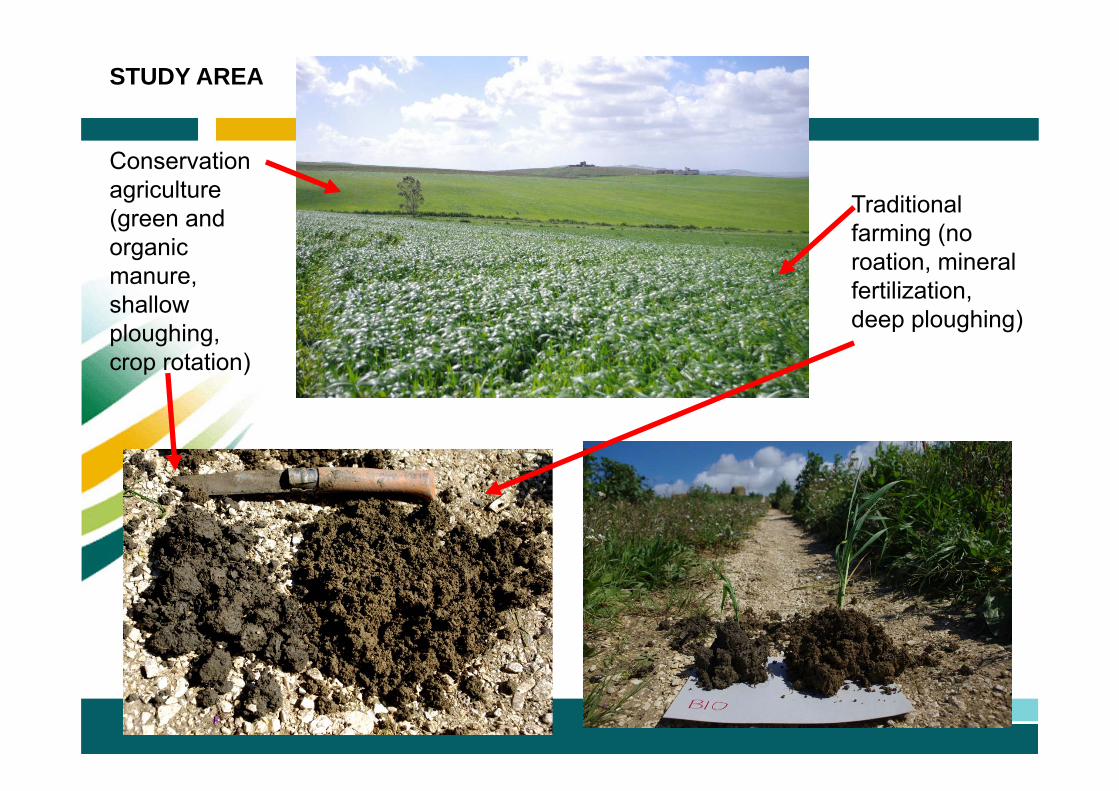
Conservation agriculture(green and organic manure, shallow ploughing, crop rotation)
Traditional farming (no roation, mineral fertilization, deep ploughing)
STUDY AREA
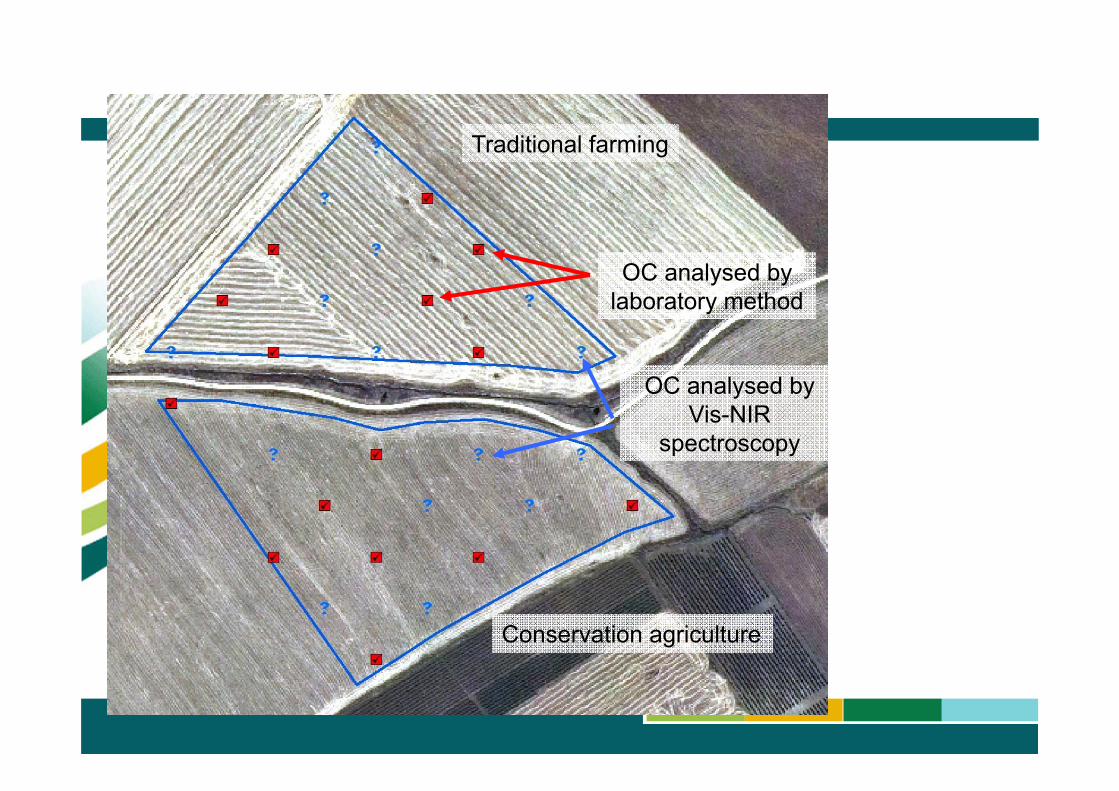
Traditional farming
Conservation agriculture
OC analysed by laboratory method
OC analysed by Vis-NIR
spectroscopy
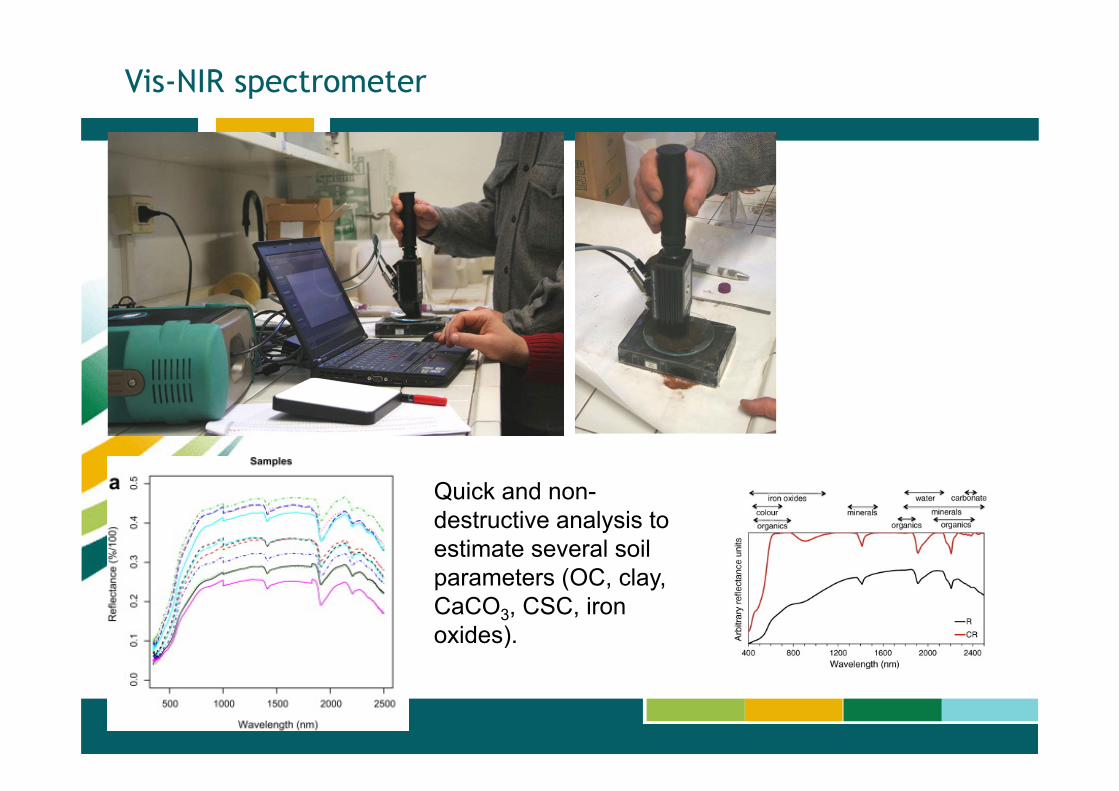
Vis-NIR spectrometer
Quick and non-destructive analysis to estimate several soil parameters (OC, clay, CaCO3, CSC, iron oxides).
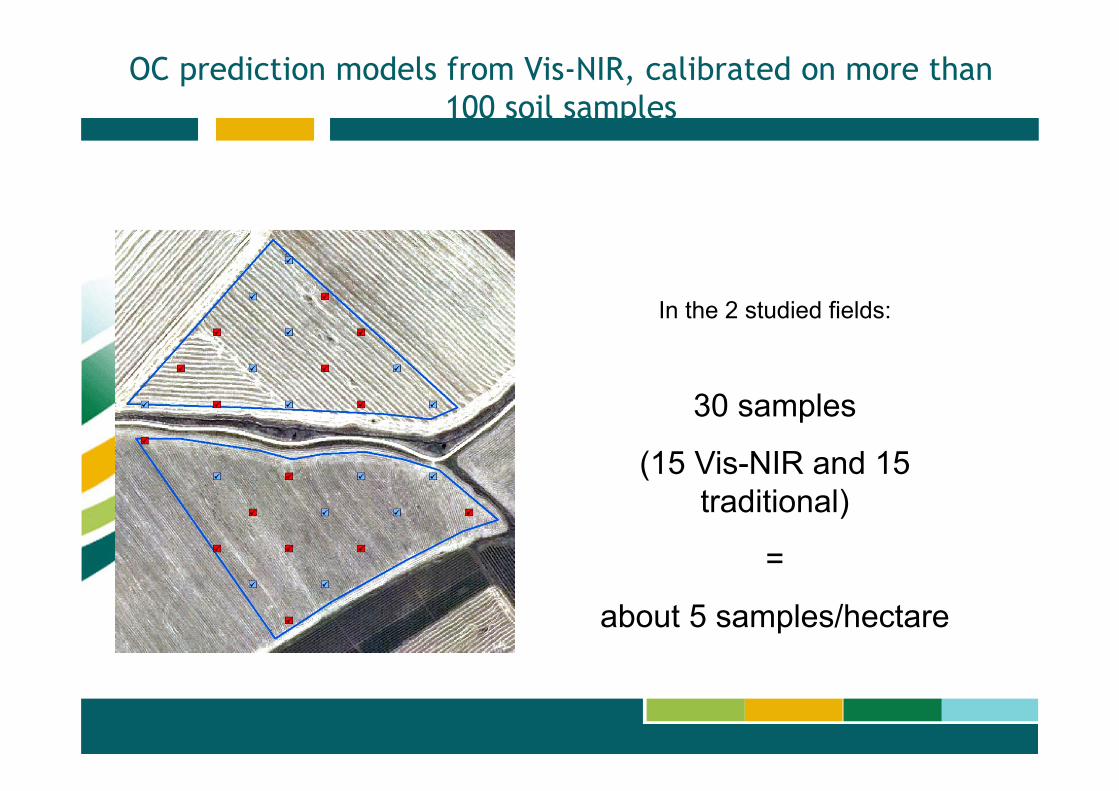
30 samples
(15 Vis-NIR and 15 traditional)
=
about 5 samples/hectare
OC prediction models from Vis-NIR, calibrated on more than100 soil samples
In the 2 studied fields:
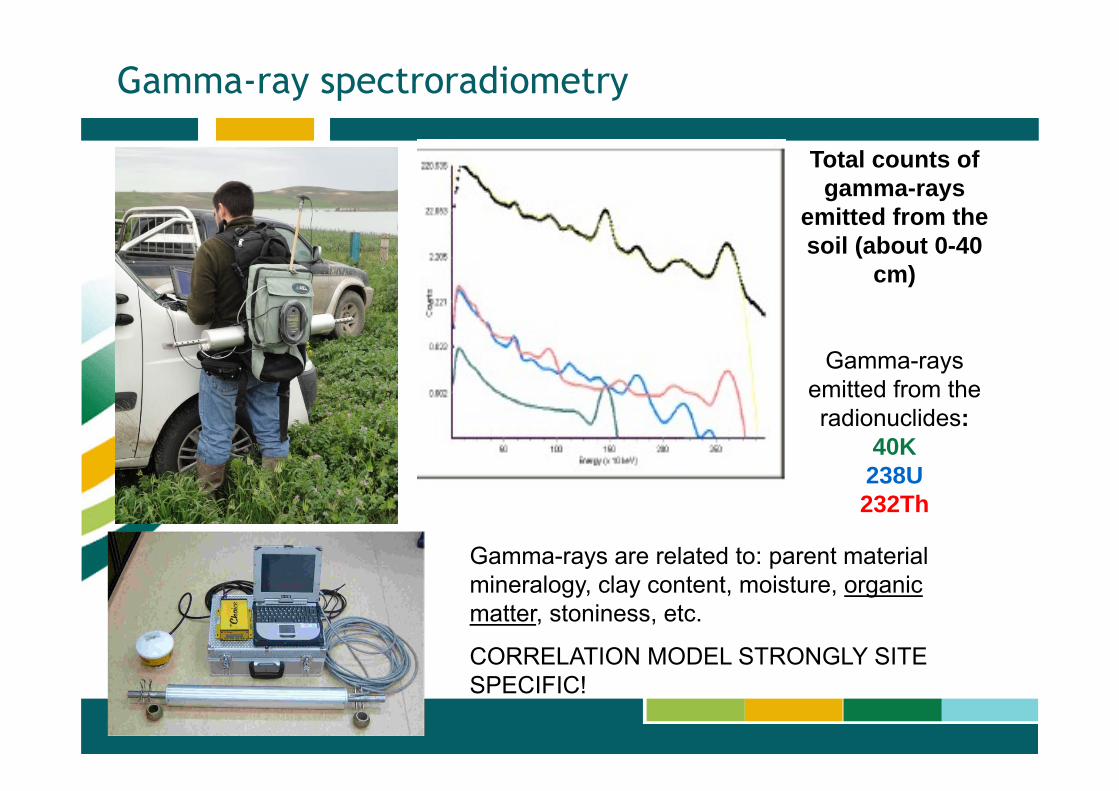
Gamma-ray spectroradiometry
Total counts of gamma-rays
emitted from the soil (about 0-40
cm)
Gamma-rays emitted from the radionuclides:
40K238U232Th
Gamma-rays are related to: parent material mineralogy, clay content, moisture, organic matter, stoniness, etc.
CORRELATION MODEL STRONGLY SITE SPECIFIC!
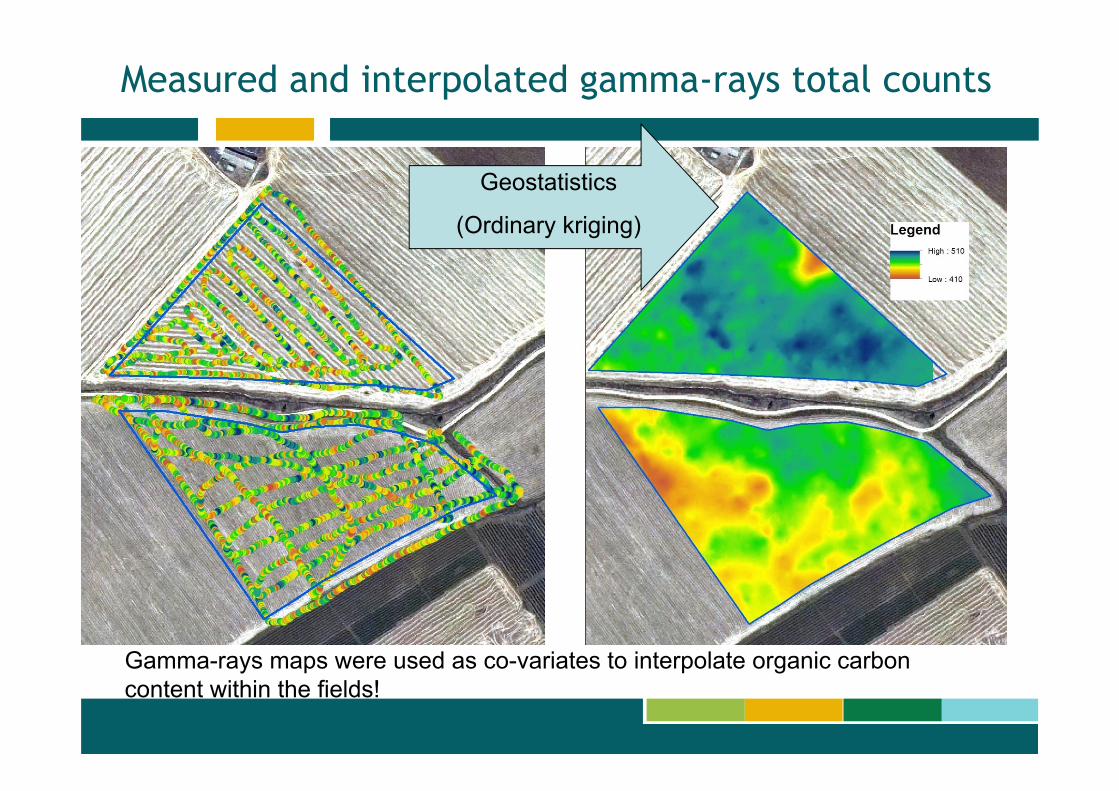
Geostatistics
(Ordinary kriging)
Measured and interpolated gamma-rays total counts
Gamma-rays maps were used as co-variates to interpolate organic carbon content within the fields!
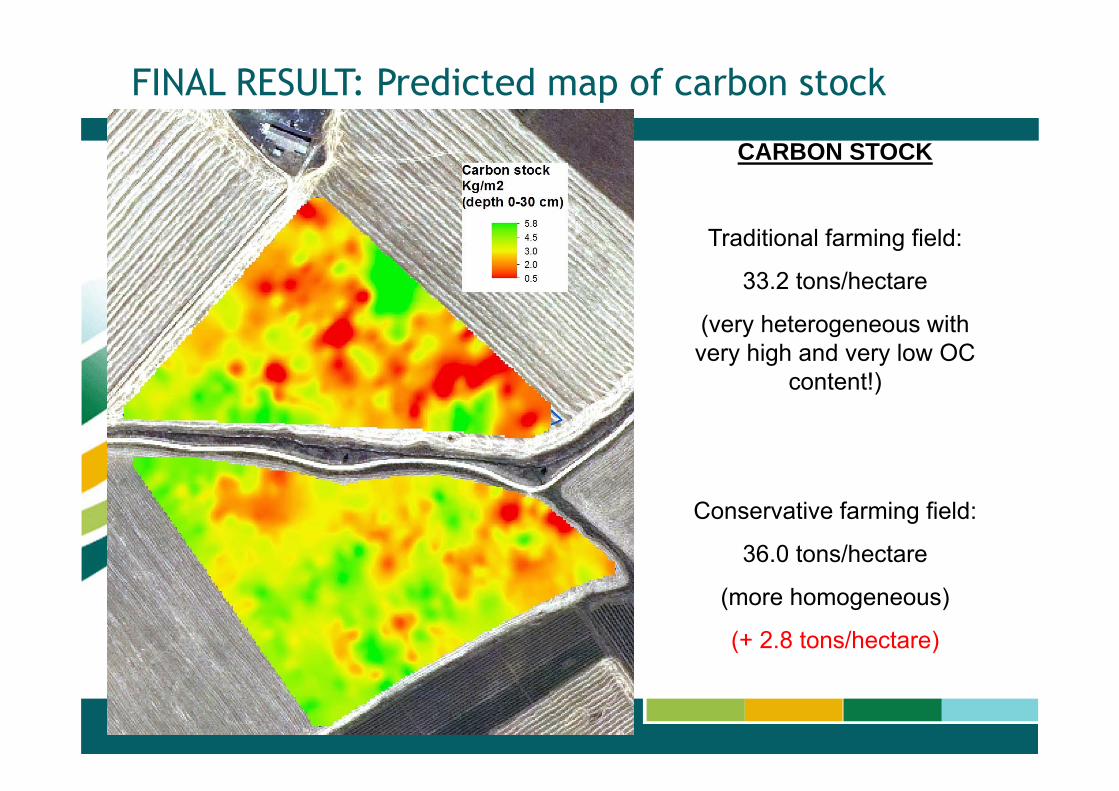
FINAL RESULT: Predicted map of carbon stock
CARBON STOCK
Traditional farming field:
33.2 tons/hectare
(very heterogeneous with very high and very low OC
content!)
Conservative farming field:
36.0 tons/hectare
(more homogeneous)
(+ 2.8 tons/hectare)
77
Any question?