Factors influencing sedentary behaviour: A system based ...
18
RESEARCH ARTICLE Factors influencing sedentary behaviour: A system based analysis using Bayesian networks within DEDIPAC Christoph Buck ID 1 *, Anne Loyen 2 , Ronja Foraita 1 , Jelle Van Cauwenberg 3,4 , Marieke De Craemer ID 5 , Ciaran Mac Donncha 6 , Jean-Michel Oppert 7 , Johannes Brug 8 , Nanna Lien 9 , Greet Cardon 5 , Iris Pigeot 1,10 , Sebastien Chastin 5,11 , on behalf of the DEDIPAC consortium ¶ 1 Leibniz Institute for Prevention Research and Epidemiology–BIPS, Bremen, Germany, 2 Department of Public and Occupational Health, Amsterdam Public Health Research Institute, VU University Medical Center, Amsterdam, Netherlands, 3 Research Foundation Flanders (FWO), Brussels, Belgium, 4 Department of Public Health, Ghent University, Ghent, Belgium, 5 Department of Movement and Sports Sciences, Ghent University, Ghent, Belgium, 6 Department of Physical Education and Sport Sciences, University of Limerick, Limerick, Ireland, 7 Department of Nutrition, University Pierre et Marie Curie, Institute of Cardiometabolism And Nutrition (ICAN), Pitie-Salpêtrière Hospital (AP-HP), Paris, France, 8 Amsterdam School for Communication Research, University of Amsterdam, Amsterdam, The Netherlands, 9 Department of Nutrition, University of Oslo, Oslo, Norway, 10 University of Bremen, Faculty of Mathematics and Computer Science, Bremen, Germany, 11 Institute for Applied Health Research, School of Health and Life Science, Glasgow Caledonian University, Glasgow, United Kingdom ¶ Membership of the DEDIPAC consortium can be found in the Acknowledgments * [email protected] Abstract Background Decreasing sedentary behaviour (SB) has emerged as a public health priority since pro- longed sitting increases the risk of non-communicable diseases. Mostly, the independent association of factors with SB has been investigated, although lifestyle behaviours are con- ditioned by interdependent factors. Within the DEDIPAC Knowledge Hub, a system of sed- entary behaviours (SOS)-framework was created to take interdependency among multiple factors into account. The SOS framework is based on a system approach and was devel- oped by combining evidence synthesis and expert consensus. The present study conducted a Bayesian network analysis to investigate and map the interdependencies between factors associated with SB through the life-course from large scale empirical data. Methods Data from the Eurobarometer survey (80.2, 2013) that included the International physical activity questionnaire (IPAQ) short as well as socio-demographic information and questions on perceived environment, health, and psychosocial information were enriched with macro- level data from the Eurostat database. Overall, 33 factors were identified aligned to the SOS-framework to represent six clusters on the individual or regional level: 1) physical health and wellbeing, 2) social and cultural context, 3) built and natural environment, 4) psy- chology and behaviour, 5) institutional and home settings, 6) policy and economics. A PLOS ONE | https://doi.org/10.1371/journal.pone.0211546 January 30, 2019 1 / 18 a1111111111 a1111111111 a1111111111 a1111111111 a1111111111 OPEN ACCESS Citation: Buck C, Loyen A, Foraita R, Van Cauwenberg J, De Craemer M, Mac Donncha C, et al. (2019) Factors influencing sedentary behaviour: A system based analysis using Bayesian networks within DEDIPAC. PLoS ONE 14(1): e0211546. https://doi.org/10.1371/journal.pone.0211546 Editor: Maciej S. Buchowski, Vanderbilt University, UNITED STATES Received: April 27, 2018 Accepted: January 16, 2019 Published: January 30, 2019 Copyright: © 2019 Buck et al. This is an open access article distributed under the terms of the Creative Commons Attribution License, which permits unrestricted use, distribution, and reproduction in any medium, provided the original author and source are credited. Data Availability Statement: The data that were used in this study are available from open source databases and can be accessed in the same manner as the authors did. The authors did not have any special access privileges that others would not have. The special Eurobarometer 80.2 can be accessed via http://zacat.gesis.org/ webview/ upon registration. Sources of additional databases can be accessed without registration and found as follows: Eurostat: https://ec.europa. eu/eurostat/data/database NOPA: http://data.euro.
Transcript of Factors influencing sedentary behaviour: A system based ...
RESEARCH ARTICLE
Factors influencing sedentary behaviour: A
system based analysis using Bayesian
networks within DEDIPAC
Christoph BuckID1*, Anne Loyen2, Ronja Foraita1, Jelle Van Cauwenberg3,4, Marieke De
CraemerID5, Ciaran Mac Donncha6, Jean-Michel Oppert7, Johannes Brug8, Nanna Lien9,
Greet Cardon5, Iris Pigeot1,10, Sebastien Chastin5,11, on behalf of the DEDIPAC
consortium
1 Leibniz Institute for Prevention Research and Epidemiology–BIPS, Bremen, Germany, 2 Department of
Public and Occupational Health, Amsterdam Public Health Research Institute, VU University Medical Center,
Amsterdam, Netherlands, 3 Research Foundation Flanders (FWO), Brussels, Belgium, 4 Department of
Public Health, Ghent University, Ghent, Belgium, 5 Department of Movement and Sports Sciences, Ghent
University, Ghent, Belgium, 6 Department of Physical Education and Sport Sciences, University of Limerick,
Limerick, Ireland, 7 Department of Nutrition, University Pierre et Marie Curie, Institute of Cardiometabolism
And Nutrition (ICAN), Pitie-Salpêtrière Hospital (AP-HP), Paris, France, 8 Amsterdam School for
Communication Research, University of Amsterdam, Amsterdam, The Netherlands, 9 Department of
Nutrition, University of Oslo, Oslo, Norway, 10 University of Bremen, Faculty of Mathematics and Computer
Science, Bremen, Germany, 11 Institute for Applied Health Research, School of Health and Life Science,
Glasgow Caledonian University, Glasgow, United Kingdom
¶ Membership of the DEDIPAC consortium can be found in the Acknowledgments
Abstract
Background
Decreasing sedentary behaviour (SB) has emerged as a public health priority since pro-
longed sitting increases the risk of non-communicable diseases. Mostly, the independent
association of factors with SB has been investigated, although lifestyle behaviours are con-
ditioned by interdependent factors. Within the DEDIPAC Knowledge Hub, a system of sed-
entary behaviours (SOS)-framework was created to take interdependency among multiple
factors into account. The SOS framework is based on a system approach and was devel-
oped by combining evidence synthesis and expert consensus. The present study conducted
a Bayesian network analysis to investigate and map the interdependencies between factors
associated with SB through the life-course from large scale empirical data.
Methods
Data from the Eurobarometer survey (80.2, 2013) that included the International physical
activity questionnaire (IPAQ) short as well as socio-demographic information and questions
on perceived environment, health, and psychosocial information were enriched with macro-
level data from the Eurostat database. Overall, 33 factors were identified aligned to the
SOS-framework to represent six clusters on the individual or regional level: 1) physical
health and wellbeing, 2) social and cultural context, 3) built and natural environment, 4) psy-
chology and behaviour, 5) institutional and home settings, 6) policy and economics. A
PLOS ONE | https://doi.org/10.1371/journal.pone.0211546 January 30, 2019 1 / 18
a1111111111
a1111111111
a1111111111
a1111111111
a1111111111
OPEN ACCESS
Citation: Buck C, Loyen A, Foraita R, Van
Cauwenberg J, De Craemer M, Mac Donncha C, et
al. (2019) Factors influencing sedentary behaviour:
A system based analysis using Bayesian networks
within DEDIPAC. PLoS ONE 14(1): e0211546.
https://doi.org/10.1371/journal.pone.0211546
Editor: Maciej S. Buchowski, Vanderbilt University,
UNITED STATES
Received: April 27, 2018
Accepted: January 16, 2019
Published: January 30, 2019
Copyright: © 2019 Buck et al. This is an open
access article distributed under the terms of the
Creative Commons Attribution License, which
permits unrestricted use, distribution, and
reproduction in any medium, provided the original
author and source are credited.
Data Availability Statement: The data that were
used in this study are available from open source
databases and can be accessed in the same
manner as the authors did. The authors did not
have any special access privileges that others
would not have. The special Eurobarometer 80.2
can be accessed via http://zacat.gesis.org/
webview/ upon registration. Sources of additional
databases can be accessed without registration
and found as follows: Eurostat: https://ec.europa.
eu/eurostat/data/database NOPA: http://data.euro.
Bayesian network analysis was conducted to investigate conditional associations among all
factors and to determine their importance within these networks. Bayesian networks were
estimated for the complete (23,865 EU-citizens with complete data) sample and for sex-
and four age-specific subgroups. Distance and centrality were calculated to determine
importance of factors within each network around SB.
Results
In the young (15–25), adult (26–44), and middle-aged (45–64) groups occupational level
was directly associated with SB for both, men and women. Consistently, social class and
educational level were indirectly associated within male adult groups, while in women fac-
tors of the family context were indirectly associated with SB. Only in older adults, factors of
the built environment were relevant with regard to SB, while factors of the home and institu-
tional settings were less important compared to younger age groups.
Conclusion
Factors of the home and institutional settings as well as the social and cultural context were
found to be important in the network of associations around SB supporting the priority for
future research in these clusters. Particularly, occupational status was found to be the main
driver of SB through the life-course. Investigating conditional associations by Bayesian net-
works gave a better understanding of the complex interplay of factors being associated with
SB. This may provide detailed insights in the mechanisms behind the burden of SB to effec-
tively inform policy makers for detailed intervention planning. However, considering the
complexity of the issue, there is need for a more comprehensive system of data collection
including objective measures of sedentary time.
Introduction
Sitting has become the dominant posture in most domains of human activity; including work,
education, transport, and leisure time, gradually displacing most forms of physical activity
over the last fifty years in developed and developing countries [1]. Nowadays people tend to
spend a major part of their waking day sitting with 50% of the European population sitting
more than 6 hours per day and particularly older adults being sedentary in excess of 60% of
their waking day [2, 3]. Activities of daily life that are performed while in a sitting, reclining, or
lying posture and that require little energy expenditure are referred to as sedentary behaviour
(SB) [4, 5]. High levels of SB are associated with an increased risk of major chronic diseases,
loss of independence in later life and premature mortality [6–8].
Consequently, several countries have issued specific recommendations to reduce time
spent in sedentary behaviours at all ages as part of their national public health guidelines for
physical activity [9, 10]. While the main target is to increase the proportion of time individuals
spend in health enhancing moderate-to-vigorous activity, there is evidence that replacing sed-
entary time with even light intensity physical activity incidental to daily living may confer posi-
tive health benefits particularly in the least active segments of the population [11–14].
Understanding the determinants of SB is a necessary step to develop effective interventions
and public health policies to curb the rise in sedentary time and reduce its societal burden.
Bayesian network of factors influencing sedentary behaviour
PLOS ONE | https://doi.org/10.1371/journal.pone.0211546 January 30, 2019 2 / 18
who.int/nopa/ European weather database: https://
www.eswd.eu/.
Funding: This work is supported by the Joint
Programming Initiative ‘Healthy Diet for a Healthy
Life’. The funding agencies supporting this work
are (in alphabetical order of participating Member
States): Belgium (Authors: JVC MDC GC):
Research Foundation - Flanders; France (Author:
JMO): Institut National de la Recherche
Agronomique (INRA); Germany (Author: CB, RF,
IP): Federal Ministry of Education and Research
(01AE1377); Ireland (Author: CMD): The Health
Research Board (HRB); The Netherlands (Author:
AL, JB): The Netherlands Organisation for Health
Research and Development (ZonMw); Norway
(Author: NL): The Research Council of Norway,
Division for Society and Health; The United
Kingdom (Author: SC): The Medical Research
Council (MRC). The publication of this article was
funded by the Open Access Fund of the Leibniz
Association. The funders had no role in study
design, data collection and analysis, decision to
publish, or preparation of the manuscript.
Competing interests: The authors have declared
that no competing interests exist.
Abbreviations: BN, Bayesian network; DEDIPAC,
Determinants of diet and physical activity; EU,
European Union; IDEFICS, Identification and
prevention of Dietary- and lifestyle-induced health
EFfects In Children and infantS; IPAQ, International
physical activity questionnaire; MPA, Moderate
physical activity; MVPA, Moderate to vigorous
physical activity; NOPA, database on Nutrition
Obesity and Physical Activity; PA, Physical activity;
SB, Sedentary behaviour; SOS-framework,
Systems of sedentary behaviour framework; WHO,
World Health Organization; VPA, Vigorous physical
activity.
Recent reviews on the life-course determinants of SB [15–17] highlighted that we know more
about whom such interventions or policies should target than the actual conditions in which
individuals and groups sit for a large part of the waking day. In particular, there is a dearth of
information about distal determinants and the role of the physical, cultural, social, and policy
settings in which people live and work. In addition, it is not clear how determinants at different
levels interact.
The present study was undertaken as part of the DEterminants of DIet and Physical Activity
(DEDIPAC) Knowledge Hub, which was a joint action as part of the European Joint Program-
ming Initiative “A Healthy Diet for a Healthy Life”[18, 19]. In the scope of DEDIPAC, an
international expert consensus and determinant mapping exercise was performed. As a result,
the SOS-framework (Systems of Sedentary Behaviours) was developed as an international
transdisciplinary consensus framework for the study of determinants, research priorities, and
policy on SB across the life-course [20]. The SOS framework is based on a concept mapping
approach focusing on understanding the interrelation between factors affecting SB. It was
developed through combination of evidence synthesis and expert consensus. Concept map-
ping is a standardised mixed method, which combines qualitative opinions with multivariate
statistical analysis to enable a group to gather and organise ideas into a conceptual framework.
As part of the concept mapping approach, factors related to SB were clustered into six different
clusters named psychology and behaviour, institutional and home settings (e.g. educational
level, social class, or wealth), physical health and wellbeing (e.g. life satisfaction), built and nat-
ural environment (e.g. access to green spaces, recreational facilities, transport infrastructures),
social and cultural context (e.g. migration background or household size), and politics and
economics (e.g. car use or GDP). Eventually, a consensus was built to set priority for future
research. Voting on the presented clusters resulted in a 92% consensus that was obtained on a
ranking setting factors related to the home and institutional settings to the first priority. From
this framework, it was concluded that understanding the complex interplay between determi-
nants is key to identify potential levers for change [19, 20].
Since classical statistical models are not able to reflect complex association structures more
recent approaches have to be applied. In this respect, Bayesian network modelling is an appro-
priate tool that allows to model complex interactions of factors in terms of direct and indirect
conditional independencies. Bayesian networks (BNs) represent probabilistic models and are
widely used in epidemiology [21], healthcare [22], and intervention planning [23]. In particu-
lar, BNs have been successfully used to understand the determinants of obesity [24] and active
transport [25] beside the complex causal pathway of diseases [26]. Thus, the aim of this study
was to exploit BNs to show how interdependencies between factors particularly associated
with SB through the life-course can be comprehensively investigated and mapped based on
large scale empirical data.
Methods
Study data
The analysis was based on data of the Eurobarometer survey and additional databases. The
Eurobarometer is a biannual cross-sectional survey, organised on behalf of the European Com-
mission, covering about 1,000 participants per EU Member State. Sampling and instruments
are described elsewhere [27]. For this particular study, data of the Eurobarometer wave 80.2
was used, which was conducted in the 28 EU Member States in 2013. This particular survey
included the special Eurobarometer 412 “Sport and physical activity”, including questions on
socio-demographic factors, lifestyle behaviours, and the International Physical Activity Ques-
tionnaire (IPAQ) short version [28] to assess time spent active and time spent sitting. The
Bayesian network of factors influencing sedentary behaviour
PLOS ONE | https://doi.org/10.1371/journal.pone.0211546 January 30, 2019 3 / 18
European Commission approved the study protocols and informed consent was obtained
from all participants. The information was anonymised and de-identified prior to the access to
the data.
In addition, data from the Eurostat database (ec.europa.eu/eurostat), the database on Nutri-
tion Obesity and Physical Activity (NOPA, data.euro.who.int/nopa) of the WHO and the
European weather database (www.climatedata.eu) were selected to add further information on
macro-level variables considering country or within country regions [29, 30].
Overall, 34 variables, including age and sex, were selected aligned to the SOS-framework
[20]. Variables are described below per cluster of the SOS-framework. They were operationa-
lised either as binary or as ordered factors to avoid small numbers or missing values within cat-
egories in the analyses stratified according to sex and age.
Psychology and behaviour. The Eurobarometer assessed sitting time on a usual day using
the IPAQ short providing ten response categories ranging from 1h or less up to more than 8h
30min. To obtain more balanced samples within each category, sitting time was collapsed into
four categories for our analyses, i.e. ‘1h or less up to 2h 30min’ (1), ‘2h 31min up to 4h 30min’
(2), ‘4h 31min up to 7h 30min’ (3), and ‘7h 31min up to 8h 30min or more’ (4).
Physical activity (PA) was calculated from reported moderate and vigorous physical activity
in the Eurobarometer survey. Information on active days per week and active time per day was
collapsed into minutes per week spent in moderate (MPA) or vigorous physical activity
(VPA), respectively. PA was categorised as ‘inactive’ (0) for reporting 0 minutes per week of
either MPA or VPA per week, ‘low active’ (1) if MPA was lower than 150 minutes and VPA
was lower than 75 minutes per week, ‘sufficiently active’ (2) for MPA equal or higher than 150
minutes per week or VPA equal or higher than 75 minutes per week, and as ‘highly active’ (3)
if MPA was equal or higher than 150 minutes per week and VPA was equal or higher than 75
minutes per week.
Life satisfaction was derived from a four-point Likert scale in the Eurobarometer question-
ing “On the whole, how satisfied or not are you with the life you lead?” and responses (very,
fairly, not very, not at all) were dichotomised as ‘satisfied’ (very or fairly; 1) or ‘not satisfied’
(not very or not at all; 0).
In addition, internet use (netuse) was calculated from three questions on internet usage in
the Eurobarometer, either at home, at work, or somewhere else. For each of the three locations,
six reported categories ranging from ‘everyday’ to ‘about once a week’ were collapsed to three,
i.e. ‘everyday’ (2), ‘two or three times per month’ or ‘less often’ (1), and never/no access (0).
The highest frequency of one of the three locations was used as the variable netuse.
Institutional and home settings. Occupational level was derived from the reported cur-
rent occupation (18 response categories) and condensed into eight categories; ‘self-employed’
(1), ‘employed professional or management’ (2), ‘employed position working at desk or travel-
ling’ (3), ‘employed position in service, or skilled or unskilled manual worker’ (4), ‘currently
unemployed and responsible for household’ (5), ‘unemployed and not working’ (6), ‘retired or
unable to work’ (7), ‘student’ (8).
Categories for educational level were built from the age at which the participant reported to
have stopped full time education as follows: ‘15 years old or younger’ (1), ‘16 to 19 years old’
(2), ‘20 years old or older’ (3).
Perceived social class was derived from three answer categories, i.e. ‘working class’, ‘middle
class’, and ‘higher class of society´ based on the question “Do you see yourself and your house-
hold belonging to. . .?” To balance the answer categories, social class was comprised to two cat-
egories, i.e. ‘working class’ (0), and ‘middle and higher class’ (1).
Financial burden was taken from responses to the question “During the last twelve months,
how often have you had difficulties in paying your bills at the end of the month. . .?”. We
Bayesian network of factors influencing sedentary behaviour
PLOS ONE | https://doi.org/10.1371/journal.pone.0211546 January 30, 2019 4 / 18
dichotomised answer categories as yes (1) for ‘most of the time’, and ‘occasionally’, and no (0)
for ‘almost never / never’.
In addition, participants answered yes / no on a list of things they own, e.g. car, television
or flat / house, following the question “Which of the following things do you have? “. From
this question, we categorised wealth as follows: ‘owning a flat / a house which you have finished
paying for’ (2), ‘owning a flat / a house which you are still paying for’ (1), ‘none of the above’
(0); ‘owning a computer’ or owning an internet connection (yes / no) were also selected as var-
iables (computer, internet) from this list and used as factors in the system of institutional and
home settings.
From the Eurostat database, the percentage of internet users per country, who were active
social media users on a monthly basis, were used for the analysis. We dichotomised the socialmedia penetration as above EU average (1) or below (0).
Physical health and wellbeing. The Eurobarometer assessed perceived quality of health-care based on a four-point Likert scale, i.e. very good, fairly good, fairly bad, and very bad, ask-
ing “How would you evaluate the overall quality of healthcare in your country? “. We
dichotomised this scale into ‘good’ (very or fairly good; 1) and ‘bad’ (fairly or very bad; 0).
From the Eurostat database, number of healthcare personnel per 100.000 inhabitants was
collected on a regional level (NUTS2) and categorised into tertiles to include the factor health-care provision in our analysis. In addition, country level prevalence of chronic diseases was
obtained from the same source and categorised as ‘above average’ (1) and ‘below average’ (0).
Built and natural environment. Level of urbanity was reported by the Eurobarometer
participants as living in a ‘rural area or village’ (1), ‘small or medium-sized town’ (2), or living
in a ‘large town or city’ (3).
Participants also reported their agreement on a four-point Likert scale on statements about
perceived recreational facilities in the neighbourhood, i.e. “The area where you live offers you
many opportunities to be physically active“, or “Local sports clubs and other local providers
offer many opportunities to be physically active“. Perceived availability of facilities (facility)
was categorised as ‘high’ (1), if participants agreed (tend to agree or totally agreed) on one of
these statements, and ‘low’ (0), if they disagreed (tend to disagree or totally disagreed) to both
statements. Moreover, a statement about perceived municipal support (municipality), i.e.
“Your local authority does not do enough for its citizens in relation to physical activeness“,
was dichotomised into ‘high’ (1) or ‘low’ (0) as explained above.
European region was categorised according to the geographical regions defined by WHO
based on the country in which the participants actually lived. ISO country codes were used to
define countries as ‘western or central’ (1), ‘southern’ (2), ‘northern’ (3), or ‘eastern’ (4) regions
in Europe.
Data on daily rainfall (precipitation) and temperature in the year of the survey (2013) was
collected from the National and European weather database (e.g. [28]). Maximum annual
average temperature was categorised into ‘hot’ (> 15˚ Celsius), ‘moderate’ (10–15˚ Celsius) or
‘cold’ (<10˚ Celsius). In addition, average daily precipitation per day was categorised as ‘dry’
(<0.2mm/day), ‘moderate’ (0.2 – 2mm/day), or ‘wet’ (>2mm/day). Both, temperature and
precipitation were aligned to the Eurobarometer using the NUTS2 coding of regions within
countries.
Social and cultural context. Participants of the Eurobarometer reported on relationship
status and number of people within the household. Household size was derived by the reported
‘number of children younger than 10 years’, ‘number of children aged 10 to 14’, and ‘number
of people aged 15 years or older’ who live within the same household, and was categorised as 0,
1, 2, and 3 or more. Having a partner and having children was derived as a binary factor from
14 different possible answer categories for the current situation of the relationship, e.g.
Bayesian network of factors influencing sedentary behaviour
PLOS ONE | https://doi.org/10.1371/journal.pone.0211546 January 30, 2019 5 / 18
‘married (or remarried) and living without children’ (or ‘living with the child of a previous
marriage’) or ‘single and living with children’ (or ‘single living without children’) etc.
Club membership of health or fitness centres, sports clubs, socio-cultural clubs including
sport activities, or other clubs, was categorised as ‘yes’ (1) / ‘no’ (0) for any confirmation of the
question “Are you a member of any of the following clubs where you participate in sport or
recreational physical activity”.
To identify migration status of EU citizens, we considered the mismatch between the
nationality of the participant of the Eurobarometer and the EU-country the survey and catego-
rised as ‘yes’ (1) or ‘no’ (0). Since the Eurobarometer only includes EU-citizens, this factor
reflects EU-migration. Information from non-EU citizens was not collected by the
Eurobarometer.
Politics and economics. Car ownership (‘yes’ (1)/’no’ (0)) was selected from the list of
belongings that Eurobarometer participants reported to own.
On the country level, the availability of policies on SB (SB guidelines, ‘yes’ (1) / ‘no’ (0)),
physical activity (PA guidelines, ‘yes’(1) / ‘no’ (0)) and public transportation (Transport policy,
‘yes’ (1) / ‘no’ (0)) was collected from the European databases on Nutrition, Obesity and Physi-
cal Activity (NOPA) of the WHO, that provides information on national and subnational pol-
icy development. Additionally, the Eurostat database was used to add GDP on a regional level
(NUTS2 subcountry regions) which was categorised into tertiles.
Study sample. The Eurobarometer provided data on 27,919 participants aged 15 and
older from 28 European countries. Observations with missing values in any of the 33 variables
were excluded, resulting in a total study sample of 23,865 observations. We did not identify
any indication for systematic missing mechanisms. Thus, we assumed the data to be missing at
random (MAR). However, regional level data (e.g. policy availability or healthcare provision
on the NUTS2 subcountry level were not available for Malta (n = 500). Hence, our study was
conducted for 27 European countries only. We arbitrarily divided the sample into eight strata
based on sex and four age categories, i.e. young (15–25), adults (26–44), middle-aged (45–64),
and older adults (65+) in order to account for differences in associations between sexes and
over the life-course.
Statistical analyses. A Bayesian network (BN) was fitted for the overall study sample as
well as for each sex- and age-specific stratum. A BN is a probabilistic model that represents a
set of random variables and their conditional independencies via a directed acyclic graph
(DAG). A DAG consists of nodes and edges where nodes represent the factors and edges
between nodes describe the dependence structure. BNs allow to model conditional dependen-
cies between variables and to capture multicollinearity between variables [31–33].
Since SB and PA are highly collinear [12] we did not consider PA for the final analysis to
avoid the BNs being dominated by this well-known relationship and to enable the algorithm to
find potential, less studied relationships among the 32 factors instead. However, BNs were re-
calculated including PA (considering 33 variables) as sensitivity analysis using the same
algorithm.
We applied a hybrid algorithm to identify the topology of a BN that comprises conditional
independence tests and network scores [34]. The technical details of the applied methods can
be found as supplementary material (see S1 Annex). We used a bootstrap resampling approach
to estimate the stability of edges for the entire study sample and each sex- and age-stratum
[35]. The complete dataset as well as each of the strata were replicated 1,000 times as part of a
random resampling with replacement. For each replication a BN was fitted and for each origi-
nal dataset (and the strata) replications were condensed to an average network. Stability of any
edge was defined as the percentage of the 1,000 BNs in which the edge was found. Edges that
were found in at least 40% of the replicated BNs were considered for the average BN. This
Bayesian network of factors influencing sedentary behaviour
PLOS ONE | https://doi.org/10.1371/journal.pone.0211546 January 30, 2019 6 / 18
threshold was chosen to be less conservative in the inclusion of edges in the final average BNs.
With regard to the self-reported dataset and the lack of detail in some of the variables, we
increased the chance of more false positive associations on purpose in the attempt to provide
more insights into possible associations between the considered factors [33]. In addition,
results will be only presented as undirected graphs to avoid misinterpretation of edges as causal
relationships of factors.
Importance and distance of nodes and their respective clusters were identified by comput-
ing network statistics such as network denseness and weighted betweenness centrality (see S1
Annex). Here, weighted betweenness centrality was only calculated for the subgraph of nodes
that are linked to SB and weighted considering the bootstrap stability of edges [33]. Distance
to SB was used to identify important factors within the BNs and was calculated as the number
of edges by which any factor was linked to SB (see S1 Annex). We aggregated this information
for each cluster of factors aligned from the SOS-framework in terms of average distance to SB
[32].
All analyses were conducted in R using the bnlearn package (4.0) [31] in R (3.3.0) [36] to
derive the BNs. Network statistics were calculated using the igraph package (1.01) [37].
Results
Table 1 presents sample sizes and network statistics for all resulting networks of the whole
sample and of all sex- and age-specific strata. The sample was almost sex-balanced with more
participants in the age groups from 26 to 44 and 45 to 64 years. Network denseness for the
whole study sample was 16.9% between the 32 nodes including age and sex. Network dense-
ness of sex- and age-specific strata considering 30 variables were lower and varied between
6.7% and 12.4% with more associations found in the two middle-age groups than in the youn-
gest and oldest age groups. Study characteristics of the study sample and each stratum, with
regard to all 33 variables, are presented as supplementary material in S1 Table. Mean distance
of factors within clusters of the SOS-framework is also presented in Table 1, while distance of
each factor to SB is presented in detail in S2 Table as supplementary material.
The graph of the complete sample is presented in Fig 1. The graph indicates the clusters of
factors of the SOS- framework following the attached colour scheme. Edges in red reveal the
direct (first) and indirect (second) association of nodes, i.e. factors, with SB. In addition, width
of edges indicates the stability of the association as strong (association found in 70% to 100%
of bootstrap replications) or weak (association found in 40% to 70% of bootstrap replications).
The graph shows a very complex web of interactions among factors (Fig 1). However, it
looks as if the whole BN graph can be decomposed into two parts. Several direct and indirect
associations with SB were found via different pathways (see Fig 1). Occupational level, finan-
cial burden, wealth, urbanity, European region, and GDP were directly related to SB, while
multiple factors of the institutional and home setting as well as the social and cultural context
were indirectly linked to SB. Weighted betweenness centrality of nodes revealed that GDP was
the most important node supporting most of the network paths followed by region (Table 1).
Clusters of institutional and home setting as well as the built and natural environment showed
the most direct associations with SB.
Networks for the various sex- and age-specific strata are provided as supplementary mate-
rial (see S1 to S8 Figs). To understand the sex differences and changes in their associations
among factors over the life-course, subgraphs of the networks for males and females are pre-
sented in the manuscript including only nodes that are associated with SB via two edges at
most (see Fig 2A and 2B to Fig 5A and 5B). The networks differ in complexity over the life-
course depending on age and sex.
Bayesian network of factors influencing sedentary behaviour
PLOS ONE | https://doi.org/10.1371/journal.pone.0211546 January 30, 2019 7 / 18
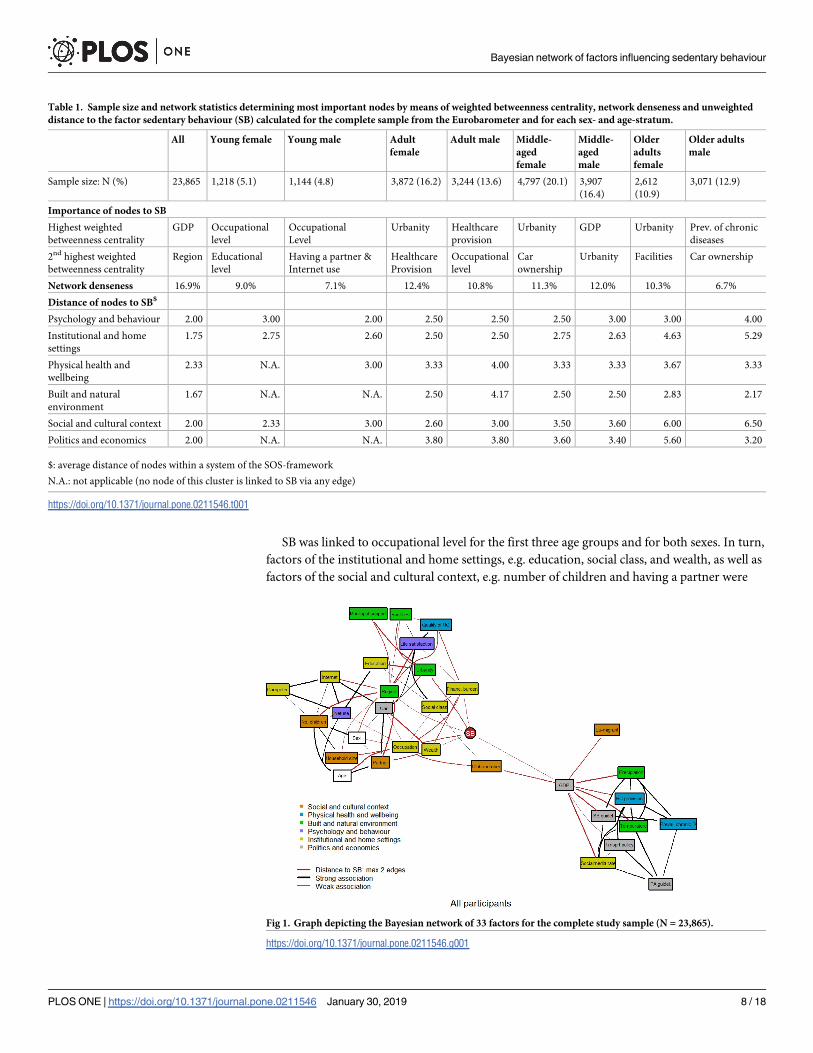
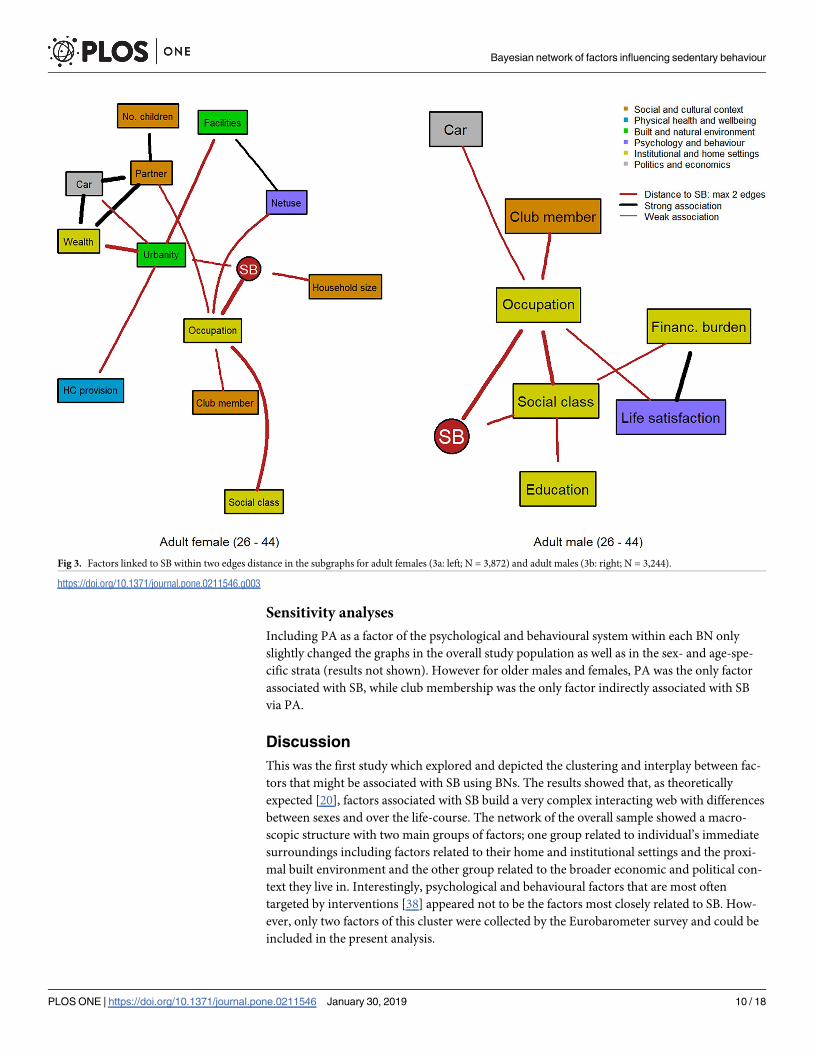
SB was linked to occupational level for the first three age groups and for both sexes. In turn,
factors of the institutional and home settings, e.g. education, social class, and wealth, as well as
factors of the social and cultural context, e.g. number of children and having a partner were
Table 1. Sample size and network statistics determining most important nodes by means of weighted betweenness centrality, network denseness and unweighted
distance to the factor sedentary behaviour (SB) calculated for the complete sample from the Eurobarometer and for each sex- and age-stratum.
All Young female Young male Adult
female
Adult male Middle-
aged
female
Middle-
aged
male
Older
adults
female
Older adults
male
Sample size: N (%) 23,865 1,218 (5.1) 1,144 (4.8) 3,872 (16.2) 3,244 (13.6) 4,797 (20.1) 3,907
(16.4)
2,612
(10.9)
3,071 (12.9)
Importance of nodes to SB
Highest weighted
betweenness centrality
GDP Occupational
level
Occupational
Level
Urbanity Healthcare
provision
Urbanity GDP Urbanity Prev. of chronic
diseases
2nd highest weighted
betweenness centrality
Region Educational
level
Having a partner &
Internet use
Healthcare
Provision
Occupational
level
Car
ownership
Urbanity Facilities Car ownership
Network denseness 16.9% 9.0% 7.1% 12.4% 10.8% 11.3% 12.0% 10.3% 6.7%
Distance of nodes to SB$
Psychology and behaviour 2.00 3.00 2.00 2.50 2.50 2.50 3.00 3.00 4.00
Institutional and home
settings
1.75 2.75 2.60 2.50 2.50 2.75 2.63 4.63 5.29
Physical health and
wellbeing
2.33 N.A. 3.00 3.33 4.00 3.33 3.33 3.67 3.33
Built and natural
environment
1.67 N.A. N.A. 2.50 4.17 2.50 2.50 2.83 2.17
Social and cultural context 2.00 2.33 3.00 2.60 3.00 3.50 3.60 6.00 6.50
Politics and economics 2.00 N.A. N.A. 3.80 3.80 3.60 3.40 5.60 3.20
$: average distance of nodes within a system of the SOS-framework
N.A.: not applicable (no node of this cluster is linked to SB via any edge)
https://doi.org/10.1371/journal.pone.0211546.t001
Fig 1. Graph depicting the Bayesian network of 33 factors for the complete study sample (N = 23,865).
https://doi.org/10.1371/journal.pone.0211546.g001
Bayesian network of factors influencing sedentary behaviour
PLOS ONE | https://doi.org/10.1371/journal.pone.0211546 January 30, 2019 8 / 18
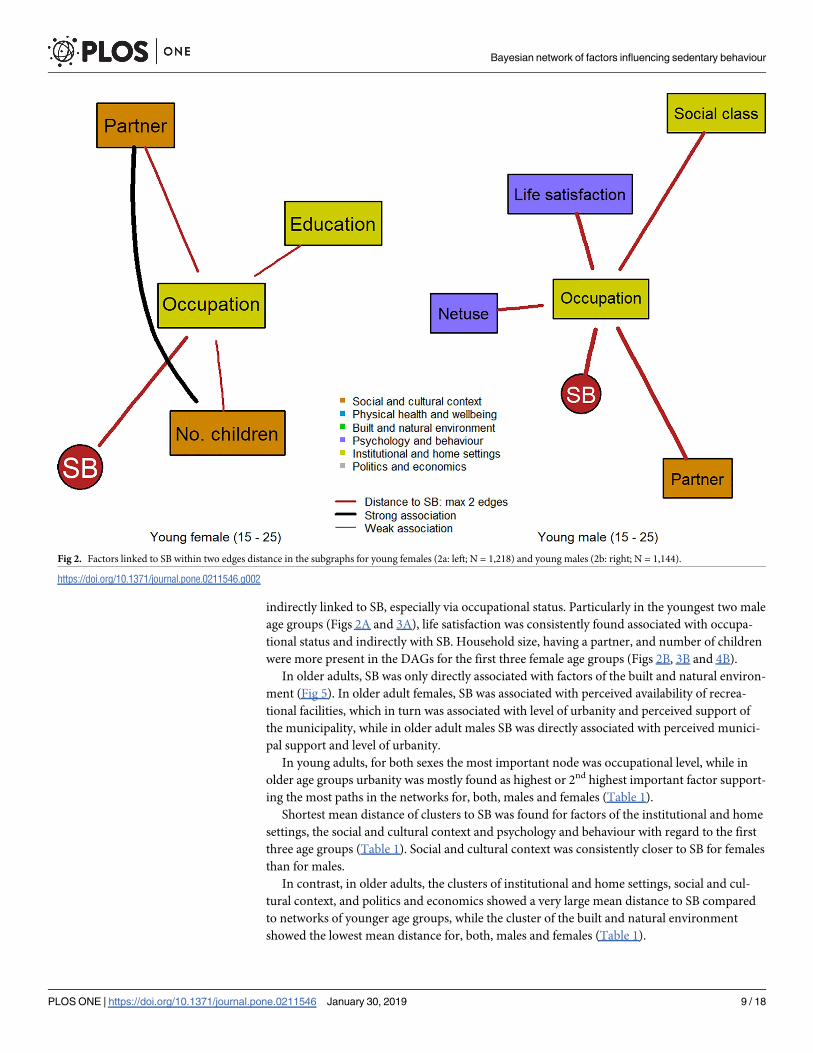
indirectly linked to SB, especially via occupational status. Particularly in the youngest two male
age groups (Figs 2A and 3A), life satisfaction was consistently found associated with occupa-
tional status and indirectly with SB. Household size, having a partner, and number of children
were more present in the DAGs for the first three female age groups (Figs 2B, 3B and 4B).
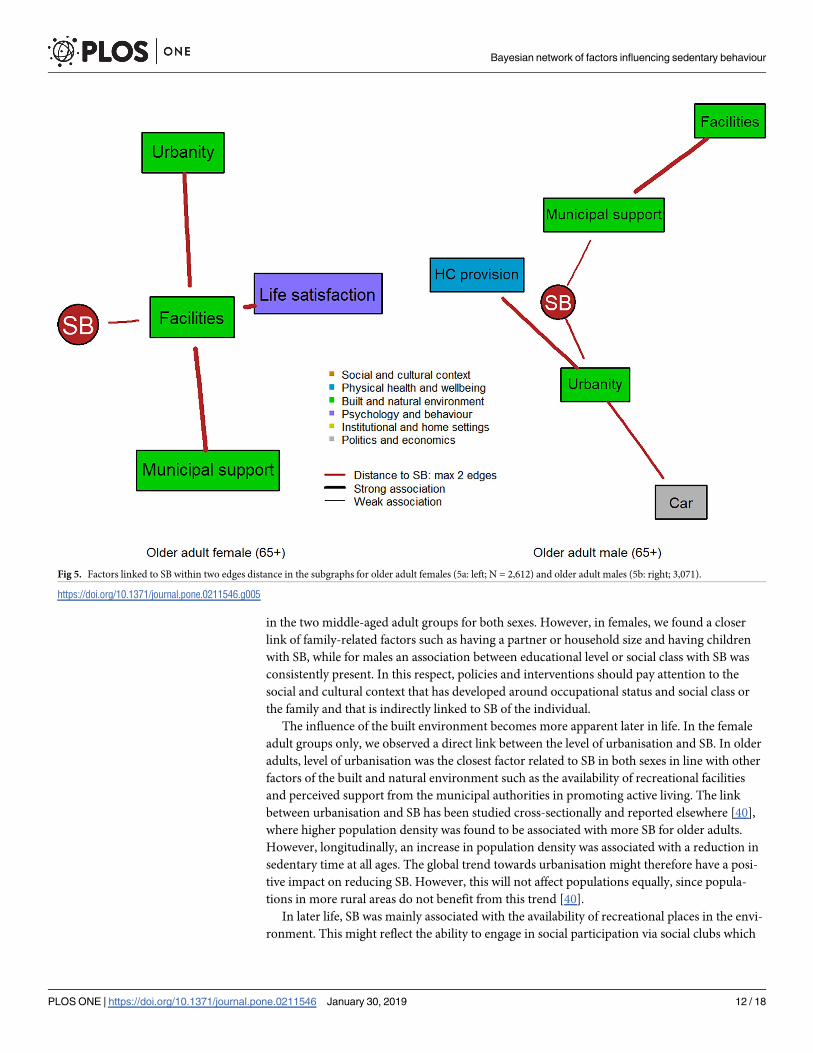
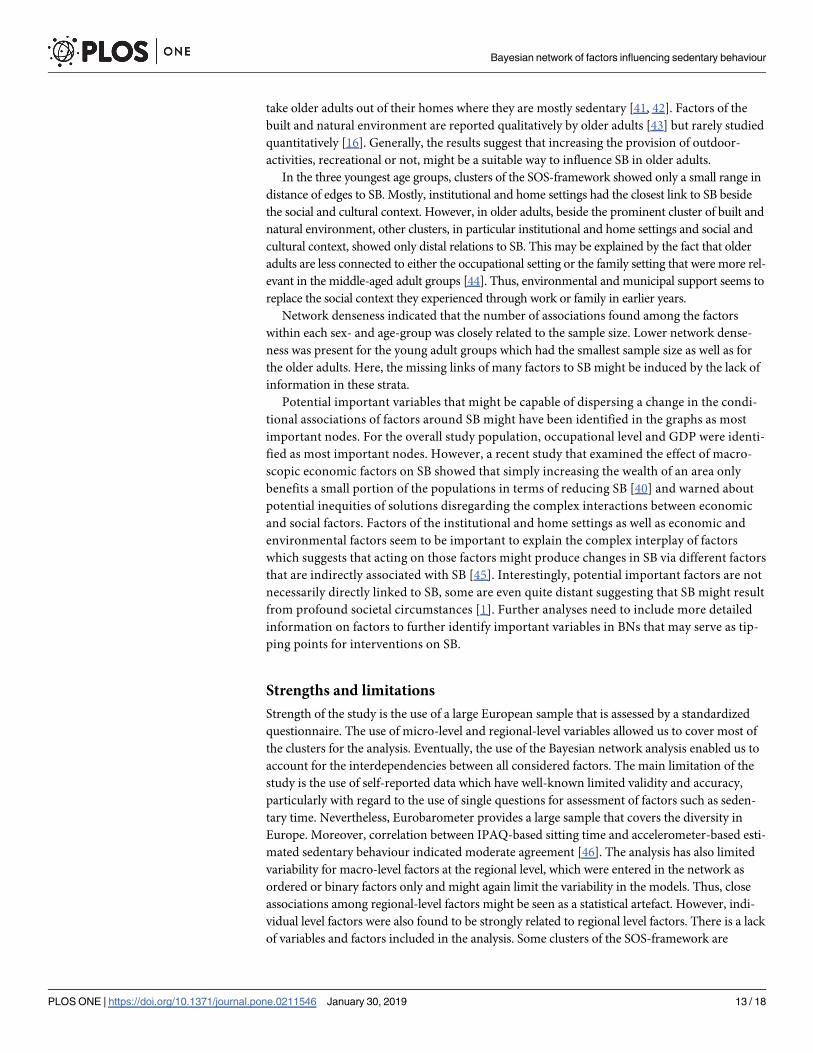
In older adults, SB was only directly associated with factors of the built and natural environ-
ment (Fig 5). In older adult females, SB was associated with perceived availability of recrea-
tional facilities, which in turn was associated with level of urbanity and perceived support of
the municipality, while in older adult males SB was directly associated with perceived munici-
pal support and level of urbanity.
In young adults, for both sexes the most important node was occupational level, while in
older age groups urbanity was mostly found as highest or 2nd highest important factor support-
ing the most paths in the networks for, both, males and females (Table 1).
Shortest mean distance of clusters to SB was found for factors of the institutional and home
settings, the social and cultural context and psychology and behaviour with regard to the first
three age groups (Table 1). Social and cultural context was consistently closer to SB for females
than for males.
In contrast, in older adults, the clusters of institutional and home settings, social and cul-
tural context, and politics and economics showed a very large mean distance to SB compared
to networks of younger age groups, while the cluster of the built and natural environment
showed the lowest mean distance for, both, males and females (Table 1).
Fig 2. Factors linked to SB within two edges distance in the subgraphs for young females (2a: left; N = 1,218) and young males (2b: right; N = 1,144).
https://doi.org/10.1371/journal.pone.0211546.g002
Bayesian network of factors influencing sedentary behaviour
PLOS ONE | https://doi.org/10.1371/journal.pone.0211546 January 30, 2019 9 / 18
Sensitivity analyses
Including PA as a factor of the psychological and behavioural system within each BN only
slightly changed the graphs in the overall study population as well as in the sex- and age-spe-
cific strata (results not shown). However for older males and females, PA was the only factor
associated with SB, while club membership was the only factor indirectly associated with SB
via PA.
Discussion
This was the first study which explored and depicted the clustering and interplay between fac-
tors that might be associated with SB using BNs. The results showed that, as theoretically
expected [20], factors associated with SB build a very complex interacting web with differences
between sexes and over the life-course. The network of the overall sample showed a macro-
scopic structure with two main groups of factors; one group related to individual’s immediate
surroundings including factors related to their home and institutional settings and the proxi-
mal built environment and the other group related to the broader economic and political con-
text they live in. Interestingly, psychological and behavioural factors that are most often
targeted by interventions [38] appeared not to be the factors most closely related to SB. How-
ever, only two factors of this cluster were collected by the Eurobarometer survey and could be
included in the present analysis.
Fig 3. Factors linked to SB within two edges distance in the subgraphs for adult females (3a: left; N = 3,872) and adult males (3b: right; N = 3,244).
https://doi.org/10.1371/journal.pone.0211546.g003
Bayesian network of factors influencing sedentary behaviour
PLOS ONE | https://doi.org/10.1371/journal.pone.0211546 January 30, 2019 10 / 18
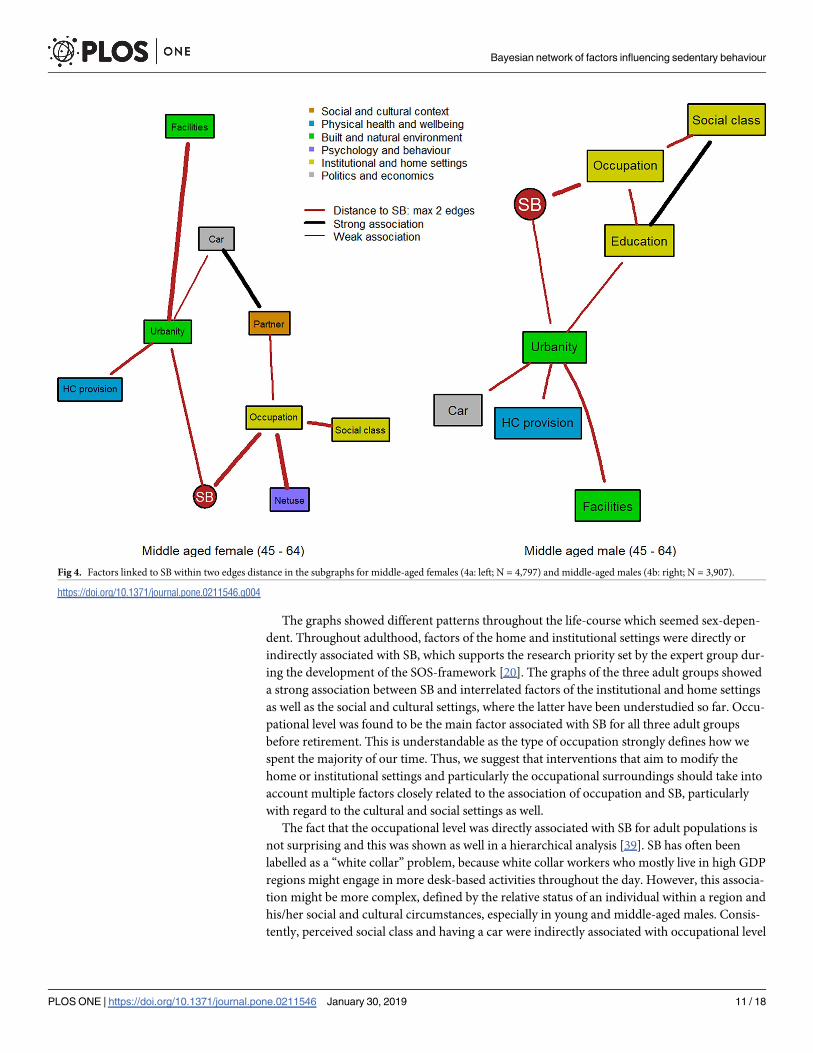
The graphs showed different patterns throughout the life-course which seemed sex-depen-
dent. Throughout adulthood, factors of the home and institutional settings were directly or
indirectly associated with SB, which supports the research priority set by the expert group dur-
ing the development of the SOS-framework [20]. The graphs of the three adult groups showed
a strong association between SB and interrelated factors of the institutional and home settings
as well as the social and cultural settings, where the latter have been understudied so far. Occu-
pational level was found to be the main factor associated with SB for all three adult groups
before retirement. This is understandable as the type of occupation strongly defines how we
spent the majority of our time. Thus, we suggest that interventions that aim to modify the
home or institutional settings and particularly the occupational surroundings should take into
account multiple factors closely related to the association of occupation and SB, particularly
with regard to the cultural and social settings as well.
The fact that the occupational level was directly associated with SB for adult populations is
not surprising and this was shown as well in a hierarchical analysis [39]. SB has often been
labelled as a “white collar” problem, because white collar workers who mostly live in high GDP
regions might engage in more desk-based activities throughout the day. However, this associa-
tion might be more complex, defined by the relative status of an individual within a region and
his/her social and cultural circumstances, especially in young and middle-aged males. Consis-
tently, perceived social class and having a car were indirectly associated with occupational level
Fig 4. Factors linked to SB within two edges distance in the subgraphs for middle-aged females (4a: left; N = 4,797) and middle-aged males (4b: right; N = 3,907).
https://doi.org/10.1371/journal.pone.0211546.g004
Bayesian network of factors influencing sedentary behaviour
PLOS ONE | https://doi.org/10.1371/journal.pone.0211546 January 30, 2019 11 / 18
in the two middle-aged adult groups for both sexes. However, in females, we found a closer
link of family-related factors such as having a partner or household size and having children
with SB, while for males an association between educational level or social class with SB was
consistently present. In this respect, policies and interventions should pay attention to the
social and cultural context that has developed around occupational status and social class or
the family and that is indirectly linked to SB of the individual.
The influence of the built environment becomes more apparent later in life. In the female
adult groups only, we observed a direct link between the level of urbanisation and SB. In older
adults, level of urbanisation was the closest factor related to SB in both sexes in line with other
factors of the built and natural environment such as the availability of recreational facilities
and perceived support from the municipal authorities in promoting active living. The link
between urbanisation and SB has been studied cross-sectionally and reported elsewhere [40],
where higher population density was found to be associated with more SB for older adults.
However, longitudinally, an increase in population density was associated with a reduction in
sedentary time at all ages. The global trend towards urbanisation might therefore have a posi-
tive impact on reducing SB. However, this will not affect populations equally, since popula-
tions in more rural areas do not benefit from this trend [40].
In later life, SB was mainly associated with the availability of recreational places in the envi-
ronment. This might reflect the ability to engage in social participation via social clubs which
Fig 5. Factors linked to SB within two edges distance in the subgraphs for older adult females (5a: left; N = 2,612) and older adult males (5b: right; 3,071).
https://doi.org/10.1371/journal.pone.0211546.g005
Bayesian network of factors influencing sedentary behaviour
PLOS ONE | https://doi.org/10.1371/journal.pone.0211546 January 30, 2019 12 / 18
take older adults out of their homes where they are mostly sedentary [41, 42]. Factors of the
built and natural environment are reported qualitatively by older adults [43] but rarely studied
quantitatively [16]. Generally, the results suggest that increasing the provision of outdoor-
activities, recreational or not, might be a suitable way to influence SB in older adults.
In the three youngest age groups, clusters of the SOS-framework showed only a small range in
distance of edges to SB. Mostly, institutional and home settings had the closest link to SB beside
the social and cultural context. However, in older adults, beside the prominent cluster of built and
natural environment, other clusters, in particular institutional and home settings and social and
cultural context, showed only distal relations to SB. This may be explained by the fact that older
adults are less connected to either the occupational setting or the family setting that were more rel-
evant in the middle-aged adult groups [44]. Thus, environmental and municipal support seems to
replace the social context they experienced through work or family in earlier years.
Network denseness indicated that the number of associations found among the factors
within each sex- and age-group was closely related to the sample size. Lower network dense-
ness was present for the young adult groups which had the smallest sample size as well as for
the older adults. Here, the missing links of many factors to SB might be induced by the lack of
information in these strata.
Potential important variables that might be capable of dispersing a change in the condi-
tional associations of factors around SB might have been identified in the graphs as most
important nodes. For the overall study population, occupational level and GDP were identi-
fied as most important nodes. However, a recent study that examined the effect of macro-
scopic economic factors on SB showed that simply increasing the wealth of an area only
benefits a small portion of the populations in terms of reducing SB [40] and warned about
potential inequities of solutions disregarding the complex interactions between economic
and social factors. Factors of the institutional and home settings as well as economic and
environmental factors seem to be important to explain the complex interplay of factors
which suggests that acting on those factors might produce changes in SB via different factors
that are indirectly associated with SB [45]. Interestingly, potential important factors are not
necessarily directly linked to SB, some are even quite distant suggesting that SB might result
from profound societal circumstances [1]. Further analyses need to include more detailed
information on factors to further identify important variables in BNs that may serve as tip-
ping points for interventions on SB.
Strengths and limitations
Strength of the study is the use of a large European sample that is assessed by a standardized
questionnaire. The use of micro-level and regional-level variables allowed us to cover most of
the clusters for the analysis. Eventually, the use of the Bayesian network analysis enabled us to
account for the interdependencies between all considered factors. The main limitation of the
study is the use of self-reported data which have well-known limited validity and accuracy,
particularly with regard to the use of single questions for assessment of factors such as seden-
tary time. Nevertheless, Eurobarometer provides a large sample that covers the diversity in
Europe. Moreover, correlation between IPAQ-based sitting time and accelerometer-based esti-
mated sedentary behaviour indicated moderate agreement [46]. The analysis has also limited
variability for macro-level factors at the regional level, which were entered in the network as
ordered or binary factors only and might again limit the variability in the models. Thus, close
associations among regional-level factors might be seen as a statistical artefact. However, indi-
vidual level factors were also found to be strongly related to regional level factors. There is a lack
of variables and factors included in the analysis. Some clusters of the SOS-framework are
Bayesian network of factors influencing sedentary behaviour
PLOS ONE | https://doi.org/10.1371/journal.pone.0211546 January 30, 2019 13 / 18
underrepresented, particularly the behavioural and psychological cluster, which means that the
graphs miss latent information about individual motivations and other unmeasured
confounders.
Implication and use of the networks
The graphs of the BNs provide an empirical validation of the SOS-framework [20]. In this
study, the graphs showed a complex interplay of factors around SB and while SB was directly
related to only few factors such as occupation and urbanisation these were in turn linked to a
complex network of conditional associations with other factors. Based on longitudinal data,
the graphs can be useful tools to understand the societal changes that have led to an increase in
sedentary time throughout society [1]. Considering cohort data that provide more reliable or
preferably objective measures for BN analyses can shed more light on the dynamics of the
interrelation of factors around SB and changes in these relationships over the life-course [19].
For example the cohort that was built up by the IDEFICS and I.Family studies [47] incorpo-
rated a standardised protocol to collect objective and self-reported data in European children
during their transition to adolescence. Such harmonised studies including an extensive survey
programme to collect data of objective and reliable measures about behavioural determinants
of lifestyle-related diseases need to be promoted on a pan-European level [19].
Building on more complex data, BNs allow for a more detailed interpretation with regard
to the graphical assessment of time series, and the assessment of graphs through temporal cen-
trality measures [48]. In addition, the graphs might be suitable to incorporate agent-based
computer simulations and scenario-based forecasting [49] to find solutions to decrease seden-
tary behaviour on a population level by studying the propagation of the potential effect of
interventions on different factors. Eventually, BNs provide an extensive analysis of the com-
plexity of factors. Resulting networks can guide interventions and policies to target several fac-
tors concurrently while communicating this effectively to policy and decision makers.
Conclusion
The BN approach provides important insights into the complex interplay of factors related to
SB. Aligned to the SOS-framework, this study presents consistent findings of factors related to
the home and institutional settings as well as to the social and cultural context clustering around
SB and supports the research priorities for these factors. Considering the complexity of the
issue, there is need for a more comprehensive system of data collection including objective mea-
sures of sedentary time and a multilevel assessment of lifestyle-related factors in these clusters.
Ethics approval and consent to participate
The European Commission approved study protocols of the Eurobarometer 80.2 (2013) and
informed consent was obtained from all participants. The information was anonymised and
de-identified prior to the access to the data.
Supporting information
S1 Annex. Technical Annex: Description of theory of Bayesian networks and methods for
statistical analyses.
(PDF)
S1 Table. Study characteristics and number of participants (N/%) per category for each
variable included in the Bayesian network analysis.
(DOCX)
Bayesian network of factors influencing sedentary behaviour
PLOS ONE | https://doi.org/10.1371/journal.pone.0211546 January 30, 2019 14 / 18
S2 Table. Distance to SB of each factor within corresponding BN.
(DOCX)
S1 Fig. Graph of young females (16–25 years, N = 1,218).
(TIFF)
S2 Fig. Graph of young males (16–25 years, N = 1,144).
(TIFF)
S3 Fig. Graph of adult females (26–44 years, N = 3,872).
(TIFF)
S4 Fig. Graph of adult males (26–44 years, N = 3,244).
(TIFF)
S5 Fig. Graph of middle-aged females (45–64 years, N = 4,797).
(TIFF)
S6 Fig. Graph of middle-aged males (45–64 years, N = 3,907).
(TIFF)
S7 Fig. Graph of older adult females (65+ years, N = 2,612).
(TIFF)
S8 Fig. Graph of older adult males (65+ years, N = 3,071).
(TIFF)
Acknowledgments
The authors thank Lien N, Lakerveld J, Mazzocchi M, O’Gorman D, Monsivais P, Nicolaou M,
Renner B, Volkert D, and the DEDIPAC-KH Management team for their helpful support. The
publication of this article was funded by the Open Access Fund of the Leibniz Association.
Author Contributions
Conceptualization: Christoph Buck, Jean-Michel Oppert, Greet Cardon, Sebastien Chastin.
Data curation: Christoph Buck, Anne Loyen, Jelle Van Cauwenberg, Marieke De Craemer,
Jean-Michel Oppert, Sebastien Chastin.
Formal analysis: Christoph Buck, Ronja Foraita.
Funding acquisition: Johannes Brug, Nanna Lien.
Methodology: Christoph Buck, Anne Loyen, Ronja Foraita, Iris Pigeot, Sebastien Chastin.
Project administration: Jean-Michel Oppert, Johannes Brug, Nanna Lien, Greet Cardon,
Sebastien Chastin.
Software: Christoph Buck, Ronja Foraita.
Supervision: Jean-Michel Oppert, Iris Pigeot, Sebastien Chastin.
Visualization: Christoph Buck.
Writing – original draft: Christoph Buck, Anne Loyen.
Bayesian network of factors influencing sedentary behaviour
PLOS ONE | https://doi.org/10.1371/journal.pone.0211546 January 30, 2019 15 / 18
Writing – review & editing: Christoph Buck, Anne Loyen, Ronja Foraita, Jelle Van Cauwen-
berg, Marieke De Craemer, Ciaran Mac Donncha, Jean-Michel Oppert, Johannes Brug,
Nanna Lien, Greet Cardon, Iris Pigeot, Sebastien Chastin.
References1. Ng SW, Popkin BM. Time use and physical activity: a shift away from movement across the globe.
Obes Rev. 2012; 13(8):659–80. https://doi.org/10.1111/j.1467-789X.2011.00982.x PMID: 22694051
2. Loyen A, van der Ploeg HP, Bauman A, Brug J, Lakerveld J. European Sitting Championship: Preva-
lence and Correlates of Self-Reported Sitting Time in the 28 European Union Member States. PLoS
One. 2016; 11(3):e0149320. https://doi.org/10.1371/journal.pone.0149320 PMID: 26934701
3. Matthews CE, Chen KY, Freedson PS, Buchowski MS, Beech BM, Pate RR, et al. Amount of time
spent in sedentary behaviors in the United States, 2003–2004. Am J Epidemiol. 2008; 167(7):875–81.
https://doi.org/10.1093/aje/kwm390 PMID: 18303006
4. Chastin SF, Schwarz U, Skelton DA. Development of a consensus taxonomy of sedentary behaviors
(SIT): report of Delphi Round 1. PLoS One. 2013; 8(12):e82313. https://doi.org/10.1371/journal.pone.
0082313 PMID: 24312653
5. Tremblay MS, Aubert S, Barnes JD, Saunders TJ, Carson V, Latimer-Cheung AE, et al. Sedentary
Behavior Research Network (SBRN)—Terminology Consensus Project process and outcome. Int J
Behav Nutr Phys Act. 2017; 14(1):75. https://doi.org/10.1186/s12966-017-0525-8 PMID: 28599680
6. Ekelund U, Steene-Johannessen J, Brown WJ, Fagerland MW, Owen N, Powell KE, et al. Does physi-
cal activity attenuate, or even eliminate, the detrimental association of sitting time with mortality? A har-
monised meta-analysis of data from more than 1 million men and women. Lancet. 2016; 388
(10051):1302–10. https://doi.org/10.1016/S0140-6736(16)30370-1 PMID: 27475271
7. Wilmot EG, Edwardson CL, Achana FA, Davies MJ, Gorely T, Gray LJ, et al. Sedentary time in adults
and the association with diabetes, cardiovascular disease and death: systematic review and meta-anal-
ysis. Diabetologia. 2012; 55(11):2895–905. https://doi.org/10.1007/s00125-012-2677-z PMID:
22890825
8. Patterson R, McNamara E, Tainio M, de Sa TH, Smith AD, Sharp SJ, et al. Sedentary behaviour and
risk of all-cause, cardiovascular and cancer mortality, and incident type 2 diabetes: a systematic review
and dose response meta-analysis. Eur J Epidemiol. 2018; 33(9):811–29. https://doi.org/10.1007/
s10654-018-0380-1 PMID: 29589226
9. Davies S, Burns H, Jewell T, McBride M. Start active, stay active: a report on physical activity from the
four home countries. Chief Medical Officers of England, Scotland, Wales and Northern Ireland, 2011;
16306:1–62.
10. Tremblay MS, Carson V, Chaput JP, Connor Gorber S, Dinh T, Duggan M, et al. Canadian 24-Hour
Movement Guidelines for Children and Youth: An Integration of Physical Activity, Sedentary Behaviour,
and Sleep. Appl Physiol Nutr Metab. 2016; 41(6 Suppl 3):S311–27.
11. Buman MP, Hekler EB, Haskell WL, Pruitt L, Conway TL, Cain KL, et al. Objective light-intensity physi-
cal activity associations with rated health in older adults. Am J Epidemiol. 2010; 172(10):1155–65.
https://doi.org/10.1093/aje/kwq249 PMID: 20843864
12. Chastin SF, Palarea-Albaladejo J, Dontje ML, Skelton DA. Combined Effects of Time Spent in Physical
Activity, Sedentary Behaviors and Sleep on Obesity and Cardio-Metabolic Health Markers: A Novel
Compositional Data Analysis Approach. PLoS One. 2015; 10(10):e0139984. https://doi.org/10.1371/
journal.pone.0139984 PMID: 26461112
13. Del Pozo-Cruz J, Garcia-Hermoso A, Alfonso-Rosa RM, Alvarez-Barbosa F, Owen N, Chastin S, et al.
Replacing Sedentary Time: Meta-analysis of Objective-Assessment Studies. Am J Prev Med. 2018; 55
(3):395–402. https://doi.org/10.1016/j.amepre.2018.04.042 PMID: 30122216
14. Biswas A, Oh PI, Faulkner GE, Bajaj RR, Silver MA, Mitchell MS, et al. Sedentary time and its associa-
tion with risk for disease incidence, mortality, and hospitalization in adults: a systematic review and
meta-analysis. Ann Intern Med. 2015; 162(2):123–32. https://doi.org/10.7326/M14-1651 PMID:
25599350
15. Chastin SF, Buck C, Freiberger E, Murphy M, Brug J, Cardon G, et al. Systematic literature review of
determinants of sedentary behaviour in older adults: a DEDIPAC study. Int J Behav Nutr Phys Act.
2015; 12:127. https://doi.org/10.1186/s12966-015-0292-3 PMID: 26437960
16. O’Donoghue G, Perchoux C, Mensah K, Lakerveld J, van der Ploeg H, Bernaards C, et al. A systematic
review of correlates of sedentary behaviour in adults aged 18–65 years: a socio-ecological approach.
BMC Public Health. 2016; 16:163. https://doi.org/10.1186/s12889-016-2841-3 PMID: 26887323
Bayesian network of factors influencing sedentary behaviour
PLOS ONE | https://doi.org/10.1371/journal.pone.0211546 January 30, 2019 16 / 18
17. Stierlin AS, De Lepeleere S, Cardon G, Dargent-Molina P, Hoffmann B, Murphy MH, et al. A systematic
review of determinants of sedentary behaviour in youth: a DEDIPAC-study. Int J Behav Nutr Phys Act.
2015; 12:133. https://doi.org/10.1186/s12966-015-0291-4 PMID: 26453175
18. Lakerveld J, van der Ploeg HP, Kroeze W, Ahrens W, Allais O, Andersen LF, et al. Towards the integra-
tion and development of a cross-European research network and infrastructure: the DEterminants of
DIet and Physical ACtivity (DEDIPAC) Knowledge Hub. Int J Behav Nutr Phys Act. 2014; 11(1):143.
19. Brug J, van der Ploeg HP, Loyen A, Ahrens W, Allais O, Andersen LF, et al. Determinants of diet and
physical activity (DEDIPAC): a summary of findings. Int J Behav Nutr Phys Act. 2017; 14(1):150. https://
doi.org/10.1186/s12966-017-0609-5 PMID: 29100542
20. Chastin SF, De Craemer M, Lien N, Bernaards C, Buck C, Oppert JM, et al. The SOS-framework (Sys-
tems of Sedentary behaviours): an international transdisciplinary consensus framework for the study of
determinants, research priorities and policy on sedentary behaviour across the life course: a DEDIPAC-
study. Int J Behav Nutr Phys Act. 2016; 13:83. https://doi.org/10.1186/s12966-016-0409-3 PMID:
27421750
21. Fuster-Parra P, Tauler P, Bennasar-Veny M, Ligeza A, Lopez-Gonzalez AA, Aguilo A. Bayesian net-
work modeling: A case study of an epidemiologic system analysis of cardiovascular risk. Comput Meth-
ods Programs Biomed. 2016; 126:128–42. https://doi.org/10.1016/j.cmpb.2015.12.010 PMID:
26777431
22. Lappenschaar M, Hommersom A, Lucas PJ, Lagro J, Visscher S. Multilevel Bayesian networks for the
analysis of hierarchical health care data. Artif Intell Med. 2013; 57(3):171–83. https://doi.org/10.1016/j.
artmed.2012.12.007 PMID: 23419697
23. Dao MC, Everard A, Aron-Wisnewsky J, Sokolovska N, Prifti E, Verger EO, et al. Akkermansia mucini-
phila and improved metabolic health during a dietary intervention in obesity: relationship with gut micro-
biome richness and ecology. Gut. 2016; 65(3):426–36. https://doi.org/10.1136/gutjnl-2014-308778
PMID: 26100928
24. Harding NJ. Application of Bayesian networks to problems within obesity epidemiology: University of
Manchester; 2011.
25. Kemperman A, Timmermans H. Environmental correlates of active travel behavior of children. Environ-
ment and Behavior. 2014; 46(5):583–608.
26. Hidalgo CA, Blumm N, Barabasi AL, Christakis NA. A dynamic network approach for the study of
human phenotypes. PLoS Comput Biol. 2009; 5(4):e1000353. https://doi.org/10.1371/journal.pcbi.
1000353 PMID: 19360091
27. Commission European. Special Eurobarometer 412: Sport and physical activity (November-December
2013). 2014.
28. Ekelund U, Sepp H, Brage S, Becker W, Jakes R, Hennings M, et al. Criterion-related validity of the last
7-day, short form of the International Physical Activity Questionnaire in Swedish adults. Public Health
Nutr. 2006; 9(2):258–65. PMID: 16571181
29. World Health Organization (2011) WHO European database on nutrition, obesity and physical activity
(NOPA). Copenhagen: WHO Regional Office for Europe.
30. Radermacher W, Johansson A, Lang V. Europe in figures: Eurostat yearbook 2012: Renouf Publishing
Company Limited; 2013.
31. Scutari M. Learning Bayesian networks with the bnlearn R package. arXiv preprint arXiv:09083817.
2009.
32. Daly R, Shen Q, Aitken S. Learning Bayesian networks: approaches and issues. Knowledge Engineer-
ing Review. 2011; 26(2):99–157.
33. Kolaczyk ED, Csardi G. Statistical analysis of network data with R: Springer; 2014.
34. Scutari M, Denis J-B. Bayesian networks: with examples in R: Chapman and Hall/CRC; 2014.
35. Pigeot I, Sobotka F, Kreiner S, Foraita R. The uncertainty of a selected graphical model. Journal of
Applied Statistics. 2015; 42(11):2335–52.
36. R Development Core Team. R: A language and environment for statistical computing. Vienna, Austria:
R Foundation for Statistical Computing; 2014.
37. Csardi G, Nepusz T. The igraph software package for complex network research. InterJournal, Com-
plex Systems. 2006; 1695(5):1–9.
38. Martin A, Fitzsimons C, Jepson R, Saunders DH, van der Ploeg HP, Teixeira PJ, et al. Interventions
with potential to reduce sedentary time in adults: systematic review and meta-analysis. Br J Sports
Med. 2015; 49(16):1056–63. https://doi.org/10.1136/bjsports-2014-094524 PMID: 25907181
Bayesian network of factors influencing sedentary behaviour
PLOS ONE | https://doi.org/10.1371/journal.pone.0211546 January 30, 2019 17 / 18
39. Lakerveld J, Loyen A, Schotman N, Peeters CFW, Cardon G, van der Ploeg HP, et al. Sitting too much:
A hierarchy of socio-demographic correlates. Prev Med. 2017; 101:77–83. https://doi.org/10.1016/j.
ypmed.2017.05.015 PMID: 28551361
40. Van Cauwenberg J, Loyen A, Lakerveld J, Cardon G, De Craemer M, Gheysen F, et al. Differential influ-
ences of population densification and economic growth on Europeans’ physical activity and sitting time.
Cities. 2018.
41. Leask CF, Harvey JA, Skelton DA, Chastin SF. Exploring the context of sedentary behaviour in older
adults (what, where, why, when and with whom). Eur Rev Aging Phys Act. 2015; 12:4. https://doi.org/
10.1186/s11556-015-0146-7 PMID: 26865868
42. Van Cauwenberg J, De Donder L, Clarys P, De Bourdeaudhuij I, Owen N, Dury S, et al. Relationships
of individual, social, and physical environmental factors with older adults’ television viewing time. J
Aging Phys Act. 2014; 22(4):508–17. https://doi.org/10.1123/japa.2013-0015 PMID: 24231688
43. Chastin SF, Fitzpatrick N, Andrews M, DiCroce N. Determinants of sedentary behavior, motivation, bar-
riers and strategies to reduce sitting time in older women: a qualitative investigation. Int J Environ Res
Public Health. 2014; 11(1):773–91. https://doi.org/10.3390/ijerph110100773 PMID: 24402064
44. Buffel T, Verte D, De Donder L, De Witte N, Dury S, Vanwing T, et al. Theorising the relationship
between older people and their immediate social living environment. International Journal of Lifelong
Education. 2012; 31(1):13–32.
45. Gardner B, Smith L, Lorencatto F, Hamer M, Biddle SJ. How to reduce sitting time? A review of behav-
iour change strategies used in sedentary behaviour reduction interventions among adults. Health Psy-
chol Rev. 2016; 10(1):89–112. https://doi.org/10.1080/17437199.2015.1082146 PMID: 26315814
46. Craig CL, Marshall AL, Sjostrom M, Bauman AE, Booth ML, Ainsworth BE, et al. International physical
activity questionnaire: 12-country reliability and validity. Med Sci Sports Exerc. 2003; 35(8):1381–95.
https://doi.org/10.1249/01.MSS.0000078924.61453.FB PMID: 12900694
47. Ahrens W, Siani A, Adan R, De Henauw S, Eiben G, Gwozdz W, et al. Cohort Profile: The transition
from childhood to adolescence in European children-how I.Family extends the IDEFICS cohort. Int J
Epidemiol. 2017; 46(5):1394–5j. https://doi.org/10.1093/ije/dyw317 PMID: 28040744
48. Hanke M, Foraita R. Clone temporal centrality measures for incomplete sequences of graph snapshots.
BMC bioinformatics. 2017; 18(1):261. https://doi.org/10.1186/s12859-017-1677-x PMID: 28511665
49. Garcia LMT, Diez Roux AV, Martins ACR, Yang Y, Florindo AA. Development of a dynamic framework
to explain population patterns of leisure-time physical activity through agent-based modeling. Int J
Behav Nutr Phys Act. 2017; 14(1):111. https://doi.org/10.1186/s12966-017-0553-4 PMID: 28830527
Bayesian network of factors influencing sedentary behaviour
PLOS ONE | https://doi.org/10.1371/journal.pone.0211546 January 30, 2019 18 / 18