FACTORS INFLUENCING PATIENT SATISFACTION WITH … filefactors influencing patient satisfaction with...
79
FACTORS INFLUENCING PATIENT SATISFACTION WITH DOCTORS IN THE OUT PATIENT DEPARTMENT AT A DISTRICT HOSPITAL IN TSUMEB, NAMIBIA Juvenary John Rutabanzibwa A minithesis submitted in partial fulfilment of the requirements for the degree of Masters in Public Health in the school of Public Health, University of the Western Cape Supervisor: Annie Parsons Co-Supervisor: Uta Lehmann University of the Western Cape Faculty of Health and Social Sciences School of Public Health 30 September 2011 Key Words: Patient‟s choice; Patient‟s satisfaction; Patient‟s expectation; Doctors‟ services; Tsumeb district; Namibia
Transcript of FACTORS INFLUENCING PATIENT SATISFACTION WITH … filefactors influencing patient satisfaction with...
FACTORS INFLUENCING PATIENT SATISFACTION WITH DOCTORS
IN THE OUT PATIENT DEPARTMENT AT A DISTRICT HOSPITAL IN
TSUMEB, NAMIBIA
Juvenary John Rutabanzibwa
A minithesis submitted in partial fulfilment of the requirements for the degree of Masters in
Public Health in the school of Public Health, University of the Western Cape
Supervisor: Annie Parsons
Co-Supervisor: Uta Lehmann
University of the Western Cape
Faculty of Health and Social Sciences
School of Public Health
30 September 2011
Key Words: Patient‟s choice; Patient‟s satisfaction; Patient‟s expectation; Doctors‟ services;
Tsumeb district; Namibia
i
ABSTRACT
Providing quality health services is a concept currently given a high priority by the World Health
Organization (WHO). As a member of WHO, Namibia is determined to improve health services
delivery in the country. In order to achieve this, both doctors and patients must fully engage in
the planning and implementation of health services. There have been long standing complaints
from patients attending Tsumeb district hospital in Namibia about unsatisfactory services from
doctors. The Regional Health Management Team and District Coordinating Committee have
tried to make sure that all essential services required at the district hospital are in place and
functional. Despite these measures, some patients continue to express dissatisfaction with the
services provided by doctors.
The aim of this study was to describe factors considered by patients in choosing a doctor at
Tsumeb district hospital Outpatient department. The research was an observational descriptive
cross-sectional study. Data was collected using a structured questionnaire administered by the
researcher in interviews to a sample of 235 patients attending the Tsumeb Out Patient
Department over five weeks. Data was analyzed using Epi-Info computer soft ware.
Approval to conduct the research was sought from the Namibian Ministry of Health Research
Ethical Committee and Regional Health Management Team prior to commencing the study.
Study participants received full information on the purpose and process of the study in their
preferred language and were allowed to withdraw at any stage without consequences. All data
was made anonymous and securely stored.
The majority of the study sample (90 percent) did not have a tertiary level of education.
Although a majority of the study sample (80 percent) said there were long waiting times at
ii
Tsumeb hospital Out Patient Department and 48 percent indicated that the environment at
Tsumeb hospital was unfriendly, a significant percent of patients surveyed (38.3 percent) were
present for follow-up care. This could be attributed to patients who attend Tsumeb hospital being
of low socio-economic status and hence having a limited choice of health services, or it could
suggest that overall patients were satisfied with the doctors they saw, as 67 percent of returning
patients agreed with the statement that Out Patient Department doctors are competent. Four
participants complained about the lack of confidentiality among nurses, an issue that was not part
of the original questionnaire. In order to improve the quality of patient care, there is a need for
the Tsumeb hospital authority to address key complaints around waiting times and staff attitudes.
iii
DECLARATION
I declare that Factors Influencing Patient Satisfaction with Doctors in the Out Patient
Department at a District Hospital in Tsumeb, Namibia is my own work, that it has not been
submitted for any degree or examination in any other university, and that all the sources I have
quoted have been indicated and acknowledged by complete references.
Juvenary John Rutabanzibwa September 2011
Signed…………………………………

iv
ACKNOWLEDGEMENTS
I would like to express my sincere gratitude to my supervisor, Annie Parson for her tireless
efforts in guiding me through the entire process of this minithesis. I would also like to thank my
colleagues at Tsumeb district hospital for their support and encouragement. Special thanks go to
my wife Tina and my children Keneth and Karen for their understanding and support.
v
TABLE OF CONTENTS
ABSTRACT I
DECLARATION III
ACKNOWLEDGEMENTS IV
TABLE OF CONTENTS V
CHAPTER ONE: INTRODUCTION 1
1.1 Problem Statement 3
1.2 Purpose 3
CHAPTER TWO: LITERATURE REVIEW 4
2.1 Introduction 4
2.2 Patient’s choice 5
2.3 Patient’s satisfaction 8
2.4 Patient’s expectations 10
STUDY AIM 14
OBJECTIVES 14
CHAPTER THREE: METHODOLOGY 15
3.1 Study design 15
3.2 Sampling 15
3.3 Data Collection 15
3.4 Validity, Reliability and Generalisability 17
3.5 Data analysis 18
vi
3.6 Ethical considerations 19
3.7 Limitation 19
CHAPTER FOUR: RESULTS 20
4.1 Introduction 20
4.2 Description of participants by sex, age and level of education 20
4.3 Description of factors influencing participants’ satisfaction with doctors in the OPD 23
4.4 Description of factors contributing to better service in the OPD 30
4.5 Description of factors influencing participants’ expectation of doctors in the OPD 37
CHAPTER FIVE: DISCUSSION OF RESULTS 52
5.1 Introduction 52
5.1 Factors associated with participants’ satisfaction with doctors in the Tsumeb OPD 52
5.2 Participant expectations of doctors in the Tsumeb hospital OPD 56
5.3 Participant complaints about doctors in the OPD 56
CHAPTER SIX: CONCLUSION 59
REFERENCES 61
APPENDIX 1: QUESTIONNAIRE 67
APPENDIX 2: PARTICIPANTS INFORMATION SHEET 70
APPENDIX 3: INFORMED CONSENT 71
1
CHAPTER ONE: INTRODUCTION
Health care services are currently changing from the old approach of provider centred to the
modern approach of patient centred care (Baron-Epel, Dushenat & Friedman, 2001). Namibia is
actively reviewing its health system to be responsive to the public‟s needs. Health care providers
no longer control medical knowledge and are not the sole deciders of patients‟ treatment needs.
Today, the roles and expectations of both providers and patients have shifted to a new approach
of informed choice and active patient participation. The importance of understanding the
decision making process of patients regarding selection and continuity of service use is
paramount in designing appropriate treatment plans.
Different studies have been conducted in multiple countries on patient choice of doctors and
have shown that it is influenced by a number of factors which differ depending on the context in
which people live (Yip, Wang & Liu, 1998; South African Health Review, 1999; Hsu et al, 2000;
Baron-Epel et al, 2001; Leonard, Mlinga & Mariam, 2002; Ndeso-Atanga, 2003; Woolf et al,
2005; Hamid, Sadique, Ahmed & Molla, 2005; NERA Report, 2008). There is an argument that
patients as consumers of health services may lack the ability to assess the quality of services they
receive from the doctors. This is based on the assumption that patients as consumers do not know
what type of health services they need. Yet the importance of including patient opinion in health
services delivery cannot be over emphasized. Patients go to the doctor with their perceived
needs. They expect the doctor to listen and understand them and then use his/her expertise to turn
the patient‟s perceived needs into a diagnosis. In order to achieve this in a patient-centred model
of care, a doctor needs to consider the patient‟s opinion by involving the patient in the entire
process of managing his or her health condition. By so doing, health services gain social
acceptance.
2
The Tsumeb district is one of two districts in Oshikoto Region situated in the Northern part of
Namibia with a population of about 27,000 (Health Information System Report, 2008). The
population is composed of people from the urban area who are mainly civil servants and
businessmen and the majority rural community who are mainly farmers. There are three public
clinics, one district hospital and six private surgeries. The district hospital serves patients from
both urban and rural areas. Tsumeb district hospital receives patients from all socio-economic
classes although most patients seem to hold lower social economic statuses. Some patients
switch between private and state health facilities, as is evident in the health passports (books)
used by some patients for doctor consultations.
The Tsumeb district hospital is fully staffed with five qualified doctors. All five doctors work in
both the outpatient department (OPD) and the inpatient department. Each doctor is assigned a
ward in which s/he is expected to conduct a round in the morning for about one hour and then to
attend patients at the OPD. In theory this means that an OPD patient has limited choice,
depending on which doctor is available. However, in practice patients will wait outside the
consulting room of a preferred doctor until that doctor is available. Consequently, two of the five
doctors regularly have long queues outside their consulting rooms in the OPD at times when the
other three doctors are available for consultations. This has prompted the Regional Health
Management Team (RMT) to ask why patients favour certain doctors over others for OPD
consultations.
Until February 2010, these complaints were collected from the complaint box placed at OPD as
well as through direct reports to the RMT by community members. (The complaints box has
been removed due to renovations.) There is no clear pattern in these complaints as different
patients complain about different doctors. Patient complaints include long waiting times,
3
incompetent doctors and an unfriendly environment. These may indicate that there are key socio-
psychological or socio-demographic factors that a patient considers on choosing a doctor. In
other words, patient dissatisfaction and satisfaction may depend on whether or not a patient‟s
expectations are met and desired choices are available.
1.1 Problem Statement
Despite efforts by the RMT to improve the quality of health services at the Tsumeb district
hospital OPD, patients continue to complain about poor health services provided by OPD
doctors. There is no clear pattern to these complaints. However, it is clear that patients utilize
their capacity to make choices about which provider to see by waiting to see a preferred OPD
doctor. This study seeks to find out why patients complain and determine any pattern to their
satisfaction with a doctor.
1.2 Purpose
This study intends to identify the factors influencing patients‟ satisfaction with the quality of care
provided by doctors at Tsumeb district hospital OPD. This will provide information on the types
of complaints that patients have about the OPD so that the RMT can effectively improve OPD
services.
4
CHAPTER TWO: LITERATURE REVIEW
2.1 Introduction
Patient‟s choice can be influenced by different socio-economic, demographic, psychological and
geographical factors (Yip, Wang & Liu, 1998; South African Health Review, 1999; Hsu et al,
2000; Baron-Epel et al, 2001; Leonard, Mlinga & Mariam, 2002; Sahn, Younger & Genicot,
2002; Ndeso-Atanga, 2003; Woolf et al, 2005; NERA Report, 2008; Hamid, Sadique, Ahmed &
Molla, 2005; Kruk et al, 2009; Elwyn & Braspenning, 2003). For example, Leonard et al (2002)
reveal that patients seek help from health facilities that they believe provide high quality
consultation by more knowledgeable physicians who observe prescription practices and are
polite. The study was conducted in Tanzania, which faces similar socio-economic challenges to
Namibia.
Namibia has a large surface area of about 824,116 km squares with an estimated population of
1,991,747 across some very sparsely populated areas (Health System Review, 2008). Oshikoto
region is composed of two districts, namely Onandjokwe with a population of 179,000 and
Tsumeb with about 29,000 people. The vastness of the country causes problems in geographical
accessibility, as the distance between health care facilities remains a big challenge to provision
of health services especially in sparsely populated areas.
Namibia is classified as a lower middle-income country with a per capita gross national product
(GNP) of 2.90 USD or around 30 Namibian dollars (Health System Review, 2008). However,
this hides discrepancies between rural and urban areas. The average GNP per capita in rural areas
is 5.14 Namibian dollars and in urban areas it is 15.81 Namibian dollars (Health System Review,
2008). The main health challenges in Namibia are caused by high HIV/AIDS, tuberculosis and
5
malaria prevalence rates which have reduced life expectancy from 60 years in the early 1990s to
49 years at present (Strategic Plan, 2009).
2.2 Patient’s choice
There are two aspects to patient choice. First, there is the issue of getting health care and second
is the issue of getting quality healthcare of your choice. Patient‟s choice may be limited in
countries where there are constraints on accessibility of health personnel, affordability and other
social economic factors. These factors may differ from place to place depending on context. For
example factors considered important in choosing a doctor in developed countries may differ
from those in developing countries.
Different studies have been conducted on the importance of recognizing patients‟ views on
health care delivery in improving the quality of health services. Consumer model principles state
that first a consumer must be allowed an opinion on the services he/she receives, secondly he/she
should believe in the legitimacy of that opinion and thirdly he/she should be willing to engage in
an expression of that opinion (Baron-Epel et al, 2001). Kmietowiz (2007) points out that health
reform should go hand in hand with re-engagement with patients, health workers and citizens in
order to create a shared vision of their future health and care services.
2.2.1 Patient’s choice in developed countries
Different studies have been conducted in developed countries on factors influencing patient‟s
choice (Ahmad, Kernohane & Baker, 1994; Butler et al , 1998; Charlottee & Rogers, 1999;
Heritage & Stivers, 1999; Bornstein, Marcus & Cassily, 2000; Smith, 2003; Bachs, 2005; Earls
et al, 2007; Coulter, 2010). These studies have shown that patients in developed countries have a
6
wide range of choice of doctors at their disposal. This is because the health systems in these
countries are supportive in terms of affordability, accessibility and provide good information on
the types of health services available to the community. In addition, many people have access to
health insurance services. For example Borstum & Cassily (2000) found that waiting time,
doctor‟s qualification and convenience were the most important factors in choosing a doctor.
These factors show that there is a good mechanism put in place to disseminate information about
all the health services available to the community and accessible to patients as well as the
information on the type of qualification held by each doctor. In addition, it also indicates that the
level of education is generally higher hence people can read and understand the doctor‟s
qualifications. Furthermore the study found that affordability and doctor‟s personality had no
strong influence on choosing the doctor. This could be because most people in developed
countries have the economic power to purchase the medical services of their choice. However,
this depends on the health care system. For example with the British National Health Services
(NHS) a person is restricted to the doctors‟ practice that serves her or his geographic location.
In a community where the number of doctors is adequate, patients have a wide choice and
subsequently factors like quality, gender, race and qualification of doctors are more likely to play
a major role. For example Ahmad, Kernohan & Baker (1994) indicated that patients are likely to
consult a doctor of their race as well as gender. They further indicated that factors like distance
and cost were found not to have a strong influence. This can be explained from a health
economics point of view that states that utility is a satisfaction of a particular good or service. If
the utility of a health service is greater than its cost, patients are willing to buy more of that
service (Drummond et al, 1987). In other words, if patients are satisfied with the health services
of a particular doctor they will be willing to go to the same doctor regardless of the cost
7
involved. Biørn (2008) found that there is a positive relationship between a patient‟s perception
of quality and the doctor chosen, as doctors with a higher expected failure rate have a smaller
probability of being chosen.
2.2.2 Patient’s choice in developing countries
In most developing countries patients have a limited choice of doctors (Leonard, 2004). Patients
choosing among health facilities in developing countries rarely have access to any formal source
of information about the quality of doctors at these facilities. This is because in developing
countries there is a constant scarcity of doctors, with patients facing greater economic constraints
and with lower education levels (Leonard, 2004). Furthermore, patients seeking health services
suffer from poor information about the health services available and an environment in which
regulations and institutional guarantees of quality differ from organization to organization. Most
decisions are made by governments who assume that their decisions are the best for people and
should be taken as such (Leonard, 2004).
There are few doctors available in both private and public practice. In response to this situation,
patients go through a difficult process of weighing different options including distance and cost
before choosing a doctor. The decision of a patient to see a particular doctor may be influenced
by culture, previous experience with the same doctor or based on what they heard from others
(Spence, 2002; Leonard, 2004). Although some argue that patients do not have the capacity to
evaluate the quality of health services rendered, Leonard (2004) argues that patients are well
informed about their health problems and will evaluate the quality of the health care they receive
against their expectations. Although the patients may not have control over the level of quality of
health services rendered, they make rational decisions in choosing whom to see. For example
8
Kenneth (2006) found that patients are willing to travel greater distances and pay higher fees to
visit doctors who are perceived as of higher quality. However, Leonard (2004) argues that this
rational choice is based on estimates of the average or fixed levels of quality of available services
at facilities but not the level of quality a patient could have obtained if she/he had a wider and
flexible choice.
Patients choose different doctors for different conditions and change their choice as their
perception of illness changes. When the patient views his illness as minor he will tend to go to
any doctor who is cheap and convenient. But when he views his illness as serious, the issue of
cost and distance will be overlooked (Kenneth, 2006). Where patient choice is not restricted by
availability or accessibility then there is the issue of patient desires and views. The NERA report
(2008) argues that strengthening patient‟s choice may provide incentives to doctors to improve
the quality of services, as they will fear losing patients or being labelled as incompetent. Given a
chance, patients would like to choose the health care provider that best suits their perceived
needs. In order to empower patients to have informed choice, Woolf et al (2005) argue that the
ideal solution is to couple information given to the patients with high-quality decision
counselling to help them understand the options available to them and help to select the option
that best accommodates their preference. This is more likely to increase patients‟ compliance and
continuity with the same health care provider. However, this may not be possible in developing
countries with many challenges including shortage of doctors.
2.3 Patient’s satisfaction
Measuring patient‟s satisfaction has many purposes, but one can summarize them into three main
reasons namely, to help evaluate health care services from the patient‟s point of view, facilitate
9
the identification of problems areas and generate ideas towards resolving these problems. A
number of studies have explored the correlation between patient satisfaction and choice of doctor
(Ntabaye, Schentz & Poulsen, 1993; Thompson & Sunol, 1995; Qatari & Haran, 1999; Hsu et al
2000; White, 2000; Baron-Epel et al, 2001; Piechulek & Al-Sabir, 2001; Andaleeb, 2001;
Muhondwa et al, 2003; Matovu et al, 2004; Hamid et al, 2005; Edward et al, 2009). Patient‟s
satisfaction is recognized as an essential component in the evaluation of health care quality
(Edward, 2009). Muhondwa et al (2003) add that patient‟s satisfaction is a fundamental indicator
of the success in health care delivery. For example, Baron-Epel et al (2001) indicated that about
77 percent of patients who reported dissatisfaction with their visit to the hospital intended to
change their physician. The context of this study is important as it was conducted in a
community in Maccabi, Israel with high socio-economic levels where patient‟s choice and
accessibility may be wider than in Namibia. However, the study involved both private and state
patients, similar to the patient profile of the region in which Tsumeb hospital is located.
Hsu et al (2000) found that patients who chose their primary care provider reported overall
greater satisfaction. This study was conducted in the US but is of relevance in Namibia as it only
involved the public health system, which is mainly used by underprivileged communities.
Patient‟s satisfaction with health services is not confined only to clinical efficiency of doctors but
should also consider other factors such as social acceptability. Qatari & Haran (1999) argue that
maintaining quality health care should not be limited to clinical effectiveness or economic
efficiency but rather should include social acceptability as an important quality objective. For
example some patients would prefer to be treated by a doctor of the same gender or age cohort.
The correlation between different variables and patient‟s satisfaction has been documented in
different studies. Qatari & Haran (1999) found that variables such as age, sex and level of
10
education among patients played a minor role in deciding the extent of satisfaction. Edward
(2009) indicated that patients with higher levels of education might be more difficult to satisfy,
as they are more likely to have higher expectations. Another study by Hamid et al (2005) found
that person‟s income, education and household status is highly associated with a patient‟s
satisfaction. This study is probably more reliable as it used a mixed methodology of quantitative
and qualitative approaches (in-depth interview, direct observation and survey) hence allowing for
triangulation of data to improve the validity of the study. In addition, this study was conducted in
Bangladesh where there are similar socio-economic challenges as in Namibia.
Olusoji (2009) described other variables, such as a doctor‟s behaviour, the health infrastructure
and waiting times, with long waiting times in particular negatively affecting satisfaction. This
study was conducted in Nigeria, a country which faces similar health personnel shortages to
Namibia that in turn contribute to long waiting times. Similarly, a study conducted in Tanzania
by Muhondwa et al (2003) indicated that 25.6 percent of patients were not satisfied with long
waiting times as well as the attention they received. They also found that the high cost of
treatment and poor levels of hygiene in the hospital had a negative impact on patient satisfaction.
Ntabaye et al (1993) also found that a good working atmosphere at the health facility as well as a
good relationship between doctor and patient significantly influenced positive patient
satisfaction.
2.4 Patient’s expectations
Patient expectations can strongly influence his or her satisfaction. Pascoe (1984) divided patient
expectations into four groups, namely ideal, minimum, expected and deserved. When studying
patient‟s satisfaction it is important to state the type of variable in expectation that is explored.
11
Most studies on patient‟s satisfaction utilize expected expectations. A patient‟s past experience
or information from any source form this type of expectation. A patient will then come to the
hospital with his or her complaint and expect the doctor to manage that complaint in a desired or
„expected‟ manner. However, sometimes the doctor will advise the patient contrary to his or her
expectations. This can affect a patient‟s satisfaction with the treatment that she or he receives, as
well as compliance with the treatment. Studies on the other mentioned groups of patient‟s
expectations (ideal, minimum and deserved) are scanty and I could not find one in my review of
the literature.
Farooqi (2005) argues that there is a wide gape between patient expectations and the doctor‟s
perceptions of medical care. He further point out that every patient who comes to see a doctor
has expectations based on the understanding of her/his illness so when patient expectations and
doctor‟s perception do not match, it results in patient dissatisfaction. Britten (2004) argues that
doctor‟s perception of patient‟s preference is a strong predictor of their actions during
consultation including diagnosis and prescription. It is important for doctors to put more effort
into assessing their patients‟ expectations to avoid inappropriate perceptions that can results in
actions deemed unnecessary by the doctor and unwanted by the patient (Little, 2004). For
example, Cockburn (1997) points out that when a doctor perceived that a particular patient
expected medication, the patient was ten times more likely to receive the medication as
compared to other similar patients. Although patients came with their expectations in the
consulting room regarding medication, it is the doctor‟s opinion about patients‟ expectations that
were the strongest determinants of prescribing behaviour. Furthermore, sometimes patient‟s
satisfaction is more affected by his or her immediate reaction to the services received than by
general expectations on going to hospital (Pascoe, 1984). In their study, Hamid et al (2005)

12
found that patients expect doctors to be attentive, listening, understanding and compassionate.
Developing the theory of expectations may help in understanding patient satisfaction. Zebrine et
al (2004) found that patients whose most important expectations are met are more likely to be
satisfied. These expectations were identified as doctor understanding and explanation followed
by emotional support. Hospital infrastructure, diagnostic procedure and treatment were less
important. Better relationships should be based on more accurate understanding gained by
finding out directly what patients are expecting.
On the other hand, Gage & Rickman (2000) argue that the nature of illness is such that patients
may not know the causes of their problem as well as the type of treatment needed and hence may
themselves jeopardize the fulfilment of their expectations, as these will be poorly defined.
Ndeso-Atanga (2003) based on research from Cameroon, a country with similar socio-economic
challenges to Namibia, has a different view. He argues that patients evaluate their medical needs
in a manner similar to that used by health professionals to evaluate patient‟s medical needs. Non-
medical issues can affect this evaluation, depending on a patient‟s context. For example, patients
tend to cite distance and cost as reasons when they regard their illness as non-serious but when
their illness is regarded as serious, the quality of health care services is a major concern. Leonard
et al (2002) found that patients seek health services at the facilities where they expect well-
qualified personnel and high quality services.
The level of fulfilment of a patient‟s expectations also relies on the doctor recognizing these
expectations and on the involvement of the patient in the whole process of managing his or her
treatment plan. Baron-Epel et al (2001) argue that the more a patient perceives that his or her
expectations have been fulfilled, the greater the satisfaction. This is more likely to increase a
patient‟s compliance and continuity with the same doctor.
13
Another study by Wilhem et al (2005) has indicated that patients‟ expectations are influenced by
socio-demographic and illness related characteristics. It is paramount that doctors should respond
to a patient‟s cultural values, social concerns and individual needs, as it is pointed out by Mutebi
(2001) that the shape and behaviour of patients toward the health services can be influenced by
their perceptions. For example, Palmer (1995) indicates that about 58 percent of all South
Africans who seek medical care are treated in the private sector, arguing that this could be due to
a belief that levels of confidentiality and privacy are higher with private practitioners.
The perceived level to which patient needs and expectations are met may indicate the degree to
which patients are satisfied with the health care they receive, as argued by Dozier et al (2001)
who developed a psychometric instrument to measure whether patient needs were met. The
measure assessed patients‟ perspectives about the health services they received, using a likert
type scale. From the above literature review, one can argue that patient‟s choice of doctor is
strongly correlated to patient‟s satisfaction with health services received. Expectations can
strongly influence the level of patient‟s satisfaction with services and choice of doctor.
14
STUDY AIM
The aim of this study is to describe factors influencing patient satisfaction with the quality of
care provided by doctors at Tsumeb district hospital Out Patient Department.
OBJECTIVES
1. To describe patient complaints about doctors in the OPD
2. To describe patient expectations of OPD doctors prior to appointments
3. To describe patient satisfaction with the doctor seen at the OPD.
15
CHAPTER THREE: METHODOLOGY
3.1 Study design
The research was an observational and descriptive cross-sectional survey as the research question
sought to address the reasons underlying patient‟s choice of doctors. The data collection tool
used was a structured questionnaire administered by a researcher in individual interviews with
participants. Every fourth patient attending the OPD over five weeks was asked to participate in
the study until the desired sample size was reached. The desired sample size (235) was reached
within the five weeks.
3.2 Sampling
The study population was composed of male and female patients of 18 years and above who
attended the OPD of Tsumeb Hospital during the research period. A systematic sample of every
fourth patient to enter the OPD over five weeks was used. Approximately 2000 people attend the
Tsumeb Hospital OPD every month and to achieve a 95 percent confidence level (with a 5
percent margin of error) the desired sample size was calculated at 235 people. The response rate
was 100 percent as all the participants approached responded. In order to avoid disruption of
routine OPD services delivery, a maximum of ten participants were interviewed each day.
3.3 Data Collection
Before starting the data collection, the researcher met with the District Health Coordinating
Committee and explained the aim and methodology of the study. Permission was granted and the
committee informed the researcher that he should not hesitate to inform them if further assistance
16
was required. Health workers in the OPD were very cooperative and willing to help in case of
translation when needed.
The data was collected in individual interviews using a structured questionnaire with scale items
administered by the researcher (Appendix 1). A four-scale likert scale meant the respondent was
required to make a positive or negative decision and if not sure of the question had to answer
„don‟t know.‟ Each interview took a maximum of thirty minutes. The structured questionnaire
was a tool of choice for this study, as it helped to test if there is an association between the
factors identified in the literature review and Tsumeb‟s setting. A face-to-face interview also did
not require participants to have literacy skills and the researcher or an assistant was able to
explain the tool in the participant‟s language of choice. There was no verbatim record.
To ensure credibility of the study, the questionnaire was piloted. Six patients who met the
inclusion criteria were randomly selected from OPD and interviewed by the researcher.
Participants were asked to sit on the bench outside the room designated for the interviews. The
study interview format was followed and one participant at a time was called in and given
information about the aim of the study. It was explained that participation was fully voluntary
with no negative or positive effects if the person did not participate. Consent and information
forms were then given to the participants for signature on acceptance.
Questions were answered without problems in the pilot, with the one exception being question
number four of the demographic section (“What was the last year of school that you
completed?”) as some participants mentioned the year that they completed schooling, for
example 1998, and others mentioned the level at which they exited, such as grade twelve. It was
17
decided to alter the questionnaire so to record the last level of education reached and not the year
of completion.
One other problem noted during piloting was that some patients initially hesitated in answering
questions that aimed to point out weakness of an OPD doctor. To address this, the researcher
made an additional effort before starting the pilot interviews and every subsequent interview to
reaffirm each participant‟s confidentiality and anonymity by reminding them that this
information was confidential and no names were recorded on the form or anywhere else.
During the actual data collection, participants were highly cooperative. Although some
participants were concerned about time constraints as they wanted to join the long waiting queue
to see a doctor, the researcher was able to reassure them as an arrangement had been made to
ensure that after the interview that patient would be seen by the available doctor immediately.
3.4 Validity, Reliability and Generalisability
The questionnaire was piloted before commencing the study and the one adjustment to a question
arising from the pilot was made. This helped to identify any discrepancy in the questions and
hence increased validity. The interview was conducted in English, Oshivambo, Damara,
Oshiherero or Afrikaans, depending on the participant‟s choice. Data analysis was done by the
researcher with the assistance of a biostatistician. This increased the dependability of results and
diminished the risk of processing error. The study used a random sampling method as well
variables tested in studies from different countries; this yielded similar results, increasing
generalisability.
18
3.5 Data analysis
Data was entered into Epi-Info by the researcher. The raw data, memos and questionnaires were
kept as an audit trail for an external auditor to evaluate at any stage if needed. The four-scale
likert scale data was analyzed using Epi-Info 3.3.2, a data analysis programme developed by the
U.S. Centers for Disease Control (http://www.cdc.gov/Epiinfo/). This allowed for a descriptive
analysis. The „strongly agreed‟ and „agreed‟ responses were taken as a positive response or „yes‟,
and given a value of 1 and 2 respectively. The „disagree‟ and „strongly disagree‟ responses were
taken as negative and given a value of 3 and 4 respectively. As different people responded with
different emphasis to questions, differences between the positive (1 and 2 values) and negative (3
and 4 values) categories were examined and not the intervals between the numbers themselves.
„Don‟t know‟ was counted as unanswered and given a value of 0. The answers were presented in
a table format, and then analyzed for p-value and using chi-square for gender (male and female),
age groups (youth, adult and old) and level of education (No school attended, Primary school,
Junior secondary, Tertiary) where appropriate. The p-value is the probability of obtaining a test
statistic at least as extreme as the one that was actually observed, assuming that the null
hypothesis is true. If the sample findings are unlikely, given the null hypothesis, the researcher
rejects the null hypothesis. Typically, this involves comparing the p-value to the significance
level, and rejecting the null hypothesis when the P-value is less than the significance level. The
significance level for this study is 0.05 since the study statistics were calculated within 95
percent confidence intervals.
In order to analyze the effect of age on different variables, the results were categorized into the
following three age-groups: (1) 18-35 years, named „Youth‟, (2) 36-50 years, named „Adult‟, and
(3) 51-80 years, named „Old‟.
19
3.6 Ethical considerations
The researcher obtained approval from the research ethical committee of the Ministry of Health
in Namibia before commencing the study. Approval was also granted by the District Health
Coordinating Committee of Tsumeb district.
Study participants were given full information about the purpose of the study and the participant
sheet was explained in detail (Appendix 2). They were informed that the anonymous research
findings may be used to improve health service delivery at Tsumeb district hospital. Participants
were also informed of their choice to participate or withdraw at any stage of the research without
any consequences. The consent form was given to the participants to read through, agree to and
sign (Appendix 3). For those who could not read, the researcher read the consent form to them.
Where requested, the consent form was verbally translated by a translator into the relevant local
language. Numbers were used instead of real names for the participants and ensured that
confidentiality and anonymity were maintained throughout the study. The data were stored in the
researcher‟s office with optimal security, which can only be accessed by him.
3.7 Limitation
Patient self-reporting may have introduced information bias into the sample. This is recognised
in the discussion section.
The researcher was a doctor who worked in the same OPD, though care was taken to explain to
all participants that all responses were kept confidential and anonymous. This may have limited
the freedom of expression of some participants.
20
CHAPTER FOUR: RESULTS
4.1 Introduction
The results looked at factors influencing participants‟ satisfaction with, expectations of, and
complaints about doctors at Tsumeb OPD. The questionnaire first established the background of
each participant, which in turn informed the results for the further questions, presented below.
Questions 1, 2, 3 and 4 (Appendix 1) asked the participant to respond „Strongly Agree‟, „Agree‟,
„Disagree‟, „Strongly Disagree‟ or „Don‟t Know‟ to a series of statements. All results were then
stratified by sex, age group and level of education. Where indicated, Chi-Square tests were done
to determine p-values for various responses.
4.2 Description of participants by sex, age and level of education
The results presented below were responses to the initial demographic overview asked of each
participant (Appendix 1). The majority of the study sample (48.5 percent) fell into the youth
category of 18 to 35 years of age (Table 1).
Table 1. Distribution of participants by age group
A1: Age Group Frequency Percent
Youth (18-35 years) 114 48.5%
Adults (36-50 years) 68 28.9%
Old (51-80 years) 53 22.6%
Total 235 100.0%
21
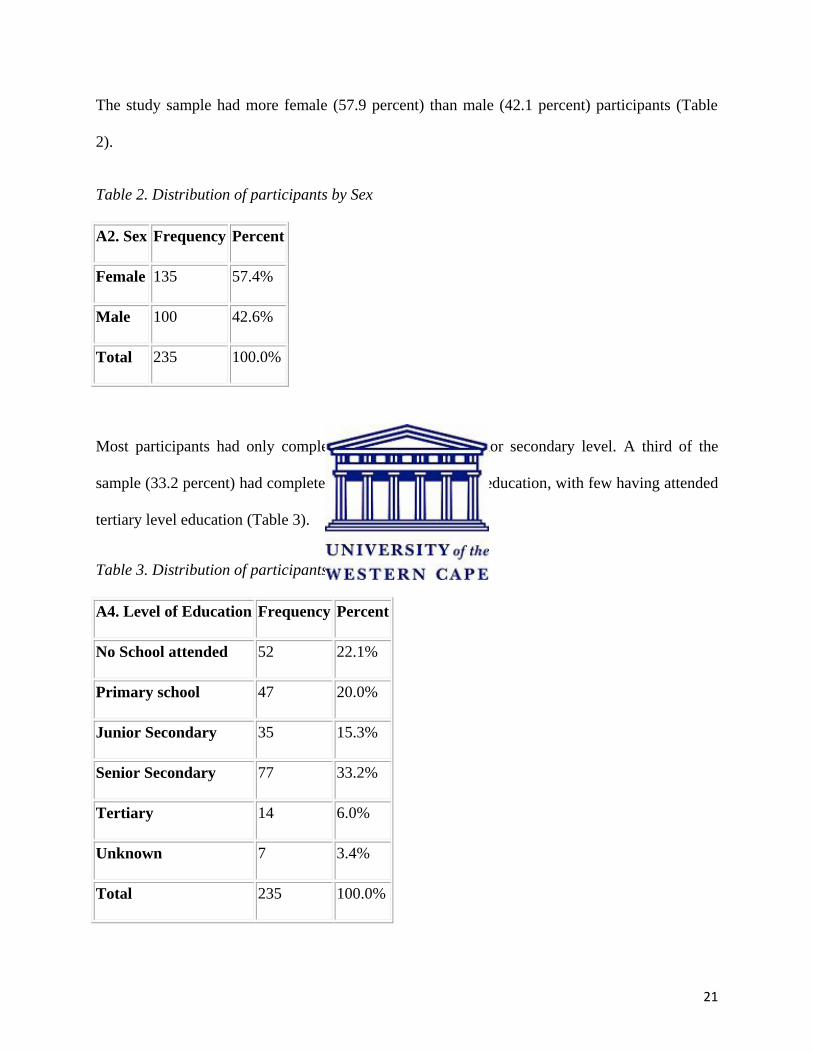
The study sample had more female (57.9 percent) than male (42.1 percent) participants (Table
2).
Table 2. Distribution of participants by Sex
A2. Sex Frequency Percent
Female 135 57.4%
Male 100 42.6%
Total 235 100.0%
Most participants had only completed schooling up to junior secondary level. A third of the
sample (33.2 percent) had completed senior secondary level education, with few having attended
tertiary level education (Table 3).
Table 3. Distribution of participants by Level of Education
A4. Level of Education Frequency Percent
No School attended 52 22.1%
Primary school 47 20.0%
Junior Secondary 35 15.3%
Senior Secondary 77 33.2%
Tertiary 14 6.0%
Unknown 7 3.4%
Total 235 100.0%
22
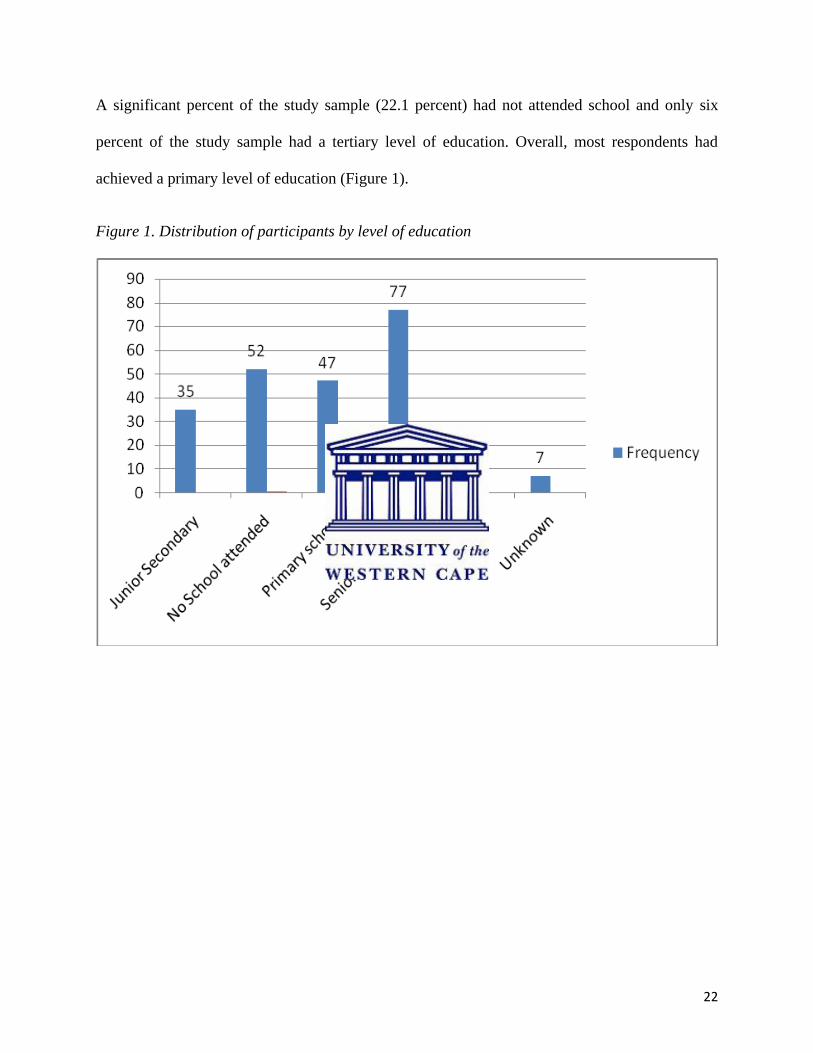
A significant percent of the study sample (22.1 percent) had not attended school and only six
percent of the study sample had a tertiary level of education. Overall, most respondents had
achieved a primary level of education (Figure 1).
Figure 1. Distribution of participants by level of education
23
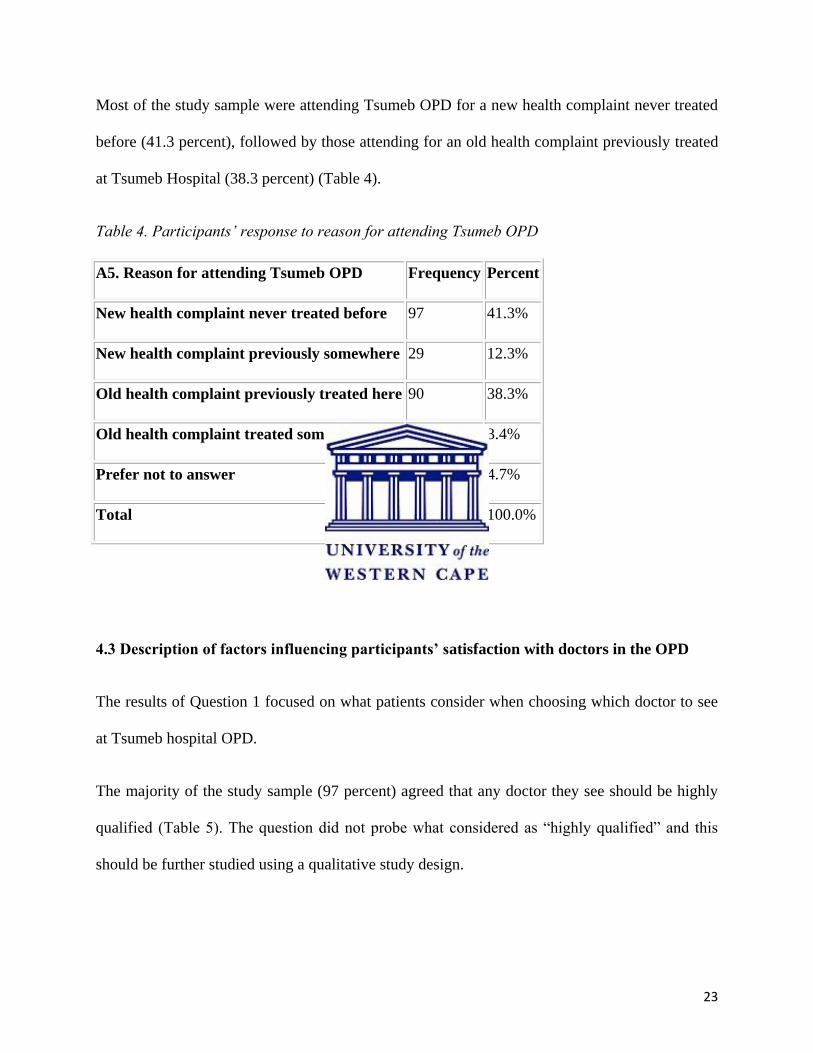
Most of the study sample were attending Tsumeb OPD for a new health complaint never treated
before (41.3 percent), followed by those attending for an old health complaint previously treated
at Tsumeb Hospital (38.3 percent) (Table 4).
Table 4. Participants‟ response to reason for attending Tsumeb OPD
A5. Reason for attending Tsumeb OPD Frequency Percent
New health complaint never treated before 97 41.3%
New health complaint previously somewhere 29 12.3%
Old health complaint previously treated here 90 38.3%
Old health complaint treated somewhere else 8 3.4%
Prefer not to answer 11 4.7%
Total 235 100.0%
4.3 Description of factors influencing participants’ satisfaction with doctors in the OPD
The results of Question 1 focused on what patients consider when choosing which doctor to see
at Tsumeb hospital OPD.
The majority of the study sample (97 percent) agreed that any doctor they see should be highly
qualified (Table 5). The question did not probe what considered as “highly qualified” and this
should be further studied using a qualitative study design.
24
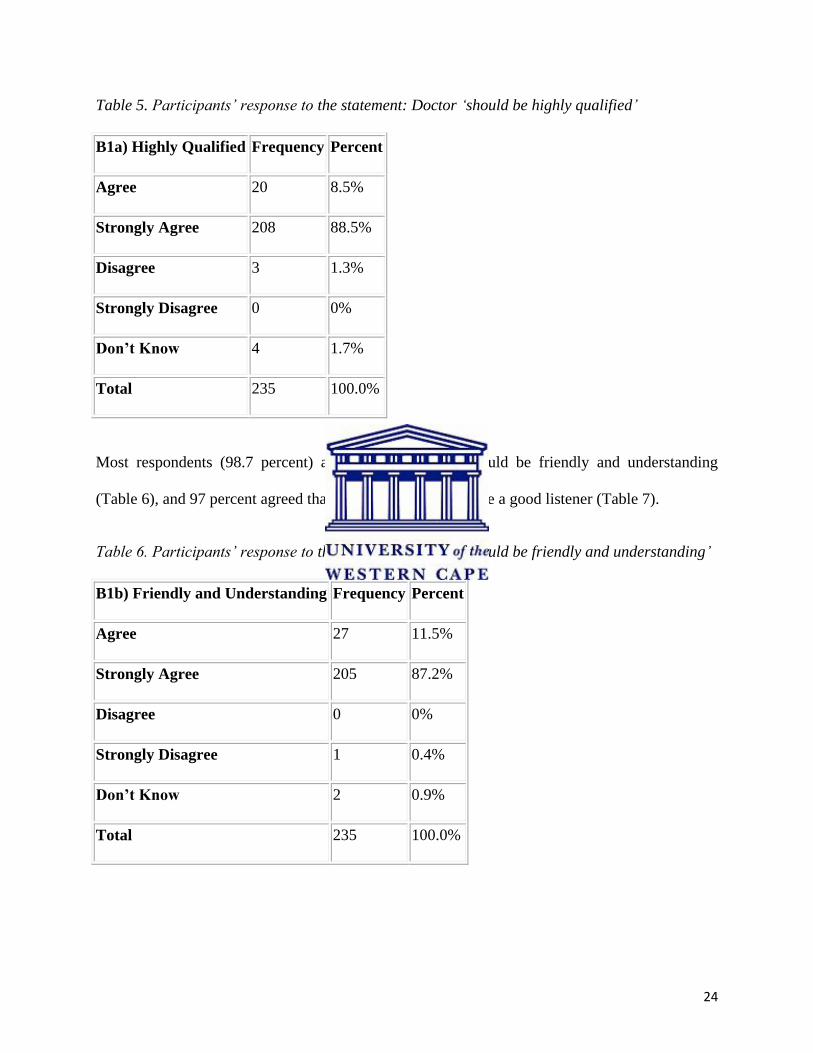
Table 5. Participants‟ response to the statement: Doctor „should be highly qualified‟
B1a) Highly Qualified Frequency Percent
Agree 20 8.5%
Strongly Agree 208 88.5%
Disagree 3 1.3%
Strongly Disagree 0 0%
Don’t Know 4 1.7%
Total 235 100.0%
Most respondents (98.7 percent) agreed that a doctor should be friendly and understanding
(Table 6), and 97 percent agreed that the doctor should also be a good listener (Table 7).
Table 6. Participants‟ response to the statement: Doctor „should be friendly and understanding‟
B1b) Friendly and Understanding Frequency Percent
Agree 27 11.5%
Strongly Agree 205 87.2%
Disagree 0 0%
Strongly Disagree 1 0.4%
Don’t Know 2 0.9%
Total 235 100.0%
25
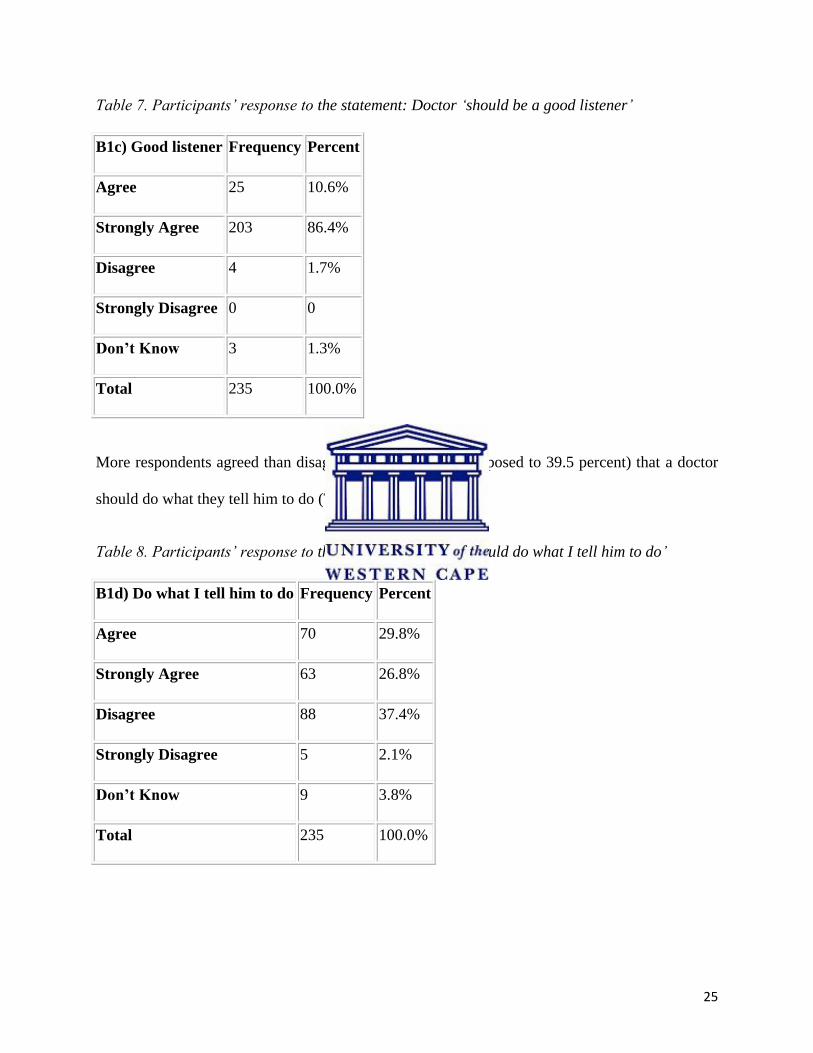
Table 7. Participants‟ response to the statement: Doctor „should be a good listener‟
B1c) Good listener Frequency Percent
Agree 25 10.6%
Strongly Agree 203 86.4%
Disagree 4 1.7%
Strongly Disagree 0 0
Don’t Know 3 1.3%
Total 235 100.0%
More respondents agreed than disagreed (56.6 percent as opposed to 39.5 percent) that a doctor
should do what they tell him to do (Table 8).
Table 8. Participants‟ response to the statement: Doctor „should do what I tell him to do‟
B1d) Do what I tell him to do Frequency Percent
Agree 70 29.8%
Strongly Agree 63 26.8%
Disagree 88 37.4%
Strongly Disagree 5 2.1%
Don’t Know 9 3.8%
Total 235 100.0%
26
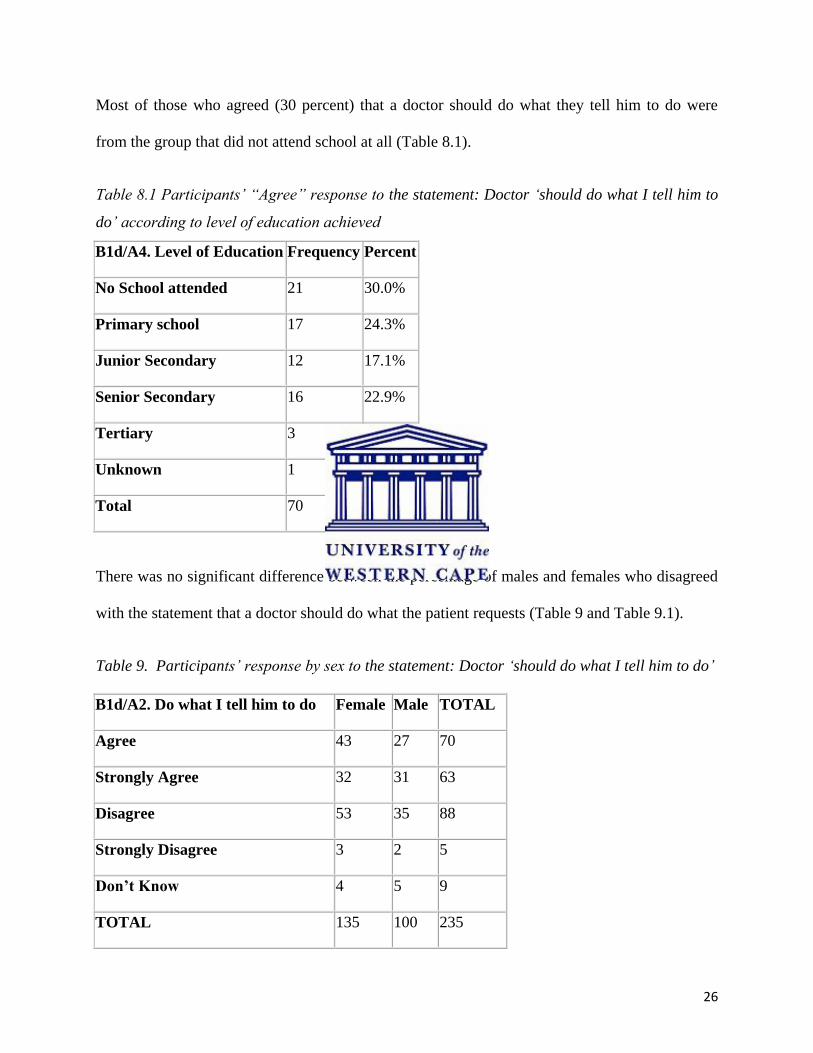
Most of those who agreed (30 percent) that a doctor should do what they tell him to do were
from the group that did not attend school at all (Table 8.1).
Table 8.1 Participants‟ “Agree” response to the statement: Doctor „should do what I tell him to
do‟ according to level of education achieved
B1d/A4. Level of Education Frequency Percent
No School attended 21 30.0%
Primary school 17 24.3%
Junior Secondary 12 17.1%
Senior Secondary 16 22.9%
Tertiary 3 4.3%
Unknown 1 1.4%
Total 70 100.0%
There was no significant difference between the percentage of males and females who disagreed
with the statement that a doctor should do what the patient requests (Table 9 and Table 9.1).
Table 9. Participants‟ response by sex to the statement: Doctor „should do what I tell him to do‟
B1d/A2. Do what I tell him to do Female Male TOTAL
Agree 43 27 70
Strongly Agree 32 31 63
Disagree 53 35 88
Strongly Disagree 3 2 5
Don’t Know 4 5 9
TOTAL 135 100 235
27
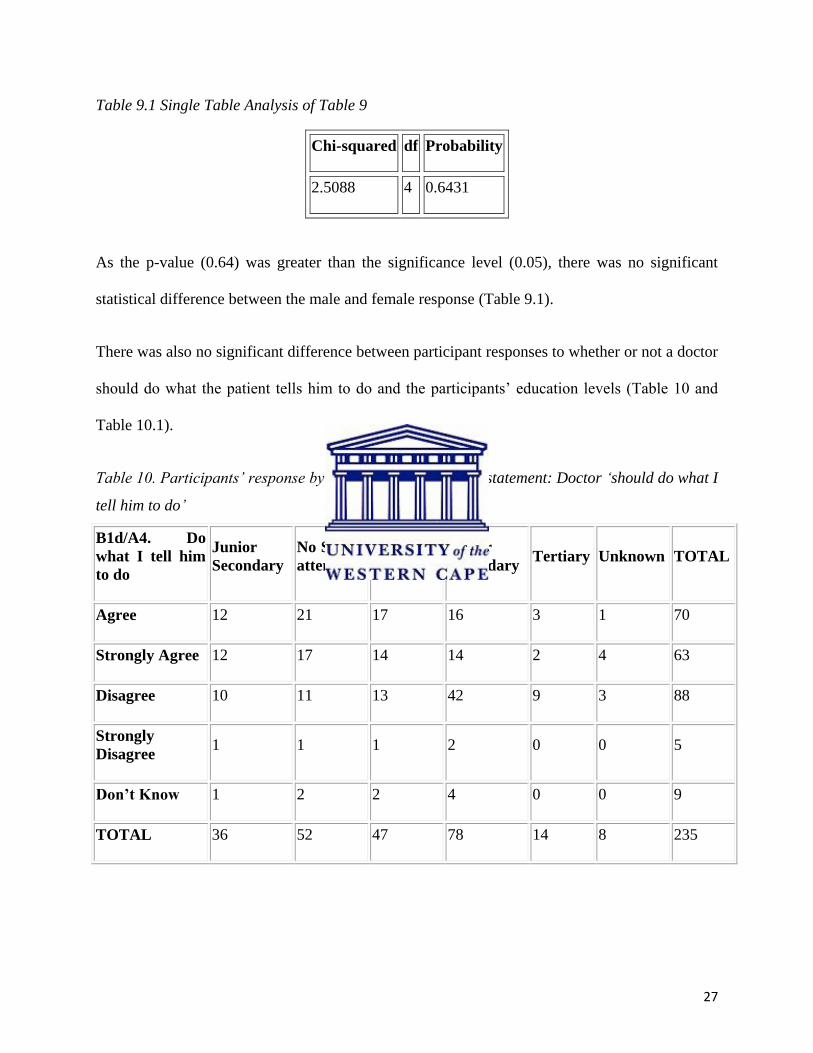
Table 9.1 Single Table Analysis of Table 9
Chi-squared df Probability
2.5088 4 0.6431
As the p-value (0.64) was greater than the significance level (0.05), there was no significant
statistical difference between the male and female response (Table 9.1).
There was also no significant difference between participant responses to whether or not a doctor
should do what the patient tells him to do and the participants‟ education levels (Table 10 and
Table 10.1).
Table 10. Participants‟ response by level of education to the statement: Doctor „should do what I
tell him to do‟
B1d/A4. Do
what I tell him
to do
Junior
Secondary
No School
attended
Primary
school
Senior
Secondary Tertiary Unknown TOTAL
Agree 12 21 17 16 3 1 70
Strongly Agree 12 17 14 14 2 4 63
Disagree 10 11 13 42 9 3 88
Strongly
Disagree 1 1 1 2 0 0 5
Don’t Know 1 2 2 4 0 0 9
TOTAL 36 52 47 78 14 8 235
28
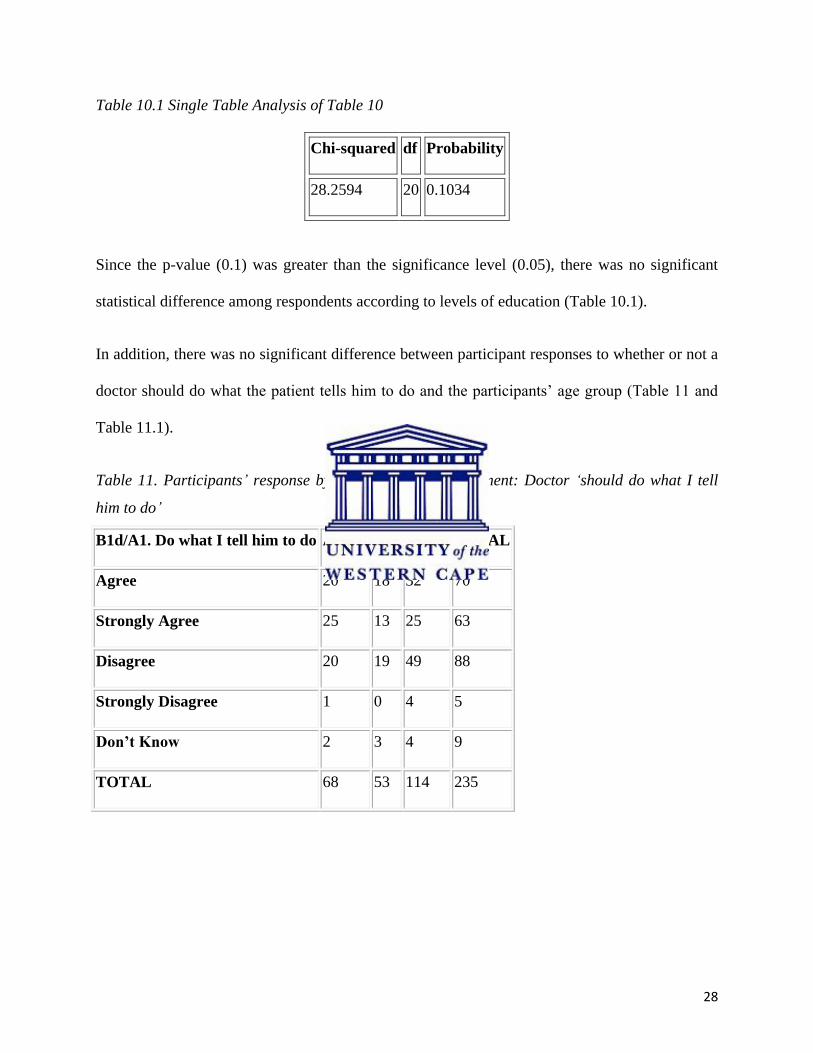
Table 10.1 Single Table Analysis of Table 10
Chi-squared df Probability
28.2594 20 0.1034
Since the p-value (0.1) was greater than the significance level (0.05), there was no significant
statistical difference among respondents according to levels of education (Table 10.1).
In addition, there was no significant difference between participant responses to whether or not a
doctor should do what the patient tells him to do and the participants‟ age group (Table 11 and
Table 11.1).
Table 11. Participants‟ response by age group to the statement: Doctor „should do what I tell
him to do‟
B1d/A1. Do what I tell him to do Adults Old Youth TOTAL
Agree 20 18 32 70
Strongly Agree 25 13 25 63
Disagree 20 19 49 88
Strongly Disagree 1 0 4 5
Don’t Know 2 3 4 9
TOTAL 68 53 114 235
29
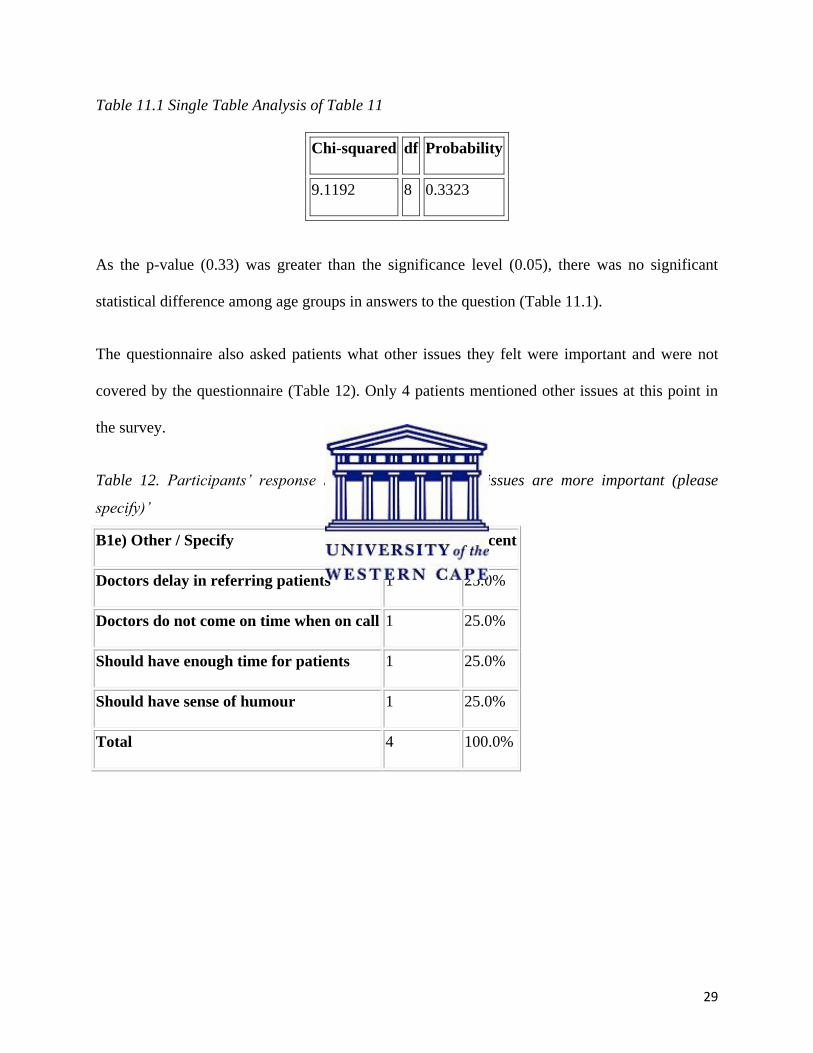
Table 11.1 Single Table Analysis of Table 11
Chi-squared df Probability
9.1192 8 0.3323
As the p-value (0.33) was greater than the significance level (0.05), there was no significant
statistical difference among age groups in answers to the question (Table 11.1).
The questionnaire also asked patients what other issues they felt were important and were not
covered by the questionnaire (Table 12). Only 4 patients mentioned other issues at this point in
the survey.
Table 12. Participants‟ response to the statement „other issues are more important (please
specify)‟
B1e) Other / Specify Frequency Percent
Doctors delay in referring patients 1 25.0%
Doctors do not come on time when on call 1 25.0%
Should have enough time for patients 1 25.0%
Should have sense of humour 1 25.0%
Total 4 100.0%
30
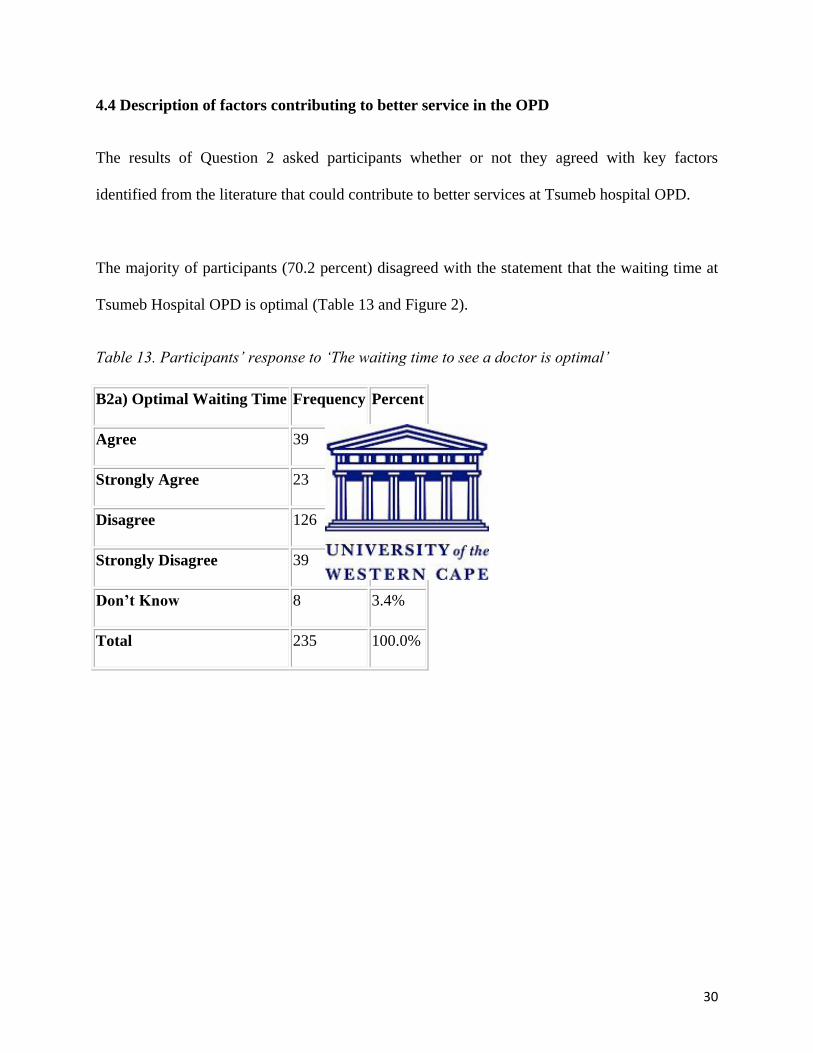
4.4 Description of factors contributing to better service in the OPD
The results of Question 2 asked participants whether or not they agreed with key factors
identified from the literature that could contribute to better services at Tsumeb hospital OPD.
The majority of participants (70.2 percent) disagreed with the statement that the waiting time at
Tsumeb Hospital OPD is optimal (Table 13 and Figure 2).
Table 13. Participants‟ response to „The waiting time to see a doctor is optimal‟
B2a) Optimal Waiting Time Frequency Percent
Agree 39 16.6%
Strongly Agree 23 9.8%
Disagree 126 53.6%
Strongly Disagree 39 16.6%
Don’t Know 8 3.4%
Total 235 100.0%
31
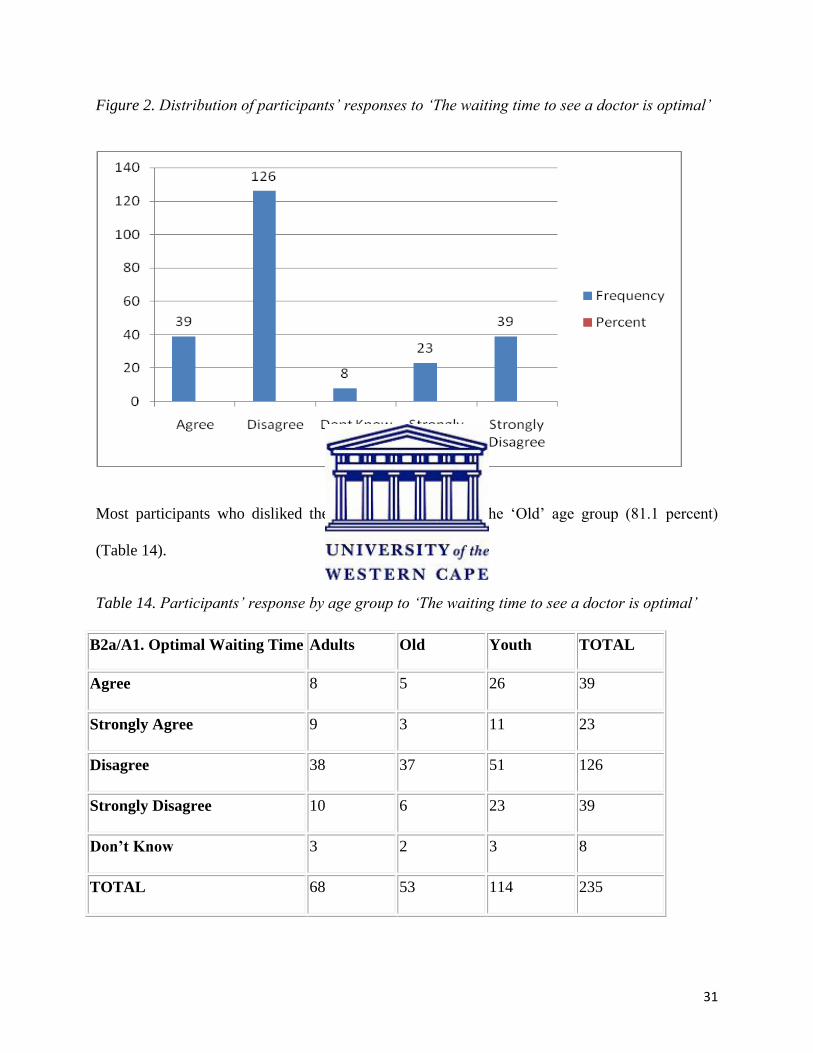
Figure 2. Distribution of participants‟ responses to „The waiting time to see a doctor is optimal‟
Most participants who disliked the waiting time were in the „Old‟ age group (81.1 percent)
(Table 14).
Table 14. Participants‟ response by age group to „The waiting time to see a doctor is optimal‟
B2a/A1. Optimal Waiting Time Adults Old Youth TOTAL
Agree 8 5 26 39
Strongly Agree 9 3 11 23
Disagree 38 37 51 126
Strongly Disagree 10 6 23 39
Don’t Know 3 2 3 8
TOTAL 68 53 114 235
32
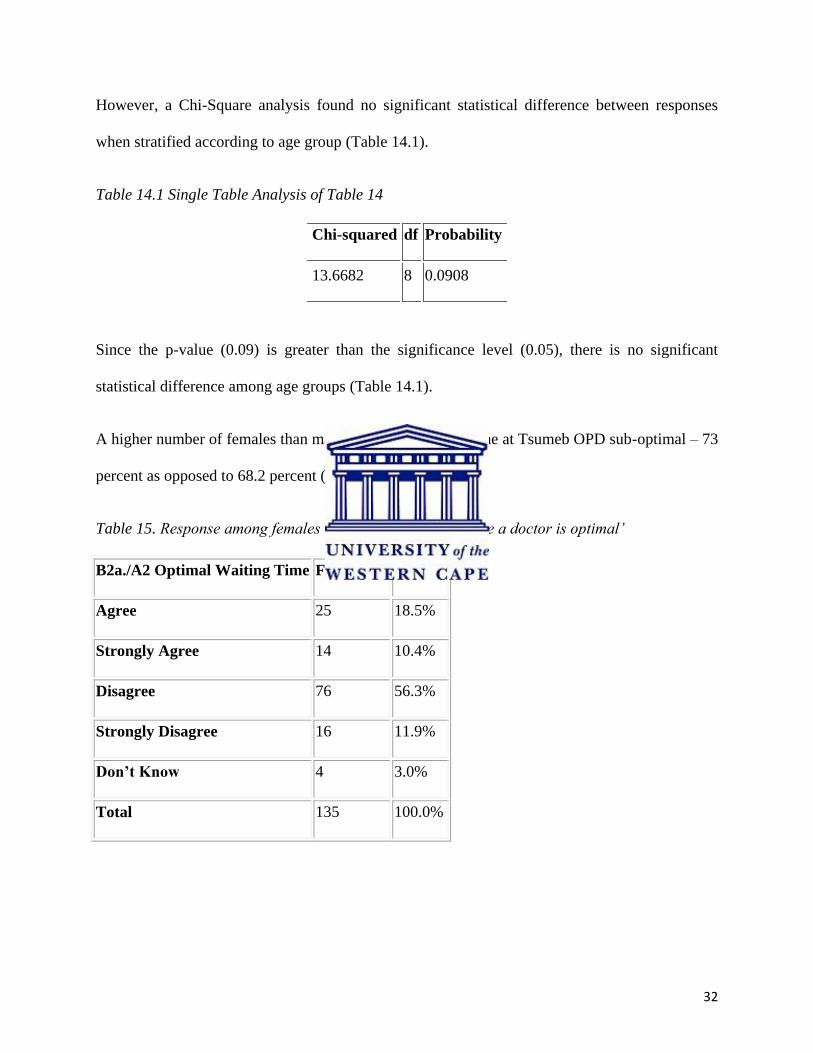
However, a Chi-Square analysis found no significant statistical difference between responses
when stratified according to age group (Table 14.1).
Table 14.1 Single Table Analysis of Table 14
Chi-squared df Probability
13.6682 8 0.0908
Since the p-value (0.09) is greater than the significance level (0.05), there is no significant
statistical difference among age groups (Table 14.1).
A higher number of females than males found the waiting time at Tsumeb OPD sub-optimal – 73
percent as opposed to 68.2 percent (Table 15 and Table 16).
Table 15. Response among females to „The waiting time to see a doctor is optimal‟
B2a./A2 Optimal Waiting Time Frequency Percent
Agree 25 18.5%
Strongly Agree 14 10.4%
Disagree 76 56.3%
Strongly Disagree 16 11.9%
Don’t Know 4 3.0%
Total 135 100.0%
33
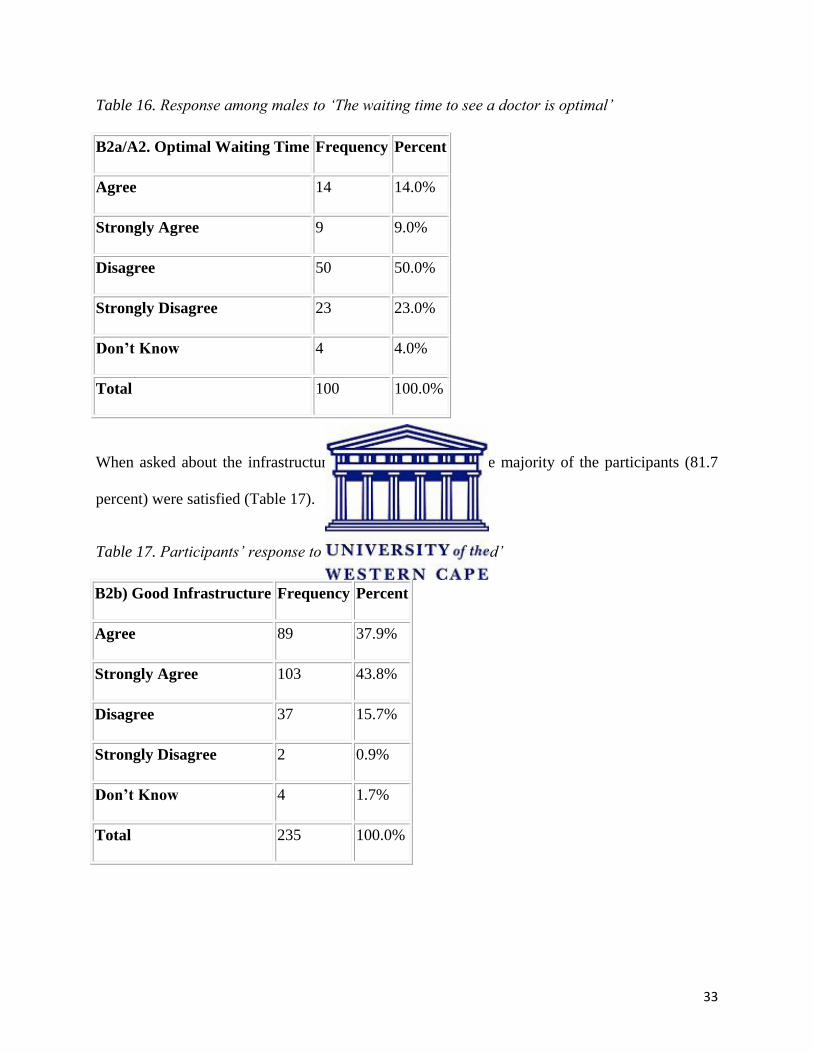
Table 16. Response among males to „The waiting time to see a doctor is optimal‟
B2a/A2. Optimal Waiting Time Frequency Percent
Agree 14 14.0%
Strongly Agree 9 9.0%
Disagree 50 50.0%
Strongly Disagree 23 23.0%
Don’t Know 4 4.0%
Total 100 100.0%
When asked about the infrastructure of Tsumeb hospital, the majority of the participants (81.7
percent) were satisfied (Table 17).
Table 17. Participants‟ response to ‟The infrastructure is good‟
B2b) Good Infrastructure Frequency Percent
Agree 89 37.9%
Strongly Agree 103 43.8%
Disagree 37 15.7%
Strongly Disagree 2 0.9%
Don’t Know 4 1.7%
Total 235 100.0%
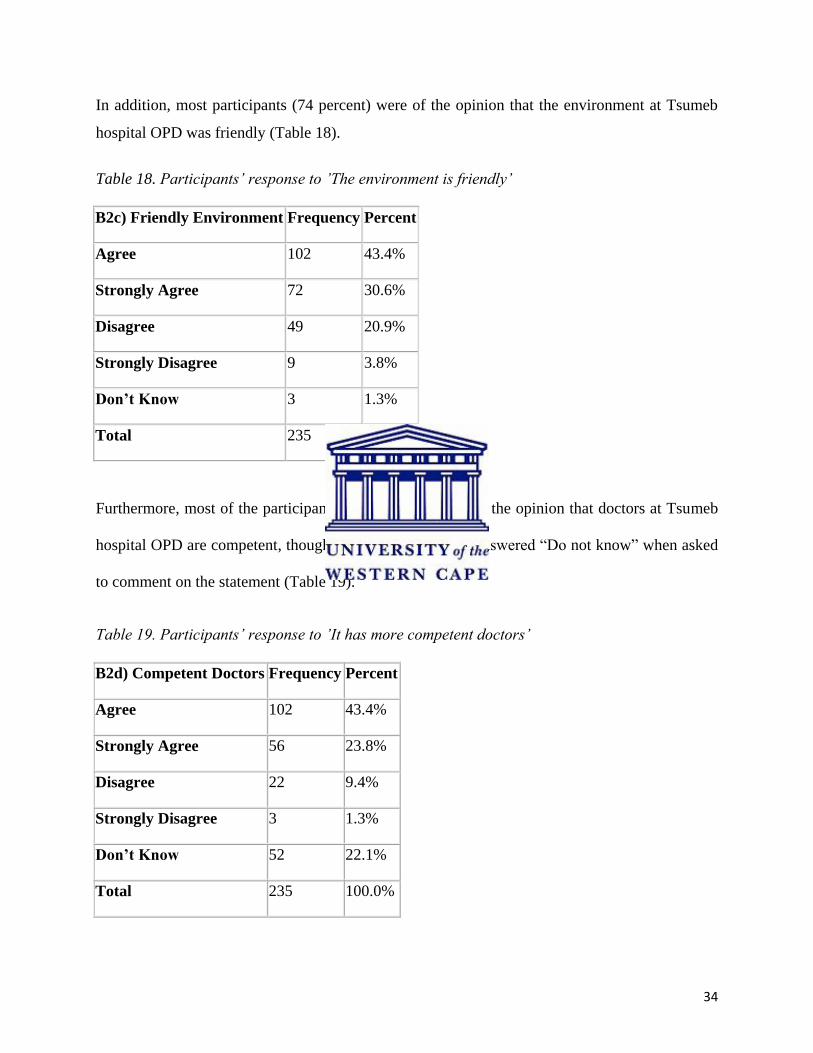
34
In addition, most participants (74 percent) were of the opinion that the environment at Tsumeb
hospital OPD was friendly (Table 18).
Table 18. Participants‟ response to ‟The environment is friendly‟
B2c) Friendly Environment Frequency Percent
Agree 102 43.4%
Strongly Agree 72 30.6%
Disagree 49 20.9%
Strongly Disagree 9 3.8%
Don’t Know 3 1.3%
Total 235 100.0%
Furthermore, most of the participants (67.2 percent) were of the opinion that doctors at Tsumeb
hospital OPD are competent, though a fifth of participants answered “Do not know” when asked
to comment on the statement (Table 19).
Table 19. Participants‟ response to ‟It has more competent doctors‟
B2d) Competent Doctors Frequency Percent
Agree 102 43.4%
Strongly Agree 56 23.8%
Disagree 22 9.4%
Strongly Disagree 3 1.3%
Don’t Know 52 22.1%
Total 235 100.0%
35
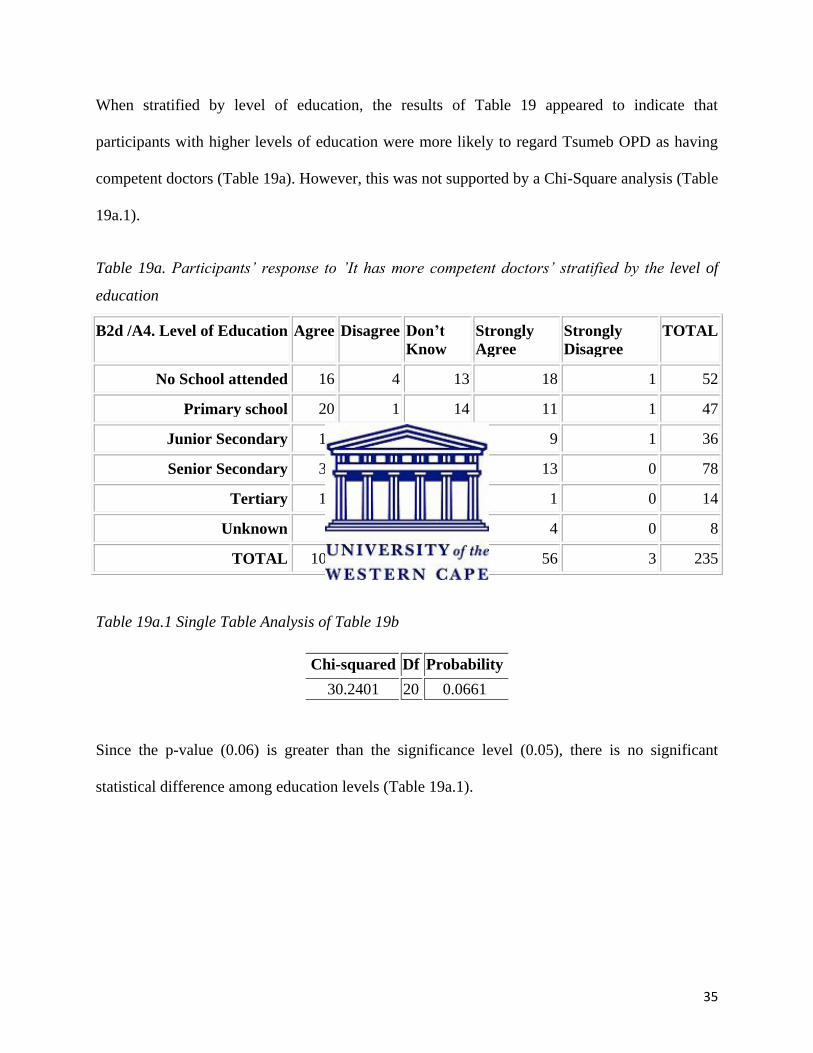
When stratified by level of education, the results of Table 19 appeared to indicate that
participants with higher levels of education were more likely to regard Tsumeb OPD as having
competent doctors (Table 19a). However, this was not supported by a Chi-Square analysis (Table
19a.1).
Table 19a. Participants‟ response to ‟It has more competent doctors‟ stratified by the level of
education
B2d /A4. Level of Education Agree Disagree Don’t
Know
Strongly
Agree
Strongly
Disagree
TOTAL
No School attended 16 4 13 18 1 52
Primary school 20 1 14 11 1 47
Junior Secondary 15 3 8 9 1 36
Senior Secondary 39 10 16 13 0 78
Tertiary 11 2 0 1 0 14
Unknown 1 2 1 4 0 8
TOTAL 102 22 52 56 3 235
Table 19a.1 Single Table Analysis of Table 19b
Chi-squared Df Probability
30.2401 20 0.0661
Since the p-value (0.06) is greater than the significance level (0.05), there is no significant
statistical difference among education levels (Table 19a.1).
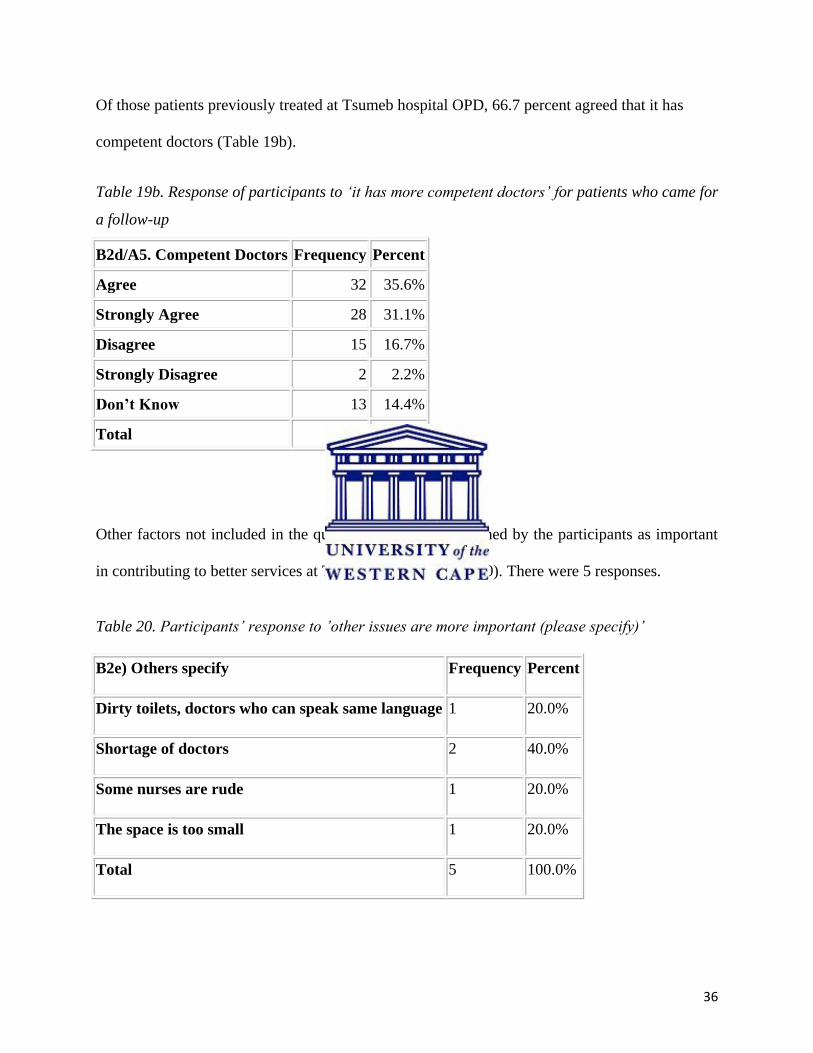
36
Of those patients previously treated at Tsumeb hospital OPD, 66.7 percent agreed that it has
competent doctors (Table 19b).
Table 19b. Response of participants to „it has more competent doctors‟ for patients who came for
a follow-up
B2d/A5. Competent Doctors Frequency Percent
Agree 32 35.6%
Strongly Agree 28 31.1%
Disagree 15 16.7%
Strongly Disagree 2 2.2%
Don’t Know 13 14.4%
Total 90 100.0%
Other factors not included in the questionnaire were mentioned by the participants as important
in contributing to better services at Tsumeb hospital (Table 20). There were 5 responses.
Table 20. Participants‟ response to ‟other issues are more important (please specify)‟
B2e) Others specify Frequency Percent
Dirty toilets, doctors who can speak same language 1 20.0%
Shortage of doctors 2 40.0%
Some nurses are rude 1 20.0%
The space is too small 1 20.0%
Total 5 100.0%
37
Overall, the variable that got the most negative response (70.2 percent) in Question 2 was “The
waiting time to see a doctor is optimal,” and the variable that got the most positive response
(81.7 percent) was “The infrastructure is good.”
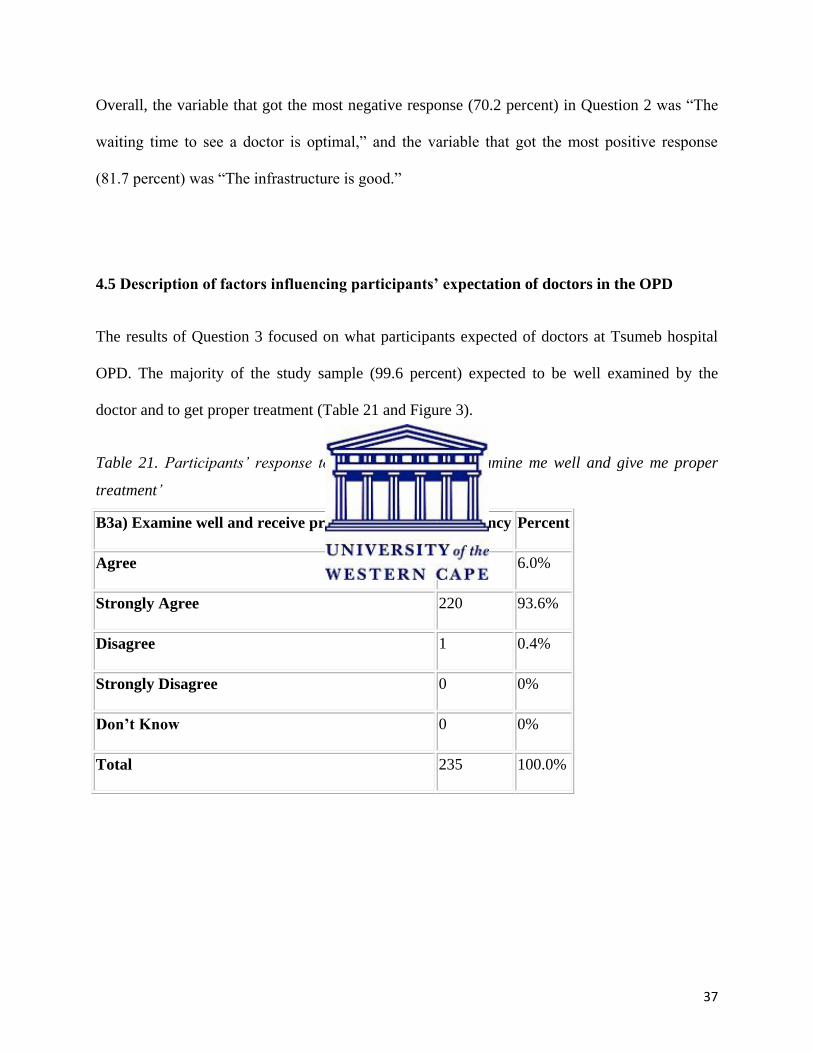
4.5 Description of factors influencing participants’ expectation of doctors in the OPD
The results of Question 3 focused on what participants expected of doctors at Tsumeb hospital
OPD. The majority of the study sample (99.6 percent) expected to be well examined by the
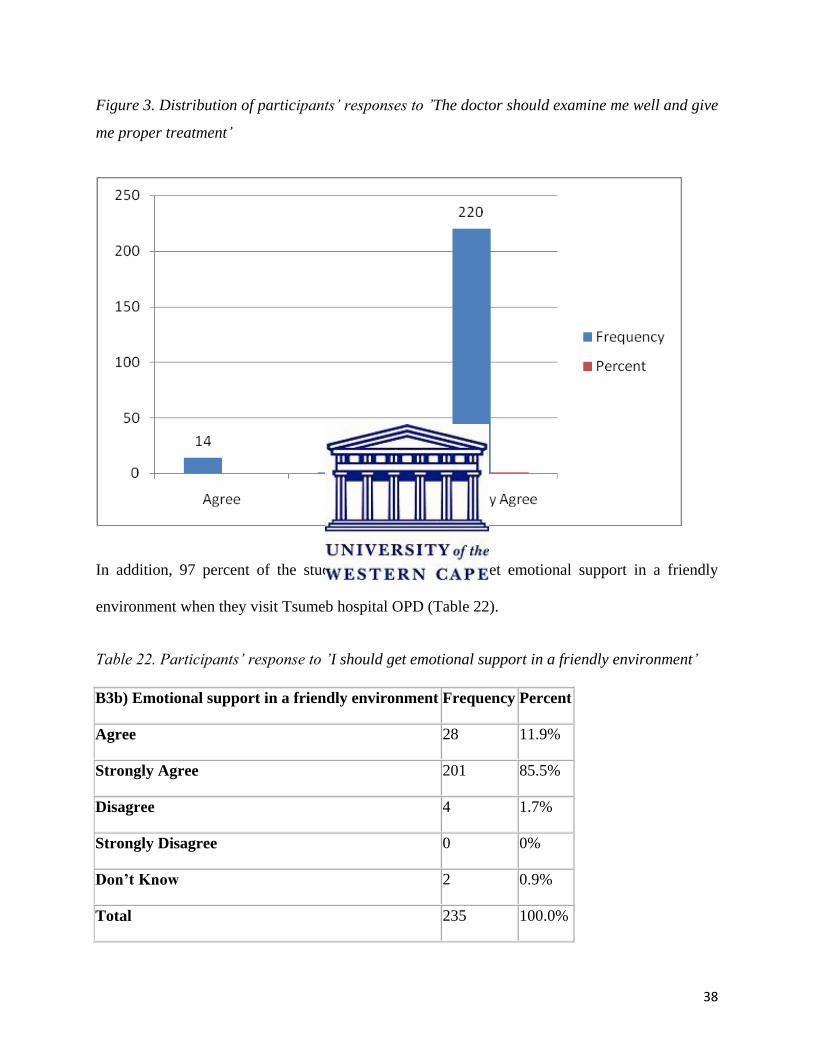
doctor and to get proper treatment (Table 21 and Figure 3).
Table 21. Participants‟ response to ‟The doctor should examine me well and give me proper
treatment‟
B3a) Examine well and receive proper Treatment Frequency Percent
Agree 14 6.0%
Strongly Agree 220 93.6%
Disagree 1 0.4%
Strongly Disagree 0 0%
Don’t Know 0 0%
Total 235 100.0%
38
Figure 3. Distribution of participants‟ responses to ‟The doctor should examine me well and give
me proper treatment‟
In addition, 97 percent of the study sample expected to get emotional support in a friendly
environment when they visit Tsumeb hospital OPD (Table 22).
Table 22. Participants‟ response to ‟I should get emotional support in a friendly environment‟
B3b) Emotional support in a friendly environment Frequency Percent
Agree 28 11.9%
Strongly Agree 201 85.5%
Disagree 4 1.7%
Strongly Disagree 0 0%
Don’t Know 2 0.9%
Total 235 100.0%
39
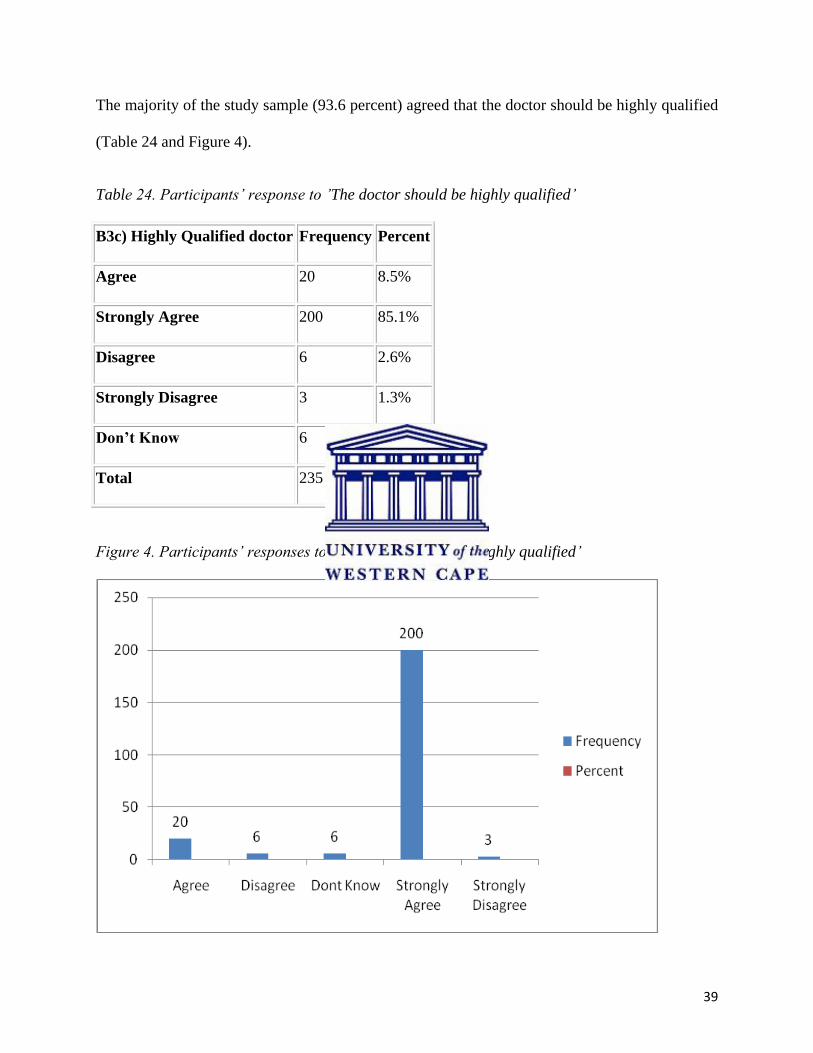
The majority of the study sample (93.6 percent) agreed that the doctor should be highly qualified
(Table 24 and Figure 4).
Table 24. Participants‟ response to ‟The doctor should be highly qualified‟
B3c) Highly Qualified doctor Frequency Percent
Agree 20 8.5%
Strongly Agree 200 85.1%
Disagree 6 2.6%
Strongly Disagree 3 1.3%
Don’t Know 6 2.6%
Total 235 100.0%
Figure 4. Participants‟ responses to ‟The doctor should be highly qualified‟
40
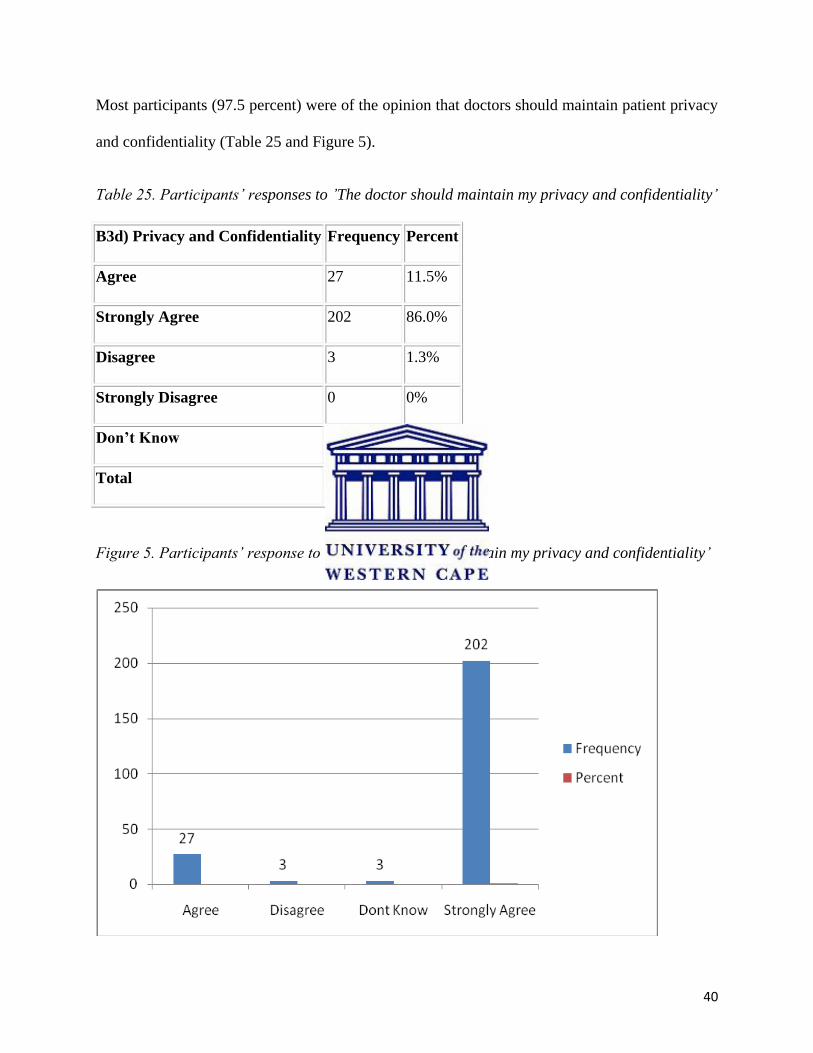
Most participants (97.5 percent) were of the opinion that doctors should maintain patient privacy
and confidentiality (Table 25 and Figure 5).
Table 25. Participants‟ responses to ‟The doctor should maintain my privacy and confidentiality‟
B3d) Privacy and Confidentiality Frequency Percent
Agree 27 11.5%
Strongly Agree 202 86.0%
Disagree 3 1.3%
Strongly Disagree 0 0%
Don’t Know 3 1.3%
Total 235 100.0%
Figure 5. Participants‟ response to ‟The doctor should maintain my privacy and confidentiality‟
41
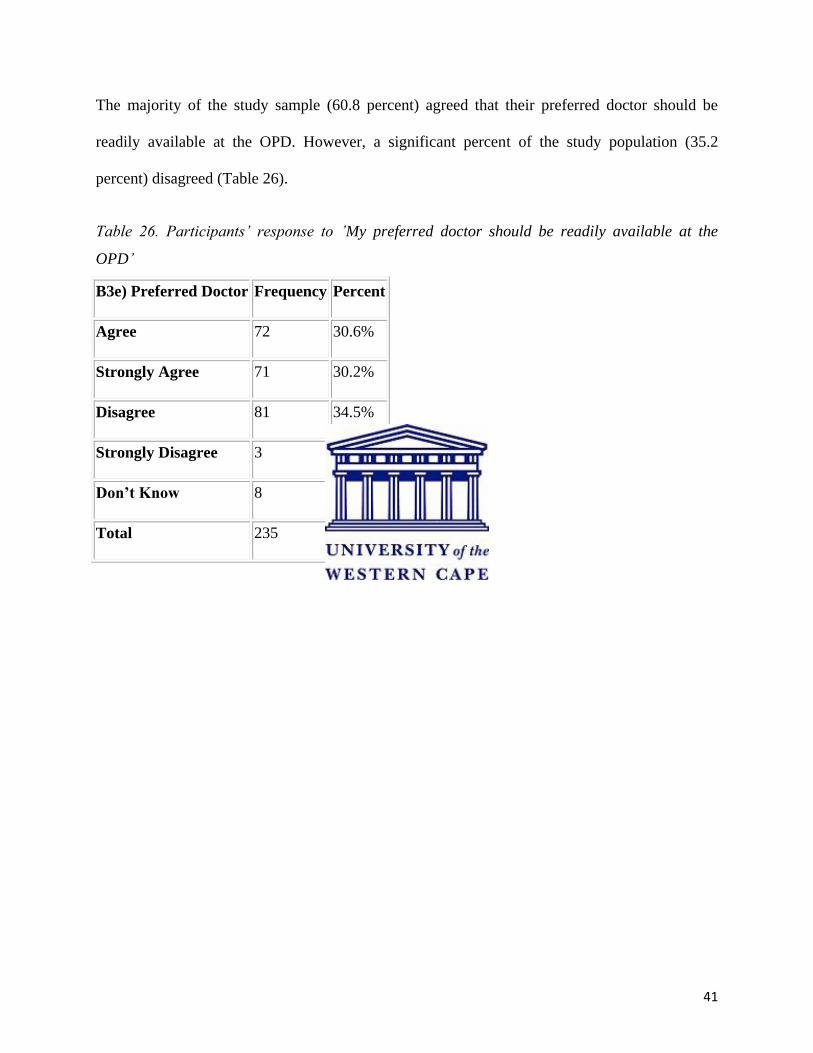
The majority of the study sample (60.8 percent) agreed that their preferred doctor should be
readily available at the OPD. However, a significant percent of the study population (35.2
percent) disagreed (Table 26).
Table 26. Participants‟ response to ‟My preferred doctor should be readily available at the
OPD‟
B3e) Preferred Doctor Frequency Percent
Agree 72 30.6%
Strongly Agree 71 30.2%
Disagree 81 34.5%
Strongly Disagree 3 1.3%
Don’t Know 8 3.4%
Total 235 100.0%
42
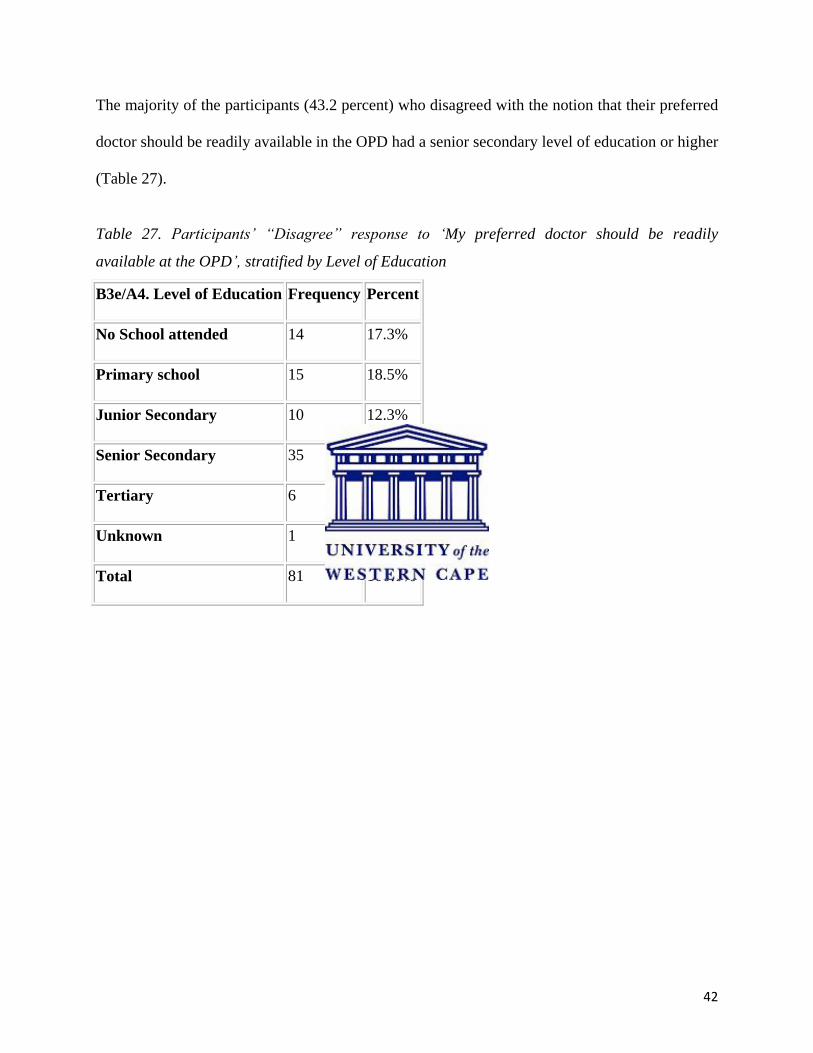
The majority of the participants (43.2 percent) who disagreed with the notion that their preferred
doctor should be readily available in the OPD had a senior secondary level of education or higher
(Table 27).
Table 27. Participants‟ “Disagree” response to „My preferred doctor should be readily
available at the OPD‟, stratified by Level of Education
B3e/A4. Level of Education Frequency Percent
No School attended 14 17.3%
Primary school 15 18.5%
Junior Secondary 10 12.3%
Senior Secondary 35 43.2%
Tertiary 6 7.4%
Unknown 1 1.2%
Total 81 100.0%
43
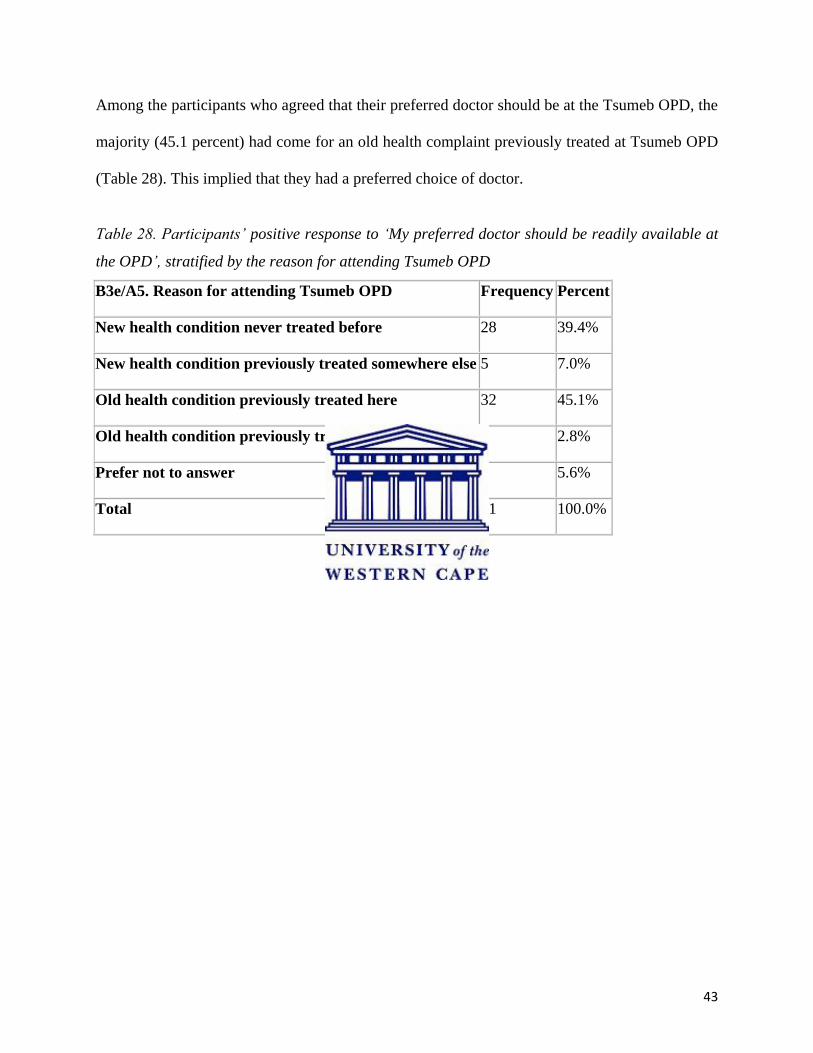
Among the participants who agreed that their preferred doctor should be at the Tsumeb OPD, the
majority (45.1 percent) had come for an old health complaint previously treated at Tsumeb OPD
(Table 28). This implied that they had a preferred choice of doctor.
Table 28. Participants‟ positive response to „My preferred doctor should be readily available at
the OPD‟, stratified by the reason for attending Tsumeb OPD
B3e/A5. Reason for attending Tsumeb OPD Frequency Percent
New health condition never treated before 28 39.4%
New health condition previously treated somewhere else 5 7.0%
Old health condition previously treated here 32 45.1%
Old health condition previously treated somewhere else 2 2.8%
Prefer not to answer 4 5.6%
Total 71 100.0%
44
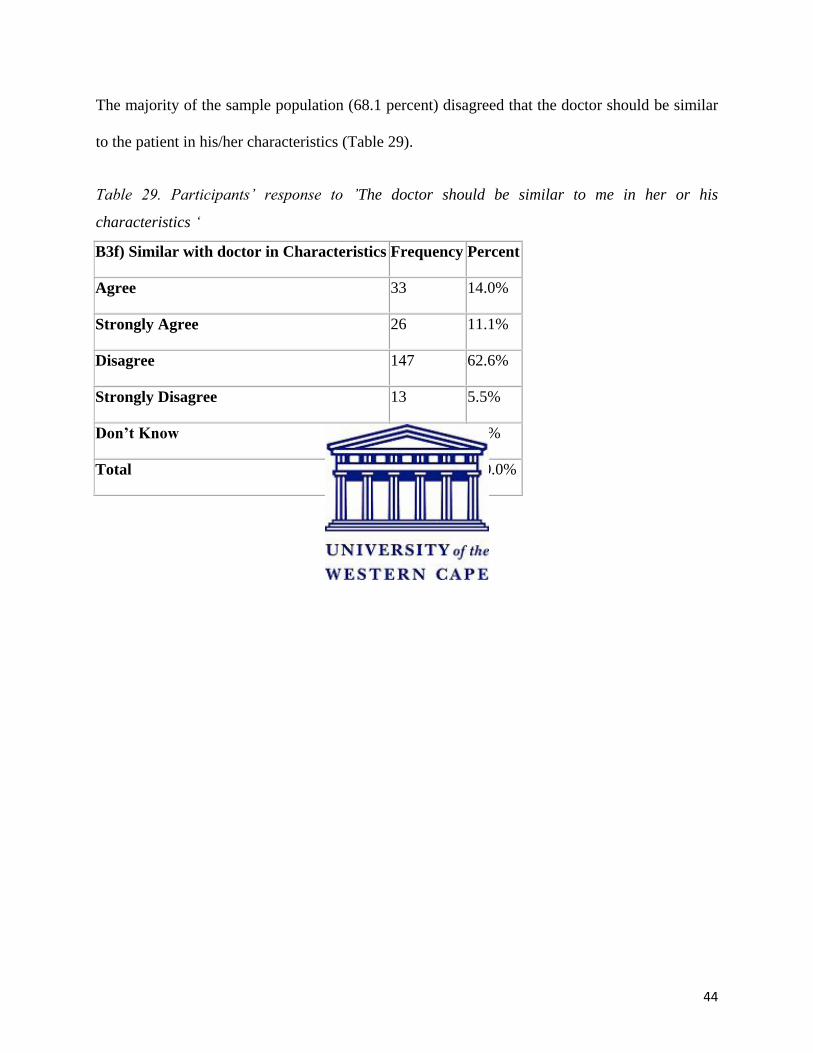
The majority of the sample population (68.1 percent) disagreed that the doctor should be similar
to the patient in his/her characteristics (Table 29).
Table 29. Participants‟ response to ‟The doctor should be similar to me in her or his
characteristics „
B3f) Similar with doctor in Characteristics Frequency Percent
Agree 33 14.0%
Strongly Agree 26 11.1%
Disagree 147 62.6%
Strongly Disagree 13 5.5%
Don’t Know 16 6.8%
Total 235 100.0%
45
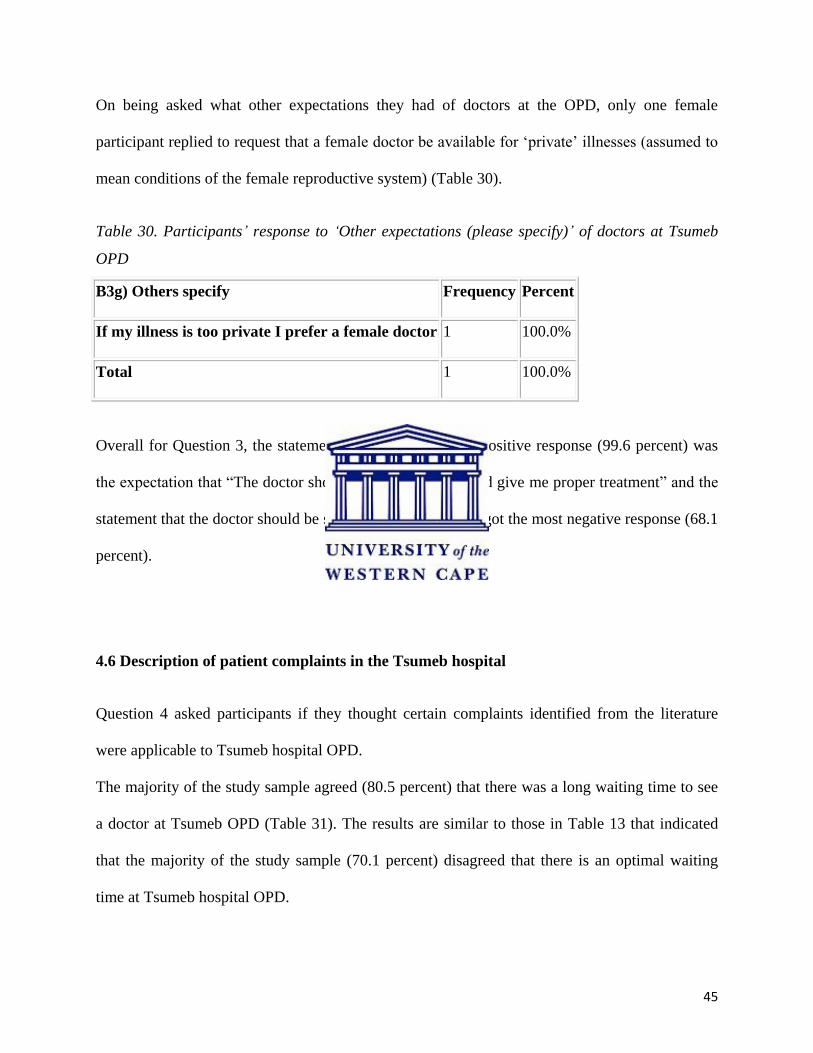
On being asked what other expectations they had of doctors at the OPD, only one female
participant replied to request that a female doctor be available for „private‟ illnesses (assumed to
mean conditions of the female reproductive system) (Table 30).
Table 30. Participants‟ response to „Other expectations (please specify)‟ of doctors at Tsumeb
OPD
B3g) Others specify Frequency Percent
If my illness is too private I prefer a female doctor 1 100.0%
Total 1 100.0%
Overall for Question 3, the statement that scored the most positive response (99.6 percent) was
the expectation that “The doctor should examine me well and give me proper treatment” and the
statement that the doctor should be similar in characteristics got the most negative response (68.1
percent).
4.6 Description of patient complaints in the Tsumeb hospital
Question 4 asked participants if they thought certain complaints identified from the literature
were applicable to Tsumeb hospital OPD.
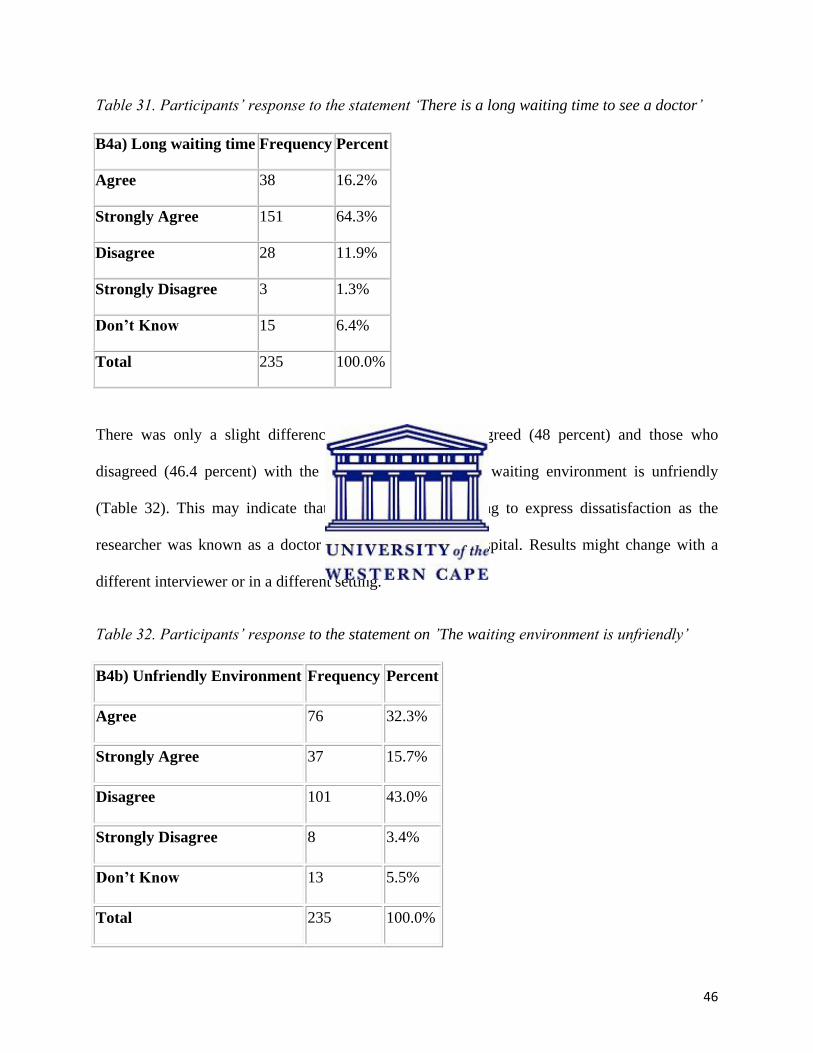
The majority of the study sample agreed (80.5 percent) that there was a long waiting time to see
a doctor at Tsumeb OPD (Table 31). The results are similar to those in Table 13 that indicated
that the majority of the study sample (70.1 percent) disagreed that there is an optimal waiting
time at Tsumeb hospital OPD.
46
Table 31. Participants‟ response to the statement „There is a long waiting time to see a doctor‟
B4a) Long waiting time Frequency Percent
Agree 38 16.2%
Strongly Agree 151 64.3%
Disagree 28 11.9%
Strongly Disagree 3 1.3%
Don’t Know 15 6.4%
Total 235 100.0%
There was only a slight difference between those who agreed (48 percent) and those who
disagreed (46.4 percent) with the statement that the OPD waiting environment is unfriendly
(Table 32). This may indicate that participants were willing to express dissatisfaction as the
researcher was known as a doctor working at the same hospital. Results might change with a
different interviewer or in a different setting.
Table 32. Participants‟ response to the statement on ‟The waiting environment is unfriendly‟
B4b) Unfriendly Environment Frequency Percent
Agree 76 32.3%
Strongly Agree 37 15.7%
Disagree 101 43.0%
Strongly Disagree 8 3.4%
Don’t Know 13 5.5%
Total 235 100.0%
47
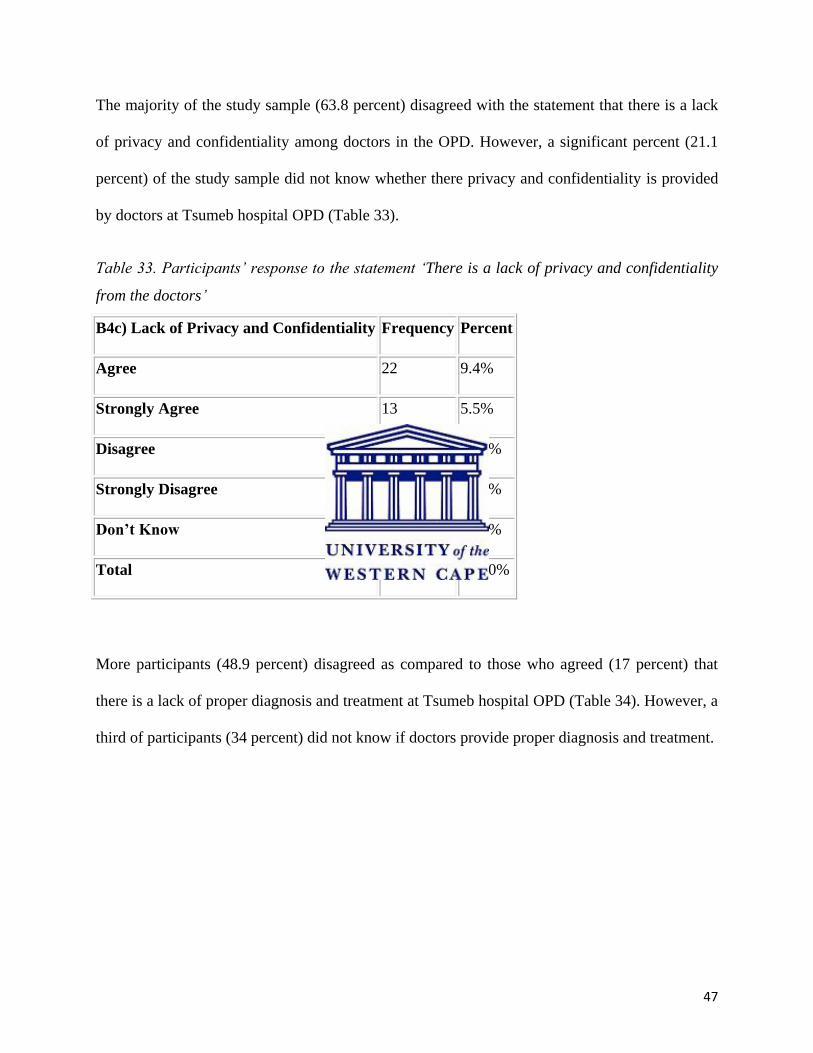
The majority of the study sample (63.8 percent) disagreed with the statement that there is a lack
of privacy and confidentiality among doctors in the OPD. However, a significant percent (21.1
percent) of the study sample did not know whether there privacy and confidentiality is provided
by doctors at Tsumeb hospital OPD (Table 33).
Table 33. Participants‟ response to the statement „There is a lack of privacy and confidentiality
from the doctors‟
B4c) Lack of Privacy and Confidentiality Frequency Percent
Agree 22 9.4%
Strongly Agree 13 5.5%
Disagree 76 32.3%
Strongly Disagree 74 31.5%
Don’t Know 50 21.3%
Total 235 100.0%
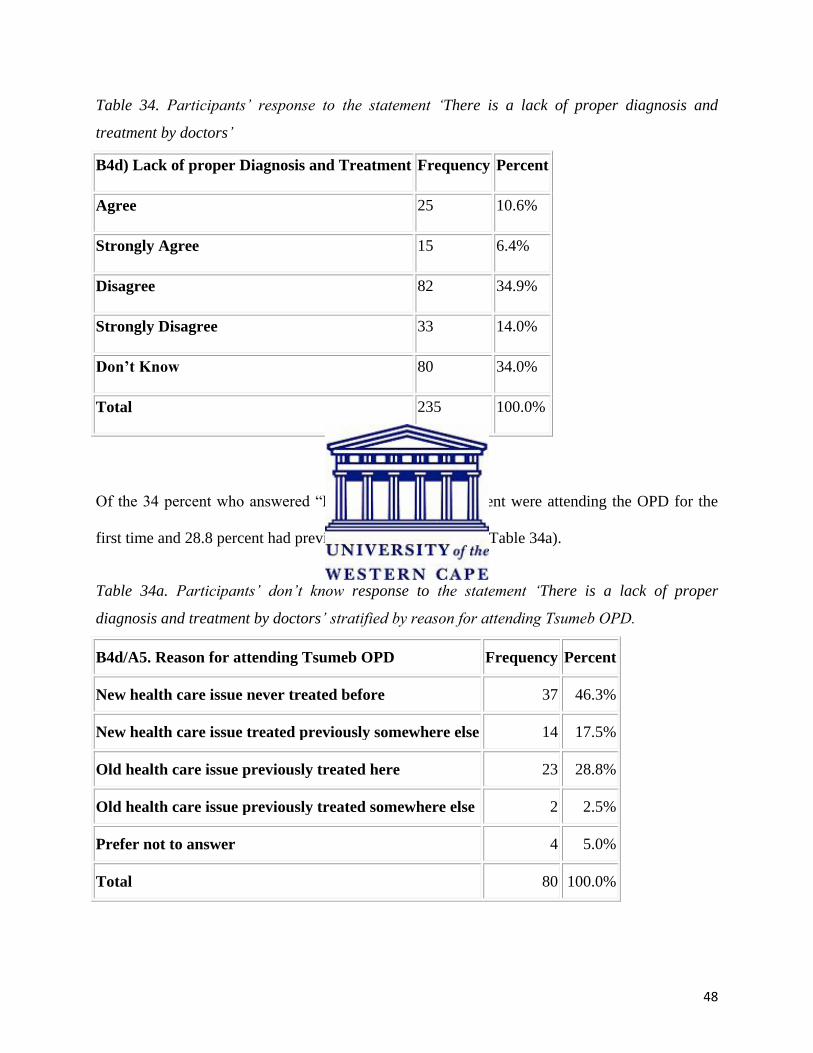
More participants (48.9 percent) disagreed as compared to those who agreed (17 percent) that
there is a lack of proper diagnosis and treatment at Tsumeb hospital OPD (Table 34). However, a
third of participants (34 percent) did not know if doctors provide proper diagnosis and treatment.
48
Table 34. Participants‟ response to the statement „There is a lack of proper diagnosis and
treatment by doctors‟
B4d) Lack of proper Diagnosis and Treatment Frequency Percent
Agree 25 10.6%
Strongly Agree 15 6.4%
Disagree 82 34.9%
Strongly Disagree 33 14.0%
Don’t Know 80 34.0%
Total 235 100.0%
Of the 34 percent who answered “Do not know”, 46.3 percent were attending the OPD for the
first time and 28.8 percent had previously attended the OPD (Table 34a).
Table 34a. Participants‟ don‟t know response to the statement „There is a lack of proper
diagnosis and treatment by doctors‟ stratified by reason for attending Tsumeb OPD.
B4d/A5. Reason for attending Tsumeb OPD Frequency Percent
New health care issue never treated before 37 46.3%
New health care issue treated previously somewhere else 14 17.5%
Old health care issue previously treated here 23 28.8%
Old health care issue previously treated somewhere else 2 2.5%
Prefer not to answer 4 5.0%
Total 80 100.0%
49
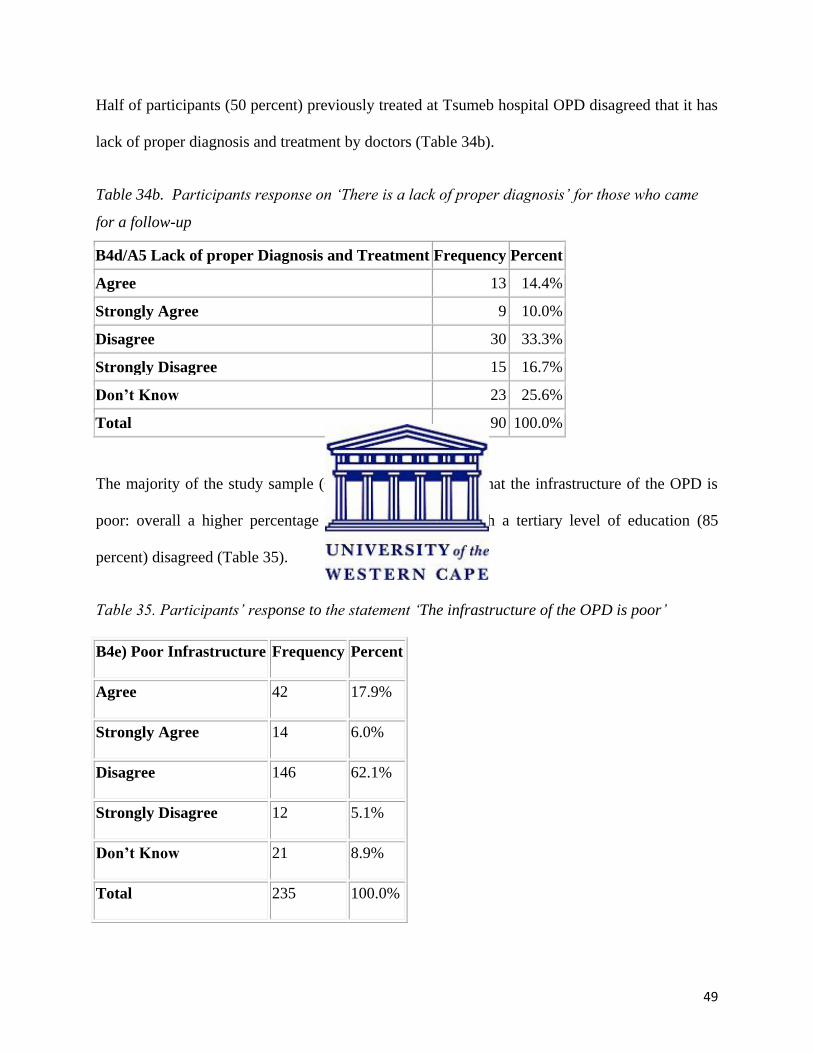
Half of participants (50 percent) previously treated at Tsumeb hospital OPD disagreed that it has
lack of proper diagnosis and treatment by doctors (Table 34b).
Table 34b. Participants response on „There is a lack of proper diagnosis‟ for those who came
for a follow-up
B4d/A5 Lack of proper Diagnosis and Treatment Frequency Percent
Agree 13 14.4%
Strongly Agree 9 10.0%
Disagree 30 33.3%
Strongly Disagree 15 16.7%
Don’t Know 23 25.6%
Total 90 100.0%
The majority of the study sample (67.2 percent) disagreed that the infrastructure of the OPD is
poor: overall a higher percentage of the study sample with a tertiary level of education (85
percent) disagreed (Table 35).
Table 35. Participants‟ response to the statement „The infrastructure of the OPD is poor‟
B4e) Poor Infrastructure Frequency Percent
Agree 42 17.9%
Strongly Agree 14 6.0%
Disagree 146 62.1%
Strongly Disagree 12 5.1%
Don’t Know 21 8.9%
Total 235 100.0%
50
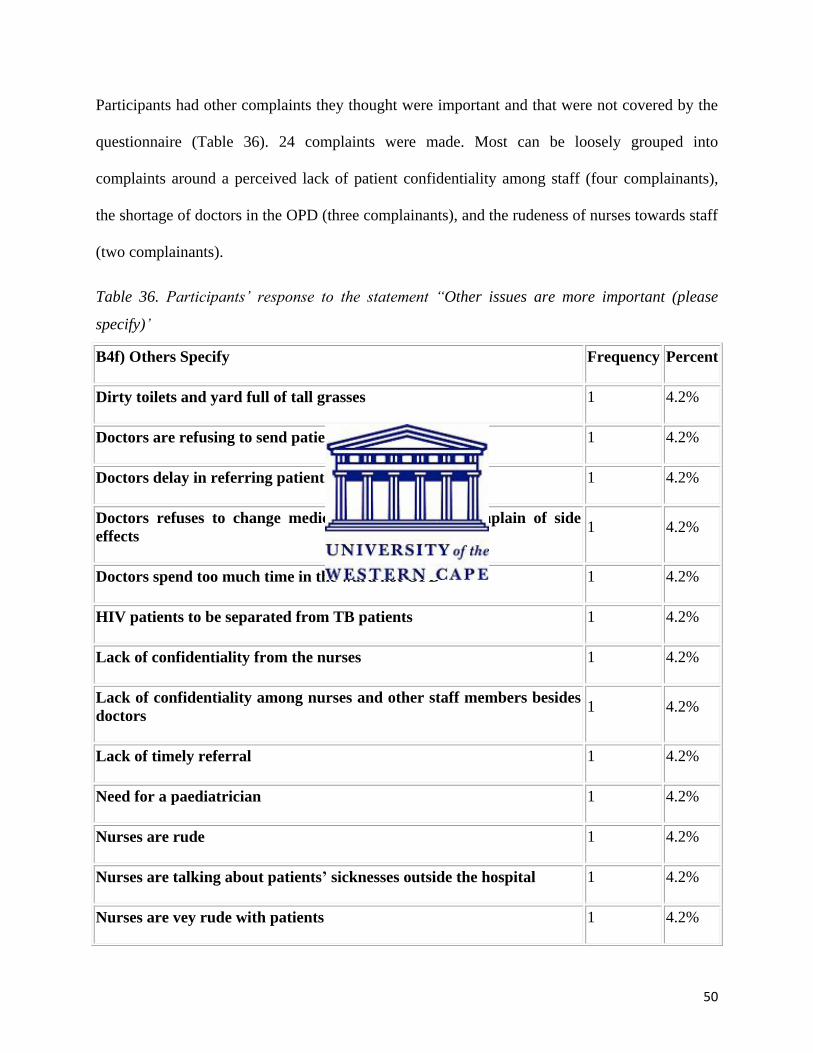
Participants had other complaints they thought were important and that were not covered by the
questionnaire (Table 36). 24 complaints were made. Most can be loosely grouped into
complaints around a perceived lack of patient confidentiality among staff (four complainants),
the shortage of doctors in the OPD (three complainants), and the rudeness of nurses towards staff
(two complainants).
Table 36. Participants‟ response to the statement “Other issues are more important (please
specify)‟
B4f) Others Specify Frequency Percent
Dirty toilets and yard full of tall grasses 1 4.2%
Doctors are refusing to send patient for sonar 1 4.2%
Doctors delay in referring patients 1 4.2%
Doctors refuses to change medicine when patients complain of side
effects 1 4.2%
Doctors spend too much time in the ward not OPD 1 4.2%
HIV patients to be separated from TB patients 1 4.2%
Lack of confidentiality from the nurses 1 4.2%
Lack of confidentiality among nurses and other staff members besides
doctors 1 4.2%
Lack of timely referral 1 4.2%
Need for a paediatrician 1 4.2%
Nurses are rude 1 4.2%
Nurses are talking about patients’ sicknesses outside the hospital 1 4.2%
Nurses are vey rude with patients 1 4.2%
51
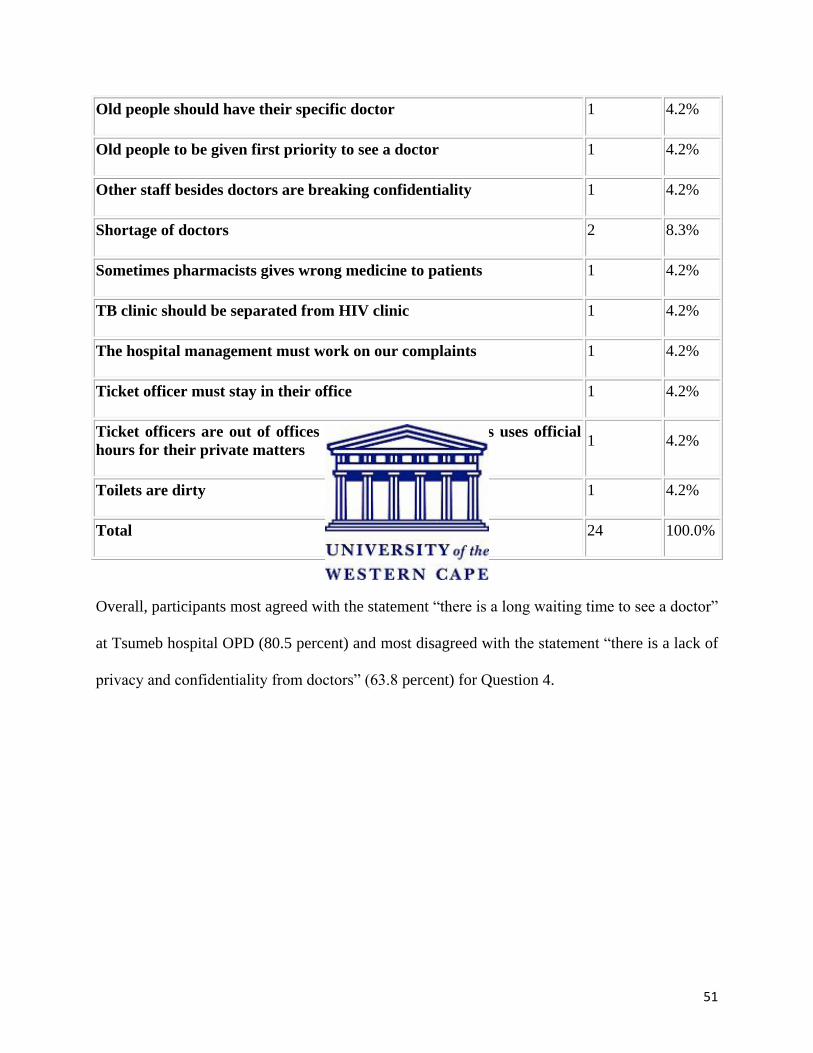
Old people should have their specific doctor 1 4.2%
Old people to be given first priority to see a doctor 1 4.2%
Other staff besides doctors are breaking confidentiality 1 4.2%
Shortage of doctors 2 8.3%
Sometimes pharmacists gives wrong medicine to patients 1 4.2%
TB clinic should be separated from HIV clinic 1 4.2%
The hospital management must work on our complaints 1 4.2%
Ticket officer must stay in their office 1 4.2%
Ticket officers are out of offices most of the time, nurses uses official
hours for their private matters 1 4.2%
Toilets are dirty 1 4.2%
Total 24 100.0%
Overall, participants most agreed with the statement “there is a long waiting time to see a doctor”
at Tsumeb hospital OPD (80.5 percent) and most disagreed with the statement “there is a lack of
privacy and confidentiality from doctors” (63.8 percent) for Question 4.
52
CHAPTER FIVE: DISCUSSION OF RESULTS
5.1 Introduction
In this chapter the results are discussed in the context of the literature review by comparing the
findings of this study with other similar studies. In addition, the results are further elaborated on
in terms of what they might mean in the context of Tsumeb Hospital OPD.
The data collection tool for this study was a structured questionnaire with a choice of pre-
determined answers. This limited the collection of in-depth information from participants. In
addition, the researcher was a doctor who worked in the same OPD: though care was taken to
explain to all participants that all responses were kept confidential and anonymous, this may
have limited some participants‟ responses. Information may have been withheld if construed by
participants as negative criticism of Tsumeb OPD.
5.1 Factors associated with participants’ satisfaction with doctors in the Tsumeb OPD
The majority of the participants who attended Tsumeb hospital OPD during the study period had
a low level of education. Low levels of education are regarded for this study as a proxy for lower
income levels, as people with less education in Namibia are correspondingly less likely to find
well-paying jobs. Patients with lower incomes are more likely to face financial constraints that
could mean they cannot afford to see a private doctor and hence have limited choices in which
doctors they can see and where they can go. In Namibia, many employed people have private
medical insurance and have the option of treatment by private doctors. The results of this study
imply that the majority of people who attend Tsumeb district hospital have lower levels of
53
education and a correspondingly lower chance of employment, leading to restricted choice in
deciding on health care services.
Although the majority of the study sample (41.3 percent) attended Tsumeb OPD clinic for a new
health complaint never before treated, a significant percentage of patients (38.3 percent) attended
for an old health complaint previously treated at Tsumeb hospital. There are two ways to
interpret this finding. On the one hand it could further support the argument that these patients
have no choice but to come back to Tsumeb OPD for the same case that was previously treated
as they have limited financial means. However, on the other hand this could indicate that patients
are satisfied with the services at Tsumeb hospital and are willing to go back. The latter point is
supported by other findings from this study: 67 percent of patients previously treated at Tsumeb
hospital OPD agreed that it has competent doctors, with half of patients previously treated at
Tsumeb hospital OPD disagreeing with the statement that there is a lack of proper diagnosis and
treatment by doctors. This ties in with existing knowledge that patients attending Tsumeb OPD
will exercise their limited range of choice by waiting to see a preferred doctor, which also
supports Baron-Epel et al‟s (2001) findings that the more satisfied patients are, the more they are
likely to come back to the same doctor. In addition 76.7 percent of participants who attended for
an old health complaint previously treated at Tsumeb OPD agreed that the infrastructure of the
OPD is good. Sahn, Young & Genicot (2002) offer scope for further expansion on the above
findings with their argument that demand for health care increases when patients have access to
qualified doctors as well as health care environment with good infrastructure. This suggests that
some of the repeat patients may be returning for care because they are satisfied with the service,
and not only out of necessity.
54
The majority of participants (97 percent) agreed that they prefer a doctor who is highly qualified,
but the question did not probe into what the participants considered as „high levels of
qualification‟. This should be explored in a further qualitative study in order to have the
participants‟ point of view as it could reflect patient perceptions that a doctor needs experience
or it could mean patients expect doctors to have specific qualifications for certain conditions.
There was no significant statistical difference by age group, sex and level of education on the
question of whether or not a doctor should be highly qualified. Other variables such as whether
or not a doctor should be friendly and understanding as well as a good listener also yielded high
positive scores with no significant statistical difference by age group, sex or level of education.
These results resemble those of Borstum & Cassily (2000) who found that perceptions of formal
and informal doctor qualifications were very important factors in choosing a doctor.
A significant number of participants (39.5 percent) disagreed with the statement that a doctor
should do what a patient tells him to do. Although there was no significant statistical difference
among respondents according to levels of education, a slightly higher number of respondents
with tertiary level education (9/14) disagreed with the statement than those with lower levels of
education. Again, there are two ways to interpret this finding. Using education as a proxy of
social economic status, the results could imply that patients with higher levels of education can
afford to pay for different tests and procedures requested by the doctor as compared to those with
less education, and hence they are not concerned by the doctor‟s instructions. Or it could mean
that those patients who are highly educated are more likely to acquiesce to the expertise of a
doctor in the management of their ailment as compared to those who have no formal schooling.
When it came to questions around the key factors that contribute to better services at Tsumeb
hospital OPD, waiting time was the central complaint. The majority of participants (70.2 percent)
55
disagreed with the statement that the waiting time at the OPD to see a doctor was optimal, in
particular amongst participants in the 51-80 age group (81.1 percent), though this was not
statistically significant. Olusaoji (2009) and Borston and Cassily (2000) among others have
found that long waiting times have a negative impact on patient satisfaction, and this finding
could thus explain much of the known dissatisfaction with Tsumeb OPD. Other variables raised
in the questionnaire, such as the presence of good infrastructure, doctors‟ qualifications and a
friendly environment yielded positive results, supporting the findings that waiting time is a
central factor in patient dissatisfaction with the OPD. The majority of participants (81.7 percent)
indicated that the infrastructure at Tsumeb hospital was good and 74 percent indicated that the
friendly environment is a key factor to better services at Tsumeb hospital.
Other key factors mentioned by participants, which in turn related to the finding on waiting
times, were availability of doctors at OPD as well as that doctors should be able to speak the
same language as the patient. Although these factors were not covered in the questionnaire and
were raised independently by patients when asked for further comments, the finding is not
surprising as there is a shortage of doctors at Tsumeb hospital and most of the time there are only
two doctors available at the OPD. In addition, among the five doctors at Tsumeb hospital at the
time the study was done, four were foreigners who could not speak the local languages and
hence depended on the availability of a translator. This increases waiting times for patients.
However, observations at the OPD by the researcher have found that patients do not appear to
favour the only doctor who speaks a local language, suggesting that the other factors identified in
this study are more important in patient decision-making.
56
5.2 Participant expectations of doctors in the Tsumeb hospital OPD
Most study participants had positive expectations of what should happen on seeing a doctor in
the Tsumeb OPD. The majority of participants (99.6 percent) agreed that they expected to be
well examined and receive proper treatment. Other expectations such as emotional support in a
friendly environment and privacy and confidentiality also yielded strong positive results (97.4
percent and 97.5 percent respectively). These results reflect those of Zebiene et al (2004), which
indicated that doctor understanding and emotional support were important patient expectations.
A significant percent of participants (60.8 percent) agreed with the statement that their preferred
doctor should be readily available at the OPD. In other words, given the opportunity, patients
would prefer to see the doctor of their choice. However, 68.1 percent disagreed with the
statement that a doctor should be similar to the patient in his/her characteristics, though those
who disagreed with the statement were more likely to have lower education levels. (This is also
an interesting finding, but beyond the scope of this questionnaire, given the issues around
language among doctors in the OPD.) This could reflect the fact that there is already a scarcity of
doctors at Tsumeb hospital, as Leonard (2004) found in many developing countries, and hence
patients‟ choice of doctors is limited.
5.3 Participant complaints about doctors in the OPD
The second important finding of the study was that it found several gaps between participant
expectations and actual experiences of seeing doctors in the OPD, as shown by the participant
responses to negative statements, or complaints. Supporting the first finding on waiting times
from Question 2, the majority of participants (80.5 percent) agreed that there is a long waiting
57
time to see a doctor at Tsumeb OPD. This can be attributed to the lack of doctors, as is the case
in most developing countries
Most of the participants (74 percent) indicated that a friendly environment is a key factor
contributing to better services at Tsumeb hospital, but nearly half did not think this could be
found at Tsumeb hospital OPD. There was slight difference between those who agreed (48
percent) and those who disagreed (46.4 percent) that the waiting environment at Tsumeb hospital
OPD was unfriendly. This variation could be due to some patients possibly being unwilling to
express their view freely as the interviewer was a doctor working at the same hospital. There was
a statistically significant difference when accounting for level of education, as respondents with a
tertiary level of education were most likely to agree that the waiting environment was unfriendly
(P value=0.05). This could be attributed to participants with a higher level of education being
more informed about their rights as compared to those with less education, or that people with
higher education levels are more likely to have jobs and feel that they can complain as they can
utilize other options than Tsumeb. One way to look deeper into this issue would be to conduct
another study that involves interviewing participants from the community who are not presently
attending the hospital OPD, as people may be more willing to discuss negative aspects of service
when not immediately reliant on that service.
Other possible complaints such as a lack of privacy and confidentiality, lack of proper diagnosis
and treatment as well as poor infrastructure did not appear to apply to doctors at Tsumeb hospital
OPD (though a lack of confidentiality among nurses was independently raised by a small number
of participants). However, over a third of participants did not know whether or not there was a
lack of proper diagnosis and treatment as many were attending for the first time. Even among
those who attended the OPD for a follow-up visit, 26.5 percent replied „Do not know‟ to the
58
question of whether or not there was a lack of proper diagnosis. This is similar to the results of
Question 2 in which 21.1 percent of respondents did not know whether or not Tsumeb OPD has
competent doctors. It is therefore difficult to either dismiss or consider complaints about actual
service quality and a different study structure that either only targeted patients returning for
treatment or that interviewed patients immediately after the consultation would be required. The
majority of participants (85 percent) with a tertiary level of education disagreed that the
infrastructure of the OPD is poor, although there was no significant statistical difference by
different levels of education (P value = 0.07), suggesting that the OPD infrastructure is also
considered reasonable by those who are more likely to have the choice of private consultations.
When asked to state what other issues were felt important, four participants complained about
the lack of confidentiality among other staff besides doctors at Tsumeb hospital OPD. Three
participants complained about the referral system and two other participants complained about
the rude nurses at Tsumeb hospital OPD. These two complaints were not covered by the
questionnaire but I suggest that they be investigated further using a qualitative study design.
59
CHAPTER SIX: CONCLUSION
The study indicated that the majority of participants considered high qualification levels, being
friendly and understanding and being a good listener as important factors in choosing a doctor.
Although the majority of participants (80 percent) complained about long waiting times to see a
doctor at Tsumeb hospital OPD, with the unfriendly environment the second most common
complaint, just over a third of patients who participated in the study were previously treated at
the same hospital OPD. This could indicate that these patients have few other choices for health
care, or that the patients were satisfied with the service they received at Tsumeb hospital OPD.
The latter idea is difficult to assert with the data from the study as only about 50 percent of those
patients who were returning for a follow-up indicated that they perceived the diagnosis and
treatment received from doctors at Tsumeb OPD as of good quality.
The study also found that there are gaps between patient expectations and experiences at Tsumeb
OPD. Factors identified as important in influencing patient expectations of doctors included
variables such as the quality of the doctor‟s examination, qualifications and the maintenance of
privacy and confidentiality.
Other issues of importance raised by participants were poor referral systems and rude staff,
especially nurses at Tsumeb hospital OPD. These issues need further investigation in order to
ensure good patient care, as they were not covered by the questionnaire used in this study. The
patient concern that there is a lack of confidentiality among nurses should in particular be
followed up by the Tsumeb hospital authority.
Overall, however, the study suggests that focusing on cutting down waiting times would resolve
a significant amount of patient dissatisfaction with Tsumeb hospital OPD. Long-term issues such

60
as quality of care should be addressed to ensure that health care staffs at the OPD are able to best
serve patients from all backgrounds.
61
REFERENCES
Ahmad, W., Kernohan, E. & Baker, M. (1991). Patient‟s Choice of General Practitioner:
Importance of Patients‟ and Doctors‟ Sex and Ethnicity. British Journal of General Practice,
(41): 330-331
Andaleeb, S. (2001). Service Quality Perceptions and Patient Satisfaction: A Study of Hospitals
in a Developing Country. Social Science and Medicine, (52): 1359-1370
Al-Sabir, J., Piechulek, H. (2001). Client Satisfaction and Quality of Health Care in Rural
Bangladesh. Bulletin of the World Health Organisation, (6): 512-517
Britten, N. (2004). Patients‟ Expectations of Consultations. British Medical Journal, (328): 416
Biørn, E. & Godager, G. (2008). Does Quality Influence Choice of General Practitioner? An
Analysis of Matched Doctor Patient Panel Data. University of Oslo: Sweden
Bornstein, B., Marcus, D., Cassidy, W. (2000). Choosing a Doctor: An Exploratory Study of
Factors Influencing Patients‟ Choice of a Primary Care Doctor. Journal of Evaluation in Clinical
Practice, 6(3): 255-262
Baker, S. (1998). Managing Patients Expectation. Willy Johns & Sons: Nebraska
Bachsa, F. (2005). Methods Measuring Patients Satisfaction in Health Care Organization. Health
Care Management Review, (22): 2
Butler, C., Rollnick, S., Pill, R., Maggs-Rapport & Stott, N. (1998). Understanding the Culture of
Prescribing; Qualitative Study of General Practitioners‟ and Patients‟ Perceptions of Antibiotics
for Sore Throats. British Medical Journal, (317): 637
62
Baron-Epel, O., Dushenat, M. & Friedman, N. (2001). Evaluation of Consumer Model:
Relationship Between Patients‟ Expectations, Perceptions and Satisfaction with Care.
International Journal for Quality in Health Care, 13(4): 317-323
Charlottee. Z., Rogers, S. (1999). General Practitioner Perceptions of Effective Health Care;
British Medical Journal, (318): 1532
Coulter, A. (2010). Do Patient want a Choice and Does it Work? British Medical Journal, (341):
349
Cockburn, J. & Pit, S. (1997). Prescribing Behaviour in Clinical Practice: Patients‟ Expectations
and Doctors‟ Perceptions of Patients‟ Expectation-A questionnaire study. British Medical
Journal, (315): 520-3
Dozier, A., Kitzman, H., Ingersoll, L., Holmberg, S & Schultz, W. (2001). Development of an
Instrument to Measure Patient Perception of the Quality of Nursing Care. Research In Nursing &
Health 2001, 24(1): 506-517
Drumond, M., Stoddart, G., Labelle, R. & Cushman, R. (1987). Health Economics: An
Introduction for Clinicians. Annals of Internal Medicine 107(1): 88-92
Earls, J., Emington, S., Lazou, J., O‟Leary, C & Cole, k. (2007). Valuing Public Service.
Amucus: London
Elwyn. G. & Braspenning, J. (2003). Doing Prescribing: High Hopes and Unexplored Beliefs - A
Novel Approach to Assessing Prescribing Behaviour Involving the Views of Both Patients and
Doctors, Combined With an Independent View of “Appropriateness” Provides a Sophisticated
Approach to the Act of Prescribing. Quality and Safety in Health Care, (12): 243
63
Edward, N. (2009). Determinants of Consumer Satisfaction of Health Care in Ghana: Does
Choice of Health Care Provider Matter. Global Journal of Health Science, (1): 2
Farooqi, J. (1997). Patient Expectation of General Practitioner Care. Middle East Journal of
Family Medicine (3):3.
Gage, H. & Rickman, N. (2000). Patient Choice and Primary Health Care. University of Surrey:
Guildford.
Heritage, J & Stivers, T. (1999). Online Commentary In Acute Medical Visits: A Method of
Shaping Patient Expectations. Social Science Medicine, (49): 1501-17
Hamid, S., Sadique, Z., Ahmed, S. & Molla, A. (2005). Determinants of Choice of Healthcare
Providers: Evidence from Selected Rural Areas of Bangladesh. Pakistan Journal of Social
Sciences, 3(3): 437-444
Health Information System (HIS) Report (2008). Tsumeb District Annual Report, Republic of
Namibia. Oshikoto Region MIS
Hsu, J., Scmittdiel, J., Krupat, E., Stein, T., Thom, D., Fireman, B., Selby, J. (2000) A
Randomised Controlled Trial of Provider Selection. California. Journal of General Internal
Medicine, 18(5): 319-25
Incentive in Health Care System (2008). Competition and choice of Health Care Provider.
Patient Choice Driving Incentives. IFPMA.
Kmietowicz, Z. (2007). Health Services Needs to Engage More with Patients, Says Nuffield
Trust. British Medical Journal, (335): 632
64
Kruk, M., Paczkowski, M., Mbaruku, G., Pinho B., Galea S.(2009). Women‟s Preferences for
Place of Delivery in Rural Tanzania: A Population-Based Discrete Choice Experiment. American
Journal of Public of Public Health, (199): 1666-1672
Leonard, K. (2004) Active Patients in Rural Africa: Health Care Implication for Research and
Policy. Evidence of Learning About Clinician Quality in Tanzania. University of Maryland:
Maryland.
Leonard, K. (2006). Learning in Health care. Evidence of Learning About Clinician Quality in
Tanzania. University of Maryland: Maryland.
Little, P. (2004). Doctors Do However Need to Elicit Expectations to Prevent Needless
Investigations. British Medical Journal, (328): 444
Leonard, K., Mlinga, G. & Mariam, D. (2002). Bypassing Health Centers in Tanzania: Revealed
Preferences for Observable and Unobservable Quality. Columbia University: New York
Muhondwa, E., Leshabari, M., Mwangu, M., Mbembati, J., Ezekiel, M. (2003). Patient
Satisfaction at the Muhimbili National Hospital in Dar-es-salaam, Tanzania. East African
Journal of Public Health (5): 2
Matovu, M., Wiseman, V., Mcelroy, B., Kongongo, M., Conteh, L. & Mwengee, W. (2004).
Factors Influencing Choice of Provider of Malaria Treatment: Evidence from a Low-income
Area in Tanzania. London School of Hygiene and Tropical Medicine: London
Ministry of Health and Social Services (2008). System Review Report, Republic of Namibia.
Ministry of Health and Social Services (2009). Strategic Plan 2009-2013, Republic of Namibia
NERA Report (2008). Competition and Choice of Health care Provider: Patients Choices
Driving Incentives. IFPMA.
65
Ntabaye, M., Scheutz, F. and Poulsen, S. (1993). Patient Satisfaction with Emergency Oral
Health Care in Rural Tanzania. Community Dentistry and Oral Epidemiology, 26(5): 289-295
Ndeso-Atanga, S. (2003). Health Care Quality and the Choice of Care Providers. Cameroon:
University of Buea.
Olusoji, D. (2009) Patient Satisfaction: A Case Study of Olabisi Onabanjo University Teaching
Hospital. Nigeria. Thesis for Masters of Business Administration: Nigeria
Palmer, N. (1995). Health Economics and Financing Program. London School of Hygiene and
Tropical Medicine: London.
Pascoe, G. (1983) Patient satisfaction in Primary Health Care: A Literature Review and
Analysis. University of California: San Francisco.
Palmer, N. (1999). „Patient Choice of Primary Care Provider‟. South Africa Health Review 1998.
Health System Trust: Durban.
Qatari, G. & Haran, D. (1999). Determinants of Users‟ Satisfaction with Primary Health Care
Settings and Services in Saudi Arabia. International Journal for Quality in Health Care, (11):
523-531
Schneider, H., Blaauw, D., Magongo, B., & Khumalo, I. (1999). „STD Care in the Private
Sector‟. South Africa Health Review 1998. Health System Trust: Durban
Smith, T. (2003). Can Patient Choice Shape Organisational Behaviour to Provide Patients with
What they Want? Quality and Safety in Health Care. (12): 473-476
Sahn, D., Younger, S. & Garance, G. (2002). The Demand for Health Care Services in Rural
Tanzania. University of California: USA
66
Spence, D. (2002). Traditional Medicine in Namibia. Traditional Medical Research &
Publications. Windhoek: Namibia.
Thompson, A. & Sunol, R. (1995). Expectations as Determinants of Patients Satisfaction:
Concept, Theory and Evidence. International Journal for Quality in Health Care. (7): 127-141
White, B. (1999). Measuring Patient Satisfaction: How to Do It and Why to Bother. Family
Practice Management, (2): 120-2
Wilhem, K., Wedgwood, L. Malhi, G., Mitchell, P., Austine, M., Kotze, B. Niven, H., Parker, G.
(2005). Great Expectations: Factors Influencing Patient Expectations and Doctor‟s
Recommendations at a Mood disorder Unit. Journal of Affective Disorders. (88): 187-192
Woolf, S., Chan, E., Harris, R., Sherdan, S., Braddock, C., Kaplan, R., Krist, A., Connor, A. &
Tunis, S. (2005). Promoting Informed Choice: Transforming Health Care To Dispense
Knowledge for Decision Making. Annals Internal Medicine Journal, 143: 293-300
Yip, W., Wang, H. & Liu, Y. (1998). Determinants of Patient Choice of Medical Provider: A
Case Study in Rural China. Health Policy and Planning, 13(3): 311-322
Zebiene, E., Razgauskas, E., Basys, V., Baubiniene, A., Gurevicius, R., Padaiga, Z. & Svab, I.
(2004). Meeting Patient‟s Expectations in Primary Care in Lithuania. International Journal for
Quality in Health, 16(1): 83-89
67
APPENDIX 1: QUESTIONNAIRE
UNIVERSITY OF THE WESTERN CAPE
School of Public Health
Private Bag X17 ● BELLVILLE ● 7535 ● South Africa
Tel: 021- 959 2809, Fax: 021- 959 2872
Interviewer‟s name: Dr J J Rutabanzibwa UWC student no: 2836270
Tel: (264) 0812065253 E-mail: [email protected]
Please tell me a little about yourself.
1. What year were you born?
2. Are you male or female?
3. What language do you speak at home?
4. What was the last year of school that you completed?
5. Why are you attending Tsumeb OPD today? Please choose the answer that best describes
your reason:
a). For a new health complaint never treated before
b). For a new health complaint previously treated at a different health centre
c). For an old health complaint previously treated at Tsumeb OPD
d). For an old health complaint previously treated at a different health centre
e). Prefer not to answer this question
f). Other reason (please explain)
68
I will now ask you some questions. Please tell me if you strongly agree, agree, disagree or
strongly disagree with each question.
1. What do you consider when you choose which doctor to see at Tsumeb hospital OPD?
Please tell me if you strongly agree, agree, disagree or strongly disagree.
a). Should be highly qualified
b). Should be friendly and understanding
c). Should be a good listener
d). Should do what I tell him to do
e). Other issues are more important (please specify)
2. The following are key factors which contribute to better services at Tsumeb Hospital
OPD. Please tell me if you strongly agree, agree, disagree or strongly disagree.
a). The waiting time to see a doctor is optimal
b). The infrastructure is good
c). The environment is friendly
d). It has more competent doctors
e). Other issues are more important (please specify)
3. What do you expect of doctors at Tsumeb hospital OPD? Please tell me if you strongly
agree, agree, disagree or strongly disagree with these statements.
a). The doctor should examine me well and give me proper treatment
b). I should get emotional support in a friendly environment
c). The doctor should be highly qualified
d). The doctor should maintain my privacy and confidentiality
e). My preferred doctor should be readily available at the OPD
f). The doctor should be similar to me in her or his characteristics (age, sex, race, religion
etc)
g.) Other expectations (please specify)
69
4. Sometimes the Tsumeb hospital OPD gets complaints. We want to know if the problems
that are sometimes reported are common or rare. Please tell me if you strongly agree,
agree, disagree or strongly disagree with these statements.
a). There is a long waiting time to see a doctor
b). The waiting environment is unfriendly
c). There is a lack of privacy and confidentiality from the doctors
d). There is a lack of proper diagnosis and treatment by doctors
e). The infrastructure of the OPD is poor
f). Other issues are more important (please specify).
70
APPENDIX 2: PARTICIPANTS INFORMATION SHEET
UNIVERSITY OF THE WESTERN CAPE
School of Public Health
Private Bag X17 ● BELLVILLE ● 7535 ● South Africa
Tel: 021- 959 2809, Fax: 021- 959 2872
PARTICIPANTS INFORMATION SHEET
Interviewer‟s name: Dr J J Rutabanzibwa UWC student no: 2836270
Tel: (264) 0812065253 E-mail: [email protected]
Institution: Tsumeb district hospital
Thank you for allowing me to interview you. I am Dr J. J. Rutabanzibwa, a student at the School
of Public Health (SOPH), University of the Western Cape. As part of my Masters in Public
Health, I am required to conduct research for the mini-thesis. I am focusing on improving the
quality of health care at Tsumeb hospital OPD. The results of this research may be used by
Oshikoto regional health directorate to improve the quality of health services at Tsumeb hospital
and for the entire region. I am accountable to Ann Parsons who is contactable at 021 959 9389 or
c/o SOPH Fax: 021 959 2872 or by e-mail at [email protected].
The interview may touch on issues for which you might criticize doctors. Criticism will not be
reported to anyone at the hospital. If there is anything that you prefer not to discuss please feel
free to say so. I will not be offended and there will be no negative consequences if you would
prefer not to answer a question or withdraw from the study. I would appreciate your guidance
should I ask anything which you see as intrusive. You can withdraw from the interview at any
time during the process and there will be no consequences.
At all times, I will keep all information confidential and refer to you by a number. This will
ensure that your data is anonymous. I shall keep records of your participation locked away at all
times, and destroy them after the data has been collected.
71
APPENDIX 3: INFORMED CONSENT
UNIVERSITY OF THE WESTERN CAPE
School of Public Health
Private Bag X17 ● BELLVILLE ● 7535 ● South Africa
Tel: 021- 959 2809, Fax: 021- 959 2872
RECORD OF INFORMED CONSENT TO CONDUCT INTERVIEW
Date:
Interviewer‟s name: Dr J J Rutabanzibwa UWC student no: 2836270
Tel: (264) 0812065253 E-mail: [email protected]
Institution: Tsumeb district hospital
Interviewee‟s number:
Place at which the interview was conducted:
Thank you for allowing me to interview you. What follows is an explanation of the purpose and
process of this interview. You are asked to give your consent for me to conduct an interview with
you and to use this data for an assignment for my studies at the School of Public Health (SOPH),
University of Western Cape.
1. Information about the interviewer
I am Dr J. J. Rutabanzibwa, a student at SOPH. As part of my Masters in Public Health, I
am required to conduct research for the mini-thesis. I am focusing on improving the
quality of health care at Tsumeb OPD. I am accountable to Ann Parsons who is
contactable at 021 959 9389 or c/o SOPH Fax: 021 959 2872 or by e-mail at
Here is some information to explain the purpose and usage of my interview.
2. Purpose and contents of interview
72
The aim of this study is to identify factors considered influencing patient satisfaction with
the quality of care provided by doctors at Tsumeb district hospital Out Patient
Department.
3. The interview process
This will consist of an individual interview using a questionnaire. I will read out each
question to you and ask for your answer. Answering the questionnaire will take
approximately thirty minutes and will be conducted in an isolated room. Only the
researcher will hear your answers.
4. Anonymity of participants
At all times, I will keep all your information confidential and anonymous. I will only
refer to you or your words by a randomly assigned number. I shall keep records of your
participation locked away at all times, and destroy them after the data is collected. Only I
will have access to your data.
5. Things that may affect your willingness to participate
The interview may touch on issues for which you might criticize doctors. Criticism will
not be reported to anyone at the hospital. If there is anything that you prefer not to discuss
please feel free to say so. I will not be offended and there will be no negative
consequences if you would prefer not to answer a question. I would appreciate your
guidance should I ask anything which you see as intrusive. You can withdraw from the
interview at any time during the process and there will be no consequences. Should you
request it, a copy of this consent form will be provided to you.
6. Agreement
6.1 Interviewee’s agreement
If you are willing to participate in the research then please sign and put the date below.
Signed (interviewee):
Date Place
6.2 Interviewer’s agreement
I shall keep the contents of the above research interview confidential. A randomly
assigned number will be used instead of real names in all documents that refer to the
interview. The contents will be used for the purposes referred to above, but may be used
for published or unpublished research at a later stage without further consent. Any change
from this agreement will be renegotiated with you.
Signed (interviewer):
Date Place: