Factors Influencing Consumers’ Intention to Adopt Near ... · Keywords: mobile wallet, near field...
154
Factors Influencing Consumers’ Intention to Adopt Near Field Communication Mobile Payments at the Point of Sale Masters Thesis Slaveya Taneva Spring Term 2017 Chair of Quantitative Marketing and Consumer Analytics L5, 2 - 2. OG 68161 Mannheim www.quantitativemarketing.org Advisor: Kateryna Gavrysh
Transcript of Factors Influencing Consumers’ Intention to Adopt Near ... · Keywords: mobile wallet, near field...

Factors Influencing Consumers’ Intention to Adopt Near Field
Communication Mobile Payments at the Point of Sale
Masters Thesis
Slaveya Taneva
Spring Term 2017
Chair of Quantitative Marketing and Consumer Analytics L5, 2 - 2. OG 68161 Mannheim www.quantitativemarketing.org
Advisor: Kateryna Gavrysh
I
Table of Content
List of Figures .................................................................................................................... III
List of Tables ....................................................................................................................... V
List of Abbreviations ........................................................................................................ VII
Abstract.............................................................................................................................. IX
1. Introduction .....................................................................................................................1
2. Literature Review ............................................................................................................6
2.1. Theories of Innovation Adoption and Technology Acceptance .................................7
2.2. Previous Research in Mobile Payments Adoption and Related Fields ..................... 14
3. Methodological Approach ............................................................................................. 19
3.1. Study Design .......................................................................................................... 19
3.2. Procedure ............................................................................................................... 22
3.3. Measures ................................................................................................................ 23
4. Empirical Analysis and Results ..................................................................................... 25
4.1. Preliminary Data Analysis ...................................................................................... 25
4.2. Analysis of Sample Characteristics ......................................................................... 26
4.3. Reliability Assessment ........................................................................................... 28
4.4. Validity Assessment ............................................................................................... 28
4.5. Common Method Bias Assessment ......................................................................... 33
4.6. Hypothesis Testing by Means of Standard Multiple Regression .............................. 34
4.7. Mediation Analysis................................................................................................. 37
II
5. Discussion ..................................................................................................................... 38
5.1. Summary of Findings ............................................................................................. 38
5.2. Managerial Implications ......................................................................................... 39
5.3. Limitations and Future Research ............................................................................ 41
Figures ................................................................................................................................ 44
Tables .................................................................................................................................. 64
Appendix A: Questionnaire.............................................................................................. 103
Appendix B: Literature Review Tables ........................................................................... 110
References ......................................................................................................................... 137
Affidavit ............................................................................................................................ 145

III
List of Figures
Figure 1. Number of Smartphone Users Worldwide from 2014 to 2020 (in Billions) ........... 44
Figure 2. Users in the Mobile Payments Market ................................................................... 45
Figure 3. Transaction Value in the Mobile Payments Market ............................................... 46
Figure 4. Global Comparison – Transaction Value in the Mobile Payments Market ............. 47
Figure 5. Users in the Digital Payments Market ................................................................... 48
Figure 6. Transaction Value in the Digital Payments Market ................................................ 49
Figure 7. Variables Determining the Rate of Innovation Adoption ....................................... 50
Figure 8. Adopter Categories Based on Their Degree of Innovativeness .............................. 51
Figure 9. Original Technology Acceptance Model ............................................................... 52
Figure 10. Model of Unified Theory of Acceptance and Use of Technology (UTAUT) in
Organizational Contexts ....................................................................................................... 53
Figure 11. Model of Unified Theory of Acceptance and Use of Technology (UTAUT2) in
Consumer Contexts .............................................................................................................. 54
Figure 12. Research Model of Factors Influencing Consumers’ Intention to Use NFC Mobile
Payments .............................................................................................................................. 55
Figure 13. First CFA: Path Diagram in IBM SPSS Amos ..................................................... 56
Figure 14. Second CFA: Path Diagram in IBM SPSS Amos ................................................ 57
Figure 15. Histograms of All Variables with Normal Distribution Curves ............................ 58
Figure 16. Normal Probability Plots of All Variables ........................................................... 59
Figure 17. Scatter Plot Comparing Studentized Residuals and Unstandardized Predicted
Values .................................................................................................................................. 60
Figure 18. Histogram of Studentized Residuals with a Normal Distribution Curve ............... 61
Figure 19. Normal P-P Plot of Studentized Residuals........................................................... 62
IV
Figure 20. Mediation Analysis Model .................................................................................. 63

V
List of Tables
Table 1. Measurement Scales ............................................................................................... 64
Table 2. Demographic Characteristics of the Study Participants ........................................... 66
Table 3. Background Characteristics of the Study Participants ............................................. 67
Table 4. Initial Reliability Statistics of the Perceived Usefulness Scale ................................ 68
Table 5. Initial Reliability Statistics of the Compatibility Scale ............................................ 69
Table 6. Initial Reliability Statistics of the Perceived Ease of Use Scale ............................... 70
Table 7. Initial Reliability Statistics of the Trialability Scale ................................................ 71
Table 8. Initial Reliability Statistics of the Trust in Provider Scale ....................................... 72
Table 9. Initial Reliability Statistics of the Trust in Mobile Device Reliability Scale ............. 73
Table 10. Initial Reliability Statistics of the Perceived Risk Scale ........................................ 74
Table 11. Initial Reliability Statistics of the Personal Innovativeness in IT Scale ................. 75
Table 12. Initial Reliability Statistics of the Intention to Use Scale ....................................... 76
Table 13. Recalculated Reliability Statistics of the Perceived Ease of Use Scale Excluding
Item PeoU_04_r ................................................................................................................... 77
Table 14. Recalculated Reliability Statistics of the Personal Innovativeness in IT Scale
Excluding Item PIIT_04_r .................................................................................................... 78
Table 15. Final Results of the Reliability Analysis ............................................................... 79
Table 16. First EFA: Results of KMO Test for Sampling Adequacy and Bartlett Test of
Sphericity ............................................................................................................................. 80
Table 17. First EFA: Total Variance Explained .................................................................... 81
Table 18. First EFA: Rotated Factor Matrixa ........................................................................ 82
Table 19. Second EFA: Results of KMO Test for Sampling Adequacy and Bartlett Test of
Sphericity ............................................................................................................................. 83

VI
Table 20. Second EFA: Total Variance Explained ................................................................ 84
Table 21. Second EFA: Rotated Factor Matrixa .................................................................... 85
Table 22. First CFA: Model Fit Statistics (for N < 250 and m ≥ 30) ..................................... 86
Table 23. First CFA: Standardized Regression Weights, AVE, and CR ................................ 87
Table 24. First CFA: Inter-construct Correlation Estimates .................................................. 89
Table 25. First CFA: Comparison of AVE Values and Squared Inter-Construct Correlation
Estimates .............................................................................................................................. 90
Table 26. Second CFA: Model Fit Statistics (for N < 250 and m ≥ 30) ................................. 91
Table 27. Second CFA: Standardized Regression Weights, AVE, and CR ............................ 92
Table 28. Second CFA: Inter-construct Correlation Estimates .............................................. 94
Table 29. Second CFA: Comparison of AVE Values and Squared Inter-Construct Correlation
Estimates .............................................................................................................................. 95
Table 30. Results of Harman’s Single-Factor Test for Common Method Bias: Total Variance
Explained in EFA ................................................................................................................. 96
Table 31. Results of Kolmogorov-Smirnov and Shapiro-Wilk Tests of Normality ................ 97
Table 32. Pearson Correlations between All Variables in the Research Model...................... 98
Table 33. Multiple Regression Analysis: Model Summary and ANOVA Statistics ............... 99
Table 34. Multiple Regression Analysis: Coefficient Statistics ........................................... 100
Table 35. Mediation Analysis: Simple Regression Coefficient Statistics ............................ 101
Table 36. Mediation Analysis: Multiple Regression Results ............................................... 102

VII
List of Abbreviations
AVE Average variance extracted
B2B Business-to-business
B2C Business-to-consumer
BLE Bluetooth low energy
C2B Consumer-to-business
C2C Consumer-to-consumer
CFA Confirmatory factor analysis
CFI Comparative fit index
CMB Common method bias
CMV Common method variance
CR Construct reliability
DV Dependent variable
EFA Exploratory factor analysis
H Hypothesis
IDT Innovation diffusion theory
IT Information technology
ItU Intention to use (NFC mobile payment)
IV Independent variable
KMO Kaiser-Meyer-Olkin
MRA Multiple regression analysis
MV Mediator variable
N Sample size
NFC Near field communication

VIII
OED Oxford English Dictionary
P2P Peer-to-peer
PAF Principal axis factoring
PCA Principal components analysis
PeoU Perceived ease of use
PIIT Personal innovativeness in information technology
POS Point of sale
PR Perceived risk
PT Prospect theory
PU_C Perceived usefulness & compatibility
RMSEA Root mean square error of approximation
SD Standard deviation
TAM Technology acceptance model
TiMDR Trust in mobile device reliability
TiP Trust in provider
TPB Theory of planned behavior
TRA Theory of reasoned action
UTAUT Unified theory of acceptance and use of technology (applies to
organizational contexts)
UTAUT2 Unified theory of acceptance and use of technology (applies to
consumer contexts)
VIF Variance inflation factor
WOM Word-of-mouth
WTP Willingness to pay

IX
Abstract
The ubiquity of digital technologies in everyday life is set to continue transforming the ways
in which consumers shop, manage their finances, and conduct payment transactions. With an
increasing penetration rate of smartphones worldwide (Statista 2017a), mainstream adoption
of technological innovations, such as proximity mobile payments at the point of sale, is more
likely than ever. Hence, based on the innovation diffusion theory (Rogers 2003), the
technology acceptance model (Davis 1989; Davis 1993), and previous research in mobile
banking, mobile commerce, and mobile payments adoption, the study at hand investigates
factors influencing consumers’ intentions to adopt near field communication (NFC) mobile
payments in a brick-and-mortar environment. Multiple statistical analyses provide support for
significant effects of perceived usefulness & compatibility, perceived ease of use, trialability,
and perceived risk on adoption intentions. Based on the study results, managerial implications
for providers of mobile payment solutions and merchants/retailers are discussed and potential
avenues for future research are proposed.
Keywords: mobile wallet, near field communication technology (NFC) mobile payments,
innovation adoption, technology acceptance

1
1. Introduction
The widespread adoption and use of digital technologies is transforming consumers’ path to
purchase. For instance, the smartphone is increasingly transcending its limits of being solely a
tool for interpersonal communication. It is set to become the go-to device for shopping,
banking, and payment transactions too (Nielsen 2016, p. 3). Specifically, mobile devices are
becoming “shopping buddies” in a brick-and-mortar environment. They simplify the process
of product and service information search, price comparison, and identification of special
deals and coupons for consumers, anytime and anywhere (Nielsen 2016, p. 4). Online
shopping via mobile devices (m-commerce) is on the rise and expected to grow steadily in the
future (Nielsen 2016, p. 6). Further, mobile banking is the preferred service for managing
personal finances, especially for Millennials (aged between 21 and 34) as well as for
Generation X (aged between 35 and 49) (Nielsen 2016, p. 9). Finally, the smartphone has the
potential to become the go-to tool for making money transactions as well, including peer-to-
peer (P2P) mobile money transfers and proximity mobile payments in physical locations, such
as stores and restaurants (Nielsen 2016, p. 17). Indeed, as Perkins and Fenech (2014) predict,
yesterday’s and today’s payment technologies (cash, credit and debit cards, online banking)
will be substituted by the transaction technologies of the future – mobile payments, payments
via facial and biometric recognition (Perkins and Fenech 2014, p. 9).
Mobile payments represent one of the transaction technologies of the future which is
currently in the process of taking off. A mobile payment is defined as “[…] a virtual type of
payment enabled by mobile device, in which money is transferred remotely or near-by from a
payer to receiver via an intermediary or directly in exchange for a service, a product or as a
money transfer” (Dahlberg et al. 2015, p. 3). In accordance with Dahlberg et al.’s (2015)
definition, mobile payments can be subcategorized as “proximity” and “remote” (European

2
Payments Council 2017, p. 30). Proximity mobile payments refer to payments where “[…] the
consumer and the merchant […] are in the same location and communicate directly using a
proximity technology […]” (European Payments Council 2017, p. 30). Such proximity
technologies include near field communication (NFC), 2D barcodes, and Bluetooth low
energy (BLE) (European Payments Council 2017, p. 30), with NFC currently being the
dominant one (Ernst & Young 2015, p. 2). Further, remote mobile payments refer to
payments where “[…] the transaction is conducted over telecommunication networks such as
GSM or internet, and can be made independently of the payer’s location […]” (European
Payments Council 2017, p. 30). Examples for remote mobile payments are P2P money
transfers, buying flight tickets via an airline application, paying for mobile entertainment
subscription, to name a few. Finally, considering that the payer and the payment receiver can
be both consumers and businesses, mobile payments can also be classified as consumer-to-
consumer (C2C), consumer-to-business (C2B), business-to-consumer (B2C), and business-to-
business (B2B) (European Payments Council 2017, p. 30). The following discussion focusses
on C2B NFC proximity mobile payments. Henceforth, the terms “NFC mobile payments” (at
the POS) and “proximity mobile payments” (at the POS) will be used interchangeably.
To be able to conduct NFC mobile payments, consumers must install a mobile wallet
application on their mobile devices where their debit and/or credit bank account information
and loyalty card(s) information is encrypted in order to prevent unauthorized access by third
parties. Some of the most popular mobile wallet solutions include Apple Pay, Android Pay,
PayPal, and Samsung Pay, to name a few (Mobgen 2015, p. 8-13). Mobile wallet applications
enable consumers to pay for goods and services in physical locations such as stores,
supermarkets, restaurants, and vending machines, by placing their mobile device in close
proximity to an NFC-enabled payment terminal and authorizing the payment transaction by
entering a PIN code or via fingerprint authentication.

3
A major prerequisite for the adoption of NFC mobile payments is a high smartphone
penetration rate. It is predicted that 2.87 billion people will be using a smartphone worldwide
by 2020 (Figure 1) (Statista 2017a). In accordance with this prediction, statistical forecasts
see an increase in the number of mobile payment users (Figure 2) (Statista 2017b), and, with
that, an increase in the transaction value in the mobile payments market until 2021 (Figure 3)
(Statista 2017c). The 2017 frontrunner economy in terms of mobile payment transaction value
is China with US$ 138,272.4 million, followed by the United States, the United Kingdom,
South Korea, and Japan (Figure 4) (Statista 2017d). However, it seems that, on a global scale,
the adoption of mobile payments is still in its infancy. In contrast, the number of users in the
digital commerce market (including payments for products and services over the Internet)
(Figure 5) (Statista 2017e) and their related transaction value (Figure 6) (Statista 2017f) are
skyrocketing when compared to those of mobile payments at the point of sale (POS) and P2P
money transfers.
These statistics show that proximity mobile payments have a long road ahead to
mainstream adoption. However, the potential of the mobile payments market is apparent. It is
hence of great interest to technology adoption research, providers of mobile payment services,
as well as to merchants and retailers, to gain a detailed understanding of the most important
drivers and barriers of proximity mobile payments adoption. NFC mobile payments are
designed to provide numerous benefits in the mobile payments ecosystem. For instance,
benefits for consumers include (1) increased convenience in terms of portability since
consumers can dispose of their physical wallets (Hayashi 2012, p. 43); and, (2) increased
convenience in terms of flexibility of choosing between different payment instruments at the
POS depending on the particular purchasing situation (e.g., credit, debit, merchant-specific
cards) (Hayashi 2012, p. 43-44). Further, (3) proximity mobile payments enable a simpler and
faster checkout process. In particular, the time spent for making a payment transaction at the

4
POS can be decreased by 15 to 30 seconds per purchase (Hayashi 2012, p. 44). Another
important benefit of proximity mobile payments is the (4) increased security of payment
transactions as compared to traditional modes of payment (Hayashi 2012, p. 49). As Hayashi
(2012) points out, mobile payment solutions enable the so called “dynamic authentication”,
“[…] in which data unique to each transaction is used to authenticate the payment device”
(Hayashi 2012, p. 49). Finally, consumers can benefit from promotions, loyalty and reward
programs related to the use of proximity mobile payments at the POS (Hayashi 2012, p. 56-
57).
Next, the new payment method also offers numerous advantages to merchants and
retailers. First, as Shin (2009) maintains, mobile wallet applications enable faster checkout at
the POS, which creates more opportunities for impulse purchasing (Shin 2009, p. 1344).
Second, the less transparent and tangible a payment transaction (card vs. cash), the less pain
of paying customers experience and the more they are willing to consume (Soman 2003, p.
182). Falk et al. (2016) provide support for this “payment transparency bias” in relation to
mobile payments – the less transparent the payment method (i.e., credit/debit card, mobile
payment) the more positive customers’ price judgments of the store and the higher their
willingness to pay (WTP) (Falk et al. 2016, p. 2422). These research findings suggest that
proximity mobile payments have the potential to increase sales volumes through a payment
transparency effect. A further benefit is the decrease in transaction time per customer, which
in turn can decrease overall time spent in waiting lines. Consequently, faster checkout is
likely to improve customers’ satisfaction and loyalty with the merchant/retailer. In addition to
the optimization of sales operations at checkout, merchants/retailers can also create new
communication “touch points” with their customers by means of targeted mobile marketing
and reward schemes (Taylor 2016, p. 162), as well as customer loyalty programs. Importantly,
mobile payment transactions are a source of customer data that can provide valuable insights

5
into their purchasing behavior and thereby help improve the customer experience. Finally,
providers of mobile payment services (i.e., mobile wallets) can benefit from the huge
potential of the mobile payment market given the fact that consumers are becoming
increasingly mobile in their path to purchase.
However, a number of barriers are hindering the takeoff of proximity mobile payments
at the POS. For instance, the lack of agreement on technology standards as well as the
creation of feasible business models for all members of the mobile payments ecosystem slow
down mainstream consumer adoption (Hayashi 2012, p. 40-41). Further, concerns about the
technical reliability of mobile payment technologies (Taylor 2016, p. 168), security risks, data
protection and privacy (Taylor 2016, p. 173) create insecurity in merchants, retailers, and
consumers. Moreover, as Dennehy and Sammon (2015) point out, the so-called "chicken-or-
egg" problem holds back adoption as well. It refers to the fact that merchants and retailers are
not yet willing to make costly investments in NFC-enabled payment terminals because they
are unsure about the consumer demand for mobile payments. However, the unavailability of
such payment terminals makes it impossible for consumers to use the new payment method
even if they wanted to (Dennehy and Sammon 2015, p. 50). Therefore, it is crucial to
investigate consumer attitudes towards adopting NFC mobile payments. Since these have not
been studied extensively yet, there is a clear need to do so.
Hence, the research question that this study poses is: What are the most important
factors influencing consumers’ intention to adopt NFC mobile payments at the POS? The
objectives of this research project are threefold. First, to develop a research model of NFC
mobile payment adoption based on established theories and empirical evidence in the fields of
innovation diffusion and technology adoption. Second, to test the model by analyzing survey
data. Third, to obtain implications for marketing management of mobile payment solutions.
The study at hand contributes to existing literature on mobile payments adoption in that it (1)

6
provides a research model focusing on NFC mobile payments in particular; and, (2) tests
understudied/new constructs.
The research paper is structured as follows. Section 2. Literature Review provides an
overview of three major theories of innovation and technology adoption, as well as a review
of available empirical evidence from the fields of mobile banking, mobile commerce, and
mobile payments adoption. Next, Section 3. Methodological Approach describes the proposed
theoretical model, the assumptions behind it, and the hypothesized relationships between the
investigated constructs. It also provides a description of the study procedure and the measures
employed to operationalize the variables of interest. Section 4. Empirical Analysis and Results
is dedicated to a series of statistical procedures employed to assess the reliability and validity
of the measurement instrument and to carry out hypothesis testing by means of multiple
regression analysis (MRA). Finally, section 5. Discussion focuses on the interpretation of the
study findings and what they mean for mobile payment providers and merchants/retailers. The
research paper concludes with an evaluation of the study limitations and provides
recommendations for future research.
2. Literature Review
The innovation diffusion theory (IDT) (Rogers 2003), the technology acceptance model
(TAM) (Davis 1989; Davis 1993), and the unified theory of acceptance and use of technology
(UTAUT/UTAUT2) (Venkatesh et al. 2003; Venkatesh, Thong, and Xu 2012) are the three
major theoretical models designed to explain and predict consumer adoption of innovations
and new technologies. The following subchapter provides insights into the central tenets
behind them. Subsequently, a review of available empirical research is discussed.

7
2.1.Theories of Innovation Adoption and Technology Acceptance
Innovation diffusion theory (IDT). IDT is one of the best known theoretical frameworks of
innovation adoption. Based on years of empirical research in the fields of anthropology,
sociology, education, public health and medical sociology, communications, marketing and
management, and new technologies (Rogers 2003, p. 44-45), the theory has enriched our
understanding of (1) what innovations are; (2) how and why they diffuse in social systems;
(3) what stages consumers go through in the innovation-decision process; and, (4) what role
consumer innovativeness, opinion leadership, diffusion networks, and communication
channels play in the diffusion process (Rogers 2003, p. 96-98). IDT defines an innovation as
“[…] an idea, practice, or object that is perceived as new by an individual or other unit of
adoption” (Rogers 2003, p. 12). As Rogers (2003) points out, an innovation is defined as such
based not on its objective newness (i.e., the period since its inception) but based on
individuals’ subjective perception of its newness (Rogers 2003, p. 12). The diffusion of an
innovation is a communication process within a social system, whereby information about the
innovation is disseminated through different communication channels (Rogers 2003, p. 5). An
important aspect of this process is the uncertainty that the innovation represents for potential
adopters. Uncertainty in this context refers to the fact that the consequences of adopting an
innovation are initially unpredictable for consumers (Rogers 2003, p. 6). A major
psychological bias that can explain the effect of uncertainty on consumers is the status quo
bias, which stems from prospect theory (PT) (Tversky and Kahneman 1992). In contrast to
classical economic theory, which assumes that individuals are rational actors with stable
preferences, PT maintains that individuals systematically deviate from this assumption of
rationality (Rabin 1998, p. 11). One of the central tenets of PT is loss aversion (Tversky and
Kahneman 1992, p. 299). Loss aversion is observed in risky and uncertain situations where
individuals are much more susceptible to losses than to same-sized gains (Tversky and

8
Kahneman 1992, p. 298). The status quo bias, which is tightly linked to the concept of loss
aversion, refers to individuals’ tendency to prefer the current state of affairs because they
anticipate potential losses to be greater than potential gains if a change in the status quo
occurs (Kahneman, Knetsch, and Thaler 1991, p. 197-198). The status quo bias is applicable
in the context of innovation diffusion because an innovation might represent a change in
consumers’ status quo and can thus be perceived as uncertain and risky.
In the field of innovation marketing, the reduction of uncertainty related to a new
product or service is a major task for marketing managers. As Rogers maintains, one way to
reduce uncertainty is the strategic provision of information about the innovation among the
target group of potential adopters (Rogers 2003, p. 6). It is also important to make a
distinction between product and service innovations when discussing uncertainty. In
particular, services exhibit a higher degree of uncertainty in comparison to products because
they are inherently intangible and their results are not readily observable. As Rogers (2003)
argues, consumers can overcome uncertainty in two ways: by trying out the innovation on
their own and by observing peers’ trial and use of the innovation (Rogers, 2003, p. 177).
Further, consumers pass through a five-stage innovation-decision process. Rogers
(2003) refers to it as an “information-seeking” and “information-processing activity” during
which consumers pass through knowledge, persuasion, decision, implementation, and
confirmation stages (Rogers 2003, p. 169). In the context of the innovation-decision process,
the following five innovation attributes are viewed as the most consistent predictors of
adoption: relative advantage, compatibility, complexity, trialability, and observability (Figure
7). According to Rogers (2003), these five attributes consistently explain between 49% and
87% of the innovation adoption variance (Rogers 2003, p. 221). In IDT, relative advantage is
defined as the degree to which potential consumers perceive an innovation as more beneficial
than the idea or technology that is currently in use (Rogers 2003, p. 15). Importantly, the
9
objective relative advantage (i.e., what experts in the field of innovation view as
advantageous) is not decisive. What matters are consumers’ subjective perceptions of the
relative advantage of the innovation in question (Rogers 2003, p. 15). The second attribute,
compatibility, refers to the extent to which consumers perceive an innovation as being
compatible with their “[…] existing values, past experiences, and needs […]” (Rogers 2003,
p. 15). An innovation that is inconsistent with the current state of affairs in the target group
requires potential adopters to modify their norms, values, and needs. Since such a change
process is usually unlikely, innovations must be as compatible with the current status quo as
possible in order to be able to diffuse. The third attribute, complexity, refers to the degree to
which potential adopters see an innovation as difficult to understand, learn to use and employ
(Rogers 2003, p. 16). The fourth attribute, trialability, is defined as the extent to which
consumers could try out and experiment with an innovation (Rogers 2003, p. 16). Finally,
observability is the degree to which the consequences of using an innovation can be observed
by other individuals (Rogers 2003, p. 16). Overall, Rogers (2003) maintains that an
innovation is more likely to diffuse more rapidly if it is perceived to have a greater relative
advantage, compatibility, trialability, and observability, and less complexity (Rogers 2003, p.
16).
Finally, IDT provides a classification of adopter categories based on the degree of
their innovativeness. Rogers (2003) defines innovativeness as the tendency to adopt an
innovation earlier than other consumers within a social system (Rogers 2003, p. 267). Based
on their degree of innovativeness, consumers generally fall into five categories: “innovators”,
“early adopters”, “early majority”, “late majority”, and “laggards” (Figure 8), where the first
two adopter types are characterized with the highest degree of innovativeness (Rogers 2003,
p. 280-281). Rogers (2003) refers to innovativeness as the “bottom-line behavior in the
diffusion process” (Rogers 2003, p. 268) for a reason. Innovators and early adopters, being

10
the ones to adopt first, play a crucial role for the further diffusion of an innovation through
peer effects. As thought leaders, they set an example for the less innovative, more risk-averse
adopters, thus reducing their uncertainty about the consequences of adopting the innovation.
In summary, IDT is one of the most comprehensive theories of innovation adoption. It
therefore constitutes a major part of the current study’s theoretical backbone.
Technology acceptance model (TAM). The second theoretical framework discussed
here is TAM (Davis 1989; Davis 1993). TAM is a parsimonious model designed to explain
consumers’ intentions to use a technology as well as their actual usage behavior. It is based on
attitude theory from psychology (Fishbein and Ajzen 1975) and is considered one of the most
relevant models in technology acceptance literature. The original TAM (Figure 9) (Davis
1993, p. 476) includes perceived usefulness and perceived ease of use as major predictors of
attitude toward using (an IT system), which in turn is a determinant of actual system use.
Importantly, the effect of perceived ease of use on attitude toward using is mediated by
perceived usefulness. Further, the model maintains that system design features have a direct
impact on consumers’ evaluations of the perceived usefulness and perceived ease of use of an
IT system. Davis (1989) originally defined perceived usefulness as the extent to which
consumers believe that a new technology would improve their job performance (Davis 1989,
p. 320). Further, perceived ease of use is the extent to which consumers believe that a new
technology would be easy to use (Davis 1989, p. 320). As Davis (1989) points out, the more
useful and the easier to use a new technology is perceived as by potential users, the more
likely are they to eventually adopt it (Davis 1989, p. 320). Looking at these definitions, it
becomes apparent that perceived usefulness and perceived ease of use are quite similar to
IDT’s relative advantage and complexity constructs respectively. Further, as evident from the
definition of perceived usefulness, TAM was initially applied to technology acceptance and
use in organizational settings. However, the model has also been applied to consumer

11
contexts, such as adoption of electronic banking channels (Hoehle, Scornavacca, and Huff
2012, p. 128), mobile technology adoption (Sanakulov and Karjaluoto 2015, p. 256-257),
mobile banking adoption (Shaikh and Karjaluoto 2015, p. 139), mobile commerce adoption
(Zhang, Zhu, and Liu 2012, p. 1905), mobile payments adoption (Dahlberg et al. 2008, p.
174; Dahlberg, Guo, and Ondrus 2015, p. 274), to name a few. Importantly, the current study
adopts the original definition of perceived ease of use and adapts the definition of perceived
usefulness to conform to the consumer-centric context of NFC mobile payments adoption as
being the degree to which using a new technology (i.e., mobile wallet, NFC mobile payment)
would enhance one’s performance in a particular activity (i.e., shopping, payment
transactions).
Later, Venkatesh and Davis (2000) modified TAM whereby attitude toward using was
reformulated as intention to use, and actual system use – as usage behavior. Similarly to the
original TAM, perceived usefulness and perceived ease of use have an effect on usage
behavior via intention to use. Further, perceived ease of use has both a direct effect and an
indirect effect on intention to use via perceived usefulness (Venkatesh and Davis 2000, p.
188). To summarize, TAM is parsimonious but powerful theoretical model. Nevertheless, as
Legris, Ingham, and Collerette (2003) suggest, it is necessary to extend it with further relevant
predictors of intention to use/usage behavior, in order to draw a more comprehensive picture
of what drives and hinders technology adoption in different contexts (Legris, Ingham, and
Collerette 2003, p. 202).
Unified theory of acceptance and use of technology (UTAUT). Finally, the original
UTAUT model (Figure 10) was developed by Venkatesh et al. (2003) to explain and predict
adoption and use of new technologies in organizational contexts (Venkatesh et al. 2003, p.
426). Later, Venkatesh, Thong, and Xu (2012) identified the need to adapt the original model
in order to explain and predict acceptance and use of new technologies in consumer contexts

12
(Venkatesh, Thong, and Xu 2012, p. 158). The result was a modified version of UTAUT
known as UTAUT2 (Figure 11). Similarly to UTAUT, UTAUT2 states that performance
expectancy, effort expectancy, and social influence are direct determinants of behavioral
intention and indirect determinants of use behavior via behavioral intention. In contrast to
UTAUT however, UTAUT2 considers facilitating conditions to have direct effects on both
behavioral intention (to use a technology) and use behavior. The three additional variables
included in UTAUT2 – hedonic motivation, price value, and habit – exhibit direct effects on
behavioral intention and indirect effects on use behavior via behavioral intention. Habit is
also a direct determinant of use behavior. Finally, age, gender, and experience (with a
technology) represent key moderator variables in the model (Venkatesh, Thong, and Xu 2012,
p. 160). Venkatesh, Thong, and Xu (2012) define the constructs in the UTAUT2 model as
follows. First, performance expectancy refers to the degree to which users perceive a new
technology as beneficial for conducting relevant activities (Venkatesh, Thong, and Xu 2012,
p. 159). Second, effort expectancy is defined as the degree of ease of use associated with the
technology (Venkatesh, Thong, and Xu 2012, p. 159). Third, social influence refers to the
degree to which a consumer’s close social circle would recommend using the technology in
question (Venkatesh, Thong, and Xu 2012, p. 159). Fourth, the construct facilitating
conditions is defined as the extent to which consumers believe that relevant resources and
support would be available to use the technology (Venkatesh, Thong, and Xu 2012, p. 159).
More specifically, the concrete dimensions behind this construct include consumers’
knowledge of the technology, its compatibility with other technologies, as well as the
availability of support by others in case consumers face difficulties while using it (Venkatesh,
Thong, and Xu 2012, p. 178). Fifth, hedonic motivation incorporates the fun and enjoyment
provided by using the technology (Venkatesh, Thong, and Xu 2012, p. 161). Sixth, price
value is “consumers’ cognitive tradeoff” between the benefits of using the technology and its

13
monetary cost (Venkatesh, Thong, and Xu 2012, p. 161). Finally, habit refers to “[…] the
extent to which people tend to perform behaviors automatically because of learning […]”
(Venkatesh, Thong, and Xu 2012, p. 161). To summarize, UTAUT and UTAUT2 are quite
comprehensive models of technology acceptance applicable to both organizational and
consumer contexts.
Finally, when comparing IDT, TAM, and UTAUT2, it becomes apparent that these
models exhibit important similarities. For instance, all three theoretical frameworks include
(1) a construct that refers to the usefulness or benefits that a new technology provides to
consumers (i.e., relative advantage, perceived usefulness, and performance expectancy) as
well as (2) a construct that refers to the degree of difficulty related to technology use (i.e.,
complexity, perceived ease of use, and effort expectancy). Further, as Venkatesh et al. (2003)
point out, facilitating conditions in UTAUT/UTAUT2 incorporates IDT’s compatibility
construct (Venkatesh et al. 2003, p. 453). Also, both IDT and UTAUT2 place importance on
the influence of one’s social circle on innovation/technology adoption. In contrast to IDT,
UTAUT2 takes into account hedonic motivation, price value, and habit. However, in the
context of the current study, these constructs are not applicable due to the following
considerations. First, NFC mobile payments have a utilitarian function rather than a hedonic
one. Second, most mobile wallet applications can be downloaded and used free of charge.
Hence price value is considered irrelevant. Third, the study focuses on participants who have
no or limited experience with NFC mobile payments. Habit is therefore unlikely to play a role
in this case. Fourth, social influence is also considered not applicable here since the target
group of this study includes consumers from markets where proximity mobile payments are
not readily available yet. It is thus not realistic to assume that social influence is likely to play
a significant role in this context. Nevertheless, habit and social influence would be constructs
of interest in a context where consumers and their social circles are more experienced in using
14
NFC mobile payments. Based on these considerations, the current study relies mostly on IDT
and TAM as theoretical models of innovation and technology adoption.
2.2.Previous Research in Mobile Payments Adoption and Related Fields
The research field of mobile payments adoption is relatively new and offers opportunities for
further investigation. The available studies are relatively few and are predominantly based on
TAM (Schierz, Schilke, and Wirtz 2010; Kim, Mirusmonov, and Lee 2010; Shaw 2014; Chen
2008; Pham and Ho 2015; Shin 2009; Wei-Han Tan et al. 2014) or on UTAUT2 (Slade et al.
2015; Oliveira et al. 2016). Interestingly, IDT has not received wide attention in the mobile
payments adoption literature. Single IDT elements have been incorporated only in a few
studies (Chen 2008; Kim, Mirusmonov, and Lee 2010; Yang et al. 2012; Pham and Ho 2015;
Oliveira et al. 2016). Alternative theoretical frameworks include perceived risk theory (Yang
et al. 2015), as well as a combination of perceived value theory and perceived risk theory (de
Kerviler, Demoulin, and Zidda 2016; Cocosila and Trabelsi 2016). Further, previous studies
focus on (1) mobile payments as a general term incorporating both proximity and remote
mobile payments (Mallat 2007; Chen 2008; Kim, Mirusmonov, and Lee 2010; Schierz,
Schilke, and Wirtz 2010; Yang et al. 2012); (2) proximity mobile payments only (Wei-Han
Tan et al. 2014; Pham and Ho 2015; Slade et al. 2015; Oliveira et al. 2016; Cocosila and
Trabelsi 2016; de Kerviler, Demoulin, and Zidda 2016); and, (3) mobile wallets (Shin 2009;
Shaw 2014). In the following sub-sections, available empirical evidence from the mobile
payments literature and related research fields is reviewed.
Empirical evidence on IDT constructs. The most studied IDT construct in the mobile
payments literature is innovativeness – either as a direct predictor of intention (Yang et al.
2012, p. 135; Wei-Han Tan et al. 2014, p. 302; Pham and Ho 2015, p. 167; Oliveira et al.
2016, p. 407); as an antecedent of relative advantage (Yang et al. 2012, p. 135), of perceived
15
ease of use (Kim, Mirusmonov, and Lee 2010, p. 312), or of performance expectancy, effort
expectancy, and compatibility (Oliveira et al. 2016, p. 407). Overall, innovativeness has been
found to be a significant, positive, direct predictor of intention in the mobile payments
literature (Yang et al. 2012, p. 136; Wei-Han Tan et al. 2014, p. 302; Pham and Ho 2015, p.
166; Oliveira et al. 2016, p. 410).
Another IDT construct that has also been considered in a small number of studies is
compatibility – either as a direct determinant of intention (Chen 2008, p. 37; Yang et al. 2012,
p. 131; Pham and Ho 2015, p. 163) or as an antecedent of performance expectancy and effort
expectancy (Oliveira et al. 2016, p. 407) as well as of perceived usefulness and perceived ease
of use (Kim, Mirusmonov, and Lee 2010, p. 312). Overall, compatibility has been found to be
a significant predictor of mobile payments adoption intentions (Chen 2008, p. 45; Yang et al.
2012, p. 135) and proximity mobile payments adoption intentions (Pham and Ho 2015, p.
165; Oliveira et al. 2016, p. 410). In other research fields, such as mobile commerce (Zhang,
Zhu, and Liu 2012, p. 1905) and mobile banking (Shaikh and Karjaluoto 2015, p. 135), IDT
constructs have also not been studied as extensively as TAM and UTAUT2 constructs. This
creates an opportunity to fill this gap in technology adoption literature.
Empirical evidence on TAM constructs. As discussed above, perceived usefulness and
perceived ease of use are considered the major predictors of intention in TAM. The available
empirical evidence in the context of mobile payments adoption provides support for the
theoretical validity of TAM. For instance, Chen (2008), Kim, Mirusmonov, and Lee (2010),
and Wei-Han Tan et al. (2014) found that perceived usefulness and perceived ease of use have
significant positive direct effects on the intention to use mobile payment (Chen 2008, p. 45;
Kim, Mirusmonov, and Lee 2010, p. 317) and on the intention to adopt mobile credit card
(Wei-Han Tan et al. 2014, p. 302). Further, these two constructs also seem to be indirect
predictors of intention via attitude towards use (Shin 2009, p. 1349; Schierz, Schilke, and

16
Wirtz 2010, p. 214). As proposed by Davis (1993), perceived ease of use operates indirectly
via perceived usefulness (Davis 1993, p. 476). This is exactly what Kim, Mirusmonov, and
Lee (2010) and Schierz, Schilke, and Wirtz (2010) found in the context of mobile payments
adoption (Kim, Mirusmonov, and Lee 2010, p. 317; Schierz, Schilke, and Wirtz 2010, p.
214). Finally, Shaw (2014) and Pham and Ho (2015) also found that perceived usefulness has
a significant positive effect on intention to use a mobile wallet (Shaw 2014, p. 454) and on
intention to adopt NFC mobile payments (Pham and Ho 2015, p. 166). However, their results
do not support an effect of perceived ease of use on intention (Shaw 2014, p. 454; Pham and
Ho 2015, p. 166). TAM constructs have also been widely studied in related research fields.
For instance, perceived usefulness and perceived ease of use have been found to be significant
predictors of the intention to adopt (1) mobile banking (Shaikh and Karjaluoto 2015, p. 136);
(2) mobile data services, mobile banking, and mobile learning (Sanakulov and Karjaluoto
2015, p. 256-257), as well as (3) mobile commerce (Zhang, Zhu, and Liu 2012, p. 1908). In
summary, perceived usefulness and perceived ease of use seem indispensable constructs in a
technology adoption study.
Empirical evidence on additional relevant constructs. Additional constructs, that are
not part of the discussed theoretical models of innovation and technology adoption, are very
likely to play a role in the diffusion of NFC mobile payments. These include perceived risk
and trust in particular.
First, perceived risk reflects the concept of risk aversion in the context of IDT and is
considered a major barrier for consumer adoption of new technologies. In accordance with
IDT and prospect theory, Mandrik and Bao (2005) maintain that “[…] the concept of
perceived risk involves both the perceived uncertainty of outcomes and the perceived
importance of negative consequences” (Mandrik and Bao 2005, p. 532). In the context of
mobile payments adoption, perceived risk has been studied as a multidimensional concept.

17
For instance, Yang et al. (2015) investigated different risk dimensions and their relation to
consumers’ overall perception of value associated with mobile payments and their intention to
adopt (Yang et al. 2015, p. 256). The researchers found that perceived financial risk,
perceived performance risk, and perceived privacy risk have significant negative effects on
adoption intentions (Yang et al. 2015, p. 261). Further, Cocosila and Trabelsi (2016)
investigated the effects of value and risk constructs on the intention to adopt proximity mobile
payments (Cocosila and Trabelsi 2016, p. 161). They found that utilitarian and enjoyment
value perceptions and psychological and privacy risk perceptions are significant predictors of
adoption intentions (Cocosila and Trabelsi 2016, p. 165). Other studies, however, treat
perceived risk as a unitary rather than a multidimensional construct (Wei-Han Tan et al. 2014,
p. 296; Pham and Ho 2015, p. 161-162; Slade et al. 2015, p. 215). The majority of these
studies maintain that perceived risk is an important negative determinant of intention in the
context of mobile payments (Pham and Ho 2015, p. 166; Slade et al. 2015, p. 221). Finally,
perceived risk has been found to be a major barrier in related consumer adoption research
fields too, such as mobile commerce adoption (Zhang, Zhu, and Liu 2012, p. 1909) and
mobile banking adoption (Shaikh and Karjaluoto 2015, p. 135). In summary, perceived risk is
an indispensable factor that must be considered in technology adoption studies such as the one
at hand.
Second, Chandra, Srivastava, and Theng (2010) identify two types of trust in the
context of remote mobile payment services adoption: (1) trust related to “mobile service
provider characteristics” (including perceived reputation and perceived opportunism) and (2)
trust in “mobile technology characteristics” (including perceived environmental risk and
perceived structural assurance) (Chandra, Srivastava, and Theng 2010, p. 565-566). Trust
related to “mobile service provider characteristics” refers to consumers’ perceptions of
providers’ reputation and trustworthiness regarding handling customer information and
18
keeping their promises (Chandra, Srivastava, and Theng 2010, p. 565). Trust related to
“mobile technology characteristics” incorporates consumers’ concerns regarding system
security, data privacy, and related risks (Chandra, Srivastava, and Theng 2010, p. 565). The
latter type of trust resembles the construct perceived risk that this study adopts. The authors
found that both types of trust are significant determinants of the overall consumer trust in
mobile payment systems, which in turn has a significant positive effect on adoption intentions
(Chandra, Srivastava, and Theng 2010, p. 571). Based on Chandra, Srivastava, and Theng’s
(2010) understanding of trust, Slade et al. (2015) proposed a unitary construct to measure
trust in provider in the context of NFC mobile payment adoption (Slade et al. 2015, p. 213).
They found that trust in provider is a significant positive predictor of adoption intentions
(Slade et al. 2015, p. 221). Since this particular construct has received only a limited attention
in the NFC mobile payments literature, it is necessary to provide more evidence on its
relevance.
Finally, another trust construct of interest here is trust in mobile device reliability. The
construct refers to the degree to which consumers perceive their mobile devices (i.e.,
smartphones) to be reliable for conducting NFC mobile payments. Since NFC mobile
payments are initiated with mobile devices, it is paramount to understand how much
consumers trust their smartphones. High levels of trust in one’s mobile device are likely to
decrease potential adopters’ uncertainty related to the new payment method. In contrast, low
levels of trust may seriously hamper adoption. This new construct is based on a qualitative
study by Mallat (2007), who found that mobile device reliability represents a major concern
for adopters of mobile payments (Mallat 2007, p. 426). Interestingly, trust in mobile device
reliability has not been empirically investigated in the mobile payments literature yet. Hence,
this creates an opportunity for the current study to fill this gap in previous research.
19
In summary, available research on consumer adoption of NFC mobile payments in
particular is relatively scarce. Hence, the need for further investigation of relevant factors that
can potentially stimulate or hinder the acceptance of this new payment method is apparent.
3. Methodological Approach
This section introduces the research model of the current study. The focus is thus specifically
on the constructs selected for investigation and the hypothesized relationships between them.
Subsequently, descriptions of the study procedure and of the measures used are provided.
3.1.Study Design
The research model of this study is based on the reviewed theoretical frameworks and
empirical evidence from the mobile payments, mobile commerce, and mobile banking
literature. Specifically, the research model combines TAM (Davis 1989; Davis 1993) and IDT
(Rogers 2003) and extends them with additional factors that are likely to have significant
effects on consumers’ intention to adopt NFC mobile payments at the POS. UTAUT2 is not
included due to its similarities with the established TAM and IDT, as well as due to the
inapplicability of the constructs social influence, hedonic motivation, price value, and habit in
the context of this study.
As discussed in the previous chapter, TAM’s perceived usefulness and perceived ease
of use are indispensable constructs that must be considered in a technology adoption study.
Since they have been systematically found to have significant positive effects on the intention
to adopt new technologies, these two constructs are included in the current research model.
Since TAM’s perceived usefulness and perceived ease of use are very similar to IDT’s
20
relative advantage and complexity respectively, the latter two constructs are not included in
the model. Further, since IDT has been systematically neglected in the mobile payments
literature in favor of TAM and UTAUT2, IDT’s constructs compatibility and trialability are
adopted. However, the fifth innovation attribute, observability, is not introduced because of
the private nature of NFC mobile payments. Since the process of paying with a smartphone
should not be readily visible for other potential adopters, observability is not considered
relevant in the current study. Finally, a last construct stemming from IDT is innovativeness.
As Agarwal and Prasad (1998) point out, in the context of technology adoption, it is necessary
to measure domain-specific innovativeness (Agarwal and Prasad 1998, p. 206). Hence, this
study adopts a special type of innovativeness – personal innovativeness in information
technology (PIIT). PIIT is an individual trait that refers to consumers’ tendency to try and use
new information technologies (Agarwal and Prasad 1998, p. 206). The term “information
technology” refers broadly to “[t]he branch of technology concerned with the dissemination,
processing, and storage of information, especially by means of computers” (OED Online
2017). Information technologies include, for instance, mobile applications, such as mobile
wallets.
Additional constructs that TAM and IDT are extended with include trust in provider,
trust in mobile device reliability, and perceived risk. Since trust in provider and trust in
mobile device reliability have been neglected in previous research, the study at hand takes the
opportunity to further investigate these constructs. Finally, perceived risk related to the
adoption and use of NFC mobile payments is also included in the research model because it
represents an indispensable factor in a technology adoption study that can seriously hamper
diffusion.
In summary, the research model (Figure 12) includes (1) perceived usefulness, (2)
compatibility, (3) perceived ease of use, (4) trialability, (5) trust in provider, (6) trust in

21
mobile device reliability, (7) perceived risk, and (8) personal innovativeness in information
technology as independent variables (IVs). The dependent variable (DV) in the model is
intention to use NFC mobile payments. Based on the discussion above, the following direct
effects between the IVs and the DV are hypothesized:
H1: Perceived usefulness has a positive effect on the intention to use NFC mobile
payments.
H2: Compatibility has a positive effect on the intention to use NFC mobile payments.
H3: Perceived ease of use has a positive effect on the intention to use NFC mobile
payments.
H4: Trialability has a positive effect on the intention to use NFC mobile payments.
H5: Trust in provider has a positive effect on the intention to use NFC mobile
payments.
H6: Trust in mobile device reliability has a positive effect on the intention to use NFC
mobile payments.
H7: Perceived risk has a negative effect on the intention to use NFC mobile payments.
H8: Personal innovativeness in information technology has a positive effect on the
intention to use NFC mobile payments.
Finally, based on TAM (Davis 1993, p. 476), the following moderator effect of perceived
usefulness is hypothesized:
H9: Perceived ease of use has an indirect, positive effect on intention to use NFC
mobile payments via perceived usefulness.

22
3.2.Procedure
An online questionnaire designed to measure the constructs of interest was developed on the
online platform www.soscisurvey.de (Appendix A). A snowball sampling technique was used
to recruit participants. Initially, the survey was published on social media channels or sent out
via email to potential respondents, who were asked to take part in the study and to forward the
survey to other people in their social circles. The survey targeted adults over 18 years of age,
who regularly use a smartphone and are also regular bank account(s) users. A further
requirement was to recruit participants of different age brackets and backgrounds, in order to
achieve a varied sample representing the population of mobile device and bank account users.
The survey consists of four parts. In the first part, participants are presented with a
hypothetical scenario. They are asked to imagine that they have installed a mobile wallet
application on their mobile device where their credit card, debit card, and customer loyalty
card(s)' information is encrypted. They are informed that this mobile wallet application allows
them to make NFC mobile payments at the POS in a brick-and-mortar environment by using a
mobile device instead of traditional modes of payment, such as cash, physical debit or credit
card. Respondents are then asked to imagine that they go grocery shopping in their favorite
supermarket. After the cashier has scanned their products, they realize that they have
forgotten their physical wallet and can now make use of the mobile one to pay for their
groceries. They are also reminded that they can make NFC mobile payments even if their
mobile device is not connected to the Internet (depending on individual mobile wallet
solutions). After that, they are instructed to activate NFC on their device and place it in close
proximity to the payment terminal. The smartphone would then automatically display a
request for payment authorization. The payment transaction can be authorized either by
entering a PIN code or by confirming their identity with fingerprint authentication. With that,
the payment would be completed and stored in the history of the mobile wallet application.

23
This scenario was meant to explain the process of conducting NFC mobile payments because
it was expected that most of the participants would not have detailed knowledge of this new
mode of payment. Thus, it was important for the reliability of the survey responses that they
have at least a basic idea about the process of paying with a mobile device at the POS.
In the second part of the study, respondents are instructed to indicate their degree of
agreement with the statements designed to measure the nine constructs in the research model.
More information about these measurement scales is available in section 3.3. Measures
below.
In the third part, participants are asked four background questions about (1) whether
they have a smartphone; (2) whether they have conducted NFC mobile payments in physical
stores or restaurants; (3) whether they were aware of NFC mobile payments as an alternative
mode of payment prior to filling out the survey; and, (4) whether they shop online for goods
and services using their mobile phones. Finally, the last section of the questionnaire includes
demographic questions regarding age, gender, country of origin, education and employment
status.
3.3.Measures
The constructs in the research model were measured with Likert-type scales, consisting of
three or more statements. Respondents were asked to indicate their degree of agreement with
these statements on a 6-point scale ranging from 1 ("strongly disagree") to 6 ("strongly
agree"). Most of these scales were adapted from previous studies as follows: perceived
usefulness (Shaw 2014, p. 457), compatibility (Schierz, Schilke, and Wirtz 2010, p. 213),
perceived ease of use (Chen 2008, p. 52), trialability (Pham and Ho 2015, p. 169), trust in
provider (Slade et al. 2015, p. 215), perceived risk (Slade et al. 2015, p. 214), personal
innovativeness in information technology (Agarwal and Prasad 1998, p. 210), and intention to

24
use NFC mobile payments (Schierz, Schilke, and Wirtz 2010, p. 213). Importantly, it was
ensured that (1) the items comprising the scales match the context of NFC mobile payments
adoption, and (2) the scales correspond to the definitions of the constructs discussed
previously. As one of the constructs (trust in mobile device reliability) has not been
empirically studied in previous research yet, a new measurement scale was developed based
on Mallat (2007) and researcher introspection. Since the construct is defined as the degree to
which consumers perceive their mobile device as reliable for conducting NFC mobile
payments, the following dimensions were included in the new scale: (1) reliability of the
battery; (2) reliability of the mobile Internet connection (if such is required to conduct NFC
mobile payments); (3) reliability of the mobile applications; (4) reliability of the mobile
operating system (i.e., iOS, Android); (5) reliability of the available authentication methods
(i.e., PIN code, fingerprint authentication); and, (6) overall mobile device reliability. An
overview of the measurement scales is available in Table 1.
Finally, background questions (yes/no) and demographic questions (multiple-choice)
represent categorical variables. For instance, respondents were asked to choose between six
age brackets (e.g., 18 to 24 years, 25 to 34 years, 35 to 44 years, 45 to 54 years, 55 to 64
years, 65 or older); two gender options (male, female); seven education levels (less than high
school; high school graduate; trade/technical/vocational training; Bachelor’s degree; Master’s
degree; Doctorate degree; other advanced degree), and five levels of employment (employed
for wages, self-employed, unemployed, student, retired).

25
4. Empirical Analysis and Results
This chapter presents the results of multiple statistical procedures conducted with the
statistical programs IBM SPSS and IBM SPSS Amos. These include (1) a preliminary data
analysis; (2) descriptive statistics of participants’ demographics and background with NFC
mobile payments and mobile commerce; (3) reliability analysis of the measurement
instrument; (4) validity analysis of the measurement instrument; (5) common method bias
assessment; (6) hypothesis testing by means of MRA, in order to estimate the significance,
strength, and direction of the direct effects of the IVs on the DV; and, (7) a small-scale
mediation analysis.
4.1.Preliminary Data Analysis
A total of 123 survey responses were collected in the period between April 6, 2017 and June
5, 2017. Prior to subjecting the data to multivariate analyses, it was ensured that reverse-
scaled items were transformed and invalid cases and outliers were identified. 12 of the 123
responses were considered invalid. Three of them were responses with high degradation time
scores of over 100 points. High degradation time scores signal that the respective respondents
have filled out the questionnaire too fast compared to other participants. Since being too fast
usually indicates a poor quality of the data (SoSciSurvey 2017), these responses were not
considered for further analysis. Nine unfinished responses were also excluded from the data
set.
In order to analyze the data for outliers, the nine scales of items were transformed into
total sum scores for each participant. As proposed by Hair et al. (2010), two methods were
applied to identify outliers in the data: (1) z-scores (univariate technique) and (2)
Mahalanobis D2 (multivariate technique) (Hair et al. 2010, p. 66-67). First, z-scores were

26
calculated for all scale scores. This method involves the transformation of the scale scores
into standard scores with a mean of 0 and standard deviation (SD) of 1, which makes them
comparable (Hair et al. 2010, p. 66). As Stevens (2009) points out, cases with a z-score > 3
(absolute value) are most likely outliers (Stevens 2009, p. 14). Based on this method, one case
with a z-score = -3.84 among the perceived ease of use z-scores was identified.
Second, Mahalanobis D2 values were calculated in a next step, in order to identify
multivariate outliers in the data. The resulting values were then compared to a chi-squared
distribution with degrees of freedom (df) equaling the number of predictors (= 8) by using the
1 – Cdf. Chisq (Mahalanobis D2, df) formula in SPSS, in order to calculate the probability
that the cases in the dataset are multivariate outliers (IBM Support 2016). As none of the
resulting probability values were below the conservative significance level of .001 (as
proposed by Tabachnik and Fidell 2007, p. 74), it was concluded that there are no multivariate
outliers in the dataset.
However, as outliers are characterized as extreme values that can potentially harm the
outcomes of multivariate statistical analyses (Hair et al. 2010, p. 158), it was decided to
remove the above-mentioned case with a z-score > 3. After the exclusion of this outlier, the
final data set amounts to N = 110 valid cases.
4.2.Analysis of Sample Characteristics
In a second step, the demographic characteristics of the study sample were analyzed. Table 2
demonstrates that the sample is characterized by a wide range of ages between 18 and 55 –
64. However, most of the participants are aged between 18 – 24 (7.3%), 25 – 34 (46.4%), and
35 – 44 (26.4%). These statistics show that the majority of the respondents stem from
technology-savvy generations. Further, the sample is relatively balanced in terms of gender:
47.3% are male and 52.7% are female. Overall, a total of 12 countries of origin are

27
represented, including Belgium, Bulgaria, Canada, China, Colombia, Estonia, Finland,
Germany, India, Romania, Russia, and Thailand. However, the majority of respondents stem
from Bulgaria (44.5%) and Germany (43.6%) – two European countries where NFC mobile
payments are not readily available yet. In terms of education, most respondents report to have
completed a higher education degree, such as a Bachelor’s degree (25.5%) or a Master’s
degree (57.3%). Finally, 80% stated to be currently employed for wages and 13.6% are
students.
Further, information regarding respondents’ experience with and knowledge of NFC
mobile payments and mobile commerce is available in Table 3. For instance, 98.2% of the
participants stated that they own a smartphone. As smartphone ownership is an important
characteristic of the target group of this study, this percentage is satisfactory. Moreover, as
expected, 97.3% reported that they have never completed an NFC mobile payment for goods
or services at a physical store or a restaurant using their smartphone. This figure satisfies the
study’s requirement that the sample should consist of consumers who are not users of NFC
mobile payments, in order to provide a representative picture of the factors responsible for the
adoption of this new mode of payment. Next, 70% stated that they were aware of NFC mobile
payments as an alternative to credit/debit cards and cash prior to the completion of the survey.
Finally, as expected most respondents (67.3%) stated that they have experience with online
shopping for goods and services on their mobile devices. To summarize, these descriptive
statistics demonstrate that remote mobile payments for goods and services over the Internet
enjoy a significantly wider acceptance than proximity mobile payments. Nevertheless, there is
a quite high level of awareness regarding NFC mobile payments, which indicates that the
majority of the respondents are currently in the knowledge stage of the innovation-decision
process.
28
4.3.Reliability Assessment
In a next step, the reliability of the measurement instrument was assessed by analyzing
Cronbach’s Alpha values of the scales, as well as the inter-item and item-total correlations.
Generally, a scale is considered reliable if Cronbach’s Alpha exceeds .70, the item-total
correlations exceed .50, and the inter-item correlations exceed .30 (Hair et al. 2010, p. 125).
Initial reliability assessments of the data (Table 4 - Table 12) suggested that some of the items
must be dropped in order to increase the reliability of two of the scales: namely, one item
from the perceived ease of use and personal innovativeness in IT scales respectively. After
removing these items, Cronbach’s Alpha values of these scales were recalculated (Table 13
and Table 14). Finally, Table 15 provides an overview of the final results of the reliability
analysis. Overall, all scales exhibit quite high internal consistency above the recommended
minimum of .70. Specifically, Cronbach’s Alpha of five scales (compatibility, trust in
provider, trust in mobile device reliability, perceived risk, and intention to use NFC mobile
payments) equals or exceeds .90. Two scales (perceived usefulness and trialability) have
Cronbach’s Alpha values over .80. Finally, the perceived ease of use and personal
innovativeness in IT scales exhibit Cronbach’s Alpha values of over .70. All scales are
characterized by very good inter-item and item-total correlations. To summarize, these results
suggest that the measurement instrument is reliable.
4.4.Validity Assessment
Following the reliability analysis, a construct validity analysis of the measurement instrument
was conducted. Construct validity refers to the degree to which the measured variables (i.e.,
items) correspond to the latent constructs they are supposed to measure (Hair et al. 2010, p.
708). As construct validity is comprised of convergent and discriminant validity (Hair et al.

29
2010, p. 709-710), the assessment of the latter two types of validity is in the center of the
following discussion.
For this purpose, exploratory factor analysis (EFA) in IBM SPSS and confirmatory
factor analysis (CFA) in IBM SPSS Amos were carried out. As the term suggests, EFA is
used to explore how individual measured variables (i.e., items) in a dataset are related to each
other and can be grouped together to represent a smaller number of higher-level constructs or
factors (Hair et al. 2010, p. 693). In EFA, the researcher has no specific idea about the factor
structure of the data in advance. In contrast to EFA, CFA is used to test and confirm a pre-
defined, theory-based data structure (Hair et al. 2010, p. 693). Despite the fact that the study
at hand is characterized by a pre-defined, theory-based structure of items and constructs, it
was decided to conduct EFA first, because one of the scales, trust in mobile device reliability,
is new and has not been validated yet. Another reason for conducting EFA first is to gain a
first impression of the actual structure of the data.
As Hair et al. (2010) suggest, an important requirement for applying EFA is the prior
assessment of the inter-correlation among the measured variables (Hair et al. 2010, p. 103).
For this purpose, Bartlett’s test of sphericity and Kaiser-Meyer-Olkin test of sampling
adequacy (KMO) were conducted. A statistically significant Bartlett’s test of sphericity and a
KMO test measure above .50 at the minimum, and ideally above .80, signal that there is
sufficient correlation between the variables (Hair et al. 2010, p. 104-105). The Bartlett test of
sphericity is significant (χ2 (703) = 3918.22, p = .000) and the KMO measure of sampling
adequacy is .903 (Table 16), suggesting that the application of EFA is appropriate.
Next, all items, except for those dropped after the initial reliability analysis, were
subjected to principal axis factoring (PAF) based on eigenvalue above 1 and with Varimax
rotation. PAF was chosen over the more widely used principal components analysis (PCA)
because PAF is considered most appropriate when the objective of the analysis is

30
identification of latent constructs rather than data reduction (Hair et al. 2010, p. 107-108).
Finally, only factor loadings above the absolute value of .50 were taken into consideration as
they can be regarded as practically significant for a sample size of > 110 (Hair et al. 2010, p.
117).
The results of the PAF analysis suggest that 7 factors account for 75.97% of the total
variance (Table 17). The resulting rotated factor matrix (Table 18) demonstrates how the
observed variables (i.e., items) load on the 7 factors. Interestingly, perceived usefulness,
compatibility, and intention to use NFC mobile payments load on the same factor. Most of the
other items load on a separate factor as expected. No cross loadings can be observed. It seems
that the items representing perceived usefulness and compatibility are highly correlated with
those of the DV intention to use NFC mobile payments. Since the presence of the DV seems
to have had an effect on the distribution of the factor loadings, it was decided to remove the
intention to use items and run a second EFA only on the items representing the IVs in the
research model. The second EFA (PAF; eigenvalue > 1; Varimax rotation) resulted in a KMO
test measure of .897 and a statistically significant Bartlett’s test of sphericity (χ2 (561) =
3178.55, p = .000) (Table 19). A total of 6 factors were extracted, accounting for 73.09% of
the variance (Table 20). The resulting rotated factor matrix (Table 21) shows factor loadings
above .50 (absolute value). Similarly to the first EFA, perceived usefulness and compatibility
items load on one factor. The same is true for trust in provider and trust in mobile device
reliability items. Perceived ease of use, trialability, perceived risk, and personal
innovativeness in IT items load on separate factors as expected. No cross-loadings can be
observed. However, two items (PeoU_03 and Trust_in_provider_04) do not load sufficiently
on any factor. Therefore, they were excluded from further analyses. As perceived usefulness
and compatibility items load on one factor in both EFAs, it was decided to treat them as one
construct under the title of perceived usefulness & compatibility in further analyses. However,

31
trust in provider and trust in mobile device reliability items load on separate factors in the
first EFA, but on one factor in the second EFA. For this reason, a decision to treat all trust
items as one factor was difficult to meet at this point. A CFA was carried out in a second step,
in order to assess the overall model fit as well as the convergent and discriminant validity of
the scales.
For this purpose, all items retained after the reliability analysis and the EFA were
modeled in path diagrams and subjected to CFA in IBM SPSS Amos. The overall model fit
was assessed based on (1) χ2 statistic, (2) two absolute fit measures (root mean square error of
approximation (RMSEA) and normed χ2), and (3) one incremental fit measure (comparative
fit index (CFI)) (Hair et al. 2010, p. 672). A non-significant χ2 test (Hair et al. 2010, p. 666),
normed χ2 < 2.0 or between 2.0 and 5.0 (Hair et al. 2010, p. 721), RMSEA < .08, and CFI >
.92 suggest good model fit for a sample size of less than 250 subjects and more than 30
observed variables (i.e., items) (Hair et al. 2010, p. 672). Further, convergent validity was
assessed by examining the standardized regression weights (i.e., factor loadings), average
variance extracted (AVE) of the constructs as well as the construct reliability (CR) (Hair et al.
2010, p. 709). Overall, standardized factor loadings over .50, and ideally over .70, are
considered significant. AVE values over .50 and CR values over .70 signal satisfactory
convergent validity (Hair et al. 2010, p.709-710). Finally, discriminant validity was assessed
by comparing the AVE values with the squared inter-construct correlation estimates. As a rule
of thumb, if the squared inter-construct correlation estimates are lower than the AVE values,
then discriminant validity is in place (Hair et al. 2010, p. 710).
An initial CFA including all items representing the IVs and the DV (Figure 13)
resulted in a significant χ2 test (χ2 (566) = 911.94, p = .000), acceptable RMSEA = .075 and
normed χ2 = 1.611 and slightly lower CFI = .904 than required (Table 22). All standardized
regression weights are higher than the minimal threshold of .50. Only four standardized

32
regression weights are lower than .70. However, the rest are higher than .70. All AVE and CR
values are higher than the threshold values of .50 and .70 respectively (Table 23). Next,
discriminant validity was assessed based on the AVE values and the inter-construct
correlation estimates (Table 24). As evident in Table 25, all AVE values are higher than the
squared correlations except for the squared correlation between perceived usefulness &
compatibility and intention to use NFC mobile payments. This finding points to the
assumption that perceived usefulness & compatibility construct is highly correlated with the
DV. Similarly to the EFA discussed above, it was decided to exclude the DV from the CFA
and focus on the IVs only. Further, the item with the lowest standardized regression weight
(Perceived_usefulness_04) was also excluded in order to improve the overall model fit
statistics. With that, a second CFA was carried out (Figure 14). Table 26 shows that the
modifications of the measurement model have improved the model fit statistics. For instance,
the χ2 statistic (χ2 (413) = 617.764, p = .000) is lower but the test is still significant, which
points to a poor model fit. However, as Hair et al. (2010) suggest, the χ2 statistic depends
heavily on the sample size and should not be used as a single measure of model fit (Hair et al.
2010, p. 666-667). Absolute and incremental fit measures should be considered as well. The
RMSEA = .067, the normed χ2 = 1.496, and the CFI > .926 suggest very good model fit.
Turning to convergent validity measures (Table 27), the majority of the standardized
regression weights are > .70 and only three are < .70. All AVE and CR values are above the
minimum of .50 and .70 respectively. To summarize, these results suggest satisfactory
convergent validity. Finally, based on the AVE values and the inter-construct correlation
estimates (Table 28), Table 29 provides evidence for satisfactory discriminant validity
because all squared inter-construct correlation estimates are lower than the AVE values.
All in all, the CFAs discussed above suggest that the measurement instrument is
characterized by adequate construct validity and reliability. For this reason, the application of
33
further multivariate analytical techniques, such as MRA, are appropriate. Importantly, based
on the CFAs, it was decided to treat perceived usefulness & compatibility items as one
construct, and trust in provider and trust in mobile device reliability items – as separate
constructs in further analyses.
4.5.Common Method Bias Assessment
A last step before subjecting the data to MRA was to assess common method bias (CMB).
Common method variance (CMV) refers to the variance caused by the method of
measurement rather than by the measured constructs (Podsakoff et al. 2003, p. 879). CMV
represents a major problem in survey research because it can have a significant effect on the
relationships between investigated constructs (Podsakoff et al. 2003, p. 880). As Podsakoff et
al. (2003) point out, CMV can be caused by (1) the fact that the measurements of the IVs and
the DV are provided by the same person, as well as due to (2) particular item characteristics;
(3) the context in which the items are placed in the survey; and, (4) the context in which the
data were collected (Podsakoff et al. 2003, p. 881). In the current study, CMB was assessed
by applying Harman’s single-factor test (Podsakoff et al. 2003, p. 889). For this purpose, all
measured variables (including the intention to use NFC mobile payments items) retained after
the CFA were loaded into an EFA in IBM SPSS by specifying the extraction of only one
factor without rotation. As Podsakoff et al. (2003) argue, CMB represents a problem if “[…]
one general factor will account for the majority of the covariance among the measures”
(Podsakoff et al. 2003, p. 889). Looking at Table 30, the total variance explained by this one
factor is 42.18%, which is below the 50% threshold that Podsakoff et al. (2003) describe. This
result suggests that CMB is most likely not a major problem in the current study.

34
4.6.Hypothesis Testing by Means of Standard Multiple Regression
Following the common method bias assessment, MRA (standard multiple regression, in
particular) was carried out, in order to test hypotheses H1 to H8 outlined in section 3.1. Study
Design. All scales were transformed into mean scores for each participant. The resulting scale
scores were then tested for the assumptions of multivariate data analysis: (1) normality and
(2) linearity (Hair et al. 2010, p. 70-77). Further, the variate (i.e., the IVs observed
collectively) was tested for the MRA-specific assumptions of (1) linearity, (2) constant
variance of the error terms (homoscedasticity), (3) independence of residuals, and (4)
normality of the error term distribution (Hair et al. 2010, p. 182). Finally, multicollinearity
was assessed as well (Hair et al. 2010, p. 200-201).
Testing for normality of the IVs and the DV involved a graphical analysis of
histograms and normal probability plots as well as Kolmogorov-Smirnov and Shapiro-Wilks
statistical tests of normality (Hair et al. 2010, p. 72). The histograms (Figure 15), including
normal distribution curves, show that most of the variables are slightly skewed to the right,
which was expected given the survey nature of the data. The normal probability plots (Figure
16) show no extreme departure from normality. However, the Kolmogorov-Smirnov and
Shapiro Wilks tests of normality (Table 31) provided mostly statistically significant results at
α = .05, which indicates that the data are not normally distributed. The only exception is the
not statistically significant Kolmogorov-Smirnov test result for perceived risk (D (110) =
.079, p = .086).
Next, the existence of linear relationships between the individual IVs and the DV was
assessed by looking at the Pearson correlations available in Table 32. As Cohen (1992)
maintains, effect sizes (in absolute values) of a product-moment correlation r can be
characterized as follows: (1) .10 - .30 (small correlation); (2) .30 - .50 (medium correlation);
and, (3) > .50 (large correlation) (Cohen 1992, p. 157). Based on this classification, perceived

35
usefulness & compatibility (r = .841, N = 110, p = .000), trialability (r = .504, N = 110, p =
.000), trust in provider (r = .648, N = 110, p = .000), and trust in mobile device reliability (r =
.626, N = 110, p = .000) exhibit large, positive, and statistically significant correlations with
intention to use NFC mobile payments. Further, perceived risk (r = -.558, N = 110, p = .000)
has a large, negative, and statistically significant correlation with the DV. Finally, perceived
ease of use (r = .441, N = 110, p = .000) and personal innovativeness in IT (r = .417, N = 110,
p = .000) are moderately correlated with the DV. Overall, these results suggest that most of
the IVs have strong linear associations with the DV.
Turning to the variate, the linearity of the relationship between the IVs, observed
collectively, and the DV was assessed by analyzing the scatter plot in Figure 17, which plots
studentized residuals against unstandardized predicted values (Hair et al. 2010, p. 220). As the
residual values do not seem to form a distinctive pattern, but are randomly scattered above
and below the zero point, the existence of a linear relationship between the variate and the DV
seems plausible. Further, by looking at the same scatter plot, an inference about the
homoscedasticity of residuals can be made as well. Specifically, as the residuals do not form
any distinctive pattern, the assumption of homoscedasticity of residuals is met as well (Hair et
al. 2010, p. 221).
Next, the assumption of independence of the error terms was tested with the help of
the Durbin-Watson test. A test statistic of around 2 suggests that residuals are not correlated
(Anderson et al. 2013, p. 789). As the Durbin-Watson statistic in the current analysis is 2.120
(Table 33), independence of residuals is assumed.
Further, normality of the error term distribution was tested by analyzing a histogram
with a superimposed normal curve (Figure 18) and a normal P-P plot of the standardized
residuals (Figure 19) (as proposed by Hair et al. 2010, p. 221). Both figures suggest that the
36
residuals are approximately normally distributed. With that, the assumption of normality of
residuals is also met.
Finally, multicollinearity refers to a situation where one IV and a set of other IVs are
highly correlated (Hair et al. 2010, p. 156). It is of particular concern in MRA due to its
potential to (1) decrease the overall R2; (2) lead to a confounded estimation of the regression
coefficients; and (3) have a negative effect on the tests for statistical significance of the
regression coefficients (Hair et al. 2010, p. 205). Multicollinearity was assessed (1) by
examining the Pearson correlations between the IVs (Table 32) and (2) by analyzing the
variance inflation factor (VIF) values (Table 34) of all IVs (Hair et al. 2010, p. 200-201). No
substantial correlations (r > .90) between the IVs can be observed (Hair et al. 2010, p. 200)
and the VIF values are well below the generally accepted threshold of 10 as well as the more
conservative thresholds of 3 and 5 (Hair et al. 2010, p. 205). These results suggest that
multicollinearity is not of concern in the current study.
All in all, the results discussed above suggest that most assumptions of MRA are met.
The only exception is the assumption of normality of the individual variables, which can be
explained by the possibility that the study participants exhibit similar characteristics and have
therefore responded to the survey questions in a similar fashion. This has most probably been
caused by the snowball sampling technique used to recruit respondents. However, all other
important assumptions, especially those related to the variate, are given. For this reason, the
application of MRA in this particular instance is considered appropriate. As evident in Table
33, the R2 for the overall model is 78.9% with an adjusted R2 of 77.5%, suggesting very good
model fit. Overall, the IVs statistically significantly predict intention to use NFC mobile
payments, F (7, 102) = 54.614, p = .000. Looking at the standardized coefficients and
significance statistics in Table 34, perceived usefulness & compatibility (β = .544, p = .000)
and trialability (β = .140, p = .017) exhibit statistically significant positive effects and

37
perceived risk (β = -.205, p = .001) – a statistically significant negative effect on the DV at α
= .05. These standardized coefficients suggest that perceived usefulness & compatibility has
the strongest effect, followed by perceived risk and trialability. However, the other variables
in the regression model do not have statistically significant effects on intention to use NFC
mobile payments. Overall, these results provide support for H1, H2, H4, and H7. In contrast,
H3, H5, and H6 are not supported and H8 (personal innovativeness in IT) is very close to
significance (β = .102, p = .051) but is nevertheless rejected.
4.7.Mediation Analysis
Finally, as discussed above, Davis (1993) maintains that perceived ease of use has an indirect
effect on intention to use via perceived usefulness (Davis 1993, p. 476). This idea is reflected
in H9. In order to test this last hypothesis, a small-scale mediation analysis based on Baron
and Kenny (1986) was carried out. It involves the constructs (1) perceived usefulness &
compatibility, (2) perceived ease of use, and (3) intention to use NFC mobile payments,
whereby (1) is the hypothesized mediator variable (MV), (2) is the IV, and (3) is the DV
(Figure 20). As proposed by Baron and Kenny (1986), a series of simple and multiple
regression analyses were conducted in order to find out whether a mediation effect is present.
First, using simple regression analyses, the effect of the MV on the DV, the effect of the IV
on the DV, and the effect of the IV on the MV were examined. Finally, a multiple regression
analysis estimated the effects of both the MV and the IV on the DV (Baron and Kenny 1986,
p. 1177). The results of the simple regressions (Table 35) show that perceived usefulness &
compatibility (β = .841, p = .000) and perceived ease of use (β = .441, p = .000) have
statistically significant effects on intention to use NFC mobile payments at α = .05 when
observed separately. The same is true for the effect of perceived ease of use (β = .469, p =
.000) on perceived usefulness & compatibility. However, when perceived ease of use (β =

38
.060, p = .312) and perceived usefulness & compatibility (β = .812, p = .000) are analyzed
together, only the latter exhibits a statistically significant effect on the DV (F (2, 107) =
130.552, p = .000, R2 = .709, R2Adjusted = .704) (Table 36). These results suggest that the effect
of perceived ease of use on the DV is fully mediated by perceived usefulness & compatibility,
which supports H9. This full mediation effect can explain why perceived ease of use does not
exhibit a statistically significant direct effect on the DV in the main MRA. The mediation
effect seems to have contributed to the effect of perceived usefulness & compatibility on the
DV in the main MRA, which is much larger than those of the other IVs in the research model.
5. Discussion
The final section of this paper is dedicated to a summary of the study findings and what they
mean for providers of mobile payment solutions and merchants/retailers in terms of
managerial implications. The paper then concludes with a summary of the study limitations
and potential avenues for future research.
5.1. Summary of Findings
In retrospect, the main objective of this study was to identify the most important factors
influencing consumers’ intention to adopt NFC mobile payments at the POS. Overall, the
research project at hand delivers findings in the following four areas: (1) the reliability and
validity of the scales; (2) the close relationship between the constructs perceived usefulness
and compatibility; (3) the results of the MRA; and, (4) the results of the mediation analysis.
First, all scales are characterized by very good reliability and validity, including the
new scale for trust in mobile device reliability. Despite the fact that this new construct does

39
not exhibit a statistically significant direct effect on the DV, the scale is valid and can be
adopted or adapted in future studies where mobile device reliability is considered a factor
relevant for the adoption of mobile-based services. Importantly, further research of this new
construct is required in the context of NFC mobile payments adoption.
Second, the results of the EFA and the CFA suggest that perceived usefulness
(stemming from TAM) and compatibility (stemming from IDT) are closely related constructs.
Questions that arise from this finding are (1) which of these constructs is the dominant one,
and (2) can they be captured under the umbrella of a new, superordinate construct? In relation
to the first question, a plausible explanation would be that compatibility is a strong
determinant of perceived usefulness – the more compatible NFC mobile payments are
perceived as by consumers, the higher the degree of usefulness they attach to this new mode
of payment. With regard to the second question, more research is required.
Third, the outcome of the MRA demonstrates that perceived usefulness &
compatibility, trialability, and perceived risk are significant direct predictors of intention to
use NFC mobile payments. However, the results do not provide support for the hypothesized
direct effects of perceived ease of use, trust in provider, and trust in mobile device reliability
on the DV. Personal innovativeness in IT is on the brink of significance but is nevertheless
rejected as well.
Finally, the small-scale mediation analysis provides support for an indirect effect of
perceived ease of use on intention to use NFC mobile payments via perceived usefulness &
compatibility. This result confirms the mediation effect depicted in the TAM model.
5.2.Managerial Implications
Important managerial implications for providers of mobile payment solutions and
merchants/retailers can be drawn from the study results. First, a very positive finding is that

40
consumers perceive NFC mobile payments as useful, easy to learn and use, and compatible
with their lifestyle, needs, and shopping habits. Since there is apparently consumer demand
for this new mode of payment, merchants/retailers need to invest in NFC-enabled payment
terminals, in order to enable innovators and early adopters to start using proximity mobile
payments at the POS. By setting an example for the less innovative and risk-averse
consumers, innovators and early adopters can drive diffusion via peer effects and word-of-
mouth (WOM). Moreover, providers of mobile payment solutions can also benefit from the
WOM of innovative adopters. For this purpose, providers should seek influential key users
who could create buzz and awareness among potential adopters in the Internet space. In their
own marketing efforts, providers should explicitly focus on the benefits that NFC mobile
payments can bring to consumers. Finally, it is also worth mentioning that some of the mobile
wallet providers are technology giants, such as Apple, Google, and Samsung. These
companies are established and trusted, and can thus benefit from brand effects in promoting
their mobile payment solutions.
Second, consumers are willing to try out and experiment with NFC mobile payments.
This is another clear signal for merchants/retailers that they should invest in NFC-enabled
infrastructure. In order to promote NFC mobile payments, providers and merchants/retailers
should invest in online and onsite demonstrations to give consumers the opportunity to learn
how to set up their mobile wallet and how to use it in a brick-and-mortar environment. The
purpose of these demonstrations would be to decrease consumers’ uncertainty about the new
payment method. Importantly, providers can drive adoption of mobile wallets and NFC
mobile payments by offering reward programs to consumers. A nice example of such a
reward program is Samsung Rewards (Samsung 2017). Samsung Pay (Samsung’s mobile
wallet solution) users get special promotions and can gather reward points for every mobile
payment they make. Users can then redeem the reward points and get a Samsung product in
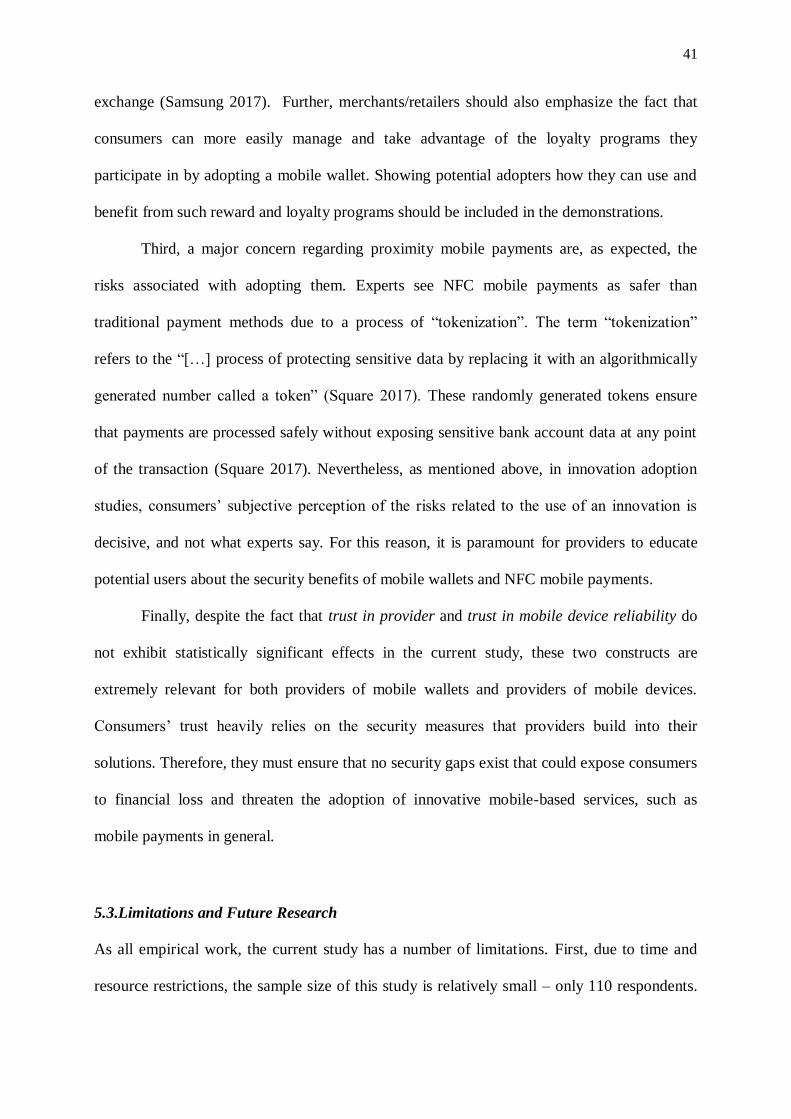
41
exchange (Samsung 2017). Further, merchants/retailers should also emphasize the fact that
consumers can more easily manage and take advantage of the loyalty programs they
participate in by adopting a mobile wallet. Showing potential adopters how they can use and
benefit from such reward and loyalty programs should be included in the demonstrations.
Third, a major concern regarding proximity mobile payments are, as expected, the
risks associated with adopting them. Experts see NFC mobile payments as safer than
traditional payment methods due to a process of “tokenization”. The term “tokenization”
refers to the “[…] process of protecting sensitive data by replacing it with an algorithmically
generated number called a token” (Square 2017). These randomly generated tokens ensure
that payments are processed safely without exposing sensitive bank account data at any point
of the transaction (Square 2017). Nevertheless, as mentioned above, in innovation adoption
studies, consumers’ subjective perception of the risks related to the use of an innovation is
decisive, and not what experts say. For this reason, it is paramount for providers to educate
potential users about the security benefits of mobile wallets and NFC mobile payments.
Finally, despite the fact that trust in provider and trust in mobile device reliability do
not exhibit statistically significant effects in the current study, these two constructs are
extremely relevant for both providers of mobile wallets and providers of mobile devices.
Consumers’ trust heavily relies on the security measures that providers build into their
solutions. Therefore, they must ensure that no security gaps exist that could expose consumers
to financial loss and threaten the adoption of innovative mobile-based services, such as
mobile payments in general.
5.3.Limitations and Future Research
As all empirical work, the current study has a number of limitations. First, due to time and
resource restrictions, the sample size of this study is relatively small – only 110 respondents.

42
Further, the non-probability snowball sampling technique used in the study has led to the
recruitment of individuals who have responded in a similar fashion to the survey questions.
The scale scores of the constructs in the research model are hence non-normally distributed.
Nevertheless, the sample is considered representative of the target group of mobile payment
services since the majority of the participants stem from technology-savvy generations and
higher education backgrounds. These consumers are more likely to be open to the adoption of
innovative information technologies, such as mobile wallets and NFC mobile payments.
Second, despite the fact that the sample is relatively balanced in terms of gender and
includes respondents from technology-savvy generations, two large groups from different
cultures – Bulgaria and Germany – make up the majority of participants. A limitation
stemming from this fact is that the current study does not account for cultural differences in
the responses. However, the investigation of culture as a moderator variable can be a subject
to a future study on the adoption of NFC mobile payments.
Third, the study does not investigate the relationships between the IVs, intention to
use, and actual use behavior due to unavailable data. Nevertheless, as Davis (1993) and
Venkatesh, Thong, and Xu (2012) suggest, intention to adopt is a very good predictor of
actual technology adoption and use (Davis 1993, p. 476; Venkatesh, Thong, and Xu 2012, p.
160). The development of a research model where intentions to use NFC mobile payments
and actual adoption and usage behavior are investigated would be a subject for further
research, when data becomes available with increasing diffusion.
Another potential avenue for future research would be a study focusing on experienced
users of NFC mobile payments and investigating the factors influencing their intentions to
continue using this payment method. Further, in terms of methodology, conjoint analysis
represents a beneficial method for tapping into consumers’ attitudes towards a product or a
service. Since conjoint analysis has been underrepresented in the mobile payments literature

43
in favor of survey methods, it would be beneficial to analyze the most important traits of
mobile wallets and NFC mobile payments from a conjoint analysis perspective.
In conclusion, the study at hand contributes to previous research in that it provides a
research model of NFC mobile payments adoption at the POS. The research model is
characterized by a strong theoretical foundation in view of IDT and TAM. It also includes
further new and understudied constructs that are considered relevant in this particular context.
The study findings indicate that NFC mobile payments have the potential to diffuse more
rapidly in the near future. Nevertheless, providers of mobile payments solutions, as well as
merchants and retailers, must work towards bringing down adoption barriers related to
security, trust, and NFC-enabled infrastructure.

44
Figures
Figure 1. Number of Smartphone Users Worldwide from 2014 to 2020 (in Billions)
Source: (Statista 2017a)

45
Figure 2. Users in the Mobile Payments Market
Source: (Statista 2017b)
Note: “The “Mobile Payments” segment includes transactions at Point-of-Sale that are
processed via smartphone applications (so-called “mobile wallets”). Well-known providers of
mobile wallets are ApplePay, Google Wallet and Samsung Pay. The payment in this case is
made by a contactless interaction of the smartphone app with a suitable payment terminal
belonging to the merchant. The data transfer can be made, for example, via wireless standard
NFC (Near Field Communication) or by scanning a QR code to initiate the payment. A user
pays for a purchase via a “Mobile Wallet” application by triggering an online bank transfer or
by using a digitally stored credit or debit card (Host Card Emulation). […]” (Statista 2017g).
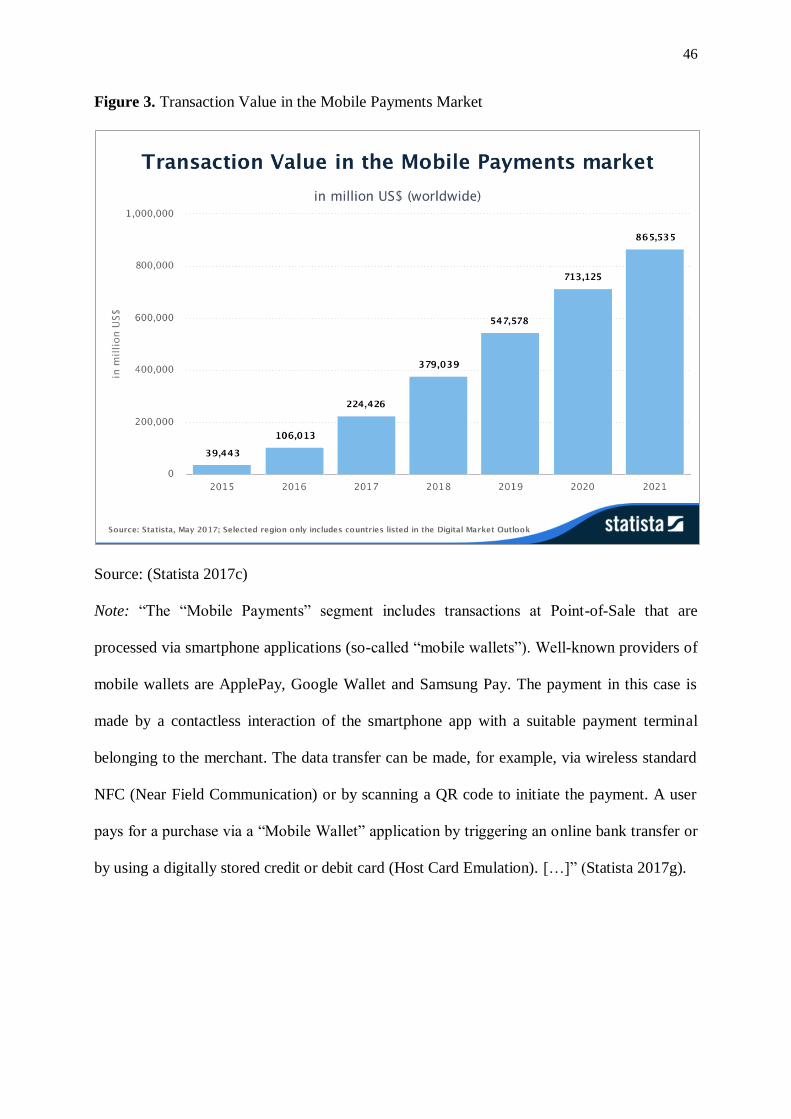
46
Figure 3. Transaction Value in the Mobile Payments Market
Source: (Statista 2017c)
Note: “The “Mobile Payments” segment includes transactions at Point-of-Sale that are
processed via smartphone applications (so-called “mobile wallets”). Well-known providers of
mobile wallets are ApplePay, Google Wallet and Samsung Pay. The payment in this case is
made by a contactless interaction of the smartphone app with a suitable payment terminal
belonging to the merchant. The data transfer can be made, for example, via wireless standard
NFC (Near Field Communication) or by scanning a QR code to initiate the payment. A user
pays for a purchase via a “Mobile Wallet” application by triggering an online bank transfer or
by using a digitally stored credit or debit card (Host Card Emulation). […]” (Statista 2017g).

47
Figure 4. Global Comparison – Transaction Value in the Mobile Payments Market
Source: (Statista 2017d)
Note: “The “Mobile Payments” segment includes transactions at Point-of-Sale that are
processed via smartphone applications (so-called “mobile wallets”). Well-known providers of
mobile wallets are ApplePay, Google Wallet and Samsung Pay. The payment in this case is
made by a contactless interaction of the smartphone app with a suitable payment terminal
belonging to the merchant. The data transfer can be made, for example, via wireless standard
NFC (Near Field Communication) or by scanning a QR code to initiate the payment. A user
pays for a purchase via a “Mobile Wallet” application by triggering an online bank transfer or
by using a digitally stored credit or debit card (Host Card Emulation). […]” (Statista 2017g).

48
Figure 5. Users in the Digital Payments Market
Source: (Statista 2017e)
Note: “The “Digital Payments” market segment is led by consumer transactions and includes
payments for products and services which are made over the Internet, mobile payments at
Point-of-Sale (POS) via smartphone applications as well as cross-border Peer-to-Peer
transfers between private users. The following are not included in this segment: transactions
between businesses (Business-to-Business payments), bank transfers initiated online (that are
not in connection with products and services purchased online), and payment transactions at
the Point-of-Sale where mobile card readers (terminals) are used. The “Digital Payments”
market segment is comprised of the following sub-segments: Digital Commerce, Mobile
Payments, P2P Money Transfers” (Statista 2017h).

49
Figure 6. Transaction Value in the Digital Payments Market
Source: (Statista 2017f)
Note: “The “Digital Payments” market segment is led by consumer transactions and includes
payments for products and services which are made over the Internet, mobile payments at
Point-of-Sale (POS) via smartphone applications as well as cross-border Peer-to-Peer
transfers between private users. The following are not included in this segment: transactions
between businesses (Business-to-Business payments), bank transfers initiated online (that are
not in connection with products and services purchased online), and payment transactions at
the Point-of-Sale where mobile card readers (terminals) are used. The “Digital Payments”
market segment is comprised of the following sub-segments: Digital Commerce, Mobile
Payments, P2P Money Transfers” (Statista 2017h).

50
Figure 7. Variables Determining the Rate of Innovation Adoption
Source: Rogers (2003, p. 222)

51
Figure 8. Adopter Categories Based on Their Degree of Innovativeness
Source: Rogers (2003, p. 281)
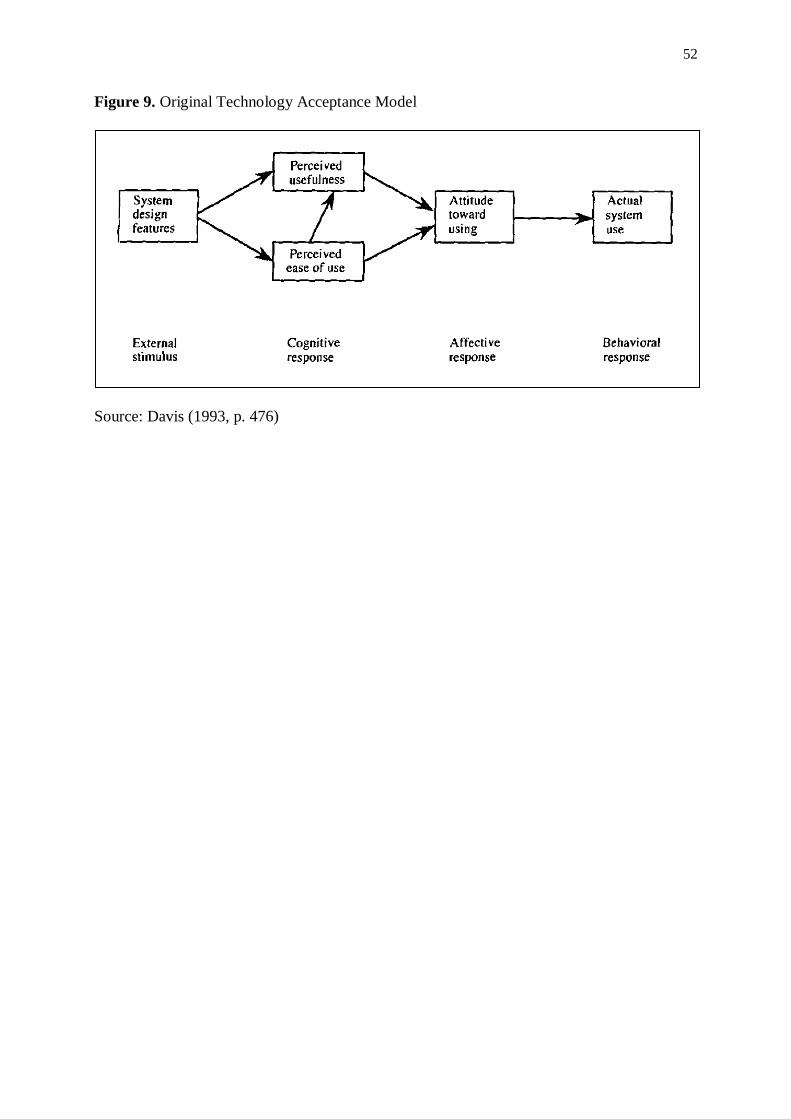
52
Figure 9. Original Technology Acceptance Model
Source: Davis (1993, p. 476)

53
Figure 10. Model of Unified Theory of Acceptance and Use of Technology (UTAUT) in
Organizational Contexts
Source: Venkatesh et al. (2003, p. 447)

54
Figure 11. Model of Unified Theory of Acceptance and Use of Technology (UTAUT2) in
Consumer Contexts
Source: Venkatesh, Thong, and Xu (2012, p. 160)
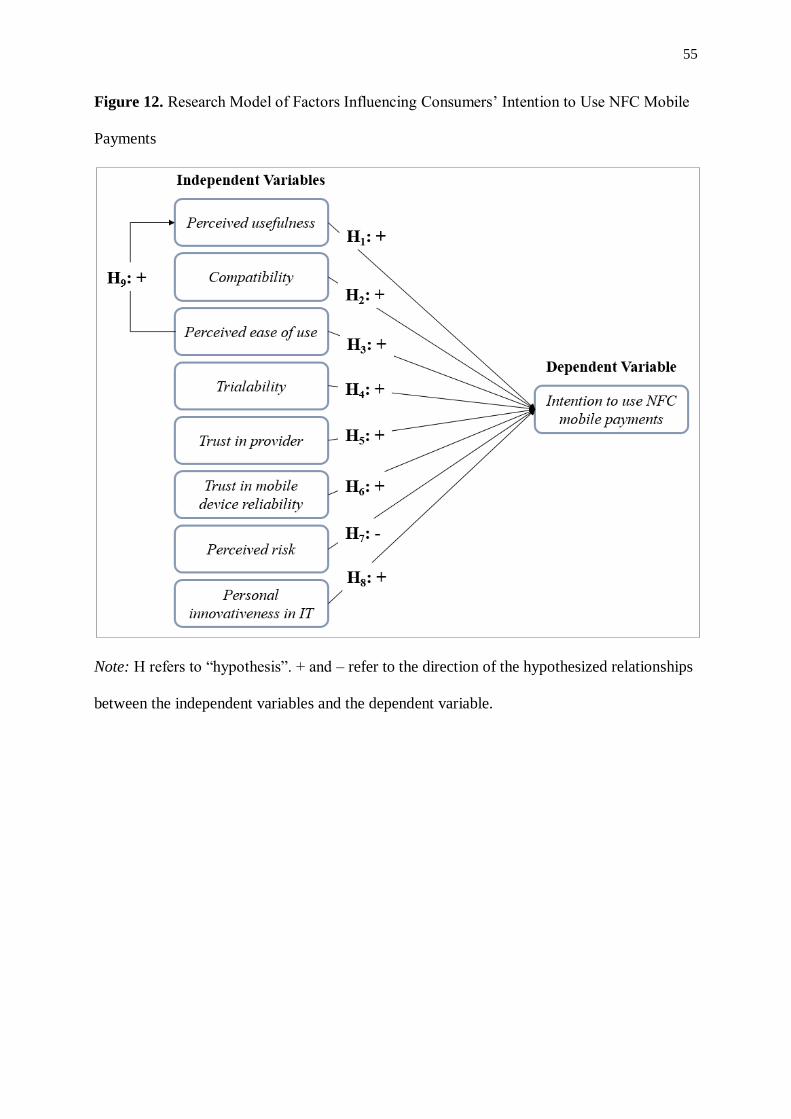
55
Figure 12. Research Model of Factors Influencing Consumers’ Intention to Use NFC Mobile
Payments
Note: H refers to “hypothesis”. + and – refer to the direction of the hypothesized relationships
between the independent variables and the dependent variable.
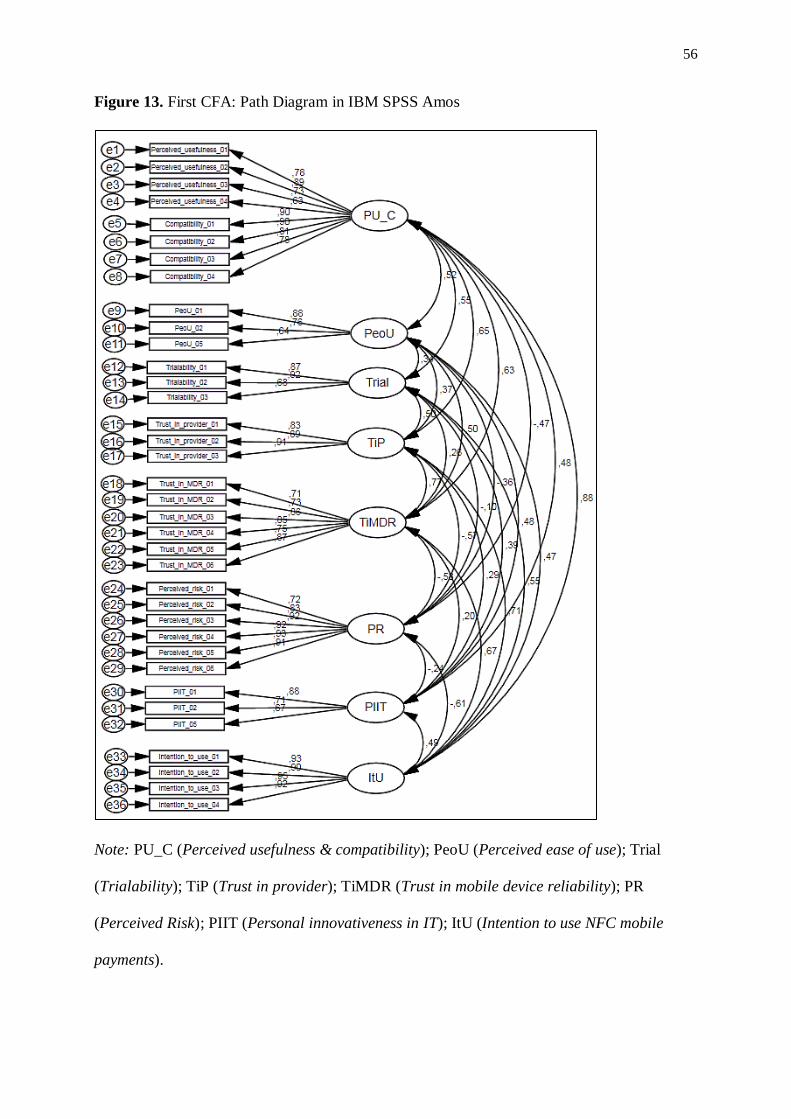
56
Figure 13. First CFA: Path Diagram in IBM SPSS Amos
Note: PU_C (Perceived usefulness & compatibility); PeoU (Perceived ease of use); Trial
(Trialability); TiP (Trust in provider); TiMDR (Trust in mobile device reliability); PR
(Perceived Risk); PIIT (Personal innovativeness in IT); ItU (Intention to use NFC mobile
payments).
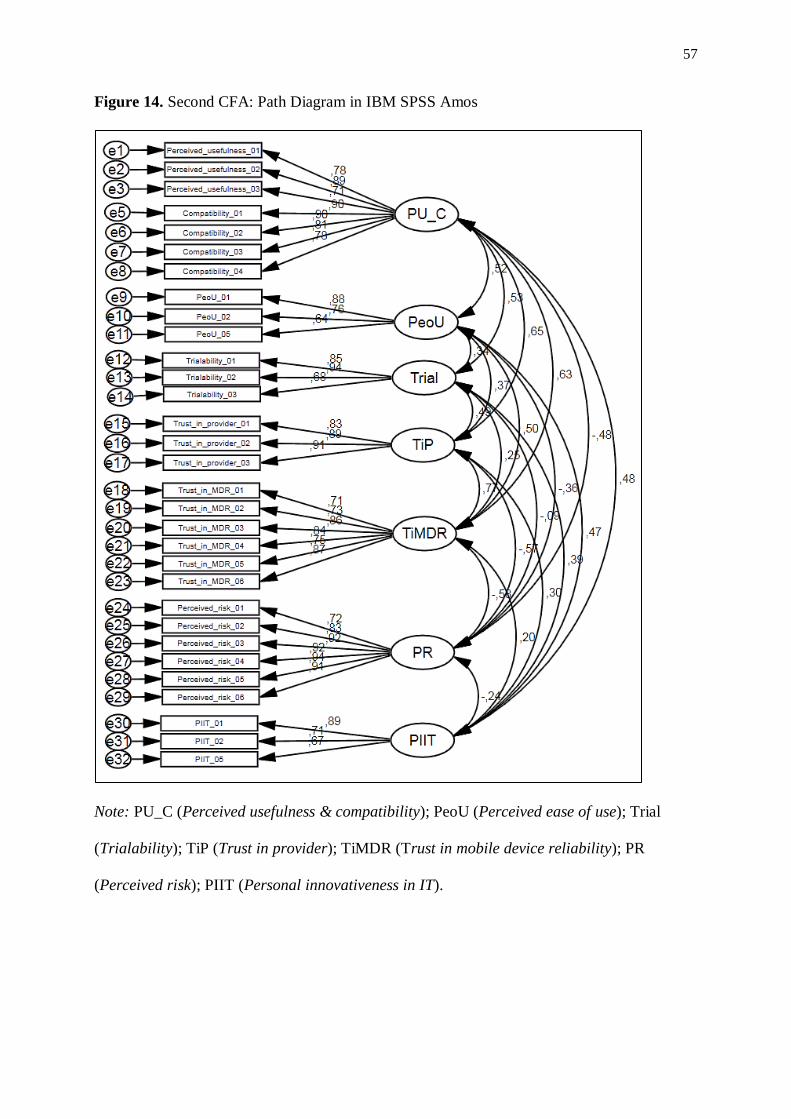
57
Figure 14. Second CFA: Path Diagram in IBM SPSS Amos
Note: PU_C (Perceived usefulness & compatibility); PeoU (Perceived ease of use); Trial
(Trialability); TiP (Trust in provider); TiMDR (Trust in mobile device reliability); PR
(Perceived risk); PIIT (Personal innovativeness in IT).
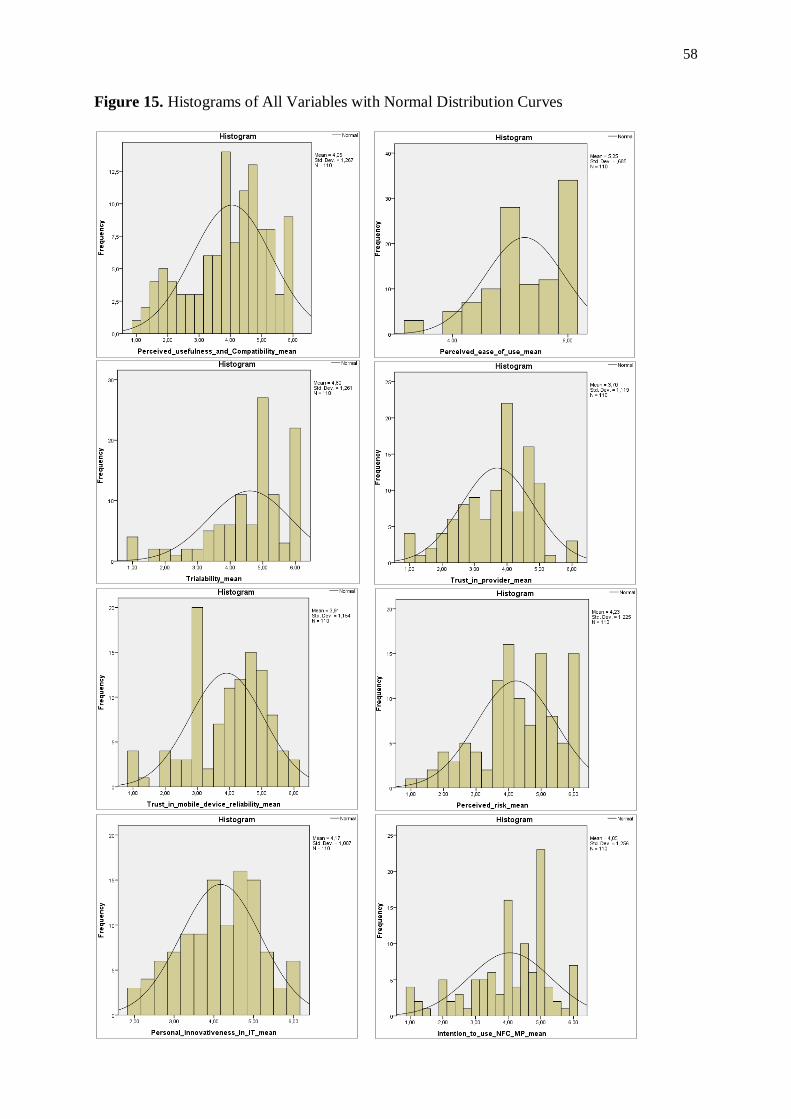
58
Figure 15. Histograms of All Variables with Normal Distribution Curves

59
Figure 16. Normal Probability Plots of All Variables
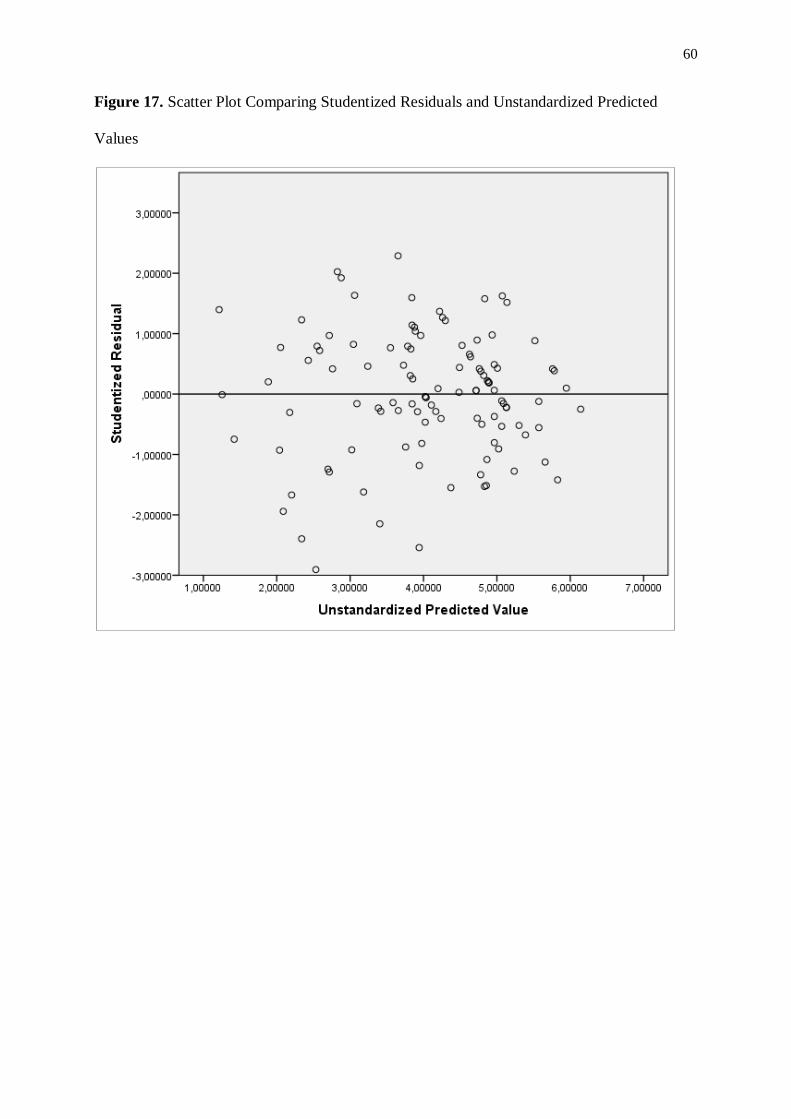
60
Figure 17. Scatter Plot Comparing Studentized Residuals and Unstandardized Predicted
Values
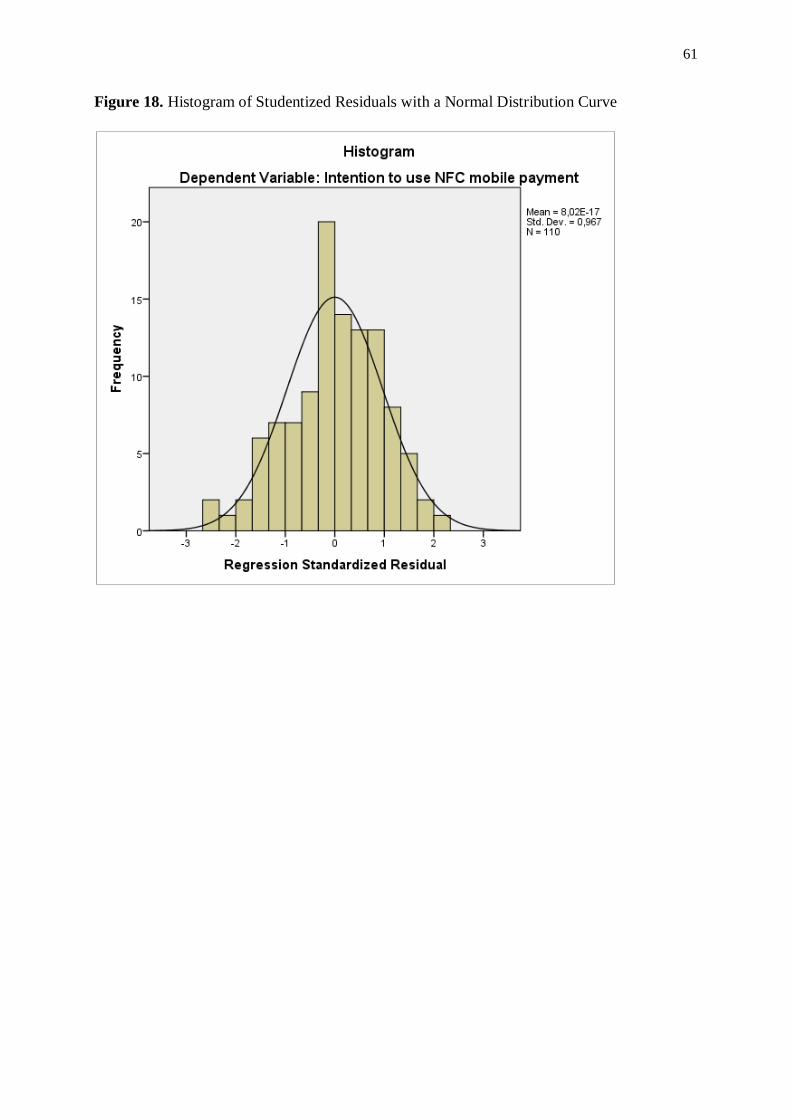
61
Figure 18. Histogram of Studentized Residuals with a Normal Distribution Curve

62
Figure 19. Normal P-P Plot of Studentized Residuals

63
Figure 20. Mediation Analysis Model
Note:
• MV (mediator variable)
• IV (independent variable)
• DV (dependent variable)

64
Tables
Table 1. Measurement Scales
Construct Items
Perceived
usefulness,
scale adapted
from Shaw
(2014)
Perceived_usefulness_01: Using NFC mobile payment would be useful.
Perceived_usefulness_02: Using NFC mobile payment would be more
convenient for me.
Perceived_usefulness_03: Using NFC mobile payment would increase my
shopping efficiency (i.e. shopping with minimum waste of time and effort).
Perceived_usefulness_04***: Using NFC mobile payment would help me
pay more quickly.
Compatibility,
scale adapted
from Schierz,
Schilke, and
Wirtz (2010)
Compatibility_01: Using NFC mobile payment fits well with my lifestyle.
Compatibility_02: Using NFC mobile payment fits well with the way I like
to purchase products and services.
Compatibility_03: I would appreciate using NFC mobile payment instead
of traditional modes of payment (e.g. credit/debit card, cash).
Compatibility_04: I would appreciate using NFC mobile payment in
addition to traditional modes of payment (e.g. credit/debit card, cash).
Perceived ease
of use, scale
adapted from
Chen (2008)
PeoU_01: I believe that learning to use NFC mobile payment will be easy
for me.
PeoU_02: I believe that NFC mobile payment will be easy to use.
PeoU_03**: I believe that when I use NFC mobile payment, the process
will be clear and understandable.
PeoU_04*: I believe that the user interface of my NFC mobile payment
application will be confusing for me to use. (reverse-scaled item)
PeoU_05: I believe that it will be easy for me to become skillful at using
NFC mobile payment.
Trialability,
scale adapted
from Pham
and Ho (2015)
Trialability_01: I want to be able to test NFC mobile payment first.
Trialability_02: I want to be able to use it on a trial basis first to see what it
can do.
Trialability_03: I want to see a trial demo first.
Trust in
provider, scale
adapted from
Slade et al.
(2015)
Trust_in_provider_01: I believe mobile wallet service providers keep their
promise.
Trust_in_provider_02: I believe mobile wallet service providers keep
customers’ interests in mind.
Trust_in_provider_03: I believe mobile wallet service providers are
trustworthy.
Trust_in_provider_04**: I believe mobile wallet service providers will do
everything to secure the transactions for users.
Trust in
mobile device
reliability,
Trust_in_MDR_01: I trust in the reliability of the battery of my mobile
device for making NFC mobile payments.
Trust_in_MDR_02: I trust in the reliability of my mobile Internet

65
new scale connection if such is required to make an NFC mobile payment.
Trust_in_MDR_03: I trust in the reliability of my mobile applications.
Trust_in_MDR_04: I trust in the reliability of my mobile operating system
(e.g. iOS, Android) for making NFC mobile payments.
Trust_in_MDR_05: I believe available authentication methods (PIN,
fingerprint) to authorize NFC mobile payments are reliable.
Trust_in_MDR_06: My mobile device is overall reliable for conducting
NFC mobile payments.
Perceived risk,
scale adapted
from Slade et
al. (2015)
Perceived_risk_01: I do not feel totally safe providing personal private
information over NFC mobile payment systems.
Perceived_risk_02: I am worried about using NFC mobile payment systems
because other people may be able to access my bank account(s).
Perceived_risk_03: I do not feel secure sending sensitive information
across NFC mobile payment systems.
Perceived_risk_04: I believe that overall riskiness of NFC mobile payment
systems is high.
Perceived_risk_05: The security measures built into NFC mobile payment
systems are not strong enough to protect my finances.
Perceived_risk_06: Using NFC mobile payment systems subjects your
bank account(s) to financial risk.
Personal
innovativeness
in information
technology,
scale adapted
from Agarwal
and Prasad
(1998)
PIIT_01: If I heard about a new information technology, I would look for
ways to experiment with it.
PIIT_02: Among my peers, I am usually the first to try out new information
technologies.
PIIT_04*: In general, I am hesitant to try out new information technologies.
(reverse-scaled item)
PIIT_05: I like to experiment with new information technologies.
Intention to
use NFC
mobile
payments,
scale adapted
from Schierz,
Schilke, and
Wirtz (2010)
Intention_to_use_01: Given the opportunity, I will use NFC mobile
payments.
Intention_to_use_02: I am likely to use NFC mobile payments in the
future.
Intention_to_use_03: I am willing to use NFC mobile payments in the
future.
Intention_to_use_04: I intend to use NFC mobile payments when the
opportunity arises.
* Items dropped based on the results of the reliability analysis.
** Items dropped based on the results of the EFA.
*** Items dropped based on the results of the CFA.

66
Table 2. Demographic Characteristics of the Study Participants
Age Frequency %
18 to 24 years
25 to 34 years
35 to 44 years
45 to 54 years
55 to 64 years
8
51
29
16
6
7.3
46.4
26.4
14.5
5.5
Gender Frequency %
Male
Female
52
58
47.3
52.7
Country of Origin Frequency %
Belgium
Bulgaria
Canada
China
Colombia
Estonia
Finland
Germany
India
Romania
Russia
Thailand
1
49
1
1
1
1
1
48
3
1
2
1
0.9
44.5
0.9
0.9
0.9
0.9
0.9
43.6
2.7
0.9
1.8
0.9
Education Frequency %
High school graduate
Trade/technical/vocational training
Bachelor's degree
Master's degree
Doctorate degree
Other advanced degree
9
4
28
63
4
2
8.2
3.6
25.5
57.3
3.6
1.8
Employment Status Frequency %
Employed for wages
Self-employed
Unemployed
Student
Retired
88
4
2
15
1
80.0
3.6
1.8
13.6
0.9

67
Table 3. Background Characteristics of the Study Participants
Question Frequency %
1. Do you own a smartphone?
Yes
No
108
2
98.2
1.8
2. Have you ever completed an NFC mobile payment for goods
or services at a physical store/a restaurant using your
smartphone?
Yes
No
3
107
2.7
97.3
3. Were you aware of NFC mobile payment as an alternative to
credit card/debit card/cash payment at physical stores prior to
completing this survey?
Yes
No
77
33
70.0
30.0
4. Do you shop online for goods and services using your
smartphone (e.g., on Amazon, Airbnb, public transportation
providers)?
Yes
No
74
36
67.3
32.7
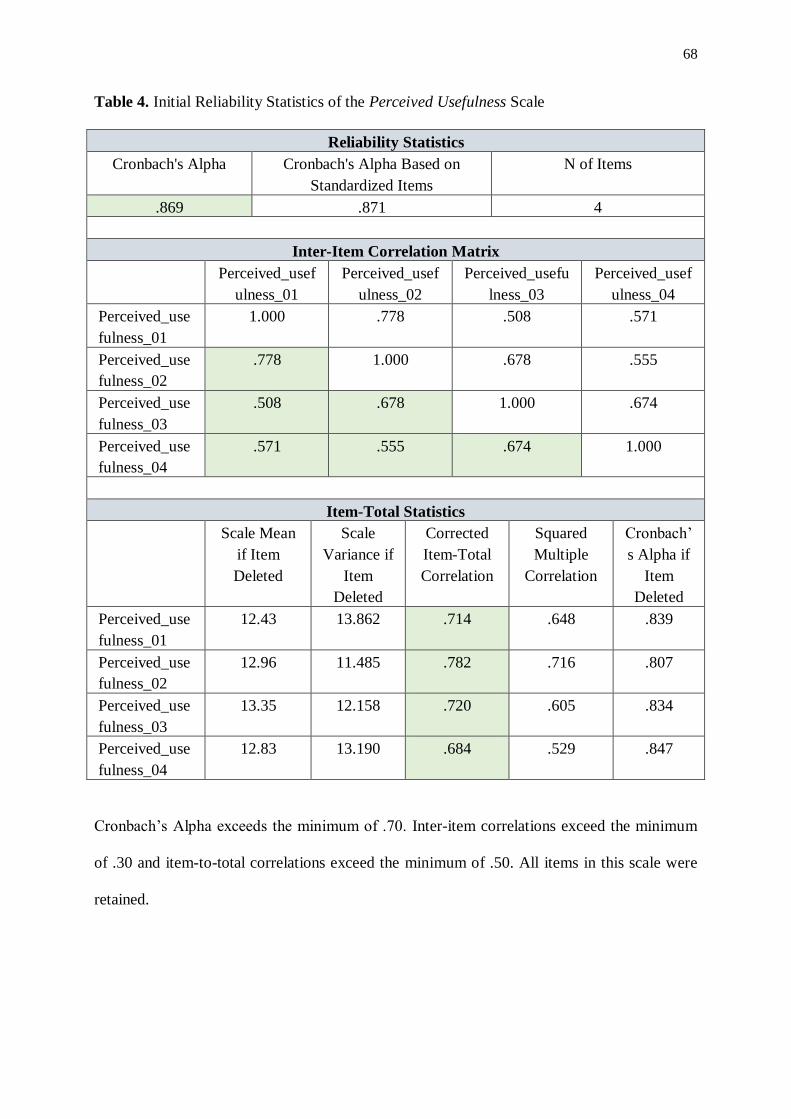
68
Table 4. Initial Reliability Statistics of the Perceived Usefulness Scale
Reliability Statistics
Cronbach's Alpha Cronbach's Alpha Based on
Standardized Items
N of Items
.869 .871 4
Inter-Item Correlation Matrix
Perceived_usef
ulness_01
Perceived_usef
ulness_02
Perceived_usefu
lness_03
Perceived_usef
ulness_04
Perceived_use
fulness_01
1.000 .778 .508 .571
Perceived_use
fulness_02
.778 1.000 .678 .555
Perceived_use
fulness_03
.508 .678 1.000 .674
Perceived_use
fulness_04
.571 .555 .674 1.000
Item-Total Statistics
Scale Mean
if Item
Deleted
Scale
Variance if
Item
Deleted
Corrected
Item-Total
Correlation
Squared
Multiple
Correlation
Cronbach’
s Alpha if
Item
Deleted
Perceived_use
fulness_01
12.43 13.862 .714 .648 .839
Perceived_use
fulness_02
12.96 11.485 .782 .716 .807
Perceived_use
fulness_03
13.35 12.158 .720 .605 .834
Perceived_use
fulness_04
12.83 13.190 .684 .529 .847
Cronbach’s Alpha exceeds the minimum of .70. Inter-item correlations exceed the minimum
of .30 and item-to-total correlations exceed the minimum of .50. All items in this scale were
retained.
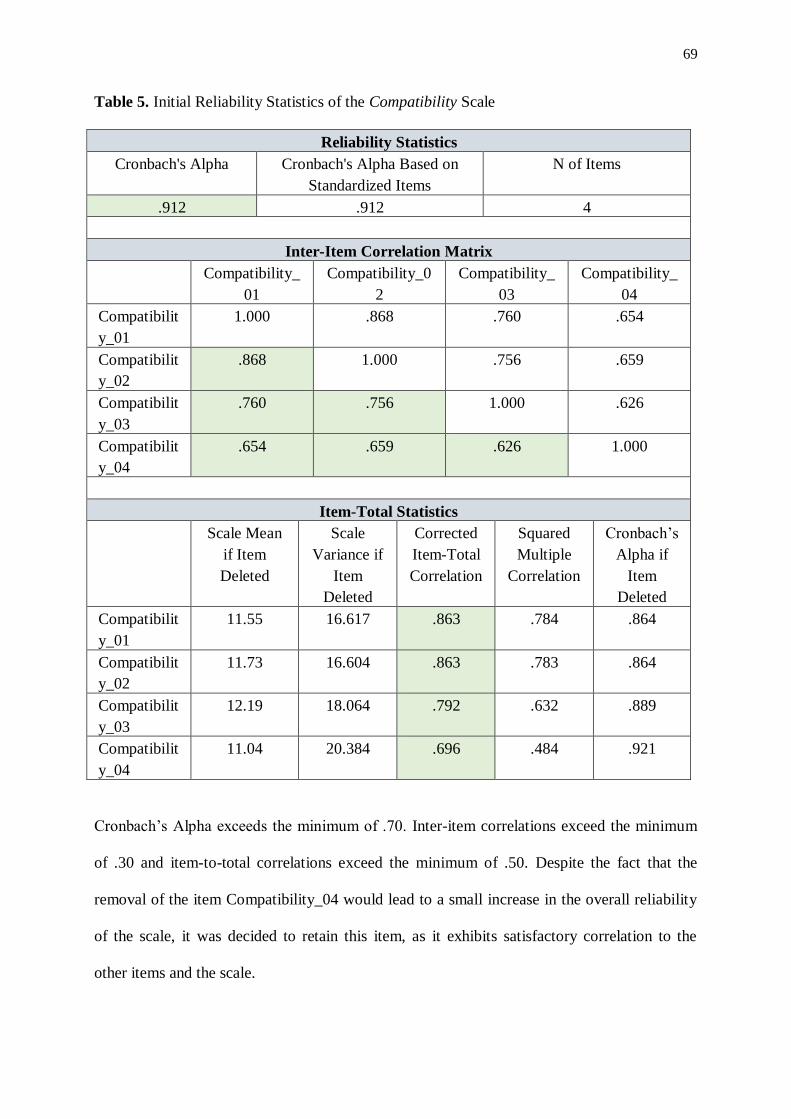
69
Table 5. Initial Reliability Statistics of the Compatibility Scale
Reliability Statistics
Cronbach's Alpha Cronbach's Alpha Based on
Standardized Items
N of Items
.912 .912 4
Inter-Item Correlation Matrix
Compatibility_
01
Compatibility_0
2
Compatibility_
03
Compatibility_
04
Compatibilit
y_01
1.000 .868 .760 .654
Compatibilit
y_02
.868 1.000 .756 .659
Compatibilit
y_03
.760 .756 1.000 .626
Compatibilit
y_04
.654 .659 .626 1.000
Item-Total Statistics
Scale Mean
if Item
Deleted
Scale
Variance if
Item
Deleted
Corrected
Item-Total
Correlation
Squared
Multiple
Correlation
Cronbach’s
Alpha if
Item
Deleted
Compatibilit
y_01
11.55 16.617 .863 .784 .864
Compatibilit
y_02
11.73 16.604 .863 .783 .864
Compatibilit
y_03
12.19 18.064 .792 .632 .889
Compatibilit
y_04
11.04 20.384 .696 .484 .921
Cronbach’s Alpha exceeds the minimum of .70. Inter-item correlations exceed the minimum
of .30 and item-to-total correlations exceed the minimum of .50. Despite the fact that the
removal of the item Compatibility_04 would lead to a small increase in the overall reliability
of the scale, it was decided to retain this item, as it exhibits satisfactory correlation to the
other items and the scale.

70
Table 6. Initial Reliability Statistics of the Perceived Ease of Use Scale
Reliability Statistics
Cronbach's Alpha Cronbach's Alpha Based on
Standardized Items
N of Items
.748 .791 5
Inter-Item Correlation Matrix
PeoU_01 PeoU_02 PeoU_03 PeoU_04_r PeoU_05
PeoU_01 1.000 .667 .492 .356 .561
PeoU_02 .667 1.000 .607 .351 .468
PeoU_03 .492 .607 1.000 .246 .346
PeoU_04_r .356 .351 .246 1.000 .208
PeoU_05 .561 .468 .346 .208 1.000
Item-Total Statistics
Scale
Mean if
Item
Deleted
Scale
Variance if
Item
Deleted
Corrected
Item-Total
Correlation
Squared
Multiple
Correlatio
n
Cronbach’s
Alpha if
Item
Deleted
PeoU_01 19.51 9.298 .692 .544 .667
PeoU_02 19.65 8.834 .707 .563 .651
PeoU_03 20.23 7.865 .530 .383 .702
PeoU_04_r 20.42 8.484 .354 .151 .789
PeoU_05 19.75 9.416 .482 .332 .715
Cronbach’s Alpha exceeds the minimum of .70. However, some of the inter-item correlations
of the item PeoU_04_r are below the minimum of .30 and the item-to-total correlations of
PeoU_04_r and PeoU_05 are below the minimum of .50. Thus, the item PeoU_04_r was
removed, in order to increase the overall reliability of the scale from .748 to .789.
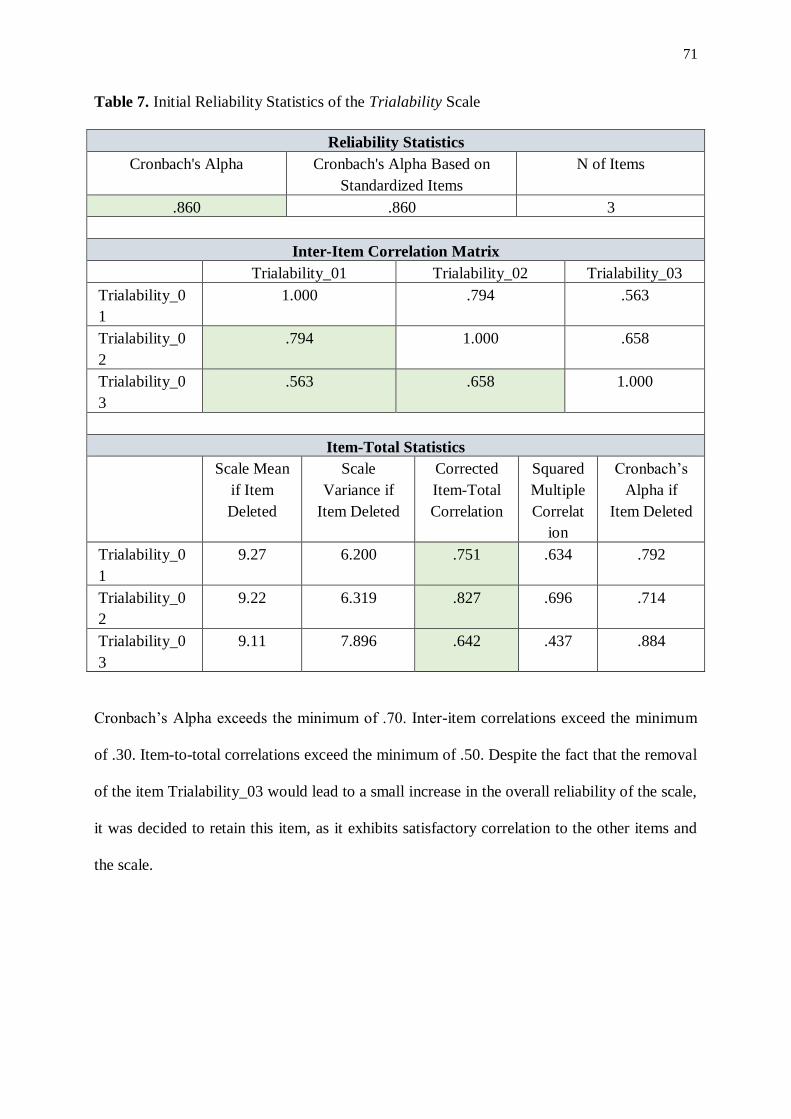
71
Table 7. Initial Reliability Statistics of the Trialability Scale
Reliability Statistics
Cronbach's Alpha Cronbach's Alpha Based on
Standardized Items
N of Items
.860 .860 3
Inter-Item Correlation Matrix
Trialability_01 Trialability_02 Trialability_03
Trialability_0
1
1.000 .794 .563
Trialability_0
2
.794 1.000 .658
Trialability_0
3
.563 .658 1.000
Item-Total Statistics
Scale Mean
if Item
Deleted
Scale
Variance if
Item Deleted
Corrected
Item-Total
Correlation
Squared
Multiple
Correlat
ion
Cronbach’s
Alpha if
Item Deleted
Trialability_0
1
9.27 6.200 .751 .634 .792
Trialability_0
2
9.22 6.319 .827 .696 .714
Trialability_0
3
9.11 7.896 .642 .437 .884
Cronbach’s Alpha exceeds the minimum of .70. Inter-item correlations exceed the minimum
of .30. Item-to-total correlations exceed the minimum of .50. Despite the fact that the removal
of the item Trialability_03 would lead to a small increase in the overall reliability of the scale,
it was decided to retain this item, as it exhibits satisfactory correlation to the other items and
the scale.

72
Table 8. Initial Reliability Statistics of the Trust in Provider Scale
Reliability Statistics
Cronbach's Alpha Cronbach's Alpha Based on
Standardized Items
N of Items
.900 .902 4
Inter-Item Correlation Matrix
Trust_in_provi
der_01
Trust_in_provi
der_02
Trust_in_provi
der_03
Trust_in_provi
der_04
Trust_in_provi
der_01
1.000 .740 .765 .633
Trust_in_provi
der_02
.740 1.000 .809 .586
Trust_in_provi
der_03
.765 .809 1.000 .646
Trust_in_provi
der_04
.633 .586 .646 1.000
Item-Total Statistics
Scale Mean if
Item Deleted
Scale
Variance if
Item Deleted
Corrected
Item-Total
Correlation
Squared
Multiple
Correlati
on
Cronbach
’s Alpha
if Item
Deleted
Trust_in_provi
der_01
11.45 11.076 .803 .651 .864
Trust_in_provi
der_02
11.65 10.026 .800 .691 .863
Trust_in_provi
der_03
11.66 10.390 .845 .733 .846
Trust_in_provi
der_04
11.10 11.265 .673 .465 .908
Cronbach’s Alpha exceeds the minimum of .70. Inter-item correlations exceed the minimum
of .30 and item-total correlations exceed the minimum of .50. Despite the fact that the
removal of item Trust_in_provider_04 would lead to a small increase in the overall reliability
of the scale, it was decided to retain this item, as it exhibits satisfactory correlation to the
other items and the scale.
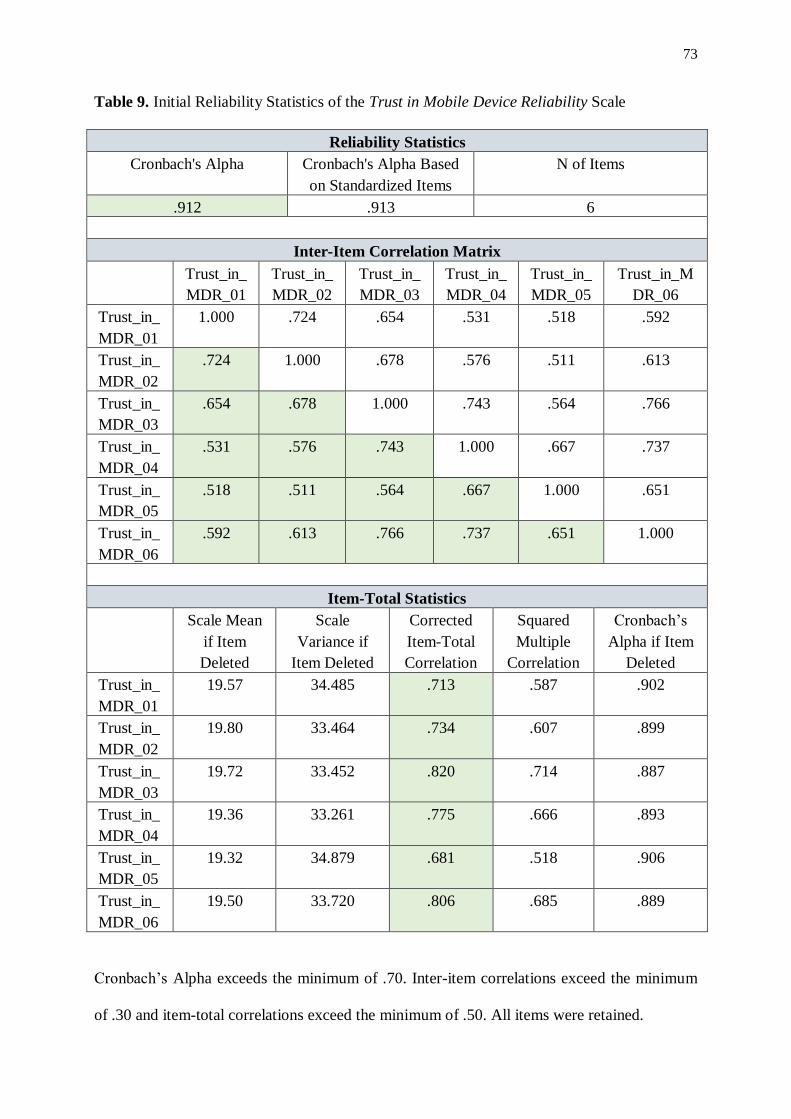
73
Table 9. Initial Reliability Statistics of the Trust in Mobile Device Reliability Scale
Reliability Statistics
Cronbach's Alpha Cronbach's Alpha Based
on Standardized Items
N of Items
.912 .913 6
Inter-Item Correlation Matrix
Trust_in_
MDR_01
Trust_in_
MDR_02
Trust_in_
MDR_03
Trust_in_
MDR_04
Trust_in_
MDR_05
Trust_in_M
DR_06
Trust_in_
MDR_01
1.000 .724 .654 .531 .518 .592
Trust_in_
MDR_02
.724 1.000 .678 .576 .511 .613
Trust_in_
MDR_03
.654 .678 1.000 .743 .564 .766
Trust_in_
MDR_04
.531 .576 .743 1.000 .667 .737
Trust_in_
MDR_05
.518 .511 .564 .667 1.000 .651
Trust_in_
MDR_06
.592 .613 .766 .737 .651 1.000
Item-Total Statistics
Scale Mean
if Item
Deleted
Scale
Variance if
Item Deleted
Corrected
Item-Total
Correlation
Squared
Multiple
Correlation
Cronbach’s
Alpha if Item
Deleted
Trust_in_
MDR_01
19.57 34.485 .713 .587 .902
Trust_in_
MDR_02
19.80 33.464 .734 .607 .899
Trust_in_
MDR_03
19.72 33.452 .820 .714 .887
Trust_in_
MDR_04
19.36 33.261 .775 .666 .893
Trust_in_
MDR_05
19.32 34.879 .681 .518 .906
Trust_in_
MDR_06
19.50 33.720 .806 .685 .889
Cronbach’s Alpha exceeds the minimum of .70. Inter-item correlations exceed the minimum
of .30 and item-total correlations exceed the minimum of .50. All items were retained.

74
Table 10. Initial Reliability Statistics of the Perceived Risk Scale
Reliability Statistics
Cronbach's Alpha Cronbach's Alpha Based on
Standardized Items
N of Items
.951 .951 6
Inter-Item Correlation Matrix
Perceive
d_risk_0
1
Perceived
_risk_02
Perceived
_risk_03
Perceived
_risk_04
Perceived_
risk_05
Perceived_ri
sk_06
Perceived
_risk_01
1.000 .683 .700 .656 .657 .603
Perceived
_risk_02
.683 1.000 .827 .738 .745 .745
Perceived
_risk_03
.700 .827 1.000 .852 .843 .813
Perceived
_risk_04
.656 .738 .852 1.000 .870 .835
Perceived
_risk_05
.657 .745 .843 .870 1.000 .879
Perceived
_risk_06
.603 .745 .813 .835 .879 1.000
Item-Total Statistics
Scale Mean
if Item
Deleted
Scale
Variance if
Item Deleted
Corrected
Item-Total
Correlation
Squared
Multiple
Correlation
Cronbach’s
Alpha if Item
Deleted
Perceived
_risk_01
20.96 40.311 .716 .540 .956
Perceived
_risk_02
21.02 37.449 .828 .718 .944
Perceived
_risk_03
21.00 36.220 .907 .832 .934
Perceived
_risk_04
21.21 37.286 .883 .815 .937
Perceived
_risk_05
21.41 37.840 .895 .847 .936
Perceived
_risk_06
21.35 38.194 .863 .806 .940
Cronbach’s Alpha exceeds the minimum of .70. Inter-item correlations exceed the minimum
of .30 and item-total correlations exceed the minimum of .50. All items were retained.

75
Table 11. Initial Reliability Statistics of the Personal Innovativeness in IT Scale
Reliability Statistics
Cronbach's Alpha Cronbach's Alpha Based on
Standardized Items
N of Items
.765 .774 4
Inter-Item Correlation Matrix
PIIT_01 PIIT_02 PIIT_04_r PIIT_05
PIIT_01 1.000 .625 .387 .583
PIIT_02 .625 1.000 .265 .504
PIIT_04_r .387 .265 1.000 .401
PIIT_05 .583 .504 .401 1.000
Item-Total Statistics
Scale Mean
if Item
Deleted
Scale
Variance if
Item
Deleted
Corrected
Item-Total
Correlation
Squared
Multiple
Correlation
Cronbach’s
Alpha if
Item
Deleted
PIIT_01 12.01 8.303 .692 .506 .649
PIIT_02 12.83 7.759 .571 .420 .710
PIIT_04_r 12.51 9.133 .409 .197 .793
PIIT_05 12.07 8.490 .628 .406 .679
Cronbach’s Alpha exceeds the minimum of .70. Item PIIT_04_r was removed due to low
inter-item and item-total correlations, contrary to the other items in the scale. The removal of
PIIT_04_r increased the overall reliability of the scale from .765 to .793.
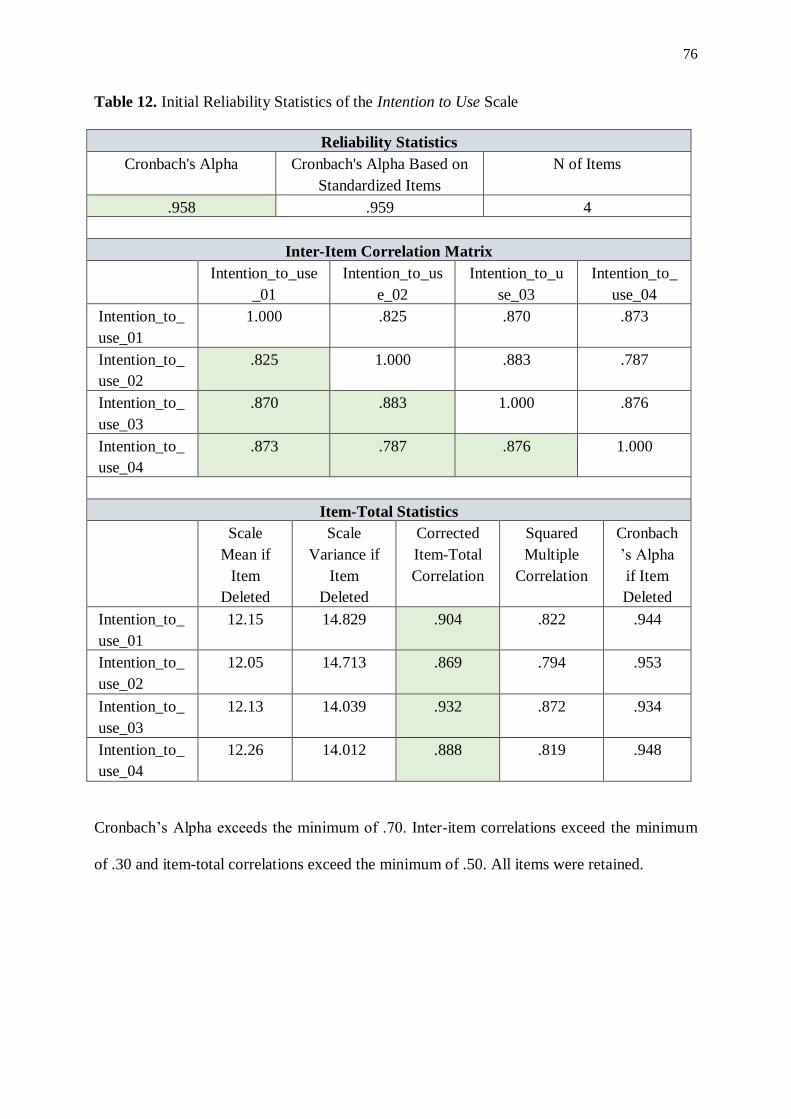
76
Table 12. Initial Reliability Statistics of the Intention to Use Scale
Reliability Statistics
Cronbach's Alpha Cronbach's Alpha Based on
Standardized Items
N of Items
.958 .959 4
Inter-Item Correlation Matrix
Intention_to_use
_01
Intention_to_us
e_02
Intention_to_u
se_03
Intention_to_
use_04
Intention_to_
use_01
1.000 .825 .870 .873
Intention_to_
use_02
.825 1.000 .883 .787
Intention_to_
use_03
.870 .883 1.000 .876
Intention_to_
use_04
.873 .787 .876 1.000
Item-Total Statistics
Scale
Mean if
Item
Deleted
Scale
Variance if
Item
Deleted
Corrected
Item-Total
Correlation
Squared
Multiple
Correlation
Cronbach
’s Alpha
if Item
Deleted
Intention_to_
use_01
12.15 14.829 .904 .822 .944
Intention_to_
use_02
12.05 14.713 .869 .794 .953
Intention_to_
use_03
12.13 14.039 .932 .872 .934
Intention_to_
use_04
12.26 14.012 .888 .819 .948
Cronbach’s Alpha exceeds the minimum of .70. Inter-item correlations exceed the minimum
of .30 and item-total correlations exceed the minimum of .50. All items were retained.

77
Table 13. Recalculated Reliability Statistics of the Perceived Ease of Use Scale Excluding
Item PeoU_04_r
Reliability Statistics
Cronbach's Alpha Cronbach's Alpha Based on
Standardized Items
N of Items
.789 .815 4
Inter-Item Correlation Matrix
PeoU_01 PeoU_02 PeoU_03 PeoU_05
PeoU_01 1.000 .667 .492 .561
PeoU_02 .667 1.000 .607 .468
PeoU_03 .492 .607 1.000 .346
PeoU_05 .561 .468 .346 1.000
Item-Total Statistics
Scale
Mean if
Item
Deleted
Scale
Variance if
Item
Deleted
Corrected
Item-Total
Correlation
Squared
Multiple
Correlation
Cronbach
’s Alpha
if Item
Deleted
PeoU_01 15.04 5.558 .696 .532 .709
PeoU_02 15.18 5.159 .723 .555 .685
PeoU_03 15.75 4.224 .566 .382 .787
PeoU_05 15.28 5.489 .515 .331 .777
Cronbach’s Alpha exceeds the minimum of .70. Inter-item correlations exceed the minimum
of .30 and item-total correlations exceed the minimum of .50.
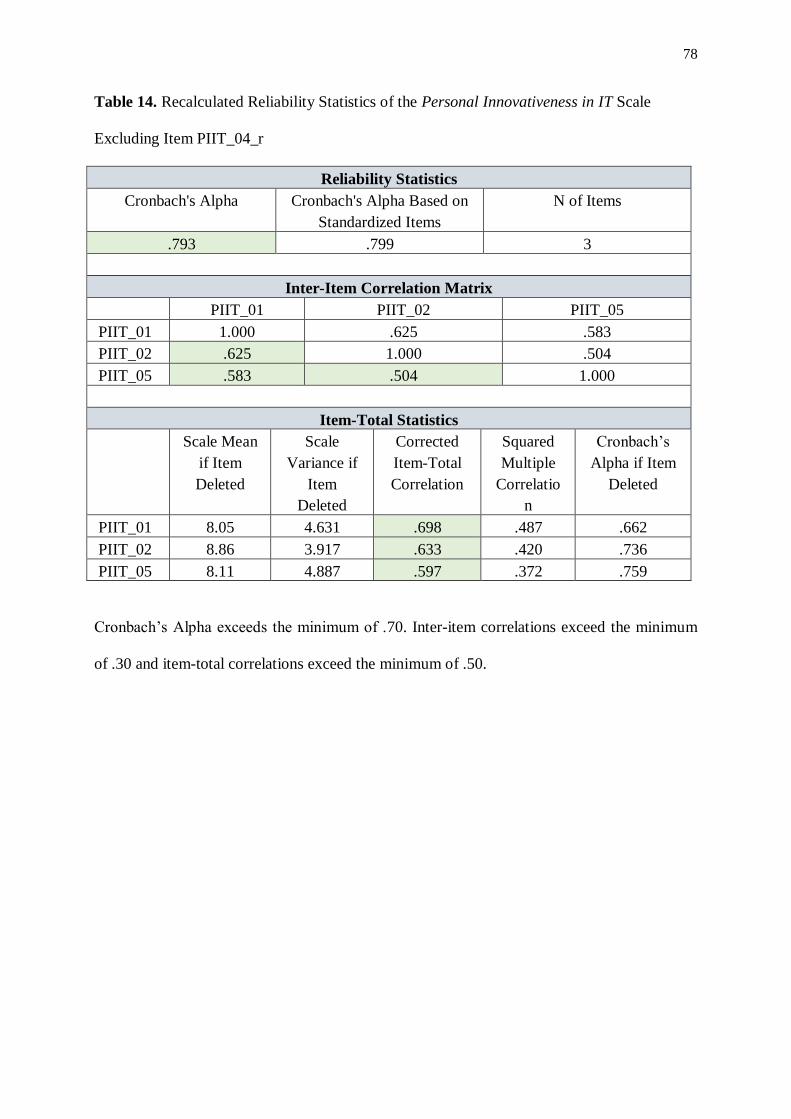
78
Table 14. Recalculated Reliability Statistics of the Personal Innovativeness in IT Scale
Excluding Item PIIT_04_r
Reliability Statistics
Cronbach's Alpha Cronbach's Alpha Based on
Standardized Items
N of Items
.793 .799 3
Inter-Item Correlation Matrix
PIIT_01 PIIT_02 PIIT_05
PIIT_01 1.000 .625 .583
PIIT_02 .625 1.000 .504
PIIT_05 .583 .504 1.000
Item-Total Statistics
Scale Mean
if Item
Deleted
Scale
Variance if
Item
Deleted
Corrected
Item-Total
Correlation
Squared
Multiple
Correlatio
n
Cronbach’s
Alpha if Item
Deleted
PIIT_01 8.05 4.631 .698 .487 .662
PIIT_02 8.86 3.917 .633 .420 .736
PIIT_05 8.11 4.887 .597 .372 .759
Cronbach’s Alpha exceeds the minimum of .70. Inter-item correlations exceed the minimum
of .30 and item-total correlations exceed the minimum of .50.
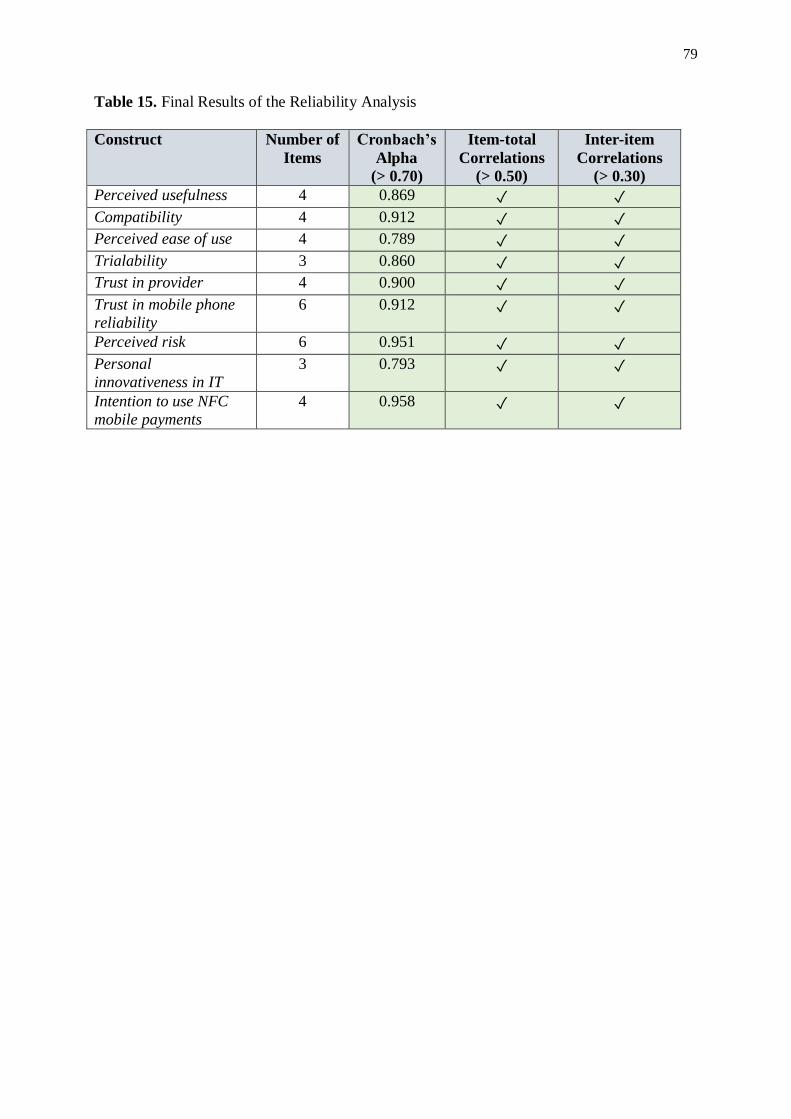
79
Table 15. Final Results of the Reliability Analysis
Construct Number of
Items
Cronbach’s
Alpha
(> 0.70)
Item-total
Correlations
(> 0.50)
Inter-item
Correlations
(> 0.30)
Perceived usefulness 4 0.869 ✓ ✓
Compatibility 4 0.912 ✓ ✓
Perceived ease of use 4 0.789 ✓ ✓
Trialability 3 0.860 ✓ ✓
Trust in provider 4 0.900 ✓ ✓
Trust in mobile phone
reliability
6 0.912 ✓ ✓
Perceived risk 6 0.951 ✓ ✓
Personal
innovativeness in IT
3 0.793 ✓ ✓
Intention to use NFC
mobile payments
4 0.958 ✓ ✓

80
Table 16. First EFA: Results of KMO Test for Sampling Adequacy and Bartlett Test of
Sphericity
KMO and Bartlett's Test
Kaiser-Meyer-Olkin Measure of Sampling Adequacy. .903
Bartlett's Test of
Sphericity
Approx. Chi-Square 3918.219
df 703
Sig. .000

81
Table 17. First EFA: Total Variance Explained
Factor Initial Eigenvalues Extraction Sums of Squared
Loadings
Rotation Sums of Squared
Loadings
Total % of
Variance
Cumulative
%
Total % of
Variance
Cumulative
%
Total % of
Variance
Cumulative
%
1 16.439 43.262 43.262 16.169 42.549 42.549 7.906 20.805 20.805
2 3.910 10.289 53.550 3.658 9.627 52.176 5.650 14.868 35.672
3 2.548 6.705 60.255 2.236 5.883 58.059 3.927 10.335 46.007
4 2.140 5.632 65.887 1.800 4.737 62.796 2.501 6.581 52.588
5 1.531 4.030 69.917 1.256 3.307 66.103 2.378 6.257 58.845
6 1.296 3.409 73.327 .961 2.529 68.631 2.321 6.108 64.952
7 1.004 2.643 75.969 .691 1.819 70.450 2.089 5.498 70.450
8 .867 2.281 78.251
9 .766 2.015 80.266
10 .714 1.878 82.143
11 .608 1.599 83.743
12 .537 1.414 85.157
13 .504 1.325 86.482
14 .452 1.190 87.672
15 .438 1.153 88.824
16 .412 1.083 89.907
17 .380 .999 90.907
18 .340 .895 91.802
19 .321 .846 92.648
20 .299 .786 93.434
21 .262 .688 94.123
22 .248 .653 94.776
23 .228 .601 95.377
24 .216 .570 95.947
25 .205 .538 96.485
26 .184 .485 96.970
27 .151 .397 97.367
28 .137 .361 97.728
29 .127 .333 98.062
30 .123 .323 98.385
31 .115 .303 98.687
32 .103 .270 98.957
33 .099 .261 99.218
34 .077 .203 99.420
35 .070 .184 99.605
36 .064 .167 99.772
37 .054 .142 99.913
38 .033 .087 100.000
Extraction Method: Principal Axis Factoring.

82
Table 18. First EFA: Rotated Factor Matrixa
Items Factor
1 2 3 4 5 6 7
Perceived_usefulness_01 .614
Perceived_usefulness_02 .790
Perceived_usefulness_03 .709
Perceived_usefulness_04 .551
Compatibility_01 .799
Compatibility_02 .777
Compatibility_03 .730
Compatibility_04 .699
PeoU_01 .763
PeoU_02 .720
PeoU_03 -
PeoU_05 .579
Trialability_01 .639
Trialability_02 .836
Trialability_03 .713
Trust_in_provider_01 .616
Trust_in_provider_02 .628
Trust_in_provider_03 .625
Trust_in_provider_04 -
Trust_in_MDR_01 .731
Trust_in_MDR_02 .824
Trust_in_MDR_03 .734
Trust_in_MDR_04 .581
Trust_in_MDR_05 -
Trust_in_MDR_06 .601
Perceived_risk_01 -.706
Perceived_risk_02 -.852
Perceived_risk_03 -.871
Perceived_risk_04 -.852
Perceived_risk_05 -.861
Perceived_risk_06 -.829
PIIT_01 .795
PIIT_02 .685
PIIT_05 .659
Intention_to_use_01 .727
Intention_to_use_02 .669
Intention_to_use_03 .705
Intention_to_use_04 .707
Extraction Method: Principal Axis Factoring.
Rotation Method: Varimax with Kaiser Normalization.
a. Rotation converged in 7 iterations.

83
Table 19. Second EFA: Results of KMO Test for Sampling Adequacy and Bartlett Test of
Sphericity
KMO and Bartlett’s Test
Kaiser-Meyer-Olkin Measure of Sampling Adequacy. .897
Bartlett's Test of
Sphericity
Approx. Chi-Square 3178.548
df 561
Sig. .000

84
Table 20. Second EFA: Total Variance Explained
Factor Initial Eigenvalues Extraction Sums of Squared
Loadings
Rotation Sums of Squared
Loadings
Total % of
Variance
Cumu
lative
%
Total % of
Variance
Cumul
ative
%
Total % of
Variance
Cumul
ative %
1 13.650 40.148 40.148 13.348 39.259 39.259 5.468 16.083 16.083
2 3.863 11.361 51.509 3.598 10.582 49.841 5.342 15.712 31.795
3 2.500 7.352 58.861 2.144 6.307 56.147 5.176 15.222 47.018
4 2.049 6.028 64.889 1.695 4.987 61.134 2.552 7.506 54.524
5 1.509 4.437 69.326 1.217 3.579 64.713 2.319 6.821 61.345
6 1.279 3.763 73.088 .927 2.726 67.438 2.072 6.093 67.438
7 .984 2.895 75.984
8 .831 2.444 78.427
9 .722 2.125 80.552
10 .615 1.809 82.361
11 .596 1.754 84.115
12 .497 1.462 85.577
13 .465 1.366 86.943
14 .439 1.290 88.233
15 .397 1.167 89.400
16 .382 1.123 90.523
17 .346 1.017 91.540
18 .320 .941 92.481
19 .308 .907 93.389
20 .266 .783 94.172
21 .255 .750 94.922
22 .227 .668 95.590
23 .209 .616 96.206
24 .196 .578 96.784
25 .173 .510 97.293
26 .147 .433 97.726
27 .128 .376 98.103
28 .122 .359 98.462
29 .113 .332 98.794
30 .107 .314 99.107
31 .097 .285 99.393
32 .080 .235 99.628
33 .069 .202 99.829
34 .058 .171 100.000
Extraction Method: Principal Axis Factoring.

85
Table 21. Second EFA: Rotated Factor Matrixa
Items Factor
1 2 3 4 5 6
Perceived_usefulness_01 .606
Perceived_usefulness_02 .781
Perceived_usefulness_03 .705
Perceived_usefulness_04 .570
Compatibility_01 .753
Compatibility_02 .749
Compatibility_03 .701
Compatibility_04 .684
PeoU_01 .787
PeoU_02 .666
PeoU_03 -
PeoU_05 .560
Trialability_01 .688
Trialability_02 .865
Trialability_03 .677
Trust_in_provider_01 .623
Trust_in_provider_02 .649
Trust_in_provider_03 .624
Trust_in_provider_04 -
Trust_in_MDR_01 .705
Trust_in_MDR_02 .708
Trust_in_MDR_03 .780
Trust_in_MDR_04 .685
Trust_in_MDR_05 .594
Trust_in_MDR_06 .718
Perceived_risk_01 .726
Perceived_risk_02 .839
Perceived_risk_03 .870
Perceived_risk_04 .850
Perceived_risk_05 .857
Perceived_risk_06 .823
PIIT_01 .827
PIIT_02 .664
PIIT_05 .613
Extraction Method: Principal Axis Factoring.
Rotation Method: Varimax with Kaiser Normalization.
a. Rotation converged in 7 iterations.

86
Table 22. First CFA: Model Fit Statistics (for N < 250 and m ≥ 30)
Fit Measures
Types
Value Threshold Value
Suggesting Good Model
Fit
Interpretation
Chi-square test χ2 = 911.94 (p = 0.000)
df = 566
Non-significant test
(Hair et al. 2010, p. 666)
x
Absolute Fit
Measures
RMSEA = 0.075 < .08 with CFI > .92
(Hair et al. 2010, p. 672) ✓
Normed χ2 (χ2:df) = 1.611 < 2 (very good); between
2 and 5 (acceptable)
(Hair et al. 2010, p. 721)
✓
Incremental Fit
Indices
CFI = 0.904
> .92
(Hair et al. 2010, p. 672)
x
Note:
• N – Sample size
• m – Number of observed variables (i.e., items) in the model
• df – Degrees of freedom
• RMSEA – Root mean square error of approximation
• CFI – Comparative fit index

87
Table 23. First CFA: Standardized Regression Weights, AVE, and CR
Items Constructs Standardized
Regression Weights
AVE CR
Perceived_usefulness_01 PU_C 0.78 0.650 0.936
Perceived_usefulness_02 PU_C 0.888
Perceived_usefulness_03 PU_C 0.728
Perceived_usefulness_04 PU_C 0.632
Compatibility_01 PU_C 0.899
Compatibility_02 PU_C 0.896
Compatibility_03 PU_C 0.815
Compatibility_04 PU_C 0.776
PeoU_01 PeoU 0.877 0.583 0.805
PeoU_02 PeoU 0.758
PeoU_05 PeoU 0.637
Trialability_01 Trial 0.865 0.689 0.868
Trialability_02 Trial 0.923
Trialability_03 Trial 0.684
Trust_in_provider_01 TiP 0.83 0.772 0.910
Trust_in_provider_02 TiP 0.89
Trust_in_provider_03 TiP 0.914
Trust_in_MDR_01 TiMD 0.707 0.636 0.912
Trust_in_MDR_02 TiMD 0.727
Trust_in_MDR_03 TiMD 0.861
Trust_in_MDR_04 TiMD 0.846
Trust_in_MDR_05 TiMD 0.752
Trust_in_MDR_06 TiMD 0.874
Perceived_risk_01 PR 0.721 0.767 0.951
Perceived_risk_02 PR 0.828
Perceived_risk_03 PR 0.921
Perceived_risk_04 PR 0.924
Perceived_risk_05 PR 0.934
Perceived_risk_06 PR 0.907
PIIT_01 PIIT 0.883 0.577 0.802
PIIT_02 PIIT 0.706
PIIT_05 PIIT 0.674
Intention_to_use_01 ItU 0.931 0.854 0.959
Intention_to_use_02 ItU 0.895
Intention_to_use_03 ItU 0.953
Intention_to_use_04 ItU 0.916
Note:
• AVE – Average variance extracted is calculated by , where ∑ 𝐿𝑖2𝑛
𝑖=1 is the AVE =∑ 𝐿𝑖
2𝑛𝑖=1
𝑛

88
sum of squared standardized regression weights per construct and n is the number of items
per construct (Hair et al. 2010, p. 709).
• CR – Construct reliability is calculated by , where (∑ 𝐿𝑖𝑛𝑖=1 )² is
the squared sum of standardized regression weights per construct and (∑ 𝑒𝑖𝑛𝑖=1 ) is the sum
of the error variance terms for a construct (Hair et al. 2010, p. 710).
CR =(∑ 𝐿𝑖
𝑛𝑖=1 )²
(∑ 𝐿𝑖𝑛𝑖=1 )
2+ (∑ 𝑒𝑖
𝑛𝑖=1 )

89
Table 24. First CFA: Inter-construct Correlation Estimates
All Possible Construct
Combinations
Inter-construct Correlation
Estimates
PU_C <--> PeoU 0.518
PU_C <--> Trial 0.554
PU_C <--> TiP 0.65
PU_C <--> TiMD 0.628
PU_C <--> PR -0.475
PU_C <--> PIIT 0.482
PU_C <--> ItU 0.878
PeoU <--> Trial 0.339
PeoU <--> TiP 0.371
PeoU <--> TiMD 0.503
PeoU <--> PR -0.363
PeoU <--> PIIT 0.477
PeoU <--> ItU 0.47
Trial <--> TiP 0.496
Trial <--> TiMD 0.259
Trial <--> PR -0.101
Trial <--> PIIT 0.394
Trial <--> ItU 0.552
TiP <--> TiMD 0.772
TiP <--> PR -0.569
TiP <--> PIIT 0.294
TiP <--> ItU 0.712
TiMD <--> PR -0.583
TiMD <--> PIIT 0.2
TiMD <--> ItU 0.673
PR <--> PIIT -0.243
PR <--> ItU -0.608
PIIT <--> ItU 0.487
Note: PU_C (Perceived usefulness & compatibility); PeoU (Perceived ease of use); Trial
(Trialability); TiP (Trust in provider); TiMDR (Trust in mobile device reliability); PR
(Perceived risk); PIIT (Personal innovativeness in IT); ItU (Intention to use NFC mobile
payments).

90
Table 25. First CFA: Comparison of AVE Values and Squared Inter-Construct Correlation
Estimates
PIIT PU_C PeoU Trial TiP TiMD PR ItU
PIIT 0.577
PU_C 0.232 0.650
PeoU 0.228 0.268 0.583
Trial 0.155 0.307 0.115 0.689
TiP 0.086 0.423 0.138 0.246 0.772
TiMD 0.040 0.394 0.253 0.067 0.596 0.636
PR 0.059 0.226 0.132 0.010 0.324 0.340 0.767
ItU 0.237 0.771 0.221 0.305 0.507 0.453 0.370 0.854
Note:
• Values on the diagonal are AVE values. Values below the diagonal are squared inter-
construct correlation estimates.
• PU_C (Perceived usefulness & compatibility); PeoU (Perceived ease of use); Trial
(Trialability); TiP (Trust in provider); TiMDR (Trust in mobile device reliability); PR
(Perceived risk); PIIT (Personal innovativeness in IT); ItU (Intention to use NFC mobile
payments).

91
Table 26. Second CFA: Model Fit Statistics (for N < 250 and m ≥ 30)
Fit Measures
Types
Value Threshold Value
Suggesting Good Model
Fit
Interpretation
Chi-square test χ2 = 617.764 (p = 0.000)
df = 413
Non-significant test
(Hair et al. 2010, p. 666)
x
Absolute Fit
Measures
RMSEA = 0.067 < .08 with CFI > .92
(Hair et al. 2010, p. 672) ✓
Normed χ2 (χ2:df) = 1.496 < 2 (very good); between
2 and 5 (acceptable)
(Hair et al. 2010, 721)
✓
Incremental Fit
Indices
CFI = 0.926
> .92
(Hair et al. 2010, p. 672) ✓
Note:
• N – Sample size
• m – Number of observed variables (i.e., items) in the model
• df – Degrees of freedom
• RMSEA – Root mean square error of approximation
• CFI – Comparative fit index
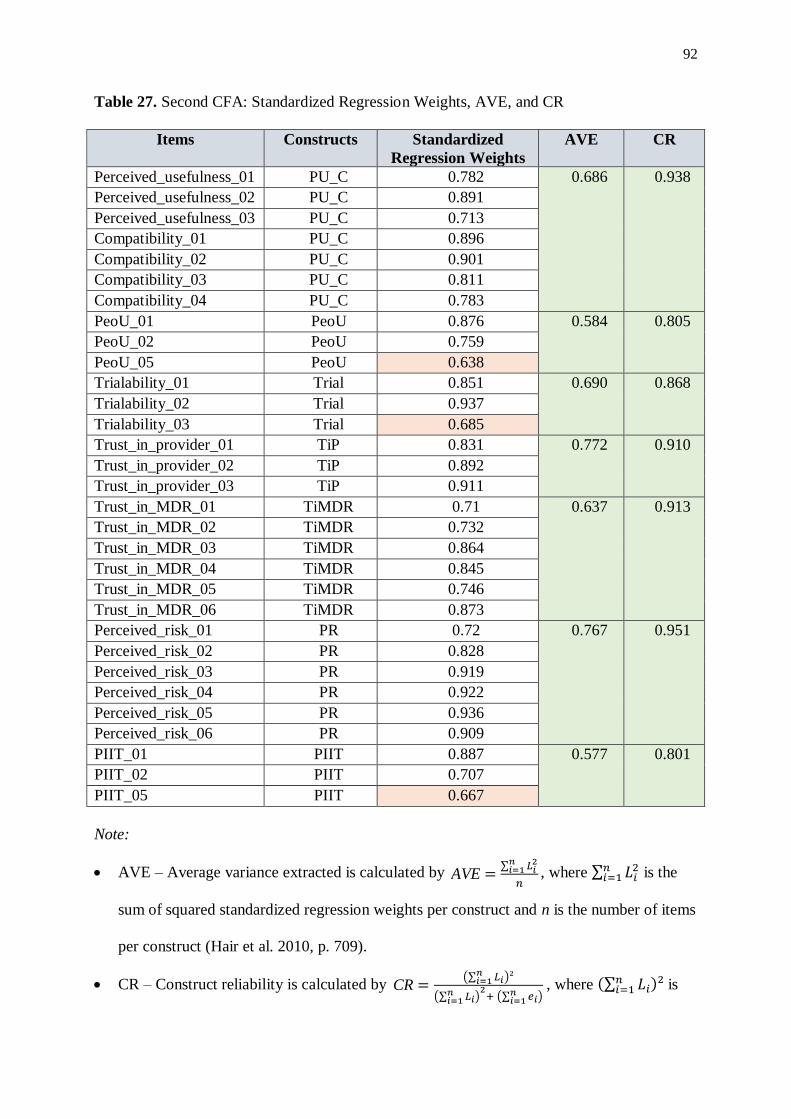
92
Table 27. Second CFA: Standardized Regression Weights, AVE, and CR
Items Constructs Standardized
Regression Weights
AVE CR
Perceived_usefulness_01 PU_C 0.782 0.686 0.938
Perceived_usefulness_02 PU_C 0.891
Perceived_usefulness_03 PU_C 0.713
Compatibility_01 PU_C 0.896
Compatibility_02 PU_C 0.901
Compatibility_03 PU_C 0.811
Compatibility_04 PU_C 0.783
PeoU_01 PeoU 0.876 0.584 0.805
PeoU_02 PeoU 0.759
PeoU_05 PeoU 0.638
Trialability_01 Trial 0.851 0.690 0.868
Trialability_02 Trial 0.937
Trialability_03 Trial 0.685
Trust_in_provider_01 TiP 0.831 0.772 0.910
Trust_in_provider_02 TiP 0.892
Trust_in_provider_03 TiP 0.911
Trust_in_MDR_01 TiMDR 0.71 0.637 0.913
Trust_in_MDR_02 TiMDR 0.732
Trust_in_MDR_03 TiMDR 0.864
Trust_in_MDR_04 TiMDR 0.845
Trust_in_MDR_05 TiMDR 0.746
Trust_in_MDR_06 TiMDR 0.873
Perceived_risk_01 PR 0.72 0.767 0.951
Perceived_risk_02 PR 0.828
Perceived_risk_03 PR 0.919
Perceived_risk_04 PR 0.922
Perceived_risk_05 PR 0.936
Perceived_risk_06 PR 0.909
PIIT_01 PIIT 0.887 0.577 0.801
PIIT_02 PIIT 0.707
PIIT_05 PIIT 0.667
Note:
• AVE – Average variance extracted is calculated by , where ∑ 𝐿𝑖2𝑛
𝑖=1 is the
sum of squared standardized regression weights per construct and n is the number of items
per construct (Hair et al. 2010, p. 709).
• CR – Construct reliability is calculated by , where (∑ 𝐿𝑖𝑛𝑖=1 )² is CR =
(∑ 𝐿𝑖𝑛𝑖=1 )²
(∑ 𝐿𝑖𝑛𝑖=1 )
2+ (∑ 𝑒𝑖
𝑛𝑖=1 )
AVE =∑ 𝐿𝑖
2𝑛𝑖=1
𝑛

93
the squared sum of standardized regression weights per construct and (∑ 𝑒𝑖𝑛𝑖=1 ) is the sum
of the error variance terms for a construct (Hair et al. 2010, p. 710).

94
Table 28. Second CFA: Inter-construct Correlation Estimates
All Possible Construct
Combinations
Inter-construct Correlation
Estimates
PU_C <--> PeoU 0.52
PU_C <--> Trial 0.532
PU_C <--> TiP 0.651
PU_C <--> TiMDR 0.626
PU_C <--> PR -0.483
PU_C <--> PIIT 0.484
PeoU <--> Trial 0.337
PeoU <--> TiP 0.37
PeoU <--> TiMDR 0.503
PeoU <--> PR -0.364
PeoU <--> PIIT 0.475
Trial <--> TiP 0.492
Trial <--> TiMDR 0.254
Trial <--> PR -0.094
Trial <--> PIIT 0.394
TiP <--> TiMDR 0.771
TiP <--> PR -0.57
TiP <--> PIIT 0.296
TiMDR <--> PR -0.582
TiMDR <--> PIIT 0.199
PR <--> PIIT -0.242
PU_C <--> PeoU 0.52
PU_C <--> Trial 0.532
PU_C <--> TiP 0.651
PU_C <--> TiMDR 0.626
PU_C <--> PR -0.483
PU_C <--> PIIT 0.484
PeoU <--> Trial 0.337
Note: PU_C (Perceived usefulness & compatibility); PeoU (Perceived ease of use); Trial
(Trialability); TiP (Trust in provider); TiMDR (Trust in mobile device reliability); PR
(Perceived risk); PIIT (Personal innovativeness in IT); ItU (Intention to use NFC mobile
payments).

95
Table 29. Second CFA: Comparison of AVE Values and Squared Inter-Construct Correlation
Estimates
PR PU_C PeoU Trial TiP TiMDR PIIT
PR 0.767
PU_C 0.233 0.686
PeoU 0.132 0.270 0.584
Trial 0.009 0.283 0.114 0.690
TiP 0.325 0.424 0.137 0.242 0.772
TiMDR 0.339 0.392 0.253 0.065 0.594 0.637
PIIT 0.059 0.234 0.226 0.155 0.088 0.040 0.577
Note:
• Values on the diagonal are AVE values. Values below the diagonal are squared inter-
construct correlation estimates.
• PU_C (Perceived usefulness & compatibility); PeoU (Perceived ease of use); Trial
(Trialability); TiP (Trust in provider); TiMDR (Trust in mobile device reliability); PR
(Perceived risk); PIIT (Personal innovativeness in IT).

96
Table 30. Results of Harman’s Single-Factor Test for Common Method Bias: Total Variance
Explained in EFA
Factor Initial Eigenvalues Extraction Sums of Squared Loadings
Total % of
Variance
Cumulative % Total % of
Variance
Cumulative %
1 15.251 43.574 43.574 14.762 42.178 42.178
2 3.750 10.715 54.289
3 2.510 7.171 61.460
4 2.088 5.966 67.425
5 1.472 4.205 71.631
6 1.270 3.628 75.258
7 .903 2.580 77.838
8 .756 2.159 79.998
9 .659 1.884 81.882
10 .611 1.746 83.627
11 .577 1.650 85.277
12 .478 1.366 86.643
13 .439 1.254 87.897
14 .411 1.175 89.072
15 .393 1.124 90.196
16 .372 1.064 91.260
17 .339 .969 92.230
18 .288 .824 93.054
19 .276 .789 93.843
20 .257 .734 94.576
21 .222 .636 95.212
22 .211 .602 95.814
23 .207 .592 96.406
24 .174 .497 96.903
25 .166 .474 97.377
26 .142 .406 97.783
27 .126 .359 98.142
28 .122 .349 98.491
29 .115 .328 98.819
30 .101 .289 99.107
31 .085 .242 99.349
32 .073 .208 99.557
33 .064 .182 99.739
34 .056 .159 99.898
35 .036 .102 100.000
Extraction Method: Principal Axis Factoring.

97
Table 31. Results of Kolmogorov-Smirnov and Shapiro-Wilk Tests of Normality
Variables Kolmogorov-Smirnova Shapiro-Wilk
Statistic df Sig. Statistic df Sig.
Perceived usefulness &
compatibility
.097 110 .013 .957 110 .001
Perceived ease of use .172 110 .000 .887 110 .000
Trialability .197 110 .000 .874 110 .000
Trust in provider .151 110 .000 .958 110 .002
Trust in mobile device
reliability
.113 110 .001 .964 110 .004
Perceived risk .079 110 .086 .958 110 .002
Personal innovativeness in
IT
.116 110 .001 .971 110 .016
Intention to use NFC mobile
payments
.148 110 .000 .931 110 .000
a. Lilliefors Significance Correction

98
Table 32. Pearson Correlations between All Variables in the Research Model

99
Table 33. Multiple Regression Analysis: Model Summary and ANOVA Statistics
Model Summaryb
Model R R Square Adjusted R
Square
Std. Error of
the Estimate
Durbin-
Watson
1 .888a .789 .775 .59590 2.120
a. Predictors: (Constant), Personal innovativeness in IT, Trust in mobile device reliability,
Trialability, Perceived risk, Perceived ease of use, Perceived usefulness & compatibility,
Trust in provider
b. Dependent Variable: Intention to use NFC mobile payments
ANOVAa
Model Sum of
Squares
df Mean
Square
F Sig.
1 Regression 135.755 7 19.394 54.614 .000b
Residual 36.220 102 .355
Total 171.975 109
a. Dependent Variable: Intention to use NFC mobile payments
b. Predictors: (Constant), Personal innovativeness in IT, Trust in mobile device reliability,
Trialability, Perceived risk, Perceived ease of use, Perceived usefulness & compatibility,
Trust in provider
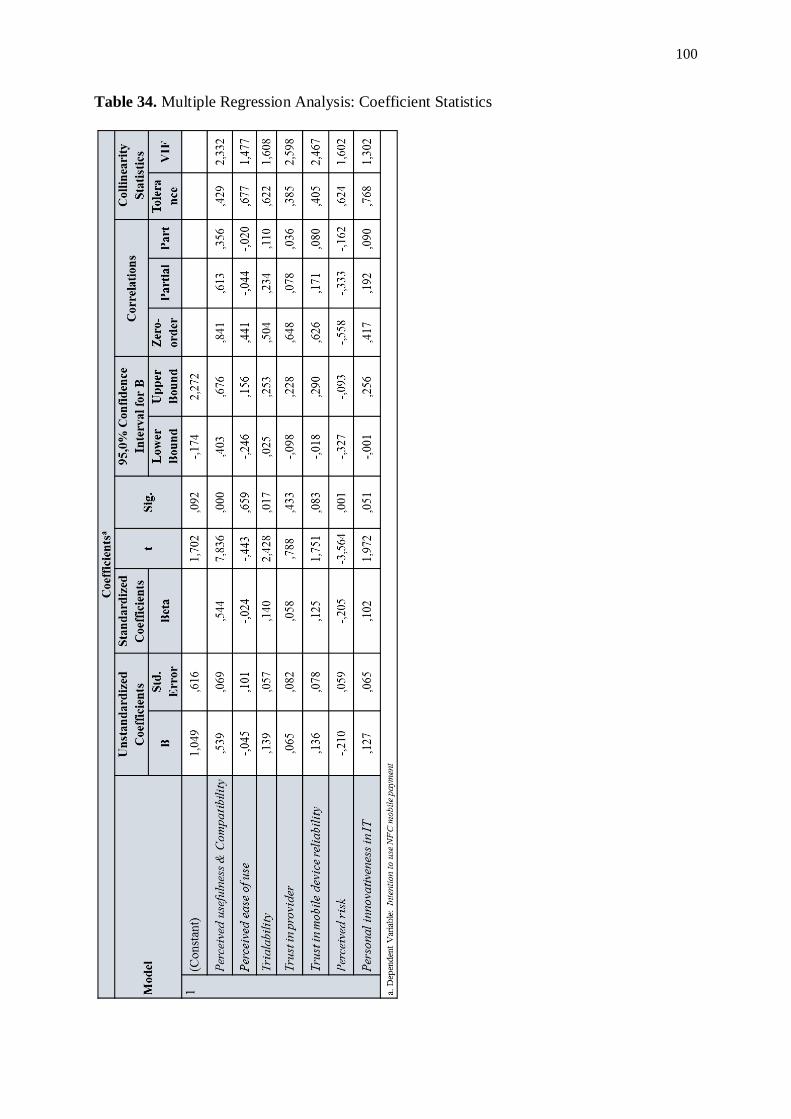
100
Table 34. Multiple Regression Analysis: Coefficient Statistics

101
Table 35. Mediation Analysis: Simple Regression Coefficient Statistics
Coefficientsa
Model Unstandardized
Coefficients
Standardized
Coefficients
t Sig.
B Std.
Error
Beta
1 (Constant) .677 .219 3.090 .003
Perceived usefulness
& compatibility
.833 .052 .841 16.12
5
.000
a. Dependent Variable: Intention to use NFC mobile payments
Coefficientsa
Model Unstandardized
Coefficients
Standardized
Coefficients
t Sig.
B Std.
Error
Beta
1 (Constant) -.197 .839 -.235 .815
Perceived ease of use .809 .158 .441 5.107 .000
a. Dependent Variable: Intention to use NFC mobile payments
Coefficientsa
Model Unstandardized
Coefficients
Standardized
Coefficients
t Sig.
B Std.
Error
Beta
1 (Constant) -.509 .832 -.611 .542
Perceived ease of use .867 .157 .469 5.520 .000
a. Dependent Variable: Perceived usefulness & compatibility

102
Table 36. Mediation Analysis: Multiple Regression Results
Model Summary
Model R R Square Adjusted R Square Std. Error of the
Estimate
1 .842a .709 .704 .68351
a. Predictors: (Constant), Perceived ease of use, Perceived usefulness & compatibility
ANOVAa
Model Sum of
Squares
df Mean Square F Sig.
1 Regression 121.986 2 60.993 130.552 .000b
Residual 49.989 107 .467
Total 171.975 109
a. Dependent Variable: Intention to use NFC mobile payments
b. Predictors: (Constant), Perceived ease of use, Perceived usefulness & compatibility
Coefficientsa
Model Unstandardized
Coefficients
Standardized
Coefficients
t Sig.
B Std.
Error
Beta
1 (Constant) .213 .507 .420 .675
Perceived
usefulness &
compatibility
.806 .059 .812 13.766 .000
Perceived ease of
use
.110 .108 .060 1.015 .312
a. Dependent Variable: Intention to use NFC mobile payments

103
Appendix A: Questionnaire

104
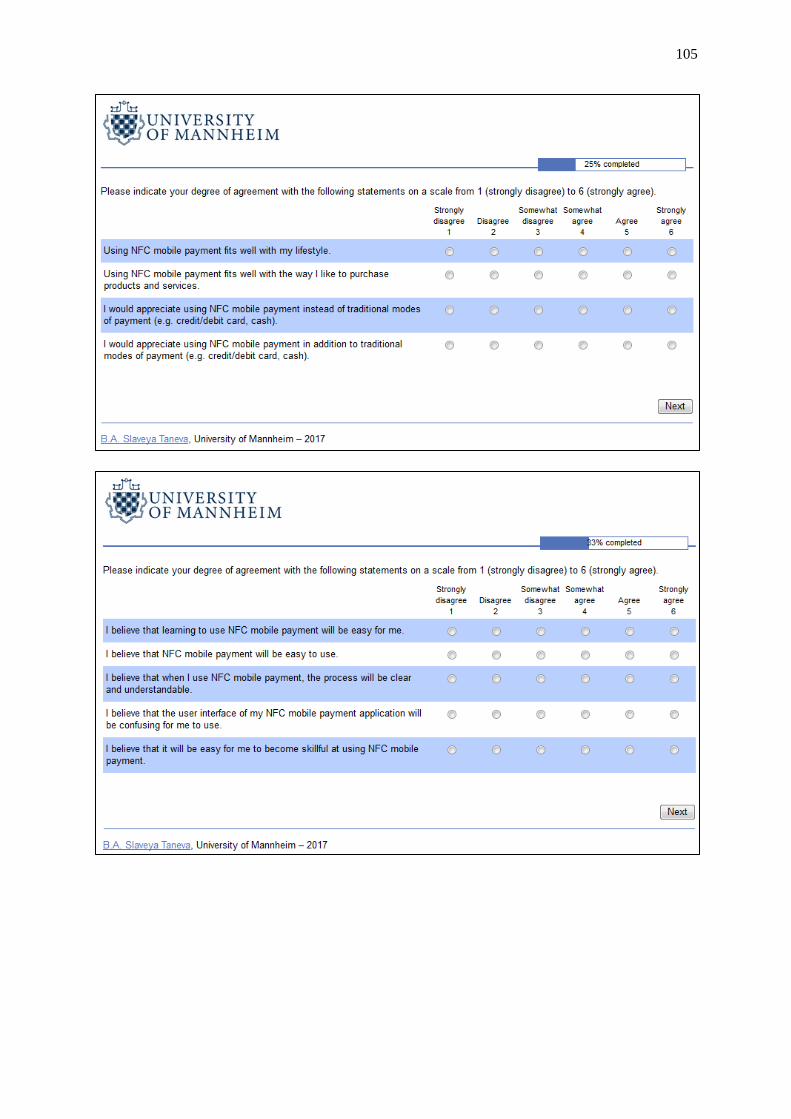
105
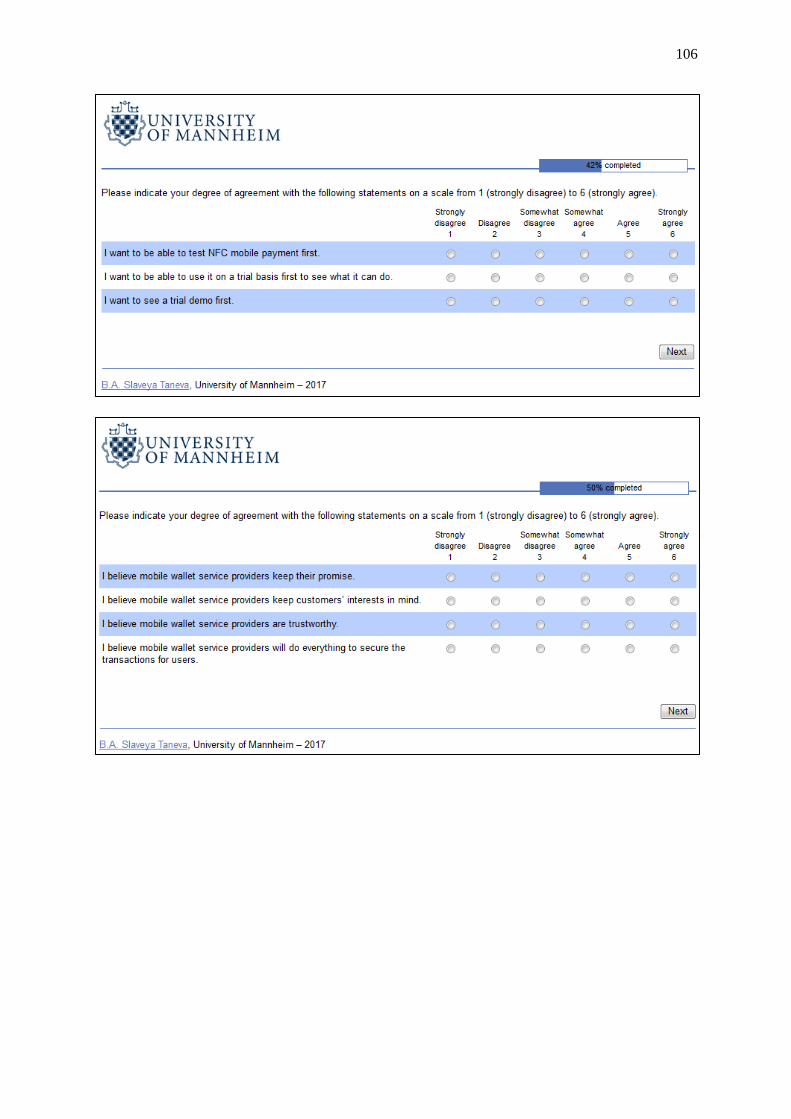
106

107

108

109

110
Appendix B: Literature Review Tables
Author/s
(Year)
[Journal]
Research Focus Theoretical
Background
Sample Method/Analysis Main
Findings
Agarwal and
Prasad
(1998)
[Information
Systems
Research]
(1) To propose a new
construct (personal
innovativeness in the
domain of information
technology (PIIT)) that
could extend existing
technology acceptance
models. (2) To develop
and test an operational
measure of this construct.
IDT, TAM, TPB,
TRA
N = 175
subjects
(1) Development of a scale for measuring PIIT
(2) Assessment of the reliability of the scale items
(Cronbach's Alpha) and the discriminant and
convergent validity of the construct (exploratory and
confirmatory factor analysis)
(3) Assessment of the new construct's nomological
validity (multiple regression analysis to analyze the
hypothesized moderating effect of PIIT on the
relationships between perceptions and usage
intentions)
The
proposed
scale for
PIIT
measures
the
conceptual
construct
it is meant
to
measure.
Author/s
(Year)
[Journal]
Research Focus Theoretical
Background
Sample Method/Analysis Main Findings
Baron and
Kenny
(1986)
[Journal of
Personality
and Social
Psychology]
Discussion of the
distinction between
moderator and mediator
variables on three levels
of analysis: conceptual,
strategic, and statistical.
Previous studies
in the field of
moderator/
mediator analysis
- Literature review
and description of
available
statistical tests
Moderator and mediator variables are
conceptually different; theorists and
researchers must make a clear distinction
between these two types of variables. The
study provides a toolbox of analytical
techniques for testing moderator and mediator
effects separately and in combination.

111
Author/s (Year)
[Journal]
Research Focus Theoretical
Background
Sample Method/Analysis Main Findings
Chandra,
Srivastava, and
Theng (2010)
[Communications
of the Association
for Information
Systems]
Investigation of
consumer trust in the
context of remote
mobile payment
services
TAM N = 109
Singapore
residents
(1) Development of a “trust-theoretic
m-payment adoption model”:
• Mobile service provider
characteristics (perceived
reputation and perceived
opportunism) and mobile
technology characteristics
(perceived environmental risk and
perceived structural assurance) are
determinants of consumer trust in
m-payment system
• Consumer trust in m-payment
system is a determinant of
adoption intention of m-payment
system via perceived usefulness
and perceived ease of use, as well
as directly
• Control variables: age, gender,
mobile internet, internet banking
(2) Multi-method approach: survey
and one-to-one interviews
(3) Analysis: partial least squares
(PLS) method
Mobile service provider
characteristics and mobile
technology characteristics are
significant determinants of
consumer trust. Consumer
trust has significant positive
relationships with perceived
ease of use and adoption
intention. Perceived ease of
use has a positive effect on
perceived usefulness.
Perceived usefulness is a
significant predictor of
adoption intention. Among
the control variables, only
experience with Internet
banking has a significant
positive effect on adoption
intention. Perceived ease of
use fully mediates the path
from consumer trust to
perceived usefulness.

112
Author/s (Year)
[Journal]
Research Focus Theoretical
Background
Sample Method/Analysis Main Findings
Chen (2008)
[International
Journal of
Mobile
Communications]
To investigate which
factors determine
consumers’ acceptance
of m-payments by
proposing and
validating a theoretical
model of m-payment
adoption.
TAM, IDT
N = 299
potential
m-
payment
adopters
in the
USA
(1) Development of a theoretical
model of mobile payments adoption
based on technology acceptance
model and innovation diffusion
theory:
• IVs: perceived transaction
convenience, perceived
transaction speed, security
concerns, privacy concerns,
perceived usefulness, perceived
risk, perceived ease of use,
compatibility
• DV: intention to use m-payment
(2) Validation of the theoretical
model using survey data
(confirmatory factor analysis and
structural equation modelling)
Consumer acceptance of m-
payments is determined by
four factors: perceived
usefulness (positive effect),
perceived ease of use (positive
effect), perceived risk
(negative effect), and
compatibility (positive effect).
Compatibility has the strongest
effect on adoption among these
factors. Transaction speed and
transaction convenience
positively affect perceived
usefulness. Security and
privacy concerns contribute
significantly to the
participants’ perceived risk of
adoption.

113
Author/s
(Year)
[Journal]
Research Focus Theoretical
Background
Sample Method/Analysis Main Findings
Cocosila and
Trabelsi
(2016)
[Electronic
Commerce
Research and
Applications]
(1) To develop a
theoretical model
contrasting
perceived gains and
costs of adopting
NFC mobile
payments. (2) To
assess the combined
effect of perceived
user value and risk
on the intention to
adopt NFC mobile
payments.
Perceived value
framework
N = 289
Canadian
consumers
(1) Development of a research model
(capturing an integrated value-risk
perception) of NFC mobile payment
adoption:
• IVs: gain constructs (utilitarian,
enjoyment, and social value) and cost
constructs (time risk, social risk,
psychological risk, privacy risk)
• DVs: overall risk (determined by cost
constructs), integrated value-risk
(determined by the gain constructs and
overall risk) and behavioral intention
(defined by integrated value-risk)
(2) Validation of the research model by
analyzing survey data using partial least
squares modeling (structural equation
modeling).
Significant positive effect
of the gain constructs
(especially utilitarian and
enjoyment) on the value
perception of using NFC
mobile payments, as well
as on behavioral intention.
Significant negative effect
of the cost constructs
(especially psychological
and privacy risks) on value
perceptions, as well as on
behavioral intention.
Overall, consumers see
more benefits than risks in
adopting NFC mobile
payments.
Author/s
(Year)
[Journal]
Research Focus Theoretical
Background
Sample Method/Analysis Main Findings
Cohen
(1992)
[Psychologic
al Bulletin]
To provide a summary of
effect size indexes and
their values for small,
medium, and large effects
in relation to sample sizes
Significance
criterion α,
statistical power,
sample size,
effect size
- Literature review E.g., effect sizes of product-
moment r: .10 (small); .30
(medium); .50 (large)

114
Author/s
(Year)
[Journal]
Research Focus Theoretical
Background
Sample Method/Analysis Main Findings
Dahlberg,
Guo, and
Ondrus
(2015)
[Electronic
Commerce
Research and
Applications]
(1) To provide a
critical review of
mobile payments
research published
between 2007 and
2014. (2) To point
out understudied
aspects of mobile
payments research.
Porter's five
forces model,
general
contingency
theory
N = 188
research
papers
published
between
2007 and
2014
(1) Literature search of online academic
journals and conference databases
(2) Classification of articles based on
area of research and methodology
(3) Critical analysis of articles from the
three most investigated research areas:
"mobile payment strategy and
ecosystems", "technology", and
"consumer adoption"
(4) Provision of guidance for future
research
Three over-studied areas of
mobile payments research are
"technology", "consumer
adoption", and "strategy and
ecosystem". Other areas, such as
"merchant adoption" and
"environmental factors" (legal,
regulatory, social, cultural)
require more attention.
Author/s
(Year)
[Journal]
Research Focus Theoretical
Background
Sample Method/Analysis Main Findings
Dahlberg,
Mallat,
Ondrus, and
Zmijewska
(2008)
[Electronic
Commerce
Research and
Applications]
(1) To review and
summarize findings
from previous mobile
payments research (up
to 2006). (2) To
propose a theoretical
framework of factors
impacting the mobile
payment services
market. (3) To propose
directions for future
research in mobile-
payment-related areas.
Porter’s five
forces
model,
general
contingency
theory
N = 73
research
papers
published
between
1999 and
2006
(1) Literature search of online academic
journals and conference databases
(2) Classification of papers into
categories according to the theoretical
framework and analysis of
methodologies applied
Most studied areas of mobile
payments research at this time are
mobile payment technologies and
consumer power. However, more
research is required in the other
areas of the proposed theoretical
framework, such as social and
cultural factors, the role of
traditional payment services
compared to mobile payment
services, merchant power, new e-
payment services etc.

115
Author/s
(Year)
[Journal]
Research Focus Theoretical
Background
Sample Method/Analysis Main Findings
Davis (1989)
[MIS
Quarterly]
Development and
validation of multi-item
measurement scales for
the theoretical constructs
perceived usefulness and
perceived ease of use
hypothesized to be major
determinants of
information technology
use.
Self-efficacy
theory, cost-
benefit paradigm
from behavioral
decision theory,
IDT, channel
disposition model
Nstudy 1 =
112
participants
Nstudy 2 =
40
participants
(1) Scale development and pretest
(2) Field study (study 1):
assessment of the reliability,
convergent validity, discriminant
validity, and factorial validity of
the new scales
(3) Refinement of the scales
based on the results of study 1
(4) Laboratory study (study 2):
assessment of reliability and
validity of the scales; regression
analysis with perceived
usefulness and perceived ease of
use as predictors of system use
The measurement scales of
perceived usefulness and
perceived ease of use were
successfully validated.
Perceived usefulness and ease
of use are significantly
correlated with self-reported
indicants of system use.
Perceived usefulness has a
stronger effect on system use
than perceived ease of use.
Perceived usefulness mediates
the effect of ease of use on
system usage.

116
Author/s
(Year)
[Journal]
Research
Focus
Theoretical
Background
Sample Method/Analysis Main Findings
Davis (1993)
[Man-
Machine
Studies]
Empirical
test of TAM
Fishbein and
Ajzen’s (1975)
attitude theory
N = 112
employees
of a North
American
corporation
(1) Development of the original TAM where:
• System design features have a direct
effect on perceived usefulness and
perceived ease of use
• Perceived usefulness and perceived ease
of use have direct effects on attitude
toward using
• Perceived usefulness also moderates the
effect of perceived ease of use on attitude
toward using
• Attitude toward using has a direct effect
on actual system use
(2) Administration of a survey
(3) Regression analyses
Attitude has a significant effect
on usage. Perceived usefulness
has a significant strong effect on
attitude. Perceived ease of use
has a significant effect on attitude
and a significantly strong effect
on perceived usefulness.
Perceived usefulness has strong
direct effect on system use, as
well as an indirect effect via
attitude.

117
Author/s
(Year)
[Journal]
Research Focus Theoretical
Background
Sample Method/Analysis Main Findings
de Kerviler,
Demoulin,
and Zidda
(2016)
[Journal of
Retailing and
Consumer
Services]
To investigate how
various benefits and risks
of proximity mobile
payments influence
consumers’ intention to
adopt them, by taking
into consideration the
role of past experience
with mobile shopping.
Theory of
perceived value,
valence
framework,
value-based
adoption model,
heuristic-
systematic model
N = 363
mobile
shoppers
(divided in
“in-store
m-
infosearch
group”
and “p-m-
payment
group”)
(1) Development of hypotheses
about the effects of perceived
benefits and risks on the intention
to use mobile payment services:
• IVs: perceived utilitarian
benefits (convenience,
economic, informational),
perceived hedonic benefits
(enjoyment, experiential),
perceived symbolic benefits
(social), perceived risks
(privacy, financial)
• DV: usage intention
• Additional variables:
smartphone-based shopping
experience, computer-based
shopping experience, product
involvement, purchase
decision involvement, past
experience
(2) Assessment of the effects of
perceived benefits and risks on
the intention to use mobile
payments by conducting a series
of OLS regressions
Utilitarian, hedonic, and social
benefits have positive effects
and financial and privacy risks
have negative effects on
consumers’ intention to use in-
store mobile payments. Accumulated experience with
in-store mobile services
enhances adoption intentions.
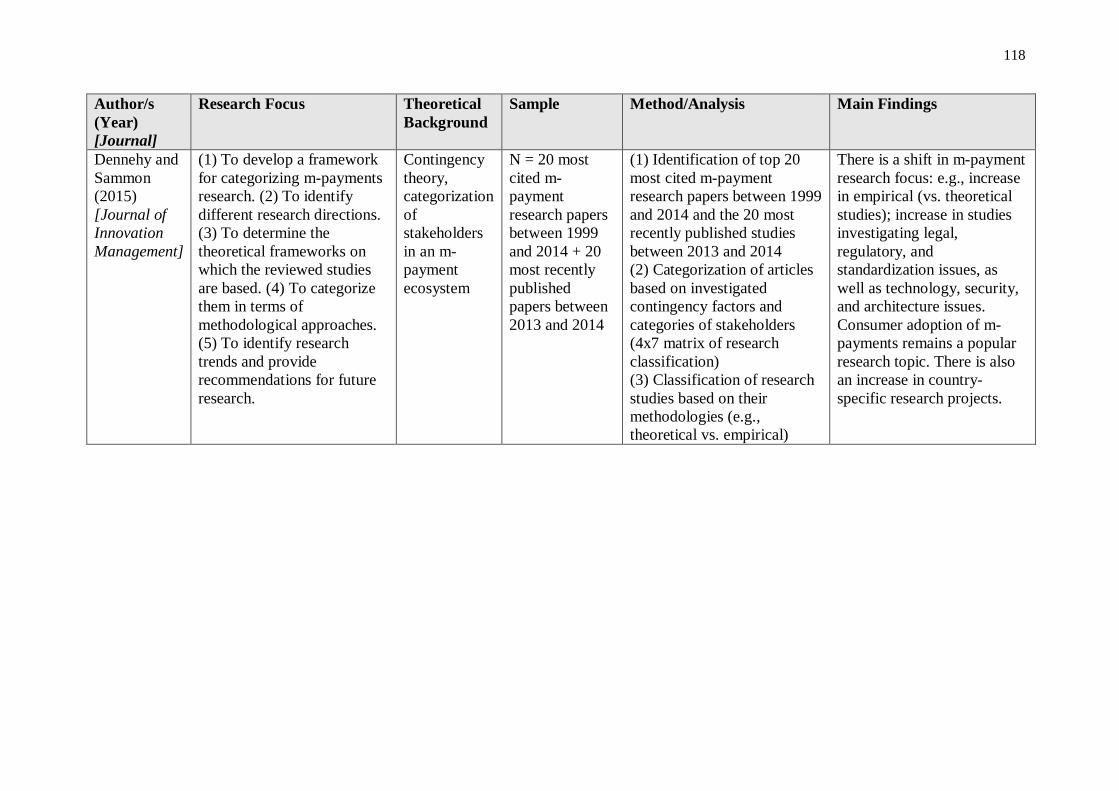
118
Author/s
(Year)
[Journal]
Research Focus Theoretical
Background
Sample Method/Analysis Main Findings
Dennehy and
Sammon
(2015)
[Journal of
Innovation
Management]
(1) To develop a framework
for categorizing m-payments
research. (2) To identify
different research directions.
(3) To determine the
theoretical frameworks on
which the reviewed studies
are based. (4) To categorize
them in terms of
methodological approaches.
(5) To identify research
trends and provide
recommendations for future
research.
Contingency
theory,
categorization
of
stakeholders
in an m-
payment
ecosystem
N = 20 most
cited m-
payment
research papers
between 1999
and 2014 + 20
most recently
published
papers between
2013 and 2014
(1) Identification of top 20
most cited m-payment
research papers between 1999
and 2014 and the 20 most
recently published studies
between 2013 and 2014
(2) Categorization of articles
based on investigated
contingency factors and
categories of stakeholders
(4x7 matrix of research
classification)
(3) Classification of research
studies based on their
methodologies (e.g.,
theoretical vs. empirical)
There is a shift in m-payment
research focus: e.g., increase
in empirical (vs. theoretical
studies); increase in studies
investigating legal,
regulatory, and
standardization issues, as
well as technology, security,
and architecture issues.
Consumer adoption of m-
payments remains a popular
research topic. There is also
an increase in country-
specific research projects.

119
Author/s
(Year)
[Journal]
Research Focus Theoretical
Background
Sample Method/Analysis Main Findings
Falk, Kunz,
Schepers, and
Mrozek
(2016)
[Journal of
Business
Research]
To investigate how
payment transparency
(cash, card, mobile
payment) and basket
price judgment affect
consumers’ overall store
price image (OSPI) of
retail stores.
Payment
transparency
concept, prospect
theory
Nstudy 1 = 56
participants
Nstudy 2 = 57
participants
Nstudy 3 =
200
participants
(1) Study 1: online
experiment examining the
effect of basket price
judgment (low/high budget
condition) on shoppers’ OSPI
formation (ANOVA)
(2) Study 2: online
experiment; examination of
the effect of payment
transparency (cash vs. card)
on shoppers’ OSPI formation
(ANOVA)
(3) Study 3: laboratory
experiment; examination of
the effects of payment
transparency (cash, card,
mobile) and basket price
judgment (low/high budget
condition) on OSPI formation
and willingness-to-pay
(ANOVA)
• Study 1: Customers form a
lower OSPI when their basket
price judgment is favorable
than when their basket price
judgment is unfavorable.
• Study 2: Customers form a
lower OSPI when the
payment method is less
transparent (e.g. card
payment in contrast to cash
payment).
• Study 3: Confirms the
findings of Study 1 and 2.
Also, mobile payments result
in lower OSPI perceptions
compared to cash and card
payments. Shoppers are
willing to spend more when
paying with a mobile phone
than with card or cash.

120
Author/s
(Year)
[Journal]
Research Focus Theoretical
Background
Sample Method/Analysis Main Findings
Hayashi
(2012)
[Economic
Review –
Federal
Reserve Bank
of Kansas
City]
(1) Literature
review; (2)
investigation of
the benefits of
proximity
mobile
payments for
consumers
Consumer
payments
literature
- Literature review;
qualitative analysis
of benefits of
proximity mobile
payments
Barriers to adoption on the supply side: creation of viable
business models for market participants; agreement on
technology standards. Barriers to adoption on the demand
side: uncertainty about the benefits of proximity mobile
payments for consumers. Benefits of proximity mobile
payments: convenience, cost benefits, security, ability to
manage finances and control spending anytime and
anywhere, ability to receive targeted ads and promotions.
Convenience and the ability to check account balances
anytime and anywhere would encourage adoption.
However, low merchant acceptance of proximity mobile
payments hampers consumer adoption.
Author/s
(Year)
[Journal]
Research
Focus
Theoretical
Background
Sample Method/Analysis Main Findings
Hoehle,
Scornavacca,
and Huff
(2012)
[Decision
Support
Systems]
Review of
research in
consumer
adoption and
use of electronic
banking
channels (ATM,
telephone,
Internet, and
mobile banking)
Classification
and definition
of electronic
banking
channels
N = 247
peer
reviewed
research
articles
(1) Identification,
review, and
analysis of
previous research
(2) Identification of
theoretical
frameworks and
methodological
approaches used in
the literature
(3) Identification of
gaps in research
Qualitative research includes case studies, focus groups,
grounded theory studies, and interview-based studies.
Quantitative research includes survey studies and
experiments. Most popular theoretical frameworks include
DOI, TRA, TPB, TAM, and technology resistance theory.
Most extensively studied constructs are relative advantage,
compatibility, complexity, trialability, observability,
attitudes towards e-banking, subjective norm, perceived
usefulness, ease of use, accessibility & convenience, costs
associated with use, reliability, risk, satisfaction, security,
self-efficacy, service quality, trust.
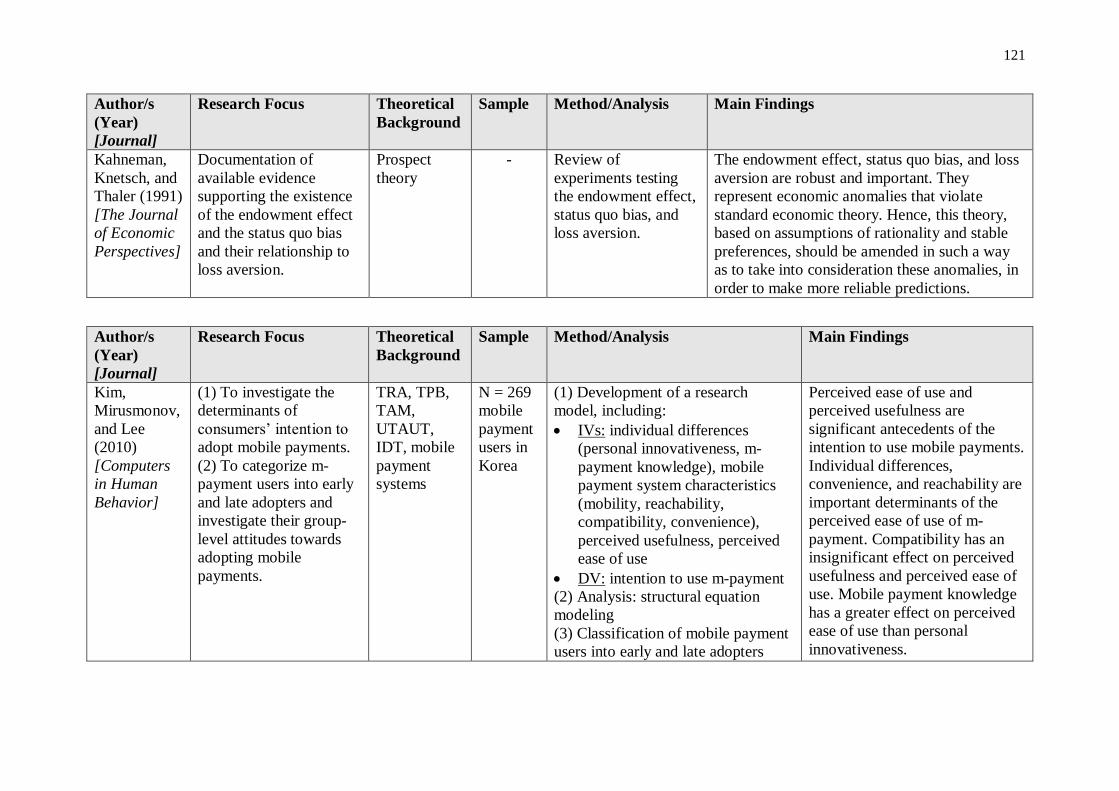
121
Author/s
(Year)
[Journal]
Research Focus Theoretical
Background
Sample Method/Analysis Main Findings
Kahneman,
Knetsch, and
Thaler (1991)
[The Journal
of Economic
Perspectives]
Documentation of
available evidence
supporting the existence
of the endowment effect
and the status quo bias
and their relationship to
loss aversion.
Prospect
theory
- Review of
experiments testing
the endowment effect,
status quo bias, and
loss aversion.
The endowment effect, status quo bias, and loss
aversion are robust and important. They
represent economic anomalies that violate
standard economic theory. Hence, this theory,
based on assumptions of rationality and stable
preferences, should be amended in such a way
as to take into consideration these anomalies, in
order to make more reliable predictions.
Author/s
(Year)
[Journal]
Research Focus Theoretical
Background
Sample Method/Analysis Main Findings
Kim,
Mirusmonov,
and Lee
(2010)
[Computers
in Human
Behavior]
(1) To investigate the
determinants of
consumers’ intention to
adopt mobile payments.
(2) To categorize m-
payment users into early
and late adopters and
investigate their group-
level attitudes towards
adopting mobile
payments.
TRA, TPB,
TAM,
UTAUT,
IDT, mobile
payment
systems
N = 269
mobile
payment
users in
Korea
(1) Development of a research
model, including:
• IVs: individual differences
(personal innovativeness, m-
payment knowledge), mobile
payment system characteristics
(mobility, reachability,
compatibility, convenience),
perceived usefulness, perceived
ease of use
• DV: intention to use m-payment
(2) Analysis: structural equation
modeling
(3) Classification of mobile payment
users into early and late adopters
Perceived ease of use and
perceived usefulness are
significant antecedents of the
intention to use mobile payments.
Individual differences,
convenience, and reachability are
important determinants of the
perceived ease of use of m-
payment. Compatibility has an
insignificant effect on perceived
usefulness and perceived ease of
use. Mobile payment knowledge
has a greater effect on perceived
ease of use than personal
innovativeness.
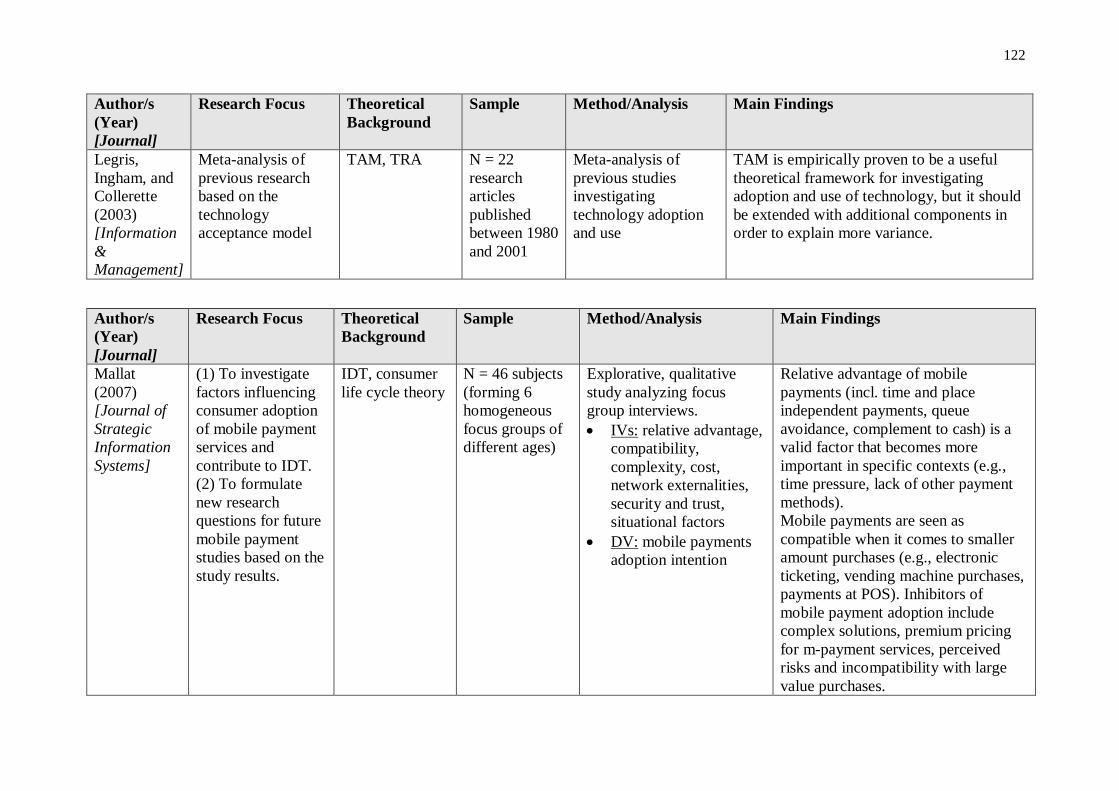
122
Author/s
(Year)
[Journal]
Research Focus Theoretical
Background
Sample Method/Analysis Main Findings
Legris,
Ingham, and
Collerette
(2003)
[Information
&
Management]
Meta-analysis of
previous research
based on the
technology
acceptance model
TAM, TRA N = 22
research
articles
published
between 1980
and 2001
Meta-analysis of
previous studies
investigating
technology adoption
and use
TAM is empirically proven to be a useful
theoretical framework for investigating
adoption and use of technology, but it should
be extended with additional components in
order to explain more variance.
Author/s
(Year)
[Journal]
Research Focus Theoretical
Background
Sample Method/Analysis Main Findings
Mallat
(2007)
[Journal of
Strategic
Information
Systems]
(1) To investigate
factors influencing
consumer adoption
of mobile payment
services and
contribute to IDT.
(2) To formulate
new research
questions for future
mobile payment
studies based on the
study results.
IDT, consumer
life cycle theory
N = 46 subjects
(forming 6
homogeneous
focus groups of
different ages)
Explorative, qualitative
study analyzing focus
group interviews.
• IVs: relative advantage,
compatibility,
complexity, cost,
network externalities,
security and trust,
situational factors
• DV: mobile payments
adoption intention
Relative advantage of mobile
payments (incl. time and place
independent payments, queue
avoidance, complement to cash) is a
valid factor that becomes more
important in specific contexts (e.g.,
time pressure, lack of other payment
methods).
Mobile payments are seen as
compatible when it comes to smaller
amount purchases (e.g., electronic
ticketing, vending machine purchases,
payments at POS). Inhibitors of
mobile payment adoption include
complex solutions, premium pricing
for m-payment services, perceived
risks and incompatibility with large
value purchases.

123
Author/s
(Year)
[Journal]
Research Focus Theoretical
Background
Sample Method/Analysis Main Findings
Mandrik and
Bao (2005)
[Advances in
Consumer
Research]
Exploration of
the concept and
measurement of
general vs.
domain-specific
risk aversion
Expected utility
theory, methods
of risk aversion
measurement
(choice
dilemmas,
gambles, self-
report measures)
N1 = 64
undergraduate
business
students
N2 = 92
students
(1) Scale development for the
concept of general risk aversion
(2) Initial test of the scale with N1;
exploratory factor analysis
(3) A study with N2 including the
new general risk aversion scale and
further risk aversion measurements
from previous research; exploratory
factor analyses; correlation analyses
The study provides support for
the possibility to measure
general risk aversion by means
of a self-report scale. The new
scale provides a simpler way to
measure risk aversion in
contrast to traditional methods
(e.g., choice dilemmas,
gambles, etc.).
Author/s
(Year)
[Journal]
Research Focus Theoretical
Background
Sample Method/Analysis Main Findings
Oliveira,
Thomas,
Baptista, and
Campos
(2016)
[Computers
in Human
Behavior]
(1) To identify
the direct and
indirect effects of
the main
determinants of
mobile payment
adoption. (2) To
identify the
determinants of
the intention to
recommend the
mobile payment
technology.
UTAUT2, IDT
N = 301
students and
alumni from
Portuguese
universities
(1) Development of a research
model, including:
• IVs: compatibility,
innovativeness, performance
expectancy, effort expectancy,
social influence, facilitating
conditions, hedonic motivation,
price value, perceived
technology security
• DVs: Behavioral intention to
adopt, behavioral intention to
recommend
(2) Testing of the research model
with survey data using structural
equation modeling
Compatibility, perceived technology
security, performance expectancy,
innovativeness, and social influence
are most important in explaining the
behavioral intention to adopt mobile
payments. Behavioral intention to
adopt, compatibility, innovativeness,
perceived technology security,
performance expectancy, effort
expectancy, and social influence
explain the behavioral intention to
recommend mobile payments.

124
Author/s
(Year)
[Journal]
Research Focus Theoretical
Background
Sample Method/Analysis Main Findings
Pham and Ho
(2015)
[Technology
in Society]
Investigation of
factors affecting
consumers'
intention to adopt
NFC-based
mobile payments.
TAM, IDT N = 402
Taiwanese
consumers
(not
current
users of
NFC-
based
mobile
payments)
(1) Development of a research model,
including:
• IVs: product-related (perceived
usefulness, perceived ease of use,
compatibility, perceived risk,
perceived cost, trialability,
additional values); personal-related
(personal innovativeness in new
technologies, absorptive capacity),
trust, attractiveness of alternatives
• DV: intention to adopt NFC mobile
payments
(2) Validation of the research model
using structural equation modeling
Perceived usefulness,
compatibility, trialability,
additional values of NFC mobile
payments, innovativeness in new
technologies, and absorptive
capacity have significant positive
effects on the intention to adopt
NFC mobile payments. Perceived
risk and attractiveness of
alternatives have significant
negative effects on the intention to
adopt. Perceived ease of use,
perceived cost, and trust have no
significant effects.
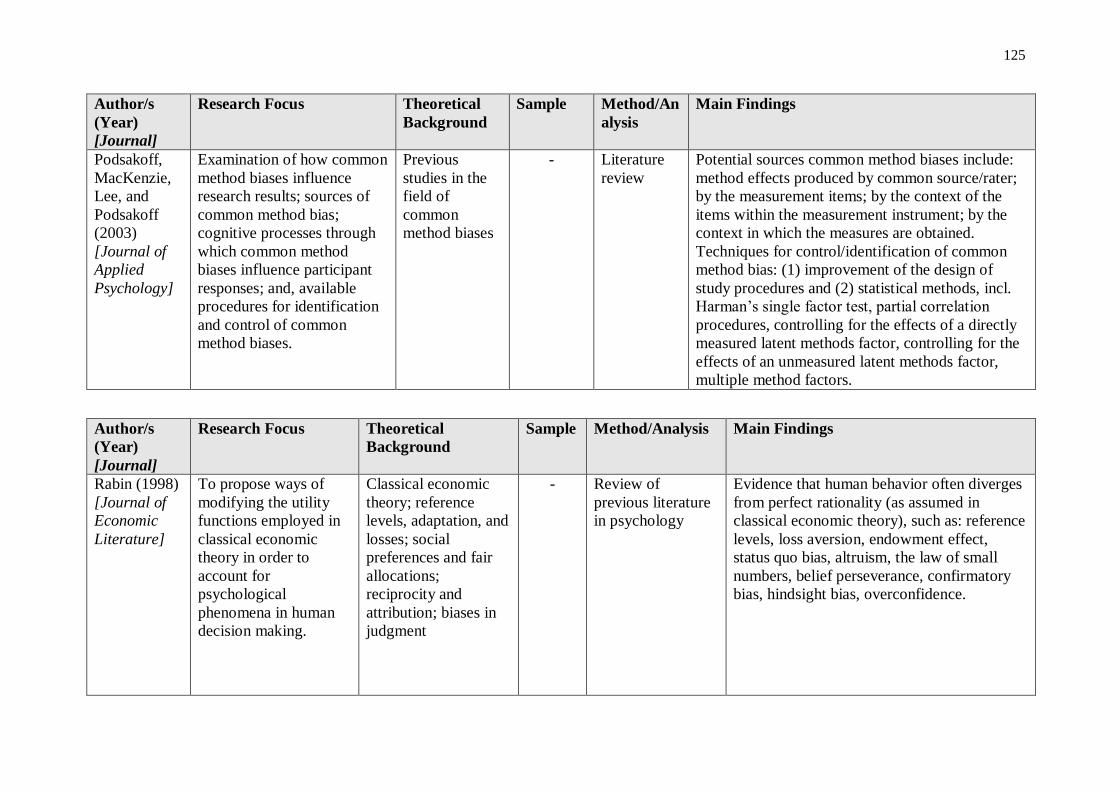
125
Author/s
(Year)
[Journal]
Research Focus Theoretical
Background
Sample Method/An
alysis
Main Findings
Podsakoff,
MacKenzie,
Lee, and
Podsakoff
(2003)
[Journal of
Applied
Psychology]
Examination of how common
method biases influence
research results; sources of
common method bias;
cognitive processes through
which common method
biases influence participant
responses; and, available
procedures for identification
and control of common
method biases.
Previous
studies in the
field of
common
method biases
- Literature
review
Potential sources common method biases include:
method effects produced by common source/rater;
by the measurement items; by the context of the
items within the measurement instrument; by the
context in which the measures are obtained.
Techniques for control/identification of common
method bias: (1) improvement of the design of
study procedures and (2) statistical methods, incl.
Harman’s single factor test, partial correlation
procedures, controlling for the effects of a directly
measured latent methods factor, controlling for the
effects of an unmeasured latent methods factor,
multiple method factors.
Author/s
(Year)
[Journal]
Research Focus Theoretical
Background
Sample Method/Analysis Main Findings
Rabin (1998)
[Journal of
Economic
Literature]
To propose ways of
modifying the utility
functions employed in
classical economic
theory in order to
account for
psychological
phenomena in human
decision making.
Classical economic
theory; reference
levels, adaptation, and
losses; social
preferences and fair
allocations;
reciprocity and
attribution; biases in
judgment
- Review of
previous literature
in psychology
Evidence that human behavior often diverges
from perfect rationality (as assumed in
classical economic theory), such as: reference
levels, loss aversion, endowment effect,
status quo bias, altruism, the law of small
numbers, belief perseverance, confirmatory
bias, hindsight bias, overconfidence.

126
Author/s (Year)
[Journal]
Research Focus Theoretical
Background
Sample Method/Analysis Main Findings
Sanakulov and
Karjaluoto
(2015)
[International
Journal of
Mobile
Communications]
Review of studies on
consumer adoption
of mobile
technologies.
Analysis of the
studies’ theoretical
backgrounds and
findings.
Identification of the
most important
predictors of mobile
technology adoption.
TRA, TPB,
TAM, fit-
viability
model,
UTAUT, IDT
N = 67
empirical
studies
of
mobile
technolo
gy
adoption
(1) Publication search
(2) Data extraction from
the selected studies
(3) Meta-analysis of
significant effects of
variables affecting
mobile technology
adoption
(4) Analysis of most
studied areas in mobile
technology adoption
TAM is the most frequently applied
theoretical framework, followed by UTAUT.
Perceived usefulness, perceived ease of use,
attitude, social factors, performance
expectance, effort expectancy, and
facilitating conditions are found to be the
most significant variables affecting mobile
technology adoption. Most studied areas of
mobile technology adoption are mobile data
services, mobile banking, and mobile
learning.
Author/s
(Year)
[Journal]
Research Focus Theoretical
Background
Sample Method/Analysis Main Findings
Schierz,
Schilke, Wirtz
(2010)
[Electronic
Commerce
Research and
Applications]
To develop and test a
research model of
consumer acceptance
of mobile payment
services.
TAM N = 1447
consume
rs in
Germany
(1) Development of a
research model, including:
• IVs: perceived
compatibility, perceived
security, perceived
usefulness, perceived ease
of use, individual
mobility, subjective norm,
attitude towards use
• DV: intention to use
(2) Analysis: structural
equation modeling
The model explains 84% of the variance
of the dependent variable. The proposed
relationships between the variables are
significant. Perceived compatibility has
the greatest impact on the intention to
use mobile payment services. Other key
factors include individual mobility,
subjective norm, perceived usefulness,
perceived security, and perceived ease of
use.

127
Author/s
(Year)
[Journal]
Research Focus Theoretical
Background
Sample Method/Analysis Main Findings
Shaikh and
Karjaluoto
(2015)
[Telematics
and
Informatics]
(1) To conduct a
literature review of
mobile banking
adoption. (2) To
summarize major
findings in the field of
mobile banking
adoption, identify gaps
in research and make
recommendations for
future studies.
TAM, DOI,
UTAUT, TPB,
Ubiquitous
computing
framework,
Task-
technology fit
model
N = 55
publications
on mobile
banking
(incl.
academic
papers and
practitioner
sources)
(1) Literature search and
identification of academic and
practitioner publications
(2) Analysis of methodologies,
geographical contexts,
theoretical models applied in
the studies
(3) Meta-analysis of average
path coefficients between
antecedents of mobile banking
and attitude and intention
Compatibility, perceived usefulness,
and perceived ease of use are
antecedents of both attitude and
intention to adopt mobile banking.
Credibility, social influence,
perceived behavioral control/self-
efficacy, and perceived cost have on
average a low to medium effect on
intention to use mobile banking.
Author/s
(Year)
[Journal]
Research Focus Theoretical
Background
Sample Method/Analysis Main Findings
Shaw (2014)
[Journal of
Retailing and
Consumer
Services]
(1) To develop a
research model of
factors influencing
consumers'
adoption of the
mobile wallet by
extending TAM.
(2) To empirically
test the research
model.
TAM N = 284
university
students in
Canada
(1) Development of a research
model:
• IVs: mobile wallet self-
efficacy, informal learning
(incl. personal WOM and
virtual WOM), perceived ease
of use, perceived usefulness,
trust
• DV: intention to use
(2) Analysis: structural equation
modeling
Trust mediates the effect of informal
learning on intention to use a mobile
wallet.
Perceived usefulness (most important
factor), trust, and informal learning
positive influence the intention to use a
mobile wallet.
The effect of perceived ease of use on
intention to use is not significant.
Mobile wallet self-efficacy influences
perceived ease of use but not perceived
usefulness.
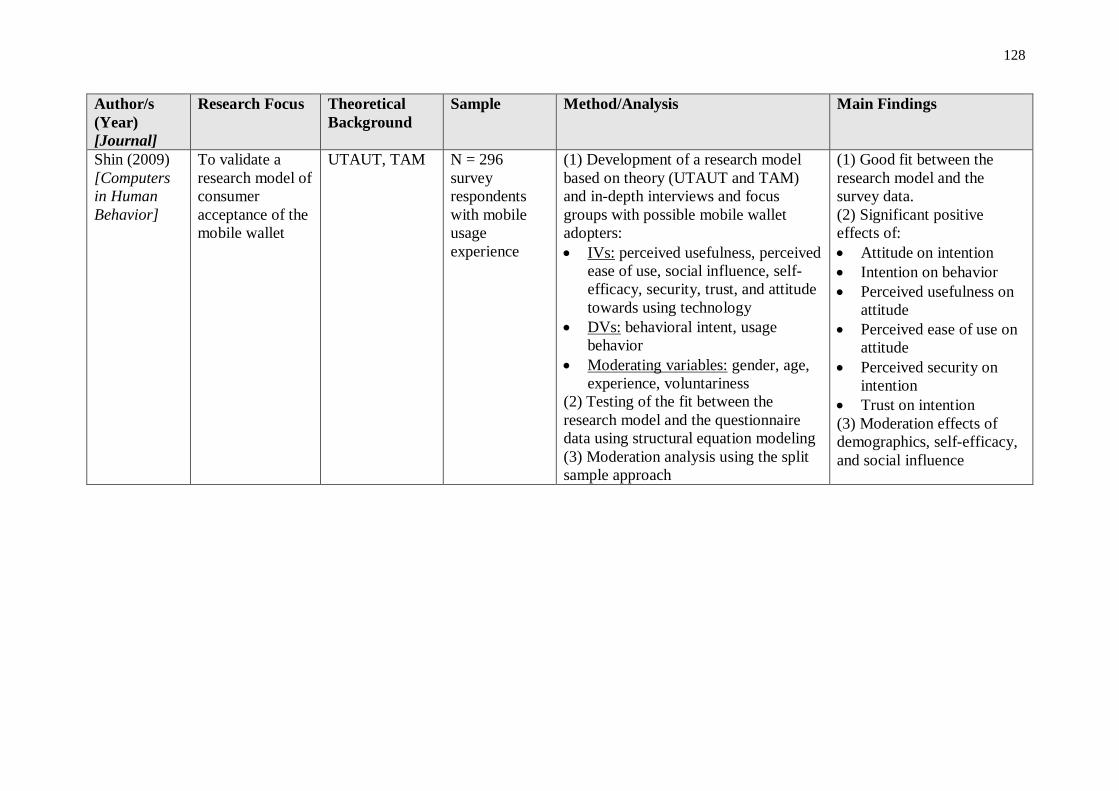
128
Author/s
(Year)
[Journal]
Research Focus Theoretical
Background
Sample Method/Analysis Main Findings
Shin (2009)
[Computers
in Human
Behavior]
To validate a
research model of
consumer
acceptance of the
mobile wallet
UTAUT, TAM
N = 296
survey
respondents
with mobile
usage
experience
(1) Development of a research model
based on theory (UTAUT and TAM)
and in-depth interviews and focus
groups with possible mobile wallet
adopters:
• IVs: perceived usefulness, perceived
ease of use, social influence, self-
efficacy, security, trust, and attitude
towards using technology
• DVs: behavioral intent, usage
behavior
• Moderating variables: gender, age,
experience, voluntariness
(2) Testing of the fit between the
research model and the questionnaire
data using structural equation modeling
(3) Moderation analysis using the split
sample approach
(1) Good fit between the
research model and the
survey data.
(2) Significant positive
effects of:
• Attitude on intention
• Intention on behavior
• Perceived usefulness on
attitude
• Perceived ease of use on
attitude
• Perceived security on
intention
• Trust on intention
(3) Moderation effects of
demographics, self-efficacy,
and social influence

129
Author/s
(Year)
[Journal]
Research Focus Theoretical
Background
Sample Method/Analysis Main Findings
Slade,
Williams,
Dwivedi, and
Piercy
(2015)
[Journal of
Strategic
Marketing]
(1) To investigate
factors influencing
consumers’ intention to
adopt proximity mobile
payments (using NFC
technology) in the UK.
(2) To compare the
statistical significance
of UTAUT2 with that
of an extended version
of UTAUT2.
UTAUT2 N = 244
consumers
in the UK
(1) Development of a research model
based on UTAUT2, in order to investigate
predictors of consumers’ intention to
adopt proximity mobile payments:
• IVs: performance expectancy, effort
expectancy, social influence,
facilitating conditions, habit, price
value, hedonic motivation, perceived
risk, trust in provider
• DV: Behavioral intention to adopt
NFC mobile payments
(2) Examination of construct validity
(using factor analysis) and reliability
(Cronbach’s Alpha)
(3) Regression analysis of survey data
Performance expectancy,
habit, hedonic motivation,
and social influence have
strongest influence on
behavioral intention in
UTAUT2.
Performance expectancy,
habit, social influence,
perceived risk, and trust have
strongest influence on
behavioral intention in the
extended UTAUT2
(improvement of the
explained variance of
behavioral intention).
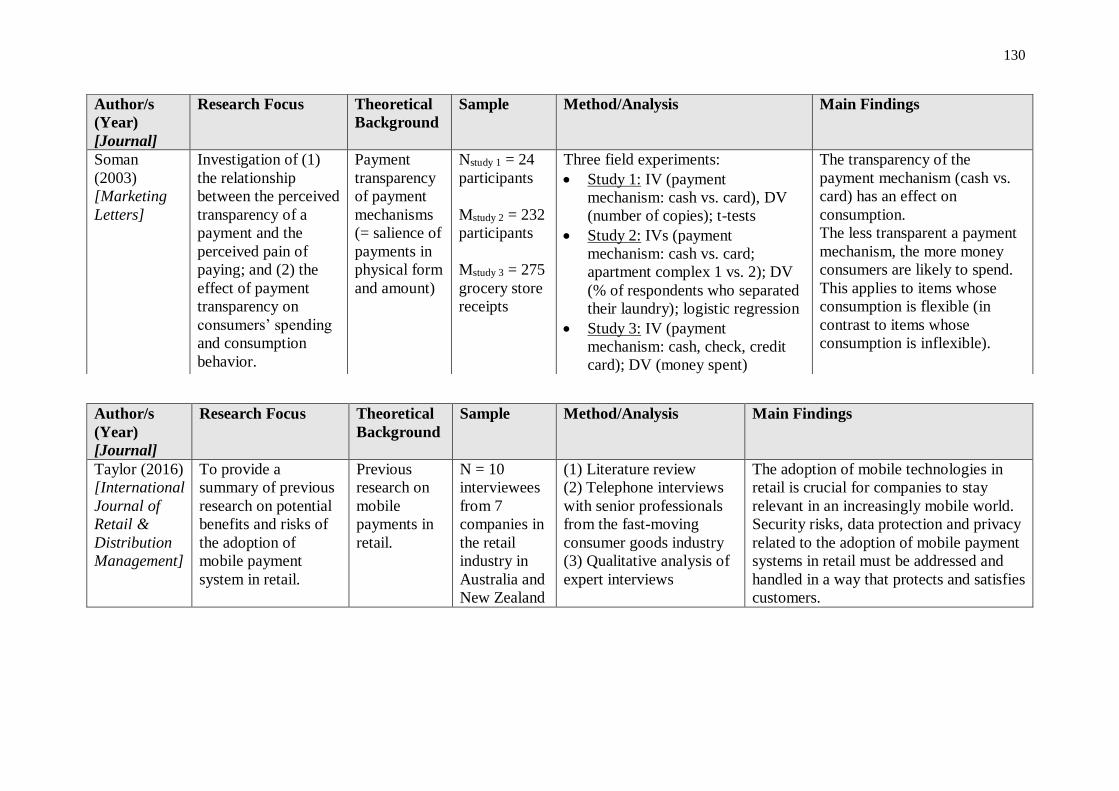
130
Author/s
(Year)
[Journal]
Research Focus Theoretical
Background
Sample Method/Analysis Main Findings
Taylor (2016)
[International
Journal of
Retail &
Distribution
Management]
To provide a
summary of previous
research on potential
benefits and risks of
the adoption of
mobile payment
system in retail.
Previous
research on
mobile
payments in
retail.
N = 10
interviewees
from 7
companies in
the retail
industry in
Australia and
New Zealand
(1) Literature review
(2) Telephone interviews
with senior professionals
from the fast-moving
consumer goods industry
(3) Qualitative analysis of
expert interviews
The adoption of mobile technologies in
retail is crucial for companies to stay
relevant in an increasingly mobile world.
Security risks, data protection and privacy
related to the adoption of mobile payment
systems in retail must be addressed and
handled in a way that protects and satisfies
customers.
Author/s
(Year)
[Journal]
Research Focus Theoretical
Background
Sample Method/Analysis Main Findings
Soman
(2003)
[Marketing
Letters]
Investigation of (1)
the relationship
between the perceived
transparency of a
payment and the
perceived pain of
paying; and (2) the
effect of payment
transparency on
consumers’ spending
and consumption
behavior.
Payment
transparency
of payment
mechanisms
(= salience of
payments in
physical form
and amount)
Nstudy 1 = 24
participants
Mstudy 2 = 232
participants
Mstudy 3 = 275
grocery store
receipts
Three field experiments:
• Study 1: IV (payment
mechanism: cash vs. card), DV
(number of copies); t-tests
• Study 2: IVs (payment
mechanism: cash vs. card;
apartment complex 1 vs. 2); DV
(% of respondents who separated
their laundry); logistic regression
• Study 3: IV (payment
mechanism: cash, check, credit
card); DV (money spent)
The transparency of the
payment mechanism (cash vs.
card) has an effect on
consumption.
The less transparent a payment
mechanism, the more money
consumers are likely to spend.
This applies to items whose
consumption is flexible (in
contrast to items whose
consumption is inflexible).

131
Author/s
(Year)
[Journal]
Research Focus Theoretical
Background
Sample Method/Analysis Main Findings
Tversky and
Kahneman
(1992)
[Journal of
Risk and
Uncertainty]
Extension of prospect
theory to apply to both
uncertain and risky
prospects with a number
of outcomes (cumulative
prospect theory).
Expected utility
theory, prospect
theory
N = 25
graduate
students
(1) Review of prospect theory and
experimental evidence from previous
research
(2) Experiment: individual choices
depending on probability of occurrence
(high, low) x outcomes (loss, gain)
(3) Ordinal and correlational analyses of
risk-seeking/risk-averse choices
Fourfold pattern or risk
attitudes: risk aversion
for gains and risk
seeking for losses of
high probability; risk
seeking for gains and
risk aversion for losses
of low probability.
Author/s
(Year)
[Journal]
Research Focus Theoretical
Background
Sample Method/Analysis Main Findings
Venkatesh
and Davis
(2000)
[Management
Science]
Extension of the
technology acceptance
model by including
additional determinants
of perceived usefulness
and usage intention.
Analysis of how the
effects of these
determinants change with
increasing user
experience. Empirical
tests of the enhanced
theoretical model
(TAM2).
TAM, TRA, TPB,
work motivation
theory, action
theory from social
psychology, task-
contingent
decision making
from behavioral
decision theory
Nstudy 1 =
38 users
Nstudy 2 =
39 users
Nstudy 3 =
43 users
Nstudy 4 =
36 users
(1) Theoretical extension of
TAM:
• Determinants of perceived
usefulness: subjective norm,
image, job relevance, output
quality, result demonstrability
• IVs: perceived usefulness,
perceived ease of use
• DV: intention to use (which
has an effect on usage
behavior)
• Moderator variables:
experience, voluntariness
(2) Four longitudinal field studies
(3) Regression analyses
TAM2 accounts for 40% -
60% of the variance in
usefulness perceptions and
34% - 52% of the variance in
usage intentions.
Social influence processes
(subjective norm,
voluntariness, and image) and
cognitive instrumental
processes (job relevance,
output quality, result
demonstrability, and perceived
ease of use) exhibit significant
effects on user acceptance of
new technologies.

132
Author/s
(Year)
[Journal]
Research Focus Theoretical
Background
Sample Method/Analysis Main Findings
Venkatesh,
Morris,
Davis, and
Davis (2003)
[MIS
Quarterly]
(1) Empirically compare
8 existing models of user
acceptance of IT. (2)
Formulate a unified
model of user acceptance
of IT based on the 8
models (UTAUT model).
(3) To empirically
validate the unified
model.
TRA, TAM,
motivational
model, TPB,
combined TAM
and TPB, model
of PC utilization,
IDT, social
cognitive theory
4 samples
stemming from 4
different
companies:
Nstudy 1 = 54
employees
Nstudy 2 = 65
employees
Nstudy 3 = 58
employees
Nstudy 4 = 38
employees
2 additional
samples used to
validate UTAUT:
Nstudy 5 = 80
employees
Nstudy 6 = 53
employees
(1) Review of 8 existing
models of user acceptance of
IT
(2) 4 longitudinal field studies
with employees from 4
different companies where new
IT systems were introduced:
• IVs: 32 IVs from the 8
models
• DVs: intention in voluntary
settings; intention in
mandatory settings;
technology use (determined
by intention to use and
perceived behavioral
control)
(3) Testing of the 8 models
using partial least squares and
employing a bootstrapping
method
(4) Analysis of moderators
(experience, voluntariness,
gender, and age)
(4) Formulation and empirical
validation of UTAUT
UTAUT outperforms the
8 models of user
acceptance of IT by
accounting for 70% of
the variance in usage
intention. Performance
expectancy, effort
expectancy, and social
influence are direct
determinants of intention
to use. Intention to use
and facilitating
conditions are direct
determinants of usage
behavior. Experience,
voluntariness, gender,
and age play a
moderating role in the
model.

133
Author/s
(Year)
[Journal]
Research Focus Theoretical
Background
Sample Method/Analysis Main Findings
Venkatesh,
Thong, and
Xu (2012)
[MIS
Quarterly]
To extend the
initial unified
theory of
acceptance and use
of technology
(UTAUT) to study
the acceptance and
use of technology
in consumer
contexts
(UTAUT2).
UTAUT,
previous
research in
hedonic
motivation,
price value,
and
experience
and habit
N = 1,512
mobile
internet
consumers
in Hong
Kong
(1) Development of UTAUT2:
• IVs: performance expectancy, effort
expectancy, social influence, facilitating
conditions, hedonic motivation, price value,
habit
• DVs: behavioral intention, use behavior
• Moderator variables: age, gender, experience
(2) Assessment of reliability and validity of the
measurement model (partial least squares
technique)
(3) Validation of the structural model (both
UTAUT and UTAUT2)
The results support the
applicability and validity
of UTAUT as a
theoretical base to predict
consumers’ behavioral
intentions and technology
use. The results also
provide support for the
applicability of UTAUT2
in consumer contexts.
Author/s
(Year)
[Journal]
Research Focus Theoretical
Background
Sample Method/Analysis Main Findings
Wei-Han
Tan, Ooi,
Chong, and
Hew (2014)
[Telematics
and
Informatics]
Investigation of
factors affecting
consumer
adoption of
mobile credit
card (MCC)
TAM N = 156
bank
customers
of a
Malaysian
bank
(1) Development of a research model of MCC
consumer adoption:
• IVs: perceived usefulness, perceived ease
of use, social influence, personal
innovativeness in IT, perceived risk,
perceived financial cost
• DV: intention to adopt MCC
• Moderating variable: gender
(2) Analysis: structural equation modeling with
maximum likelihood estimation
(3) Multi group analysis to test for moderating
effects of gender
Perceived usefulness,
perceived ease of use, social
influence, and personal
innovativeness in IT have
significant positive effects on
the intention to adopt MCC.
Perceived risk and perceived
financial cost do not exert
significant effects on the
intention to adopt. There are
no significant moderating
effects of gender.
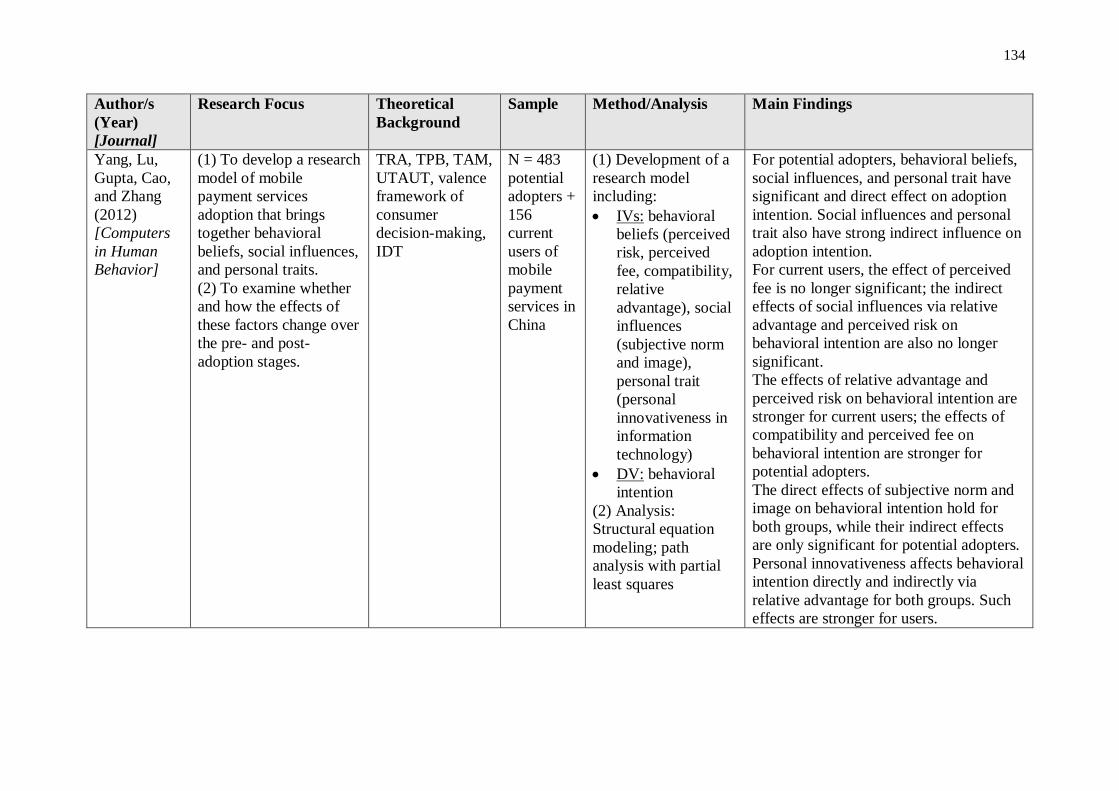
134
Author/s
(Year)
[Journal]
Research Focus Theoretical
Background
Sample Method/Analysis Main Findings
Yang, Lu,
Gupta, Cao,
and Zhang
(2012)
[Computers
in Human
Behavior]
(1) To develop a research
model of mobile
payment services
adoption that brings
together behavioral
beliefs, social influences,
and personal traits.
(2) To examine whether
and how the effects of
these factors change over
the pre- and post-
adoption stages.
TRA, TPB, TAM,
UTAUT, valence
framework of
consumer
decision-making,
IDT
N = 483
potential
adopters +
156
current
users of
mobile
payment
services in
China
(1) Development of a
research model
including:
• IVs: behavioral
beliefs (perceived
risk, perceived
fee, compatibility,
relative
advantage), social
influences
(subjective norm
and image),
personal trait
(personal
innovativeness in
information
technology)
• DV: behavioral
intention
(2) Analysis:
Structural equation
modeling; path
analysis with partial
least squares
For potential adopters, behavioral beliefs,
social influences, and personal trait have
significant and direct effect on adoption
intention. Social influences and personal
trait also have strong indirect influence on
adoption intention.
For current users, the effect of perceived
fee is no longer significant; the indirect
effects of social influences via relative
advantage and perceived risk on
behavioral intention are also no longer
significant.
The effects of relative advantage and
perceived risk on behavioral intention are
stronger for current users; the effects of
compatibility and perceived fee on
behavioral intention are stronger for
potential adopters.
The direct effects of subjective norm and
image on behavioral intention hold for
both groups, while their indirect effects
are only significant for potential adopters.
Personal innovativeness affects behavioral
intention directly and indirectly via
relative advantage for both groups. Such
effects are stronger for users.

135
Author/s
(Year)
[Journal]
Research Focus Theoretical
Background
Sample Method/Analysis Main Findings
Yang, Liu,
Li, and Yu
(2015)
[Industrial
Management
& Data
Systems]
(1) To investigate the
sources of perceived risk
of mobile payment
adoption. (2) To
investigate how different
types of perceived risk
influence the value
perception of mobile
payment services and
thus affect consumer
adoption.
Perceived risk
theory, prospect
theory, perceived
value theory
N = 310
respondents
in China
(1) Development of a research
model, including:
• Determinants of perceived risk
types: perceived technological
uncertainty, perceived
information asymmetry,
perceived regulatory
uncertainty, perceived service
intangibility
• IVs (perceived risk types):
perceived financial risk,
perceived privacy risk,
perceived performance risk,
perceived psychological risk,
perceived time risk
• DVs: perceived value (also
hypothesized to have an effect
on acceptance intention),
acceptance intention
(2) Estimation of the research
model using structural equation
modeling
Perceived financial risk and
perceived performance risk
have strong negative effects
on both perceived value and
acceptance intention.
Perceived privacy risk has a
salient effect on acceptance
intention, but no effect on
perceived value. Perceived
psychological risk and
perceived time risk have no
effects on perceived value
and acceptance intention.
Perceived information
asymmetry, perceived
technological uncertainty,
perceived regulatory
uncertainty, and perceived
service intangibility are
relevant and significant
determinants of perceived
risks.

136
Author/s
(Year)
[Journal]
Research Focus Theoretical
Background
Sample Method/Analysis Main Findings
Zhang, Zhu,
and Liu
(2012)
[Computers
in Human
Behavior]
(1) To develop a research
model of mobile
commerce adoption by
extending TAM. (2) To
test the research model
by conducting a meta-
analysis of previous
studies in mobile
commerce acceptance.
TAM, TPB, IDT
N = 53
research
articles in
mobile
commerce
adoption
(1) Development of a research
model of mobile commerce
adoption:
• IVs: perceived risk, perceived
cost, perceived behavioral
control, subjective norm,
perceived usefulness, perceived
ease of use, innovativeness,
compatibility, trust, perceived
enjoyment, attitude
• DV: behavioral intention, actual
use
(2) Testing the model by
conducting a meta-analysis of
previous studies in mobile
commerce adoption (structural
equation modeling)
(3) Moderator analysis to test a
hypothesized moderator effect of
culture (Western vs. Eastern)
The relation between attitude
and behavioral intention
represents the strongest
correlation in the model.
Perceived usefulness,
perceived ease of use,
subjective norm, and
perceived enjoyment are
strongly and positively
correlated with behavioral
intention.
The effects of perceived cost
and perceived risk on
behavioral intention are
negative and significant.
Culture appears as a
moderator that makes some
independent variables more
or less important in Western
and Eastern cultures.

137
References
Agarwal, Ritu and Jayesh Prasad (1998), “A Conceptual and Operational Definition of
Personal Innovativeness in the Domain of Information Technology,” Information
Systems Research, 9 (2), 204-215.
Anderson, David R., Dennis J. Sweeney, Thomas A. Williams, Jeffrey D. Camm, and James
J. Cochran (2013), Statistics for Business and Economics, 12th Edition. Mason: South-
Western.
Baron, Reuben M. and David A. Kenny (1986), “The Moderator-Mediator Variable
Distinction in Social Psychological Research: Conceptual, Strategic, and Statistical
Considerations,” Journal of Personality and Social Psychology, 51 (6), 1173-1182.
Chandra, Shalini, Shirish C. Srivastava, and Yin-Leng Theng (2010), “Evaluating the Role of
Trust in Consumer Adoption of Mobile Payment Systems: An Empirical Analysis,”
Communications of the Association for Information Systems, 27 (1), 561-588.
Chen, Lei-da (2008), “A Model of Consumer Acceptance of Mobile Payment,” International
Journal of Mobile Communications, 6 (1), 32-52.
Cocosila, Mihail and Houda Trabelsi (2016), “An Integrated Value-Risk Investigation of
Contactless Mobile Payments Adoption,” Electronic Commerce Research and
Applications, 20 (November-December), 159-170.
Cohen, Jacob (1992), “A Power Primer,” Psychological Bulletin, 112 (1), 155-159.
Dahlberg, Tomi, Niina Mallat, Jan Ondrus, and Agnieszka Zmijewska (2008), “Past, Present,
and Future of Mobile Payments Research: A Literature Review,” Electronic
Commerce Research and Applications, 7 (2), 165-181.
―――, Jie Guo, and Jan Ondrus (2015), “A Critical Review of Mobile Payment Research,”
Electronic Commerce Research and Applications, 14 (5), 265-284.
138
Davis, Fred D. (1989), “Perceived Usefulness, Perceived Ease of Use, and User Acceptance
of Information Technology,” MIS Quarterly, 13 (3), 319-340.
――― (1993), “User Acceptance of Information Technology: System Characteristics, User
Perceptions, and Behavioral Impacts,” International Journal of Man-Machine Studies,
38 (3), 475-487.
de Kerviler, Gwarlann, Nathalie T. M. Demoulin, and Pietro Zidda (2016), “Adoption of In-
store Mobile Payment: Are Perceived Risk and Convenience the Only Drivers?,”
Journal of Retailing and Consumer Services, 31 (July), 334-344.
Dennehy, Denis and David Sammon (2015), “Trends in Mobile Payments Research: A
Literature Review,” Journal of Innovation Management, 3 (1), 49-61.
Ernst & Young (2015), “Mobile Payment: War of the Wallets,” (accessed August 4, 2017),
[available at http://www.ey.com/Publication/vwLUAssets/ey-mobile-payment-war-of-
wallets-nov-2015/$FILE/ey-mobile-payment-war-of-wallets-nov-2015.pdf].
European Payments Council (2017), “White Paper Mobile Payments,” (accessed July 25,
2017), [available at
https://www.europeanpaymentscouncil.eu/sites/default/files/KB/files/EPC492-
09%20v5.0%20White%20Paper%20Mobile%20Payments%20-
%20edition%202017.pdf].
Falk, Tomas, Werner H. Kunz, Jeroen J. L. Schepers, and Alexander J. Mrozek (2016), “How
Mobile Payment Influences the Overall Store Price Image,” Journal of Business
Research, 69, 2417-2423.
Fishbein, Martin and Icek Ajzen (1975), Belief, Attitude, Intention, and Behavior: An
Introduction to Theory and Research. Reading, MA: Addison-Wesley.
Hair, Joseph F., William C. Black, Barry J. Babin, and Rolph E. Anderson (2010),
Multivariate Data Analysis: A Global Perspective. New Jersey: Pearson.

139
Hayashi, Fumiko (2012), “Mobile Payments: What’s in It for Consumers?”, Economic Review
– Federal Reserve Bank of Kansas City, 1st Quarter, 35-66.
Hoehle, Hartmut, Eusebio Scornavacca, and Sid Huff (2012), “Three Decades of Research on
Consumer Adoption and Utilization of Electronic Banking Channels: A Literature
Analysis,” Decision Support Systems, 54 (1), 122-132.
IBM Support (2016), “Compute Mahalanobis Distance and Flag Multivariate Outliers,”
(accessed July 15, 2017), [available at http://www-
01.ibm.com/support/docview.wss?uid=swg21480128].
Kahneman, Daniel, Jack L. Knetsch, and Richard H. Thaler (1991), “Anomalies: The
Endowment Effect, Loss Aversion, and Status Quo Bias,” The Journal of Economic
Perspectives, 5 (Winter), 193-206.
Kim, Changsu, Mirsobit Mirusmonov, and In Lee (2010), “An Empirical Examination of
Factors Influencing the Intention to Use Mobile Payment,” Computers in Human
Behavior, 26 (3), 310-322.
Legris, Paul, John Ingham, and Pierre Collerette (2003), “Why Do People Use Information
Technology? A Critical Review of the Technology Acceptance Model,” Information
& Management, 40 (3), 191-204.
Mallat, Niina (2007), “Exploring Consumer Adoption of Mobile Payments – A Qualitative
Study,” The Journal of Strategic Information Systems, 16 (4), 413-432.
Mandrik, Carter A. and Yeqing Bao (2005), “Exploring the Concept and Measurement of
General Risk Aversion,” Advances in Consumer Research, 32 (1), 531-539.
Mobgen (2015), “The Mobile Payments Landscape and its Opportunities,” (accessed July 29,
2017), [available at https://www.accenture.com/t20160708T043705__w__/us-
en/_acnmedia/PDF-25/Accenture-Acquires-Mobgen-Expand-European-Mobile-
Payment-UK.pdf].

140
Nielsen (2016), “Mobile Money: From Shopping to Banking to Payments, How Mobile is
Transforming Commerce Around the World,” (accessed July 25, 2017), [available at
http://www.nielsen.com/content/dam/nielsenglobal/eu/docs/pdf/nielsen-global-mobile-
money-report.pdf].
OED Online (2017), “Information Technology,” (accessed September 9, 2017), [available at
http://www.oed.com/view/Entry/273052?redirectedFrom=information+technology#ei
d].
Oliveira, Tiago, Manoj Thomas, Goncalo Baptista, and Filipe Campos (2016), “Mobile
Payment: Understanding the Determinants of Customer Adoption and Intention to
Recommend the Technology,” Computers in Human Behavior, 61 (August), 404-414.
Perkins, Ben and Celine Fenech (2014), “The Deloitte Consumer Review: The Growing
Power of Consumers,” (accessed July 25, 2017), [available at
https://www2.deloitte.com/content/dam/Deloitte/uk/Documents/consumer-
business/consumer-review-8-the-growing-power-of-consumers.pdf].
Pham, Thanh-Thao T. and Jonathan C. Ho (2015), “The Effects of Product-related, Personal-
related Factors and Attractiveness of Alternatives on Consumer Adoption of NFC-
based Mobile Payments,” Technology in Society, 43 (November), 159-172.
Podsakoff, Philip M., Scott B. MacKenzie, Jeong-Yeon Lee, and Nathan P. Podsakoff (2003),
“Common Method Biases in Behavioral Research: A Critical Review of Literature and
Recommended Remedies,” Journal of Applied Psychology, 88 (5), 879-903.
Rabin, Matthew (1998), “Psychology and Economics,” Journal of Economic Literature, 36
(1), 11-46.
Rogers, Everett M. (2003), Diffusion of Innovations. New York: Free Press.
Samsung (2017), “Samsung Rewards,” (accessed September 10, 2017), [available at
https://www.samsung.com/us/samsung-pay/rewards/#catalog].

141
Sanakulov, Nodir and Heikki Karjaluoto (2015), “Consumer Adoption of Mobile
Technologies: A Literature Review,” International Journal of Mobile
Communications, 13 (3), 244-275.
Schierz, Paul Gerhardt, Oliver Schilke, and Bernd W. Wirtz (2010), “Understanding
Consumer Acceptance of Mobile Payment Services: An Empirical Analysis,”
Electronic Commerce Research and Applications, 9 (3), 209-216.
Shaikh, Aijaz A. and Heikki Karjaluoto (2015), “Mobile Banking Adoption: A Literature
Review,” Telematics and Informatics, 32 (1), 129-142.
Shaw, Norman (2014), “The Mediating Influence of Trust in the Adoption of the Mobile
Wallet,” Journal of Retailing and Consumer Services, 21 (4), 449-459.
Shin, Dong-Hee (2009), “Towards an Understanding of the Consumer Acceptance of Mobile
Wallet,” Computers in Human Behavior, 25, 1343-1354.
Slade, Emma, Michael Williams, Yogesh Dwivedi, and Niall Piercy (2015), “Exploring
Consumer Adoption of Proximity Mobile Payments,” Journal of Strategic Marketing,
23 (3), 209-223.
Soman, Dilip (2003), “The Effect of Payment Transparency on Consumption: Quasi-
Experiments from the Field,” Marketing Letters, 14 (3), 172-183.
SoSciSurvey (2017), “Additional Variables in the Data Set,” (accessed June 18, 2017),
[available at https://www.soscisurvey.de/help/doku.php/en:results:variables].
Square (2017), “Payment Tokenization Explained,” (accessed September 10, 2017),
[available at https://squareup.com/townsquare/what-does-tokenization-actually-mean].
Statista (2017a), “Number of Smartphone Users Worldwide from 2014 to 2020 (in Billions),”
(accessed July 9, 2017), [available at
https://www.statista.com/statistics/330695/number-of-smartphone-users-worldwide/].

142
――― (2017b), “Users in the Mobile Payments Market,” (accessed July 9, 2017) [available
at https://www.statista.com/outlook/331/100/mobile-payments/worldwide#market-
users].
――― (2017c), “Transaction Value in the Mobile Payments Market,” (accessed July 9,
2017) [available at https://www.statista.com/outlook/331/100/mobile-
payments/worldwide#market-transactionValue].
――― (2017d), “Global Comparison – Transaction Value in the Mobile Payments Market,”
(accessed July 9, 2017), [available at
https://www.statista.com/outlook/331/100/mobile-payments/worldwide#market-
globalTransactionValue].
――― (2017e), “Users in the Digital Payments Market,” (accessed July 9, 2017), [available
at https://www.statista.com/outlook/296/100/digital-payments/worldwide#market-
users].
――― (2017f), “Transaction Value in the Digital Payments Market,” (accessed July 9,
2017), [available at https://www.statista.com/outlook/296/100/digital-
payments/worldwide#market-transactionValue].
――― (2017g), “Market Definition: Mobile Payments,” (accessed September 3, 2017),
[available at https://www.statista.com/outlook/331/100/mobile-
payments/worldwide#].
――― (2017h), “Market Definition: Digital Payments,” (accessed September 3, 2017),
[available at https://www.statista.com/outlook/296/100/digital-payments/worldwide#].
Stevens, James P. (2009), Applied Multivariate Statistics for the Social Sciences. New York:
Routledge.
Tabachnik, Barbara G. and Linda S. Fidell (2007), Using Multivariate Statistics. Boston:
Pearson.

143
Taylor, Emmeline (2016), “Mobile Payment Technologies in Retail: A Review of Potential
Benefits and Risks,” International Journal of Retail & Distribution Management, 44
(2), 159-177.
Tversky, Amos and Daniel Kahneman (1992), “Advances in Prospect Theory: Cumulative
Representation of Uncertainty,” Journal of Risk and Uncertainty, 5 (4), 297-323.
Venkatesh, Viswanath and Fred D. Davis (2000), “A Theoretical Extension of the
Technology Acceptance Model: Four Longitudinal Field Studies,” Management
Science, 46 (2), 186-204.
―――, Michael G. Morris, Gordon B. Davis, and Fred D. Davis (2003), “User Acceptance
of Information Technology: Toward a Unified View,” MIS Quarterly, 27 (3), 425-478.
―――, James Y. L. Thong, and Xin Xu (2012), “Consumer Acceptance and Use of
Information Technology: Extending the Unified Theory of Acceptance and Use of
Technology,” MIS Quarterly, 36 (1), 157-178.
Wei-Han Tan, Garry, Keng-Boon Ooi, Siong-Choy Chong, and Teck-Soon Hew (2014),
“NFC Mobile Credit Card: The Next Frontier of Mobile Payment?,” Telematics and
Informatics, 31 (2), 292-307.
Yang, Shuiqing, Yaobin Lu, Sumeet Gupta, Yuzhi Cao, and Rui Zhang (2012), “Mobile
Payment Services Adoption Across Time: An Empirical Study of the Effects of
Behavioral Beliefs, Social Influences, and Personal Traits,” Computers in Human
Behavior, 28 (1), 129-142.
Yang, Yongqing, Yong Liu, Hongxiu Li, and Benhai Yu (2015), “Understanding Perceived
Risks in Mobile Payment Acceptance,” Industrial Management and Data Systems, 115
(2), 253-269.

144
Zhang, Liyi, Jing Zhu, and Qihua Liu (2012), “A Meta-Analysis of Mobile Commerce
Adoption and the Moderating Effect of Culture,” Computers in Human Behavior, 28
(5), 1902-1911.