
Factors driving California pocket mice (Chaetodipus ...
12
1 Journal of Mammalogy, XX(X):1–12, 2021 DOI:10.1093/jmammal/gyab067 © The Author(s) 2021. Published by Oxford University Press on behalf of the American Society of Mammalogists, www.mammalogy.org. Factors driving California pocket mice (Chaetodipus californicus) population dynamics Vratika Chaudhary,* , William D. Tietje, Anne Y. Polyakov, Virginie Rolland, and Madan K. Oli Department of Wildlife Ecology and Conservation, University of Florida, Newins-Zeigler Hall, Gainesville, FL 32611, USA (VC, MKO) Department of Environmental Science, Policy and Management, University of California, Mulford Hall, 130 Hilgard Way, Berkeley, CA 94720, USA (WDT, AYP) Department of Biological Sciences, Arkansas State University, P.O. Box 599, Jonesboro, AR 72467, USA (VR) * Correspondent: chaudharyv@ufl.edu Understanding how demographic parameters respond to climatic variables is essential for predicting species’ response to changing environmental conditions. The California pocket mouse (Chaetodipus californicus) is an inhabitant of coastal-central California oak (Quercus spp.) woodland that is undergoing a rapid anthropogenic transformation while also facing effects of global climate change. We analyzed the population dynamics of the California pocket mouse by applying Pradel’s temporal symmetry model to a 10-year (2004 – 2013) capture– mark–recapture data set to estimate survival and recruitment rates and realized population growth rate. The overall monthly apparent survival probability (ϕ) was 0.76 ± 0.01 SE and was slightly higher in the dry season (0.79 ± 0.02 SE) than the wet season (0.74 ± 0.01 SE). Coefficients of variation (CV) of temperature and rainfall (with and without a one-season lag), average seasonal temperature, and regional climatic variation (El Niño index) positively influenced ϕ. Overall monthly recruitment rate (f) was 0.17 ± 0.01 SE but varied seasonally; f was substantially higher during the dry season (0.39 ± 0.04 SE) than the wet season (0.09 ± 0.02 SE). Average seasonal temperature, CV of temperature and rainfall (without a one-season lag), and total seasonal rainfall (with a one- season lag) positively influenced recruitment, whereas regional climatic variation (El Niño index), total seasonal rainfall (without a one-season lag), and CV of rainfall (with a one-season lag) had a negative effect on f. Monthly realized population growth rate (λ) was 1.00 ± 0.02 SE (or 0.07 ± 0.02 SE annually) for the entire study period, but it varied temporally. Our study provides the first estimates of demographic parameters for the California pocket mouse and tests for the influence of climatic variables on these parameters. Although the California pocket mouse population remained relatively stable during our study (as indicated by λ = 1.00), changing climate and anthropogenic influences on California oak woodland could adversely influence demographic parameters and population dynamics and might also indicate effects of climate change on its ecologically sensitive habitat. Key words: capture–mark–recapture analysis, climatic effects, demographic parameters, population dynamics, population growth rate, Pradel’s model, recruitment, survival Knowledge of demographic parameters and factors and pro- cesses influencing them is necessary for understanding popu- lation dynamics and persistence, and the structure and function of ecological communities (Chesson et al. 2004; Thibault and Brown 2008; Thibault et al. 2010; Nichols et al. 2011; Allington et al. 2013). Because small mammals have short generation times and their field studies are logistically less challenging than those of large mammals, they often are used as model or- ganisms for studies of population and community dynamics, behavioral ecology, and disease ecology (Fryxell et al. 1998; Ostfeld et al. 1998; Ernest et al. 2008; Krebs 2013; Krebs et al. 2013). Understanding the relationship between population dy- namics and environmental factors can hold the key to the long- term viability of small mammal species and for maintenance of ecological niches they occupy. The hypothesis that abiotic factors are the primary drivers of small mammal population dynamics is well tested and continues to receive considerable empirical support Downloaded from https://academic.oup.com/jmammal/advance-article/doi/10.1093/jmammal/gyab067/6315977 by University of Florida user on 26 July 2021
Transcript of Factors driving California pocket mice (Chaetodipus ...

1
Journal of Mammalogy, XX(X):1–12, 2021DOI:10.1093/jmammal/gyab067
© The Author(s) 2021. Published by Oxford University Press on behalf of the American Society of Mammalogists, www.mammalogy.org.
Factors driving California pocket mice (Chaetodipus californicus) population dynamics
Vratika Chaudhary,*, William D. Tietje, Anne Y. Polyakov, Virginie Rolland, and Madan K. Oli
Department of Wildlife Ecology and Conservation, University of Florida, Newins-Zeigler Hall, Gainesville, FL 32611, USA (VC, MKO)Department of Environmental Science, Policy and Management, University of California, Mulford Hall, 130 Hilgard Way, Berkeley, CA 94720, USA (WDT, AYP)Department of Biological Sciences, Arkansas State University, P.O. Box 599, Jonesboro, AR 72467, USA (VR)
* Correspondent: [email protected]
Understanding how demographic parameters respond to climatic variables is essential for predicting species’ response to changing environmental conditions. The California pocket mouse (Chaetodipus californicus) is an inhabitant of coastal-central California oak (Quercus spp.) woodland that is undergoing a rapid anthropogenic transformation while also facing effects of global climate change. We analyzed the population dynamics of the California pocket mouse by applying Pradel’s temporal symmetry model to a 10-year (2004 – 2013) capture–mark–recapture data set to estimate survival and recruitment rates and realized population growth rate. The overall monthly apparent survival probability (ϕ) was 0.76 ± 0.01 SE and was slightly higher in the dry season (0.79 ± 0.02 SE) than the wet season (0.74 ± 0.01 SE). Coefficients of variation (CV) of temperature and rainfall (with and without a one-season lag), average seasonal temperature, and regional climatic variation (El Niño index) positively influenced ϕ. Overall monthly recruitment rate (f) was 0.17 ± 0.01 SE but varied seasonally; f was substantially higher during the dry season (0.39 ± 0.04 SE) than the wet season (0.09 ± 0.02 SE). Average seasonal temperature, CV of temperature and rainfall (without a one-season lag), and total seasonal rainfall (with a one-season lag) positively influenced recruitment, whereas regional climatic variation (El Niño index), total seasonal rainfall (without a one-season lag), and CV of rainfall (with a one-season lag) had a negative effect on f. Monthly realized population growth rate (λ) was 1.00 ± 0.02 SE (or 0.07 ± 0.02 SE annually) for the entire study period, but it varied temporally. Our study provides the first estimates of demographic parameters for the California pocket mouse and tests for the influence of climatic variables on these parameters. Although the California pocket mouse population remained relatively stable during our study (as indicated by λ = 1.00), changing climate and anthropogenic influences on California oak woodland could adversely influence demographic parameters and population dynamics and might also indicate effects of climate change on its ecologically sensitive habitat.
Key words: capture–mark–recapture analysis, climatic effects, demographic parameters, population dynamics, population growth rate, Pradel’s model, recruitment, survival
Knowledge of demographic parameters and factors and pro-cesses influencing them is necessary for understanding popu-lation dynamics and persistence, and the structure and function of ecological communities (Chesson et al. 2004; Thibault and Brown 2008; Thibault et al. 2010; Nichols et al. 2011; Allington et al. 2013). Because small mammals have short generation times and their field studies are logistically less challenging than those of large mammals, they often are used as model or-ganisms for studies of population and community dynamics,
behavioral ecology, and disease ecology (Fryxell et al. 1998; Ostfeld et al. 1998; Ernest et al. 2008; Krebs 2013; Krebs et al. 2013). Understanding the relationship between population dy-namics and environmental factors can hold the key to the long-term viability of small mammal species and for maintenance of ecological niches they occupy.
The hypothesis that abiotic factors are the primary drivers of small mammal population dynamics is well tested and continues to receive considerable empirical support
applyparastyle "fig//caption/p[1]" parastyle "FigCapt"applyparastyle "fig" parastyle "Figure"
Dow
nloaded from https://academ
ic.oup.com/jm
amm
al/advance-article/doi/10.1093/jmam
mal/gyab067/6315977 by U
niversity of Florida user on 26 July 2021

2 JOURNAL OF MAMMALOGY
(Holmgren et al. 2006; Kelt 2011). The influence of abiotic factors on population dynamics is better understood in arid and semiarid environments because these are resource-limited regions with highly variable weather patterns (Kelt 2011; Mason-Romo et al. 2017). Intense rainfall events often lead to pulses of high primary productivity that can cause periodic population outbreaks (Beatley 1969; Lima et al. 1999; Orland and Kelt 2007). While long periods of drought can lead to se-vere population declines, which can adversely impact popula-tion persistence (Dickman et al. 2001; Greenville et al. 2012), climatic impacts on small mammal demography and popula-tion dynamics usually are not consistent across species with different life-history traits or habitat requirements (Hernández et al. 2005). Species-specific responses to abiotic factors could reset long-term population trends and, together with biotic interactions, alter structure of small mammal communities (Thibault and Brown 2008). Furthermore, species-specific re-sponses of small mammals can be used as an indicator of cli-mate change-induced alterations of ecological systems.
Semiarid, coastal-central California oak (Quercus spp.) woodland is undergoing a rapid anthropogenic transformation
whilst also facing the effects of global climate change. Human activities at the interface of residential development and wildland have resulted in the loss of native shrublands (Syphard et al. 2017). Human-caused ignitions also have dramatically in-creased frequency and intensity of large wildfires (Keeley and Fotheringham 2001); the area burned in southwestern California is predicted to nearly double by mid-century (Yue et al. 2014). These habitat alterations are exacerbated by environmental changes that are occurring rapidly and are expected to continue (Intergovernmental Panel on Climate Change 2014).
We studied the demography and population dynamics of the California pocket mouse (Chaetodipus californicus), a small rodent occurring in the central-coastal range woodland of southern California. It has a relatively narrow distribution that extends along the California coast from San Francisco Bay and the San Joaquin Valley south through Baja California and along the Western Sierra Nevada (Fig. 1). Throughout its distribution, it occupies semiarid shrublands and woodlands that are under-going some of the most pervasive and rapid anthropogenic and environmental changes globally (Alagona et al. 2013). Since the 1970s, urban sprawl into formerly wildland areas has
Fig. 1.—Distribution of the California pocket mouse (Chaetodipus californicus; gray shading) in California, United States, and Baja California (adapted from Zeiner et al. 1988), and location of the National Guard Post Camp Roberts study site. Inset shows the 22 trapping plots (solid squares) that were sampled in 2004–2013.
Dow
nloaded from https://academ
ic.oup.com/jm
amm
al/advance-article/doi/10.1093/jmam
mal/gyab067/6315977 by U
niversity of Florida user on 26 July 2021
CHAUDHARY ET AL.—POPULATION DYNAMICS OF CALIFORNIA POCKET MICE 3
proceeded at an ever-accelerating rate. Because the California pocket mouse occupies a narrow area in an ecologically sensi-tive system that is experiencing diverse, rapid, and widespread alterations, investigating the population dynamics of this little-studied California heteromyid will not only provide essential information about the species but also can serve as an indicator of the climate change-induced alterations of coastal woodlands of central California.
Here, we applied temporal symmetry capture–mark–recap-ture (CMR) models (Pradel 1996; Williams et al. 2002; Nichols 2016) to a 10-year data set (2004–2013) to (1) provide estimates of apparent survival probability (ϕ), recruitment rate (f), and realized population growth rate (λ); and (2) investigate the in-fluence of sex, season, and climatic variables (e.g., temperature and rainfall and their variability) on ϕ, f, and thus on λ. Given that our study species inhabits a rainfall-limited, semiarid envi-ronment, we expected rainfall to positively influence ϕ and f; in contrast, we expected that temperature would negatively influ-ence these demographic parameters. Specifically, we predicted that ϕ and f will be (1) positively influenced by total seasonal rainfall (with and without a one-season lag) via a current season and a delayed increase in plant growth and seed production; (2) negatively influenced by temperature, particularly during the dry season; (3) negatively influenced by variability in tempera-ture and rainfall due to unpredictability in primary production (Huxman et al. 2004); and (4) will be positively affected by El Niño events (a measure of regional climatic variability) due to increased local precipitation.
Materials and MethodsStudy species.—The California pocket mouse is a nocturnal,
mostly solitary, granivore that spends most of the day in its burrow (Tucker 1966). To keep the temperature low and hu-midity high during the day, pocket mice usually occlude the en-trances to their burrows (French 1977). The burrow is used for caches of seeds of forbs and grasses (Tucker 1965), care of neo-nates, and moderation of microclimate and to reduce vulnera-bility to predation and wildfires. The California pocket mouse can enter diurnal torpor for up to 24 h (Merritt 1985), an adap-tation for energy conservation during periods of food shortage (Tucker 1965). Aboveground activity essentially is restricted to nocturnal foraging and mate finding. From April through July, the one annual litter of about four young (range: 2 – 7) is pro-duced in the burrow nest (Eisenberg and Isaac 1963).
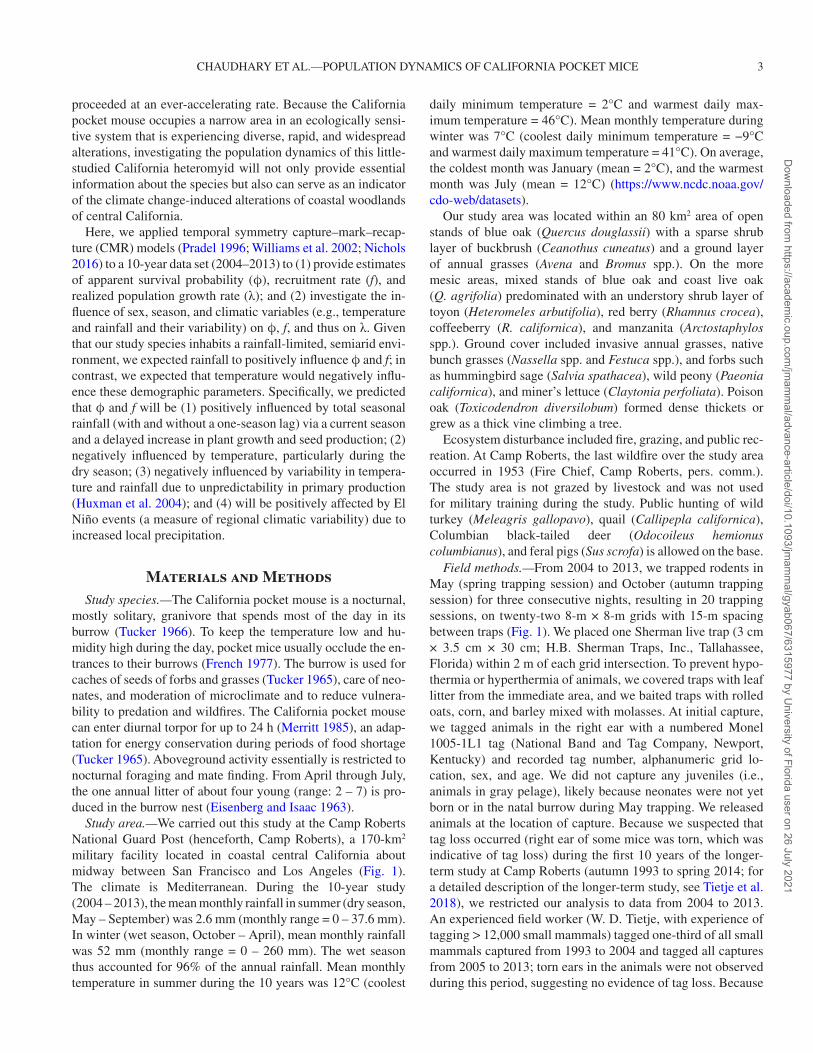
Study area.—We carried out this study at the Camp Roberts National Guard Post (henceforth, Camp Roberts), a 170-km2 military facility located in coastal central California about midway between San Francisco and Los Angeles (Fig. 1). The climate is Mediterranean. During the 10-year study (2004 – 2013), the mean monthly rainfall in summer (dry season, May – September) was 2.6 mm (monthly range = 0 – 37.6 mm). In winter (wet season, October – April), mean monthly rainfall was 52 mm (monthly range = 0 – 260 mm). The wet season thus accounted for 96% of the annual rainfall. Mean monthly temperature in summer during the 10 years was 12°C (coolest
daily minimum temperature = 2°C and warmest daily max-imum temperature = 46°C). Mean monthly temperature during winter was 7°C (coolest daily minimum temperature = −9°C and warmest daily maximum temperature = 41°C). On average, the coldest month was January (mean = 2°C), and the warmest month was July (mean = 12°C) (https://www.ncdc.noaa.gov/cdo-web/datasets).
Our study area was located within an 80 km2 area of open stands of blue oak (Quercus douglassii) with a sparse shrub layer of buckbrush (Ceanothus cuneatus) and a ground layer of annual grasses (Avena and Bromus spp.). On the more mesic areas, mixed stands of blue oak and coast live oak (Q. agrifolia) predominated with an understory shrub layer of toyon (Heteromeles arbutifolia), red berry (Rhamnus crocea), coffeeberry (R. californica), and manzanita (Arctostaphylos spp.). Ground cover included invasive annual grasses, native bunch grasses (Nassella spp. and Festuca spp.), and forbs such as hummingbird sage (Salvia spathacea), wild peony (Paeonia californica), and miner’s lettuce (Claytonia perfoliata). Poison oak (Toxicodendron diversilobum) formed dense thickets or grew as a thick vine climbing a tree.
Ecosystem disturbance included fire, grazing, and public rec-reation. At Camp Roberts, the last wildfire over the study area occurred in 1953 (Fire Chief, Camp Roberts, pers. comm.). The study area is not grazed by livestock and was not used for military training during the study. Public hunting of wild turkey (Meleagris gallopavo), quail (Callipepla californica), Columbian black-tailed deer (Odocoileus hemionus columbianus), and feral pigs (Sus scrofa) is allowed on the base.
Field methods.—From 2004 to 2013, we trapped rodents in May (spring trapping session) and October (autumn trapping session) for three consecutive nights, resulting in 20 trapping sessions, on twenty-two 8-m × 8-m grids with 15-m spacing between traps (Fig. 1). We placed one Sherman live trap (3 cm × 3.5 cm × 30 cm; H.B. Sherman Traps, Inc., Tallahassee, Florida) within 2 m of each grid intersection. To prevent hypo-thermia or hyperthermia of animals, we covered traps with leaf litter from the immediate area, and we baited traps with rolled oats, corn, and barley mixed with molasses. At initial capture, we tagged animals in the right ear with a numbered Monel 1005-1L1 tag (National Band and Tag Company, Newport, Kentucky) and recorded tag number, alphanumeric grid lo-cation, sex, and age. We did not capture any juveniles (i.e., animals in gray pelage), likely because neonates were not yet born or in the natal burrow during May trapping. We released animals at the location of capture. Because we suspected that tag loss occurred (right ear of some mice was torn, which was indicative of tag loss) during the first 10 years of the longer-term study at Camp Roberts (autumn 1993 to spring 2014; for a detailed description of the longer-term study, see Tietje et al. 2018), we restricted our analysis to data from 2004 to 2013. An experienced field worker (W. D. Tietje, with experience of tagging > 12,000 small mammals) tagged one-third of all small mammals captured from 1993 to 2004 and tagged all captures from 2005 to 2013; torn ears in the animals were not observed during this period, suggesting no evidence of tag loss. Because
Dow
nloaded from https://academ
ic.oup.com/jm
amm
al/advance-article/doi/10.1093/jmam
mal/gyab067/6315977 by U
niversity of Florida user on 26 July 2021

4 JOURNAL OF MAMMALOGY
Jung et al. (2020) consider 5 years of experience and tagging of > 10,000 animals as “high level of experience,” we are con-fident that there was almost no tag loss during the 2005 – 2013 study period. Using our field records, trap mortality was neg-ligible (1.31%). Capture and handling followed the guidelines of the University of California, Berkeley, Institutional Animal Care and Use Committee (University of California, Berkeley Permit R-126A) and guidelines of the American Society of Mammalogists (Sikes et al. 2016).
Climatic covariates.—We defined the 5-month period (May – October) between spring and autumn trapping sessions as “dry season” and the 7-month period (October – April) be-tween autumn and spring trapping sessions as “wet season.” We tested for the influence of the following covariates on pocket mice demographics: (1) average seasonal atmospheric tempera-ture; (2) total seasonal precipitation; (3) coefficient of variation (CV) of average seasonal temperature and total seasonal pre-cipitation; (4) a one-season lag in total precipitation and its CV to account for the delayed response of populations to precipita-tion; and (5) regional temperature and precipitation oscillations caused by El Niño. All climatic covariates were standardized to a mean of zero and a SD of 1 (Schroeder et al. 2016).
We used atmospheric temperature and rainfall data recorded at the National Oceanographic and Atmospheric Agency’s (NOAA) Paso Robles City weather station (35.66°N, 120.69°W) situated 11.7 km from the study area (National Oceanographic and Atmospheric Administration 2016). Seasonal averages were computed using monthly data. We tested for effects of El Niño on demographic parameters of California pocket mouse using monthly values of Oceanic Niño Index (ONI). This index tracks average sea-surface temperature in the equatorial Pacific Ocean. El Niño conditions occur when the average sea-surface temperature of three consecutive months is 0.5°C above average temperature and La Niña conditions occur when the average sea-surface temperature is 0.5°C below average temperature. We obtained the ONI value from the National Oceanographic and Atmospheric Agency Climate Prediction Center (www.cpc.noaa.gov/products/analysis_monitoring).
Data analysis.—Capture-mark-recapture models have been used extensively for estimating survival, recruitment, and
population growth rates of small mammals (Lima et al. 2003; Kelt 2011). The models require encounter history data from re-peated sampling of individually marked animals, thereby ac-counting for animals that although present on the study site, might not be detected in all successive trapping sessions. We used the ϕ–f parameterization of Pradel’s CMR model because this approach permitted simultaneous estimation of recapture probability (p), ϕ, and f, in a single likelihood (Pradel 1996). We used an all-combination modeling strategy (Doherty et al. 2012) to estimate p, ϕ, and f and to test for the influence of time (i.e., trapping sessions), sex, and season (wet or dry season), and climatic covariates (only on ϕ and f) on aforementioned parameters. We specifically tested for (1) singular, additive, and interactive effects of time, sex, and season on p; (2) sin-gular effects of environmental covariates (one variable at a time) on ϕ and f; and (3) additive and interactive effects of cli-matic covariates, sex, and season on ϕ and f (Table 1). Because several climatic covariates were highly correlated, we did not test for additive or interactive effects of ≥ 2 climatic covariates in the same model (Supplementary Data SD1). We estimated overall, sex-specific, seasonal, and time-specific estimates of the realized λ using the ϕ–λ parameterization of Pradel’s CMR model; we included top model for ϕ from ϕ–f parameterization and overall sex-specific, seasonal, and time-specific effects on ϕ (Pradel 1996; Williams et al. 2002; Nichols 2016).
We undertook all CMR analyses using program MARK (White and Burnham 1999) version 6.2 accessed using the RMark package (Laake and Rexstad 2008) for the R program-ming language (R Development Core Team 2020). We car-ried out the RELEASE (test 2 and 3) goodness-of-fit (GOF) test to test the null hypothesis that the general time-dependent Cormack–Jolly–Seber model fits our data using the release.gof function in RMark (Burnham et al. 1987, 2011). GOF test tests for the violation of the assumption that every marked animal has the same probability of capture, there is no tag loss, and that animals marked during any instance have an equal probability of survival (Burnham et al. 1987). We used an information-theoretic approach for model selection and statistical infer-ence, based on Akaike Information Criteria corrected for small sample size (AICc—Burnham et al. 1987, 2011). We considered
Table 1.—Model comparison presenting the top five models estimating recapture probability (p), survival probability (ϕ), and recruitment rate (f) and testing for the influence of time (i.e., trapping sessions), sex, season (wet season, May–October or dry season, November–April), and climatic covariates (only on ϕ and f) on the aforementioned parameters of the California pocket mouse (Chaetodipus californicus), at Camp Ro-berts, California. The table lists the number of parameters (K), Akaike information criterion corrected for small sample size (AICc), the difference in AICc value from the best-supported model (∆AICc), and the relative model probability (weight) for the five best-supported models. Additive effects are indicated by a “+,” and additive and interactive effects are indicated by “*.” Models were ranked based on the AICc values.
Model K AICc ∆AICc Weight
ϕ(rain_cv_onelaga * season) p(time) f(rain_sum_onelagb * season) 28 8000.16 0.00 0.84ϕ(rain_cv_onelag + sex * season) p(time) f(rain_sum_onelag * season) 29 8004.45 4.28 0.10ϕ(rain_cv_onelag + season) p(time) f(rain_sum_onelag * season) 27 8007.30 7.14 0.02ϕ(rain_cv_onelag + sex + season) p(time) f(rain_sum_onelag * season) 28 8008.01 7.84 0.02ϕ(rain_cvc * sex) p(time) f(rain_sum_onelag * season) 28 8009.21 9.05 0.01
arain_cv_onelag = coefficient of variation (CV) of seasonal rainfall from the season prior to capture.brain_sum_onelag = total seasonal rainfall from the season prior to capture.crain_cv = coefficient of variation (CV) of rainfall during season of capture.
Dow
nloaded from https://academ
ic.oup.com/jm
amm
al/advance-article/doi/10.1093/jmam
mal/gyab067/6315977 by U
niversity of Florida user on 26 July 2021
CHAUDHARY ET AL.—POPULATION DYNAMICS OF CALIFORNIA POCKET MICE 5
models within ∆AICc of 2 to be equivalent. Overall, sex, and season-specific estimates of demographic parameters were based on the most parsimonious model testing for the constant, sex, and season-specific effect on the demographic parameter. Covariate effects on ϕ or f were considered to be substantial if the associated 95% confidence interval of the corresponding slope parameter does not include zero (Grosbois et al. 2008; Hardouin et al. 2014). Significance of the influence of climatic covariates on demographic parameters was assessed using an analysis of deviance (ANODEV), and the proportion of vari-ance in ϕ and f explained by a climatic covariate was estimated using R2
dev (Grosbois et al. 2008; Gimenez and Barbraud 2017):
R2dev =
devianceconstant model − deviancecovariate model
devianceconstant model − deviancetime−dependent model,
where devianceconstant model refers to the deviance of the null model for the parameter being tested while holding other parameters at the general structure (time-specific), deviancecovariate model refers to the deviance of the model testing for the influence of the covariate of the parameter being tested while holding other parameters at the general structure (time-specific), and deviancetime refers to all the parameters at the general structure (time-specific).
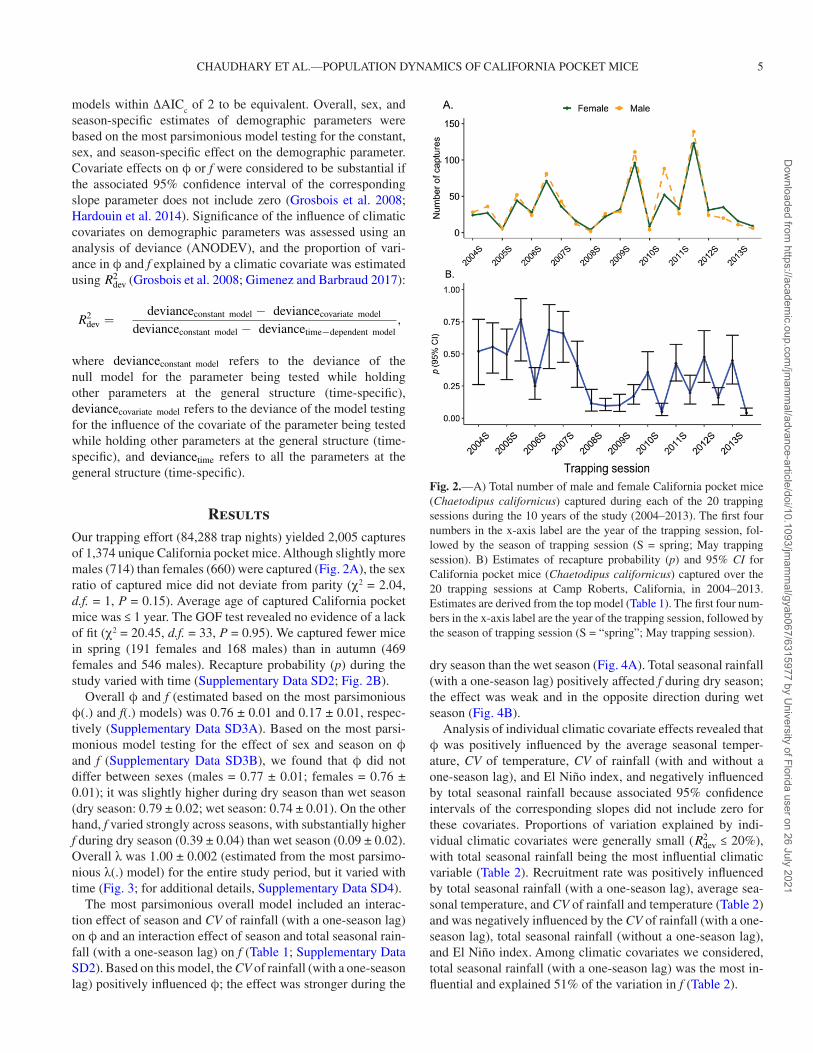
ResultsOur trapping effort (84,288 trap nights) yielded 2,005 captures of 1,374 unique California pocket mice. Although slightly more males (714) than females (660) were captured (Fig. 2A), the sex ratio of captured mice did not deviate from parity (χ 2 = 2.04, d.f. = 1, P = 0.15). Average age of captured California pocket mice was ≤ 1 year. The GOF test revealed no evidence of a lack of fit (χ 2 = 20.45, d.f. = 33, P = 0.95). We captured fewer mice in spring (191 females and 168 males) than in autumn (469 females and 546 males). Recapture probability (p) during the study varied with time (Supplementary Data SD2; Fig. 2B).
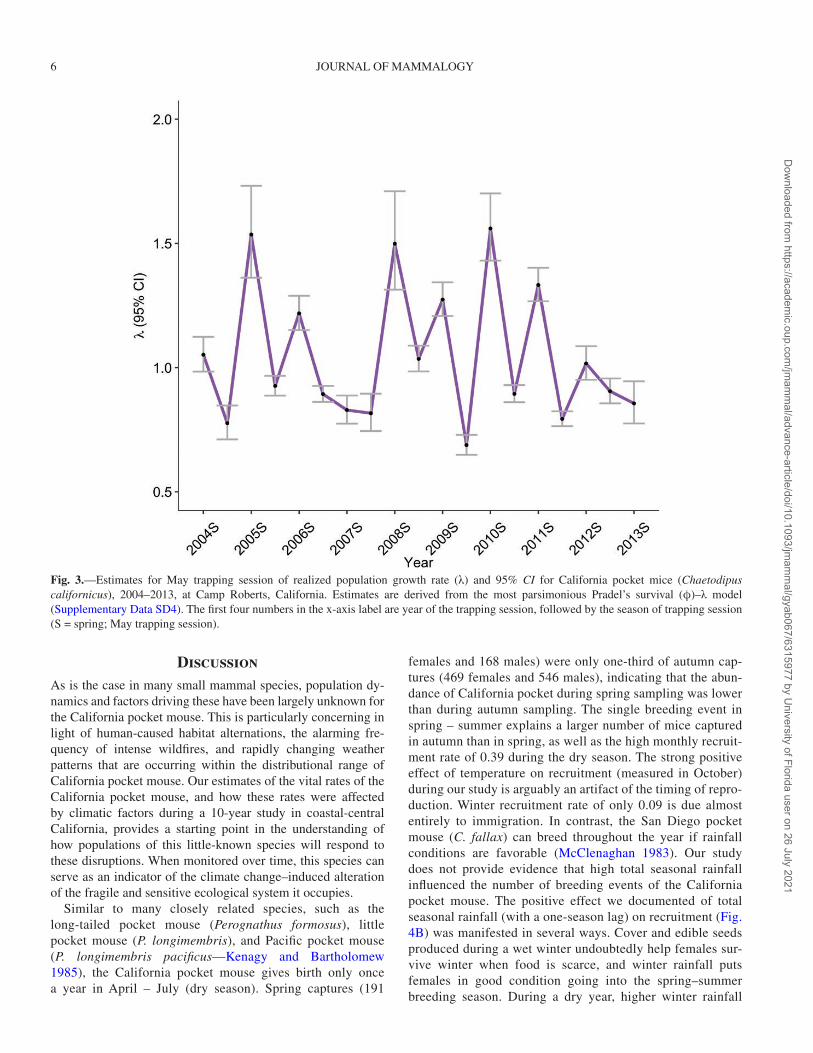
Overall ϕ and f (estimated based on the most parsimonious ϕ(.) and f(.) models) was 0.76 ± 0.01 and 0.17 ± 0.01, respec-tively (Supplementary Data SD3A). Based on the most parsi-monious model testing for the effect of sex and season on ϕ and f (Supplementary Data SD3B), we found that ϕ did not differ between sexes (males = 0.77 ± 0.01; females = 0.76 ± 0.01); it was slightly higher during dry season than wet season (dry season: 0.79 ± 0.02; wet season: 0.74 ± 0.01). On the other hand, f varied strongly across seasons, with substantially higher f during dry season (0.39 ± 0.04) than wet season (0.09 ± 0.02). Overall λ was 1.00 ± 0.002 (estimated from the most parsimo-nious λ(.) model) for the entire study period, but it varied with time (Fig. 3; for additional details, Supplementary Data SD4).
The most parsimonious overall model included an interac-tion effect of season and CV of rainfall (with a one-season lag) on ϕ and an interaction effect of season and total seasonal rain-fall (with a one-season lag) on f (Table 1; Supplementary Data SD2). Based on this model, the CV of rainfall (with a one-season lag) positively influenced ϕ; the effect was stronger during the
dry season than the wet season (Fig. 4A). Total seasonal rainfall (with a one-season lag) positively affected f during dry season; the effect was weak and in the opposite direction during wet season (Fig. 4B).
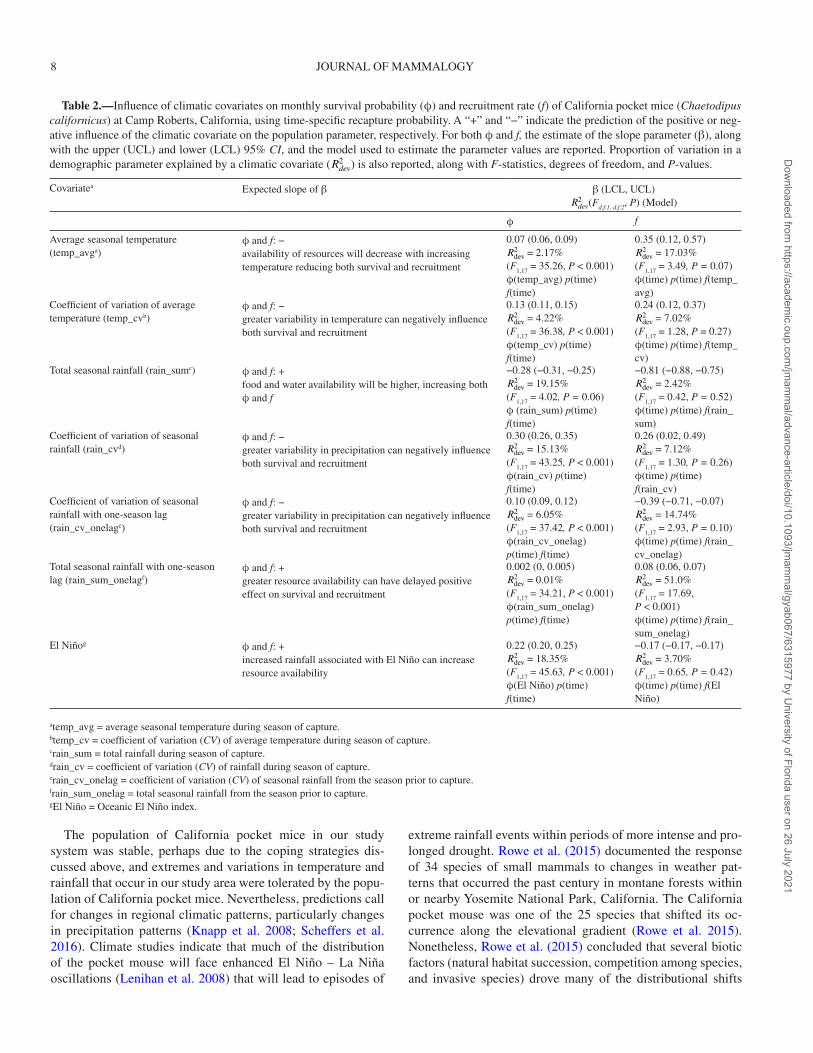
Analysis of individual climatic covariate effects revealed that ϕ was positively influenced by the average seasonal temper-ature, CV of temperature, CV of rainfall (with and without a one-season lag), and El Niño index, and negatively influenced by total seasonal rainfall because associated 95% confidence intervals of the corresponding slopes did not include zero for these covariates. Proportions of variation explained by indi-vidual climatic covariates were generally small (R2
dev ≤ 20%), with total seasonal rainfall being the most influential climatic variable (Table 2). Recruitment rate was positively influenced by total seasonal rainfall (with a one-season lag), average sea-sonal temperature, and CV of rainfall and temperature (Table 2) and was negatively influenced by the CV of rainfall (with a one-season lag), total seasonal rainfall (without a one-season lag), and El Niño index. Among climatic covariates we considered, total seasonal rainfall (with a one-season lag) was the most in-fluential and explained 51% of the variation in f (Table 2).
Fig. 2.—A) Total number of male and female California pocket mice (Chaetodipus californicus) captured during each of the 20 trapping sessions during the 10 years of the study (2004–2013). The first four numbers in the x-axis label are the year of the trapping session, fol-lowed by the season of trapping session (S = spring; May trapping session). B) Estimates of recapture probability (p) and 95% CI for California pocket mice (Chaetodipus californicus) captured over the 20 trapping sessions at Camp Roberts, California, in 2004–2013. Estimates are derived from the top model (Table 1). The first four num-bers in the x-axis label are the year of the trapping session, followed by the season of trapping session (S = “spring”; May trapping session).
Dow
nloaded from https://academ
ic.oup.com/jm
amm
al/advance-article/doi/10.1093/jmam
mal/gyab067/6315977 by U
niversity of Florida user on 26 July 2021
6 JOURNAL OF MAMMALOGY
DiscussionAs is the case in many small mammal species, population dy-namics and factors driving these have been largely unknown for the California pocket mouse. This is particularly concerning in light of human-caused habitat alternations, the alarming fre-quency of intense wildfires, and rapidly changing weather patterns that are occurring within the distributional range of California pocket mouse. Our estimates of the vital rates of the California pocket mouse, and how these rates were affected by climatic factors during a 10-year study in coastal-central California, provides a starting point in the understanding of how populations of this little-known species will respond to these disruptions. When monitored over time, this species can serve as an indicator of the climate change–induced alteration of the fragile and sensitive ecological system it occupies.
Similar to many closely related species, such as the long-tailed pocket mouse (Perognathus formosus), little pocket mouse (P. longimembris), and Pacific pocket mouse (P. longimembris pacificus—Kenagy and Bartholomew 1985), the California pocket mouse gives birth only once a year in April – July (dry season). Spring captures (191
females and 168 males) were only one-third of autumn cap-tures (469 females and 546 males), indicating that the abun-dance of California pocket during spring sampling was lower than during autumn sampling. The single breeding event in spring – summer explains a larger number of mice captured in autumn than in spring, as well as the high monthly recruit-ment rate of 0.39 during the dry season. The strong positive effect of temperature on recruitment (measured in October) during our study is arguably an artifact of the timing of repro-duction. Winter recruitment rate of only 0.09 is due almost entirely to immigration. In contrast, the San Diego pocket mouse (C. fallax) can breed throughout the year if rainfall conditions are favorable (McClenaghan 1983). Our study does not provide evidence that high total seasonal rainfall influenced the number of breeding events of the California pocket mouse. The positive effect we documented of total seasonal rainfall (with a one-season lag) on recruitment (Fig. 4B) was manifested in several ways. Cover and edible seeds produced during a wet winter undoubtedly help females sur-vive winter when food is scarce, and winter rainfall puts females in good condition going into the spring–summer breeding season. During a dry year, higher winter rainfall
Fig. 3.—Estimates for May trapping session of realized population growth rate (λ) and 95% CI for California pocket mice (Chaetodipus californicus), 2004–2013, at Camp Roberts, California. Estimates are derived from the most parsimonious Pradel’s survival (ϕ)–λ model (Supplementary Data SD4). The first four numbers in the x-axis label are year of the trapping session, followed by the season of trapping session (S = spring; May trapping session).
Dow
nloaded from https://academ
ic.oup.com/jm
amm
al/advance-article/doi/10.1093/jmam
mal/gyab067/6315977 by U
niversity of Florida user on 26 July 2021

CHAUDHARY ET AL.—POPULATION DYNAMICS OF CALIFORNIA POCKET MICE 7
could further boost fecundity by bringing a greater proportion of females into breeding condition. California pocket mice do not breed during winter; therefore, the negative effect of rainfall during winter simply indicates reduced immigration during wet winters (Fig. 4B).
While total seasonal rainfall boosts recruitment by its pos-itive effect on plant production and the condition of females going into the breeding season, our results show a negative effect on recruitment of total seasonal rainfall (without a lag) and El Niño storms during winter and early spring (Table 2). Heavy rain can cause fungal infections of critical seed stores during winter (Reichman et al. 1985) and direct mortality from flooding of natal burrows during the spring breeding event (Thibault and Brown 2008). Monthly overall survival of pocket mice in our study was relatively high (76%), and was slightly higher in dry season (0.79 ± 0.02) than in wet season (0.74 ± 0.01). A higher CV of rainfall (with a one-season lag) was cor-related with higher survival (Fig. 4A). CV of temperature also had a positive influence on survival probability of California pocket mouse. In a semiarid region such as our study area where mean summer rainfall is already low, variability in rain could manifest as more days or months with even less precip-itation or more days or months with more (Boyce et al. 2006). During our study, the latter potentially benefited survival.
Although average seasonal temperature positively influ-ences survival of the California pocket mouse, it explained only a small proportion of variance in survival (Table 2). This result is in contrast to the strong negative effect of av-erage seasonal temperature on survival rates of the California mouse (Peromyscus californicus—Tietje et al. 2018), the piñon mouse (P. truei—Srivathsa et al. 2019), and the brush mouse (P. boylii— Polyakov et al. 2021) in the same study area. These species-specific differences might reflect sev-eral adaptations of the California pocket mouse to ame-liorate potentially negative effects of high temperature on survival. California pocket mice can survive without free water (Tucker 1962). Herbaceous plant seeds, its primary food, are relatively persistent during dry season, and seeds are appropriate for caching. The burrow ameliorates temper-ature extremes (Tucker 1966), and thermoregulation further maintained because pocket mice are known to occlude en-trances to their burrows (French 1977). Aboveground activity is restricted essentially to food gathering and mate finding. During a food shortage, they can enter diurnal torpor where the energy required to maintain a stable weight is reduced by almost one-half (43%—Tucker 1962, 1965, 1966). Tucker (1966) surmised that torpor is an adaptation to the variable climate of California, particularly seasonally available foods.
Fig. 4.—A) Influence of the coefficient of variation of the CV of rainfall (with a one-season lag; “Rainfall CV (one lag)”) on apparent survival (ϕ), and B) influence of total seasonal rainfall (with a one-season lag; “Seasonal rainfall (one lag),” measured in “mm”) on the recruitment rate of the California pocket mouse population (Chaetodipus californicus) during the dry season (left panel) and wet season (right panel) in 2004–2013 at Camp Roberts California. These relationships are based on the most parsimonious model (Table 1, model 1). Also depicted in both panels are 95% CI.
Dow
nloaded from https://academ
ic.oup.com/jm
amm
al/advance-article/doi/10.1093/jmam
mal/gyab067/6315977 by U
niversity of Florida user on 26 July 2021
8 JOURNAL OF MAMMALOGY
The population of California pocket mice in our study system was stable, perhaps due to the coping strategies dis-cussed above, and extremes and variations in temperature and rainfall that occur in our study area were tolerated by the popu-lation of California pocket mice. Nevertheless, predictions call for changes in regional climatic patterns, particularly changes in precipitation patterns (Knapp et al. 2008; Scheffers et al. 2016). Climate studies indicate that much of the distribution of the pocket mouse will face enhanced El Niño – La Niña oscillations (Lenihan et al. 2008) that will lead to episodes of
extreme rainfall events within periods of more intense and pro-longed drought. Rowe et al. (2015) documented the response of 34 species of small mammals to changes in weather pat-terns that occurred the past century in montane forests within or nearby Yosemite National Park, California. The California pocket mouse was one of the 25 species that shifted its oc-currence along the elevational gradient (Rowe et al. 2015). Nonetheless, Rowe et al. (2015) concluded that several biotic factors (natural habitat succession, competition among species, and invasive species) drove many of the distributional shifts
Table 2.—Influence of climatic covariates on monthly survival probability (ϕ) and recruitment rate (f) of California pocket mice (Chaetodipus californicus) at Camp Roberts, California, using time-specific recapture probability. A “+” and “−” indicate the prediction of the positive or neg-ative influence of the climatic covariate on the population parameter, respectively. For both ϕ and f, the estimate of the slope parameter (β), along with the upper (UCL) and lower (LCL) 95% CI, and the model used to estimate the parameter values are reported. Proportion of variation in a demographic parameter explained by a climatic covariate (R2
dev) is also reported, along with F-statistics, degrees of freedom, and P-values.
Covariatea Expected slope of β β (LCL, UCL) R2
dev(Fd.f.1, d.f.2, P) (Model)
ϕ f
Average seasonal temperature (temp_avga)
ϕ and f: − availability of resources will decrease with increasing temperature reducing both survival and recruitment
0.07 (0.06, 0.09) R2
dev = 2.17% (F1,17 = 35.26, P < 0.001) ϕ(temp_avg) p(time) f(time)
0.35 (0.12, 0.57) R2
dev = 17.03% (F1,17 = 3.49, P = 0.07) ϕ(time) p(time) f(temp_avg)
Coefficient of variation of average temperature (temp_cvb)
ϕ and f: − greater variability in temperature can negatively influence both survival and recruitment
0.13 (0.11, 0.15) R2
dev = 4.22% (F1,17 = 36.38, P < 0.001) ϕ(temp_cv) p(time) f(time)
0.24 (0.12, 0.37) R2
dev = 7.02% (F1,17 = 1.28, P = 0.27) ϕ(time) p(time) f(temp_cv)
Total seasonal rainfall (rain_sumc) ϕ and f: + food and water availability will be higher, increasing both ϕ and f
−0.28 (−0.31, −0.25) R2
dev = 19.15% (F1,17 = 4.02, P = 0.06) ϕ (rain_sum) p(time) f(time)
−0.81 (−0.88, −0.75) R2
dev = 2.42% (F1,17 = 0.42, P = 0.52) ϕ(time) p(time) f(rain_sum)
Coefficient of variation of seasonal rainfall (rain_cvd)
ϕ and f: − greater variability in precipitation can negatively influence both survival and recruitment
0.30 (0.26, 0.35) R2
dev = 15.13% (F1,17 = 43.25, P < 0.001) ϕ(rain_cv) p(time) f(time)
0.26 (0.02, 0.49) R2
dev = 7.12% (F1,17 = 1.30, P = 0.26) ϕ(time) p(time) f(rain_cv)
Coefficient of variation of seasonal rainfall with one-season lag (rain_cv_onelage)
ϕ and f: − greater variability in precipitation can negatively influence both survival and recruitment
0.10 (0.09, 0.12) R2
dev = 6.05% (F1,17 = 37.42, P < 0.001) ϕ(rain_cv_onelag) p(time) f(time)
−0.39 (−0.71, −0.07) R2
dev = 14.74% (F1,17 = 2.93, P = 0.10) ϕ(time) p(time) f(rain_cv_onelag)
Total seasonal rainfall with one-season lag (rain_sum_onelagf)
ϕ and f: + greater resource availability can have delayed positive effect on survival and recruitment
0.002 (0, 0.005) R2
dev = 0.01% (F1,17 = 34.21, P < 0.001) ϕ(rain_sum_onelag) p(time) f(time)
0.08 (0.06, 0.07) R2
dev = 51.0% (F1,17 = 17.69, P < 0.001) ϕ(time) p(time) f(rain_sum_onelag)
El Niñog ϕ and f: + increased rainfall associated with El Niño can increase resource availability
0.22 (0.20, 0.25) R2
dev = 18.35% (F1,17 = 45.63, P < 0.001) ϕ(El Niño) p(time) f(time)
−0.17 (−0.17, −0.17) R2
dev = 3.70% (F1,17 = 0.65, P = 0.42) ϕ(time) p(time) f(El Niño)
atemp_avg = average seasonal temperature during season of capture.btemp_cv = coefficient of variation (CV) of average temperature during season of capture.crain_sum = total rainfall during season of capture.drain_cv = coefficient of variation (CV) of rainfall during season of capture.erain_cv_onelag = coefficient of variation (CV) of seasonal rainfall from the season prior to capture.frain_sum_onelag = total seasonal rainfall from the season prior to capture.gEl Niño = Oceanic El Niño index.
Dow
nloaded from https://academ
ic.oup.com/jm
amm
al/advance-article/doi/10.1093/jmam
mal/gyab067/6315977 by U
niversity of Florida user on 26 July 2021

CHAUDHARY ET AL.—POPULATION DYNAMICS OF CALIFORNIA POCKET MICE 9
they documented, and they predicted that human-mediated habitat alterations would have more influence on the demo-graphics and distributions of small mammals in California than would changing weather patterns. Widespread and rapid alter-ations of habitat in the past decades within the distribution of the California pocket mouse suggest that this may be the case.
Movement of humans into wildlands has greatly increased frequency of wildfires in California’s already fire-prone Mediterranean climate (Keeley and Fotheringham 2001; Lenihan et al. 2008). An experimental fire that we carried out in 1997 on our study site at Camp Roberts did not affect California pocket mouse abundance and, as a matter of fact, survival was marginally higher following the fire (Tietje et al. 2018); however, this low-intensity burn had no appreciable ef-fect on shrub or tree cover. In contrast, Brehme et al. (2011) reported that a population of the congeneric San Diego pocket mouse (C. fallax fallax) decreased in response to wildfire. They attributed the decrease to the large reduction of protective cover and competitive advantage obtained following the fire by a gen-eralist species, the deer mouse (P. maniculatus). Diffendorfer et al. (2012) documented consistently reduced numbers of California pocket mice following each of several episodes of heavy rainstorms in winter that followed a large wildfire in southern California—perhaps not unlike the effects of El Niño on recruitment in our study. Species-specific response to wildfire also depends on the habitat type (Schwilk and Keeley 1998). Movement of humans into shrublands in the especially southern half of the California pocket mouse distribution (Fig. 1) is increasing the occurrence and size of areas known as “urban–wildland interface.” In these areas, small mammal resi-dents might respond strongly to the human disturbance-related vegetation changes (Bolger et al. 1997; Sauvajot et al. 1998). Those authors documented reduced numbers of small mam-mals due to shrub habitat alterations, including numbers of the California pocket mouse. Sauvajot et al. (1998:293) concluded that “... urban-associated habitat fragmentation and disturbance can lead to small mammal extinctions.”
Of concern from the San Francisco Bay to Big Sur, the exotic pathogen Phytophthora rameoren, the causal agent of sudden oak death (SOD), has killed an estimated 50 mil-lion tanoak trees (Notholithocarpus densiflorus; http://www.suddenoakdeath.org/) and up to five million coast live oak trees (Quercus agrifolia; M. M. Garbelotto, University of California, Berkeley, pers. comm.). In parts of southern California, the gold spotted oak borer (Agrilus auroguttatus—Coleman and Seybold 2008) has killed thousands of coast live oak trees (Das et al. 2020). These authors documented drought-induced mor-tality of blue oak (Q. douglasii) in oak woodland of Yosemite National Park, California, undoubtedly also the cause of oak mortality oftentimes reported by the concerned public and cit-izen scientists from throughout the distribution of the California pocket mouse. Effects of tree mortality on small mammals have not been studied extensively; however, some evidence exists that a decrease in structural complexity of the habitat leads to a decline in abundances of small mammals (Smit et al. 2001)
and makes them more vulnerable to predator-induced mortality (Torre and Diaz 2004).
Short-lived and annually reproducing species such as California pocket mouse exhibit high sensitivity to temporally correlated environmental conditions, and their short generation time might allow them to adapt rapidly to changing environ-mental optimum (Morris et al. 2008; Paniw et al. 2018; Postuma et al. 2020). For the same reason, they also suffer large popu-lation declines when the environmental optimum shifts, which is expected due to global environmental changes (Postuma et al. 2020). Our 10-year study provides the first estimates of demographics of this barely studied species and concludes that the population is relatively stable with a long-term population growth of ~1.0 on the study site, a mostly undisturbed habitat. Our results show that the California pocket mouse is quite tol-erant of dry and hot conditions. Perhaps due to its life-history strategies and coping strategies (e.g., food caching, predomi-nantly seed diet, and ability to enter torpor), it has evolved to deal with the seasonal environment that may become more sea-sonal due to climate change. If conditions become wetter and more variable, our results suggest that California pocket mouse will have higher survival and recruitment.
We note, however, that we did not consider several abiotic and biotic variables (e.g., competition, predation) that could poten-tially influence California pocket mouse population dynamics. We also do not know the extent to which our results can be applied to conditions other than those that occurred during our study, which was carried out in a relatively undisturbed habitat. Trends for other populations of the California pocket mouse could be different because these dynamics will vary with local climatic conditions, vegetation structure, fire regimes, space, and intensity of anthropogenic disturbance. Future studies from other regions of California and Baja California are needed to understand population dynamics of California pocket mice and the effects of abiotic and biotic factors on these dynamics from across the distribution of the species.
AcknowledgmentsUniversity of California, Division of Agriculture and Natural Resources; University of California, Berkeley, Department of Environmental Science, Policy, and Management; University of Florida, Gainesville, Department of Wildlife Ecology and Conservation; and Arkansas State University, Jonesboro, Department of Biological Sciences, supported this research. We thank the California Army National Guard, Camp Roberts, for permitting access to study sites. VC was supported by the University of Florida Biodiversity Institute, Tropical Conservation and Development Program, University of Florida, and WildLandscapes International. I. Ilyas, Cheriton School of Computer Science, University of Waterloo, Ontario, Canada, and X. Chu, electronically cleaned the data set, which greatly assisted our manual cleaning. We thank A. Srivathsa, J. D. Nichols, J. E. Hines, and O. Gimenez, for providing guid-ance in data analysis. Finally, we acknowledge P. Zollner,
Dow
nloaded from https://academ
ic.oup.com/jm
amm
al/advance-article/doi/10.1093/jmam
mal/gyab067/6315977 by U
niversity of Florida user on 26 July 2021

10 JOURNAL OF MAMMALOGY
C. Oosthuizen, M. A. Hardy, and two anonymous reviewers for their many helpful comments on drafts of this publication.
Supplementary DataSupplementary data are available at Journal of Mammalogy online.
Supplementary Data SD1.—Pairwise correlation plot for continuous climatic covariates.
Supplementary Data SD2.—Full model comparison table testing for the effect of time, and an additive effect of time and sex on recapture probability (p); season (wet season or dry season), sex (male or female), climatic covariates, and addi-tive and interactive effects of sex and season with individual climatic covariates on survival probability (ϕ) and recruitment rate (f) of California pocket mouse (Chaetodipus californicus).
Supplementary Data SD3.—Models used to estimate (A) overall and (B) sex and season-specific survival proba-bility (ϕ) and recruitment rate (f) of California pocket mouse (Chaetodipus californicus).
Supplementary Data SD4.—Model comparison table testing for the effect of time, season (wet season or dry season), sex (male or female), and additive and interactive effects of time, sex, and season on population growth rate (λ) of California pocket mouse (Chaetodipus californicus).
Literature CitedAlagona, P. S., A. Linares, P. Campos, and L. Huntsinger. 2013.
History and recent trends. Pp. 25–58 in Mediterranean oak wood-land working landscapes: dehesas of Spain and ranchlands of California (P. Campos, et al., eds.). Springer Publishing. New York.
Allington, G. R., D. N. Koons, S. K. Morgan Ernest, M. R. Schutzenhofer, and T. J. Valone. 2013. Niche opportun-ities and invasion dynamics in a desert annual community. Ecology Letters 16:158–166.
Beatley, J. C. 1969. Dependence of desert rodents on winter annuals and precipitation. Ecology 50:721–724.
Bolger, D. T., et al. 1997. Response of rodents to habitat frag-mentation in coastal southern California. Ecological Applications 7:552–563.
Boyce, M. S., C. V. Haridas, C. T. Lee, and The NCEAS Stochastic Demography Working Group. 2006. Demography in an increasingly variable world. Trends in Ecology & Evolution 21:141–148.
Brehme, C. S., D. R. Clark, C. J. Rochester, and R. N. Fisher. 2011. Wildfires alter rodent community structure across four veg-etation types in Southern California, USA. Fire Ecology 7:81–98.
Burnham, K. P., D. R. Anderson, and K. P. Huyvaert. 2011. AIC model selection and multimodel inference in behavioral ecology: some background, observations, and comparisons. Behavioral Ecology and Sociobiology 65:23–35.
Burnham, K. P., D. R. Anderson, G. C. White, C. Brownie, and K. H. Pollock. 1987. Design and analysis methods for fish sur-vival experiments based on release-recapture. American Fisheries Society Monograph 5:1–437.
Chesson, P., et al. 2004. Resource pulses, species interactions, and diversity maintenance in arid and semi-arid environments. Oecologia 141:236–253.
Coleman, T. W., and S. J. Seybold. 2008. Previously unrecorded damage to oak, Quercus spp., in southern California by the goldspotted oak borer, Agrilus coxalis Waterhouse (Coleoptera: Buprestidae). Pan-Pacific Entomologist 84:288–300.
Das, A. J., et al. 2020. Tree mortality in blue oak woodland during extreme drought in Sequoia National Park, California. Madrono 66:164–175.
Dickman, C. R., A. S. Haythornthwaite, G. H. McNaught, P. S. Mahon, B. Tamayo, and M. Letnic. 2001. Population dynamics of three species of dasyurid marsupials in arid central Australia: a 10-year study. Wildlife Research 28:493–506.
Diffendorfer, J., G. M. Fleming, S. Tremor, W. Spencer, and J. L. Beyers. 2012. The role of fire severity, distance from fire perimeter and vegetation on post-fire recovery of small-mammal communities in chaparral. International Journal of Wildland Fire 21:436–448.
Doherty, P. F., G. C. White, and K. P. Burnham. 2012. Comparison of model building and selection strategies. Journal of Ornithology 152:S317–S323.
Eisenberg, J. F. and D. E. Isaac. 1963. The reproduction of Heteromyid rodents in captivity. Journal of Mammalogy 44:61–67.
Ernest, S. K., J. H. Brown, K. M. Thibault, E. P. White, and J. R. Goheen. 2008. Zero sum, the niche, and metacommunities: long-term dynamics of community assembly. The American Naturalist 172:E257–E269.
French, A. R. 1977. Periodicity of recurrent hypothermia during hi-bernation in pocket mouse, Perognathus longimembris. Journal of Comparative Physiology 115:87–100.
Fryxell, J. M., J. B. Falls, E. A. Falls, and R. J. Brooks. 1998. Long-term dynamics of small-mammal populations in Ontario. Ecology 79:213–225.
Gimenez, O., and C. Barbraud. 2017. Dealing with many correl-ated covariates in capture-recapture models. Population Ecology 59:287–291.
Greenville, A. C., G. M. Wardle, and C. R. Dickman. 2012. Extreme climatic events drive mammal irruptions: regression anal-ysis of 100-year trends in desert rainfall and temperature. Ecology and Evolution 2:2645–2658.
Grosbois, V., et al. 2008. Assessing the impact of climate variation on survival in vertebrate populations. Biological Reviews of the Cambridge Philosophical Society 83:357–399.
Hardouin, L. A., A. Robert, M. Nevoux, O. Gimenez, F. Lacroix, and Y. Hingrat. 2014. Meteorological conditions influence short-term survival and dispersal in a reinforced bird population. Journal of Applied Ecology 51:1494–1503.
Hernández, L., A. G. Romero, J. W. Laundré, D. Lightfoot, E. Aragón, and J. López Portillo. 2005. Changes in rodent community structure in the Chihuahuan Desert México: com-parisons between two habitats. Journal of Arid Environments 60:239–257.
Holmgren, M., et al. 2006. Extreme climatic events shape arid and semiarid ecosystems. Frontiers in Ecology and the Environment 4:87–95.
Huxman, T. E., et al. 2004. Precipitation pulses and carbon fluxes in semiarid and arid ecosystems. Oecologia 141:254–268.
Intergovernmental Panel on Climate Change. 2014. Climate change (2014) synthesis report. In Contribution of working groups I, II, and III to the fifth assessment report of the intergovernmental panel on climate change (Core Writing Team, R. K. Pachauri, and L. A. Meyer, eds.). Intergovernmental Panel on Climate Change. Geneva, Switzerland. https://www.ipcc.ch/site/assets/
Dow
nloaded from https://academ
ic.oup.com/jm
amm
al/advance-article/doi/10.1093/jmam
mal/gyab067/6315977 by U
niversity of Florida user on 26 July 2021
CHAUDHARY ET AL.—POPULATION DYNAMICS OF CALIFORNIA POCKET MICE 11
uploads/2018/02/SYR_AR5_FINAL_full.pdf. Accessed October 2019.
Jung, T. S., R. Boonstra, and C. J. Krebs. 2020. Mark my words: experts’ choice of marking methods used in capture-mark-recapture studies of small mammals. Journal of Mammalogy 101:307–317.
Keeley, J. E., and C. J. Fotheringham. 2001. Historic fire re-gime in Southern California shrublands. Conservation Biology 15:1536–1548.
Kelt, D. A. 2011. Comparative ecology of desert small mammals: a selective review of the past 30 years. Journal of Mammalogy 92:1158–1178.
Kenagy, G. J., and G. A. Bartholomew. 1985. Seasonal repro-ductive patterns in 5 coexisting California desert rodent species. Ecological Monographs 55:371–397.
Knapp, A. K., et al. 2008. Consequences of more extreme precipi-tation regimes for terrestrial ecosystems. Bioscience 58:811–821.
Krebs, C. J. 2013. Population fluctuations in rodents. University of Chicago Press. Chicago, Illinois.
Krebs, C. J., et al. 2013. Synchrony in the snowshoe hare (Lepus americanus) cycle in northwestern North America, 1970–2012. Canadian Journal of Zoology-Revue Canadienne de Zoologie 91:562–572.
Laake, J., and E. Rexstad. 2008. RMark–an alternative approach to building linear models in MARK. Program MARK: a gentle in-troduction C1-C113. http://www.phidot.org/software/mark/docs/book. Accessed 29 January 2019.
Lenihan, J. M., D. Bachelet, R. P. Neilson, and R. Drapek. 2008. Response of vegetation distribution, ecosystem productivity, and fire to climate change scenarios for California. Climatic Change 87:S215–S230.
Lima, M., P. A. Marquet, and F. M. Jaksic. 1999. El Niño events, precipitation patterns, and rodent outbreaks are statistically associ-ated in semiarid Chile. Ecography 22:213–218.
Lima, M., N. C. Stenseth, H. Leirs, and F. M. Jaksic. 2003. Population dynamics of small mammals in semi-arid regions: a comparative study of demographic variability in two rodent spe-cies. Proceedings of the Royal Society of London, B. Biological Sciences 270:1997–2007.
Mason-Romo, E. D., A. A. Farías, and G. Ceballos. 2017. Two decades of climate driving the dynamics of functional and taxo-nomic diversity of a tropical small mammal community in western Mexico. PLoS ONE 12:e0189104.
McClenaghan, L. R. 1983. Notes on the population ecology of Perognathus fallax (Rodentia, Heteromyidae) in Southern California. Southwestern Naturalist 28:429–436.
Merritt, J. 1985. The effects of torpor on adenosine-triphosphate storage in the California pocket mouse, Perognathus californicus. Comparative Biochemistry and Physiology, A. Physiology 82:297–299.
Morris, W. F., et al. 2008. Longevity can buffer plant and an-imal populations against changing climatic variability. Ecology 89:19–25.
National Oceanographic and Atmospheric Administration. 2016. El Niño & La Niña (El Niño-Southern Oscillation). https://www.climate.gov/enso. Accessed 7 February 2017.
Nichols, J. D. 2016. And the first one now will later be last: time-reversal in Cormack-Jolly-Seber models. Statistical Science 31:175–190.
Nichols, J. D., et al. 2011. Climate change, uncertainty, and natural resource management. Journal of Wildlife Management 75:6–18.
Orland, M. C., and D. A. Kelt. 2007. Responses of a heteromyid rodent community to large- and small-scale resource pulses:
diversity, abundance, and home-range dynamics. Journal of Mammalogy 88:1280–1287.
Ostfeld, R. S., F. Keesing, C. G. Jones, C. D. Canham, and G. M. Lovett. 1998. Integrative ecology and the dynamics of spe-cies in oak forests. Integrative Biology 1:178–186.
Paniw, M., A. Ozgul, and R. Salguero-Gómez. 2018. Interactive life-history traits predict sensitivity of plants and animals to tem-poral autocorrelation. Ecology Letters 21:275–286.
Polyakov, A. Y., W. D. Tietje, V. Rolland, J. E. Hines, and M. K. Oli. 2021. Multiple coping strategies maintain stability of a small mammal population in resource-restricted environments. Ecology & Evolution (in press).
Postuma, M., M. Schmid, F. Guillaume, A. Ozgul, and M. Paniw. 2020. The effect of temporal environmental autocorrelation on eco-evolutionary dynamics across life histories. Ecosphere 11:e03029.
Pradel, R. 1996. Utilization of capture-mark-recapture for the study of recruitment and population growth rate. Biometrics 52:703–709.
R Development Core Team. 2020. R: a language and environment for statistical computing. R Foundation for Statistical Computing. Vienna, Austria. www.R-project.org/. Accessed 12 October 2020.
Reichman, O. J., D. T. Wicklow, and C. Rebar. 1985. Ecological and mycological characteristics of caches in the mounds of Dipodomys spectabilis. Journal of Mammalogy 66:643–651.
Rowe, K. C., et al. 2015. Spatially heterogeneous impact of climate change on small mammals of montane California. Proceedings of the Royal Society of London, B. Biological Sciences 282:20141857.
Sauvajot, R. M., M. Buechner, D. A. Kamradt, and C. M. Schonewald. 1998. Patterns of human disturbance and re-sponse by small mammals and birds in chaparral near urban devel-opment. Urban Ecosystems 2:279–297.
Scheffers, B. R., et al. 2016. The broad footprint of cli-mate change from genes to biomes to people. Science 354:aaf7671-1–aaf7671-11.
Schroeder, L. D., D. L. Sjoquist, and P. E. Stephan. 2016. Understanding regression analysis: an introductory guide (vol. 57). Sage Publications. Newbury Park, California.
Schwilk, D. W., and J. E. Keeley. 1998. Rodent populations after a large wildfire in California chaparral and coastal sage scrub. Southwestern Naturalist 43:480–483.
Sikes, R. S., and The Animal Care and Use Committee of the American Society of Mammalogists. 2016. 2016 Guidelines of the American Society of Mammalogists for the use of wild mammals in research and education. Journal of Mammalogy 97:663–688.
Smit, R., J. Bokdam, J. den Ouden, H. Olff, H. Schot-Opschoor, and M. Schrijvers. 2001. Effects of introduction and exclusion of large herbivores on small rodent communities. Plant Ecology 155:119–127.
Srivathsa, A., W. Tietje, V. Rolland, A. Polyakov, and M. K. Oli. 2019. Climatic drivers of pinyon mouse Peromyscus truei population dynamics in a resource-restricted environment. Population Ecology 61:122–131.
Syphard, A. D., J. E. Keeley, A. H. Pfaff, and K. Ferschweiler. 2017. Human presence diminishes the importance of climate in driving fire activity across the United States. Proceedings of the National Academy of Sciences of the United States of America 114:13750–13755.
Thibault, K. M., and J. H. Brown. 2008. Impact of an extreme climatic event on community assembly. Proceedings of the National Academy of Sciences of the United States of America 105:3410–3415.
Thibault, K. M., S. K. M. Ernest, E. P. White, J. H. Brown, and J. R. Goheen. 2010. Long-term insights into the influence of
Dow
nloaded from https://academ
ic.oup.com/jm
amm
al/advance-article/doi/10.1093/jmam
mal/gyab067/6315977 by U
niversity of Florida user on 26 July 2021
12 JOURNAL OF MAMMALOGY
precipitation on community dynamics in desert rodents. Journal of Mammalogy 91:787–797.
Tietje, W. D., A. Y. Polyakov, V. Rolland, J. E. Hines, and M. K. Oli. 2018. Climatic influences on demography of the California mouse (Peromyscus californicus) in semiarid oak wood-land. Journal of Mammalogy 99:1149–1158.
Torre, I., and M. Diaz. 2004. Small mammal abundance in Mediterranean post-fire habitats: a role for predators? Acta Oecologica-International Journal of Ecology 25:137–142.
Tucker, V. A. 1962. Diurnal torpidity in the California pocket mouse. Science 136:380–381.
Tucker, V. A. 1965. Oxygen consumption thermal conductance and torpor in California pocket mouse Perognathus californicus. Journal of Cellular and Comparative Physiology 65:393–403.
Tucker, V. A. 1966. Diurnal torpor and its relation to food consump-tion and weight changes in California pocket mouse Perognathus californicus. Ecology 47:245–252.
White, G. C., and K. P. Burnham. 1999. Program MARK: sur-vival estimation from populations of marked animals. Bird Study 46:S120–S139.
Williams, B. K., J. D. Nichols, and M. J. Conroy. 2002. Analysis and management of animal populations: modeling, estimation, and decision making. Academic Press. San Diego, California.
Yue, X., L. J. Mickley, and J. A. Logan. 2014. Projection of wild-fire activity in southern California in the mid-21st century. Climate Dynamics 43:1973–1991.
Zeiner, D. C., W. F. J. Laudenslayer, K. E. Mayer, and M. White (eds.). 1988. California’s wildlife. Volume 1. Mammals. California Department of Fish and Game. Sacramento.
Submitted 11 January 2020. Accepted 10 May 2021.
Associate Editor was Patrick Zollner.
Dow
nloaded from https://academ
ic.oup.com/jm
amm
al/advance-article/doi/10.1093/jmam
mal/gyab067/6315977 by U
niversity of Florida user on 26 July 2021