FACTORS DETERMINING THE PROFITABILITY OF ENTERPRISES ...
19
OPERATIONS RESEARCH AND DECISIONS No. 2 2011 Agnieszka PARKITNA* Beata SADOWSKA** FACTORS DETERMINING THE PROFITABILITY OF ENTERPRISES – INFLUENCE ASSESSMENT The purpose of the paper is to demonstrate existence and intensity of correlation between deter- mining factors and a state of profitability of Polish enterprises. The scope of the paper includes identi- fying the factors that determine enterprises profitability, creating an econometric model and conduct- ing analysis of influence of determining factors and their intensity have on profitability of studied population of enterprises in Poland. Keywords: determinants, profitability, econometric models 1. Introduction In order to properly function and develop, an enterprise needs managers, who can well understand the economic environment that it operates in. However, this under- standing is often limited to the closest environment. This is why many successes and failures come highly unexpected. They arise from the surrounding macroeconomics; we are often unaware of its forces. Therefore, its mechanisms need to be understood, its potential opportunities need to be utilized and its threats limited. Although in the literature on this subject we can find a broad range of research on internal factors, when it comes to external factors, there is no precise qualification of their influence. This is a gap in the field of science that is worth filling, or at least worth trying to in- vestigate. In Poland, alongside economic development and integration with the global __________________________ *Institute of Organization and Management, Wrocław University of Technology, ul. Smoluchowski- ego 25, 50-372 Wrocław, Department of Management, e-mail: [email protected] **Financial Officer, Zakład Bezpieczeństwa Ruchu Drogowego ZABERD SA (Institute of Road Sa- fety).
Transcript of FACTORS DETERMINING THE PROFITABILITY OF ENTERPRISES ...
O P E R A T I O N S R E S E A R C H A N D D E C I S I O N S No. 2 2011
Agnieszka PARKITNA* Beata SADOWSKA**
FACTORS DETERMINING THE PROFITABILITY OF ENTERPRISES – INFLUENCE ASSESSMENT
The purpose of the paper is to demonstrate existence and intensity of correlation between deter-mining factors and a state of profitability of Polish enterprises. The scope of the paper includes identi-fying the factors that determine enterprises profitability, creating an econometric model and conduct-ing analysis of influence of determining factors and their intensity have on profitability of studied population of enterprises in Poland.
Keywords: determinants, profitability, econometric models
1. Introduction
In order to properly function and develop, an enterprise needs managers, who can well understand the economic environment that it operates in. However, this under-standing is often limited to the closest environment. This is why many successes and failures come highly unexpected. They arise from the surrounding macroeconomics; we are often unaware of its forces. Therefore, its mechanisms need to be understood, its potential opportunities need to be utilized and its threats limited. Although in the literature on this subject we can find a broad range of research on internal factors, when it comes to external factors, there is no precise qualification of their influence. This is a gap in the field of science that is worth filling, or at least worth trying to in-vestigate. In Poland, alongside economic development and integration with the global
__________________________ *Institute of Organization and Management, Wrocław University of Technology, ul. Smoluchowski-
ego 25, 50-372 Wrocław, Department of Management, e-mail: [email protected] **Financial Officer, Zakład Bezpieczeństwa Ruchu Drogowego ZABERD SA (Institute of Road Sa-
fety).

A. PARKITNA, B. SADOWSKA 46
economy, awareness regarding the practical use of identifying the influence of factors on the profitability of domestic enterprises has been deepening. When observing Polish reality, most often we meet just awareness of certain regularities and of the influence of the environment and its factors on the results of financial instruments. This awareness has practical use, yet its narrow range causes some problems. Entre-preneurs know the concept of profitability, but they do not know how to influence its value in practice. A large percentage of bigger enterprises face this problem. It is most visible at a time of crisis. To preserve their financial condition, enterprises undertake risky steps that are supposed to be profitable, for example they buy foreign exchange options or shares in stock-listed companies. Because of limited experience and high risk, these kinds of actions most often result in worsening the financial situation of the enterprise. This is why identifying the factors determining the profitability of enter-prises or applying research methodology to measure their influence in practice is still a very open subject.
2. The necessity of research on profitability and its determinants
The change of the political system in Poland which occurred in 1989 resulted in economic changes that could be observed throughout the nineties of the past century. The reason for these changes was of course the necessity of building a modern and well-developed market economy. An economy adapted to the new reality, whicch could be observed, at the very least, by the change in the public perception of enter-prises. The importance of the owner (owners) of enterprises increased, as they are the ones who invest their own capital resources, which is in contrast to the previous eco-nomic model, where public property dominated. At present, the owner derives specific benefits accruing from an increase in the enterprise’s capital. Therefore, he is directly interested in effective functioning of the enterprise and its market position. Beside economic responsibility, he also bears legal responsibility, which is connected to as-signing him ownership, as well as the risk and the consequences of running an enter-prise. A given individual or legal identity profits from and bears direct and material responsibility in the case of losses from the business activity they run [3]. For the en-trepreneur, profit is compensation for costs.
During the course of time, it has been noticed that the ability to efficiently manage an economic entity is one of the main conditions for its rational functioning. That is why managing any enterprise should concentrate on identifying and realizing set goals of the enterprise functioning [12]. All the decisions made in the enterprise’s operations will be considered through the prism of its original purpose. This purpose will motivate each and every action. The literature indicates basic goals of business
Profitability of enterprises – influence assessment 47
activity. These are: profit maximization, development, growth and maximization of the enterprise’s value. Nowak assumes that […] the main goal of the enterprise should be to maximize the owners’ profit [7] and as Kuder claims full satisfaction of the cli-ents. To achieve this, analyzing the effectiveness of an economic entity is very im-portant. Effectiveness means efficiency, proficiency and a positive outcome which, in our economic reality, is most often profit, i.e. the surplus of income over expenditure or the income expenditure ratio. To achieve this, the enterprise should make use of its assets and values in the optimum manner, applying the principle of rational econom-ics, which was stated by Kuder: with given expenditure to receive maximum goal real-ization rate or with given goal realization rate to use minimum expenditure [6]. The running of any enterprise is dependent on achieving required economic effectiveness. The formulation of this effectiveness results from the decisions made, which means that effectiveness is crucial to an enterprise because: appropriate measurement and evaluation of effectiveness enable identifying the areas where resources are increasing the most. Appropriate measurement and evaluation of effectiveness enables one to build fair systems to assess an enterprise and, on this basis, a system of motivation [9].
In today’s economy, where strong competition dominates and where all processes are highly dependent on information, the success of an enterprise requires specific measurement and management systems. To comply with the principle of rational eco-nomics, an enterprise must systematically analyze its financial result or in other words analyze profitability. When determining the profitability index of a business entity, we can use many variants of the numerator and denominator to gain more information about a company. However, we get the most data from applying the whole range of profitability indexes in three aspects [11]:
• sales profitability, defined in the literature as return on sale, • return on assets, also known as economic return, • return on invested capital, known also as financial profitability. Thanks to these indexes, we can obtain a wide range of information helpful in
managing an enterprise.
3. Determinants of profitability
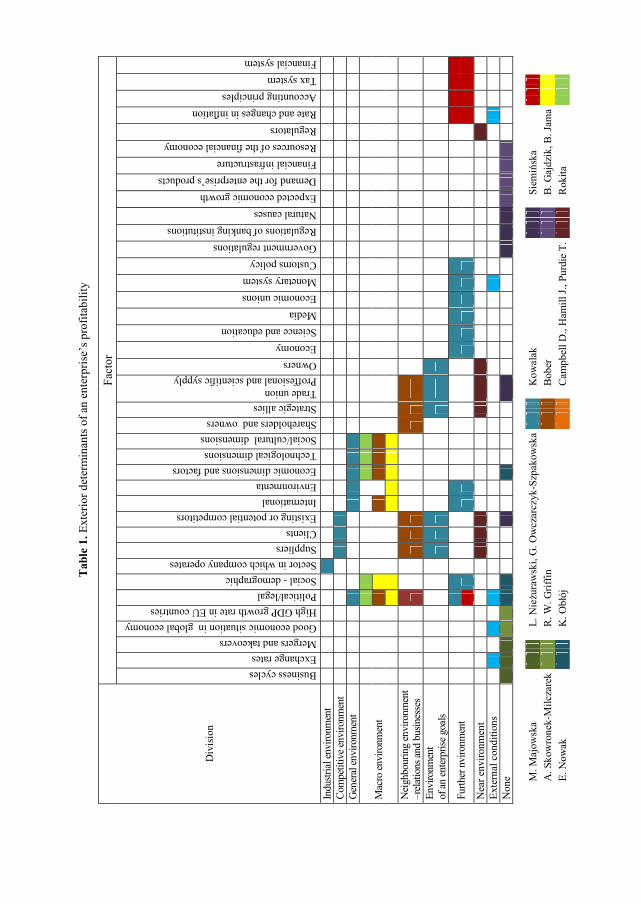
A number of factors affect the profitability of an enterprise. Their influence varies in the short term, as well as in the long term. Recognizing these factors will be very helpful in managing a business entity. These determinants can be of a positive or negative nature. In the latter case, an important role falls to the manager of the enter-prise, who must make all efforts to improve the financial results of the company.
Tab
le 1
. Ext
erio
r det
erm
inan
ts o
f an
ente
rpris
e’s p
rofit
abili
ty
Div
isio
n
Fact
or
Business cycles Exchange rates Mergers and takeovers Good economic situation in global economy High GDP growth rate in EU countries Political/legal Social - demographic Sector in which company operates Suppliers Clients Existing or potential competitors International Environmenta Economic dimensions and factors Technological dimensions Social/cultural dimensions Shareholders and owners Strategic allies Trade union Proffesional and scientific sypply Owners Economy Science and education Media Economic unions Monetary system Customs policy Government regulations Regulations of banking institutions Natural causes Expected economic growth Demand for the enterprise’s products Financial infrastructure Resources of the financial economy Regulators Rate and changes in inflation Accounting principles Tax system Financial system
Indu
stria
l env
ironm
ent
Com
petit
ive e
nviro
nmen
t
Gen
eral
envi
ronm
ent
Mac
ro en
viro
nmen
t
Nei
ghbo
urin
g en
viro
nmen
t –r
elat
ions
and
busin
esse
s
Envi
ronm
ent
of an
ente
rpris
e goa
ls
Furth
er n
viro
nmen
t
N
ear e
nviro
nmen
t
Exte
rnal
con
ditio
ns
N
one
M
. Maj
owsk
a
L.
Nieżu
raw
ski,
G. O
wcz
arcz
yk-S
zpak
owsk
a
Kow
alak
Siem
ińsk
a
A. S
kow
rone
k-M
ilcza
rek
R. W
. Grif
fin
B
ober
B
. Gaj
dzik
, B. J
ama
E.
Now
ak
K. O
błój
C
ampb
ell D
., H
amill
J., P
urdi
e T.
Rok
ita

Profitability of enterprises – influence assessment 49
Recognizing and understanding factors that are important at the moment is a con-siderable challenge. The literature on this subject gives a whole list of these factors, which the authors systematized in Table 1. However, it is unacceptable when a group of managers, who in spite of recognizing these factors, fail to undertake any actions, as Kowalak states, believing that the clouds, that came will leave on their own. This kind of approach can, in many cases, lead to the downfall of an organization [5].
In the literature we find many types of external factors influencing the profitability of an enterprise. Table 1 presents an assemblage of the factors existing in the litera-ture. They include:
Political-legal environment. Political factors are those that derive from the fact that an enterprise functions in a given country. This environment consists of various kinds of state institutions that regulate the business activity of an enterprise, its rela-tions with the state and other enterprises. The problems that private enterprises face when they enter a market where monopolists are still present are the simplest example of this.
Economic environment. The literature defines economic environment as the milieu that comprises the basic macroeconomic values characterizing the economy in which an enterprise runs, institutions operating in given economy, together with specific legal system, technologies etc. [10].
Tide of the market. The tide of the market determines an enterprise’s profitability to a high degree. It is subject to periodic, cyclical fluctuations. It is expressed by the macroeconomic ratio defined as gross domestic product (GDP). Bień [1] defines GDP as the value of goods and services produced in a given time which are intended for final consumption and for investment, adjusted for import/export balance.
Unemployment. In connection with the increasing range of new technologies, in-dustrialization or with “informatization”, more and more often we are facing resigna-tion from human work in favor of machines, devices or computers. This results in a phenomenon defined as unemployment, which means a surplus of people available for work over the number of work posts.
Social-cultural environment. These are the norms and cultural values of the coun-try in which a business operates. These factors are demography, its tendencies and modes of consumption. Forecasts from the Central Statistical Office (GUS) are quite alarming.
On the one hand they indicate a decrease in the population, and on the other, aging of the population. Forecasts say that in 2030, the Polish population will be just over 35 mln., of which 42% will be over 65, which, as one can guess, will have a consider-able influence on the profitability of enterprises.

Tab
le 2
. Int
erna
l det
erm
inan
ts o
f an
ente
rpris
e’s p
rofit
abili
ty (s
ourc
e: o
wn
wor
k)
Div
isio
n
Fact
ors
Accounting policy Quality of products and services
Reaction time to market changes Successful product innovations Investing in human resources Expenditure on research and development Innovative solutions in customer service systems Cost optimisation Efficient managing Taking advantage of the ability to operate in the homogeneous EU market Skilful usage of the finances from structural funds Board of the organisation Employees Organisational culture New companies in the market Suppliers Substitutes Transport Services Trade Competition New technologies Information and communication Government regulations Foreign investments Cooperating entities Labour market Banks Receivers Local community Material recourses Financial resources
Inte
rnal
env
ironm
ent
N
ear e
nviro
nmen
t
Non
e
M. M
ajow
ska
L. N
ieżu
raw
ski,
G. O
wcz
arcz
yk-S
zpak
owsk
a
A
. Sko
wro
nek-
Milc
zare
k
K
. Obł
ój
E. N
owak
B
, Gaj
dzik
, B. J
ama

Profitability of enterprises – influence assessment 51
Technical-technological environment. This covers the knowledge of how to trans-form a natural good into a final product, as well as all the means and skills for realiz-ing this goal. Analyzing this environment gives us information about new inventions and innovative technologies. It is a very important factor, because it can decide about the success or failure of an enterprise. Implementing new technology is important so as not to be left behind the competition. Usually new technologies cause a decrease in costs or shortening of the technological process. Failing to follow in its direction can quickly cause a decrease in profitability or even completely exclude an enterprise from the market. External factors create the framework for macroeconomic policy [8].
A large amount of research on factors influencing profitability that are dependent on the enterprise itself have been published (Table 2). As a result many opinions and indications of various determinants emerge. Further factors of the neighbouring envi-ronment indicated by Kopertyńska are: sufficient capital recourses, access to the buy-ers’ market, accessibility of resources and materials. [4]
Taussig and Baker were pioneers in the research on salary levels. They introduced the famous relationship between the effectiveness of an organization and the salaries of the employees in high positions. This relationship was so surprising that many re-searchers followed up their research. In the course of time, the function of such re-search was modified. At the beginning, researchers treated the managers’ salaries as a means of enabling discussion about the role of the board (for instance analyzing whether the board pays too high salaries to the managers)*. After modification, this research was used as a tool to control effectiveness. In spite of using similar sources of data and identical statistical methods, the results of this research are ambiguous. Some confirmed the association between effectiveness and salary, others quite the contrary, and there were also some ambiguous results.
4. Factors determining the profitablity of enterprises – influence assessment
The data used for our research into profitability and its determinants came from three sources: the website of the Central Statistical Office (GUS), Table 8 in the Ap-pendix, Concise Statistical Yearbooks of Poland, Table 3, and the database from the document Poland – macroeconomic indicators. Annual economic measurement in-struments, provided by the Institute of Financial Management, which includes 2254
__________________________ *Zajac E.L., CEO selection, succession, compensation, and firm performance. A theoretical integra-
tion and empirical analysis, Strategic Management Journal, 1990, 11 (3), 217–230. [after] Majowska M., W kierunku definiowania efektywności organizacyjnej, Zeszyty Naukowe Uniwersytetu Szczecińskiego, Finanse, rynki finansowe, ubezpieczenia, nr 14, Szczecin, 2008.

A. PARKITNA, B. SADOWSKA 52
enterprises over a period of 10 years. The data were incomplete for some enterprises. After selection, 535 enterprises remained.
Table 3. External factors selected from the Concise Statistical Yearbooks of Poland
Symbol Specification Unit x41 unemployed aged 15 and older quantity x42 unemployment rate % x43 registered unemployed persons
quantity x44 unemployed previously not employed x45 unemployed previous employment terminated by the company x46 unemployed possessing benefit rights x47 unemployment benefits
PLN x48 average monthly income for 1 person in a household (available income)x49 average monthly wages and salaries x50 average monthly expenditure for 1 person in a household x51 inventions and utility models – applications items x52 inventions and utility models – patents granted x53 import dynamics previous year = 100 x54 export dynamics x55 domestic demand per capita x56 gross domestic product (current prices) x57 foreign debt (mil USD) gross x58 gross domestic income (current prices) mln. PLN x59 total money supply x60 total industrial production sold previous year = 100 x61 indices of agricultural output x62 obligatory encumbrances on the gross financial result of enterprises
mln. PLN x63 including income tax from enterprises x64 the net financial result x65 indices of construction and assembly production previous year = 100 x66 current assets of enterprises
mln. PLN
x67 total value of the stocks of enterprises x68 short-term dues and claims x69 short-term dues and claims from deliveries and services x70 short-term investments (monetary means) x71 short-term liabilities of enterprises x72 credits and loans
Source: Authors’ work based on the Central Statistic Office data.
In the case of the profitability on turnover of Polish enterprises (Table 6), we can notice a significant and very strong positive correlation with some of the studied fac-tors, for example: youth education in total (0.90), the net financial result for all enter-prises (0.96), investment outlays on machinery, technical equipment and tools (0.90).

Profitability of enterprises – influence assessment 53
A very strong negative correlation is characteristic of the cost level indicator in all enterprises (–0.99). The critical value for this correlation for n = 9 calculated from the formula
2α
2α
2
12
S
*
S
tnr
tn
,
,
−=+
−
is 0.6664. These selected factors form a basis to build an econometric model describ-ing the profitability on turnover of Polish enterprises.
The first stage of creating econometric models was to determine the purpose of the research. This is to determine which factors influence the profitability indices studied. The data was selected based on the literature, and subsequently using correlations, input data was selected for the model. We assume a linear model of the following form:
0
k
i j ij ij
y a X ε=
= +∑
The next stage was to estimate the structural parameters, which was carried out us-ing the Gretl software by the method of least squares. Because of the large number of factors and, at the same time, the relatively small number of years, at this stage several probable econometric models have been selected.
In the case of the profitability on turnover of Polish enterprises, the models sug-gested are given below. They all explain variation in profitability at a significance level of α = 0.05.
• Model 1
1 8 9 116
13 20
10824 76 0 25924 11 4913 42 688 1 5482524 955 3 54 10
y . – . x – . x – . x . x– . x . x−
= −+ ×
• Model 2
1 8 9 115
13 36
11258 49 0 27525 8 57086 37 9335 0 9093126 6974 2 7 10 .
y . – . x – . x – . x – . x– . x . x−
=+ ×
• Model 3
1 8 9 11 135 5
36 67
10925 72 0 26509 9 7725 39 5849 1 01198 25 99111 67 10 1 39 10
y . – . x – . x – . x – . x – . x. x . x− −
=+ × + ×
A. PARKITNA, B. SADOWSKA 54
• Model 4
1 8 9 11 135 6
36
10774 94 0 26295 8 54521 36 9436 0 90139 25 88632 52 10 3 47 10 64
y . – . x – . x – . x – . x – . x. x . x− −
=+ × + ×
• Model 5
1 8 9 116
13 22
11116 643 0 266175 11 80505 43 77216 1 62204625 62702 3 854 10
y . – . x – . x – . x – . x– . x . x−
=+ ×
• Model 6 5
1 8 11 13 685040 725 0 13256 0 462391 0 364081 15 8811 3 46 10y . – . x . x . x . x . x−= + + − + ×
The models studied were considered according to an assumed model of action. Statistical testing of these models was carried out in accordance to standard proce-dures for building econometric models. To assure the transparency of the regression results, they are given in Table 9 in the Appendix.
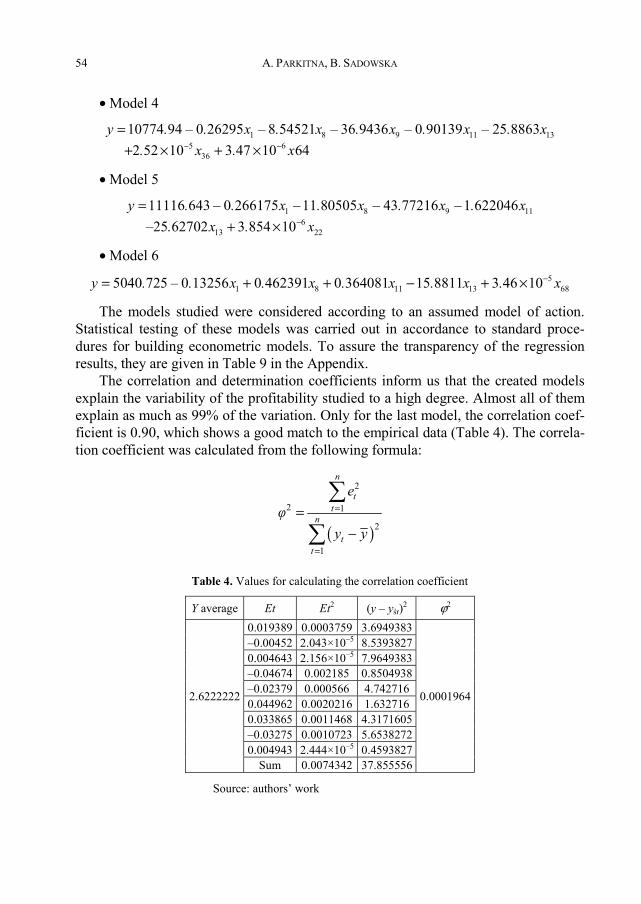
The correlation and determination coefficients inform us that the created models explain the variability of the profitability studied to a high degree. Almost all of them explain as much as 99% of the variation. Only for the last model, the correlation coef-ficient is 0.90, which shows a good match to the empirical data (Table 4). The correla-tion coefficient was calculated from the following formula:
( )
2
2 1
2
1
n
tt
n
tt
eφ
y y
=
=
=−
∑
∑
Table 4. Values for calculating the correlation coefficient
Y average Et Et2 (y – yśr)2 ϕ2
2.6222222
0.019389 0.0003759 3.6949383
0.0001964
–0.00452 2.043×10⁻⁵ 8.53938270.004643 2.156×10⁻⁵ 7.9649383–0.04674 0.002185 0.8504938–0.02379 0.000566 4.742716 0.044962 0.0020216 1.632716 0.033865 0.0011468 4.3171605–0.03275 0.0010723 5.65382720.004943 2.444×10⁻⁵ 0.4593827
Sum 0.0074342 37.855556
Source: authors’ work

Profitability of enterprises – influence assessment 55
Based on this value, the coefficient of determination was calculated from the for-mula R2 = ϕ2. For each model, the condition of coincidence was used to eliminate some factors. The condition of coincidence is:
( )( ) ( )sign , signj jr x y a=
where: sign(r(xj, y)) is the sign of the correlation coefficient between the exogenous variable xj and the endogenous variable y; sign(aj) is the sign of the coefficient aj in the econometric model with variable xj (Tables 5, 6).
Table 5. Signs of the coefficient aj
Variable Coefficient const 10824.76253
x1 –0.259236256x8 –11.49130841x9 –42.68804759x11 –1.548254524x13 –24.95499803x20 3.54358×10⁻⁶
Source: authors’ work
Table 6. Correlation with profitability on turnover in the model for Polish enterprises
Variable y x1 x8 x9 x11 x13 x20 y 1 x1 –0.8858 1 x8 –0.8378 0.982531 1 x9 0.839921 –0.98671 –0.99828 1 x11 0.903889 –0.962 –0.95085 0.95194 1 x13 0.809863 –0.98028 –0.98043 0.977174 0.921443 1 x20 0.738861 –0.89288 –0.91885 0.902921 0.8546 0.948087 1
Source: authors’ work.
1 1sign( ( , )) = sign ( )r x y a , 8 8sign( ( , )) = sign ( )r x y a , 9 9sign( ( , )) = sign ( )r x y a
11 11sign( ( , )) = sign ( )r x y a , 13 13sign( ( , )) = sign ( )r x y a , 20 20sign( ( , )) = sign ( )r x y a
Accordance of the coefficient signs and the coefficient in the econometric model does not occur for the variables x9, x11, and x13. Once these variables had been exclud-ed, one more model estimation using the OLS method, was carried out.
A. PARKITNA, B. SADOWSKA 56
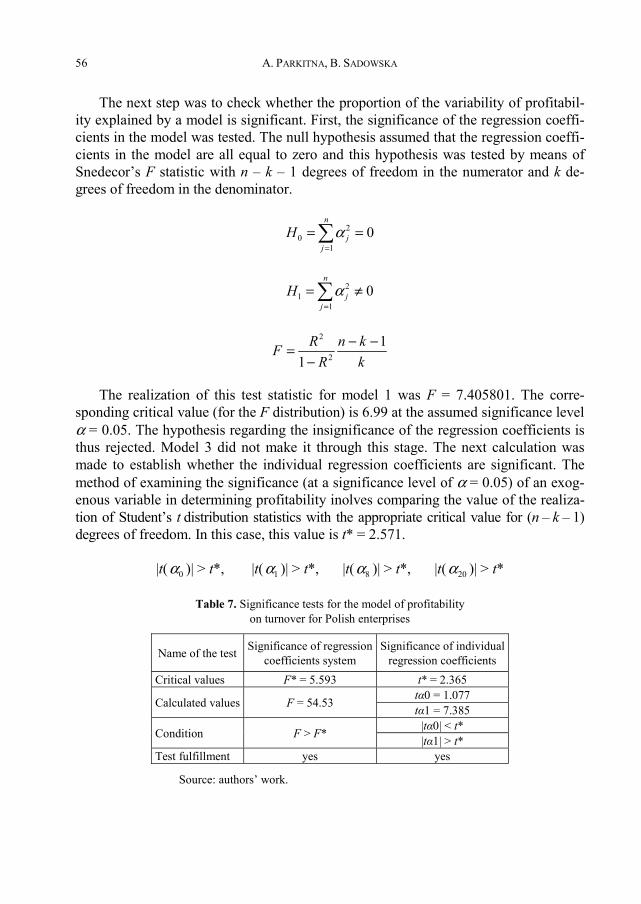
The next step was to check whether the proportion of the variability of profitabil-ity explained by a model is significant. First, the significance of the regression coeffi-cients in the model was tested. The null hypothesis assumed that the regression coeffi-cients in the model are all equal to zero and this hypothesis was tested by means of Snedecor’s F statistic with n – k – 1 degrees of freedom in the numerator and k de-grees of freedom in the denominator.
20
10
n
jj
H=
= =∑α
21
10
n
jj
H=
= ≠∑α
2
2
11
R n kFR k
− −=−
The realization of this test statistic for model 1 was F = 7.405801. The corre-sponding critical value (for the F distribution) is 6.99 at the assumed significance level α = 0.05. The hypothesis regarding the insignificance of the regression coefficients is thus rejected. Model 3 did not make it through this stage. The next calculation was made to establish whether the individual regression coefficients are significant. The method of examining the significance (at a significance level of α = 0.05) of an exog-enous variable in determining profitability inolves comparing the value of the realiza-tion of Student’s t distribution statistics with the appropriate critical value for (n – k – 1) degrees of freedom. In this case, this value is t* = 2.571.
|t( 0α )| > t*, |t( 1α )| > t*, |t( 8α )| > t*, |t( 20α )| > t*
Table 7. Significance tests for the model of profitability on turnover for Polish enterprises
Name of the test Significance of regression coefficients system
Significance of individualregression coefficients
Critical values F* = 5.593 t* = 2.365
Calculated values F = 54.53 tα0 = 1.077 tα1 = 7.385
Condition F > F* |tα0| < t* |tα1| > t*
Test fulfillment yes yes
Source: authors’ work.

Profitability of enterprises – influence assessment 57
Among the models presented, only model 4 indicated the significance of one of the factors. This is why only this model was submitted to further verification. Accord-ing to the principles of building an econometric model, another test of this model was started which now has the following form:
5640 426254 5 12 10y . . x−= + ×
This model explains 89% of the variability of the profitability on turnover of Polish enterprises. The condition of coincidence has been fulfilled. The results of the significance tests verifying the variability explained by the model are presented in Table 7. The results of the test show that the net financial result is very significant associated with the profitability on turnover.
5. Conclusions
Recognizing and skillful evaluation of the factors influencing an enterprise makes it easier for managers to react to situations that a business entity faces. A problem posed in this way was submitted to in-depth analysis from the point of view of identi-fying a wide spectrum of factors determining profitability. Based on this, an analysis of the influence of determining factors was conducted on a given sample of Polish enterprises. The following conclusions were made:
• In the cases of the unemployment rate and business cycle, there were some diffi-culties in evaluating their influence on profitability, which could mean that they are of a non-linear character.
• Econometric models enabled selecting external factors that show a linear impact on the profitability of enterprises.
• The created econometric models showed that the following influence the sales profitability of Polish enterprises: total population, youth education, graduates of higher education institutions. However, the procedure for creating econometric models showed their low significance.
• It has been observed that throughout most of the study period it was noticeable that there are opposing influences of the studied factors on the operating profitability of invested capital (sample of 535 enterprises).
At the end, it is necessary to stress the diversity and complexity of the problems that are the subject of this article. Despite the attempt to explain the subject thorough-ly, not every issue has been presented. In the face of such a complex problem, this paper should be treated as an entry point for further discussion. In the authors’ opin-ion, research has not explained the determinants of profitability, their identification or evaluation of their influence. However, this is a very important aspect of enterprise management.

A. PARKITNA, B. SADOWSKA 58
References
[1] BIEŃ W., Zarządzanie finansami przedsiębiorstw. Wydanie 8, Difin, Warszawa, 2008. [2] GOMEZ-MEJIA L.R., Structure and process of divesification, compencation strategy, and firm per-
formance, Strategy Management Journal, 1992, No. 13; BOYD B., SALAMIN A., Strategic reward sys-tems: A contingency model of may system design, Strategy Management Journal, 2001, 22 [after:] MAJOWSKA M., W kierunku definiowania efektywności organizacyjnej, Zeszyty Naukowe Uniwersy-tetu Szczecińskiego, Finanse, rynki finansowe, ubezpieczenia, No. 14, Szczecin, 2008.
[3] JAKI A., Ocena efektywności a kreowanie wartości przedsiębiorstwa, [in:] Zeszyty Naukowe Aka-demii Ekonomicznej w Krakowie, nr 731, Kraków, 2006.
[4] KOPERTYŃSKA M.W., Czynniki determinujące sukces małych i średnich firm – studia przypadków, Prace i Materiały Wydziału Zarządzania UG, Systemowe uwarunkowanie sukcesu organizacji, 2, Sopot, 2009.
[5] KOWALAK R., Ocena kondycji finansowej przedsiębiorstwa w badaniu zagrożenia upadłością, Ośro-dek Doradztwa i Doskonalenia Kadr Sp. z o.o., Gdańsk, 2008.
[6] KUDER D., Analiza rentowności przedsiębiorstwa na przykładzie grupy kapitałowej EXBUD, [in:] Zeszyty Naukowe No. 635 Akademii Ekonomicznej w Krakowie, Kraków, 2003.
[7] NOWAK E., Controlling w przedsiębiorstwie, koncepcje i instrumenty, Wydawnictwo ODDK, Gdańsk, 2003 [after:] BURZYKOWSKA M., Makroekonomiczne czynniki kształtujące rynkową wartość płynności finansowej przedsiębiorstwa, [in:] Prace naukowe z zakresu ekonomiki i zarządzania przedsiębiorstwem, J. Duraj (Ed.), Wydawnictwo Uniwersytetu Łódzkiego, Łódź, 2008.
[8] PARKITNA A., Wpływ czynników makroekonomicznych na kondycję finansową przedsiębiorstw w Polsce – przyczynek do dyskusji, [in:] Prace Naukowe Akademii Ekonomicznej we Wrocławiu, Problemy gospodarki światowej, No. 1191, Wrocław, 2008.
[9] POLACZEK R., Analiza wskaźnikowa jako podstawowa metoda oceny efektywności przedsiębiorstwa, [in:] Prace Naukowe Uniwersytetu Ekonomicznego we Wrocławiu, Współczesne problemy analizy ekonomicznej przedsiębiorstwa, No. 9 (1209), Wrocław, 2008.
[10] POMYKALSKI A., Zarządzanie i planowanie marketingowe, PWN, Warszawa, 2008. [11] SIERPIŃSKA M., JACHNA T., Ocena przedsiębiorstwa według standardów światowych, PWN, War-
szawa, 2006. [12] STĘPIEŃ K., Nadrzędne cele działalności jednostek gospodarczych, [in:] Zeszyty Naukowe Akademii
Ekonomicznej w Krakowie, No. 674, Kraków, 2005. [13] ZAJĄC E.L., CEO selection, succession, compensation, and firm performance: A theoretical integra-
tion and empirical analysis, Strategic Management Journal, 1990, No. 11 (3), 217–230 [after:] MAJOWSKA M., W kierunku definiowania efektywności organizacyjnej, Zeszyty Naukowe Uniwersy-tetu Szczecińskiego, Finanse, rynki finansowe, ubezpieczenia, No. 14, Szczecin, 2008.
Appendix
In the Appendix, Table 8 (External factors used in this study) and Table 9 (Report from testing the model of turnover profitability for Polish enterprises) are presented. The data was included to assure the transparency of the regression results.

Tab
le 8
. Ext
erna
l fac
tors
use
d in
this
stud
y
Sym
bol
Tabl
e Sp
ecifi
catio
n
Uni
t
1 2
3 4
x 10
pric
es
pric
e in
dice
s of f
oods
and
serv
ices
pr
ev. y
ear =
100
x 1
1
educ
atio
n, sc
ienc
e, a
nd in
form
atio
n so
ciet
y
yout
h ed
ucat
iona,
b in
tota
l %
x 1
2 ea
rly sc
hool
leav
ersc,
d in
tota
l %
x 13
grad
uate
s of h
ighe
r edu
catio
n in
stitu
tions
e in th
e fie
lds o
f life
sc
ienc
e, te
chni
cal a
nd c
ompu
ter s
cien
ce in
tota
l pe
r 100
0
inha
bita
nts
x 14
publ
ic e
xpen
ditu
re o
n ed
ucat
ion
in re
latio
n to
GD
P %
x 1
5 ex
pend
iture
for R
&D
act
iviti
es in
rela
tion
to G
DP
%
x 16
com
pute
rs
% o
f all
ente
rpris
esx 1
7 in
tern
et a
cces
s %
of a
ll en
terp
rises
x 18
broa
dban
d in
tern
et
% o
f all
ente
rpris
esx 1
9 fin
ance
s of n
on-fi
nanc
ial e
nter
prise
sa re
venu
e fro
m to
tal a
ctiv
ities
of e
nter
pris
es in
gen
eral
m
ln. P
LN
x 20
incl
udin
g re
venu
e fro
m sa
les o
f pro
duct
s, fo
ods a
nd m
ater
ials
m
ln. P
LN
x 21
costs
of o
btai
ning
reve
nue f
rom
tota
l act
ivity
of e
nter
prise
s in
gene
ral
mln
. PLN
x 2
2 (t
he d
ata i
nclu
de e
cono
mic
entit
ies k
eepi
ng
acco
untin
g le
dger
s, em
ploy
ing
mor
e tha
n 9
pers
ons.
Dat
a do
not i
nclu
de b
anks
, ins
uran
ce co
mpa
nies
, br
oker
age h
ouse
and
offic
es, i
nves
tmen
t, pe
nsio
n so
ciet
ies,
natio
nal i
nves
tmen
t fun
ds, h
ighe
r edu
catio
n in
stitu
tions
, ind
epen
dent
pub
lic h
ealth
care
in
stitu
tions
, cul
tura
l ins
titut
ions
with
lega
l ent
ity,
priv
ate f
arm
s in
agric
ultu
re)
incl
udin
g th
e co
st o
f sol
d pr
oduc
ts, fo
ods a
nd m
ater
ials
m
ln. P
LN
x 23
the
net f
inan
cial
resu
lt of
ent
erpr
ises
in to
tal
mln
. PLN
x 2
4 co
st le
vel i
ndic
ator
in e
nter
pris
es in
tota
l %
x 2
5 th
e ne
t tur
nove
r pro
fitab
ility
rate
in e
nter
pris
es in
gen
eral
%
x 2
6 lo
ng-te
rm li
abili
ties o
f ent
erpr
ises
in to
tal (
for e
nd o
f the
yea
r)
mln
. PLN
x 2
7 sh
ort-t
erm
liab
ilitie
s in
ente
rpris
es in
tota
l (fo
r end
of t
he y
ear)
m
ln. P
LN
x 28
non-
retu
rnab
le fu
nds f
rom
the
euro
pean
uni
on a
nd o
ther
sour
cesf
mln
. PLN
x 2
9 st
ate
budg
et e
xpen
ditu
re in
tota
l m
ln. P
LN
x 30
allo
catio
ns a
nd su
bsid
ies i
n to
tal
mln
. PLN
x 3
1 in
vestm
ents
inve
stm
ent o
utla
ys in
tota
l (cu
rren
t pric
es)
mln
. PLN
x 3
2 on
mac
hine
ry, t
echn
ical
equ
ipm
ent a
nd to
ols
prev
. yea
r = 1
00
x 1
popu
latio
n
popu
latio
n in
tota
l (fo
r 31.
12)
thou
sand
s x 2
an
nual
incr
ease
th
ousa
nds
po
pula
tion
in
x 3
pr
e-w
orki
ng a
ge (0
–17
year
s old
) %
x 4
w
orki
ng a
ge (1
8–59
/64
year
s old
) %
x 5
m
obile
age
(18-
44 y
ears
old
) %

Tab
le 8
con
tinue
d
1 2
3 4
x 6
no
n-m
obile
age
(45–
59/6
4 ye
ars o
ld)
%
x 7
po
st-w
orki
ng a
ge (6
0/65
yea
rs a
nd o
lder
) %
x 8
0–14
yea
rs o
ld (c
hild
ren)
%
x 9
65 y
ears
and
old
er
%
x 33
of
ficia
l NB
P ex
chan
ge ra
te: 1
00 U
SD
PLN
x 3
4
100
EUR
PLN
x 3
5
Con
sum
ptio
n in
tota
l (cu
rren
t pric
es)
mln
. PLN
x 3
6
incl
udin
g in
divi
dual
con
sum
ptio
n ex
pend
iture
in h
ouse
hold
sect
or
mln
. PLN
x 3
7 la
bour
mar
ket
empl
oyed
in th
e na
tiona
l eco
nom
y (a
t the
end
of t
he p
erio
d)g
thou
sand
s x 3
8 av
erag
e ag
e of
pro
fess
iona
l dea
ctiv
atio
nh %
x 3
9 en
viro
nmen
t m
unic
ipal
was
te d
epos
ited
on w
aste
dum
ps
kg/in
habi
tant
x 4
0 pa
rtici
patio
n of
ener
gy fr
om re
new
able
sour
ces i
n el
ectri
city
cons
umpt
ion
%
a Shar
e of
per
sons
age
d 20
–24,
with
at l
east
bas
ic v
ocat
iona
l edu
catio
n, in
the
tota
l pop
ulat
ion,
in th
e sa
me
age
grou
p.
b Dat
a ob
tain
ed fr
om th
e Eu
rost
at w
ebsi
te o
n 14
th Ja
nuar
y 20
10.
c Dat
a ob
tain
ed fr
om th
e Eu
rost
at w
ebsi
te o
n 14
th Ja
nuar
y 20
10.
d Shar
e of
per
sons
age
d 18
-24
with
low
er se
cond
ary
educ
atio
n at
mos
t, an
d w
ho a
re n
ot p
artic
ipat
ing
in e
duca
tion
or tr
aini
ng in
the
sam
e ag
e gr
oup.
e Pr
elim
inar
y da
ta.
f In th
e ye
ars:
200
4,20
05,2
006
–pay
men
ts to
the
stat
e bu
dget
from
the
Euro
pean
Uni
on.
g Dat
a si
nce
2000
incl
udin
g pr
ofes
sion
al s
oldi
ers
in e
xten
ded
man
dato
ry m
ilita
ry s
ervi
ce, i
n 20
02 in
two
dim
ensi
ons:
con
side
ring
empl
oyed
per
sons
in
priv
ate
farm
s in
agric
ultu
re o
n th
e ba
sis o
f the
resu
lts o
f the
Agr
icul
tura
l Cen
sus 1
996
(num
erat
or) a
nd P
opul
atio
n an
d H
ousi
ng C
ensu
s 200
2, a
s wel
l as t
he
Agr
icul
tura
l Cen
sus 2
002(
deno
min
ator
). h D
ata
from
the
Euro
stat
web
site
from
the
14th
Janu
ary
2010
. So
urce
: ow
n w
ork
on th
e ba
sis o
f Cen
tral S
tatis
tical
Offi
ce (G
US)
dat
a.

Tab
le 9
. Rep
ort f
rom
test
ing
the
mod
el o
f tur
nove
r pro
fitab
ility
for P
olish
ent
erpr
ises
Model
Symbol
Correlation convergence
Coefficient of determination
As a result of the coincidence test I eliminated the following variables
New form of the model containing the variables
Correlation convergence
Coefficient of determination
Significance of the regression model
Significance of the individual regression coefficients
Conclusion
1 2
3 4
5 6
7 8
9 10
11
1
x 1
0.000196384
0.999803616
0.183706
0.816294004
F =
7.41
tα
0 =
1.73
5686
038
mod
el in
sign
ifica
nt
x 9
x 1
tα1
= –1
.716
4310
3 x 8
x 1
1 x 8
F
* =
6.99
tα
2 =
0.70
5669
147
x 9
x 13
x 20
tα3
= –0
.173
6706
7 x 1
1
t* =
2.5
71
x 13
F >
F*
|tα0|
< t*
stat
emen
t unf
ulfil
led
|tα1|
< t*
x 20
stat
emen
t ful
fille
d |tα
2| <
t*
|tα3|
< t*
2
x 1
9.07E–05
0.999909319
x 9
x 1
0.176193753
0.823806247
F =
7.79
2617
tα
0 =
1.48
4324
83
mod
el in
sign
ifica
nt
x 8
x 11
x 8
tα1
= –1
.454
4821
3 x 9
x 1
3 x 3
6 F
* =
6.99
tα
2 =
0.29
5506
624
x 11
tα3
= –0
.494
5996
4 F
> F
* t*
= 2
.571
x 13
stat
emen
t ful
fille
d
|tα0|
< t*
stat
emen
t unf
ulfil
led
|tα1|
< t*
x 36
|tα2|
< t*
|tα3|
< t*

Tab
le 9
con
tinue
d
1 2
3 4
5 6
7 8
9 10
11
3
x 1
0.000000292
0.999999708
x 9
x 1
0.154131834
0.845868166
F =
5.48
7952
mod
el in
sign
ifica
nt
x 8
x 11
x 8
x 9
x 13
x 36
F*
= 6.
42
x 11
x 6
7 x 1
3
F
> F
* x 3
6
st
atem
ent u
nful
fille
d x 6
7
4
x 1
0.000000035
0.999999965
x 9
x 1
0.05804954
0.94195046
F =
16.2
2667
tα
0 =
–1.1
4866
878
one
sign
ifica
nt
regr
essi
on c
oeffi
cien
t
x 8
x 11
x 8
tα1
= 1.
1612
4994
9 x 9
x 1
3 x 3
6 F
* =
6.42
tα
2 =
–1.5
9388
261
x 11
x 6
4 tα
3 =
–1.9
4578
144
tα4
= 2.
8532
3033
4
x 13
F >
F*
t* =
2.7
76
stat
emen
t ful
fille
d
|tα0|
< t*
stat
emen
t for
|tα
4| >
t*
fulfi
lled
x 36
|tα1|
< t*
|tα
2| >
t *
x 64
|tα3|
< t*
|tα
4| >
t*
5
x 1
0.000145017
0.999854983
x 9
x 1
0.1825386
0.817461376
F =
7.46
3821
tα
0 =
1.71
9593
65
mod
el in
sign
ifica
nt
x 11
x 8
tα1
= –1
.699
3611
4 x 8
x 1
3 x 2
2 F
* =
6.99
tα
2 =
0.66
6415
791
x 9
tα3
= –0
.249
6606
5 x 1
1 F
> F
* t*
= 2
.571
x 1
3
stat
emen
t ful
fille
d
|tα0|
< t*
|tα
1| <
t*
|tα2|
< t*
|tα
3| <
t*
stat
emen
t unf
ulfil
led
x 22

Tab
le 9
con
tinue
d
1 2
3 4
5 6
7 8
9 10
11
6
x 1
0.09396619
0.90603381
x 8
x 1
0.1611362
0.83886376
F =
8.67
6548
tα
0 =
0.57
5012
241
mod
el in
sign
ifica
nt
x 13
x 11
tα1
= –0
.703
4992
1 x 8
x 68
F*
= 6.
99
tα2
= 0.
8740
7253
7 x 1
1
tα
3 =
–0.7
5364
406
x 13
F >
F*
t* =
2.5
71
stat
emen
t ful
fille
d
|tα0|
< t*
|tα
1| <
t*
|tα2|
< t*
|tα
3| <
t*
stat
emen
t unf
ulfil
led
x 36
x 68
Sour
ce: a
utho
r’s w
ork.