Factors Determining Public Demand for Safe … Paper/WorkingPaper-58.pdfPIDE Working Papers 2010: 58...
34
PIDE Working Papers 2010: 58 Factors Determining Public Demand for Safe Drinking Water (A Case Study of District Peshawar) Iftikhar Ahmad Pakistan Institute of Development Economics, Islamabad Miraj ul Haq Pakistan Institute of Development Economics, Islamabad and Abdul Sattar Pakistan Institute of Development Economics, Islamabad PAKISTAN INSTITUTE OF DEVELOPMENT ECONOMICS ISLAMABAD
-
Upload
trinhxuyen -
Category
Documents
-
view
217 -
download
1
Transcript of Factors Determining Public Demand for Safe … Paper/WorkingPaper-58.pdfPIDE Working Papers 2010: 58...
PIDE Working Papers 2010: 58
Factors Determining Public Demand for Safe Drinking Water
(A Case Study of District Peshawar)
Iftikhar Ahmad Pakistan Institute of Development Economics, Islamabad
Miraj ul Haq Pakistan Institute of Development Economics, Islamabad
and
Abdul Sattar Pakistan Institute of Development Economics, Islamabad
PAKISTAN INSTITUTE OF DEVELOPMENT ECONOMICS ISLAMABAD
All rights reserved. No part of this publication may be reproduced, stored in a retrieval system or transmitted in any form or by any means—electronic, mechanical, photocopying, recording or otherwise—without prior permission of the Publications Division, Pakistan Institute of Development Economics, P. O. Box 1091, Islamabad 44000.
© Pakistan Institute of Development Economics, 2010.
Pakistan Institute of Development Economics Islamabad, Pakistan
E-mail: [email protected] Website: http://www.pide.org.pk Fax: +92-51-9248065
Designed, composed, and finished at the Publications Division, PIDE.
C O N T E N T S
Page
Abstract vi
I. Introduction 1
I.a. Situation in District Peshawar 2
II. Literature Review 4
III. Methodology 5
III.a. Theoretical Considerations 6
III.b. Theoretical Framework 7
III.c. Econometric Specification 7
IV. Data Description and Variable Construction 8
V. Empirical Estimation 16
V.a. Binary Logistic Regression Equation 16
V.b. Multinomial Logistic Model for WTP 18
V.c. HH’s Willingness-to-pay Parameters for Municipal Corporation 19
V.d. HH’s Willingness-to-pay Parameters for Private Company 20
VI. Conclusion and Recommendations 22
Appendices 23
References 24
List of Tables Table 1. Percentage Distribution of HHs by Sources of Drinking
Water 3
Table 2. Sources of Drinking Water at Home by Sample HHs (%) 3
Table 3. Sample Profile by Rural and Urban Areas 9
Table 4. Education Disparity by Gender 9
Table 5. Sample Age Characteristics by HH Head Education 10
Table 6. HH Perception Regarding Level of Awareness in Locality 11
(iv)
Page
Table 7. Water Purification Adoption and HH Head’s Media Exposures (%) 12
Table 8. Water Purification Methods and Wealth of HHs (%) 13
Table 9. Water Purification Methods, Location and Diarrhoea Episode in HHs (%) 14
Table 10. Acceptance for Improved Water Supply System 14
Table 11. Water Quality Responses 15
Table 12. Maximum WTP Behaviour by HH Head Educational Level (%) 16
Table 13. Maximum WTP Behaviour by Media Exposures of HH Heads (%) 16
Table 14. Marginal Effects in Binary Logistic Regression 17
Table 15. Wald Tests on Parameters for Binary Logit Model 18
Table 16. Marginal Effects of Willingness-to-pay from Multinomial Logit Regression 18
Table 17. Wald Tests on Parameters for Multinomial Logit Model 19
Table 18. Wald Parameters for Municipal Corporation 20
Table 19. WTP Parameters for Private Company 21
List of Figures
Figure 1. Educational Disparity among Male and Female in District Peshawar 10
Figure 2. Diseases Prevalence Rate among HHs 11
Figure 3. Response about Government and Private Water Systems 14
ABSTRACT
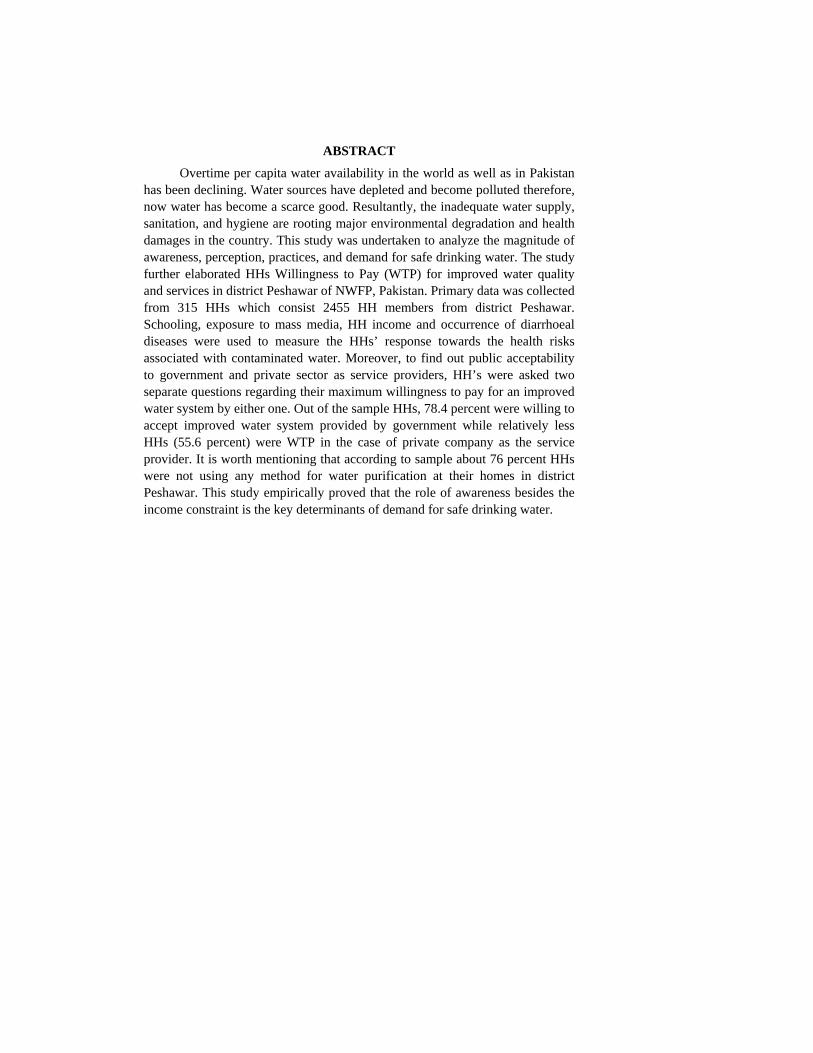
Overtime per capita water availability in the world as well as in Pakistan has been declining. Water sources have depleted and become polluted therefore, now water has become a scarce good. Resultantly, the inadequate water supply, sanitation, and hygiene are rooting major environmental degradation and health damages in the country. This study was undertaken to analyze the magnitude of awareness, perception, practices, and demand for safe drinking water. The study further elaborated HHs Willingness to Pay (WTP) for improved water quality and services in district Peshawar of NWFP, Pakistan. Primary data was collected from 315 HHs which consist 2455 HH members from district Peshawar. Schooling, exposure to mass media, HH income and occurrence of diarrhoeal diseases were used to measure the HHs’ response towards the health risks associated with contaminated water. Moreover, to find out public acceptability to government and private sector as service providers, HH’s were asked two separate questions regarding their maximum willingness to pay for an improved water system by either one. Out of the sample HHs, 78.4 percent were willing to accept improved water system provided by government while relatively less HHs (55.6 percent) were WTP in the case of private company as the service provider. It is worth mentioning that according to sample about 76 percent HHs were not using any method for water purification at their homes in district Peshawar. This study empirically proved that the role of awareness besides the income constraint is the key determinants of demand for safe drinking water.
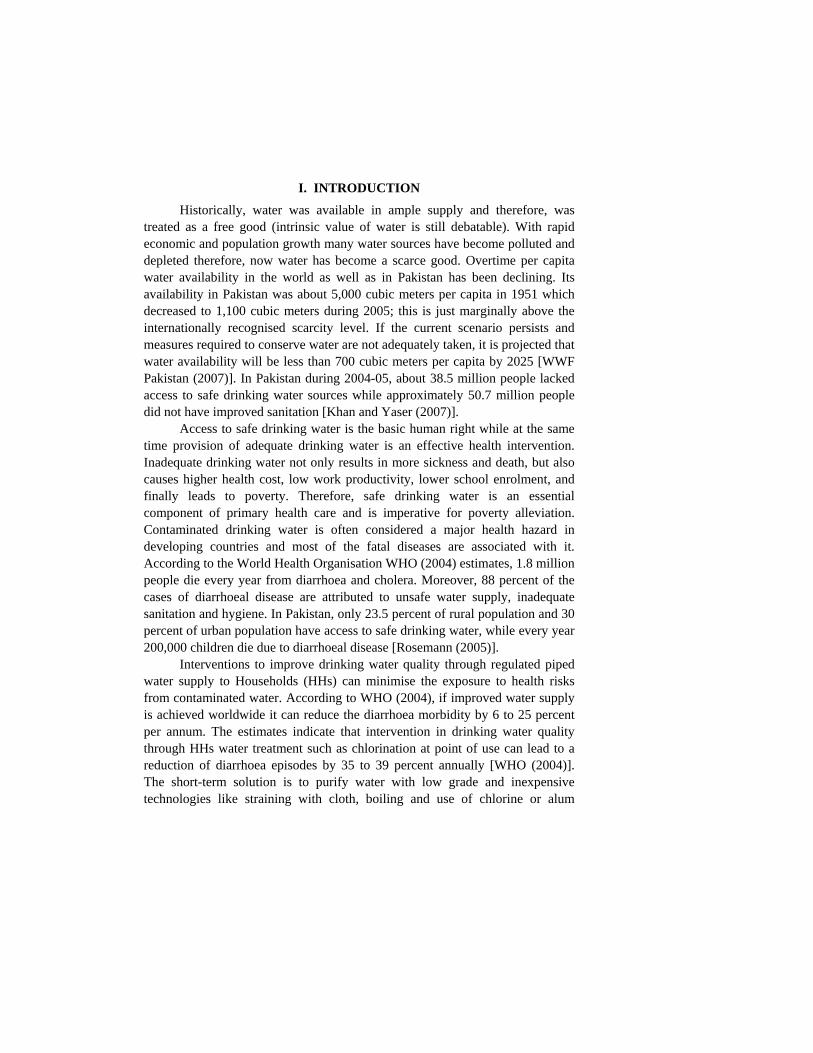
I. INTRODUCTION
Historically, water was available in ample supply and therefore, was treated as a free good (intrinsic value of water is still debatable). With rapid economic and population growth many water sources have become polluted and depleted therefore, now water has become a scarce good. Overtime per capita water availability in the world as well as in Pakistan has been declining. Its availability in Pakistan was about 5,000 cubic meters per capita in 1951 which decreased to 1,100 cubic meters during 2005; this is just marginally above the internationally recognised scarcity level. If the current scenario persists and measures required to conserve water are not adequately taken, it is projected that water availability will be less than 700 cubic meters per capita by 2025 [WWF Pakistan (2007)]. In Pakistan during 2004-05, about 38.5 million people lacked access to safe drinking water sources while approximately 50.7 million people did not have improved sanitation [Khan and Yaser (2007)].
Access to safe drinking water is the basic human right while at the same time provision of adequate drinking water is an effective health intervention. Inadequate drinking water not only results in more sickness and death, but also causes higher health cost, low work productivity, lower school enrolment, and finally leads to poverty. Therefore, safe drinking water is an essential component of primary health care and is imperative for poverty alleviation. Contaminated drinking water is often considered a major health hazard in developing countries and most of the fatal diseases are associated with it. According to the World Health Organisation WHO (2004) estimates, 1.8 million people die every year from diarrhoea and cholera. Moreover, 88 percent of the cases of diarrhoeal disease are attributed to unsafe water supply, inadequate sanitation and hygiene. In Pakistan, only 23.5 percent of rural population and 30 percent of urban population have access to safe drinking water, while every year 200,000 children die due to diarrhoeal disease [Rosemann (2005)].
Interventions to improve drinking water quality through regulated piped water supply to Households (HHs) can minimise the exposure to health risks from contaminated water. According to WHO (2004), if improved water supply is achieved worldwide it can reduce the diarrhoea morbidity by 6 to 25 percent per annum. The estimates indicate that intervention in drinking water quality through HHs water treatment such as chlorination at point of use can lead to a reduction of diarrhoea episodes by 35 to 39 percent annually [WHO (2004)]. The short-term solution is to purify water with low grade and inexpensive technologies like straining with cloth, boiling and use of chlorine or alum
2
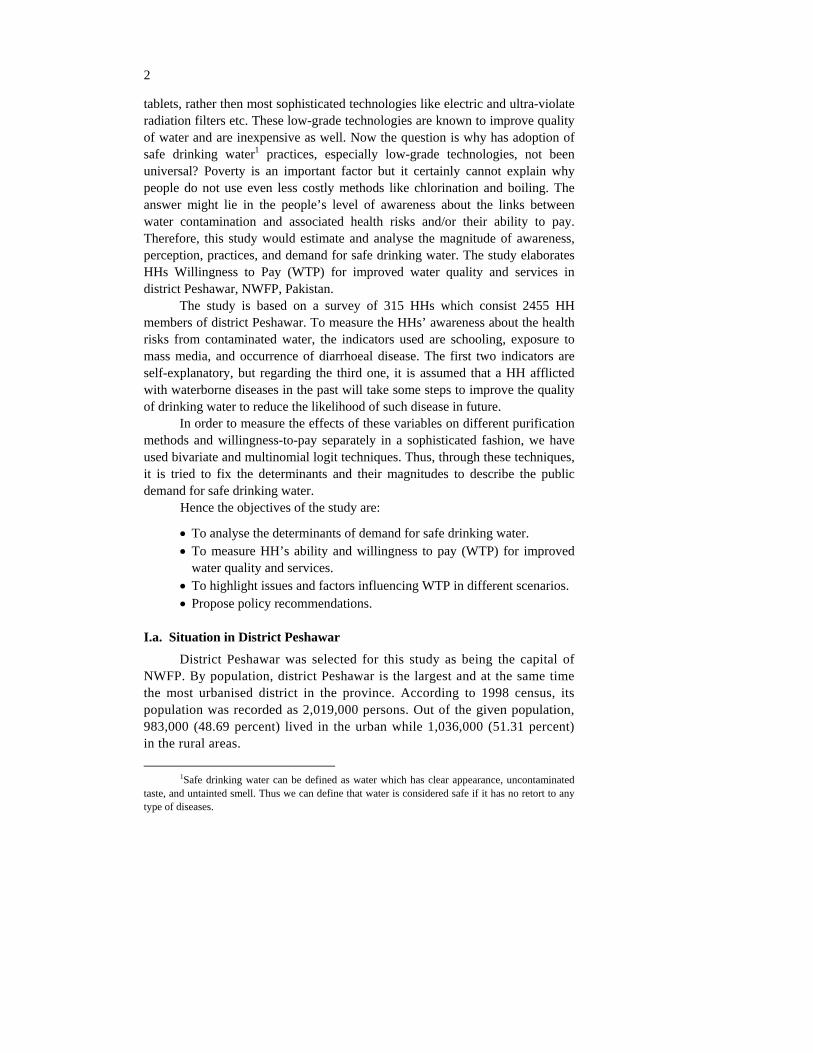
tablets, rather then most sophisticated technologies like electric and ultra-violate radiation filters etc. These low-grade technologies are known to improve quality of water and are inexpensive as well. Now the question is why has adoption of safe drinking water1 practices, especially low-grade technologies, not been universal? Poverty is an important factor but it certainly cannot explain why people do not use even less costly methods like chlorination and boiling. The answer might lie in the people’s level of awareness about the links between water contamination and associated health risks and/or their ability to pay. Therefore, this study would estimate and analyse the magnitude of awareness, perception, practices, and demand for safe drinking water. The study elaborates HHs Willingness to Pay (WTP) for improved water quality and services in district Peshawar, NWFP, Pakistan.
The study is based on a survey of 315 HHs which consist 2455 HH members of district Peshawar. To measure the HHs’ awareness about the health risks from contaminated water, the indicators used are schooling, exposure to mass media, and occurrence of diarrhoeal disease. The first two indicators are self-explanatory, but regarding the third one, it is assumed that a HH afflicted with waterborne diseases in the past will take some steps to improve the quality of drinking water to reduce the likelihood of such disease in future.
In order to measure the effects of these variables on different purification methods and willingness-to-pay separately in a sophisticated fashion, we have used bivariate and multinomial logit techniques. Thus, through these techniques, it is tried to fix the determinants and their magnitudes to describe the public demand for safe drinking water.
Hence the objectives of the study are:
To analyse the determinants of demand for safe drinking water.
To measure HH’s ability and willingness to pay (WTP) for improved water quality and services.
To highlight issues and factors influencing WTP in different scenarios.
Propose policy recommendations.
I.a. Situation in District Peshawar
District Peshawar was selected for this study as being the capital of NWFP. By population, district Peshawar is the largest and at the same time the most urbanised district in the province. According to 1998 census, its population was recorded as 2,019,000 persons. Out of the given population, 983,000 (48.69 percent) lived in the urban while 1,036,000 (51.31 percent) in the rural areas.
1Safe drinking water can be defined as water which has clear appearance, uncontaminated taste, and untainted smell. Thus we can define that water is considered safe if it has no retort to any type of diseases.
3
With the passage of time, situation of drinking water in the district is
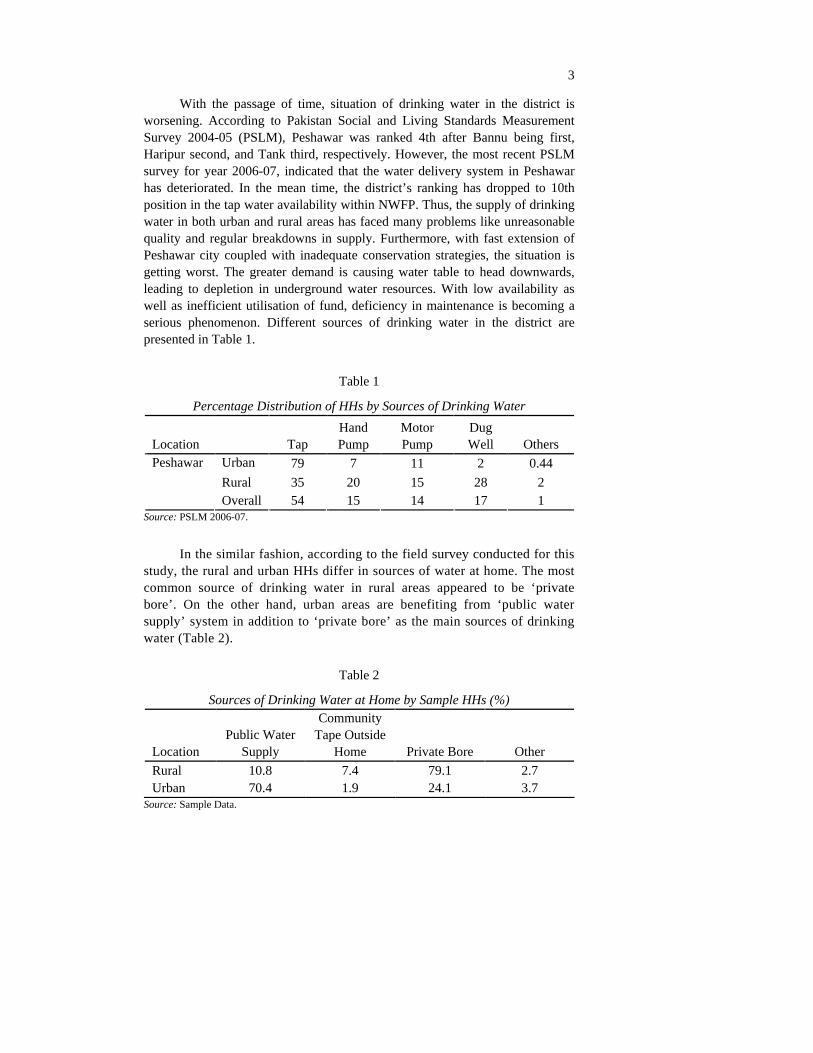
worsening. According to Pakistan Social and Living Standards Measurement Survey 2004-05 (PSLM), Peshawar was ranked 4th after Bannu being first, Haripur second, and Tank third, respectively. However, the most recent PSLM survey for year 2006-07, indicated that the water delivery system in Peshawar has deteriorated. In the mean time, the district’s ranking has dropped to 10th position in the tap water availability within NWFP. Thus, the supply of drinking water in both urban and rural areas has faced many problems like unreasonable quality and regular breakdowns in supply. Furthermore, with fast extension of Peshawar city coupled with inadequate conservation strategies, the situation is getting worst. The greater demand is causing water table to head downwards, leading to depletion in underground water resources. With low availability as well as inefficient utilisation of fund, deficiency in maintenance is becoming a serious phenomenon. Different sources of drinking water in the district are presented in Table 1.
Table 1
Percentage Distribution of HHs by Sources of Drinking Water
Location Tap Hand Pump
Motor Pump
Dug Well Others
Urban 79 7 11 2 0.44
Rural 35 20 15 28 2
Peshawar
Overall 54 15 14 17 1 Source: PSLM 2006-07.
In the similar fashion, according to the field survey conducted for this study, the rural and urban HHs differ in sources of water at home. The most common source of drinking water in rural areas appeared to be ‘private bore’. On the other hand, urban areas are benefiting from ‘public water supply’ system in addition to ‘private bore’ as the main sources of drinking water (Table 2).
Table 2
Sources of Drinking Water at Home by Sample HHs (%)
Location Public Water
Supply
Community Tape Outside
Home Private Bore Other
Rural 10.8 7.4 79.1 2.7 Urban 70.4 1.9 24.1 3.7
Source: Sample Data.
4
II. LITERATURE REVIEW
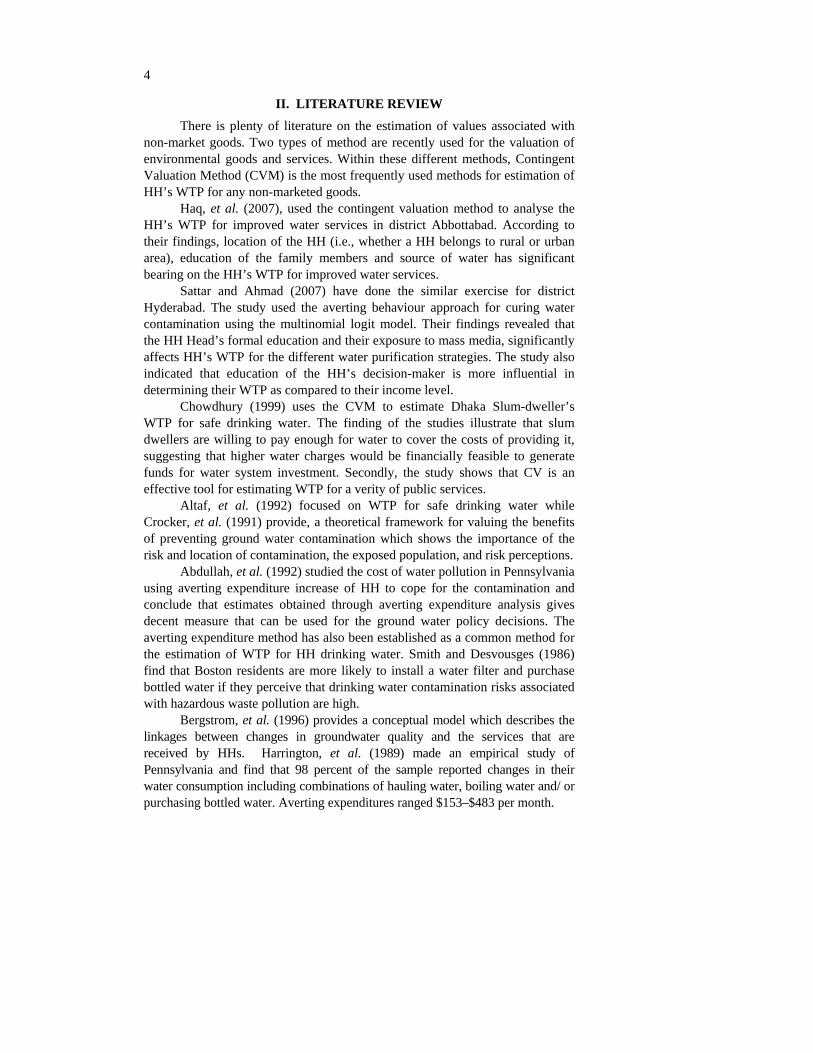
There is plenty of literature on the estimation of values associated with non-market goods. Two types of method are recently used for the valuation of environmental goods and services. Within these different methods, Contingent Valuation Method (CVM) is the most frequently used methods for estimation of HH’s WTP for any non-marketed goods.
Haq, et al. (2007), used the contingent valuation method to analyse the HH’s WTP for improved water services in district Abbottabad. According to their findings, location of the HH (i.e., whether a HH belongs to rural or urban area), education of the family members and source of water has significant bearing on the HH’s WTP for improved water services.
Sattar and Ahmad (2007) have done the similar exercise for district Hyderabad. The study used the averting behaviour approach for curing water contamination using the multinomial logit model. Their findings revealed that the HH Head’s formal education and their exposure to mass media, significantly affects HH’s WTP for the different water purification strategies. The study also indicated that education of the HH’s decision-maker is more influential in determining their WTP as compared to their income level.
Chowdhury (1999) uses the CVM to estimate Dhaka Slum-dweller’s WTP for safe drinking water. The finding of the studies illustrate that slum dwellers are willing to pay enough for water to cover the costs of providing it, suggesting that higher water charges would be financially feasible to generate funds for water system investment. Secondly, the study shows that CV is an effective tool for estimating WTP for a verity of public services.
Altaf, et al. (1992) focused on WTP for safe drinking water while Crocker, et al. (1991) provide, a theoretical framework for valuing the benefits of preventing ground water contamination which shows the importance of the risk and location of contamination, the exposed population, and risk perceptions.
Abdullah, et al. (1992) studied the cost of water pollution in Pennsylvania using averting expenditure increase of HH to cope for the contamination and conclude that estimates obtained through averting expenditure analysis gives decent measure that can be used for the ground water policy decisions. The averting expenditure method has also been established as a common method for the estimation of WTP for HH drinking water. Smith and Desvousges (1986) find that Boston residents are more likely to install a water filter and purchase bottled water if they perceive that drinking water contamination risks associated with hazardous waste pollution are high.
Bergstrom, et al. (1996) provides a conceptual model which describes the linkages between changes in groundwater quality and the services that are received by HHs. Harrington, et al. (1989) made an empirical study of Pennsylvania and find that 98 percent of the sample reported changes in their water consumption including combinations of hauling water, boiling water and/ or purchasing bottled water. Averting expenditures ranged $153–$483 per month.
5
Whitehead, et al. (1998) surveyed Gaston County, North Carolina and used
the averting behaviour approach. They found that respondents were concerned about risks to health from ground water pollution are 1.67 times more likely to use a water filter. On the other hand, respondents who rate their water quality as fair or poor are 2.4 times more likely to use water filter. While, Collins, et al. (1993) examined the actions taken by HHs in rural West Virginia in response to test that revealed several contaminants in drinking water supplies. The most common types of action was to clean and/or repair the water system, haul water, install treatment systems, boil water, use a new water source, and/or correcting the contamination source. The average HH cost of defensive behaviour ranged from $32 and $36 per month for bacterial and mineral contaminants. The total HH cost related to organic contaminants was $109 per month.
Laughland, et al. (1993) estimate averting expenditures for HHs in Milesburg and Boggs Township, Pennsylvania who experience a surface water contamination episode. During the three-month boil water advisory programme, most of the respondents (91 percent) boiled, hauled, or purchased water. The average monthly HH defensive expenditures ranged between $16 and $35.
Abrahms, et al. (2000) used the multinomial logit model of averting behaviour in response to water contamination risks for Georgia residents. According to his estimation that perceived risk from tap water, concern about water quality (taste, odour, and appearance of tap water), race and age are the most important determinants of bottled water selection. Information regarding current or prior problems with tap water, perceived risk from tap water, and income are the most important determinants of water filter selection. Adjusting for quality differences between tap and bottled water, he showed that averting costs estimates using bottled water expenditures would lead to an overstatement of avoidance costs by about 12 percent.
Hence, the literature suggests that contingent valuation method as well as the averting behaviour approach, are viable techniques to quantify HH’s Willingness to Pay (WTP) for non-marketed goods. Thus the given literature provided sound footings to this study to value HH’s WTP for safe drinking water in district Peshawar.
III. METHODOLOGY
The HH’s preferences regarding their day-to-day budget allocation decisions have been the central issue in economic theory and literature. This section of the study elaborates the theoretical consideration of consumer’s preferences and the methodology that is used to estimate demand for safe drinking water practices as function of awareness and wealth of the HHs. The traditional demand functions, besides income and consumption pattern, are also depending on several other factors capturing preference structure of HHs like demographic composition, educational levels, profession and residential status of HHs [Deaton (1980)].
6
III.a. Theoretical Considerations
III.a.1. Demand Function
The traditional Marshallian demand function of a particular HH for any good is a function of its own price, income and other characteristics of the HHs representing their preference structure. In our context, the budget allocation decision making of HHs is best described as a multi-stage budget process. At the first stage, a typical HH will allocate the budget among major consumption categories like food, clothing, housing and health etc. This decision is made in the light of the given budget, price indices of broad consumption categories and HH preference structure. At the second stage, the expenditure allocated to each category at the first stage is distributed among various sub-categories. At this stage the allocation will depend on the price of sub-category and budget allocated to broader category. Likewise, we can have third and even more stages of budget allocation.
In our context, the budget will first be allocated to food, health and other categories. Then at the second stage the food expenditure will be disaggregated among daily food consumption, of which demand for clean drinking water makes an important item, while health expenditure will be allocated for curing diarrhoea and other waterborne diseases along with other items.
At each stage of budget allocation, the size of given budget, prices and preference structure of HH, have their importance. Engel has observed that the nature of preferences is such that income-consumption curves are skewed, that is, as income level (budget size) increases the budget share of luxuries tends to rise and that of necessities tends to decline. This observation, known as Engel law, implies that rich HHs are more likely to allocate a larger share of their budget to more expensive water purification devices. In the allocation process for the quality of drinking water, here it is assumed that HHs have four available choices namely boiling, use chlorine tablets, ordinary filter and electric filter. If the HHs are fully aware of adverse health effects of using contaminated drinking water then boiling and use of chlorine tablets are necessities, while electric filter can be considered as a luxury good. It is expected that richer HHs are more likely to use electric filter than the poor HHs and they would spend a larger budget share on it. The HH expenditure on different goods or their consumption allocation patterns for different commodities, have different economic implications. Similarly, the demand for safe drinking water practices and income allocation patterns for such practices have not only serious implications on HH’s economic behaviour but also produce serious health productivity shocks on the aggregate country level.
Since the preference structure of a HH depends crucially on the level of information that the HH have regarding the utility producing attributes of various goods, the variables that represent the information about the HH, also
7
matter. These variables will typically include educational level of HH heads (which are the decision-makers) and other members of HH; as well as the practices of collecting information through newspaper, radio and television. In the cross-sectional data, HHs face the identical prices as no genuine variation in the prices can be observed at a point of time, so here we cannot use the price of water purification method in the demand estimation.
III.b. Theoretical Framework
Basically two theoretical approaches (the direct and indirect) are used for making reliable estimates of HH’s WTP for improvement in service and quality of water [Abdullah, et al. (1992)].
(i) The direct approach uses stated preference in which simply the individuals are directly asked how much he/she would be willing to pay for the improved water service. This is called contingent valuation method (CVM).
(ii) The indirect approach uses data on observed water use behaviour (revealed preference) for averting the effects of inefficient and unsafe water qualities to estimate WTP. To survive the issue, consumers develop various coping strategies. The coping cost give an estimate of how much additional money people are willing to pay for an improved quality.
III.b.1. Contingent Valuation Method (CVM)
To consider the main objective “WTP for improved service level” we apply CVM. Contingent Valuation (CV) is a method of estimating the economic value of non-market environmental goods through survey questions that bring out individual’s preferences regarding such goods [Carson, et al. (1993)].
CVM surveys should carefully describe both quality levels and ask for respondent WTP for the change in quality [Mitchell, et al. (1989)]. The basic assumption behind this method is to represent or value the objective quality improvement that the survey asks them to value.
In recent time CVM has been extensively applied in both developed and developing countries to the valuation of a wide range of environmental goods and services. CVM has been successfully applied to a variety of environment related issues including water, water supply and sanitation.
III. c. Econometric Specification
Inferring about the unconditional effects of different characteristics of HHs (which influences the purification measures used by them at their homes) may produce misleading results because these variables might correlate with each other. Thus it is needed to develop an econometric model where we are able to separate out the effects of each variable.
8
We will use a bivariate logistic model to estimate the effects of different
explanatory variables on the adoption of water treatment by HHs at their homes. For water treatments at home, it is assumed that HH chooses only one method2
of purification. The variables required for estimation will be; one binary dependent variable and set of explanatory variables. The binary dependent variable takes the value equal to one if a HH uses some water purification method and zero if the HH does not use any water purification method.
The estimated coefficients from these models will not be directly interpretable. For this, we will calculate marginal effects of each variable that is the effects of one unit change in explanatory variables on the estimated probability of adopting a purification method.
The multinomial Logit model was used for the demand and WTP for the water treatments at homes. Questions were asked that if HHs were provided safe drinking water by Municipal Corporation (MC) or a private company what will be their maximum WTP. The resulting maximum WTP were then coded in multinomial fashion. The estimated coefficients from the multinomial logit models are also difficult to interpret. We need to calculate the marginal effects of each variable.
Hence, to capture various determinants of WTP, the following multivariate regression analysis is conducted.
WTPi = ß0 + ß1 (Hi) + ß2 (Di) +ß3 (Mi) + ui
Where:
WTPi = HHs’ willingness for continuous and potable water supplies. Hi = HHs characteristics (Highest education level of the HH, income/
wealth level of the HH). Di = HHs demographic characteristics (urban, rural). Mi = Media Exposure of the HH Head (TV and Newspaper reading
habit).
IV. DATA DESCRIPTION AND VARIABLE CONSTRUCTION
The data used in this study was collected from District Peshawar (NWFP, Pakistan) in the year 2008. The multi-stage systematic random sampling technique was used to collect the information of 315 HHs, which consists of 2455 HH members. Thirty union councils were selected randomly out of 92 union councils of the district. The HHs were then selected from each of the thirty union councils trying to cover all the quarters. The district population is almost equally distributed between rural and urban locations [DCR (1998)], therefore we have taken equal number of union councils from each urban and rural areas of the district.
2In case a HH adopts two methods simultaneously, only the best method is considered.
9
This study estimates factors that affect demand and WTP for safe
drinking water. For this, a questionnaire was developed according to design methodology.
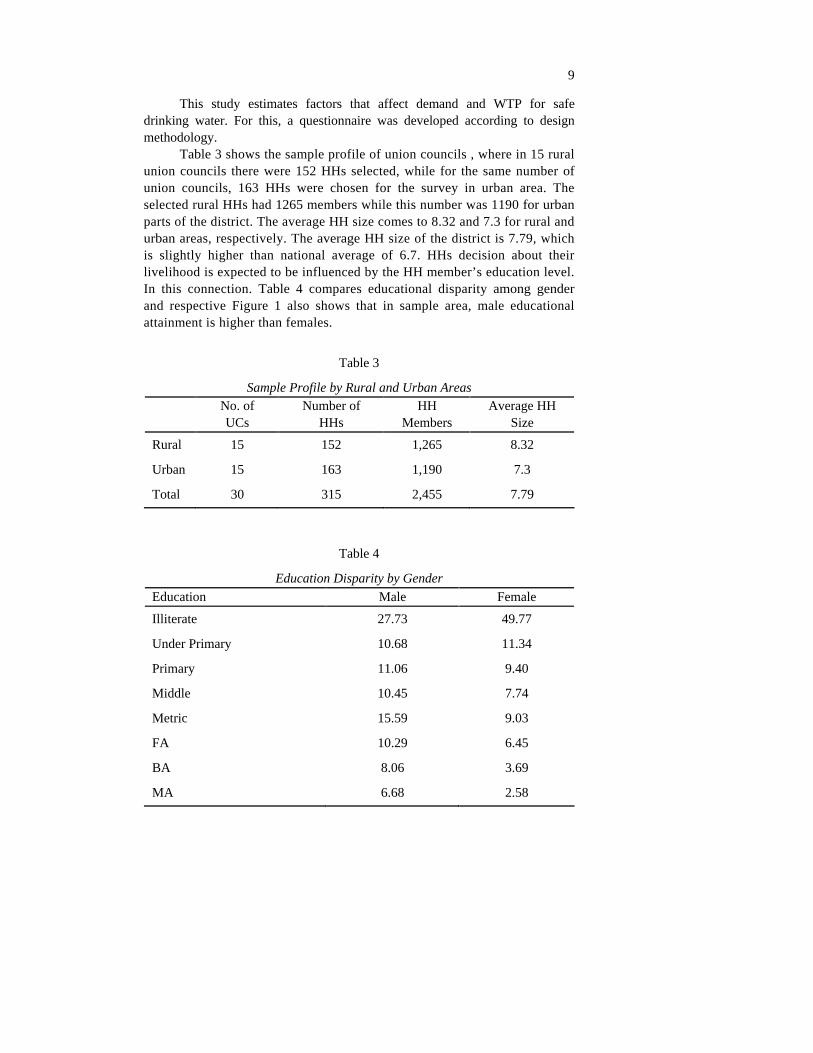
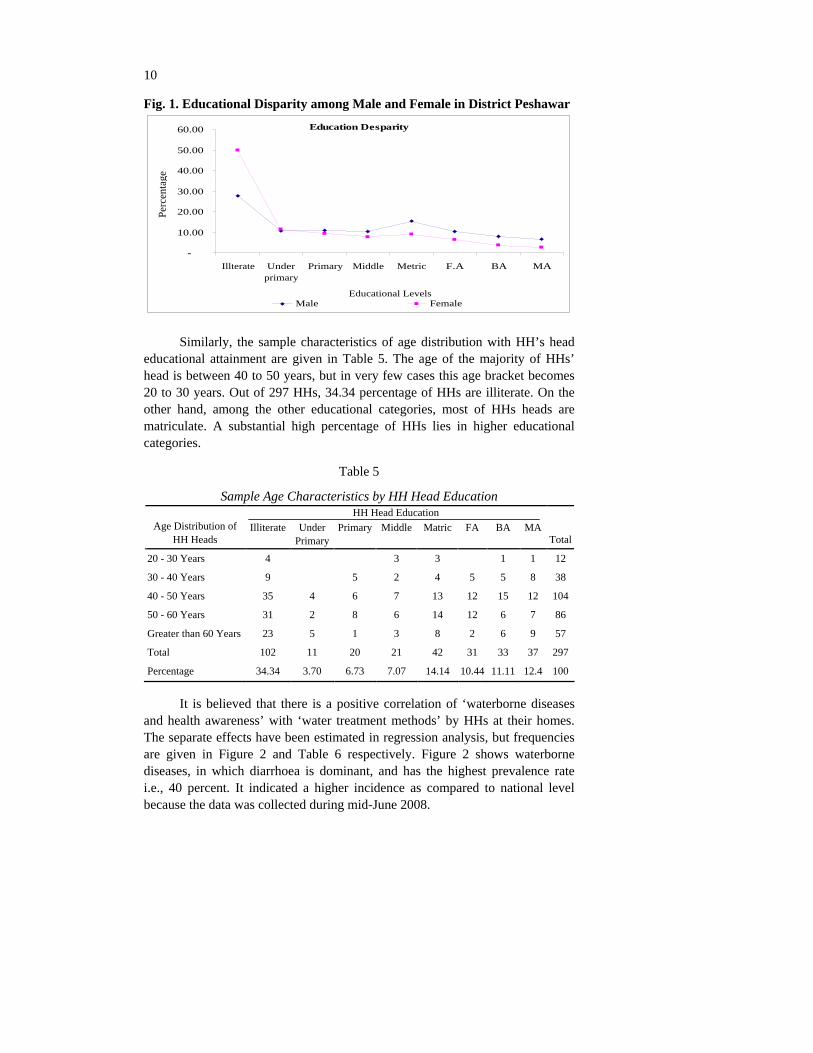
Table 3 shows the sample profile of union councils , where in 15 rural union councils there were 152 HHs selected, while for the same number of union councils, 163 HHs were chosen for the survey in urban area. The selected rural HHs had 1265 members while this number was 1190 for urban parts of the district. The average HH size comes to 8.32 and 7.3 for rural and urban areas, respectively. The average HH size of the district is 7.79, which is slightly higher than national average of 6.7. HHs decision about their livelihood is expected to be influenced by the HH member’s education level. In this connection. Table 4 compares educational disparity among gender and respective Figure 1 also shows that in sample area, male educational attainment is higher than females.
Table 3
Sample Profile by Rural and Urban Areas
No. of UCs
Number of HHs
HH Members
Average HH Size
Rural 15 152 1,265 8.32
Urban 15 163 1,190 7.3
Total 30 315 2,455 7.79
Table 4
Education Disparity by Gender
Education Male Female
Illiterate 27.73 49.77
Under Primary 10.68 11.34
Primary 11.06 9.40
Middle 10.45 7.74
Metric 15.59 9.03
FA 10.29 6.45
BA 8.06 3.69
MA 6.68 2.58
10
Fig. 1. Educational Disparity among Male and Female in District Peshawar
Education Desparity
-
10.00
20.00
30.00
40.00
50.00
60.00
Illterate Underprimary
Primary Middle Metric F.A BA MA
Educational Levels
Perc
enta
ge
Male Female
Similarly, the sample characteristics of age distribution with HH’s head educational attainment are given in Table 5. The age of the majority of HHs’ head is between 40 to 50 years, but in very few cases this age bracket becomes 20 to 30 years. Out of 297 HHs, 34.34 percentage of HHs are illiterate. On the other hand, among the other educational categories, most of HHs heads are matriculate. A substantial high percentage of HHs lies in higher educational categories.
Table 5
Sample Age Characteristics by HH Head Education HH Head Education
Age Distribution of HH Heads
Illiterate
Under Primary
Primary
Middle
Matric FA BA MA
Total
20 - 30 Years 4 3 3 1 1 12
30 - 40 Years 9 5 2 4 5 5 8 38
40 - 50 Years 35 4 6 7 13 12 15 12 104
50 - 60 Years 31 2 8 6 14 12 6 7 86
Greater than 60 Years
23 5 1 3 8 2 6 9 57
Total 102 11 20 21 42 31 33 37 297
Percentage 34.34 3.70 6.73 7.07 14.14 10.44
11.11
12.4
100
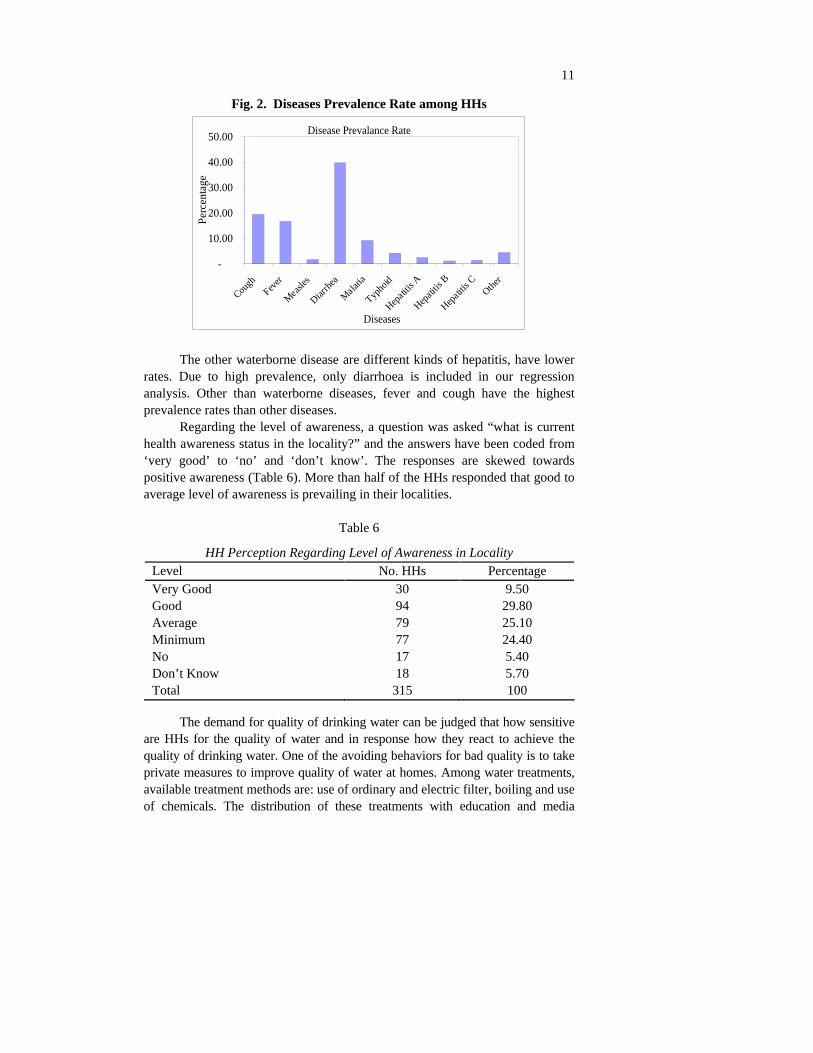
It is believed that there is a positive correlation of ‘waterborne diseases and health awareness’ with ‘water treatment methods’ by HHs at their homes. The separate effects have been estimated in regression analysis, but frequencies are given in Figure 2 and Table 6 respectively. Figure 2 shows waterborne diseases, in which diarrhoea is dominant, and has the highest prevalence rate i.e., 40 percent. It indicated a higher incidence as compared to national level because the data was collected during mid-June 2008.
Perc
enta
ge
11
Fig. 2. Diseases Prevalence Rate among HHs
Disease Prevalance Rate
-
10.00
20.00
30.00
40.00
50.00
Cough
Fever
Mea
sles
Diarrh
ea
Mala
ria
Typho
id
Hepati
tis A
Hepati
tis B
Hepati
tis C
Other
Diseases
Per
cent
age
The other waterborne disease are different kinds of hepatitis, have lower rates. Due to high prevalence, only diarrhoea is included in our regression analysis. Other than waterborne diseases, fever and cough have the highest prevalence rates than other diseases.
Regarding the level of awareness, a question was asked “what is current health awareness status in the locality?” and the answers have been coded from ‘very good’ to ‘no’ and ‘don’t know’. The responses are skewed towards positive awareness (Table 6). More than half of the HHs responded that good to average level of awareness is prevailing in their localities.
Table 6
HH Perception Regarding Level of Awareness in Locality Level No. HHs Percentage Very Good 30 9.50 Good 94 29.80 Average 79 25.10 Minimum 77 24.40 No 17 5.40 Don’t Know 18 5.70 Total 315 100
The demand for quality of drinking water can be judged that how sensitive are HHs for the quality of water and in response how they react to achieve the quality of drinking water. One of the avoiding behaviors for bad quality is to take private measures to improve quality of water at homes. Among water treatments, available treatment methods are: use of ordinary and electric filter, boiling and use of chemicals. The distribution of these treatments with education and media
12
exposure is also made. In the sample 23.57 percent HHs are using some water purification device with 15.61 percent are using the boiling technique, 1.91 percent chlorine tablets, about one percent ordinary filter and 5.10 percent electric filter. In our analysis, for the HHs using more than one method of purification we have considered only the one which is the best method.
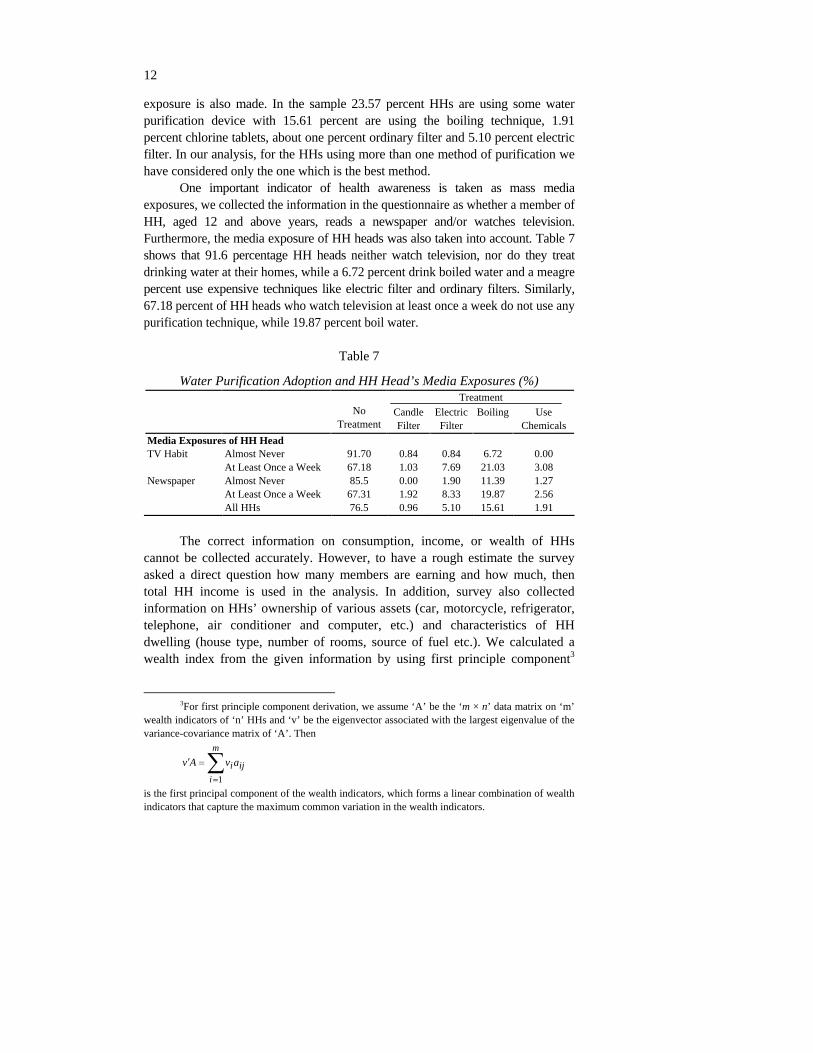
One important indicator of health awareness is taken as mass media exposures, we collected the information in the questionnaire as whether a member of HH, aged 12 and above years, reads a newspaper and/or watches television. Furthermore, the media exposure of HH heads was also taken into account. Table 7 shows that 91.6 percentage HH heads neither watch television, nor do they treat drinking water at their homes, while a 6.72 percent drink boiled water and a meagre percent use expensive techniques like electric filter and ordinary filters. Similarly, 67.18 percent of HH heads who watch television at least once a week do not use any purification technique, while 19.87 percent boil water.
Table 7
Water Purification Adoption and HH Head’s Media Exposures (%) Treatment
No Treatment
Candle Filter
Electric Filter
Boiling
Use Chemicals
Media Exposures of HH Head TV Habit Almost Never 91.70 0.84 0.84 6.72 0.00
At Least Once a Week 67.18 1.03 7.69 21.03 3.08 Newspaper Almost Never 85.5 0.00 1.90 11.39 1.27
At Least Once a Week 67.31 1.92 8.33 19.87 2.56 All HHs 76.5 0.96 5.10 15.61 1.91
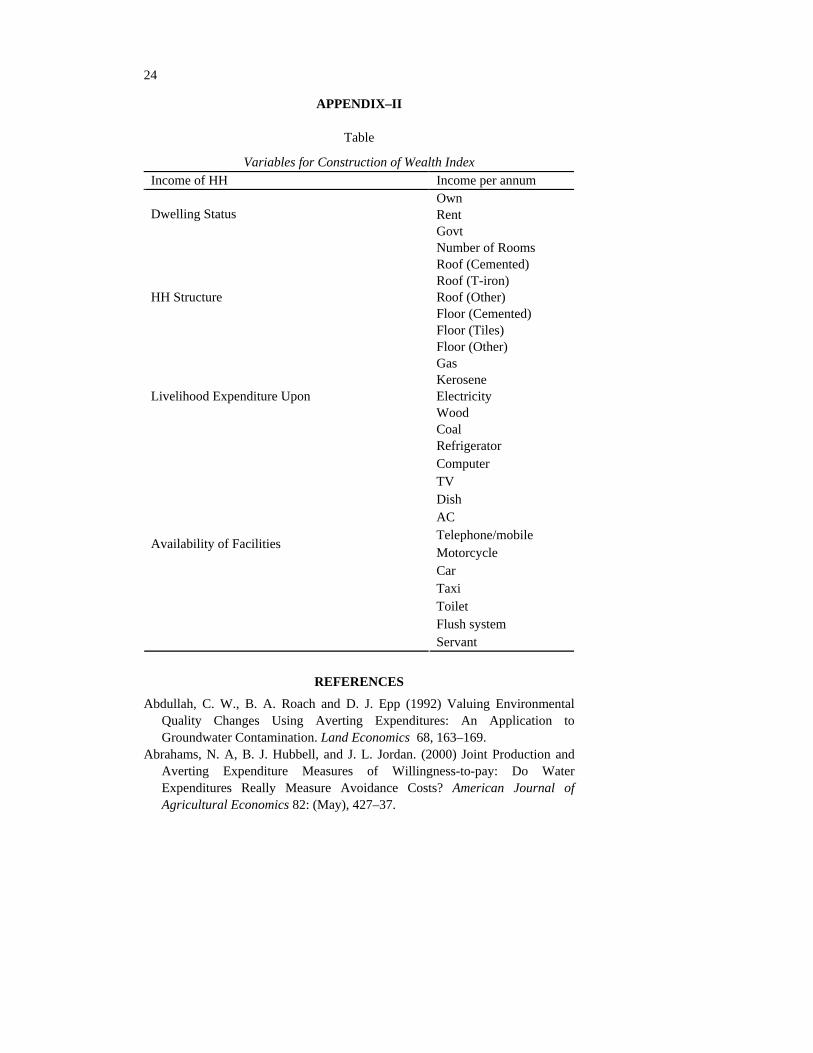
The correct information on consumption, income, or wealth of HHs cannot be collected accurately. However, to have a rough estimate the survey asked a direct question how many members are earning and how much, then total HH income is used in the analysis. In addition, survey also collected information on HHs’ ownership of various assets (car, motorcycle, refrigerator, telephone, air conditioner and computer, etc.) and characteristics of HH dwelling (house type, number of rooms, source of fuel etc.). We calculated a wealth index from the given information by using first principle component3
3For first principle component derivation, we assume ‘A’ be the ‘m × n’ data matrix on ‘m’ wealth indicators of ‘n’ HHs and ‘v’ be the eigenvector associated with the largest eigenvalue of the variance-covariance matrix of ‘A’. Then
m
i
ijiavAv
1
is the first principal component of the wealth indicators, which forms a linear combination of wealth indicators that capture the maximum common variation in the wealth indicators.
13
(Appendix I). For the ease of interpretation, we create and use wealth quartiles. HHs of the least quartile corresponded to the poorer units of the sample. The wealth index acts as a proxy for unobserved wealth. The correlation between income and wealth variables was found very poor. Spearman’s rank correlation coefficient is 0.318 between two variables. This means that HHs misreported income or their life style is not a true representation of their income. We have made cross-tabulation analysis for both, but in regression analysis wealth quartiles were used instead of income as proxy of income. Due to non-reported information on HH assets by the HHs, the number of observations has reduced to 291 in the construction of wealth index.
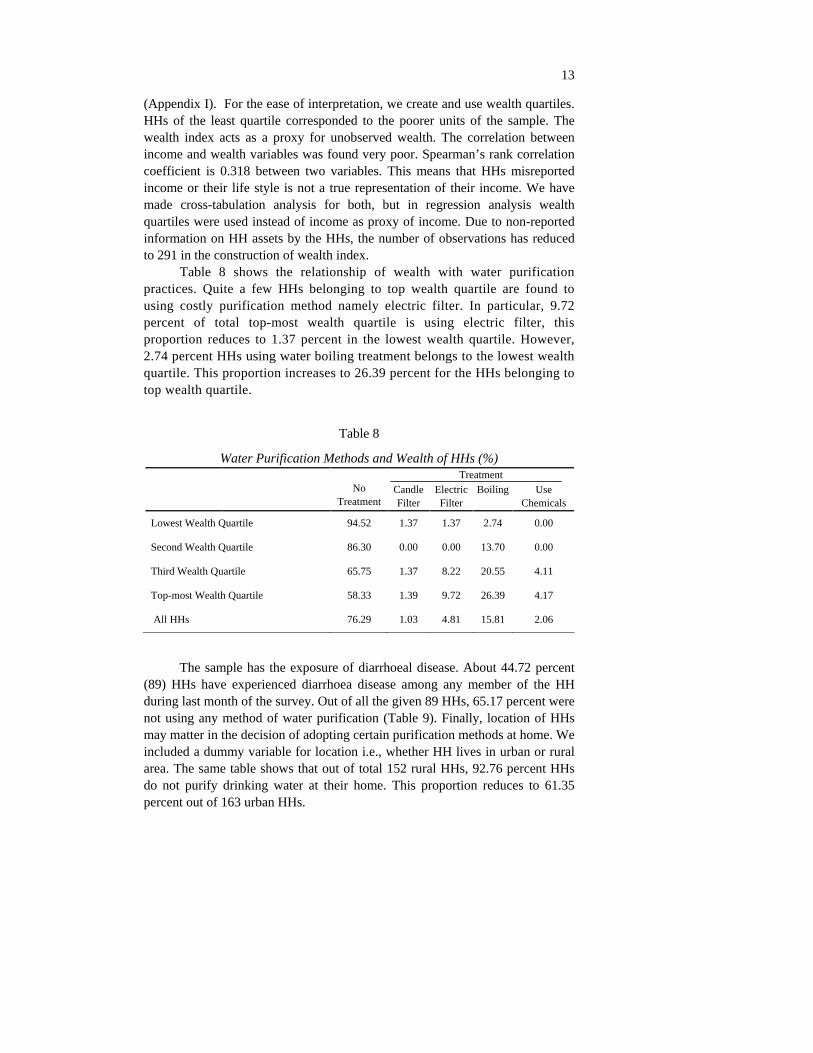
Table 8 shows the relationship of wealth with water purification practices. Quite a few HHs belonging to top wealth quartile are found to using costly purification method namely electric filter. In particular, 9.72 percent of total top-most wealth quartile is using electric filter, this proportion reduces to 1.37 percent in the lowest wealth quartile. However, 2.74 percent HHs using water boiling treatment belongs to the lowest wealth quartile. This proportion increases to 26.39 percent for the HHs belonging to top wealth quartile.
Table 8
Water Purification Methods and Wealth of HHs (%) Treatment
No Treatment
Candle Filter
Electric Filter
Boiling
Use Chemicals
Lowest Wealth Quartile 94.52 1.37 1.37 2.74 0.00
Second Wealth Quartile 86.30 0.00 0.00 13.70 0.00
Third Wealth Quartile 65.75 1.37 8.22 20.55 4.11
Top-most Wealth Quartile 58.33 1.39 9.72 26.39 4.17
All HHs 76.29 1.03 4.81 15.81 2.06
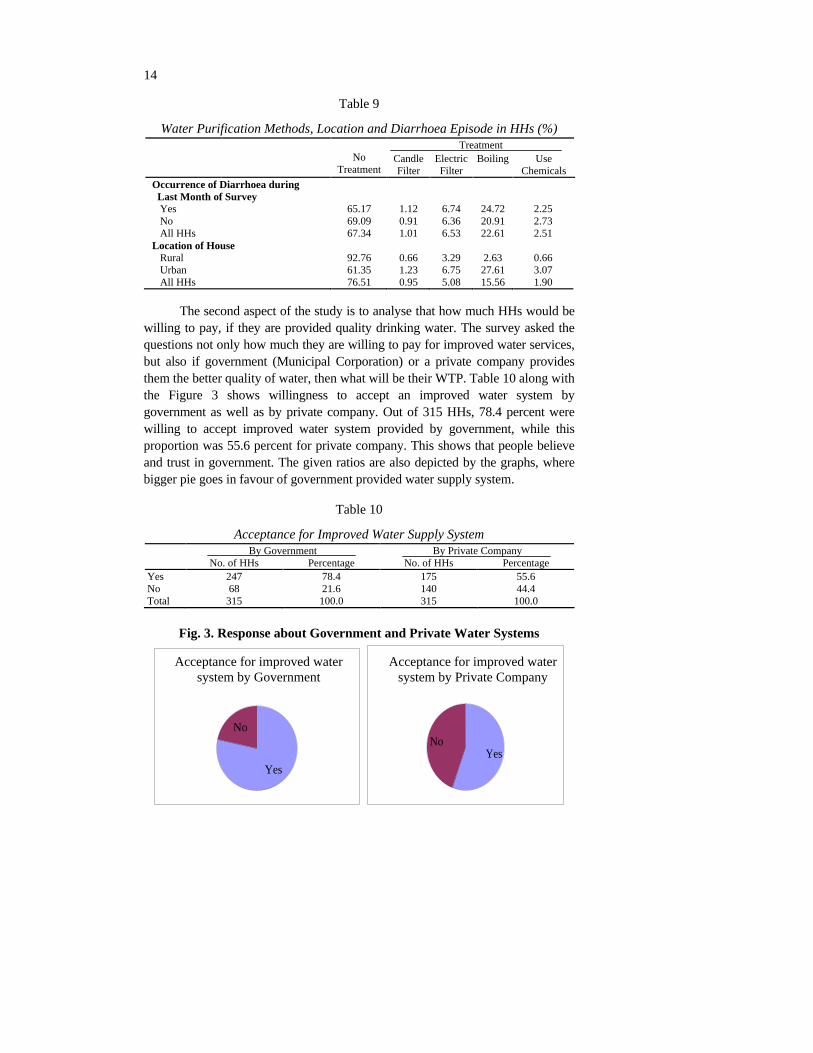
The sample has the exposure of diarrhoeal disease. About 44.72 percent (89) HHs have experienced diarrhoea disease among any member of the HH during last month of the survey. Out of all the given 89 HHs, 65.17 percent were not using any method of water purification (Table 9). Finally, location of HHs may matter in the decision of adopting certain purification methods at home. We included a dummy variable for location i.e., whether HH lives in urban or rural area. The same table shows that out of total 152 rural HHs, 92.76 percent HHs do not purify drinking water at their home. This proportion reduces to 61.35 percent out of 163 urban HHs.
14
Table 9
Water Purification Methods, Location and Diarrhoea Episode in HHs (%) Treatment
No
Treatment Candle Filter
Electric Filter
Boiling
Use
Chemicals Occurrence of Diarrhoea during Last Month of Survey Yes 65.17 1.12 6.74 24.72 2.25 No 69.09 0.91 6.36 20.91 2.73 All HHs 67.34 1.01 6.53 22.61 2.51 Location of House Rural 92.76 0.66 3.29 2.63 0.66 Urban 61.35 1.23 6.75 27.61 3.07 All HHs 76.51 0.95 5.08 15.56 1.90
The second aspect of the study is to analyse that how much HHs would be willing to pay, if they are provided quality drinking water. The survey asked the questions not only how much they are willing to pay for improved water services, but also if government (Municipal Corporation) or a private company provides them the better quality of water, then what will be their WTP. Table 10 along with the Figure 3 shows willingness to accept an improved water system by government as well as by private company. Out of 315 HHs, 78.4 percent were willing to accept improved water system provided by government, while this proportion was 55.6 percent for private company. This shows that people believe and trust in government. The given ratios are also depicted by the graphs, where bigger pie goes in favour of government provided water supply system.
Table 10
Acceptance for Improved Water Supply System By Government By Private Company
No. of HHs Percentage No. of HHs Percentage Yes 247 78.4 175 55.6 No 68 21.6 140 44.4 Total 315 100.0 315 100.0
Fig. 3. Response about Government and Private Water Systems
Acceptance for imporved water system by Govermnet
Yes
No
Acceptance for imporved water system by Private Company
YesNo
Acceptance for improved water system by Government
Acceptance for improved water system by Private Company
15
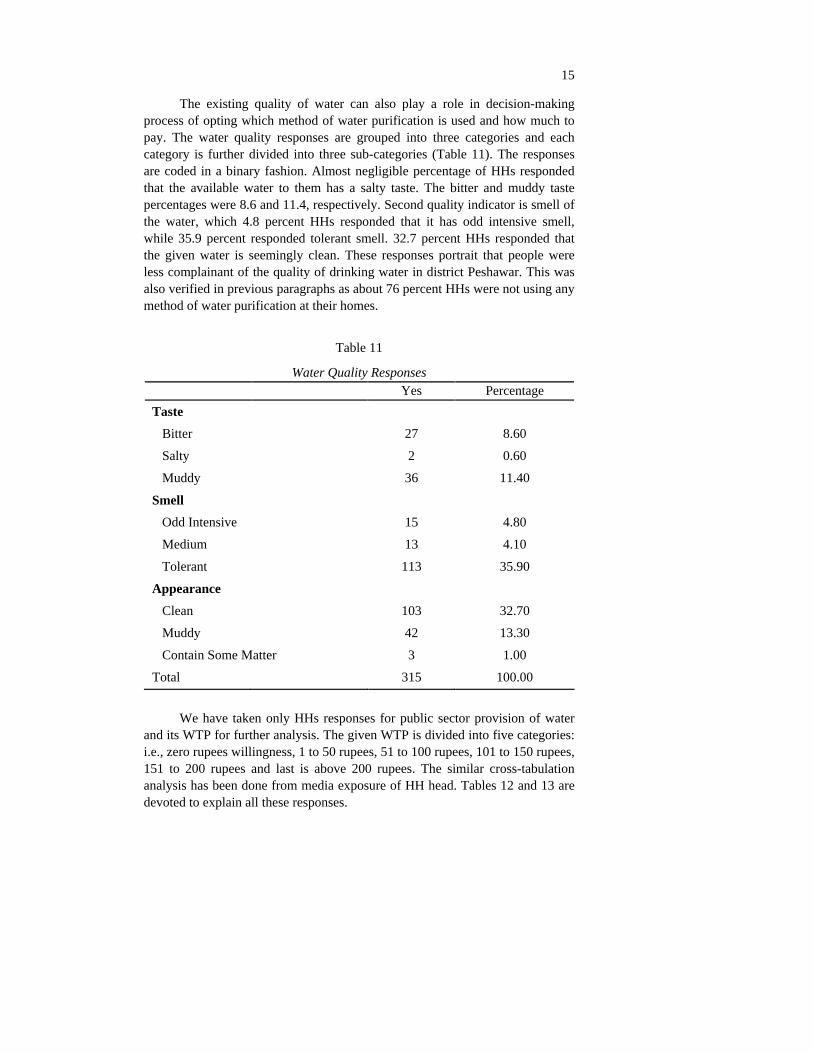
The existing quality of water can also play a role in decision-making process of opting which method of water purification is used and how much to pay. The water quality responses are grouped into three categories and each category is further divided into three sub-categories (Table 11). The responses are coded in a binary fashion. Almost negligible percentage of HHs responded that the available water to them has a salty taste. The bitter and muddy taste percentages were 8.6 and 11.4, respectively. Second quality indicator is smell of the water, which 4.8 percent HHs responded that it has odd intensive smell, while 35.9 percent responded tolerant smell. 32.7 percent HHs responded that the given water is seemingly clean. These responses portrait that people were less complainant of the quality of drinking water in district Peshawar. This was also verified in previous paragraphs as about 76 percent HHs were not using any method of water purification at their homes.
Table 11
Water Quality Responses
Yes Percentage
Taste
Bitter 27 8.60
Salty 2 0.60
Muddy 36 11.40
Smell
Odd Intensive 15 4.80
Medium 13 4.10
Tolerant 113 35.90
Appearance
Clean 103 32.70
Muddy 42 13.30
Contain Some Matter 3 1.00
Total 315 100.00
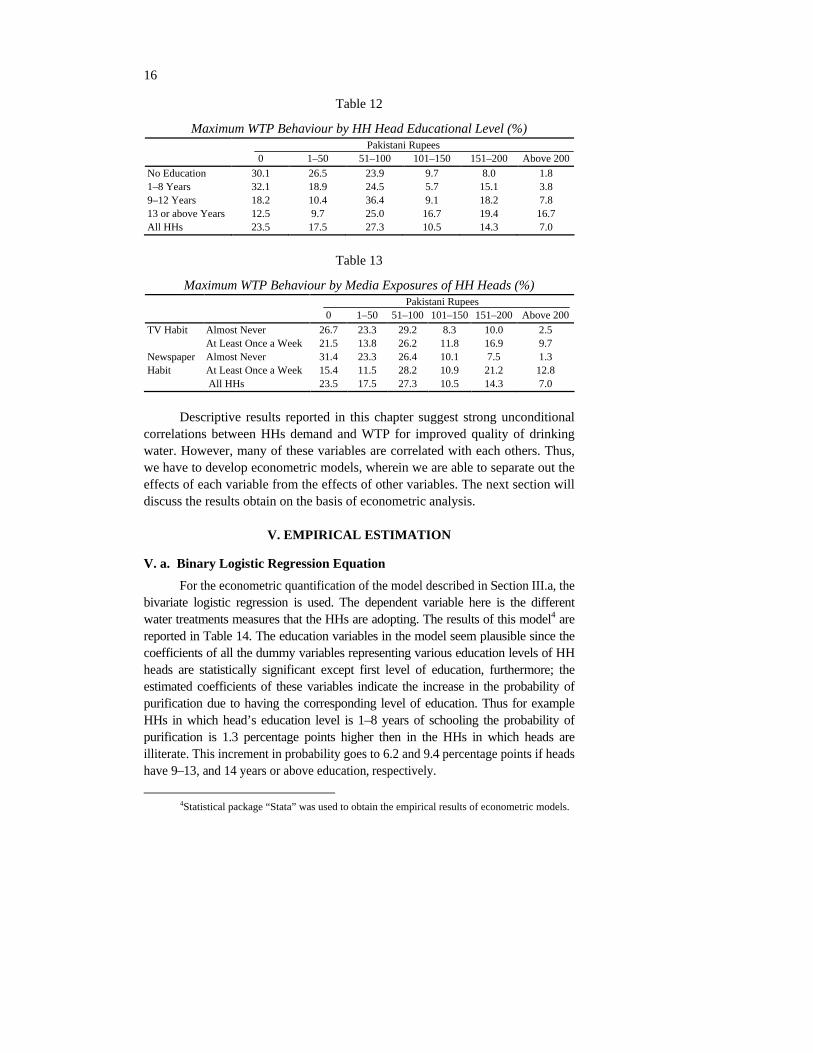
We have taken only HHs responses for public sector provision of water and its WTP for further analysis. The given WTP is divided into five categories: i.e., zero rupees willingness, 1 to 50 rupees, 51 to 100 rupees, 101 to 150 rupees, 151 to 200 rupees and last is above 200 rupees. The similar cross-tabulation analysis has been done from media exposure of HH head. Tables 12 and 13 are devoted to explain all these responses.
16
Table 12
Maximum WTP Behaviour by HH Head Educational Level (%) Pakistani Rupees
0 1–50 51–100 101–150 151–200 Above 200
No Education 30.1 26.5 23.9 9.7 8.0 1.8 1–8 Years 32.1 18.9 24.5 5.7 15.1 3.8 9–12 Years 18.2 10.4 36.4 9.1 18.2 7.8 13 or above Years 12.5 9.7 25.0 16.7 19.4 16.7 All HHs 23.5 17.5 27.3 10.5 14.3 7.0
Table 13
Maximum WTP Behaviour by Media Exposures of HH Heads (%) Pakistani Rupees
0 1–50 51–100
101–150
151–200
Above 200
TV Habit Almost Never 26.7 23.3 29.2 8.3 10.0 2.5
At Least Once a Week 21.5 13.8 26.2 11.8 16.9 9.7 Newspaper Almost Never 31.4 23.3 26.4 10.1 7.5 1.3 Habit At Least Once a Week 15.4 11.5 28.2 10.9 21.2 12.8
All HHs 23.5 17.5 27.3 10.5 14.3 7.0
Descriptive results reported in this chapter suggest strong unconditional correlations between HHs demand and WTP for improved quality of drinking water. However, many of these variables are correlated with each others. Thus, we have to develop econometric models, wherein we are able to separate out the effects of each variable from the effects of other variables. The next section will discuss the results obtain on the basis of econometric analysis.
V. EMPIRICAL ESTIMATION
V. a. Binary Logistic Regression Equation
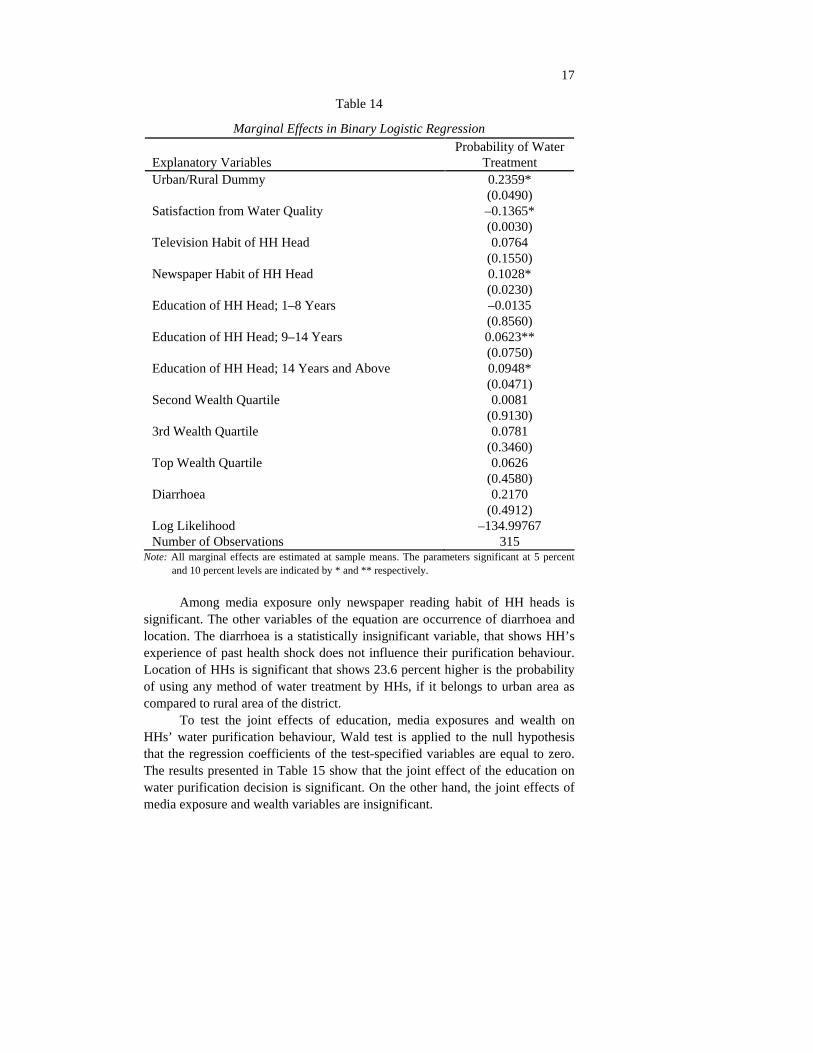
For the econometric quantification of the model described in Section III.a, the bivariate logistic regression is used. The dependent variable here is the different water treatments measures that the HHs are adopting. The results of this model4 are reported in Table 14. The education variables in the model seem plausible since the coefficients of all the dummy variables representing various education levels of HH heads are statistically significant except first level of education, furthermore; the estimated coefficients of these variables indicate the increase in the probability of purification due to having the corresponding level of education. Thus for example HHs in which head’s education level is 1–8 years of schooling the probability of purification is 1.3 percentage points higher then in the HHs in which heads are illiterate. This increment in probability goes to 6.2 and 9.4 percentage points if heads have 9–13, and 14 years or above education, respectively.
4Statistical package “Stata” was used to obtain the empirical results of econometric models.
17
Table 14
Marginal Effects in Binary Logistic Regression
Explanatory Variables Probability of Water
Treatment Urban/Rural Dummy 0.2359*
(0.0490)
Satisfaction from Water Quality –0.1365* (0.0030)
Television Habit of HH Head 0.0764 (0.1550)
Newspaper Habit of HH Head 0.1028* (0.0230)
Education of HH Head; 1–8 Years –0.0135 (0.8560)
Education of HH Head; 9–14 Years 0.0623** (0.0750)
Education of HH Head; 14 Years and Above 0.0948* (0.0471)
Second Wealth Quartile 0.0081 (0.9130)
3rd Wealth Quartile 0.0781 (0.3460)
Top Wealth Quartile 0.0626 (0.4580)
Diarrhoea 0.2170 (0.4912)
Log Likelihood –134.99767 Number of Observations 315
Note: All marginal effects are estimated at sample means. The parameters significant at 5 percent and 10 percent levels are indicated by * and ** respectively.
Among media exposure only newspaper reading habit of HH heads is significant. The other variables of the equation are occurrence of diarrhoea and location. The diarrhoea is a statistically insignificant variable, that shows HH’s experience of past health shock does not influence their purification behaviour. Location of HHs is significant that shows 23.6 percent higher is the probability of using any method of water treatment by HHs, if it belongs to urban area as compared to rural area of the district.
To test the joint effects of education, media exposures and wealth on HHs’ water purification behaviour, Wald test is applied to the null hypothesis that the regression coefficients of the test-specified variables are equal to zero. The results presented in Table 15 show that the joint effect of the education on water purification decision is significant. On the other hand, the joint effects of media exposure and wealth variables are insignificant.
18
Table 15
Wald Tests on Parameters for Binary Logit Model
Null Hypothesis Chi-Square Probability of
Rejection Education of HH held has no effect on water
treatment decision 38.49 0.0144 Media exposures of HH head has no effect
on water treatment decision 15.11 0.1286 Wealth has no effect on water treatment
decision 1.65 0.6476
V.b. Multinomial Logistic Model for WTP
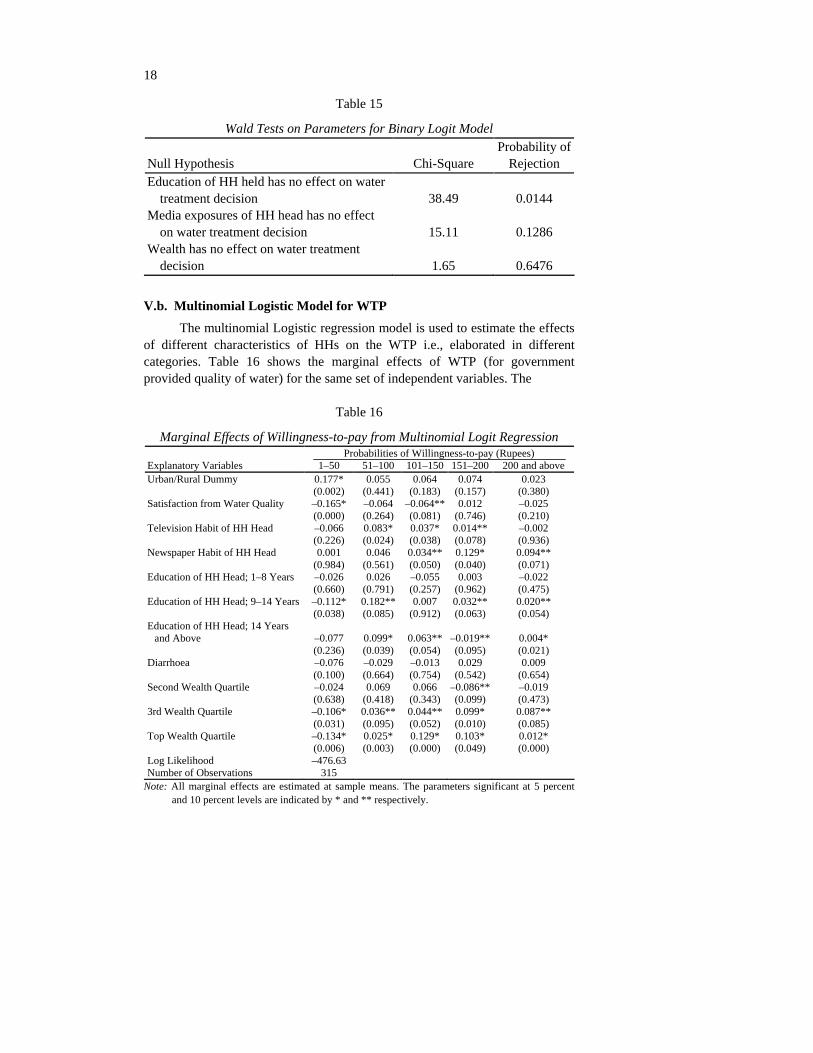
The multinomial Logistic regression model is used to estimate the effects of different characteristics of HHs on the WTP i.e., elaborated in different categories. Table 16 shows the marginal effects of WTP (for government provided quality of water) for the same set of independent variables. The
Table 16
Marginal Effects of Willingness-to-pay from Multinomial Logit Regression Probabilities of Willingness-to-pay (Rupees)
Explanatory Variables 1–50 51–100 101–150
151–200
200 and above Urban/Rural Dummy 0.177* 0.055 0.064 0.074 0.023
(0.002) (0.441) (0.183) (0.157) (0.380) Satisfaction from Water Quality –0.165* –0.064 –0.064**
0.012 –0.025 (0.000) (0.264) (0.081) (0.746) (0.210)
Television Habit of HH Head –0.066 0.083* 0.037* 0.014**
–0.002 (0.226) (0.024) (0.038) (0.078) (0.936)
Newspaper Habit of HH Head 0.001 0.046 0.034** 0.129* 0.094** (0.984) (0.561) (0.050) (0.040) (0.071)
Education of HH Head; 1–8 Years
–0.026 0.026 –0.055 0.003 –0.022 (0.660) (0.791) (0.257) (0.962) (0.475)
Education of HH Head; 9–14 Years
–0.112* 0.182** 0.007 0.032**
0.020** (0.038) (0.085) (0.912) (0.063) (0.054)
Education of HH Head; 14 Years and Above –0.077 0.099* 0.063** –0.019**
0.004* (0.236) (0.039) (0.054) (0.095) (0.021)
Diarrhoea –0.076 –0.029 –0.013 0.029 0.009 (0.100) (0.664) (0.754) (0.542) (0.654)
Second Wealth Quartile –0.024 0.069 0.066 –0.086**
–0.019 (0.638) (0.418) (0.343) (0.099) (0.473)
3rd Wealth Quartile –0.106* 0.036** 0.044** 0.099* 0.087** (0.031) (0.095) (0.052) (0.010) (0.085)
Top Wealth Quartile –0.134* 0.025* 0.129* 0.103* 0.012* (0.006) (0.003) (0.000) (0.049) (0.000)
Log Likelihood –476.63 Number of Observations 315
Note: All marginal effects are estimated at sample means. The parameters significant at 5 percent and 10 percent levels are indicated by * and ** respectively.
19
dependent variables have six categories, among them one is zero WTP that is base category in the regression. While four middle categories having Rs 50 incremental in each category which start at one rupee and goes up to the upper limit i.e., Rs 200. The sixth category is above Rs 200. The result indicated that within the set of educational categories, upper two categories of education are statistically significant for almost all groups of WTP, while almost similar pattern are found in wealth quartile that only upper two wealth quartiles are statistically significant. Diarrhoea is insignificant in all the cases, while location is significant only for first category that on average 17.75 percent higher is probability of paying one to 50 rupees compare to no WTP if HH is living in urban areas compare to rural areas. Here one additional variable is added to the regression equation i.e., whether HH is satisfied (or not) with quality of water that he consumes presently at home. It is expected that if HHs is satisfied then his willingness to pay will be lesser. The variable seems significant for first and third category of WTP, and its sign is also according to our expectation.
Table 17, showing the results of Wald tests of parameters associated with the education, media exposure and wealth variables, indicates that all education, media and wealth variables have jointly significant impact on HHs WTP.
Table 17
Wald Tests on Parameters for Multinomial Logit Model Null Hypothesis Chi-Square Probability of Rejection Education of HH held has no effect on water treatment decision 227.47 0.000 Media exposures of HH head has no effect on water treatment decision 71.69 0.003 Wealth has no effect on water treatment decision 314.57 0.000
V.c. HH’s Willingness-to-pay Parameters for Municipal Corporation
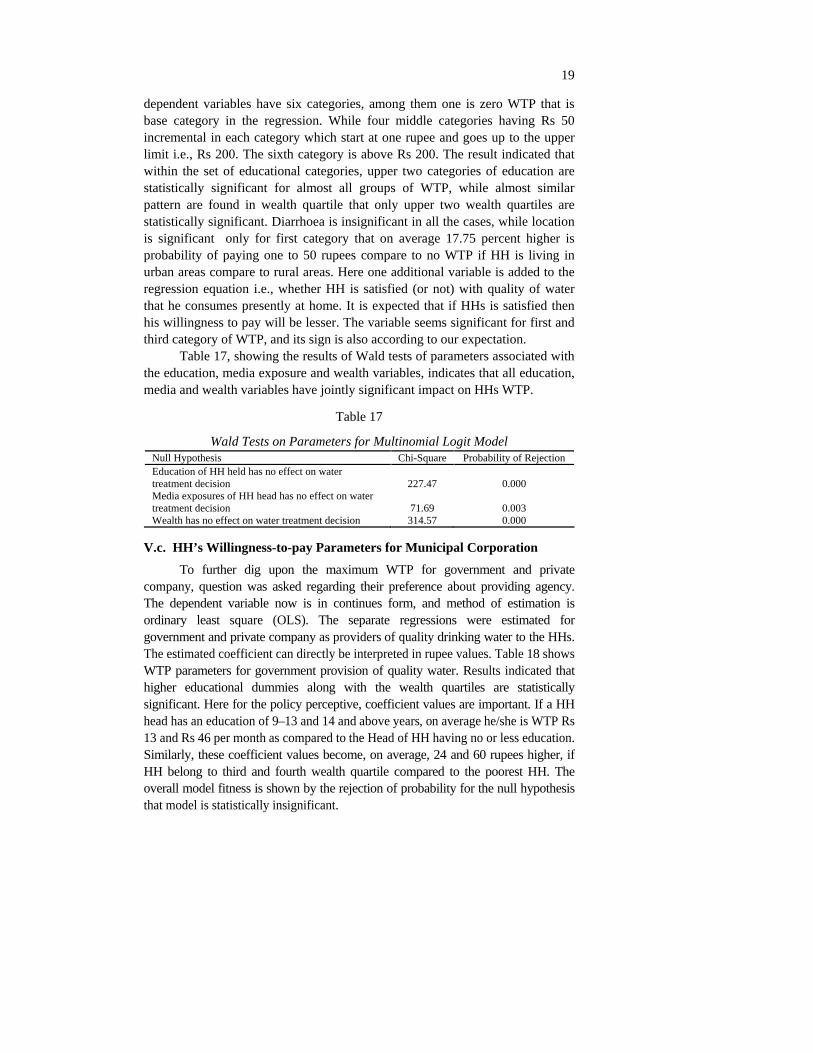
To further dig upon the maximum WTP for government and private company, question was asked regarding their preference about providing agency. The dependent variable now is in continues form, and method of estimation is ordinary least square (OLS). The separate regressions were estimated for government and private company as providers of quality drinking water to the HHs. The estimated coefficient can directly be interpreted in rupee values. Table 18 shows WTP parameters for government provision of quality water. Results indicated that higher educational dummies along with the wealth quartiles are statistically significant. Here for the policy perceptive, coefficient values are important. If a HH head has an education of 9–13 and 14 and above years, on average he/she is WTP Rs 13 and Rs 46 per month as compared to the Head of HH having no or less education. Similarly, these coefficient values become, on average, 24 and 60 rupees higher, if HH belong to third and fourth wealth quartile compared to the poorest HH. The overall model fitness is shown by the rejection of probability for the null hypothesis that model is statistically insignificant.
20
Table 18
WTP Parameters for Municipal Corporation
Explanatory Variables Coefficients and Their
Probabilities Urban/Rural Dummy 3.14
(0.88)
Satisfaction from Water Quality –19.82 (0.24)
Television Habit of HH Head 9.85** (0.063)
Newspaper Habit of HH Head 46.77** (0.05)
Education of HH Head; 1–8 Years –12.73 (0.64)
Education of HH Head; 9–14 Years 13.01** (0.092)
Education of HH Head; 14 Years and Above 45.93* (0.015)
Diarrhoea 29.17 (0.14)
Second Wealth Quartile 11.14** (0.096)
3rd Wealth Quartile 23.82* (0.000)
Top Wealth Quartile 60.49* (0.000)
Constant 71.62* (0.000)
F( 11, 303) 33.82 Prob > F (0.000) R-squared 0.277 Adj R-squared 0.261
Probability of critical values are reported in parentheses. *Indicates significance at 5 percent or lower while. ** Indicates significance at 10 percent or lower.
V.d. HH’s Willingness-to-pay Parameters for Private Company
Table 19 shows the same parameter values for the private company. The results revealed that the media exposure (Television and Newspaper reading habit of the head of HH) has a positive and significant impact on HH’s WTP for private company. While in educational categories, the higher category of 9–13 and 14 and above years of schooling have also a positive and significant effect on HH’s WTP. In addition, wealth is significant for upper two wealth quartiles.

21
Table 19
WTP Parameters for Private Company
Explanatory Variables Coefficients and
Their Probabilities Urban/Rural Dummy 14.24
(0.54)
Satisfaction from Water Quality –29.42 (0.11)
Television Habit of HH Head 10.51** (0.063)
Newspaper Habit of HH Head 30.08* (0.025)
Education of HH Head; 1–8 Years –8.21 (0.78)
Education of HH Head; 9–14 Years 20.57** (0.051)
Education of HH Head; 14 Years and Above 93.38* (0.00)
Diarrhoea 33.47 (0.12)
Second Wealth Quartile 6.35 (0.80)
3rd Wealth Quartile 33.74* (0.000)
Top Wealth Quartile 84.03* (0.00)
Constant 52.36* (0.02)
F( 11, 303) 35.36 Prob > F (0.000) R-squared 0.318 Adj R-squared 0.298
Probability of critical values are reported in parentheses. * Indicates significance at 5 percent or lower while ** indicates significance at 10 percent or lower.
The results compared to Table 18, are similar in parameters’ significance, but it differs in magnitude of the parameters. The HHs are willing to pay much higher for private company. On average, HH heads are willing to pay 21 and 93 rupees higher than an illiterate HH heads if he has an educational level 9–13 years and 14 and above years of schooling. The WTP coefficient becomes 84 if HH belong to upper most wealth quartile compared to the poorest HH.
22
VI. CONCLUSION AND RECOMMENDATIONS
The purpose of this study was to measure and analyse the determinants of the demand and WTP for safe drinking water among the HHs in Peshawar district, NWFP, Pakistan. The bi-variate logit and multinomial logit econometrics models were used to estimate the effects of different HHs’ characteristics on the decision to use purification methods and their WTP. Separate equations of WTP were also estimated for private and government provision of quality of water so that to find out public preferences and its consequences.
The study estimated that there are statistically significant and quantitatively non-negligible effects of formal education on demand and WTP for improved water services. The study also found that there is a strong effect of informal education like print media on the water purification behaviour of HHs. The robustness of the results is against the common presumption that awareness in comparison to income has a second-order impact on the demand for environmental quality. Thus better level of awareness about health hazards regarding contaminated drinking water may prevent waterborne diseases, rather than focusing other strategies. Education appears to be strong determinant to influence the people about adverse effects of contaminated water. Informal education through print media and television also has a significant effect on water purification at homes, so public awareness campaigns to educate the population about the health risks of inferior water quality may be an important policy instrument. Regarding the question whether a better-informed people are willing to pay more than an uninformed people, the study finds that WTP of a more educated person is higher than an uneducated person.
The study leads us to conclude that quality of drinking water is highly significant with formal education thereafter the media exposure. It means lack of awareness either through formal education or through media exposures can be regarded as the main function contributing waterborne diseases and associated health risks. The HHs who are aware about the associated health risks coupled with ability to pay for the prevention measures to improve quality of drinking are likely to adopt water purification measures. This study empirically proved that the role of awareness besides the income constraint is the key determinants of demand for safe drinking water.
The following policy implications are derived out of the study:
Government and civil society can make an effective difference in lives of the people by making them aware about the methods of safe drinking water.
Education and awareness campaigns about clean water are powerful tools for public health interventions.
23
As water purification measures are mostly carried out by women at home therefore, measures should be taken to educate and aware them. It is also imperative to educate women about cheaper and easily adoptable measures of water purification.
Print and electronic media can be used to play a role in sensitising and informing people about health hazards from unsafe drinking water.
These policies do not negate the need for increased supply of regulated clean pipe water; every possible policy to make the water safe needs to be considered and adopted.
Appendices
APPENDIX–I
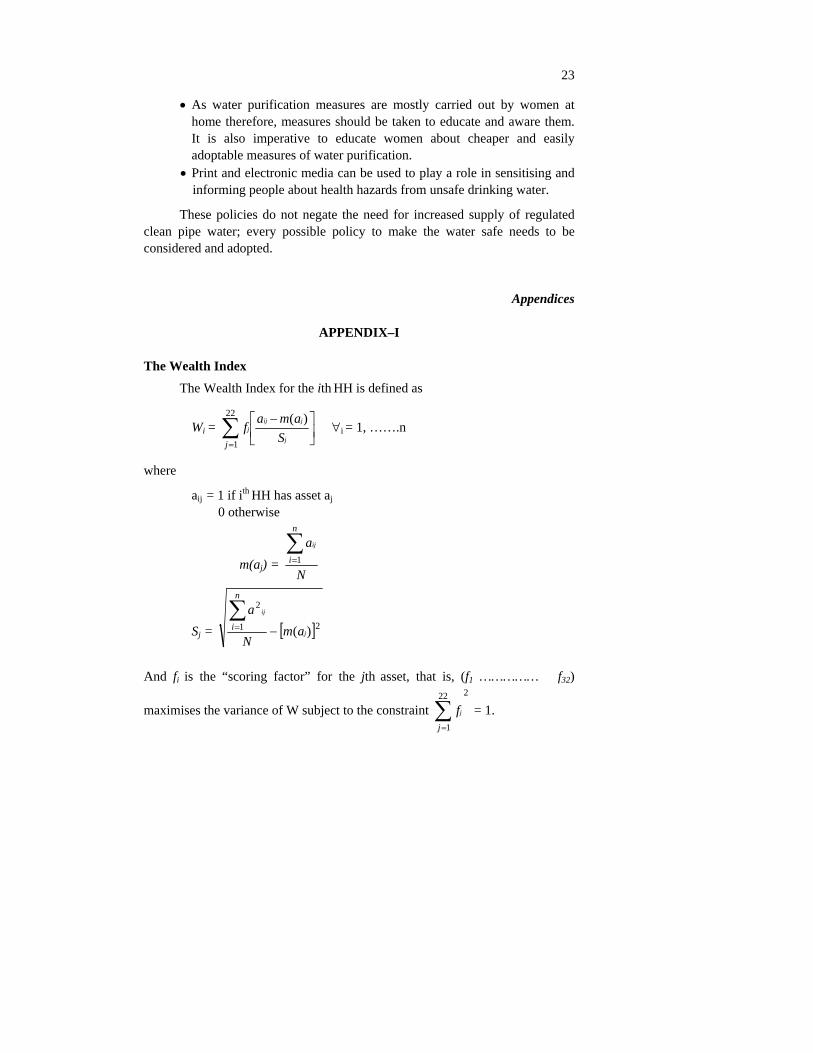
The Wealth Index
The Wealth Index for the ith HH is defined as
Wi = j
jijj
S
amaf
j
)(22
1
i = 1, …….n
where
aij = 1 if ith HH has asset aj
0 otherwise
m(aj) = N
an
i
ij
1
Sj = 21
2
)( j
ij
amN
an
i
And fi is the “scoring factor” for the jth asset, that is, (f1 …………… f32)
maximises the variance of W subject to the constraint
222
1j
jf = 1.
24
APPENDIX–II
Table
Variables for Construction of Wealth Index Income of HH Income per annum
Own Rent Dwelling Status Govt Number of Rooms Roof (Cemented) Roof (T-iron) Roof (Other) Floor (Cemented) Floor (Tiles)
HH Structure
Floor (Other) Gas Kerosene Electricity Wood
Livelihood Expenditure Upon
Coal Refrigerator Computer TV Dish AC Telephone/mobile Motorcycle Car Taxi Toilet Flush system
Availability of Facilities
Servant
REFERENCES
Abdullah, C. W., B. A. Roach and D. J. Epp (1992) Valuing Environmental Quality Changes Using Averting Expenditures: An Application to Groundwater Contamination. Land Economics 68, 163–169.
Abrahams, N. A, B. J. Hubbell, and J. L. Jordan. (2000) Joint Production and Averting Expenditure Measures of Willingness-to-pay: Do Water Expenditures Really Measure Avoidance Costs? American Journal of Agricultural Economics 82: (May), 427–37.
25
Altaf, M. A., H. Jamal, and D. Whittington (1992) Willingness-to-pay for Water in Rural Punjab, Pakistan. UNDP—World Bank, Water and Sanitation Programme. Washington, DC, World Bank. (Water and Sanitation Report No. 4.)
Bergstrom, J. C., K. J. Boyle, C. A. Job, and M. J. Kealy (1996) Assessing the Economic Benefits of Groundwater for Environmental Policy Decisions. Water Resources Bulletin 32, 279–291.
Carson, R. T., and C. Mitchell (1993) The Value of Clean Water: The Public’s Willingness-to-pay for Boatable, Fishable and Swimmable Quality Water. Water Resources Research 29:7, 2445–2454.
Chowdhury, N. T. (1999) Willingness to Pay for Water in Dhaka Slum: A Contingent Valuation Study. IUCN.< http://www.joyhecht.net/professional/ papers/SAsia.valuation.ch4.pdf >
Collins, A. R, and S. Steinbeck (1993) Rural HH Response to Water Contamination in West Virginia. Water Resource Bulletin 199–209.
Crocker, T. D., B. A. Forster, and J. F. Shogren (1991) Valuing potential Groundwater Protection Benefits. Water Resources Research 27, 1–6.
Deaton, A., and J. Muellbauer (1980) Economics and Consumer Behaviour. Cambridge, M.A: Cambridge University Press.
DCR (1998) District Census Report (Peshawar). Ministry of Urban and Population Planning. Government of Pakistan. Islamabad.
Khan, Faheem J. and Yaser Javed (2007) Delivering Access to Safe Drinking Water and Adequate Sanitation in Pakistan. (PIDE Working Papers No. 30)
Freeman, A. Myrick III. (1993) The Measurement of Environmental and Resource Values. Theory and Methods, Resources for the Future, CA.
Frank, R. Rijserman and J. C. Willian (2000) Making Water Every Body Business. World Water Council.
Haq, M, U. Mustafa, and I. Ahmad (2007) Household’s Willingness-to-pay for Safe Drinking Water: A Case Study of District Abbottabad. The Pakistan Development Review 46:4, Part II. 1137–1153.
Harrington, W., A. J. Krupnick, and W. A. Spofford (1989) The Economic Losses of a Waterborne Disease Outbreak. Journal of Urban Economics 25,116–137.
Laughland, A. S., L. M. Musser, W. N. Musser, and J. S. Shortle (1993) The Opportunity Cost of Time and Averting Expenditures for Safe Drinking Water. Water Resources Bulletin 29:2, 219–299.
Mitchell, R. C. and R. T. Carson (1989) Using Surveys to Value Public Goods: The Contingent Valuation Method. Resources for the Future. Washington, DC.
Pakistan, Government of (2005) Pakistan Social and Living Standards Measurement Survey 2004-05 (PSLM). Federal Bureau of Statistics (FBS), Islamabad.
26
Pakistan, Government of (2007) Pakistan Social and Living Standards Measurement Survey 2006-07 (PSLM). Federal Bureau of Statistics (FBS), Islamabad.
Rosemann, N. (2005) Drinking Water Crises in Pakistan and the Issue of Bottled Water: The Case of Nestle’s Pure Life. Actionaid Pakistan.
Sattar, A. and E. Ahmad (2007) HHs Preferences for Safe Drinking Water. International Journal of Human Development 3:1, 23–36.
Smith, V. K. and W. H. Desvouges (1986) Averting Behaviour: Does It Exits? Economics Letters 20: 3, 291–96.
Whitehead, J. C. and G. V. Houtven (1998) Methods for Valuing the Benefits of the Safe Drinking Water Act.: Review and Assessment. East Carolina University. (Working Paper).
World Health Organisation (2004) The World Health Report 2002. Geneva: WHO, Switzerland.
WWF Pakistan (2007) Pakistan’s Water at Risk: Water and Health Related Issues in Pakistan and Key Recommendations. WWF, Pakistan. Available at http:// www.wwfpak.org/pdf/water report.
PIDE Working Papers
2006: 1. Remittances, Trade Liberalisation, and Poverty in Pakistan: The Role of Excluded Variables in Poverty Change Analysis by Rizwana Siddiqui and A. R. Kemal (2006). 40pp.
2006: 2. Poverty-reducing or Poverty-inducing? A CGE-based Analysis of Foreign Capital Inflows in Pakistan by Rizwana Siddiqui and A. R. Kemal (2006). 43pp.
2006: 3. Bureaucracy and Pro-poor Change by Ali Cheema and Asad Sayeed (2006). 26pp.
2006: 4. Civil Servants’ Salary Structure by Faiz Bilquees (2006). 21pp.
2006: 5. Wheat Markets and Price Stabilisation in Pakistan: An Analysis of Policy Options by Paul Dorosh and Abdul Salam (2006). 17pp.
2006: 6. Stock Market Liberlalisations in the South Asian Region by Fazal Husain and Abdul Qayyum (2006). 19pp.
2006: 7. Volatitlity Spillover between the Stock Market and the Foreign Exchange Market in Pakistan by Abdul Qayyum and A. R. Kemal (2006). 15pp.
2006: 8. A Significant Shift in Causal Relations of Money, Income, and Prices in Pakistan: The Price Hikes in the Early 1970s by Fazal Husain and Abdul Rashid (2006). 18pp.
2006: 9. A Social Accounting Matrix for Pakistan, 2001-02: Methodology and Results by Paul Dorosh, Muhammad Khan Niazi, and Hina Nazli (2006). 31pp.
2006: 10. Demographic Dividend or Demographic Threat in Pakistan by Durr-e-Nayab (2006). 29pp.
2006: 11. Awake the Sleeper Within: Releasing the Energy of Stifled Domestic Commerce! by Nadeem Ul Haque (2006). 14pp.
2006: 12. Myths and Realities of Long-run Development: A Look at Deeper Determinants by Lubna Hasan (2006). 37pp.
2007: 13. A Fresh Assessment of the Underground Economy and Tax Evasion in Pakistan: Causes, Consequences, and Linkages with the Formal Economy by M. Ali Kemal (2007). 30pp.
2007: 14. The Relationship between Corporate Governance Indicators and Firm Value: A Case Study of Karachi Stock Exchange by Attiya Y. Javed and Robina Iqbal (2007). 22pp.
2007: 15. Perfect Competition by M. Ali Khan (2007). 21pp.
2007: 16. The Harris-Todaro Hypothesis by M. Ali Khan (2007). 11pp.
2007: 17. Wage Differentials, Rate of Return to Education, and Occupational Wage Share in the Labour Market of Pakistan by Asma Hyder (2007). 20pp.
2007: 18. Foreign Direct Investment and Economic Growth: The Role of Domestic Financial Sector by Muhammad Arshad Khan (2007). 47pp.
2007: 19. Trade Liberalisation, Financial Development and Economic Growth by Muhammad Arshad Khan and Abdul Qayyum (2007). 34pp.
2007: 20. Preference for Public Sector Jobs and Wait Unemployment: A Micro Data Analysis by Asma Hyder (2007). 18pp.
2007: 21. Awareness and the Demand of Safe Drinking Water Practices by Eatzaz Ahmed and Abdul Sattar (2007). 21pp.
2007: 22. Determinants of Interest Spread in Pakistan by Idrees Khawaja and Musleh-ud Din (2007). 18pp.
2007: 23. X-efficiency, Scale Economies, Technological Progress and Competition: A Case of Banking Sector in Pakistan by Abdul Qayyum and Sajawal Khan (2007). 16pp.
2007: 24. Why Civil Service Reforms Do Not Work by Nadeem Ul Haque (2007). 32pp.
2007: 25. Effectiveness of Regulatory Structure in the Power Sector of Pakistan by Afia Malik (2007). 34pp.
2007: 26. Impact of Export Subsidies on Pakistan’s Exports by Nadeem Ul Haque and M. Ali Kemal (2007). 18pp.
2007: 27. Efficiency of Large Scale Manufacturing in Pakistan: A Production Frontier Approach by Tariq Mahmood, Ejaz Ghani, and Musleh-ud Din (2007). 15pp.
2007: 28. International Competitiveness—Where Pakistan Stands? by Uzma Zia (2007). 20pp.
2007: 29. Entrepreneurship in Pakistan by Nadeem Ul Haque (2007). 54pp.
2007: 30. Delivering Access to Safe Drinking Water and Adequate Sanitation in Pakistan by Faheem Jehangir Khan and Yaser Javed (2007). 47pp.
2007: 31. Exchange Market Pressure and Monetary Policy: Evidence from Pakistan by M. Idrees Khawaja (2007). 24pp.
2007: 32. Health Care Services and Government Spending in Pakistan by Muhammad Akram and Faheem Jehangir Khan (2007). 25pp.
2007: 33. National Finance Commission Awards in Pakistan: A Historical Perspective by Iftikhar Ahmed, Usman Mustafa, and Mahmood Khalid (2007). 22pp.
2007: 34. The Taylor Rule and the Macroeconomic Performance in Pakistan by Wasim Shahid Malik and Ather Maqsood Ahmed (2007). 25pp.
2007: 35. Monetary Policy Objectives in Pakistan: An Empirical Investigation by Wasim Shahid Malik (2007). 25pp.
2007: 36. What Determines Private Investment? The Case of Pakistan by Sajawal Khan and Muhammad Arshad Khan (2007). 17pp.
2007: 37. Stock Market Reaction to Catastrophic Shock: Evidence from Listed Pakistani Firms by Attiya Y. Javid (2007). 31pp.
2007: 38. Dynamic Effects of Agriculture Trade in the Context of Domestic and Global Liberalisation: A CGE Analysis for Pakistan by Rizwana Siddiqui (2007). 21pp.
2007: 39. Measures of Monetary Policy Stance: The Case of Pakistan by Sajawal Khan and Abdul Qayyum (2007). 18pp.
2007: 40. Public Provision of Education and Government Spending in Pakistan by Muhammad Akram and Faheem Jehangir Khan (2007). 35pp.
2007: 41. Household Budget Analysis for Pakistan under Varying the Parameter Approach by Eatzaz Ahmad and Muhammad Arshad (2007). 29pp.
2008: 42. Pension and Social Security Schemes in Pakistan: Some Policy Options by Naushin Mahmood and Zafar Mueen Nasir (2008). 33pp.
2008: 43. Income, Public Social Services, and Capability Development: A Cross-district Analysis of Pakistan by Rizwana Siddiqui (2008). 24pp.
2008: 44. Monetary Policy Transparency in Pakistan: An Independent Analysis by Wasim Shahid Malik and Musleh-ud Din (2008). 26pp.
2008: 45. Bilateral J-Curves between Pakistan and her Trading Partners by Zehra Aftab and Sajawal Khan (2008). 11pp.
2008: 46. On Measuring the Complexity of Urban Living by Lubna Hasan (2008). 30pp.
2008: 47. Growth Diagnostics in Pakistan by Abdul Qayyum, Idrees Khawaja, and Asma Hyder (2008). 24pp.
2008: 48. The Conditional Capital Asset Pricing Model: Evidence from Karachi Stock Exchange by Attiya Y. Javid and Eatzaz Ahmad (2008). 46pp.
2008: 49. Test of Multi-moment Capital Asset Pricing Model: Evidence from Karachi Stock Exchange by Attiya Y. Javid and Eatzaz Ahmad (2008). 28pp.
2009: 50. Reforming Institutions: Where to Begin? by M. Idrees Khawaja and Sajawal Khan (2009). 27pp.
2009: 51. Human Capital vs. Physical Capital: A Cross-country Analysis of Human Development Strategies by Rizwana Siddiqui (2009). 27pp.
2009: 52. Does Governance Contribute to Pro-poor Growth? Evidence from Pakistan by Rashida Haq and Uzma Zia (2009). 20pp.
2009: 53. Trends in Inequality, Welfare, and Growth in Pakistan, 1963-64 to 2004-05 by Nadia Zakir and Muhammad Idrees (2009). 17pp.
2009: 54. Pakistan’s Wage Structure during 1990-91–2006-07 by Mohammad Irfan (2009). 47pp.
2009: 55. Pakistan’s Trade Policy, 1999–2008: An Assessment by Mirza Qamar Baig (2009). 22pp.
2010: 56. Rural to Urban Migration in Pakistan: The Gender Perspective by Shahnaz Hamid (2010). 17pp.
2010: 57. Corporate Governance in Pakistan: Corporate Valuation, Ownership and Financing by Attiya Y. Javid and Robina Iqbal (2010). 81 pp.