FACTORS AFFECTING WOMEN REPRESENTATION IN PUBLIC ...
95
FACTORS AFFECTING WOMEN REPRESENTATION IN PUBLIC PARTICIPATION ON DECISION-MAKING: A CASE STUDY OF THARAKA NITHI COUNTY IN KENYA BY KIMANI RACHEL WANJIRU UNITED STATES INTERNATIONAL UNIVERSITY – AFRICA FALL 2019
Transcript of FACTORS AFFECTING WOMEN REPRESENTATION IN PUBLIC ...
FACTORS AFFECTING WOMEN REPRESENTATION IN PUBLIC
PARTICIPATION ON DECISION-MAKING: A CASE STUDY OF
THARAKA NITHI COUNTY IN KENYA
BY
KIMANI RACHEL WANJIRU
UNITED STATES INTERNATIONAL UNIVERSITY – AFRICA
FALL 2019

FACTORS AFFECTING WOMEN REPRESENTATION IN PUBLIC
PARTICIPATION ON DECISION-MAKING: A CASE STUDY OF
THARAKA NITHI COUNTY IN KENYA
BY
KIMANI RACHEL WANJIRU
A Research Project Report Submitted to the Chandaria School of
Business in Partial Fulfillment of the Requirement for the Degree of
Masters in Business Administration (MBA)
UNITED STATES INTERNATIONAL UNIVERSITY – AFRICA
FALL 2019
ii
STUDENT’S DECLARATION
I, the undersigned, declare that this is my original work and has not been submitted to any
other college, institution or university other than the United States International University
in Nairobi for academic credit.
Signed: ____________________________Date: _____________________________
Rachel Kimani (Student ID 622552)
This research project report has been presented for examination with my approval as the
appointed supervisor.
Signed: ____________________________Date: ______________________________
Timothy C. Okech, PhD
Signed: ____________________________Date: ______________________________
Dean, Chandaria School of Business

iii
DEDICATION
I dedicate this work to Hannah & Herman Kimani, Kiarie, Tony, Lilian, Mwenda, friends
and lecturers, especially Prof. Okech. To all thank you for your invaluable support.
iv
TABLE OF CONTENTS
STUDENT’S DECLARATION ........................................................................................ ii
DEDICATION................................................................................................................... iii
LIST OF TABLES ........................................................................................................... vii
LIST OF FIGURES ........................................................................................................ viii
ABBREVIATIONS AND ACRONYMS ......................................................................... ix
ABSTRACT ...................................................................................................................... xii
CHAPTER ONE ................................................................................................................ 1
1.0 INTRODUCTION........................................................................................................ 1
1.1 Background of the Study ............................................................................................ 1
1.2 Statement of the Problem ........................................................................................... 3
1.3 Purpose of the Study .................................................................................................. 4
1.4 Research Questions .................................................................................................... 4
1.5 Importance of the Study ............................................................................................. 5
1.5.2 Scholars ................................................................................................................... 5
1.5.4 Civic Educators ....................................................................................................... 5
1.6 Scope of the Study...................................................................................................... 5
1.7 Definition of Terms .................................................................................................... 6
1.8 Chapter Summary ....................................................................................................... 6
CHAPTER TWO ............................................................................................................... 7
2.0 LITERATURE REVIEW ........................................................................................... 7
2.1 Introduction ................................................................................................................ 7
2.2 Effect of Socioeconomic Factors on Women Decision – Making at Public
Hearings ........................................................................................................................... 7
2.3 Effect of Economic Empowerment on Decision Making at Public Hearings .......... 11
2.4 Influence of Inclusion on Women Decision Making at Public Hearings ................. 15
2.5 Chapter Summary ..................................................................................................... 19
CHAPTER THREE ......................................................................................................... 20

v
3.0 RESEARCH METHDOLOGY ................................................................................ 20
3.1 Introduction .............................................................................................................. 20
3.2 Research Design ....................................................................................................... 20
3.3. Population and Sampling Design ............................................................................ 21
3.4 Data Collection Methods .......................................................................................... 24
3.5 Research Procedures ................................................................................................ 24
3.6 Data Analysis Methods ............................................................................................ 25
3.7 Chapter Summary ..................................................................................................... 25
CHAPTER FOUR ............................................................................................................ 26
4.0 RESULTS AND FINDINGS ..................................................................................... 26
4.1 Introduction .............................................................................................................. 26
4.2 Response Rate and Background ............................................................................... 26
4.3 Effect of Socioeconomic Factors on Decision-Making in Women at Public
Participation Hearings .................................................................................................... 30
4.4 Effect of Women Economic Empowerment on Public Participation ....................... 34
4.5 Effect of Inclusivity in Public Participation Hearings on Decision-Making ........... 38
4.7 Chapter Summary ..................................................................................................... 41
CHAPTER FIVE ............................................................................................................. 42
5.0 DISCUSSION, CONCLUSION AND RECOMMENDATION ............................. 42
5.1 Introduction .............................................................................................................. 42
5.2 Summary .................................................................................................................. 42
5.3 Discussion ................................................................................................................ 44
5.4 Conclusion ................................................................................................................ 51
5.5 Recommendation ...................................................................................................... 51
REFERENCE ................................................................................................................... 53
APPENDICES .................................................................................................................. 62
Appendix I: Introductory letter ...................................................................................... 62
vi
Appendix II: Questionnaire ............................................................................................ 63
Appendix III: Research Permit ....................................................................................... 68
Appendix IV: Attendees ................................................................................................. 69
Appendix V: 2018-19 Budget Calendar ......................................................................... 73
Appendix VI: Map of Tharaka Nithi County ................................................................. 79
Appendix VII: Population Projections as per the wards ................................................ 80
vii
LIST OF TABLES
Table 3.1: Population Distribution and Density by Constituency/Sub County ................. 21
Table 3.2: Overall Employment by Education Levels in Tharaka Nithi County............... 22
Table 3.3: Sample Distribution .......................................................................................... 23 Table 4.1: Healthcare Access ............................................................................................. 29
Table 4.2: Socioeconomic Factors ..................................................................................... 32
Table 4.3: Correlation Between Socioeconomic Factors and Decision-Making ............... 33
Table 4.4: Regression on Socioeconomic Factors and Decision-Making ......................... 33
Table 4.5: ANOVA on Socioeconomic Factors and Decision-Making ............................. 34
Table 4.6: Coefficient on Socioeconomic Factors and Decision-Making ......................... 34
Table 4.7: Women Economic Empowerment .................................................................... 36
Table 4.8: Correlation between Women Economic Empowerment and Decision-Making
............................................................................................................................................ 36
Table 4.9: Regression on Women Economic Empowerment and Decision-Making ........ 37
Table 4.10: ANOVA on Women Economic Empowerment and Decision-Making .......... 37
Table 4.11: Coefficient on Women Economic Empowerment and Decision-Making ...... 38
Table 4.12: Inclusivity in Public Participation Hearings ................................................... 39
Table 4.13: Correlation between Inclusivity in Public Participation Hearings and Decision-
making................................................................................................................................ 39
Table 4.14: Model Summary on Inclusivity in Public Participation Hearings and Decision
............................................................................................................................................ 40
Table 4.15: ANOVA on Inclusivity in Public Participation Hearings and Decision......... 40
Table 4.16: Coefficients on Inclusivity in Public Participation Hearings and Decision ... 41
viii
LIST OF FIGURES
Figure 4.1: Respondents’ Gender ...................................................................................... 27
Figure 4.2: Academic Qualification ................................................................................... 27
Figure 4.3: Employment Status ......................................................................................... 28
Figure 4.4: Public Participation Knowledge ...................................................................... 28
Figure 4.5: Involvement in Public Participation ................................................................ 29
Figure 4.6: Community/Political Group Membership ....................................................... 30
ix
ABBREVIATIONS AND ACRONYMS
ASDSP Agricultural Sector Development Support Programme
BPO Business Process Outsourcing
CADP Annual Development Plan
CAMER County Annual Monitoring and Evaluation Report
CBO Community Based Organization
CEC County Executive Committee
CFA Community Forest Association
CFSP County Fiscal Strategy Paper
CIDP County Integrated Development Plan
CIMES County Integrated Monitoring and Evaluation
CO Chief Officer
COG Council of Governors
CPSB County Public Service Board
CRA Commission on Revenue Allocation
DRM Disaster Risk Management
ECDE Early Childhood Development Education
EDE Ending Drought Emergencies
FBO Faith Based Organization
GDP Gross Domestic Product
GIS Geographic Information System
GIZ German Society for International Cooperation
HDI Human Development Index
HIV/AIDS Human Immunodeficiency Virus/Acquired Immune Deficiency Syndrome
HR Human Resource
x
HSC Health Sciences Center
ICT Information and Communication Technology
IFMIS Integrated Financial Management Information Systems
IGAs Income Generating Activities
KFS Kenya Forest Service
KNBS Kenya National Bureau of Statistics
Ksh. Kenya Shilling
KWS Kenya Wildlife Service
M&E Monitoring and Evaluation
MDGs Millennium Development Goals
MIS Management Information System
MoDP Ministry of Devolution and Planning
MP Member of Parliament
MSMEs Micro, Small, and Medium Enterprises
MTEF Medium Term Expenditure Framework
MTP Medium Term Plan
NDMA National Drought Management Authority
NEMA National Environmental Management Authority
NG-CDF National Government - Constituency Development Fund
NGO Non-Governmental Organization
NIMES National Integrated Monitoring and Evaluation System
OVC Orphans and Vulnerable Children
PBO Public Benefits Organization
PDHPE Personal Development, Health and Physical Education
PEM Public Expenditure Management
xi
PFMA Public Financial Management Act
PMC Project Management Committee
PPIs Programmes, Projects Initiatives
PPP Public Private Partnership
PSH Public Sector Hearings
PWD Persons with Disability
SACCOS Savings and Credit Cooperative Society
SCM Supply Chain Management
SDGs Sustainable Development Goals
SIR Social Intelligence Report
SWGs Sector Working Groups
TIVET Technical and Vocational Education and Training
TNCG Tharaka Nithi County Government
TTI Technical Training Institute
TWGs Technical Working Groups
UN United Nations
UNDP United Nations Development Programme
USAID United States Agency for International Development
UTaNRMP Upper Tana Natural Resources Management Project
WRMA Water Resource Management Authority
WRUA Water Resource Users Association
xii
ABSTRACT
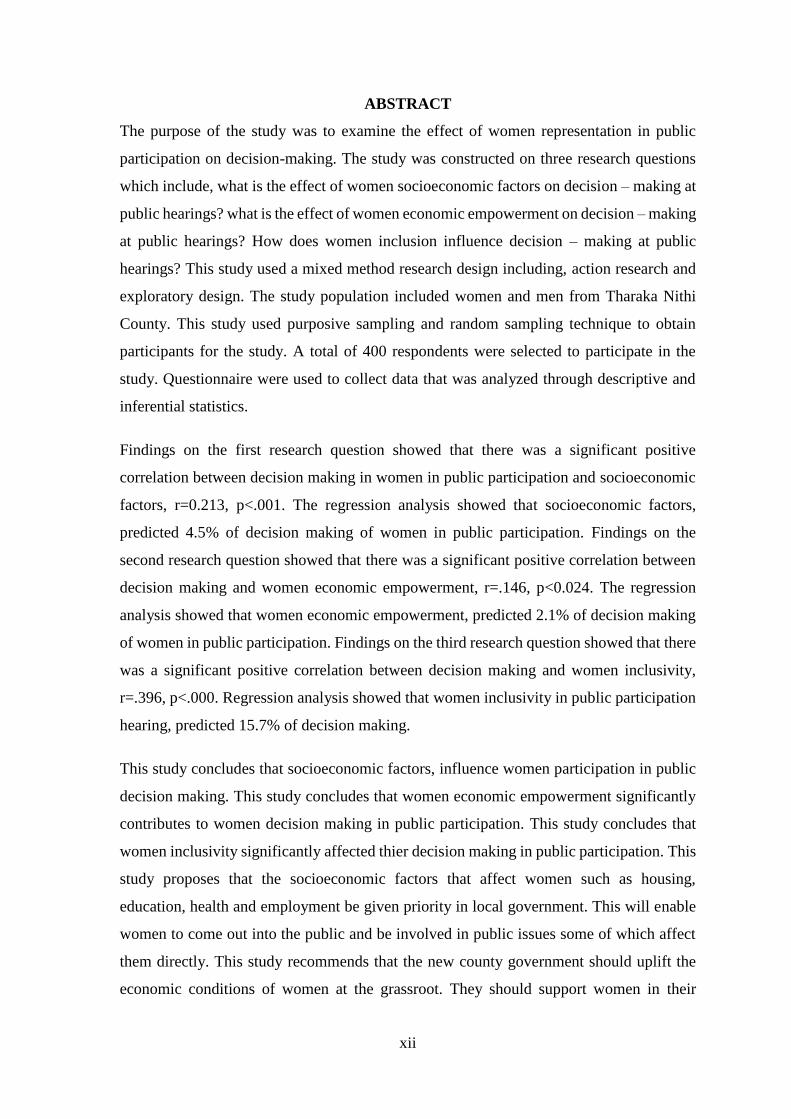
The purpose of the study was to examine the effect of women representation in public
participation on decision-making. The study was constructed on three research questions
which include, what is the effect of women socioeconomic factors on decision – making at
public hearings? what is the effect of women economic empowerment on decision – making
at public hearings? How does women inclusion influence decision – making at public
hearings? This study used a mixed method research design including, action research and
exploratory design. The study population included women and men from Tharaka Nithi
County. This study used purposive sampling and random sampling technique to obtain
participants for the study. A total of 400 respondents were selected to participate in the
study. Questionnaire were used to collect data that was analyzed through descriptive and
inferential statistics.
Findings on the first research question showed that there was a significant positive
correlation between decision making in women in public participation and socioeconomic
factors, r=0.213, p<.001. The regression analysis showed that socioeconomic factors,
predicted 4.5% of decision making of women in public participation. Findings on the
second research question showed that there was a significant positive correlation between
decision making and women economic empowerment, r=.146, p<0.024. The regression
analysis showed that women economic empowerment, predicted 2.1% of decision making
of women in public participation. Findings on the third research question showed that there
was a significant positive correlation between decision making and women inclusivity,
r=.396, p<.000. Regression analysis showed that women inclusivity in public participation
hearing, predicted 15.7% of decision making.
This study concludes that socioeconomic factors, influence women participation in public
decision making. This study concludes that women economic empowerment significantly
contributes to women decision making in public participation. This study concludes that
women inclusivity significantly affected thier decision making in public participation. This
study proposes that the socioeconomic factors that affect women such as housing,
education, health and employment be given priority in local government. This will enable
women to come out into the public and be involved in public issues some of which affect
them directly. This study recommends that the new county government should uplift the
economic conditions of women at the grassroot. They should support women in their
xiii
economic ventures that would empower them and drive them into public participation. This
study proposes for stronger policies in the government to include more women in public
activities. Women should be supported with policies that guarantees thier participation in
the public.
1
CHAPTER ONE
1.0 INTRODUCTION
1.1 Background of the Study
Public participation is defined as a revered continuum of interaction between citizens and
their governments, with activities ranging from listening and informing to implementing
solution agreed upon and these interactions occur at three main levels: information access,
consultation, and active dialogue and partnership. Governments should never apply
measures that prevent the public from acquiring information. Further, it should properly
define issues that affect the broader public and foster situations where the public is in line
with the common goals of the entire process (European Urban Knowledge Network, 2019).
Public participation is also defined an activity or series of activities that people undertake
to involve themselves in affairs of government or their communities, according to Uraia
Trust (2016). Examples of activities cited by Uraia include voting, attending meetings,
participating in political discussion in private or public settings, debating on issues,
endorsing petitions regarding policy, volunteering in community activities, fundraising and
lobbying, and supporting political candidates.
Though time consuming and labor intensive, public participation activities have proven to
bring notable impact on management of people affairs. The reason for this is embedded in
the fact that the numerous roles leaders have for facilitating public participation are broad
and based on common pre-defined deliverable results such as absorption of development
allocations. They also include ensuring that these duty bearers are accessible to the citizens
they represent, ensuring the forums and opportunities for citizens are available frequently,
providing civic education, developing channels for communication, issuing timely
information on all decision-making matters, and accounting for public resources to
facilitate public participation. All these actions have positive impact on citizens and their
countries such as creation of progressive citizens who are enlightened of their community
needs and how governments respond to these needs (Uraia, 2016).
Citizens yearn for improved delivery of services, better credibility on important issues, and
opportunities to address many community concerns that public officials possess
information about. Governments are expected to involve their citizens in identifying
capital-intensive projects that will create employment, empower marginalized groups, and
strengthen democratic processes. Participation in governance remains far from balanced,
2
and there is a proven lower proportion of women in the political decision-making realm.
According to UN Women, women accounted for less than 10% of parliamentarians in
approximately 38 counties. The Convention on the Elimination of Discrimination Against
Women (CEDAW) is one of the innovative international bills drafted circa 1979 to lobby
for the rights of women (CEDAW, 2007). Its general recommendations include
discouraging any acts of exclusion or restriction based on sex and supports civil human
rights, and access to civic engagement (CEDAW, 2007). To date, there are over 180 states
that instituted the women’s bill of rights, attending to their interests, such as elimination of
all forms of discrimination (CEDAW, 2007). These early initiatives in minimizing
incidences of discrimination support activism and advocacy by organizations such as UN
Women.
In the United States, the government, engages citizens in direct participation to solve public
problems and is an active democracy (Holzer, Hu & Song, 2004). Women are encouraged
to participate in politics to fight exclusion and injustice in other parts of the world such as
the Middle East and Africa. However, they do not always engage in this form of active
citizenship and as such, the number of women actively attending public sector hearings
around the world is relatively lower than that of their counterparts (Parpart, Connelly,
Connelly & Barriteau, 2000).
In Kenya, public participation is outlined in the Constitution of Kenya, 2010 in Article 118
(1) (GoK, 2010). Article 1(1-4) of the Constitution of Kenya 2010 empowers citizens to
participate in public affairs directly or through elected representatives (Constitution of
Kenya, 2010). The government invites conduction of parliamentary business in an open
manner to the public through committees. Article 232 (1) (d) highlights transparency in
policy making on a timely basis. The PFM Act, 2012, further compels county governments
to establish structures, mechanisms and guidelines for citizen participation (The Public
Finance Management Act, 2012). Kenya’s journey to devolving government services to
the people has been a long one characterized by inequality and in some cases, violent
opposition to women in leadership despite being one way of addressing socio-economic
challenges in society (Kamau, 2010).
In Tharaka Nithi the development of policy documents has been used to address challenges
in making progress towards devolution, as is done at national level (The Government of
Tharaka Nithi County, 2014). These documents have been used to develop local laws that
3
promote equity and inclusivity. They include the County Fiscal Strategy Papers (CFSP),
Budget Review and Outlook Papers (CBROP), Program Based Budgets (PBB), Integrated
Development Plans (CIDP), and Annual Budget. All these documents contain details on
development projects that shall take place in the counties for a five-year period. The process
through which these projects are prioritized for each ward requires improvement through
improved planning, multi-sectoral partnerships, and better citizen engagement frameworks.
Policy documents provide insight on resource distribution for each sector, where the
interests of women and vulnerable groups such as healthcare, education, and
entrepreneurship opportunities lie (The Government of Tharaka Nithi County, 2014).
1.2 Statement of the Problem
Holistic and inclusive decision-making has always been a complex process at all
institutional levels, be it in households, small organizations or multinational organizations,
where prioritization and management of available resources is crucial for sustenance. The
need to ensure the involvement of all affected individuals using criteria such as ethics,
shared concerns, rationality, bias, information availability, Prior to multiparty democracy
in Kenya, organized groups represented women’s preferred platform to push for
constitutional transformation in a patriarchal system. For decades, they have contributed
to institutional change, conflict management, and representation matters among other
issues that influenced today’s political arena (Otieno, 2013). Later, participation in the
electoral process became possible as a result of these efforts. This in turn led to more
Kenyan women recorded as participants in public hearings increased after the introduction
of the county governments from a dismal few. However, the number of women attending
hearings are still fewer than men registered in the same sittings in Tharaka Nithi County
(The Government of Tharaka Nithi County, 2014). County governments are responsible
for consistent inclusion of as many members of the public in decision making as possible
to drive progressive democracy. It is a difficult and expensive process. However, timely
advertising and publicizing of public sector hearings to all demographic groups simplifies
this process. Some of these demographic groups include youth, people with special needs,
women, and children, all of whom require understanding of opportunities are available in
their communities through government programs on a timely basis in a dynamic decision-
making environment (The Government of Tharaka Nithi County, 2014).
4
For years, enlightening the public has been through media channels such as radio,
newspapers, television and social channels. While these options provide information daily
to the public, not all reports on public spending are accurate. Hajli (2018) emphasizes that
many questions frequently arise over ethical aspects in the online communities including
social media, influencing information credibility and perceived usefulness of shared
content despite its increasing popularity.
Shaping decision-making through public channels requires the involvement of
government-endorsed experts in some cases, especially in the wake of social networking
as a tool of empowerment in Kenya. Tharaka Nithi county has 15 wards: Muthambi, Ganga,
Chogoria, Mitheru, Mwimbi, Nkondi, Marimanti, Gatunga, Chiakariga, Mukothima,
Mariani, Karingani, Igambang’ombe, Magumoni and Mugwe. These wards are distributed
across three constituencies: Maara, Tharaka, and Chuka Igambang’ombe. Every ward is
visited annually for citizen engagement through public hearings, monitoring and
evaluation. However, counties continually face social and economic challenges that
influence the proportion of men and women attending public participation. The inability to
include various constituents including women has some effect on. This study endeavors to
examine the effect of women participation in decision making on the issues affecting them
(The Government of Tharaka Nithi County, 2014).
1.3 Purpose of the Study
The purpose of the study was to examine the effect of women representation in public
participation on decision-making.
1.4 Research Questions
The following research questions guided the study.
1.4.1 What is the effect of women socioeconomic factors on decision – making at public
hearings?
1.4.2 What is the effect of women economic empowerment on decision – making at
public hearings?
1.4.3 How does women inclusion influence decision – making at public hearings?
5
1.5 Importance of the Study
This study will benefit a number of stakeholders key among them are, policy makers,
scholars, county planning committee and civic educators. These benefits are illustrated in
the following sub-sections.
1.5.1 Policy Makers
The information in this document will be useful to policy makers in Tharaka Nithi county
government and other counties to improve their already-informed processes for the future.
Devolved governments are encouraged to create community development committees
which have the potential to lead wards in the process of presenting development proposals
to county executive level.
1.5.2 Scholars
It will also contribute to the studies that academic scholars will pursue under devolution
and equality.
1.5.3 County Planning Committee
This study provides suggestions on how information collected from vulnerable groups can
be collected and analyzed to provide meaningful advice to county planning committee on
sustainable and utilizable projects in health, economic planning, agriculture, education, and
infrastructure departments. These departments have high capital expenditure and were
devolved with little support from the national government.
1.5.4 Civic Educators
Enhancing civic education and creating awareness to stakeholders has the potential of
improving leadership and inclusive citizen engagement. According to the author of this
report, when women’s participation is significantly improved, community development
committees are likely to succeed in the long term because the number of informed
participants will increase.
1.6 Scope of the Study
Tharaka Nithi County was the preferred location for this study. Although it consists 15
wards, this study will focus on three wards namely Magumoni, Igambang’ombe, and
Karingani. They were three densely populated wards located in the upper and lower zones
of the county. Research focused on employed and unemployed residents who lived and
6
worked in this county, especially actively participated in daily community management
and information sharing, which made them ideal respondents for. Data was collected in the
from August 2019 to September 2019. There were a number of limitations encountered
including, time constraints and resources constraints. The researcher however use a sample
that could be handled with the limited resources and the limited time the researcher had.
1.7 Definition of Terms
1.7.1 Public participation
Public participation is the process of engagement in governance, in which ‘people
participate together for deliberation and collective action within an array of interests,
institutions and net-works, developing civic identity, and involving people in governance
processes (Uraia, 2016).
1.7.2 Socio-economic factors
These are related to economic factors and influence one another. Examples of
socioeconomic factors are access to healthcare, availability of income, employment, and
education levels (Ramirez-Hurtado, Berbel-Pineda & Palacios-Florencio, 2018).
1.7.3 Civic Engagement
This is the political system that works to provide, produce, distribute and allocate public
goods and services to the people (Ross & Savage, 2013)
1.7.4 Economic Empowerment
It is a means through which civilians take part in the development of their communities to
enhance their living standards for the future (Adler & Goggin, 2005).
1.8 Chapter Summary
This chapter has presented the research background information, the problem statement and
the research objective. It has also included, research questions, importance of the study,
study scope and definition of terms. Chapter two presents literature review based on the
research questions. This is followed by the research methodology in chapter three, results
and findings in chapter four and finally summary, discussion, conclusion and
recommendations in chapter five.
7
CHAPTER TWO
2.0 LITERATURE REVIEW
2.1 Introduction
This chapter covers literature from some of the sources that contributes to the research on
public participation and women involvement. Literature is reviewed in line with the
research questions.
2.2 Effect of Socioeconomic Factors on Women Decision – Making at Public Hearings
Socio-economic factors are defined as the societal factors that are related to economic
factors and influence one another. Examples of socioeconomic factors are access to
healthcare, availability of income, employment and education levels (Ramirez-Hurtado,
Berbel-Pineda & Palacios-Florencio, 2018). Social development is defined as progress
made in agriculture, rural communities, technology, access to basic needs, and self-
reliance.
Development has become a trendy topic that have steered the conversation from civic
unrest to funding of these initiatives to meet Sustainable Development Goals (SDGs), the
current Millennium Development Goals (MDGs) and the new international economic order
in the short term (Szirmai, 2015). An example of a universal goal that directly addresses
the plight of women is MDG 3 which promotes gender equality and empowerment of
women. These goals were set to be achieved by the end of 2015, but many countries are
yet to achieve these targets. Socio-economic factors impact individuals’ lives who vary in
access for skilled and unskilled employment, availability of basic amenities such as shelter,
likelihood to participate in crime and investing in higher education (Credit Suisse, 2018).
The likelihood of inequality in nations has led to the development index being a measure
of the socio-economic factors highlighted in this study. Businesses therefore take socio-
economic issues as a major contributor to their success and governments. They are the key
proponents to ensuring inclusivity as a method of wealth creation and combating wealth
and income inequality. Credit Suisse (2018) reported that global household wealth rose by
4.6% to $317 trillion and the number of ultra-high net-worth individuals increased. This
indicates that there is now a higher number of women who account for 40% of wealth
according to the same report, among the 42 million millionaires registered worldwide with
an average wealth of $63,100.
8
Social indicators are important because they supplement the feedback obtained from studies
on economic indicators and they enhance the results obtained from qualitative studies on
demographic characteristics of a nation. For example, studies in health examining life
expectancy, energy consumption, literacy levels, access to clean water and equal
opportunities for both genders provide insight to researchers on societies (Szirmai, 2015).
These are all qualitative aspects of communities that are important for comparison purposes
for global analysis of development. As such, UNDP publishes the Human Development
Index (HDI), in a comprehensive report which focuses on different development themes
each year.
2.2.1 Approaches to Improving the State of Socio-Economic
Sustainable approaches to improving the state of socio-economic factors such as education
levels in developing countries include citing nations as case studies that can be used on a
comparative basis to help improve conditions in home counties devising policies to
improve their existing conditions. For example, Tanzania introduced free primary
education in 2001 and improved literacy levels by easing access to universities (Wiafe -
Amoako, 2018). The development was significant because the county depends on coffee
which is a major forex earner, with over 20 levies, taxes and licenses charged to farmers.
Kenya in comparison exported a higher amount of coffee per acre and did not impose such
high taxes. According to Hine (2018), the gender gap in girls’ education in Kenya is slowly
being reduced through increased prioritization of the cost of education to keep girls
enrolled. This comes at the cost of reducing early marriage and the perceived economic
benefits that come with the tradition. As such, the transition of girls moving from secondary
school to universities is still low in some parts of Kenya such as Trans Mara West, and
Narok North (Hine, 2018). However, if farmers access public participation forums, they
can provide cultural insight to the approaches selected by economic planners, rather than
adopt approaches selected from advanced economies. This is what Siala (2015) describes
as an increased degree of citizen engagement, which endorses socioeconomic and cultural
behavior. It also enables core tenets of structure and systems to provide motivation behind
each practice (Siala, 2015).
Developed nations used for comparison in North America, Europe and Asia, such as the
United States, United Kingdom and Malaysia (Szirmai, 2015). Evaluating the historical
processes in economic growth for modest but numerous savings made by citizens have
9
contributed to the income considerations that governments, entrepreneurs and innovators
consider for the improvement of socio-economic conditions. Therefore, both social and
economic factors that contribute to progress in civic education which requires analysis of
existing problems in a realistic and critical manner. This is one way of mitigating the
decline in social and economic inequality which focuses on the benefit of the masses, rather
than a chosen few (Szirmai, 2015).
A strong correlation was found between enhanced socio-economic status and lower fertility
rates, as a result of improved education levels and employment opportunities. Increased
equality between men and women in general led to a reduced rate of childbearing. The
sacrifices that women make to pay for their education are also related to the access to
information on family planning services which include birth control alternatives.
Governments are responsible for imposing social discipline, which ensures that
developmental targets are attained by citizens (Szirmai, 2015). Targets such as minimizing
environmental pollution, equitable distribution of resources, poverty reduction and
inclusion are some of the factors that this research highlights. These specific goals can be
sustainably addressed through involving citizenry consistently and carefully considering
suggestions and proposals presented.
Social capabilities include the technical competence a nation’s population owns. That
includes the availability of basic education, managerial expertise, financial services, access
to capital, infrastructure availability (power, transport, and communication), and access to
supporting services (Szirmai, 2015). Kenya is working towards attainment of free primary
education to address availability of basic education in the 47 counties.
In addition to this, establishment of personal identity that maps out attributes, traits, belief
system, interests and competencies can improve the success rate of women willing to
venture into economic activities (Greene & Brush, 2018). Encouraging women to own their
identity and aspirations through social entrepreneurship enhances economic growth and
diversity in addition to solving pressing societal problems. Women can also analyze social
and psychological issues that can identify behavior that can improve previously wrongly
prescribed situations in society. This ability can help align social norms to improve decision
making and improve outcomes.
10
The cultural and institutional factors that influence the decisions that men and women make
come after considerations such as social prestige, beyond religious preferences.
Considering future comfort influences the number of children women chose to have. For
example, the conviction that better education and employment opportunities lay ahead can
influence family sizes. Government programs influencing polices and legislation,
expenditure and taxation are therefore major determinants of socio-economic wellbeing.
Policies and legislation aimed at changing matters such as marriage, consent, breastfeeding,
birth control, and abortion are currently highlighted in current affairs around the world. In
Kenya, Mosley’s model proves that child mortality is directly influenced by education level
of the mother whose behavioral tendencies are likely to include basic hygiene and proper
nutrition practices (Szirmai, 2015).
2.2.2 Social Networks
Social obligations in African countries influence the social networks established for better
access to economic success and bonding is reinforced during leisure activities that build
social cohesion (Szirmai, 2015). Public participation forums are examples of gatherings
that can provide platforms for women to learn about new approaches to accessing jobs and
trading activities. Cultural practices encouraging social activities enable women to have
opportunities to accessing incentives likely to prevent default on obligations. One such
obligation is active participation in civic affairs, solidarity, and civic participation (Szirmai,
2015).
One study focusing on healthcare policy development observed that researchers could
associate the high performing health indicators with women who enjoy higher social status
and relatively higher education levels (Szirmai, 2015). Enlightenment on the importance of
hygiene, medical facility access to obtain treatment was realized among women with the
enhanced awareness of women. The link to religion also contributed to the rate of
acceptance of better health choices.
Sexual discrimination against women occurs at different levels in the world’s religions and
diverse cultures. For example, the Indian caste system propagates underproductivity. The
reason for this is occupational discrimination which restricts the talents women have. As a
result, women hold fewer jobs in health and education (Szirmai, 2015).

11
Threats to inequality alleviation include gender discrimination and violence which are both
rampant in Islamic culture - women face restriction on the education level they attain. This
is bound to affect their access to the trading, entrepreneurship, and influence the wellbeing
of children. Violence is an inhibitor of women’s political empowerment, impeding civil,
economic cultural rights, and can be contributed to by socioeconomic factors (Alesina,
Brioschi & Ferrara, 2016). Examples of nations that have provisions inhibiting violence
towards females include Malawi, South Africa and Zimbabwe in Africa. Preventing
harmful practices and norms such as the asymmetric burden on women addressing
household responsibilities is important in the development of better approaches to
increasing empowerment of communities and should be carried out in line with
international legal framework regarding public and political life (Rueschemeyer, 2016).
One such way is through increased civic education among women and girls, which can
improve their likelihood of political success, as was done in Poland.
Better civic education leads to an increased likelihood of participation in governance issues
and 5 improved selection of priority county-funded projects among citizens who believe
the priorities listed in each sector as a good fit to the needs of various social classes (Siala,
2015). Further, identification of opportunities to increase entrepreneurship among women
and youth can be done better when elevated levels of social inclusion endear towards the
financial implications of budgeting and economic planning. A reduced likelihood of
financial exclusion in hard to reach areas is minimized and tendencies towards
manipulation are avoided, according to Arnstein’s ladder of citizen participation
(Arnstein,2015). Strengthening democracy at county level can be done by the eight levels
of citizen participation proposed by Arnstein (2015): manipulation, therapy, informing,
consultation, placation, partnership, delegated power, and citizen control.
2.3 Effect of Economic Empowerment on Decision Making at Public Hearings
For the first section of this review, we shall begin by defining terms around civic
engagement. Adler and Goggin (2005) define it as means through which civilians take part
in the development of their communities to enhance their living standards for the future.
The definition that the author of this proposal relies on to define the public sector is a
combination of functions and institutions that are performed by government bodies (Levac
& Cowper-Smith, 2016). Ross and Savage (2013) defined it as a political system that works
12
to provide, produce, distribute and allocate public goods and services to the people. Both
definitions capture the core activities involved in many government agencies.
However, the practices and norms associated with public service provide methods of
carrying out civic education, according to public administration scholarship and practice
(Denhardt & Denhardt, 2015). Continuous education is one of the tools used to ensure that
civilians benefit from learning resources in the form of policy documents, presentations by
seasoned public servants, and international organizations dedicated to improving
information exposure levels of participants. The movement has particularly emphasized
efforts to empower previously unreachable sections of women and youth.
2.3.1 Empowering Citizens
In a 2016 report, Hivos committed to empowering citizens in Kenya through supporting
the government (Hivos, 2016). One of their proposed approaches was through the Dutch
Ministry of Foreign Affairs which supports civic engagement through open contracting.
Hivos has also aided in supported the establishment of safe spaces online that do not support
online harassment of women and improving working conditions for women in flower
farms, where women constitute 70% of the labor force (Hivos, 2016). Their work through
the SDG 8 promotes sustained, inclusive and sustainable economic growth, full and
productive employment and decent work for all. The organization runs programs and
projects internationally in establishing inclusive platforms and rights, agriculture, energy
development, sexual rights, and diversity, investing over 6.474 million Euros just in 2015.
Africa is considered a resource-rich continent, with 54 different countries endowed with
labor, capital, mineral and other resources that are unequally distributed. For example,
Oxfam (2019) reported that Africa’s richest control more than over 650 million people
within the same continent. The continent is plagued by dilemmas such as inability to
educate children and unsustainable debt in nations such as Ghana, Egypt, Cameroon,
Mozambique and Nigeria. The same report states that females have a higher likelihood of
being poor in the continent, and a lower probability of advancing in their studies (Oxfam
International, 2019). Unpaid labor is characteristic in nations such as Kenya where
healthcare costs, where 50% of the population hold approximately $22.98 billion.
Major challenges that arise in the computation of economic growth include pegging all
progress in monetary terms. Developing countries focus on subsistence production which

13
only partly regards money as national income. Further, Gross National Product (GNP)
calculation inadequately factors in results of the informal sector, which dominates the
developing world (Szirmai, 2015).
2.3.2 Women in Leadership
According to research, the challenges women face when attempting to participate in
governance include constant downplaying by male counterparts and the presumption that
women are second class citizens (Otieno 2013). Of course, this remains a debatable point
of view considering the impressive accomplishments that women have made when granted
the opportunity to build their nations.
According to the International Knowledge Networks of Women in Politics, when women
are enabled to become leaders in political realms, their nations enjoy higher living
standards, improved infrastructure, education, and health services. The conclusion is based
on the observation that in 2016 when the number of national women leaders was only 6.9%,
but since then, steady increase in participation by women has led to the improvements
previously discussed.
The widening stream of women becoming heads of state, members of parliament and
representatives is due to continuous adult training and capacity building designed
specifically to improve female skills in a male-dominated field. When measuring
socioeconomic indicators is done, quantifiable variables are usually considered for
researchers to understand demographic factors better. Measurement of growth and
development is done through evaluating changes in indicators to each variable (Szirmai,
2015). For example, increments and decreases in national income can be calculated through
computing all incomes, which include wages, profits, interest, dividends, and rent.
Alternatively, it can be calculated through calculating the national product. For each of the
indicators, it should be observed that there is little or no distinction between male and
female contribution to the indicator. This is just one of the technical problems involved in
measurement of economic growth and shows that growth and development are neutral to
the self-imposed distinctions that individuals make. An increase in these indicators is
therefore a product of the collective efforts of a nation’s people (Szirmai, 2015).
Demographic characteristics vary in developing counties. They include population size,
population density and population growth rates. In the data provided in this research, the
14
proportion of female and male population is skewed towards women. Fluctuations in
demographics influence regional characteristics and therefore differences in experiences
are seen in regions of Sub-Saharan Africa, South Asia, East Asia and Latin America
(Szirmai, 2015). These in turn are influenced by socioeconomic factors such as income
levels because the size of income gaps between countries and regions is based on economic
interests and trade which may be dependent of independent, especially in developing
nations. Wilkinson and Pickett (2017) argue that inequality in income can even cause
prevalent health and social problems.
Vuleta (2018) asserts that an increasingly precarious political and geographic environment
exists. Women such as Theresa May, Christine Lagarde, and Angela Merkel have the
potential to steer European economies through their participation in the EU and German
government respectively. The former ranked first of twenty - two influential women around
the globe, while the later ranked second on the same ranking according to Forbes Magazine.
Despite the success that they enjoy, they are also subject to numerous setbacks in politics
and policy development. Hilary Clinton for instance, was the subject of severe criticism
over decisions that she made throughout her career. Indeed, women are subject to higher
levels of scrutiny in contemporary media culture, especially when they exhibit social
influence.
2.3.3 Improve the Livelihoods
With regards to socioeconomic impact and policy development, third world countries are
still looking for ways to improve the livelihoods of their people. Developing nations have
a range of similarities such as large shares of agricultural production and smaller
proportions of industrial production which have been utilized for many years as a means of
economic empowerment. This has led to devolved governments prioritizing key sectors
considered the drivers of development and presenting healthcare, education, water, and
agriculture agendas in manifestos (Njuki, 2017).
Agricultural developments over the past 12,000 years have led to the spread of inequality
due to the egalitarian origins of both political and economic features in societies (Mattison,
Smith, Shenk, & Cochrane, 2016). Additionally, developing nations also experience a wide
gap between the modern and traditional sectors, characterized by adaptive and primitive
technology approaches in the economy and these areas of interest impact the appeal of
specific careers for females in comparison to their counterparts (Szirmai, 2015). Otieno
15
further argues that women lack tools creating access to power. One could argue that perhaps
this is one of the reasons why women refrain from active participation in politics in Kenya:
they see their contributions as means with no fruitful ends.
Inevitably, income available to households must be computed after statutory
responsibilities (such as taxes and licenses) have been met and for years, these taxes have
been excessive (Wiafe -Amoako, 2018). This in turn leads to the economic resources
available to sustain wellbeing becoming fewer in the developing world. Low income levels
influence life expectancy, mortality and infant mortality rates (Wilkinson and Pickett,
2017). By participating in discussions around the economy, participants can learn more
about the policies in their counties, their history and their direct impact on their lives. This
is particularly important in regions that depend on agriculture, tourism, and mining:
Tharaka Nithi is an example of a county that fits this description (CIDP, 2017/18-2021/22).
Major challenges that arise in the computation of economic growth include pegging all
progress in monetary terms. Developing countries focus on subsistence production which
only partly regards money as national income. Further, Gross National Product (GNP)
calculation inadequately factors in results of the informal sector, which dominates the
developing world (Szirmai, 2015). Opinions on appearance, beauty, intelligence are
relentlessly highlighted in addition to attention-drawing opinions (Elias, Gill & Scharff,
2017). Does this phenomenon increase oppression? The author of this proposal believes
so because the diversity of choices that women make is based on their willingness to be
criticized despite the economic, industrial, financial, religious and social benefits that come
with participating in decision-making in employment (Hakim, 2016).
2.4 Influence of Inclusion on Women Decision Making at Public Hearings
According to Percy (2018), policy development is plagued by vague mandates that
influence the rate of development specifically in the infrastructure sector, education, and
employment practices. These are sectors that directly affect women and their performance.
Policy development plays a major role in wealth distribution and equality, impacting the
roles that women play in society. Public participation is a political principle whose ideals
are embedded in inclusivity in terms of access to the previously discussed socioeconomic
factors and access to leadership.

16
2.4.1 Inclusivity
Inclusion allows fair sharing of opinions despite differences in ethnic backgrounds. It can
therefore be included that inclusion in the digital age improves the competence of citizens
based on their access to various forms of media (Schulz, Ainley, Fraillon, Losito, Agrusti,
& Friedman, 2018). Experts argue that religion helps popularize inclusive values that
enhance the process of political participation in an era where there is always room for
improvement especially in citizenship education for the youth. Religion promotes access
to early opportunities in politics and molds the ideals of a nation such as environmental
awareness and collective efforts to combat current issues such as climate change (Schulz,
Ainley, Fraillon, Losito, Agrusti, & Friedman, 2018).
Inclusive societies are also reported to have better levels of peace, tolerance in their
education systems and high achieving students with strong civic and citizenship capacities.
This further enhances the level of autonomy in institutions such as schools and encourage
experiences in decision-making. Attitudes towards democracy, equal opportunities,
perceptions to global issues are fostered in learning institutions where youth first learn
about foreign affairs: past leaders seeking to mentor future generations of political experts
have an interest in ensuring inclusivity at academic level (Schulz, Ainley, Fraillon, Losito,
Agrusti, & Friedman, 2018). Further, authors argue that just before 1990, over 80% of
participants of one Gallup Poll were convinced that those living with disabilities in the U.S.
received insufficient support. The situation had improved since the 1960s, but not
significantly (Percy, 2018). This is case of America’s policy development processes
illustrates how policy implementation and public services are both overwhelmed by low
levels of women engagement.
For 2019, the HDI Report will focus on inclusivity, in addition to providing an international
ranking on the income levels, education and health – all major socioeconomic indicators
highlighted in this paper. SDG 10 which covers inequality is at the core of the discussions
on the HDI report, which also factors the critical role families play as incubators of
individual social development (UNDP, 2019). Szirmai (2015) delves further and
conceptualizes approaches to development into two: fighting against poverty and analysis
of long-terms economic and social development in his argument for developing countries
and the importance of understanding of socio-economic development. For the billions of
individuals living on $1.25 a day (Banerjee, Duflo, Goldberg, Karlan, Osei, Pariente &

17
Urdy, 2015) to experience an improvement in their living standards, a great deal of progress
must be made. If more educational opportunities are awarded to women, the costs
associated with childbearing and raising children (Szirmai, 2015).
2.4.2 Inequality
One of the reasons for the imbalance witnessed in socioeconomic factors and achievement
of development goals is inequality (Wilkinson & Pickett, 2017). Socio-economic factors
have a significant effect on the contributions to household income and therefore
opportunities to improve inclusivity. For example, African housewives still require the
assistance of children to provide food. Based on the family structures that exist in the
society, the distribution of costs and benefits limit family size and therefore the ability of
women to provide for their nuclear and extended families (Szirmai, 2015).
Conceptualization of formal and informal political spaces for women and potentially
increase the entrepreneurship pool and skilled workforce (Hakim, 2004). Innovative
creation and design of public policy includes the involvement of all available stakeholders.
However, this balancing act has taken organizations and governments years to improve.
The devolution system in Kenya committed to increase the capacity of women through the
minimum of one third gender rule (Mudi & Waswa, 2018).
Admittedly, the male-dominated parliament still requires an objective means of managing
employment opportunities for women in Kenyan society and women in politics continue to
gain interest and scrutiny (Biegon, 2016). Having at last 33% of women appointed to
leadership roles would significantly improve the roles that females play in leadership.
Today, only two of the forty-seven county governors are women. The overall effect of this
shows sluggish progress from the first MTEF period where none of the 47 governors were
women (Kivoi, 2014). Satisfaction of both male and female citizens of all ages is less than
satisfactory, despite the masculine political ideologies spread by the media to date,
questioning the effectiveness of empowering women.
2.4.3 Ethnic Politics
One study asserts that in addition to the slow pace of change, ethnic politics in multiethnic
societies present opportunities and conditions hindering even the most fundamental forms
of participation by women in sub-Saharan Africa (Arriola & Johnson, 2014). Researchers
also discovered that in the 34 countries in the study, those with highly politicized ethnic
18
groups had fewer female MPs. This study utilizing data from 1980 to 2005 argued that the
proportion of women representatives rises in more democratized nations. In Uganda,
researchers found that basic need security and wellbeing increased in families where a
woman was a member of an agricultural cooperative and bore knowledge of agronomic
practices. The quasi-experimental study examined women in the north-eastern region and
found that women’s empowerment bridges the gender inequality gap (Lecoutere, 2017).
For decades, governments have been requested to revolutionize their approach towards
engaging the public through value addition (Hassan, 2017) in order to enhance an otherwise
dull and boring activity of increasing social competence. This has led to the development
of development groups, unions, and other groups designed to improve the bargaining
capital of interested parties.
Social movements have gained influence over the past decade as a result of the
development of coordinated factions that better understanding of the needs of the nations
including water, sanitation, hygiene, labor management, and youth engagement. In 2012,
Canadians took protests to Quebec presenting their discomfort with labor laws and austerity
measures (Collombat, 2016). This is an example of a dialectical approach that organized
groups resort to once formal communication channels become ineffective and when a
government and its people fail to reach compromise.
2.4.4 Contribution of Women in Leadership
Some research suggests that women provide diversity and intersectionality when involved
in leadership and in order to counter under-representation, females should be involved in
decision-making (Cook & Glass, 2014). Strengthened negotiating capacity and access to
justice for communities comes from inclusion of women. This is the only way in which
organized change can be planned for (Maracle, 2018). Findings on inclusive leadership in
six countries (India, Germany, Mexico, USA, Australia, and China) show that innovation
levels improved under inclusive environments. Further, the study concludes that the more
people felt involved, the better their sense of duty became: team objectives were met
quicker and a sense of belongingness and endearment improved the workplace (Prime &
Salib, 2014).
Unique skills provided by women include human resource management, professional
competence, risk management, and business sustainability. They all improve firm value
19
(Kim & Starks, 2016). Government and non-government agencies benefit from these
aspects of strength. In corporate boards, gender diversity with a preference for women is
argued by these authors to lead to high firm value and stronger market value. Performance
mechanisms chosen by female directors in leadership are also hypothesized to be of better
quality and long-lasting impact in business.
Once focused on governance, the skill sets positively impact forgotten populations such as
poor and vulnerable young people who face more risk factors in comparison to their peers
(Arora, Shah, Chaturvedi, & Gupta, 2015). These factors and indicators are health related
factors, social factors, and family problems. Women can address these challenges through
their participation in governance and well-respected leaders have exhibited their
competence in and their employment could improve governance.
Increasing autonomy through increasing the formal education of women has been proven
to improve decisions in reproductive health in Nepal. Safer sex practices among married
women was high for women and their ability to negotiate and take part in decision making
and asset acquisition (Atteraya, Kimm, & Song, 2014). It is important for women to
empower women to make simple and complex decisions in every aspect of national growth.
Women provide additional skills to the negotiation table. For example, women are
described to have budgeting, multi-tasking, persuasive and negotiation skills once they
become entrepreneurs (Greene & Bush, 2018). “Mumpreneurs” posit experiences that they
have mastered, such as giving birth and raising children, which provide insight to important
social skills (Markowska, 2016).
2.5 Chapter Summary
This chapter began by presenting an introduction of the literature review for the topic which
covered highlighting socioeconomic factors, economic empowerment, and inclusive citizen
engagement. It continued to provide information to readers on the theoretical views of
public sector hearings and shared information such as the threats and benefits that come
with empowering citizens to participate in public hearings. Examples of policies made with
both high and low levels of public participation were provided and the ladder of public
participation according to Arnstein was explained. The next chapter provides research
methodology followed by results and findings in chapter four and finally, summary,
discussion, conclusion and recommendations in chapter five.
20
CHAPTER THREE
3.0 RESEARCH METHDOLOGY
3.1 Introduction
In the chapter, research methodology is provided, giving specific details about the methods
and procedures used to carry out the study. The first section explains the research design
followed by target population and sampling design. Thereafter, the sampling frame and
techniques as well as sample size are provided. The last sub-section contains the data
collection methods, research procedures and data analysis methods.
3.2 Research Design
Research design identifies efficient methods of evaluating solutions for unique societies,
especially in clinical research (McCusker & Gunaydin, 2015). It is the process of using real
world approaches to obtain information for qualitative and quantitative research, for non-
business disciplines at post-graduate level and knowledge creation for undergraduate
students (Quinlan, Babin, Carr, & Griffin, 2019). Kumar (2019) defines research design as
a two-pronged approach that involves conceptualization of a study and establishing an
organized means of obtaining answers for the research questions formulated in the research
process. These two functions ensure that researchers identify the correct population,
sampling method, contacting methods, and response mechanisms to participants’ questions.
Bhat (2019) defines exploratory research as research approach used to investigate problems
that are not well defined. In this case, the reasons for poor participation of women are not
simple to identify and originate from a range of causes unique to each ward visited. The
author of this project combined two approaches to research design, namely action research
which focuses on investigative and diagnostic data collection and exploratory design which
was used to gain information on the public sector topic to answer the research questions
presented in section 1.3. Both approaches aided in identification of institutional
weaknesses in the process of public participation at county government level (Siala, 2015).
It was also affordable for the author to carry out both action and exploratory research
because both methods provided the necessary tools required to establish the causes of
challenges in public participation events.
21
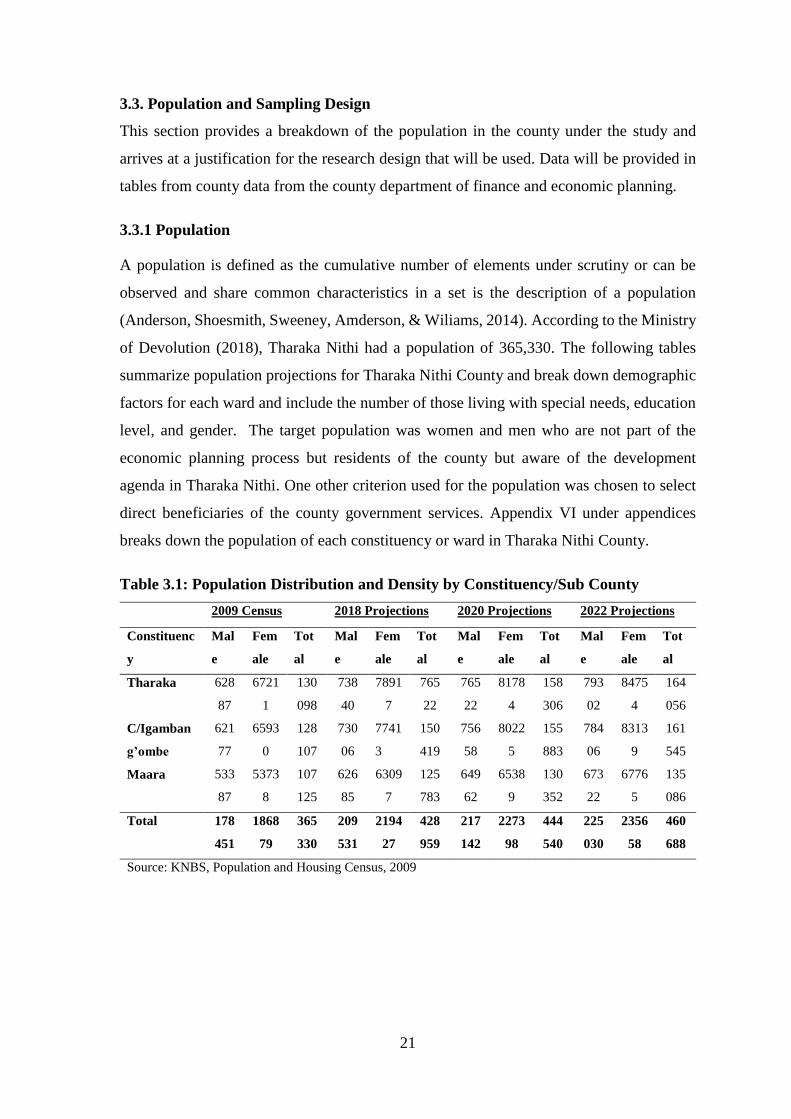
3.3. Population and Sampling Design
This section provides a breakdown of the population in the county under the study and
arrives at a justification for the research design that will be used. Data will be provided in
tables from county data from the county department of finance and economic planning.
3.3.1 Population
A population is defined as the cumulative number of elements under scrutiny or can be
observed and share common characteristics in a set is the description of a population
(Anderson, Shoesmith, Sweeney, Amderson, & Wiliams, 2014). According to the Ministry
of Devolution (2018), Tharaka Nithi had a population of 365,330. The following tables
summarize population projections for Tharaka Nithi County and break down demographic
factors for each ward and include the number of those living with special needs, education
level, and gender. The target population was women and men who are not part of the
economic planning process but residents of the county but aware of the development
agenda in Tharaka Nithi. One other criterion used for the population was chosen to select
direct beneficiaries of the county government services. Appendix VI under appendices
breaks down the population of each constituency or ward in Tharaka Nithi County.
Table 3.1: Population Distribution and Density by Constituency/Sub County
2009 Census 2018 Projections 2020 Projections 2022 Projections
Constituenc
y
Mal
e
Fem
ale
Tot
al
Mal
e
Fem
ale
Tot
al
Mal
e
Fem
ale
Tot
al
Mal
e
Fem
ale
Tot
al
Tharaka 628
87
6721
1
130
098
738
40
7891
7
765
22
765
22
8178
4
158
306
793
02
8475
4
164
056
C/Igamban
g’ombe
621
77
6593
0
128
107
730
06
7741
3
150
419
756
58
8022
5
155
883
784
06
8313
9
161
545
Maara 533
87
5373
8
107
125
626
85
6309
7
125
783
649
62
6538
9
130
352
673
22
6776
5
135
086
Total 178
451
1868
79
365
330
209
531
2194
27
428
959
217
142
2273
98
444
540
225
030
2356
58
460
688
Source: KNBS, Population and Housing Census, 2009
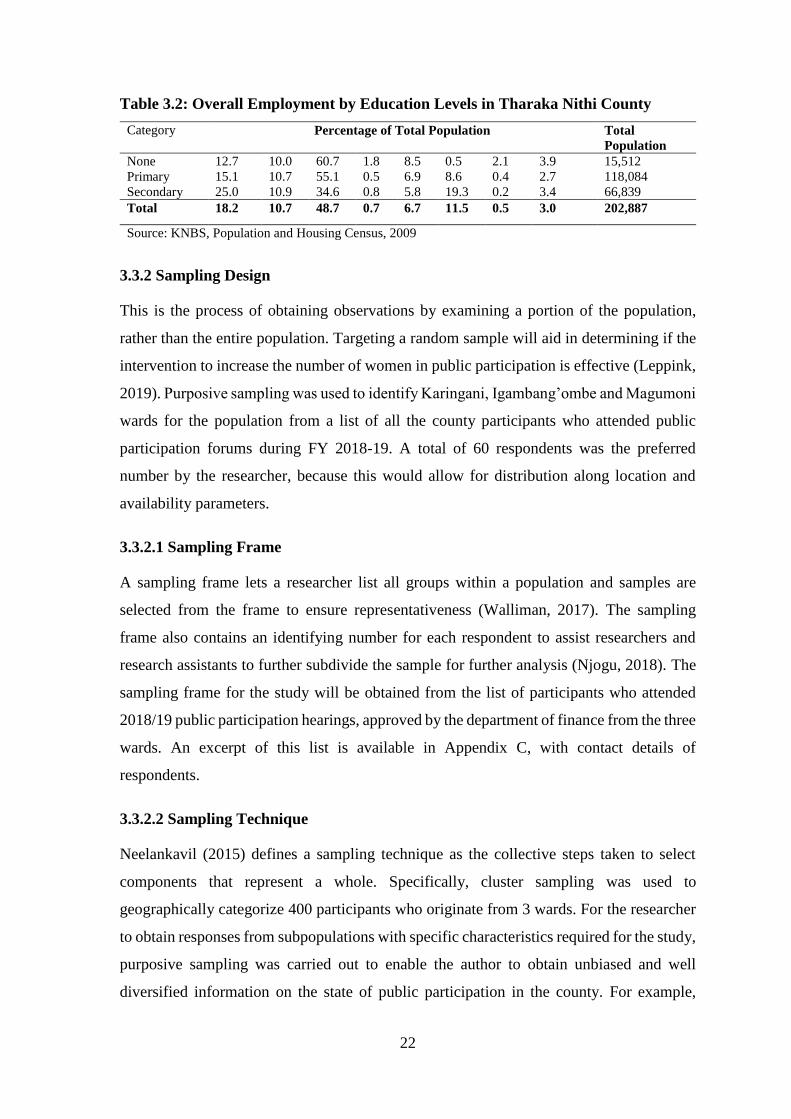
22
Table 3.2: Overall Employment by Education Levels in Tharaka Nithi County
Category Percentage of Total Population Total
Population
None 12.7 10.0 60.7 1.8 8.5 0.5 2.1 3.9 15,512
Primary 15.1 10.7 55.1 0.5 6.9 8.6 0.4 2.7 118,084
Secondary 25.0 10.9 34.6 0.8 5.8 19.3 0.2 3.4 66,839
Total 18.2 10.7 48.7 0.7 6.7 11.5 0.5 3.0 202,887
Source: KNBS, Population and Housing Census, 2009
3.3.2 Sampling Design
This is the process of obtaining observations by examining a portion of the population,
rather than the entire population. Targeting a random sample will aid in determining if the
intervention to increase the number of women in public participation is effective (Leppink,
2019). Purposive sampling was used to identify Karingani, Igambang’ombe and Magumoni
wards for the population from a list of all the county participants who attended public
participation forums during FY 2018-19. A total of 60 respondents was the preferred
number by the researcher, because this would allow for distribution along location and
availability parameters.
3.3.2.1 Sampling Frame
A sampling frame lets a researcher list all groups within a population and samples are
selected from the frame to ensure representativeness (Walliman, 2017). The sampling
frame also contains an identifying number for each respondent to assist researchers and
research assistants to further subdivide the sample for further analysis (Njogu, 2018). The
sampling frame for the study will be obtained from the list of participants who attended
2018/19 public participation hearings, approved by the department of finance from the three
wards. An excerpt of this list is available in Appendix C, with contact details of
respondents.
3.3.2.2 Sampling Technique
Neelankavil (2015) defines a sampling technique as the collective steps taken to select
components that represent a whole. Specifically, cluster sampling was used to
geographically categorize 400 participants who originate from 3 wards. For the researcher
to obtain responses from subpopulations with specific characteristics required for the study,
purposive sampling was carried out to enable the author to obtain unbiased and well
diversified information on the state of public participation in the county. For example,
23
members of special interest groups who attend public participation were requested to
respond through the questionnaires, as an important subpopulation.
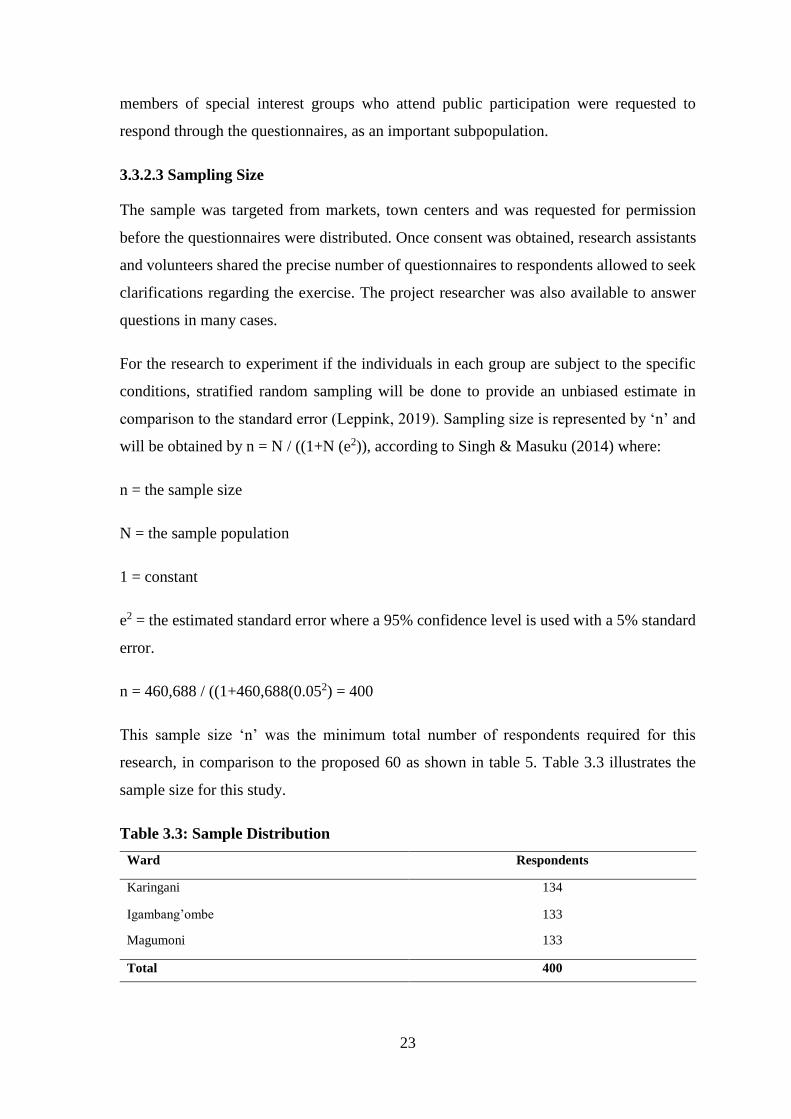
3.3.2.3 Sampling Size
The sample was targeted from markets, town centers and was requested for permission
before the questionnaires were distributed. Once consent was obtained, research assistants
and volunteers shared the precise number of questionnaires to respondents allowed to seek
clarifications regarding the exercise. The project researcher was also available to answer
questions in many cases.
For the research to experiment if the individuals in each group are subject to the specific
conditions, stratified random sampling will be done to provide an unbiased estimate in
comparison to the standard error (Leppink, 2019). Sampling size is represented by ‘n’ and
will be obtained by n = N / ((1+N (e2)), according to Singh & Masuku (2014) where:
n = the sample size
N = the sample population
1 = constant
e2 = the estimated standard error where a 95% confidence level is used with a 5% standard
error.
n = 460,688 / ((1+460,688(0.052) = 400
This sample size ‘n’ was the minimum total number of respondents required for this
research, in comparison to the proposed 60 as shown in table 5. Table 3.3 illustrates the
sample size for this study.
Table 3.3: Sample Distribution
Ward Respondents
Karingani 134
Igambang’ombe 133
Magumoni 133
Total 400
24
3.4 Data Collection Methods
This study involved the collection of primary data. The study used structured questionnaire
to collect primary data. It is advisable to use structured questionnaire to prevent
misconception of the idea of study, while at the same time it is deemed appropriate for
descriptive research because it allows the researcher to investigate perception of
participants on the variable of study.
The questionnaire items were constructed from the research questions while it also
contained questions to capture respondents’ demographic data. The questions on the
research questions were constructed in a Likert Scale nature with a 5 point scale. The first
part contained the demographic questions, the second part captured effect of women
socioeconomic factors on decision – making, the third part captured effect of women
economic empowerment on decision – making, the fourth part captured how women
inclusion influence decision – making. The fifth part contains questions on women decision
making and the last part had general questions. These formed the data that was analyzed
and interpreted.
3.5 Research Procedures
This research was carried out in an orderly manner in order to attain its purpose and ensure
reliable data collection and analysis. First, an introductory letter was obtained from the
Institution Review Board in USIU-A. This letter enabled the researcher to apply for
NACOSTI permit for carrying out the research. The researcher then approached the
respondent with these letters and voluntarily recruited participants. Following their
approval and acceptance to participate in the study the researcher first involved 10
respondents in a pilot study. The pilot study raised a number of issues such as unclear
questions, ambiguous questions and unnecessary questions. The questionnaire was
readjusted to ensure they collect accurate information.
The actual study followed the pilot study after the review of the questionnaire. The
questionnaire during the actual study were dropped to respondents at their convenience.
They were given 1 day to fill the questionnaire and the researcher revisited them to collect
the completed questionnaires the next day. This enabled a high response rate because the
respondents had a whole day to respond to the questionnaire. The researcher further,
informed the respondents how the data would be used and the confidentiality of their info
and that participation would be voluntarily. This facilitated collaboration from the
25
participants and also ensured the researcher remained ethical by using the data only for the
intended academic purpose.
3.6 Data Analysis Methods
This study collected quantitative data from the participants. The data was analyzed
statistically through both descriptive and inferential statics. It was first cleaned and coded
in preparation for data entry into Statistical Package Social Sciences (SPSS), and then
entered in SPSS prior to analysis. Descriptive analysis was performed by calculating the
percentage and average scores and standard deviation values of the field data. This enabled
the researcher to describe, illustrate and summarize the large quantity of collected data in a
significant way. Inferential statistics involved correlation and regression analysis that was
done to assess the relationship of the study variables. The data was presented in figures and
tables.
The regression equation used is represented below:
Y=a+ b1x1 + e
Y= Dependent variable (decision making)
a = constant
x1 = Independent Variable (socioeconomic factors, economic empowerment, inclusive
citizen engagement).
3.7 Chapter Summary
This chapter has summarized the various research methods that the author proposes to
utilize for the project, which included targeting 60 respondents for questionnaire
distribution, telephone interviews, and focus group discussions. Research design, sampling
design, and data collection methods were discussed in the initial sections of the chapter
were linked to the use of primary and secondary data sources obtained from the Budgeting
and Economic Planning Unit. The pilot run to test effectiveness of the research tools and
analysis methods was discussed in this chapter and a preamble to the analysis methods used
are highlighted in the concluding sections of this chapter. The next chapter provides results
and findings followed by summary, discussion, conclusion and recommendations in
chapter five.
26
CHAPTER FOUR
4.0 RESULTS AND FINDINGS
4.1 Introduction
This chapter presents the results and findings of the study. Results are presented in line
with the research questions starting with response rate and background information. This
is followed by effect of socioeconomic factors on decision making, effect of women
economic empowerment on decision making at public hearing, and finally, women
inclusion influence decision making at public hearings.
4.2 Response Rate and Background
This sub-section provides response rate and background information. It starts with response
rate followed by background information. A total of 120 women and 116 men recorded
their respondents through submitted questionnaires and shared their feedback on the nature
of high capital projects that the county would benefit from and suggestions on how to
improve the participation of women in decision-making on project selection activities.
4.2.1 Response Rate
The researcher targeted 400 respondents overall, consisting of an equal number of male
and female respondents. However, a total of 236 questionnaires were received after
distribution representing a 59% response rate.
4.2.2 Background Information
The background information section showed that respondents were classified according to
gender, age, academic qualification, employment status, religion, and ward.
4.2.2.1 Respondents’ Gender
Information provided by respondents showed that there were 120 women and 116 men,
representing 50.6% and 49.4% of the respondents respectively. This is illustrated in Figure
4.1.

27
Figure 4.1: Respondents’ Gender
4.2.2.2 Academic Qualification
The respondents shared information on their levels of education. Approximately 17% of
respondents attained only primary school education while 56% of all respondents attended
secondary school. According to results 26%of all respondents attended tertiary institutions
such as TVET, colleges, and universities. The results are shown Figure 4.2.
Figure 4.2: Academic Qualification
4.2.2.3 Employment Status
With regards to employment and empowerment opportunities, respondents shared the
following: 32.2% of men are employed while 37.4% are employed women. In total, 82
respondents classified themselves as employed while 154 did not. This includes
respondents who did not consider subsistence farming gainful employment and shows that
0.00%
10.00%
20.00%
30.00%
40.00%
50.00%
60.00%
Primary Secondary Tertiary
18.50%
54.60%
26.90%
Academic Qualification
49.40%
50.60%
Respondents' Gender
Male
Female
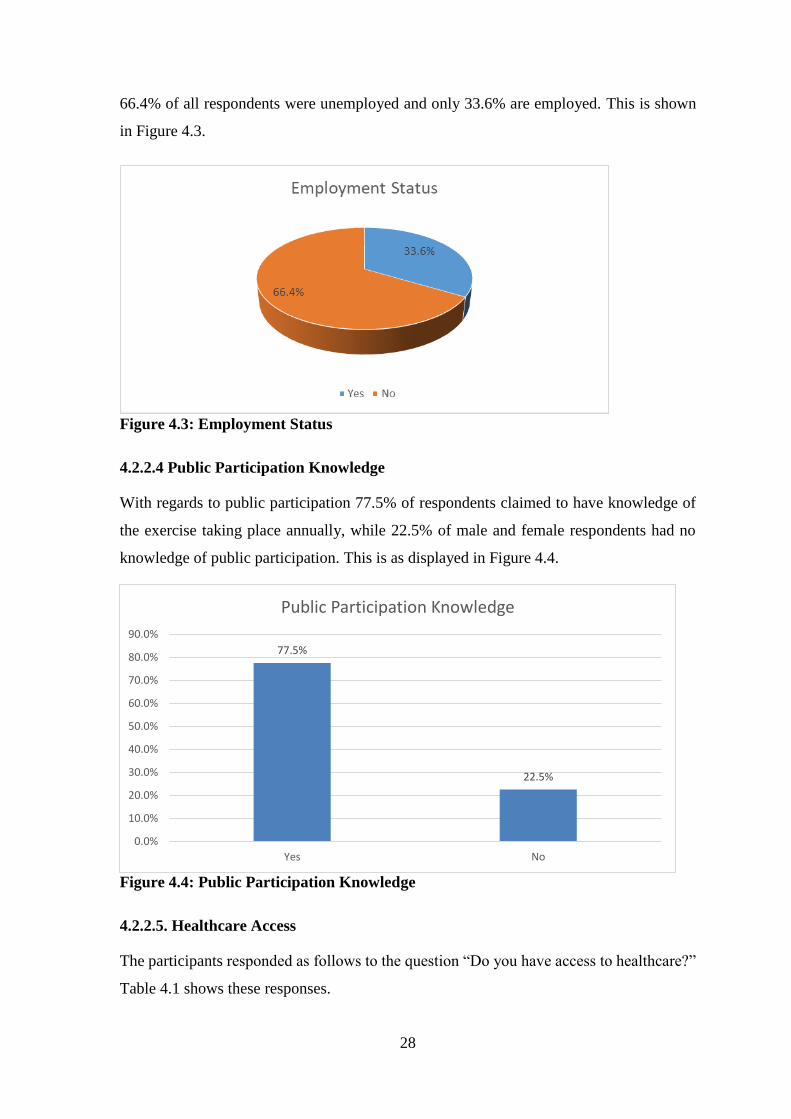
28
66.4% of all respondents were unemployed and only 33.6% are employed. This is shown
in Figure 4.3.
Figure 4.3: Employment Status
4.2.2.4 Public Participation Knowledge
With regards to public participation 77.5% of respondents claimed to have knowledge of
the exercise taking place annually, while 22.5% of male and female respondents had no
knowledge of public participation. This is as displayed in Figure 4.4.
Figure 4.4: Public Participation Knowledge
4.2.2.5. Healthcare Access
The participants responded as follows to the question “Do you have access to healthcare?”
Table 4.1 shows these responses.
77.5%
22.5%
0.0%
10.0%
20.0%
30.0%
40.0%
50.0%
60.0%
70.0%
80.0%
90.0%
Yes No
Public Participation Knowledge
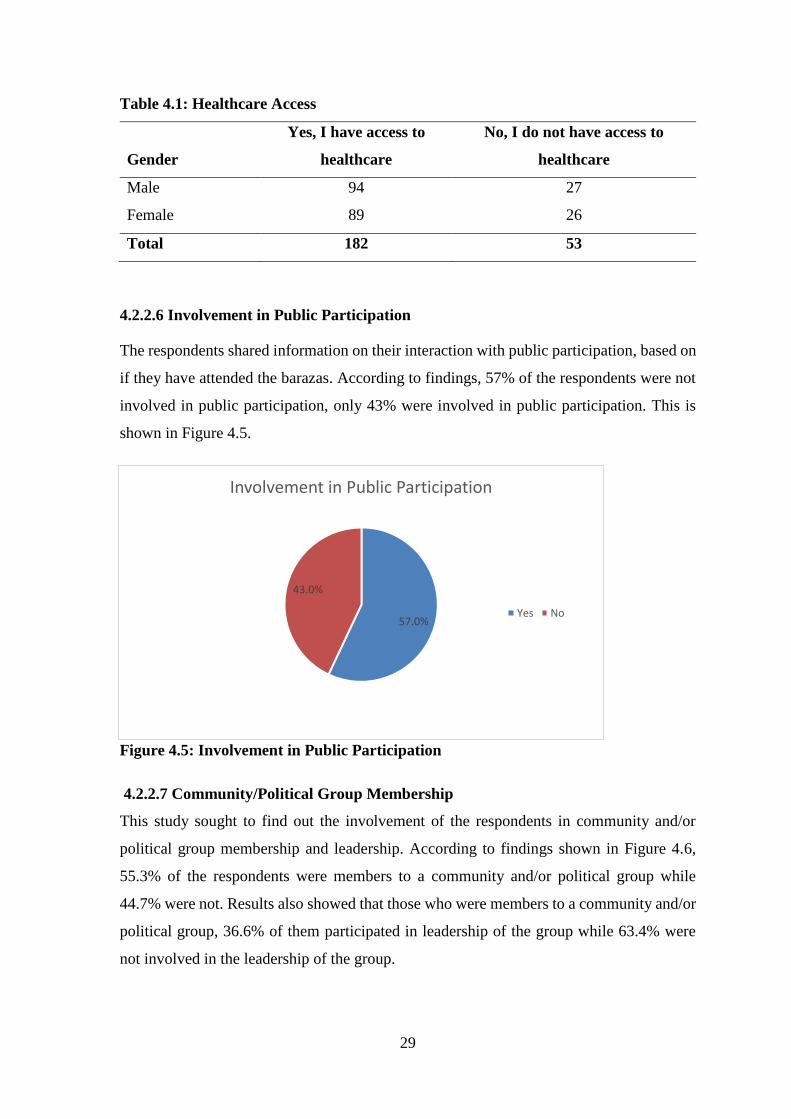
29
Table 4.1: Healthcare Access
Gender
Yes, I have access to
healthcare
No, I do not have access to
healthcare
Male 94 27
Female 89 26
Total 182 53
4.2.2.6 Involvement in Public Participation
The respondents shared information on their interaction with public participation, based on
if they have attended the barazas. According to findings, 57% of the respondents were not
involved in public participation, only 43% were involved in public participation. This is
shown in Figure 4.5.
Figure 4.5: Involvement in Public Participation
4.2.2.7 Community/Political Group Membership
This study sought to find out the involvement of the respondents in community and/or
political group membership and leadership. According to findings shown in Figure 4.6,
55.3% of the respondents were members to a community and/or political group while
44.7% were not. Results also showed that those who were members to a community and/or
political group, 36.6% of them participated in leadership of the group while 63.4% were
not involved in the leadership of the group.
57.0%
43.0%
Involvement in Public Participation
Yes No

30
Figure 4.6: Community/Political Group Membership
4.3 Effect of Socioeconomic Factors on Decision-Making in Women at Public
Participation Hearings
This study examined several factors relating to socioeconomic and their effect on decision
making among women in public participation. Findings showed that 24.8% of the
respondents felt that health and community awareness projects was a very good contributor
to women decision making, 31.8% felt it was a good contributor and 13.9% were neutral
while 15.6% thought it was a poor contributor and 13.9% thought it was very poor
contributor. This had a mean of 3.8 and a standard deviation of 0.3. According to 31.1%
respondents said that education projects were a very good contributor to women decision
making, 34% also felt education projects were a very good contributor while 18.5% were
neutral and 12.6% thought it had a poor contribution and 3.8% felt it had a very poor
contribution. This had a mean of 4.2 and a standard deviation of 0.7.
Entrepreneurship opportunities, according to 20.8% of the respondents was a very good
contributor to women decision making and according to 20.8% it was a good contributor
while 34.2% were neutral and still according to 14.3% it was a poor contributor and 12.5%
felt it was a very poor contributor. This had a mean of 4.6 and a standard deviation of 0.8.
Women and youth employment creation was a very good contributor to women decision
making according to 15.4% respondents while according to 31.6% it was just a good
contributor, however 25.6% were neutral and still 14.1% thought it was a poor contributor
0.0%
10.0%
20.0%
30.0%
40.0%
50.0%
60.0%
70.0%
Community/Political GroupMembership Leadership
55.3%
36.6%
44.7%
63.4%
Community/Political Group Membership & Leadership
Yes No
31
while 13.3% thought it was a very poor contributor. This had a mean of 4.0 and a standard
deviation of 0.7.
According to 12.9% respondents ATI/veterinary lab/ milk processor plant construction and
farm input provision was a very good contributor to women decision making while 21.3%
felt it was just a good contributor but 17.1% were neutral and yet 21.3% felt it was a poor
contributor and 27.4% felt it was very poor contributor. This had a mean of 4.7 and a
standard deviation of 0.9. Water project was a very good contributor according to 25.5%
and according to 28.9% it was just a good contributor while 13.7% were neutral and still
20.1% felt it was a poor contributor and11.8% felt it was a very poor contributor. This had
a mean of 3.8 and a standard deviation of 0.5.
According to 19.7% of the respondents housing was a very good contributor to women
decision making and 27.5% felt it was good contributor while 21.5% were neutral and still
17.1% thought it was a poor contributor while 14.2% felt it was a very poor contributor.
This had a mean of 4.6 and a standard deviation of 0.4. Electrification and ICT connectivity
was a very good contributor according to 21.7% and 38.7% felt that it was a good
contributor while 17.4% were neutral and still 10.0% felt it was a poor contributor
and12.2% felt it was a very poor contributor. This had a mean of 4.1 and a standard
deviation of 0.6.
Roads, footbridges and bridges were a very good contributor of women decision making in
public participation according to 22.2% and just a good contributor according to 32.6%
while 15.7% were neutral but still 16.9% felt it was a poor contributor and according to
12.6% it was a very poor contributor. This had a mean of 3.9 and a standard deviation of
0.7. According to 14.9% of the respondent’s construction / completion of markets and trade
parks was a very good contributor and according to 28.2% it was just a good contributor
while 23.8% were neutral and still 16.7% felt it was a poor contributor and 16.4% felt it
was a very poor contributor. This had a mean of 3.9 and a standard deviation of 0.9. These
results are shown in Table 4.2.
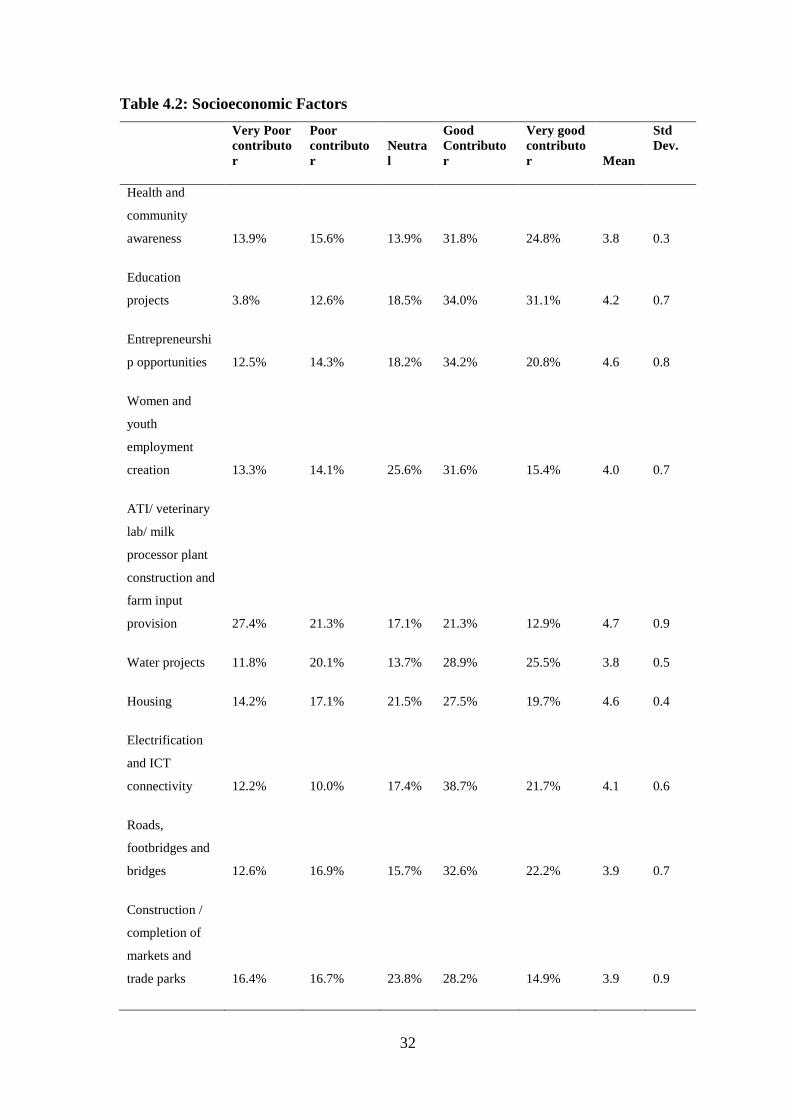
32
Table 4.2: Socioeconomic Factors
Very Poor
contributo
r
Poor
contributo
r
Neutra
l
Good
Contributo
r
Very good
contributo
r Mean
Std
Dev.
Health and
community
awareness 13.9% 15.6% 13.9% 31.8% 24.8% 3.8 0.3
Education
projects 3.8% 12.6% 18.5% 34.0% 31.1% 4.2 0.7
Entrepreneurshi
p opportunities 12.5% 14.3% 18.2% 34.2% 20.8% 4.6 0.8
Women and
youth
employment
creation 13.3% 14.1% 25.6% 31.6% 15.4% 4.0 0.7
ATI/ veterinary
lab/ milk
processor plant
construction and
farm input
provision 27.4% 21.3% 17.1% 21.3% 12.9% 4.7 0.9
Water projects 11.8% 20.1% 13.7% 28.9% 25.5% 3.8 0.5
Housing 14.2% 17.1% 21.5% 27.5% 19.7% 4.6 0.4
Electrification
and ICT
connectivity 12.2% 10.0% 17.4% 38.7% 21.7% 4.1 0.6
Roads,
footbridges and
bridges 12.6% 16.9% 15.7% 32.6% 22.2% 3.9 0.7
Construction /
completion of
markets and
trade parks 16.4% 16.7% 23.8% 28.2% 14.9% 3.9 0.9

33
4.3.1 Correlation Between Socioeconomic Factors and Decision-Making
There was a significant positive correlation between decision making in women in public
participation and socioeconomic factors, r=0.213, p<.001. These results are shown in Table
4.3.
Table 4.3: Correlation Between Socioeconomic Factors and Decision-Making
Factor Decision Making
Socioeconomic Factors Pearson
Correlation .213**
Sig. (2-tailed) .001
**. Correlation is significant at the 0.01 level (2-tailed).
*. Correlation is significant at the 0.05 level (2-tailed).
4.3.2 Regression on Socioeconomic Factors and Decision-Making
This study sought to find out the effect of socioeconomic factors of women on decision-
making in public participation. A regression analysis was performed to examine this
influence, the dependent variable was decision making and the independent variable was
socioeconomic factors. As shown in Table 4.4, the model summary shows that R Square =
.045, this shows that socioeconomic factors, predicted 4.5% of decision making of women
in public participation.
Table 4.4: Regression on Socioeconomic Factors and Decision-Making
Model R R Square Adjusted R Square
Std. Error of the
Estimate
1 .213a .045 .041 12.22749
a. Predictors: (Constant), Socioeconomic Factors
The ANOVA table illustrates how well the regression model predicts the dependent
variable. According to results shown in Table 4.5, socioeconomic factors, was significant
in predicting decision making in women, p<.001.
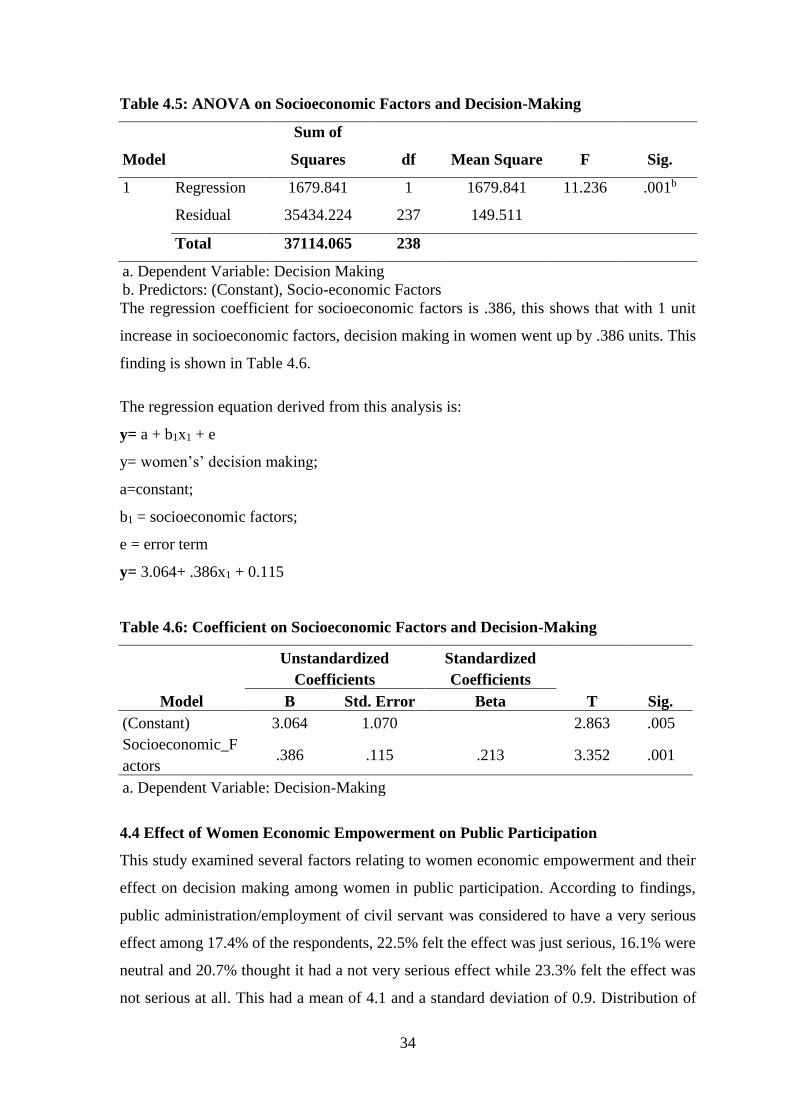
34
Table 4.5: ANOVA on Socioeconomic Factors and Decision-Making
Model
Sum of
Squares df Mean Square F Sig.
1 Regression 1679.841 1 1679.841 11.236 .001b
Residual 35434.224 237 149.511
Total 37114.065 238
a. Dependent Variable: Decision Making
b. Predictors: (Constant), Socio-economic Factors
The regression coefficient for socioeconomic factors is .386, this shows that with 1 unit
increase in socioeconomic factors, decision making in women went up by .386 units. This
finding is shown in Table 4.6.
The regression equation derived from this analysis is:
y= a + b1x1 + e
y= women’s’ decision making;
a=constant;
b1 = socioeconomic factors;
e = error term
y= 3.064+ .386x1 + 0.115
Table 4.6: Coefficient on Socioeconomic Factors and Decision-Making
Model
Unstandardized
Coefficients
Standardized
Coefficients
T Sig. B Std. Error Beta
(Constant) 3.064 1.070 2.863 .005
Socioeconomic_F
actors .386 .115 .213 3.352 .001
a. Dependent Variable: Decision-Making
4.4 Effect of Women Economic Empowerment on Public Participation
This study examined several factors relating to women economic empowerment and their
effect on decision making among women in public participation. According to findings,
public administration/employment of civil servant was considered to have a very serious
effect among 17.4% of the respondents, 22.5% felt the effect was just serious, 16.1% were
neutral and 20.7% thought it had a not very serious effect while 23.3% felt the effect was
not serious at all. This had a mean of 4.1 and a standard deviation of 0.9. Distribution of
35
transformative projects in wards was considered to have very serious effect among 13.3%
and 31.6% felt it had a serious effect while 23.6% were neutral, 18.8% felt it the effect was
not very serious while 13.3% also felt the effect was not serious at all. This had a mean of
3.9 and a standard deviation of 0.8.
Further, delays in national funding to county governments had a very serious effect on
women decision making in public participation according to 19% of the respondents, while
32.3% felt it had a serious effect, still 23.3% were neutral and 16.4% said the effect was
not very serious and 9% though the effect was not serious at all. This had a mean of 3.8 and
a standard deviation of 0.1. Introduction of new projects had very serious effect according
to 8.7% of the respondents and 22.1% thought it had serious effect while 36.4% were
neutral, however 17.7% felt the effect was not very serious and 15.2% felt the effect was
not serious at all. This had a mean of 3.7 and a standard deviation of 0.3.
Many departments with similar or identical mandates duplicated each fiscal year had a
serious effect on women decision making in public participation, as per 13.0% of the
respondents and 21.1% felt this effect was serious while 31% were neutral and still 18.5%
thought that this effect was not very serious and 16.4% felt the effect was not serious at all.
This had a mean of 3.8 and a standard deviation of 0.3. Lastly, PFM calendar deadlines had
a very serious effect on women decision making in public participation, this is according
to 11.3% and 20.3% considered this effect to be just serious while 24.2% and yet 28.6%
said that this effect was not very serious and 15.6% held that this effect was not serious at
all. This had a mean of 4.1 and a standard deviation of 0.3. These findings are shown in
Table 4.7.
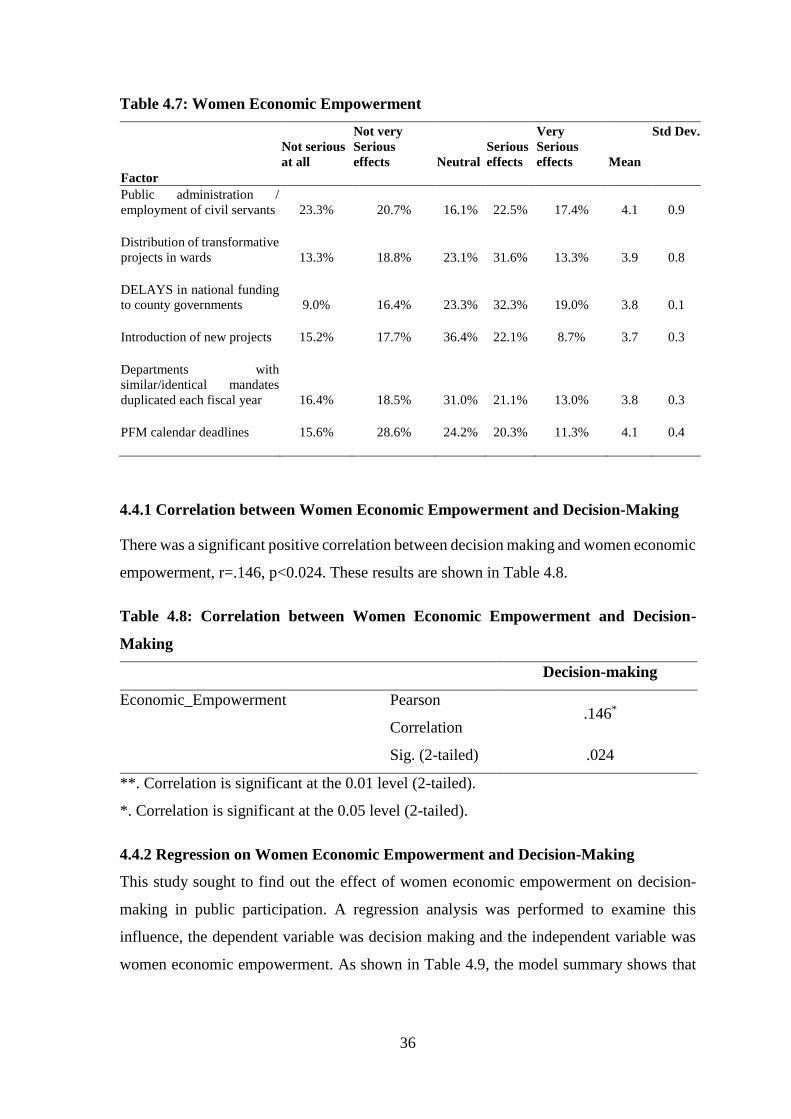
36
Table 4.7: Women Economic Empowerment
Factor
Not serious
at all
Not very
Serious
effects Neutral
Serious
effects
Very
Serious
effects Mean
Std Dev.
Public administration /
employment of civil servants 23.3% 20.7% 16.1% 22.5% 17.4% 4.1 0.9
Distribution of transformative
projects in wards 13.3% 18.8% 23.1% 31.6% 13.3% 3.9 0.8
DELAYS in national funding
to county governments 9.0% 16.4% 23.3% 32.3% 19.0% 3.8 0.1
Introduction of new projects 15.2% 17.7% 36.4% 22.1% 8.7% 3.7 0.3
Departments with
similar/identical mandates
duplicated each fiscal year 16.4% 18.5% 31.0% 21.1% 13.0% 3.8 0.3
PFM calendar deadlines 15.6% 28.6% 24.2% 20.3% 11.3% 4.1 0.4
4.4.1 Correlation between Women Economic Empowerment and Decision-Making
There was a significant positive correlation between decision making and women economic
empowerment, r=.146, p<0.024. These results are shown in Table 4.8.
Table 4.8: Correlation between Women Economic Empowerment and Decision-
Making
Decision-making
Economic_Empowerment Pearson
Correlation .146*
Sig. (2-tailed) .024
**. Correlation is significant at the 0.01 level (2-tailed).
*. Correlation is significant at the 0.05 level (2-tailed).
4.4.2 Regression on Women Economic Empowerment and Decision-Making
This study sought to find out the effect of women economic empowerment on decision-
making in public participation. A regression analysis was performed to examine this
influence, the dependent variable was decision making and the independent variable was
women economic empowerment. As shown in Table 4.9, the model summary shows that
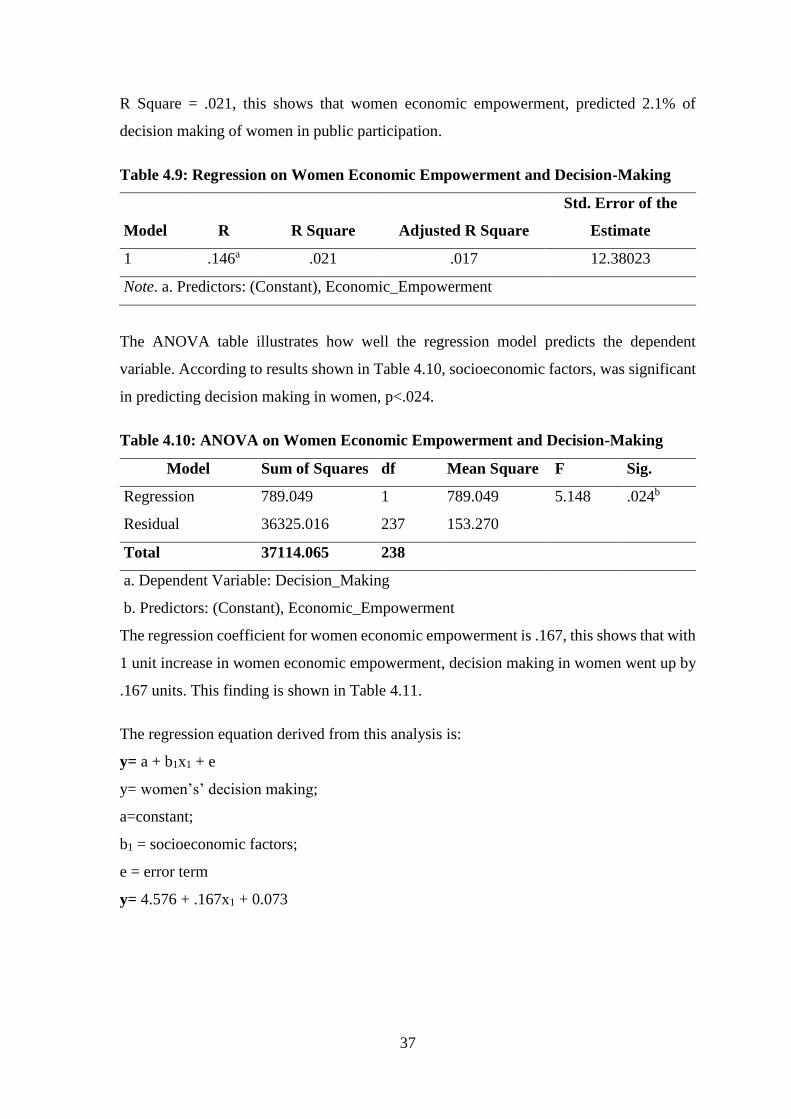
37
R Square = .021, this shows that women economic empowerment, predicted 2.1% of
decision making of women in public participation.
Table 4.9: Regression on Women Economic Empowerment and Decision-Making
Model R R Square Adjusted R Square
Std. Error of the
Estimate
1 .146a .021 .017 12.38023
Note. a. Predictors: (Constant), Economic_Empowerment
The ANOVA table illustrates how well the regression model predicts the dependent
variable. According to results shown in Table 4.10, socioeconomic factors, was significant
in predicting decision making in women, p<.024.
Table 4.10: ANOVA on Women Economic Empowerment and Decision-Making
Model Sum of Squares df Mean Square F Sig.
Regression 789.049 1 789.049 5.148 .024b
Residual 36325.016 237 153.270
Total 37114.065 238
a. Dependent Variable: Decision_Making
b. Predictors: (Constant), Economic_Empowerment
The regression coefficient for women economic empowerment is .167, this shows that with
1 unit increase in women economic empowerment, decision making in women went up by
.167 units. This finding is shown in Table 4.11.
The regression equation derived from this analysis is:
y= a + b1x1 + e
y= women’s’ decision making;
a=constant;
b1 = socioeconomic factors;
e = error term
y= 4.576 + .167x1 + 0.073
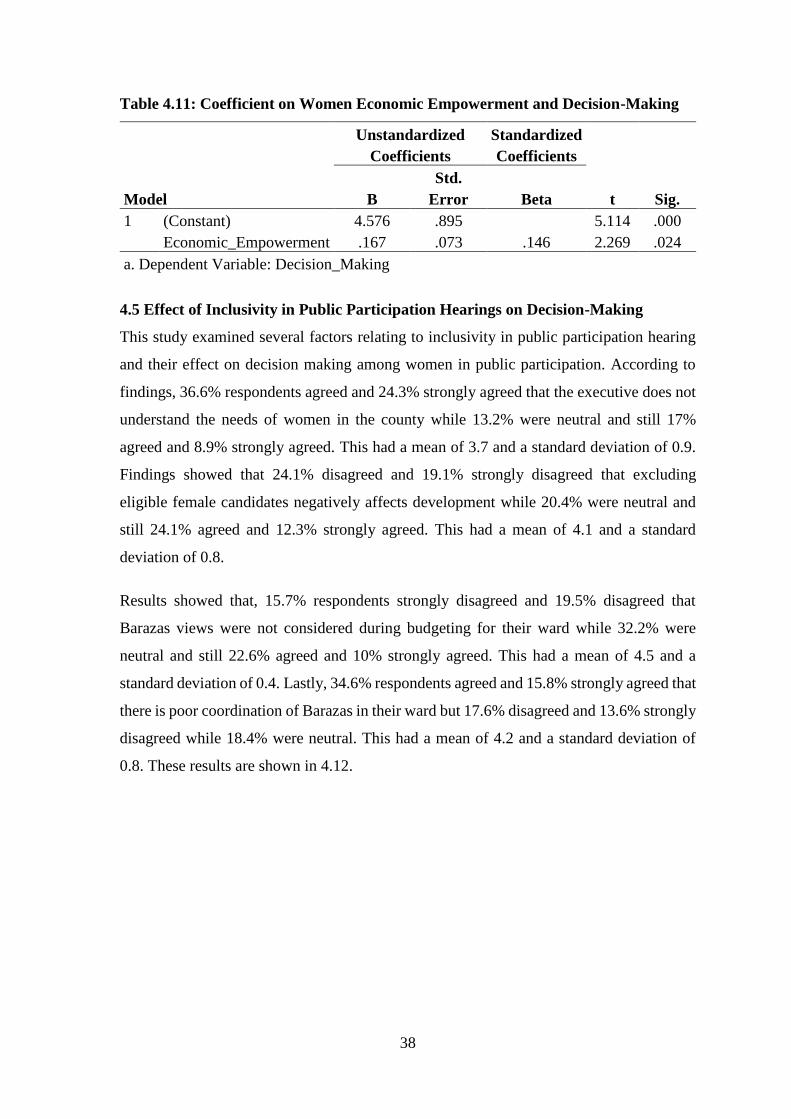
38
Table 4.11: Coefficient on Women Economic Empowerment and Decision-Making
Model
Unstandardized
Coefficients
Standardized
Coefficients
t Sig. B
Std.
Error Beta
1 (Constant) 4.576 .895 5.114 .000
Economic_Empowerment .167 .073 .146 2.269 .024
a. Dependent Variable: Decision_Making
4.5 Effect of Inclusivity in Public Participation Hearings on Decision-Making
This study examined several factors relating to inclusivity in public participation hearing
and their effect on decision making among women in public participation. According to
findings, 36.6% respondents agreed and 24.3% strongly agreed that the executive does not
understand the needs of women in the county while 13.2% were neutral and still 17%
agreed and 8.9% strongly agreed. This had a mean of 3.7 and a standard deviation of 0.9.
Findings showed that 24.1% disagreed and 19.1% strongly disagreed that excluding
eligible female candidates negatively affects development while 20.4% were neutral and
still 24.1% agreed and 12.3% strongly agreed. This had a mean of 4.1 and a standard
deviation of 0.8.
Results showed that, 15.7% respondents strongly disagreed and 19.5% disagreed that
Barazas views were not considered during budgeting for their ward while 32.2% were
neutral and still 22.6% agreed and 10% strongly agreed. This had a mean of 4.5 and a
standard deviation of 0.4. Lastly, 34.6% respondents agreed and 15.8% strongly agreed that
there is poor coordination of Barazas in their ward but 17.6% disagreed and 13.6% strongly
disagreed while 18.4% were neutral. This had a mean of 4.2 and a standard deviation of
0.8. These results are shown in 4.12.
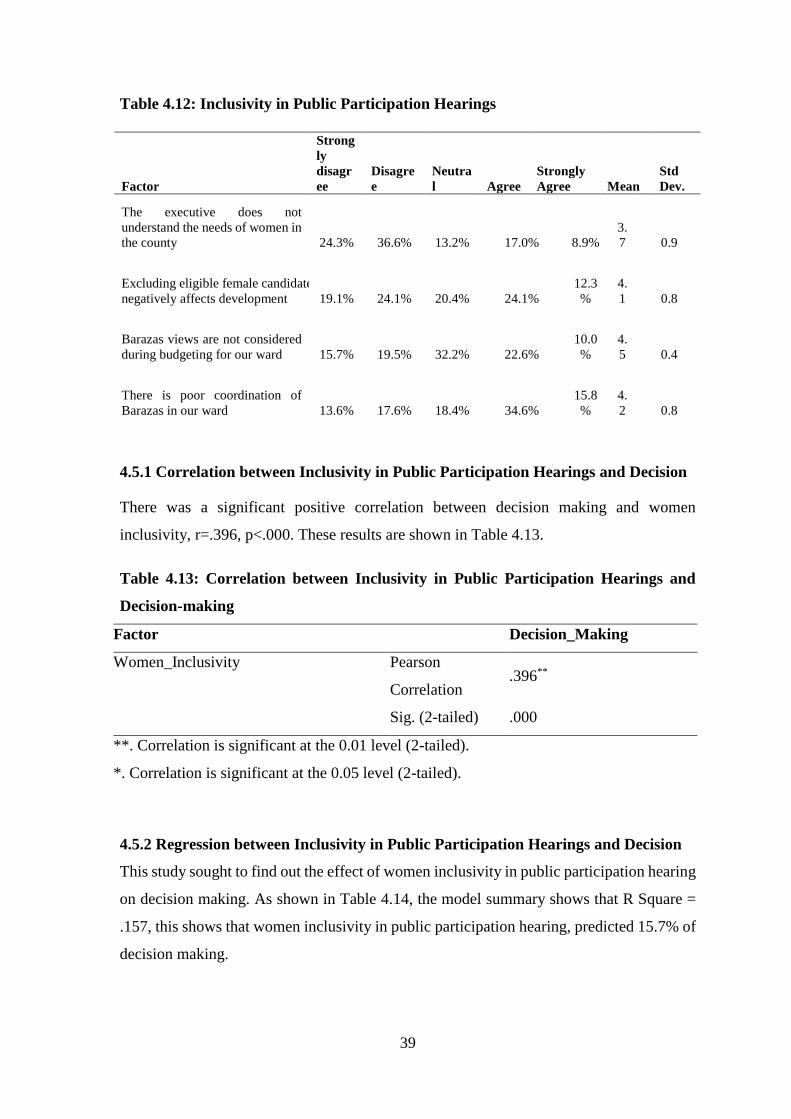
39
Table 4.12: Inclusivity in Public Participation Hearings
4.5.1 Correlation between Inclusivity in Public Participation Hearings and Decision
There was a significant positive correlation between decision making and women
inclusivity, r=.396, p<.000. These results are shown in Table 4.13.
Table 4.13: Correlation between Inclusivity in Public Participation Hearings and
Decision-making
Factor Decision_Making
Women_Inclusivity Pearson
Correlation .396**
Sig. (2-tailed) .000
**. Correlation is significant at the 0.01 level (2-tailed).
*. Correlation is significant at the 0.05 level (2-tailed).
4.5.2 Regression between Inclusivity in Public Participation Hearings and Decision
This study sought to find out the effect of women inclusivity in public participation hearing
on decision making. As shown in Table 4.14, the model summary shows that R Square =
.157, this shows that women inclusivity in public participation hearing, predicted 15.7% of
decision making.
Factor
Strong
ly
disagr
ee
Disagre
e
Neutra
l Agree
Strongly
Agree Mean
Std
Dev.
The executive does not
understand the needs of women in
the county 24.3% 36.6% 13.2% 17.0% 8.9%
3.
7 0.9
Excluding eligible female candidates
negatively affects development 19.1% 24.1% 20.4% 24.1%
12.3
%
4.
1 0.8
Barazas views are not considered
during budgeting for our ward 15.7% 19.5% 32.2% 22.6%
10.0
%
4.
5 0.4
There is poor coordination of
Barazas in our ward 13.6% 17.6% 18.4% 34.6%
15.8
%
4.
2 0.8
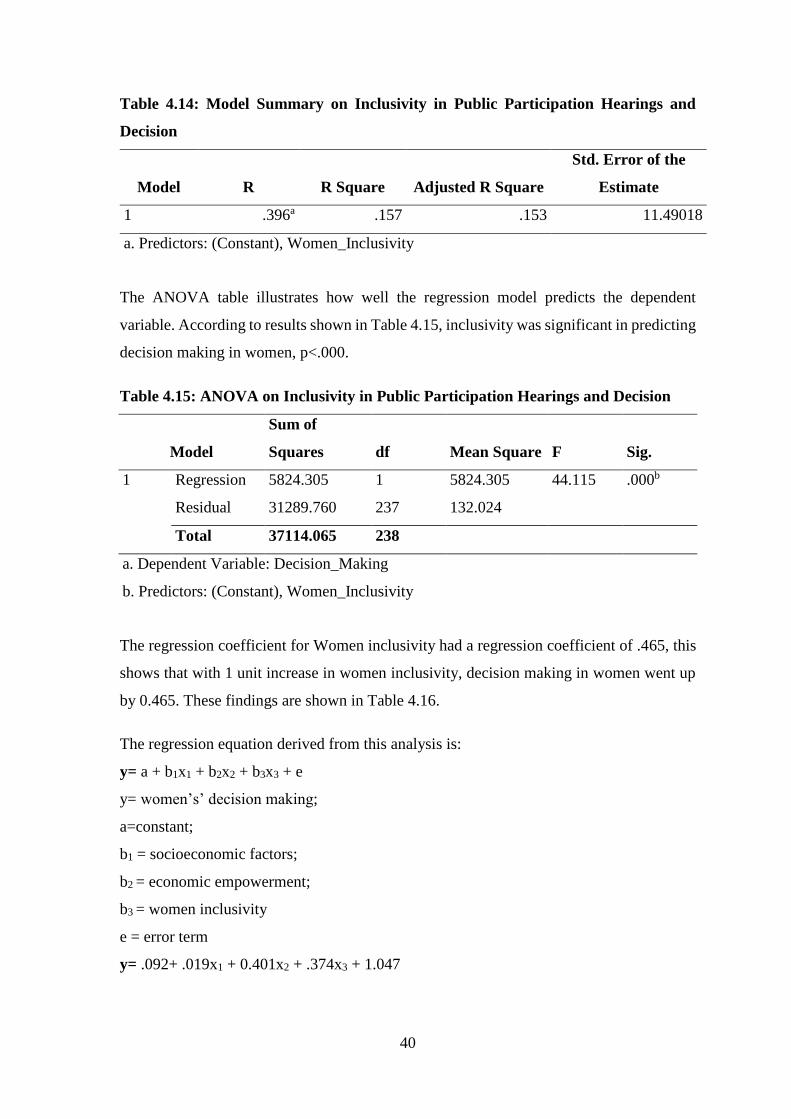
40
Table 4.14: Model Summary on Inclusivity in Public Participation Hearings and
Decision
Model R R Square Adjusted R Square
Std. Error of the
Estimate
1 .396a .157 .153 11.49018
a. Predictors: (Constant), Women_Inclusivity
The ANOVA table illustrates how well the regression model predicts the dependent
variable. According to results shown in Table 4.15, inclusivity was significant in predicting
decision making in women, p<.000.
Table 4.15: ANOVA on Inclusivity in Public Participation Hearings and Decision
Model
Sum of
Squares df Mean Square F Sig.
1 Regression 5824.305 1 5824.305 44.115 .000b
Residual 31289.760 237 132.024
Total 37114.065 238
a. Dependent Variable: Decision_Making
b. Predictors: (Constant), Women_Inclusivity
The regression coefficient for Women inclusivity had a regression coefficient of .465, this
shows that with 1 unit increase in women inclusivity, decision making in women went up
by 0.465. These findings are shown in Table 4.16.
The regression equation derived from this analysis is:
y= a + b1x1 + b2x2 + b3x3 + e
y= women’s’ decision making;
a=constant;
b1 = socioeconomic factors;
b2 = economic empowerment;
b3 = women inclusivity
e = error term
y= .092+ .019x1 + 0.401x2 + .374x3 + 1.047
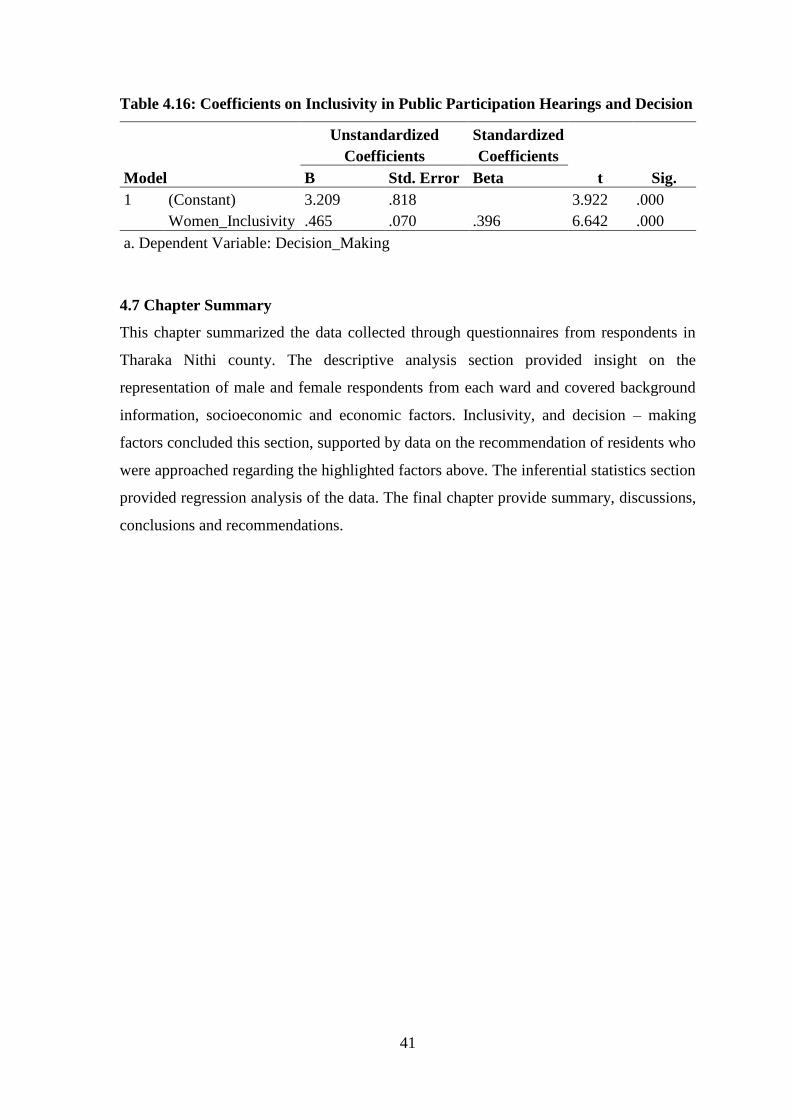
41
Table 4.16: Coefficients on Inclusivity in Public Participation Hearings and Decision
Model
Unstandardized
Coefficients
Standardized
Coefficients
t Sig. B Std. Error Beta
1 (Constant) 3.209 .818 3.922 .000
Women_Inclusivity .465 .070 .396 6.642 .000
a. Dependent Variable: Decision_Making
4.7 Chapter Summary
This chapter summarized the data collected through questionnaires from respondents in
Tharaka Nithi county. The descriptive analysis section provided insight on the
representation of male and female respondents from each ward and covered background
information, socioeconomic and economic factors. Inclusivity, and decision – making
factors concluded this section, supported by data on the recommendation of residents who
were approached regarding the highlighted factors above. The inferential statistics section
provided regression analysis of the data. The final chapter provide summary, discussions,
conclusions and recommendations.
42
CHAPTER FIVE
5.0 DISCUSSION, CONCLUSION AND RECOMMENDATION
5.1 Introduction
This chapter presents a discussion of the findings presented in chapter four. It further
provides conclusions and recommendations for each objective as informed by the research
findings on specific objectives. The chapter first presents a summary of the study in the
following section.
5.2 Summary
The purpose of the study was to examine the effect of women representation in public
participation on decision-making. The study was constructed on three research questions
which include, what is the effect of women socioeconomic factors on decision – making at
public hearings? what is the effect of women economic empowerment on decision – making
at public hearings? How does women inclusion influence decision – making at public
hearings? This study used a mixed method research design including, action research and
exploratory design. The study population included women and men from Tharaka Nithi
County. This study used purposive sampling and random sampling technique to obtain
participants for the study. A total of 400 respondents were selected to participate in the
study. Questionnaire were used to collect data that was analyzed through descriptive and
inferential statistics.
The findings on the first research question showed that most of the respondents, 56.6% felt
that health and community awareness projects was a good contributor to women decision
making while 29.5% felt otherwise and only 13.9% were neutral. Again, most of the
respondents, 65.1% said that education projects were a good contributor to women decision
making but 16.4% were of the contrary opinion while 18.5% were neutral. Further, majority
of the respondents 41.6% thought that entrepreneurship opportunities, was a good
contributor to women decision making and 26.8% were negative while 34.2% remained
neutral. Additionally, 47% of the respondents held that women and youth employment
creation was a good contributor to women decision making, still 27.4% were opposed to
this notion and 25.6% were neutral. Results also showed that most of the respondents,
48.7% felt that ATI/veterinary, lab/milk processor plant construction and farm input
provision was a poor contributor to women decision making but 34.2% were of the contrary
opinion while 17.1% were neutral. According to 54.4% of the respondents, water project
43
was a good contributor to women decision making however 31.9% of the respondents felt
otherwise while 13.7% were neutral. In addition, 47.2% of the respondents felt that housing
was a good contributor to women decision making, however 31.3% were negative
while21.5% were neutral. Results also showed that majority of the respondents, 60.4% felt
that electrification and ICT connectivity was a good contributor to women decision making
but 22.2% were negative and 17.4% were neutral. Again, most of the respondents, 54.8%
thought that roads, footbridges and bridges were a good contributor of women decision
making even though 29.5% were negative and 15.7% were neutral. Most of the
respondents, 43.1% felt that respondent’s construction / completion of markets and trade
parks was a good contributor but 33.1% opposed this while 23.8% were neutral. According
to the correlation analysis, there was a significant positive correlation between decision
making in women in public participation and socioeconomic factors, r=0.213, p<.001. The
regression analysis showed that socioeconomic factors, predicted 4.5% of decision making
of women in public participation.
Findings on the second research question showed that most of the respondents, 44% felt
that public administration/employment of civil servant had a serious effect on women
decision making, still 39.9% felt it had no serious effect while 16.1% were neutral.
According to findings, 44.9% of the respondents thought distribution of transformative
projects in wards had a serious effect on women decision making while 32.1% felt
otherwise and 23.6% were neutral. Findings showed that majority of the respondents,
53.3% thought that delays in national funding to county governments had a serious effect
on women decision making in public participation, still 25.4% differed while 23.3% were
neutral. Again, results showed that 30.8% of the respondents felt introduction of new
projects had a serious effect on women decision making in public participation while 32.9%
were negative while 36.4% were neutral. In addition, results showed that 34.2% of the
respondents thought that identical mandates duplicated each fiscal year had a serious effect
on women decision making in public participation while 34.9% felt this effect was not
serious while 31% were neutral. Further, 44.2% of the respondents felt that PFM calendar
deadlines had a no serious effect on women decision making in public participation while
31.6% felt this had a serious effect while 24.2% were neutral. According to the correlation
analysis, there was a significant positive correlation between decision making and women
economic empowerment, r=.146, p<0.024. The regression analysis showed that women
44
economic empowerment, predicted 2.1% of decision making of women in public
participation.
Findings on the third research question showed that most of the respondents, 60.9%
disagreed that the executive does not understand the needs of women in the county, still
25.9% agreed and 13.2% were neutral. Results showed that 43.2% of the respondents
disagreed that excluding eligible female candidates negatively affects development but
36.4% disagreed while 20.4% were neutral. It was again showed that, 35.2% of the
respondents disagreed that Barazas views were not considered during budgeting for their
ward but 32.6% agreed to this while 32.2% were neutral. In addition, majority of the
respondents, 50.4% agreed that there is poor coordination of Barazas in their ward but
31.2% disagreed while18.4% were neutral. According to the correlation analysis there was
a significant positive correlation between decision making and women inclusivity, r=.396,
p<.000. Regression analysis showed that women inclusivity in public participation hearing,
predicted 15.7% of decision making.
5.3 Discussion
5.3.1 Effect of Socioeconomic Factors on Women Participation in Decision-Making in
Public.
Findings on the first research question showed that most of the respondents, 56.6% felt that
health and community awareness projects was a good contributor to women participation
in decision making. This is in line with the argument presented by WHO (2013) that healthy
women are in a better position to participate in society take joint action to promote their
own interests. Again, most of the respondents, 65.1% said that education projects were a
good contributor to women participation decision making. This in line with Bishaw (2014)
who established that as the level of education of women in rural areas increases, their
participation in political and economic events. Further, majority of the respondents 41.6%
thought that entrepreneurship opportunities, was a good contributor to women participation
in decision making. The findings are in agreement with Morshed and Haque (2015)
observation that women entrepreneurs have a more participation in politics and social
activities.
Additionally, 47% of the respondents held that women and youth employment creation was
a good contributor to women participation in decision making. Similarly, Raju (2015)
45
found out that women employment has a appositive influence on active participation in the
decision making process among women. This was an observation made by Pambè,
Gnoumou and Kaboré (2014) who noted that women that are paid for work are more likely
to participate in decision making as opposed to women who do not receive work pay.
Results also showed that most of the respondents, 48.7% felt that ATI/veterinary, lab/milk
processor plant construction and farm input provision was a poor contributor to women
participation in decision making. This contradict the findings of Diiro et al (2018) which
showed that rural development initiatives in Kenya that seek to improve agricultural
productivity and enhance food security and minimize poverty can attain greater effect
through incorporating women empowerment, which entails participation in decision
making. According to findings, majority of the respondents, 54.4% thought water project
was a good contributor to women’s decision-making, however. In line with the findings
here, Joshi and Fawcett (2001) argued that women have been represented in community
decision-making forums and grown more aware of health and hygiene aspects of water
management and participated in income generation activities as a result of investment of
time and resources on water projects.
In addition, majority of the respondents, 47.2% felt that housing was a good contributor to
women decision making. Results also showed that majority of the respondents, 60.4% felt
that electrification and ICT connectivity was a good contributor to women participation in
decision making. This observation corresponds to Nikulin (2017) findings that there is a
positive effect from ICT usage women workforce participation in developing countries. A
number of infrastructures were identified as a good contributor women participation in
decision making, 54.8% identified roads, footbridges and bridges while 43.1% identified
markets and trade parks as good contributors of women decision making. Mbogori (2014)
on the other hand identified a number of infrastructures that have an effect on women
participation, these include, mode of transport and road networks. Most of the respondents,
43.1% felt that construction / completion of markets and trade parks was a good contributor
to women participation in decision making. Moreover, findings showed that socioeconomic
factors had a significant relationship with women participation in decision making
(r=0.213, p<.001). The results demonstrated that socioeconomic factors, predicted 4.5% of
women participation in public decision making. This observation here is consistent with
Pambè, Gnoumou and Kaboré (2014) study results that found out a significant relationship
between socioeconomic and women decision making.
46
People often complain about the high amount of expenses related to improving their
educational levels and the amount of time consumed attending universities, secondary and
even primary schools. However, this is the singular simple approach to improving how
society operates. It aids in improving the decision-making capabilities of students,
including women. According to Banks and Banks, (2019), a divided society is a high risk
society with higher likelihood of inequality. The meritocracy rewards hard work and
initiatives of both male and female students succeed, based on more than their talents.
However, aspects beyond the control of women such as the quality of schools and education
influence their ability to contribute consistently for their households.
Higher investment directed to women to offer a larger number of options to study improves
the differences in social inequality. Time, money, and knowledge must be passed on to
ensure women spend more time learning better literacy skills and as professionals,
accordingly. Children whose parents attend tertiary institutions are more likely to devote
time to their own pursuit of higher education. Elements that increase the likelihood of
women in middle income and low-income levels is therefore considered a viable approach
to improving decision making in the long term in Tharaka Nithi county. Tracking women
and ensuring that they attend specific, economy-boosting courses is impacted positively by
the attitudes of students, who are at higher risk of spending less time in engaging in decision
making at government level.
Women are more likely to escalate issues to government officials if they attend more time
training on how to improve their capabilities. County Governments therefore require
national government funding for programs that focus on women in marginal rural areas to
attend learning institutions to mitigate the decision-making gap currently witnessed in the
counties such as Tharaka Nithi. Ultimately, societal biases are also reduced by ensuring
that patterns such as higher drop-out rates among vulnerable women are reduced and more
opportunities awarded to them. The average Kenyan citizen is more likely to spend time in
school with the hope that their effort will pay-off. However, with the high rate of
unemployment and dwindling economy, more must be done to ensure that societal skills
such as participating in governance are enhanced. Polices formulated in the future must
bear this consideration in order to enhance the future of the entire nation.
47
5.3.2 Effect of Women Economic Empowerment on Public Participation
Findings showed that most of the respondents, 44% felt that public
administration/employment of civil servant had a serious effect on women participation in
decision making. Consistent with findings here, Nasser (2018) argues that balanced total
employment between men and women is critical, still it is crucial to have women spread
across the various sectors of administrative governance and also fairly represented in every
levels of decision-making. According to findings, majority of the respondents, 44.9%
thought that distribution of transformative projects in wards had a serious effect on women
participation decision making. In line with this, Kongolo (2009) argues that women in rural
settlements will be able to participate in development like their counterpart in urban
settlements, if these women are introduced and guided in development.
Findings showed that majority of the respondents, 53.3% thought that delays in national
funding to county governments had a serious effect on women decision making in public
participation. In the same line Sow (2012) observed that decentralization bodies lack
financial resources to effectively implement gender equality policies in the back of under-
representation of women in key position of policy and program implementation. Again,
results showed that majority of the respondents, 36.4% were neutral on whether
introduction of new projects had a serious effect on women decision making in public
participation. These findings are in line with the observation made by Casey, Glennerster
and Miguel (2011) who could not establish a sustained effect of community development
projects on among other things decision making processes and participation of women in
local matters.
Further, majority of the respondents, 44.2% felt that PFM (public finance management)
calendar deadlines had a no serious effect on women decision making in public
participation. This seems to contradict the sentiment of Welham, Barnes-Robinson,
Mansour-Ille and Okhandiar (2018) who indicated that public finance management
processes influenced reducing gender inequalities. However, Welham, Barnes-Robinson,
Mansour-Ille and Okhandiar (2018) asserted that this is can be attained through making the
process of public finance management to be more aware of gender. According to Birchall
and Fontana (2015) gender insensitive budget could miss out on prospects of using public
finance to enhance the position women in the community. This could lead to the risk of
unconsciously reproducing and reinforcing systematic inequalities among women and men.
48
According to the correlation analysis, there was a significant positive correlation between
women economic empowerment and decision making of women in public participation,
r=.146, p<0.024. The regression analysis showed that women economic empowerment,
predicted 2.1% of decision making of women in public participation. Sow (2012) registered
mixed findings in a study to examine women political participation and economic
empowerment. Though he found evidence showing that poverty and economic insecurity
prevented women from political participation, the results in Uganda was contradicting what
was a common observation. In Uganda Sow (2012) noted that the progress made by women
in the economic domain did not provide them a more prominent position in political
decision making.
There are close ties between economic development and the level of education that
individuals attain. Widespread availability of the empowerment of all citizens and
particularly women is pegged on high quality public training in various aspects of economic
empowerment. A fairer distribution is pegged on individuals in public institutions attaining
training previously accessible to those in private institutions and psychological and political
empowerment thrives in an environment where women attain technical and other
certifications that enable them to attend public universities, access borrowing facilities in
banks and other financial institutions.
Finally, to combat gender discrimination, society must push women to benefit from the
manifest functions beyond their counties of origin and explore other locations in the country
that will enable them to learn about more opportunities for them to succeed. Furthermore,
national governments should encourage social integration which drives acknowledgement
and appreciation of cultures beyond those living within a region or country. Modernization
through technical and social training occurs once women are granted the opportunity to
explore, transforming their lives. According to Calhoun (2019), large scale social
integration contributes to stronger social foundations in communities. Kenya, with its
diverse cultures, stands to benefit from the economic empowerment of women through
encouraging their access to different parts of the world to improve their understanding and
mold the future workforce. According to Vos (2019), Credentialing individuals who attend
foreign institutions can also help the government identify proper remuneration for all and
contribute to social cohesion and prevent alienation.
49
5.3.3 Effect of Inclusivity in Public Participation Hearings on Women Decision-
Making in Public Participation
Most of the respondents, 60.9% disagreed that the executive does not understand the needs
of women in the county. According to the Beijing Declaration (1995) equality in decision-
making is fundamental to the development of women’s rights and that women’s equal
participation in decision-making is more than just a question of simple justice or
democracy, but also a need for women’s interests to be considered. Results showed that
43.2% of the respondents disagreed that excluding eligible female candidates negatively
affects development. According to other researcher findings by Hejase et al (2013) despite
the great intake of women in the workplace and enhancing number of women occupying
mid-level managerial positions, executive position at the top were elusive to women.
It was again showed that majority of the respondents, 35.2% disagreed that Barazas views
were not considered during budgeting for their ward but 32.6% agreed to this while 32.2%
were neutral. Contrary to findings here a Wacera (2016) in a study of the influence of
citizen participation in Nyandarua County found out that residents indicated that their views
were barely ever considered in the County. In addition, majority of the respondents, 50.4%
agreed that there is poor coordination of Barazas in their ward. This was the same scenario
observed by Wacera (2016) in Nyandarua County, residents of Nyandarua County were
dissatisfied with the way the public participation through such group as County Barazas
were carried out.
According to the correlation analysis there was a significant positive correlation between
women participation in decision making and women inclusivity, r=.396, p<.000.
Regression analysis showed that women inclusivity in public participation hearing,
predicted 15.7% of decision making. This result is in line with the argument of O’Neil and
Domingo (2015) who argued that critical drivers of women’s political influence include
among other more and inclusive politics. According to O’Neil and Domingo (2015) across
the globe women have become more influential over the decision that impact their lives
which is a result of the more equitable policies advocated by feminists and gender
advocates.
Class matters in the lives of Kenyans and at the very beginning of life, each individual
experiences class socialization, which impacts the lives of women experience political
contexts and pass on knowledge on aspects such as obedience and better social cleavage,
50
to their children, according to Grasso, Farrall, Gray, Hay and Jennings (2019) who study
the trickle-down effect of political socialization. For individuals who learn this lesson early,
the chances that they select locations with better funding opportunities for education,
health, entrepreneurship, and public amenities is higher. Inclusivity implies that women
can attend institutions and places of work with advanced technology, which influences
employment and education of future generations.
The movement to enforce inclusion counters the establishment of gaps in healthcare,
income, money education, and occupational disparities. Different groups of people share
various advantages and disadvantages in their counties of origin. The socioeconomic status
of someone with better access to these amenities is obviously better than that of an
individual who has not enjoyed social mobility, as shown by the results of this study. Social
influence theories assert that the stereotyping associated with the roles of women in the
society can lead to discrimination of those who step away from conventional roles while
prejudiced views propagate the attitude of the masses, discrimination affects behavior of
people in society. Inclusivity impacts the association placed with individuals, led by the
implicit attitudes that communities bear.
Why is inclusivity important? According to Weller (2017), inclusivity ensures that society
remains cohesive, especially through religion and governance. County governments and
national governments overall influence the narrative followed by the population and can
change the generalizations made regarding development. For example, they can influence
the just world phenomenon stating that people get what they deserve. If governments in
multicultural settings focus on changing the behavior and attitudes of the society, positive
changes are more likely to occur. Visibly less conflict, increased cooperation, and better
management of public resources are witnessed in inclusive societies. Equity is one of the
major considerations that women seek when searching for job opportunities in the public
sector. Furthermore, Edge and Harvey (2017) state that inclusivity is an aspect of social
justice that protects women from individualistic behavior. In many developing nations, law
and religion go hand in hand, molding society. County governments can utilize these two
aspects of contemporary society to address issues arising specific to the needs of women.
Encouraging women to participate in unconventional roles plays a significant role in global
efforts to make governance participatory.

51
5.4 Conclusion
5.4.1 Effect of Socioeconomic Factors on Women Decision Making in Public
Participation
This study concludes that socioeconomic factors, influence women participation in public
decision making. The socioeconomic factors that affect women decision making, health
and education community awareness projects, entrepreneurship opportunities, women
employment, water project, housing, electrification and ICT connectivity. Infrastructure
including roads, footbridges and bridges as well as markets and trade parks also contribute
to women participation in decision making in the public sphere.
5.4.2 Effect of Women Economic Empowerment on Women Decision Making in
Public Participation
This study concludes that women economic empowerment significantly contributes to
women decision making in public participation. Women public participation in decision
making is contributed by such economic factors as, employment of women in the public
services and distribution of transformative projects in wards. The delays caused by the
county government funding from the national government negatively affects women
decision making in public participation.
5.4.3 Effect of Inclusivity in Public Participation Hearings on Women Decision-
Making in Public Participation
This study concludes that women inclusivity significantly affected thier decision making
in public participation. Inclusivity provides women with an opportunity to be invloded
public matters that affect them such as, politics, recruitment to the public services and
economic opportunities that will empoer them.
5.5 Recommendation
5.5.1 Recommendation for Improvement
5.5.1.1 Effect of Socioeconomic Factors on Women Decision Making in Public
Participation
This study proposes that the socioeconomic factors that affect women such as housing,
education, health and employment be given priority in local government. This will enable
52
women to come out into the public and be involved in public issues some of which affect
them directly. Women are encouraged to come out strong and help in the improvement of
socioeconomic status with an aim of empowering their own in taking up position public
participation.
5.5.1.2 Effect of Women Economic Empowerment on Women Decision Making in
Public Participation
This study recommends that the new county government should uplift the economic
conditions of women at the grassroot. They should support women in their economic
ventures that would empower them and drive them into public participation. Women should
venture out in business opportunities and seek public office that would make them stronger
to engage in public matters.
5.5.1.3 Effect of Inclusivity in Public Participation Hearings on Women Decision-
Making in Public Participation
This study proposes for stronger policies in the government to include more women in
public activities. Women should be supported with policies that guarantees thier
participation in the public. This should be especially on matter that affect them directly.
There should reseved posts in the public sector for women while the private sectro should
also be compelled to ensure a gender balance in thier workforce.
5.5.2 Recommendation for Further Studies
This study was carried out to examine factros that affect women decision making in public
participation. The study proposes further research to be carried out on factros that
encourage women decision making in public participation. this study was carried out in
Tharaka Nithi County, a similar study can carried out in otehr counties to relate with the
findings here.
53
REFERENCE
Adler, R. P., & Goggin, J. (2005). What do we mean by “civic engagement”? Journal of
transformative education, 3(3), 236-253.
Alesina, A., Brioschi, B., & Ferrara, E. L. (2016). Violence against women: A cross-
cultural analysis for Africa (No. w21901). National Bureau of Economic Research.
Anderson, D., Shoesmith, E., Sweeney, D., Anderson, D., & Williams, T. A. (2014).
Statistics for Business and Economics 3e. Cengage Textbooks.
Arnstein, S. R. (2015). A ladder of citizen participation. The City Reader, 279.
Arora, S. K., Shah, D., Chaturvedi, S., & Gupta, P. (2015). Defining and measuring
vulnerability in young people. Indian journal of community medicine: official
publication of Indian Association of Preventive & Social Medicine, 40(3), 193.
Arriola, L. R., & Johnson, M. C. (2014). Ethnic Politics and Women's Empowerment in
Africa: Ministerial Appointments to Executive Cabinets. American Journal of
Political Science, 58(2), 495-510.
Atteraya, M. S., Kimm, H., & Song, I. H. (2014). Women's autonomy in negotiating safer
sex to prevent HIV: findings from the 2011 Nepal demographic and health survey.
AIDS Education and Prevention, 26(1), 1-12.
Banerjee, A., Duflo, E., Goldberg, N., Karlan, D., Osei, R., Parienté, W., ... & Udry, C.
(2015). A multifaceted program causes lasting progress for the very poor: Evidence
from six countries. Science, 348(6236), 1260799.
Banks, J. A., & Banks, C. A. M. (2019). Multicultural education: Issues and perspectives.
John Wiley & Sons.
Bell, E., Bryman, A., & Harley, B. (2018). Business research methods. Oxford university
press.
Bhat, A. (2019). Exploratory research: definition, methods, types and examples.
QuestionPro. Article retrieved online from
https://www.questionpro.com/blog/exploratory-research/
54
Biegon, J. (2016). Gender equality and political processes in Kenya: challenges and
prospects.
Bishaw, A. (2014). The Impact of Education on Rural Women's Participation in Political
and Economic Activities. International Journal of Educational Administration and
Policy Studies, 6(2), 23-31.
Calhoun, C. (2019). Indirect relationships and imagined communities: large-scale social
integration and the transformation of everyday life. In Social theory for a changing
society (pp. 95-130). Routledge.
Casey, K., Glennerster, R., & Miguel, E. (2011). Reshaping institutions: Evidence on
external aid and local collective action. National Bureau of Economic Research.
CEDAW. (2007, December 31). Convention on the Elimination of All Forms of
Discrimination against Women. Retrieved from
https://www.un.org/womenwatch/daw/cedaw/
Cook, A., & Glass, C. (2014). Women and top leadership positions: Towards an
institutional analysis. Gender, Work & Organization, 21(1), 91-103.
Credit Suisse (2018). The Global Wealth Report 2018. Article retrieved online from
https://www.credit-suisse.com/about-us/en/reports-research/global-wealth-
report.html
De Vos, G. (2019). Social cohesion and alienation: Minorities in the United States and
Japan. Routledge.
Declaration, B. (1995). Beijing Declaration and Platform for Action Fourth World
Conference on Women. Paragraph, 112.
Denhardt, J. V., & Denhardt, R. B. (2015). The new public service revisited. Public
Administration Review, 75(5), 664-672.
Diiro, G. M., Seymour, G., Kassie, M., Muricho, G., & Muriithi, B. W. (2018). Women’s
empowerment in agriculture and agricultural productivity: Evidence from rural
maize farmer households in western Kenya. PloS one, 13(5), e0197995.
55
Edge, P. W., & Harvey, G. (2017). Law and Religion in Contemporary Society:
communities, individualism and the state. Routledge.
Elias, A., Gill, R., & Scharff, C. (2017). Aesthetic labour: Beauty politics in neoliberalism.
In Aesthetic labour (pp. 3-49). Palgrave Macmillan, London.
European Urban Knowledge Network (2018). What is Public Participation? Article
retrieved online from https://www.eukn.eu/policy-labs/policy-lab-for-cy-public-
participation-in-the-development-process/general-introduction/what-is-public-
participation/ on 6th June 2019.
Fung, A. (2015). Putting the public back into governance: The challenges of citizen
participation and its future. Public Administration Review, 75(4), 513-522.
Grasso, M. T., Farrall, S., Gray, E., Hay, C., & Jennings, W. (2019). Thatcher’s children,
Blair’s babies, political socialization and trickle-down value change: An age, period
and cohort analysis. British Journal of Political Science, 49(1), 17-36.
Greene, P. G., & Brush, C. G. (Eds.). (2018). A research agenda for women and
entrepreneurship: Identity through aspirations, behaviors and confidence. Edward
Elgar Publishing.
Grissom, A. (2019). Inclusive leadership. Catalyst. Article retrieved online from
https://www.catalyst.org/research/inclusive-leadership-the-view-from-six-
countries/10/ on Friday 29th March 2019.
Hajli, N. (2018). Ethical environment in the online communities by information credibility:
a social media perspective. Journal of Business Ethics, 149(4), 799-810.
Hakim, C. (2016). Key issues in women's work: Female diversity and the polarization of
women's employment. Routledge-Cavendish.
Hassan, L. (2017). Governments should play games: Towards a framework for the
gamification of civic engagement platforms. Simulation & Gaming, 48(2), 249-267.
Hejase, H., Haddad, Z., Hamdar, B., Massoud, R. & Farha G. (2013). Female Leadership:
An Exploratory Research from Lebanon. American Journal of Scientific Research,
86, 28-52.

56
Hine, H. (2018). The Borgen Project: Girls’ Education in Kenya. Article retrieved online
on Tuesday 9th July 2019 at 1.44 pm from https://borgenproject.org/girls-education-
in-kenya/
Hivos (2016). Hivos Annual Report: 2016. Retrieved online from https://east-
africa.hivos.org/who-we-are/our-organization/annual-report/ at 6.05 pm
Holzer, M., Hu, L. T., & Song, S. H. (2004). Digital government and citizen participation
in the United States. In Digital government: Principles and best practices (pp. 306-
319). Igi Global.
iKnowPolitics (2019). Women’s Leadership Article Retrieved online from
http://iknowpolitics.org/en/knowledge-library/opinion-pieces/patriarchal-barrier-
women-politics on Sunday 17th March 2019
Joshi, D., & Fawcett, B. (2001). Water projects and women's empowerment. Paper
presented at the 27th WEDC Conference, People and Systems for Water, Sanitation
and Health, Lusaka, August 2001.
Kamau, N. (2010). Women and Political Leadership in Kenya: Ten Case Studies-
Publications-Heinrich Böll Foundation. Nairobi, Kenya: Heinrich Böll Foundation.
Kim, D., & Starks, L. T. (2016). Gender diversity on corporate boards: Do women
contribute unique skills? =American Economic Review, 106(5), 267-71.
Kivoi, D. (2014). Factors impeding political participation and representation of women in
Kenya. Humanities and Social Sciences, 2(6), 173-181.
Kongolo, M. (2009). Factors Limiting Women’s Involvement in Development: Lesson
from Ithuseng, South Africa. African Research Review, 3(4).
Kumar, R. (2019). Research methodology: A step-by-step guide for beginners. Sage
Publications Limited.
Lecoutere, E. (2017). The impact of agricultural co-operatives on women’s empowerment:
Evidence from Uganda. Journal of Co-operative Organization and Management,
5(1), 14-27.
57
Leppink, J. (2019). Models for Treatment Order Effects. In Statistical Methods for
Experimental Research in Education and Psychology (pp. 243-254). Springer,
Cham.
Levac, L., & Cowper-Smith, Y. (2016). Women and public sector precarity: Causes,
conditions, and consequences.
Lister, R., & Campling, J. (2017). Citizenship: feminist perspectives. Macmillan
International Higher Education.
Maracle, S. (2018). The eagle has landed: Native women, leadership, and community
development. Gender and Women's Studies: Critical Terrain, 373.
Markowska, M. (2016). Mumpreneurship: Does Motherhood Influence Women’s
Entrepreneurial Self-Efficacy?2. In Academy of Management Proceedings (Vol.
2016, No. 1, p. 13811). Briarcliff Manor, NY 10510: Academy of Management.
Mattison, S. M., Smith, E. A., Shenk, M. K., & Cochrane, E. E. (2016). The evolution of
inequality. Evolutionary Anthropology: Issues, News, and Reviews, 25(4), 184-199.
Mbogori, A. K. (2014). Factors Influencing the Level of Women Participation in
Community Development Projects in Narok South Sub County, Narok County,
Kenya. (Masters’ Thesis, University of Nairobi, Nairobi Kenya)
McCusker, K., & Gunaydin, S. (2015). Research using qualitative, quantitative or mixed
methods and choice based on the research. Perfusion, 30(7), 537-542.
Ministry of Devolution and ASALs. (2018) General County Information: Background to
Counties. Webpage accessed on 24th June 2019 at 10.50 am at
http://www.devolutionasals.go.ke/county-information-2/#
Morshed, F., & Haque, M. E. (2015). Impact of Women Entrepreneurship on Women
Empowerment in Bangladesh. World, 1(1), 1-14.
Mudi, B. I., & Waswa, J. (2018). Analysis of political representation effects on subjective
well-being of women employees in the county government of Kakamega.
International Journal of Academic Research and Development, 3(6), 33-37.
58
Nasser, S. (2018). Boxed Women in Public Administration-Between Glass Ceilings and
Glass Walls: A Study of Women's Participation in Public Administration in the
Arab States. Journal of International Women's Studies, 19(3), 152-171.
Nikulin, D. (2017). The impact of ICTs on women’s economic empowerment. In
Catalyzing development through ICT adoption (pp. 15-24). Springer, Cham.
Njogu, D. M. (2018). The Influence of Corporate Business Strategy on Competitive
Advantage: A Case of Safaricom Limited.
Njuki, M. (2017). Muthomi Njuki: My governor manifesto) 17-23
Nzomo, M. (1997). Kenyan women in politics and public decision making. African
feminism: The politics of survival in sub-Saharan Africa, 232-254.
O’Neil, T., & Domingo, P. (2015). The power to decide: Women, decision-making and
gender equality. London: ODI.
Okello, N., Beevers, L., Douven, W., & Leentvaar, J. (2009). The doing and un-doing of
public participation during environmental impact assessments in Kenya. Impact
Assessment and Project Appraisal, 27(3), 217-226.
Otieno, W. A. (2013). Challenges and prospects of women’s political participation in
governance in Africa: A case study of Kenya (Doctoral dissertation, Master’s thesis,
University of Nairobi, Nairobi, Kenya). Retrieved from erepository. uonbi. ac.
ke/.../Otieno_Challenges% 20and% 20Prospects% 20of% 20Wome).
Owuor, E. (2016). Women and political inclusion in Kenya: A historical overview, 1963–
2016. Gender Equality and Political Processes in Kenya. Nairobi: Strathmore
University Press, International Commission of Jurists, and National Gender and
Equality Commission, 7-38.
Oxfam International (2019) Africa’s three richest men have more wealth than the poorest
650 million people across the continent. Published 3 September 2019. Article
retrieved online from https://www.oxfam.org/en/pressroom/pressreleases/2019-09-
02/africas-three-richest-men-have-more-wealth-poorest-650-million

59
Pambè, M. W., Gnoumou, B., & Kaboré, I. (2014). Relationship between women’s
socioeconomic status and empowerment in Burkina Faso: A focus on participation
in decision-making and experience of domestic violence. African Population
Studies, 28, 1146-1156.
Parpart, J. L., Connelly, P., Connelly, M. P., & Barriteau, E. (Eds.). (2000). Theoretical
perspectives on gender and development. IDRC.
Percy, S. L. (2018). Disability, civil rights, and public policy: The politics of
implementation. University of Alabama Press.
Planta, K., Prinz, V., & Vimalarajah, L. (2015). Inclusivity in National Dialogues.
Guaranteeing Social Integration or Preserving Old Power Hierarchies.
Prime, J. & Salib, E.R. (2014). Inclusive Leadership: The View from Six Countries
(Catalyst, 2014).
Quinlan, C., Babin, B., Carr, J., & Griffin, M. (2019). Business research methods. South
Western Cengage.
Raju, S. (2015). Influence of Women Employment on Women Empowerment in West
Bengal. National Seminar on women in Informal Sector – Issues and Challenges
On 5th & 6th October 2015 Institute for Social and Economic Change (ISEC),
Bangalore.
Ramirez-Hurtado, J. M., Berbel-Pineda, J. M., & Palacios-Florencio, B. (2018). Study of
the influence of socio-economic factors in the international expansion of Spanish
franchisors to Latin American countries. PloS one, 13(1).
Rueschemeyer, M. (2016). Women in the politics of post-communist Eastern Europe.
Routledge.
Schulz, W., Ainley, J., Fraillon, J., Losito, B., Agrusti, G., & Friedman, T. (2018).
Becoming citizens in a changing world: IEA International Civic and Citizenship
Education Study 2016 international report. Springer.

60
Siala, E. O. (2015). Factors Influencing Public Participation in Budget Formulation. The
Case of Nairobi County (Doctoral dissertation, United States International
University-Africa).
Singh, A. S., & Masuku, M. B. (2014). Sampling techniques & determination of sample
size in applied statistics research: An overview. International Journal of
Economics, Commerce and Management, 2(11), 1-22.
Sow, N. (2012). Women’s Political Participation and Economic Empowerment in Post-
conflict Countries: Lessons from the Great Lakes region in Africa. International
Alert, 1-47.
Sow, N. (2012). Women’s Political Participation and Economic Empowerment in Post-
conflict Countries: Lessons from the Great Lakes region in Africa. International
Alert, 1-47.
Szirmai, A. (2015). Socio-economic development. Cambridge University Press.
Tharaka Nithi County Treasury (2018). County Annual Development Plan for FY 2017-
18: Abbreviations and Acronyms & Glossary of Commonly Used Terms (x-xi)
The Government of Tharaka Nithi County. (2014). County Fiscal Strategy Paper. Retrieved
from: https://devolutionhub.or.ke/file/344fbd3e759719c61b1ff9eae00f3407.pdf
The Public Finance Management Act. (2012). The Public Finance Management Act 2012.
Retrieved from, http://crecokenya.org/new/index.php/resource-center/bills/177-
the-public-finance-management-act-2012
U.S News & World Report (2019) Power. Article retrieved online on 24th May 2019 from
https://www.usnews.com/news/best-countries/power-rankings.
UNDP (2019). Human Development Report for 2019: Focusing on inequality. Article
retrieved online on Tuesday 9th July 2019 at 1.04 pm from
http://hdr.undp.org/en/towards-hdr-2019
Uraia: Kenya’s National Civic Education Program (2016) What is Public
Participation?Frequently Asked Questions. Printed by Uraia with support from
Embassy of Sweden in Nairobi and Diakonia.
61
Vulenta, C. & Jones, N. (2018). Women who rule the world: The 22 most powerful female
political and policy leaders in 2018. Published by Forbes Magazine and retrieved
online from https://www.forbes.com/sites/christinavuleta/2018/12/04/the-women-
in-politics-and-policy-who-are-setting-the-stage-for-change/#3873ae7143a8 on
Sunday 17th March 2019
Wacera, D. C. (2016). Effect of Citizen Participation on Budget Implementation in Kenyan
Counties: A Case Study of Nyandarua County (Masters Thesis, University of
Nairobi).
Welham, B., Barnes-Robinson, K., Mansour-Ille, D., & Okhandiar, R. (2018). Gender-
responsive public expenditure management. Overseas Development Institute.
Weller, P. (2017). Equity, inclusivity and participation in a plural society: Challenging the
establishment of the Church of England. In Law and Religion in Contemporary
Society (pp. 53-67). Routledge.
WHO. (2013). Promoting Women’s Empowerment for Better Health Outcomes For
Women And Children. Strategy Brief for the Inter-Ministerial Conference on
“South-South Cooperation in Post ICDP and MDGs", Beijing, China 22-23
October, 2013.
Wilkinson, R. G., & Pickett, K. E. (2017). The enemy between us: The psychological and
social costs of inequality. European Journal of Social Psychology, 47(1), 11-24.
Zhong, L. J., & Mol, A. P. (2008). Participatory environmental governance in China: Public
hearings on urban water tariff setting. Journal of environmental management,
88(4), 899-913.

62
APPENDICES
Appendix I: Introductory letter

63
Appendix II: Questionnaire
I Rachel Wanjiru Kimani, (Student ID NO 622552) an MBA student at United States
International University-Africa, am conducting a study on the effect of women
representation in public participation on decision-making in Kenya. You have been selected
as a stakeholder in this area to respond to a few questions to enable me gather necessary
data to inform the findings and conclusions of my research proposal. The information you
give will be aggregated and solely used for the intended purpose and the interview will take
not more than 15 minutes. All feedback will be treated with the highest level of
confidentiality.
SECTION A: BACKGROUND INFORMATION
1. Gender: Male _______Female _______
2. Age: ___________
3. Highest level of academic qualification: Primary _____Secondary _____Tertiary
_____
4. Employed: Yes: _____________ No: ___________________
5. Occupation __________________________________
6. Religion __________________________________________
7. Ward _____________________________________________
8. Do you know what public participation is? Yes _______ No _____
9. Do you have access to healthcare? Yes _______ No _____
10. Have you ever engaged in any form of public participation? Yes _______ No _____
11. Are you a member of any community group or political group? Yes _______ No
_____
12. If yes, are you an official? Yes _______ No _____

64
SECTION B: SOCIOECONOMIC FACTORS
13. On a Likert scale provided below, projects that are socioeconomic in nature are
highlighted. Please rate your opinion on how the projects contribute to use of
development funds:
Item Very Poor
contributor
Poor
contributor
Neutral Good
Contributor
Very good
contributor
Health and
community
awareness
Education
projects
Entrepreneurship
opportunities
Women and youth
employment
creation
ATI/ veterinary
lab/ milk
processor plant
construction and
farm input
provision
Water projects
Housing
Electrification
and ICT
connectivity
Roads,
footbridges and
bridges
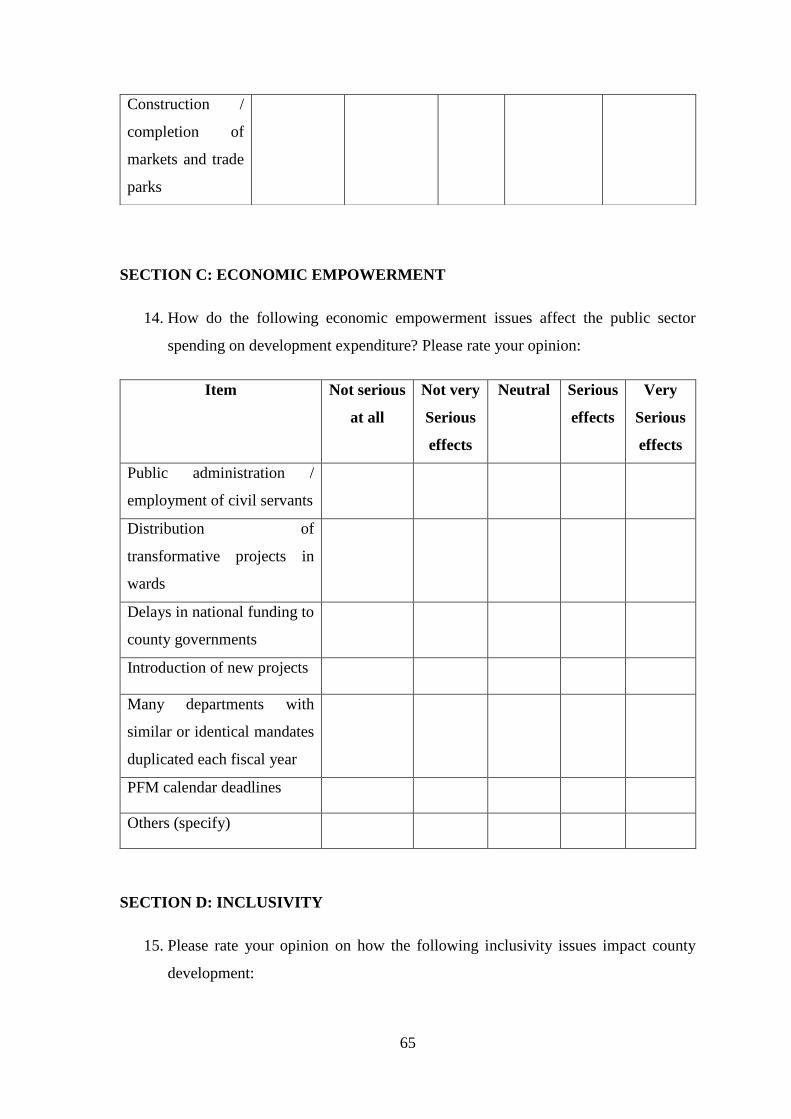
65
SECTION C: ECONOMIC EMPOWERMENT
14. How do the following economic empowerment issues affect the public sector
spending on development expenditure? Please rate your opinion:
Item Not serious
at all
Not very
Serious
effects
Neutral Serious
effects
Very
Serious
effects
Public administration /
employment of civil servants
Distribution of
transformative projects in
wards
Delays in national funding to
county governments
Introduction of new projects
Many departments with
similar or identical mandates
duplicated each fiscal year
PFM calendar deadlines
Others (specify)
SECTION D: INCLUSIVITY
15. Please rate your opinion on how the following inclusivity issues impact county
development:
Construction /
completion of
markets and trade
parks
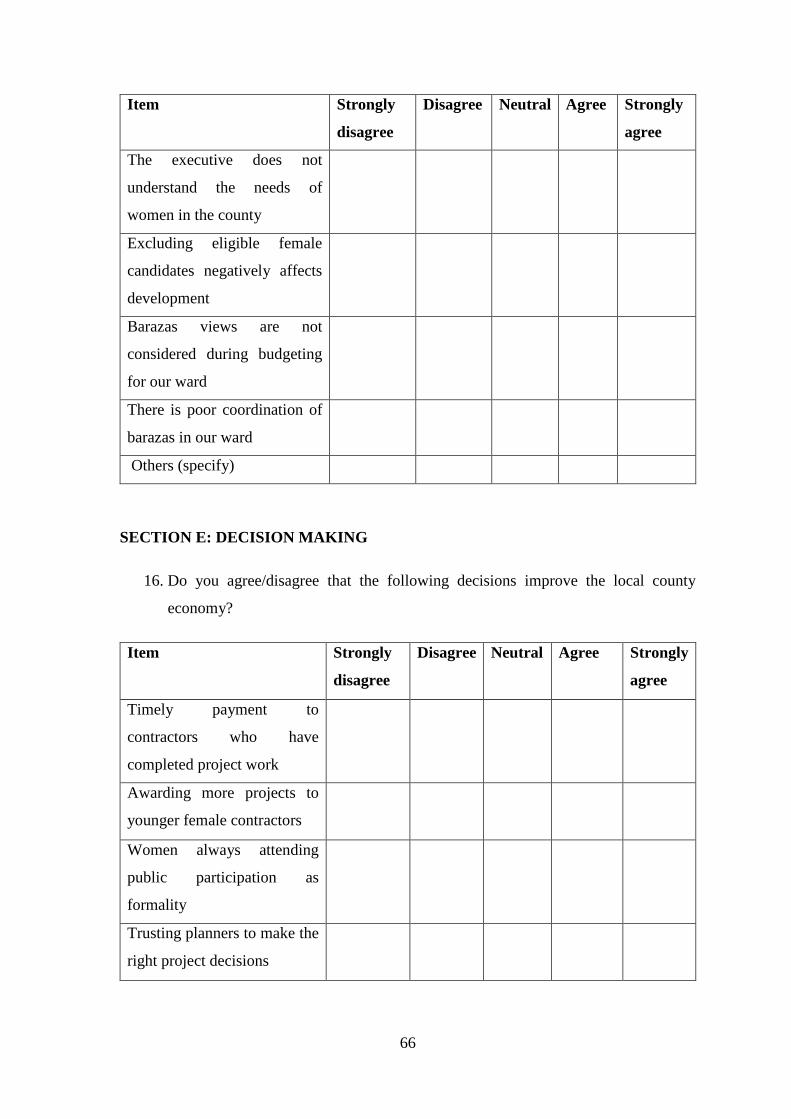
66
Item Strongly
disagree
Disagree Neutral Agree Strongly
agree
The executive does not
understand the needs of
women in the county
Excluding eligible female
candidates negatively affects
development
Barazas views are not
considered during budgeting
for our ward
There is poor coordination of
barazas in our ward
Others (specify)
SECTION E: DECISION MAKING
16. Do you agree/disagree that the following decisions improve the local county
economy?
Item Strongly
disagree
Disagree Neutral Agree Strongly
agree
Timely payment to
contractors who have
completed project work
Awarding more projects to
younger female contractors
Women always attending
public participation as
formality
Trusting planners to make the
right project decisions

67
Sharing project suggestions to
economic planners
Others (specify)
SECTION F: GENERAL RECOMMENDATIONS
17. Is the county government doing enough to increase development expenditure in
sectors directly affecting the lives of women?
Yes ______ Why?
____________________________________________________________
__________________________________________________________________
________
No _______ Why?
__________________________________________________________
__________________________________________________________________
________
18. In your view what should be done to increase women’s participation in decision-
making on spending on development expenditures?
__________________________________________________________________
__________________________________________________________________
19. What challenges & solutions are experienced by women who participate in public
hearings?
Challenges Solutions
Thank you for your time.
68
Appendix III: Research Permit

69
Appendix IV: Attendees
CFSP PUBLIC PARTICIPATION FY 2018-19 AT KARINGANI,
IGAMBANG’OMBE & MAGUMONI WARDS
NAME GEN
DER WARD
PHONE
NUMBER LOCATION
1 David Gitonga M Karingani 718220930 Kiang'ondu
2 Mercy Muthoni Kathia F Karingani 715021402 Karingani
3 Akida Rajab F Karingani 726501605 Karingani
4 Cyrus Kinyua M Karingani 726496129 Karingani
5 Daniel Kimwea M Karingani 792539332 Kiang'ondu
6 Dorothy Wanja F Karingani 721572729 Mugwe
7 Susan Murugi F Karingani 728257382 Karingani
8 Pierra Wanja F Karingani 720634071 Karingani
9 Ephantus Muriithi M Karingani 726707257 Karingani
10 Rosalid Wanja F Karingani 717638041 Karingani
11 Caroline Gakii F Karingani 718825694 Kibumbu
12 Kellen Gatugi F Karingani 724550110 Mugwe
13 Caroline Kanjiru F Karingani 710438099 Kiang'ondu
14 Godfrey Mawira M Karingani 706809660 Mucwa
15 Amram Muthee M Karingani 707322580 Township
16 Patrick Micheni M Karingani 726393970 Township
17 Francis Muchangi M Karingani 708597375 Kiang'ondu
18 Linus Kirimi M Karingani 721446612 Township
19 Mercy Murugi F Karingani 708597375 Township
20 Modester Kambura F Karingani 712806252 Township
21 Mary Kaari F Karingani 723727928 Township
22 Purity Muthoni F Karingani 727095954 Township
23 Joy Kaari F Karingani 713825100 Township
24 James Kamau M Karingani 798564730 Township
25 Peter Mwenda M Karingani 716966596 Township
26 Stella Kaguthi F Karingani 724436422 Township
27 Caroline Wanja F Karingani 721929600 Township
28 Jedidah Murage F Karingani 721639154 Township
29 Gitonga Ththi M Mugwe 712594611 Muiru
30 James Njabuba M Mugwe 733644142 Gitareni
31 Japhet Kimoni M Mugwe 721813295 Nkuthika
32 David Kimathi M Mugwe 727037033 Gitareni
33 Harriet Kaburu F Mugwe 722172926 Gitareni
34 Kariuki Muthoni F Mugwe 703785943 Mugwe
35 Roda Muthoni F Mugwe 729245063 Muiru
36 Edita Muthoni F Mugwe 714753324 Muiru
37 Neitus Gaceri F Mugwe 716847259 Gitareni
38 Agnes Karimi F Mugwe 795804776 Gitareni
39 Edward Mutwiri M Mugwe 713567033 Muiru
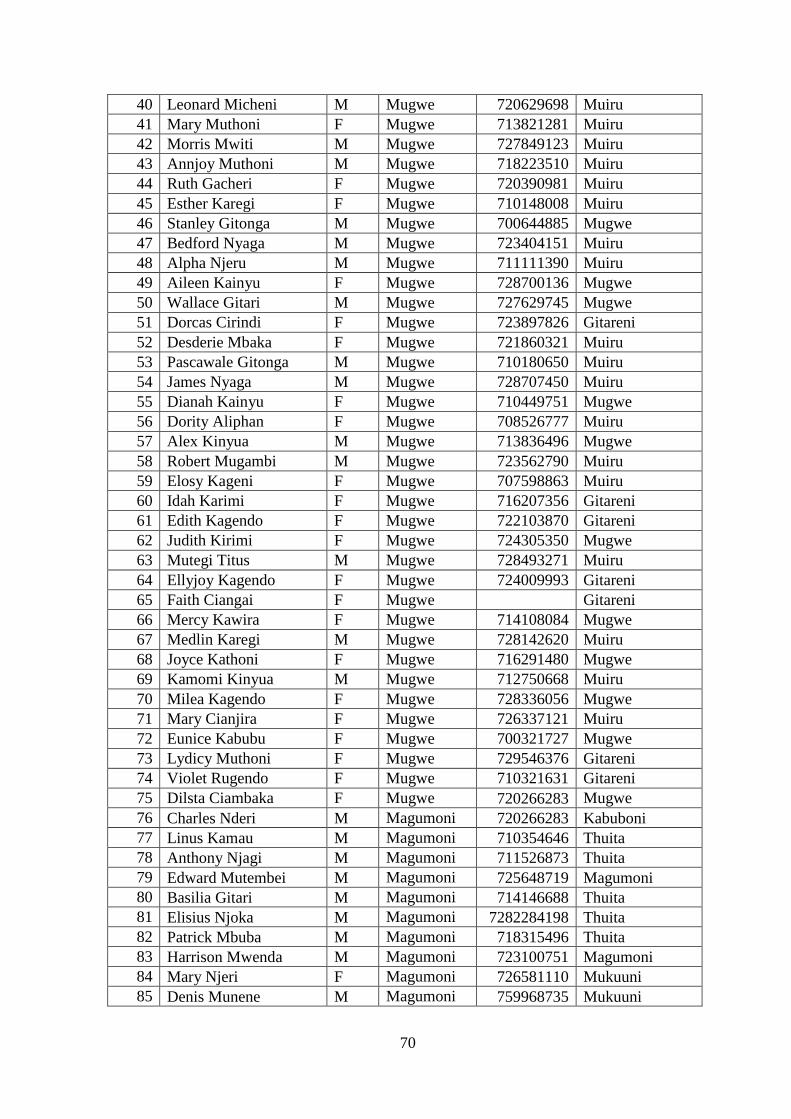
70
40 Leonard Micheni M Mugwe 720629698 Muiru
41 Mary Muthoni F Mugwe 713821281 Muiru
42 Morris Mwiti M Mugwe 727849123 Muiru
43 Annjoy Muthoni M Mugwe 718223510 Muiru
44 Ruth Gacheri F Mugwe 720390981 Muiru
45 Esther Karegi F Mugwe 710148008 Muiru
46 Stanley Gitonga M Mugwe 700644885 Mugwe
47 Bedford Nyaga M Mugwe 723404151 Muiru
48 Alpha Njeru M Mugwe 711111390 Muiru
49 Aileen Kainyu F Mugwe 728700136 Mugwe
50 Wallace Gitari M Mugwe 727629745 Mugwe
51 Dorcas Cirindi F Mugwe 723897826 Gitareni
52 Desderie Mbaka F Mugwe 721860321 Muiru
53 Pascawale Gitonga M Mugwe 710180650 Muiru
54 James Nyaga M Mugwe 728707450 Muiru
55 Dianah Kainyu F Mugwe 710449751 Mugwe
56 Dority Aliphan F Mugwe 708526777 Muiru
57 Alex Kinyua M Mugwe 713836496 Mugwe
58 Robert Mugambi M Mugwe 723562790 Muiru
59 Elosy Kageni F Mugwe 707598863 Muiru
60 Idah Karimi F Mugwe 716207356 Gitareni
61 Edith Kagendo F Mugwe 722103870 Gitareni
62 Judith Kirimi F Mugwe 724305350 Mugwe
63 Mutegi Titus M Mugwe 728493271 Muiru
64 Ellyjoy Kagendo F Mugwe 724009993 Gitareni
65 Faith Ciangai F Mugwe Gitareni
66 Mercy Kawira F Mugwe 714108084 Mugwe
67 Medlin Karegi M Mugwe 728142620 Muiru
68 Joyce Kathoni F Mugwe 716291480 Mugwe
69 Kamomi Kinyua M Mugwe 712750668 Muiru
70 Milea Kagendo F Mugwe 728336056 Mugwe
71 Mary Cianjira F Mugwe 726337121 Muiru
72 Eunice Kabubu F Mugwe 700321727 Mugwe
73 Lydicy Muthoni F Mugwe 729546376 Gitareni
74 Violet Rugendo F Mugwe 710321631 Gitareni
75 Dilsta Ciambaka F Mugwe 720266283 Mugwe
76 Charles Nderi M Magumoni 720266283 Kabuboni
77 Linus Kamau M Magumoni 710354646 Thuita
78 Anthony Njagi M Magumoni 711526873 Thuita
79 Edward Mutembei M Magumoni 725648719 Magumoni
80 Basilia Gitari M Magumoni 714146688 Thuita
81 Elisius Njoka M Magumoni 7282284198 Thuita
82 Patrick Mbuba M Magumoni 718315496 Thuita
83 Harrison Mwenda M Magumoni 723100751 Magumoni
84 Mary Njeri F Magumoni 726581110 Mukuuni
85 Denis Munene M Magumoni 759968735 Mukuuni
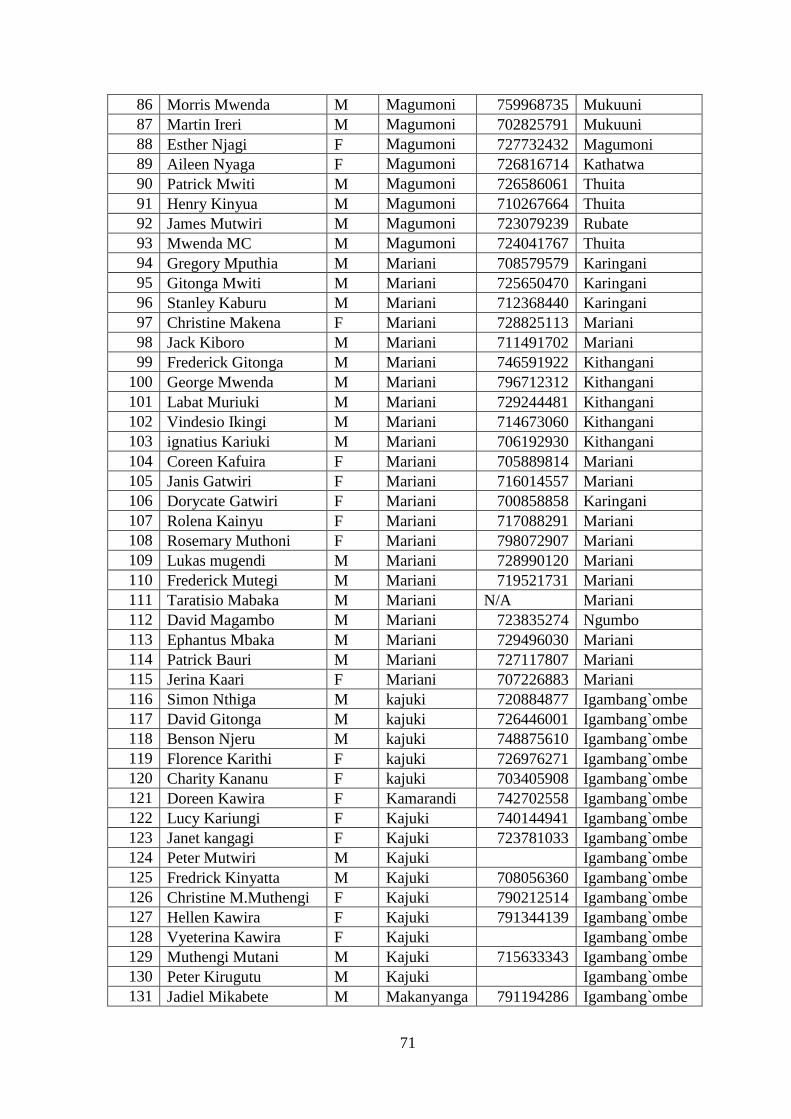
71
86 Morris Mwenda M Magumoni 759968735 Mukuuni
87 Martin Ireri M Magumoni 702825791 Mukuuni
88 Esther Njagi F Magumoni 727732432 Magumoni
89 Aileen Nyaga F Magumoni 726816714 Kathatwa
90 Patrick Mwiti M Magumoni 726586061 Thuita
91 Henry Kinyua M Magumoni 710267664 Thuita
92 James Mutwiri M Magumoni 723079239 Rubate
93 Mwenda MC M Magumoni 724041767 Thuita
94 Gregory Mputhia M Mariani 708579579 Karingani
95 Gitonga Mwiti M Mariani 725650470 Karingani
96 Stanley Kaburu M Mariani 712368440 Karingani
97 Christine Makena F Mariani 728825113 Mariani
98 Jack Kiboro M Mariani 711491702 Mariani
99 Frederick Gitonga M Mariani 746591922 Kithangani
100 George Mwenda M Mariani 796712312 Kithangani
101 Labat Muriuki M Mariani 729244481 Kithangani
102 Vindesio Ikingi M Mariani 714673060 Kithangani
103 ignatius Kariuki M Mariani 706192930 Kithangani
104 Coreen Kafuira F Mariani 705889814 Mariani
105 Janis Gatwiri F Mariani 716014557 Mariani
106 Dorycate Gatwiri F Mariani 700858858 Karingani
107 Rolena Kainyu F Mariani 717088291 Mariani
108 Rosemary Muthoni F Mariani 798072907 Mariani
109 Lukas mugendi M Mariani 728990120 Mariani
110 Frederick Mutegi M Mariani 719521731 Mariani
111 Taratisio Mabaka M Mariani N/A Mariani
112 David Magambo M Mariani 723835274 Ngumbo
113 Ephantus Mbaka M Mariani 729496030 Mariani
114 Patrick Bauri M Mariani 727117807 Mariani
115 Jerina Kaari F Mariani 707226883 Mariani
116 Simon Nthiga M kajuki 720884877 Igambang`ombe
117 David Gitonga M kajuki 726446001 Igambang`ombe
118 Benson Njeru M kajuki 748875610 Igambang`ombe
119 Florence Karithi F kajuki 726976271 Igambang`ombe
120 Charity Kananu F kajuki 703405908 Igambang`ombe
121 Doreen Kawira F Kamarandi 742702558 Igambang`ombe
122 Lucy Kariungi F Kajuki 740144941 Igambang`ombe
123 Janet kangagi F Kajuki 723781033 Igambang`ombe
124 Peter Mutwiri M Kajuki Igambang`ombe
125 Fredrick Kinyatta M Kajuki 708056360 Igambang`ombe
126 Christine M.Muthengi F Kajuki 790212514 Igambang`ombe
127 Hellen Kawira F Kajuki 791344139 Igambang`ombe
128 Vyeterina Kawira F Kajuki Igambang`ombe
129 Muthengi Mutani M Kajuki 715633343 Igambang`ombe
130 Peter Kirugutu M Kajuki Igambang`ombe
131 Jadiel Mikabete M Makanyanga 791194286 Igambang`ombe

72
132 Mukwanyaga M Kajuki Igambang`ombe
133 Caro Ciakuthii F Kajuki 792798282 Igambang`ombe
134 Francis Simba M Kajuki 727814851 Igambang`ombe
135 Michael Munyi M Kajuki 792700834 Igambang`ombe
136 Bonface Kavuitu M Kamwimbi 713041930 Igambang`ombe
137 Regina Njoki F Itugururu 724408370 Igambang`ombe
138 Newton Mwiti M Mutino 714894630 Igambang`ombe
139 Joseph Njeru M Kajuki 727893712 Igambang`ombe
140 Peter M Kajuki 2769078 Igambang`ombe
141 Peter Kienge M Kajuki 711690503 Igambang`ombe
142 Rutere Kanampiu M Kajuki Igambang`ombe
143 Hellen Karugi F Kajuki Igambang`ombe
144 Njoka Mutiria M Kajuki Igambang`ombe
145 Gilbert Kabunjia M kajuki 702687021 Igambang`ombe
146 Raphael Murithi M kajuki 710142094 Igambang`ombe
147 Luka Njeru M Kamutiria 701034875 Igambang`ombe
148 Josphat Kithome M Kamutiria 701698298 Igambang`ombe
149 Protas Kambuthu M kajuki 708348482 Igambang`ombe
150 Veronica Mwende F Kamutiria 751865155 Igambang`ombe
151 David Gitonga M KiKora 713668585 Igambang`ombe
152 Kennedy Mwiti Mbaka M Mutino 723880960 Igambang`ombe
153 Denis Mugambi M Kamaindi Igambang`ombe
154 Mitambo Muguika M kajuki Igambang`ombe
155 Babliel Kiania M Kajuki 5088205 Igambang`ombe
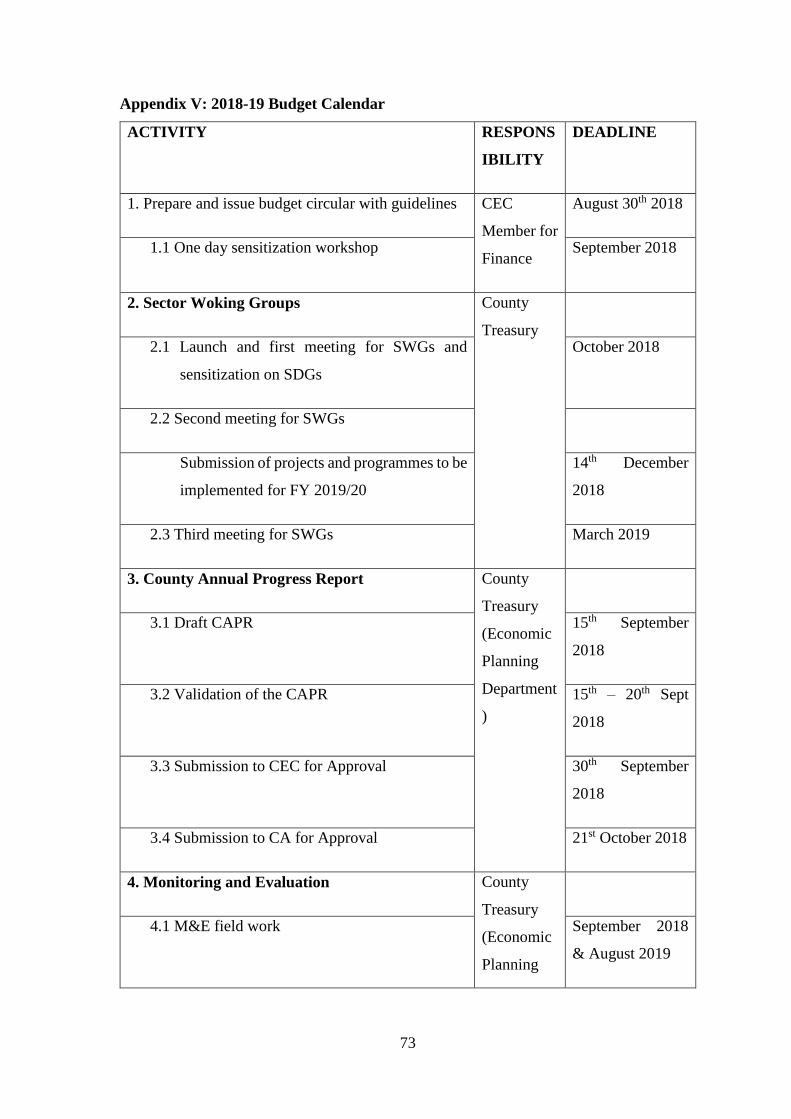
73
Appendix V: 2018-19 Budget Calendar
ACTIVITY RESPONS
IBILITY
DEADLINE
1. Prepare and issue budget circular with guidelines CEC
Member for
Finance
August 30th 2018
1.1 One day sensitization workshop September 2018
2. Sector Woking Groups County
Treasury
2.1 Launch and first meeting for SWGs and
sensitization on SDGs
October 2018
2.2 Second meeting for SWGs
Submission of projects and programmes to be
implemented for FY 2019/20
14th December
2018
2.3 Third meeting for SWGs March 2019
3. County Annual Progress Report County
Treasury
(Economic
Planning
Department
)
3.1 Draft CAPR 15th September
2018
3.2 Validation of the CAPR 15th – 20th Sept
2018
3.3 Submission to CEC for Approval 30th September
2018
3.4 Submission to CA for Approval 21st October 2018
4. Monitoring and Evaluation County
Treasury
(Economic
Planning
4.1 M&E field work September 2018
& August 2019

74
4.2 Annual M&E week Department
)
2nd week
November 2018
5. Statistical abstract County
Treasury
(Economic
Planning
Department
5.1 Draft Oct18
5.2 Launch Nov18
6. Development of ADPs for FY 2019/20 and
2020/21
County
Treasury
(Economic
Planning
Department
)
6.1. Draft ADP FY 2019/20 23rd August 2018
6.2 Submission of ADP FY 2019/20 to CEC 27th August 2018
6.3. Submission of ADP FY 2019/20 to County
Assembly
30th August 2018
6.4. Report of ADP from County Assembly
6.5. Consolidation of CA recommendations to
Final ADP
6.6. Approval of ADP by County Assembly
6.7. Meeting with TWGs for ADP FY 2020/21 30th May 2019
6.8. First draft ADP FY 2020/21 15th August 2019
6.9. Validation ADP FY 2020/21 15th – 20th August
2019
6.10. CEC Approval ADP FY 2020/21 20th August 2019
6.11. Submission ADP FY 2020/21 to County
Assembly
30th August 2019
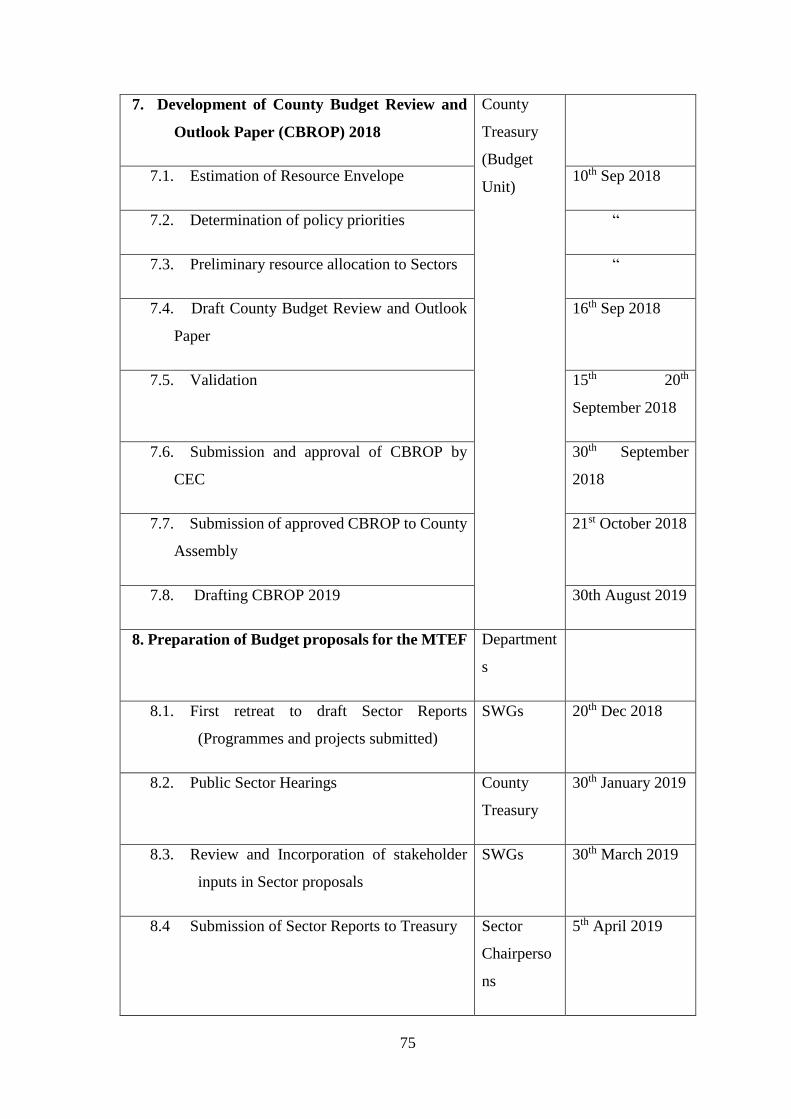
75
7. Development of County Budget Review and
Outlook Paper (CBROP) 2018
County
Treasury
(Budget
Unit)
7.1. Estimation of Resource Envelope 10th Sep 2018
7.2. Determination of policy priorities “
7.3. Preliminary resource allocation to Sectors “
7.4. Draft County Budget Review and Outlook
Paper
16th Sep 2018
7.5. Validation 15th 20th
September 2018
7.6. Submission and approval of CBROP by
CEC
30th September
2018
7.7. Submission of approved CBROP to County
Assembly
21st October 2018
7.8. Drafting CBROP 2019 30th August 2019
8. Preparation of Budget proposals for the MTEF Department
s
8.1. First retreat to draft Sector Reports
(Programmes and projects submitted)
SWGs 20th Dec 2018
8.2. Public Sector Hearings County
Treasury
30th January 2019
8.3. Review and Incorporation of stakeholder
inputs in Sector proposals
SWGs 30th March 2019
8.4 Submission of Sector Reports to Treasury Sector
Chairperso
ns
5th April 2019
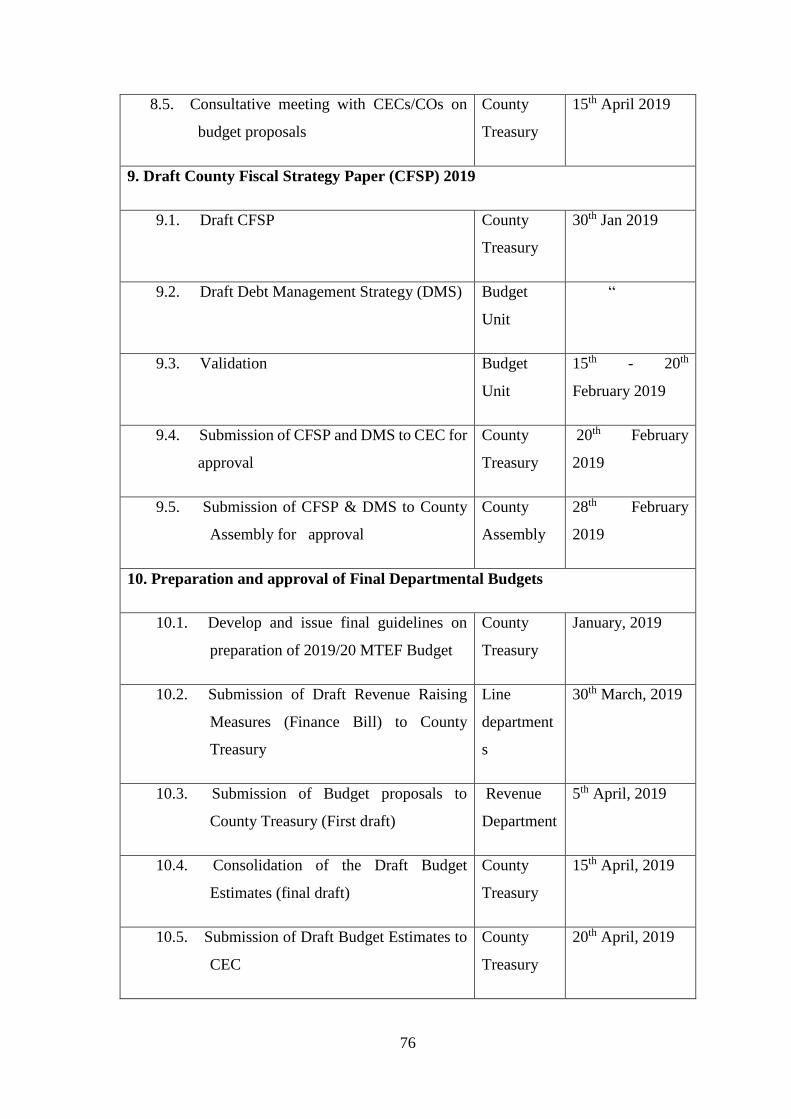
76
8.5. Consultative meeting with CECs/COs on
budget proposals
County
Treasury
15th April 2019
9. Draft County Fiscal Strategy Paper (CFSP) 2019
9.1. Draft CFSP County
Treasury
30th Jan 2019
9.2. Draft Debt Management Strategy (DMS) Budget
Unit
“
9.3. Validation Budget
Unit
15th - 20th
February 2019
9.4. Submission of CFSP and DMS to CEC for
approval
County
Treasury
20th February
2019
9.5. Submission of CFSP & DMS to County
Assembly for approval
County
Assembly
28th February
2019
10. Preparation and approval of Final Departmental Budgets
10.1. Develop and issue final guidelines on
preparation of 2019/20 MTEF Budget
County
Treasury
January, 2019
10.2. Submission of Draft Revenue Raising
Measures (Finance Bill) to County
Treasury
Line
department
s
30th March, 2019
10.3. Submission of Budget proposals to
County Treasury (First draft)
Revenue
Department
5th April, 2019
10.4. Consolidation of the Draft Budget
Estimates (final draft)
County
Treasury
15th April, 2019
10.5. Submission of Draft Budget Estimates to
CEC
County
Treasury
20th April, 2019
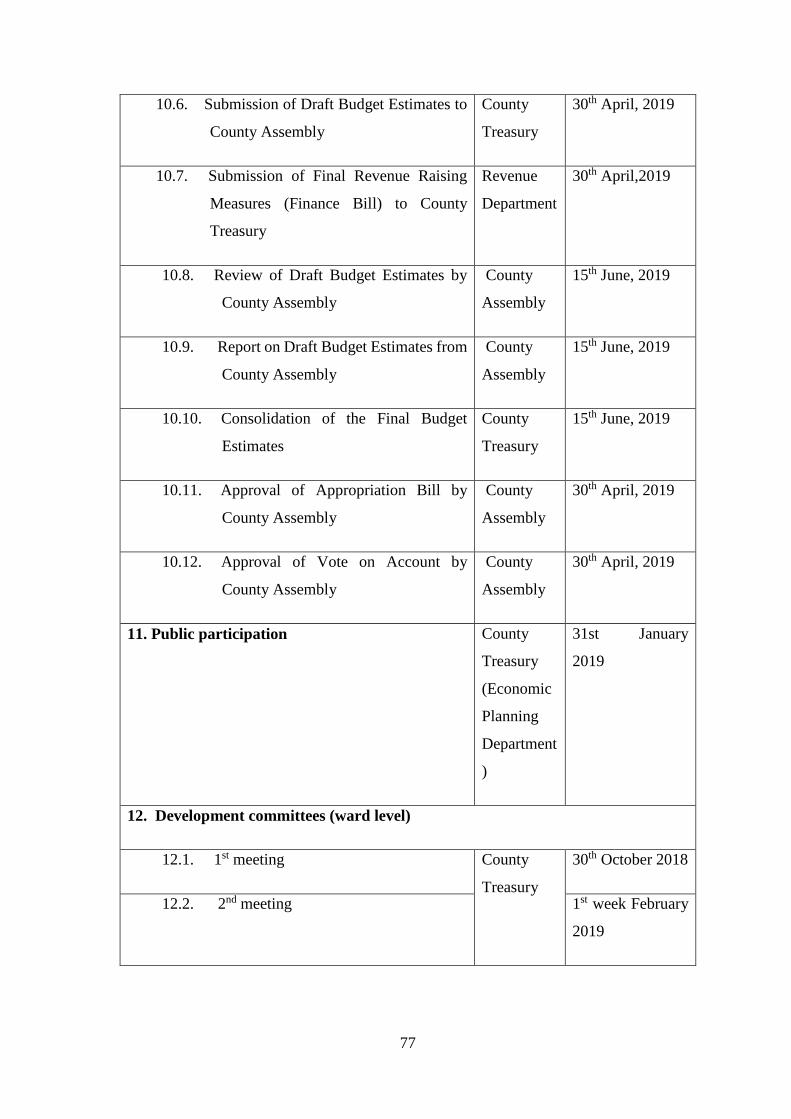
77
10.6. Submission of Draft Budget Estimates to
County Assembly
County
Treasury
30th April, 2019
10.7. Submission of Final Revenue Raising
Measures (Finance Bill) to County
Treasury
Revenue
Department
30th April,2019
10.8. Review of Draft Budget Estimates by
County Assembly
County
Assembly
15th June, 2019
10.9. Report on Draft Budget Estimates from
County Assembly
County
Assembly
15th June, 2019
10.10. Consolidation of the Final Budget
Estimates
County
Treasury
15th June, 2019
10.11. Approval of Appropriation Bill by
County Assembly
County
Assembly
30th April, 2019
10.12. Approval of Vote on Account by
County Assembly
County
Assembly
30th April, 2019
11. Public participation County
Treasury
(Economic
Planning
Department
)
31st January
2019
12. Development committees (ward level)
12.1. 1st meeting County
Treasury
30th October 2018
12.2. 2nd meeting 1st week February
2019

78
13. Budget Statement CECM
Finance
19th June, 2019
14. Appropriation Bill passed County
Assembly
30th June, 2019
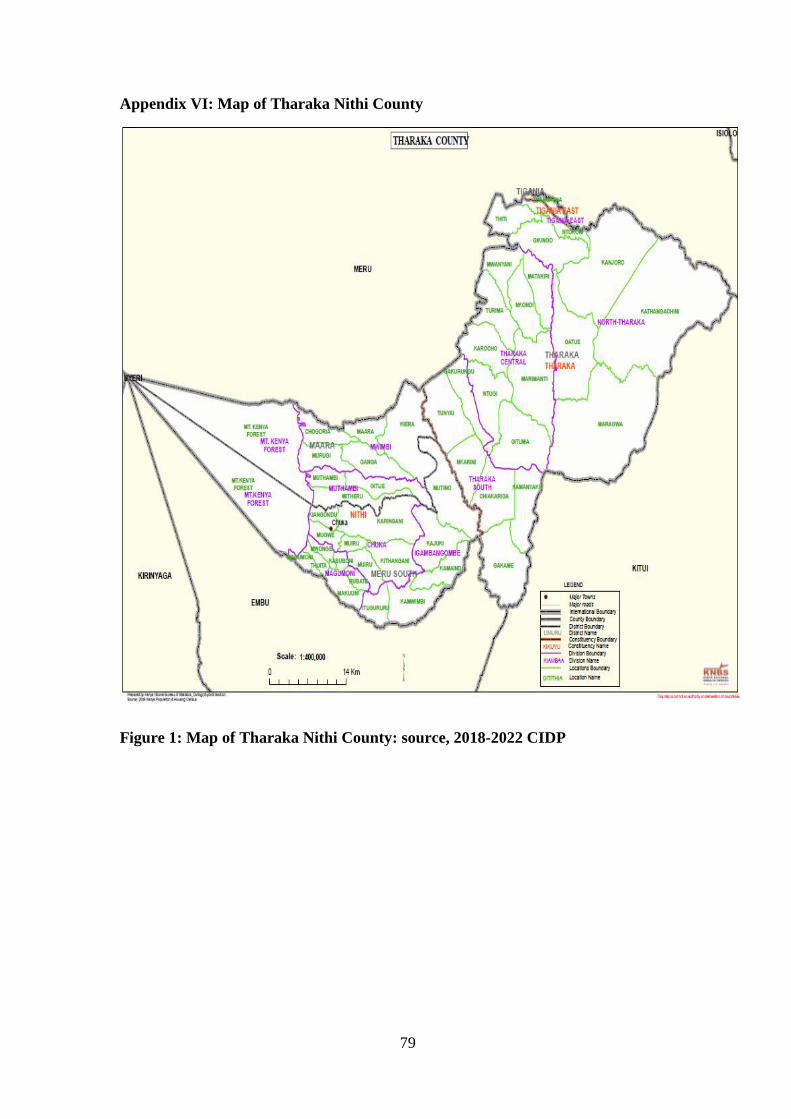
79
Appendix VI: Map of Tharaka Nithi County
Figure 1: Map of Tharaka Nithi County: source, 2018-2022 CIDP
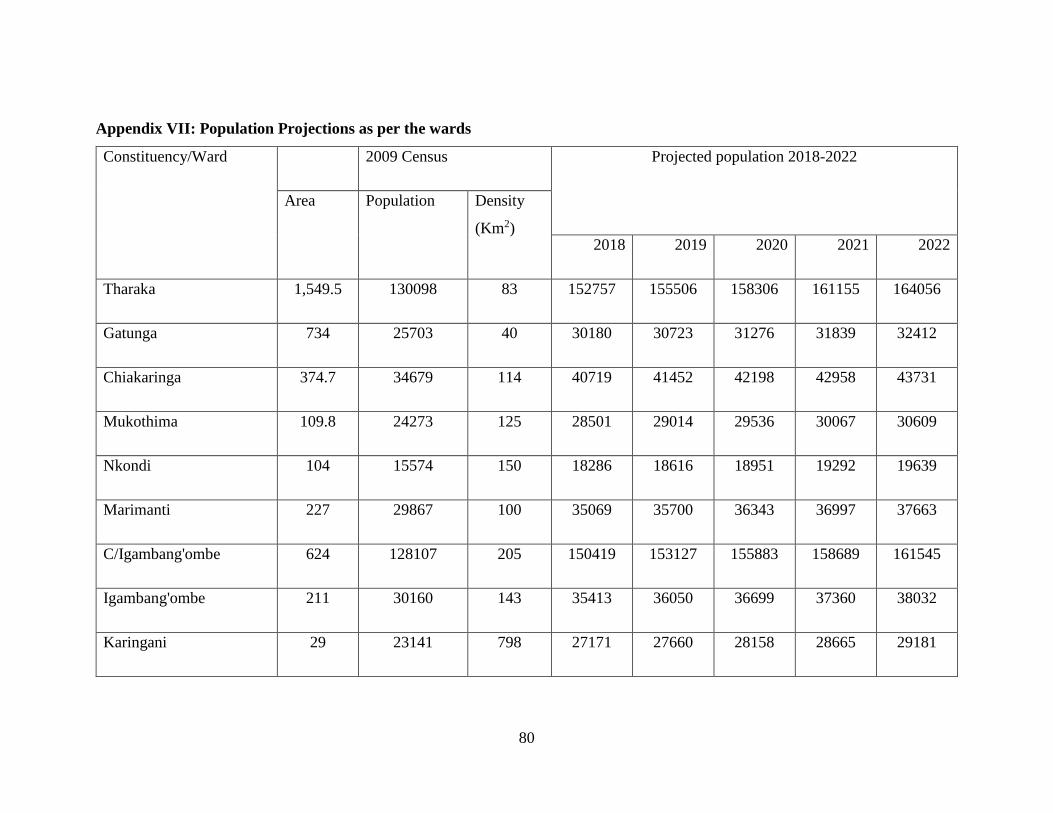
80
Appendix VII: Population Projections as per the wards
Constituency/Ward 2009 Census Projected population 2018-2022
Area
Population Density
(Km2) 2018 2019 2020 2021 2022
Tharaka 1,549.5 130098 83 152757 155506 158306 161155 164056
Gatunga 734 25703 40 30180 30723 31276 31839 32412
Chiakaringa 374.7 34679 114 40719 41452 42198 42958 43731
Mukothima 109.8 24273 125 28501 29014 29536 30067 30609
Nkondi 104 15574 150 18286 18616 18951 19292 19639
Marimanti 227 29867 100 35069 35700 36343 36997 37663
C/Igambang'ombe 624 128107 205 150419 153127 155883 158689 161545
Igambang'ombe 211 30160 143 35413 36050 36699 37360 38032
Karingani 29 23141 798 27171 27660 28158 28665 29181
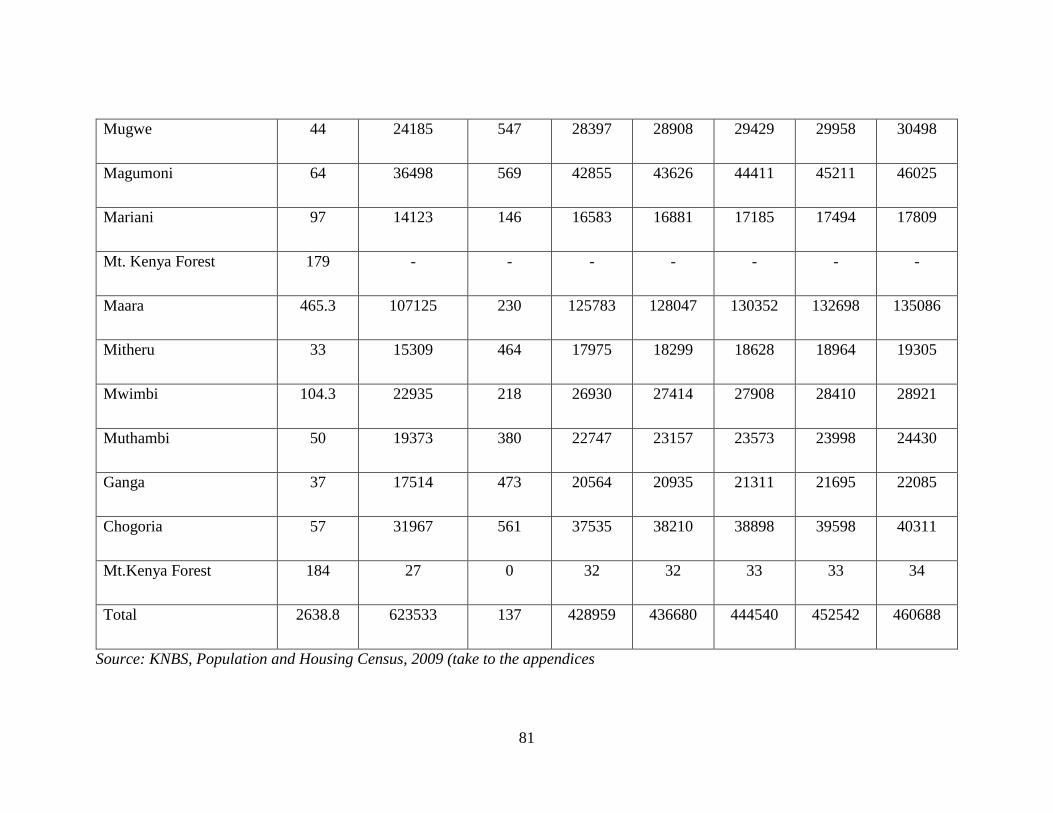
81
Mugwe 44 24185 547 28397 28908 29429 29958 30498
Magumoni 64 36498 569 42855 43626 44411 45211 46025
Mariani 97 14123 146 16583 16881 17185 17494 17809
Mt. Kenya Forest 179 - - - - - - -
Maara 465.3 107125 230 125783 128047 130352 132698 135086
Mitheru 33 15309 464 17975 18299 18628 18964 19305
Mwimbi 104.3 22935 218 26930 27414 27908 28410 28921
Muthambi 50 19373 380 22747 23157 23573 23998 24430
Ganga 37 17514 473 20564 20935 21311 21695 22085
Chogoria 57 31967 561 37535 38210 38898 39598 40311
Mt.Kenya Forest 184 27 0 32 32 33 33 34
Total 2638.8 623533 137 428959 436680 444540 452542 460688
Source: KNBS, Population and Housing Census, 2009 (take to the appendices