FACTORS AFFECTING PERIPHYTON ABUNDANCE ON MACROPHYTES IN A
40
FACTORS AFFECTING PERIPHYTON ABUNDANCE ON MACROPHYTES IN A SPRING-FED RIVER IN FLORIDA By VINCENT ANTHONY POLITANO A THESIS PRESENTED TO THE GRADUATE SCHOOL OF THE UNIVERSITY OF FLORIDA IN PARTIAL FULFILLMENT OF THE REQUIREMENTS OF THE DEGREE OF MASTER OF SCIENCE UNIVERSITY OF FLORIDA 2008 1
Transcript of FACTORS AFFECTING PERIPHYTON ABUNDANCE ON MACROPHYTES IN A

FACTORS AFFECTING PERIPHYTON ABUNDANCE ON MACROPHYTES IN A SPRING-FED RIVER IN FLORIDA
By
VINCENT ANTHONY POLITANO
A THESIS PRESENTED TO THE GRADUATE SCHOOL OF THE UNIVERSITY OF FLORIDA IN PARTIAL FULFILLMENT
OF THE REQUIREMENTS OF THE DEGREE OF MASTER OF SCIENCE
UNIVERSITY OF FLORIDA
2008
1

© 2008 Vincent Anthony Politano
2

To my family
3

ACKNOWLEDGEMENTS
I thank my family and friends for their support and my advisors for their tutelage.
4

TABLE OF CONTENTS page
ACKNOWLEDGEMENTS .............................................................................................................4
LIST OF TABLES ...........................................................................................................................6
LIST OF FIGURES .........................................................................................................................7
ABSTRACT .....................................................................................................................................8
CHAPTER
1 INTRODUCTION ..................................................................................................................10
2 MATERIALS AND METHODS ...........................................................................................12
Quantitative River and Spring Survey ....................................................................................12 Chemical and Physical Parameters ..................................................................................13 Vegetation Sampling .......................................................................................................13 Quantifying Periphyton Associated with SAV ................................................................14
Translocation Experiment .......................................................................................................15 Statistical Analyses .................................................................................................................16
3 RESULTS ...............................................................................................................................19
Survey Results ........................................................................................................................19 Translocation Experiment .......................................................................................................20
4 DISCUSSION .........................................................................................................................33
LIST OF REFERENCES ...............................................................................................................37
BIOGRAPHICAL SKETCH .........................................................................................................40
5

LIST OF TABLES
Table page 3-1. Summary of 2007 Survey Data – Means ± Standard Errors (n = # of samples) ....................22
6

LIST OF FIGURES
Figure page 2-1. Map of the Ichetucknee River course through the Ichetucknee Springs State Park. All
transect sampling was carried out in the upper portion of the river within the confines of the park. Experimental work was conducted near Singing Spring, Devils Eye (also known as Boiling Spring) and Mill Pond Spring. .....................................................17
2-2. Collapsed and expanded view of plant sampling apparatus. .................................................18
3-1. Mean dissolved oxygen concentration with increasing distance downstream in the main stem of the Ichetucknee River. Numbers along the x-axis correspond to river transects with ascending values representing distance downstream. .................................23
3-2. Mean dissolved oxygen concentration in the main stem of the Ichetucknee River and three associated feeder springs (i.e. Singing Spring, Devil’s Eye Spring, and Mill Pond Spring). .....................................................................................................................24
3-3. Mean stream velocity with increasing distance downstream in the main stem of the Ichetucknee River. Numbers along the x-axis correspond to river transects with ascending values representing distance downstream. ........................................................25
3-4. Mean stream velocity in the main stem of the Ichetucknee River and three associated feeder springs (i.e. Singing Spring, Devil’s Eye Spring, and Mill Pond Spring). .............26
3-5. Mean periphyton abundance with increasing distance downstream in the main stem of the Ichetucknee River. Numbers along the x-axis correspond to river transects with ascending values representing distance downstream. ........................................................27
3-6. Mean periphyton abundance in the main stem of the Ichetucknee River and three associated feeder springs (i.e. Singing Spring, Devil’s Eye Spring, and Mill Pond Spring)................................................................................................................................28
3-7. Mean plant biomass with increasing distance downstream in the main stem of the Ichetucknee River. Numbers along the x-axis correspond to river transects with ascending values representing distance downstream. ........................................................29
3-8. Mean plant biomass in the main stem of the Ichetucknee River and three associated feeder springs (i.e. Singing Spring, Devil’s Eye Spring, and Mill Pond Spring). .............30
3-9. Mean plant biomass in the main stem of the Ichetucknee River and three associated feeder springs (i.e. Singing Spring, Devil’s Eye Spring, and Mill Pond Spring) following a four week translocation experiment. ..............................................................31
3-10. Mean periphyton abundance in the main stem of the Ichetucknee River and three associated feeder springs (i.e. Singing Spring, Devil’s Eye Spring, and Mill Pond Spring) following a four week translocation experiment. .................................................32
7

Abstract of Thesis Presented to the Graduate School of the University of Florida in Partial Fulfillment of the
Requirements for the Degree of Master of Science
FACTORS AFFECTING PERIPHYTON ABUNDANCE ON MACROPHYTES IN A SPRING-FED RIVER IN FLORIDA
By
Vincent Anthony Politano
May 2008
Chair: Thomas K. Frazer Major: Fisheries and Aquatic Sciences Past and present land use activities in Florida have resulted in broad-scale nutrient
concentration increases in the groundwater system. Nutrient contaminated groundwater is not
only a health concern, but also represents a potentially serious ecological problem. Because
Florida’s extensive system of aquifers exist within a very permeable karst geology, there are
myriad of pathways by which nutrient laden groundwater can enter and be mixed with surface
water systems. Freshwater springs, for example, provide a direct conduit for contaminated
groundwater discharge to surface water systems. It is in the surface waters where nutrients, such
as nitrogen and phosphorus, have the greatest potential to negatively alter the ecology of aquatic
ecosystems. Along the Ichetucknee River, several feeder springs have experienced vegetation
losses over the past decade. The springs are not only enriched in nutrients, but also exhibit low
dissolved oxygen concentrations, and low stream velocites. While eutrophication appears to be a
plausible explanation for vegetation loss, this study investigated the possibility that nutrient
contamination alone may not be responsible for vegetation loss. I hypothesized that low
dissolved oxygen concentrations near spring vents and seeps preclude the existence of primary
grazers and, as a consequence, macrophytes in these areas of low stream velocity accumulate
more periphyton and grow more slowly than vegetation in more oxygenated, swiftly flowing
8

9
portions of the river. An initial characterization of the abiotic environment and the macrophyte
community of the Ichetucknee River indicated that the proposed pattern of interaction was
evident throughout the system. Subsequently, a four-week translocation experiment was carried
out where genets of the most abundant macrophyte, Sagittaria kurziana, were relocated to
several river and spring locations to evaluate site specific differences in the rate of periphyton
accumulation and potential effects on macrophyte growth. Results suggest that periphyton
accumulation on S. kurziana is more rapid in feeder spring environments than in the main stem
of the Ichetucknee River. The differences were likely due to low dissolved oxygen
concentrations, low stream velocities and reduced grazer abundance in the feeder springs. There
were, however, no detectable effects on macrophyte growth probably due to the short duration of
the study.

CHAPTER 1 INTRODUCTION
The structure and function of aquatic ecosystems is determined by many chemical,
physical and biological processes. Chemically driven processes that influence primary
production with consequences for higher-order organisms are typically classified as “bottom-up”
processes. In contrast, “top-down” processes are those in which higher-order organisms exert a
strong influence on the structure and function of the system. Although opposing in nature,
“bottom-up” and “top-down” processes co-occur (Heck et al. 2006). In some cases, however, the
balance between these opposing processes is disrupted with marked ecological consequences
(Turner et al. 1994).
Nutrient over-enrichment, for example, can lead to excessive primary production and
changes in habitat and community structure. In extreme cases, microalgae flourish and become
so abundant as to lethally shade benthic macrophytes and macroalgae (Duarte 1995).
Eutrophication is common in water bodies bordered by human development and ecologists are
becoming increasingly aware of the potential effects of anthropogenic nutrient enrichment
(Caccia and Boyer 2007).
Nutrient over-enrichment is of great concern in north central Florida where many aquatic
systems are affected by changing land use activities. The region’s permeable karst geology
allows for pollutants to percolate into an extensive aquifer system. Nutrient pollutants in
Florida’s groundwater, nitrogen and phosphorus in particular, are delivered to surface waters in
the region via more than 300 individual freshwater springs (Notestein et al. 2003). Many aquatic
ecosystems throughout north central Florida have experienced increases in nutrient pollution and
reports of vegetation loss attributable to algal overgrowth from prolonged anthropogenic nutrient
enrichment are increasingly common (e.g., Wright and McDonald 1986a, 1986b).
10

Nutrient enrichment, however, may not be the only factor contributing to vegetation loss in
spring-fed river systems. Low concentrations of dissolved oxygen and low stream velocities
may also play a role. For instance, aquifer water supplying spring-fed systems in Florida is often
hypoxic (Rosenau et al. 1977), presumably due to the microbial remineralization of organic
substrates. Additionally, when aquifer water enters the surface waters of a system it often does
so at a very low velocity (Kurz 2004). Low dissolved oxygen concentration could preclude the
existence of periphyton grazers and low stream velocity could facilitate the accumulation of
periphyton by reducing the sheer force near the boundary layer surrounding macrophyte blades.
Together, these factors may facilitate a pattern of vegetation loss whereby areas of low dissolved
oxygen concentration may have low populations of periphyton grazers and low stream velocities,
which allows periphyton to accumulate, in the absence of scouring, to levels capable of
negatively impacting the growth of rooted macrophytes.
The Ichetucknee River, located in north central Florida, is predominantly spring-fed and a
reduction in the abundance of rooted macrophytes in the system has been observed over the past
decade in conjunction with an increase in periphyton (Evans 2007). These findings are
consistent with a nutrient enrichment scenario and the Ichetucknee River does show elevated
levels of nitrate and phosphorus (Kurz 2004). I propose, however, that the pattern of vegetation
loss is dependent on dissolved oxygen concentrations and stream velocities which, in
combination, control the presence of periphyton grazers and the magnitude of the scouring force
of water. I hypothesize specifically that the growth potential of macrophytes in areas of low
dissolved oxygen concentrations and low stream velocities will be compromised due to shading
from periphytic algae that accumulates in the slow flowing water and proliferates in the absence
of grazers.
11

CHAPTER 2 MATERIALS AND METHODS
Study Site
The Ichetucknee River is a tributary of the Santa-Fe River which is part of the larger
Suwannee River basin in north central Florida. The river is fed, in large part, by water derived
from the Floridan Aquifer. A 1st magnitude headspring serves as the origin of flow, though
numerous feeder springs along the river’s length also contribute to the river’s flow. Exceptional
water clarity is a hallmark of the Ichetucknee system and the main stem of the river is densely
populated by submersed aquatic vegetation. The dominant macrophyte throughout the system is
Sagittaria kurziana (Kurz et al. 2003); however, the smaller feeder springs along the main stem
of the Ichetucknee River are often nearly devoid of macrophytes (Kurz et al. 2004).
The Ichetucknee is home to a variety of fish species including Micropterus, Heterandria
and Lepomis species in addition to a rich benthic invertebrate community represented by
numerous chironomids, crustaceans, and molluscs (McKinsey and Chapman 1998, Mattson et al.
1995). Dominant grazers of periphyton in the system include chironomids and a pleurocerid
snail, Elimia floridensis, which grows to five centimeters in length and can live for nearly a
decade (Huryn et al. 1994). Recent research has shown that E. floridensis is more abundant in
the main stem of the Ichetucknee River than in the smaller spring runs (Dormsjo 2007), although
the presence of chironomids in the smaller spring runs has not been studied.
Quantitative River and Spring Survey
In January of 2007, a temporally focused effort provided estimates for several key
chemical and physical parameters as well as a quantitative characterization of submersed aquatic
vegetation and associated periphyton. All sampling was carried out at fourteen regularly-spaced
transects along 2 km of the main stem of the river as well as three transects along the runs of
12

three associated feeder springs, i.e. Singing Spring, Devils Eye Spring, Mill Pond Spring (Figure
2-1). Along each transect, three stations were sampled perpendicular to the direction of water
flow such that one station was sampled in mid-channel and the other two sampled halfway
between the bank of the river or spring run and the mid-channel station.
Chemical and Physical Parameters
Dissolved oxygen concentration (mgL-1), water temperature (oC), and pH were measured in
situ at a depth of 0.5 m with a Yellow Springs Instrument Company model 650 hand-held meter.
Water depth (m) was measured at all stations with a collapsible fiberglass survey rod marked in
0.01 m increments. Stream velocities (ms-1) were measured at two-thirds of the water column
depth with a Marsh-McBirney model 2000 portable flow meter recording 5-second averages. Li-
Cor Instruments, Inc. quantum light sensors were employed to simultaneously collect surface and
downwelling light intensity (umole photons s-1m-2 of photosynthetically active radiation, PAR) at
three depths spanning the water column. Light attenuation (Kd) at each station was determined
from the equation: Kd = [ln (Io / Iz)] / z, where Io is the incident irradiance at the water surface
and Iz is the light intensity at depth z (m) (Kirk 1994).
Vegetation Sampling
Submersed aquatic vegetation was collected at each station using a 0.0625-m2 quadrat,
constructed of 4-inch diameter PVC with 90o elbow joints (Figure 2-2). During construction, the
frame of the device was sliced in half transversely to make a top u-shape and a bottom u-shape.
These two halves were then connected by six-foot panels of 425-micron NITEX mesh. Four
panels were used in total, but one panel remained attached to the frame on only one side of the
device in order to eventually close the three-sided u-shape into a square. During deployment, the
quadrat was collapsed, inserted into the SAV canopy by SCUBA divers and placed on the river
bed in its, three-sided form (with the fourth panel tucked back). The fourth panel was then
13
brought across between the u-shape tips to close the shape into a full square quadrat. The fourth
panel was connected to the opposite side of the u-shape by a zipper spanning the entire six-foot
length of the panel. With the panel connected, the entire top u-shape of the quadrat could be
separated from the bottom u-shape resting on the river bed and lifted, while simultaneously
zippering the fourth panel to its adjacent compliment. This sample maneuver resulted in the
enclosure of all SAV within the confines of the quadrat. In this position, the apparatus was then
folded over on itself to cover the top hole of the device and the above-ground SAV was cut at the
sediment/water interface. As the sampler was removed from the canopy and placed aboard the
research vessel, all gastropods associated with the substrate beneath the sampler were collected
as part of a complementary effort. Onboard the boat, the sampler was opened and all vegetation
was inspected for gastropods. All gastropods were identified, recorded and returned to the river.
Data concerning gastropod abundance and distribution are reported elsewhere (Dormsjo 2007).
SAV samples were removed from the device and stored in a zip-lock bag on ice during transport
to the laboratory for additional processing. At the laboratory, any incidental below-ground
biomass associated with the harvested plants was removed and discarded. The remaining plant
material was blotted dry with a paper towel. All leaf lengths were measured (to the nearest mm)
and the wet weight of the entire sample was determined (to the nearest mg). Plants were
subsequently dried at 600C for >48 hr to determine a dry weight.
Quantifying Periphyton Associated with SAV
Periphyton associated with SAV at each sample station was measured according to the
method originally outlined by Moss (1981) and subsequently modified by Canfield and Hoyer
(1988). First, a single blade of the dominant macrophyte at each sampling station was removed
from the river and placed in a 1-L Nalgene jar, pre-filled with 500 ml of deionized water.
Periphyton was then removed from the host macrophyte sample by vigorously shaking the 1-L
14

Nalgene jar containing the sample for 30 seconds. The resultant slurry was filtered through a 1-
mm screen into a Nalgene beaker. Fresh deionized water was added to the Nalgene jar and the
shaking / filtering process was repeated for a total of three times. The resultant slurry after three
shaking processes was homogenized and a sub-sample of known volume was filtered through a
Gelman type A/E 47 mm glass-fiber filter. The remaining volume of slurry was noted and the
filters were stored frozen prior to analysis of chlorophyll (APHA 1995).
Translocation Experiment
In addition to the river survey, a field experiment was performed in March 2007 to
quantify the rate of periphyton accumulation on macrophytes in the main river and feeder springs
and assess the potential influence of that periphyton accrual on macrophyte growth. This
experiment involved the relocation of individual, standardized genets of S. kurziana into cleared
plots within the river and three adjacent feeder springs, i.e. Singing Spring, Devil’s Eye Spring,
and Mill Pond Spring. The use of translocated genets of S. kurziana was intended to reduce any
intrinsic variability between resident river and spring plants.
The genets of S. kurziana selected for the study were harvested near the confluence of
Devil’s Eye Spring run and the main river. Chosen for their morphological uniformity, the 225
plants were severed from their stolon connections and individually placed in terra cotta pots with
sandy substrate and a sponge lid to secure the contents throughout the experiment. All potted
plants were placed into the main river channel in three groups of 75. Groups were placed just
upstream of the confluence of the main stem of the river and each of the three feeder springs, i.e.
Singing Spring, Devil’s Eye Spring, and Mill Pond Spring. The substrate at each location was
cleared of SAV to ensure an adequate light environment for the study plants. The potted plants
were allowed one week of acclimation after which, all plants were rubbed clean of periphyton by
hand and cut to a standardized blade length of approximately 7.5 cm. Immediately after
15

standardization, 25 plants were harvested for initial measurements of plant biomass and
periphyton abundance. Half of the remaining 50 plants were moved to their respective feeder
springs and arrayed just downstream of the primary spring vent. The 25 remaining plants were
left in the river channel at the acclimation location and all plants were observed bi-weekly for 4
weeks. After 4 weeks, all experimental plants from the river and spring locations were harvested
and measures of plant biomass and periphyton abundance were made following the methods
previously described. Abiotic metrics were also sampled for a comparison of pre- and post-
experimental conditions.
Statistical Analyses
Standard ANOVA procedures were used to test for differences in chemical, physical and
biological characteristics between the main river transects and feeder spring transects (JMP IN v.
5.1 1989). Normality was assessed with the Shapiro-Wilk test and the assumption of equal
variance verified with a Brown-Forsythe test. All plant biomass and periphyton abundance data
were log10+1 transformed to improve normality and heteroscedasity.
16

Figure 2-1. Map of the Ichetucknee River course through the Ichetucknee Springs State Park.
All transect sampling was carried out in the upper portion of the river within the confines of the park. Experimental work was conducted near Singing Spring, Devils Eye (also known as Boiling Spring) and Mill Pond Spring.
17

18
Figure 2-2. Collapsed and expanded view of plant sampling apparatus.

CHAPTER 3 RESULTS
Survey Results
Mean dissolved oxygen concentration in the main stem of the river ranged between 3.2 and
7.4 mg L-1 and exhibited a general increase between feeder spring influences (Figure 3-1). Mean
dissolved oxygen concentrations did not differ between the feeder springs (Mean value + SE;
Singing Spring = 1.57 mgL-1 ± 0.28; Devil’s Eye Spring = 1.05 mgL-1 ± 0.13; Mill Pond Spring
= 1.40 mgL-1 ± 0.49) (ANOVA; df = 2, F = 0.56, P = 0.60). Relative to the three feeder springs,
the main river exhibited significantly higher dissolved oxygen concentrations (ANOVA; df = 1,
F = 86.31, P = <0.0001) (Figure 3-2).
Mean stream velocity in the main stem of river ranged between 0.04 and 0.30 ms-1 and
exhibited a general increase between feeder spring influences (Figure 3-3). Mean stream
velocity did not differ between the feeder springs (Mean value ± SE; Singing Spring = 0.04 ms-1
± 0.013; Devil’s Eye Spring = 0.04 ms-1 ± 0.0083; Mill Pond Spring = 0.05 ms-1 ± 0.016)
(ANOVA; df = 2, F = 0.168, P = 0.85). Relative to the three feeder springs, the main river
exhibited significantly higher stream velocities (ANOVA; df = 1, F = 11.63, P = 0.003) (Figure
3-4).
Mean periphyton abundance on macrophytes within the main stem of river ranged
between 0.014 and 0.068 mg chl a g WW-1 and showed a trend of decreasing abundance between
feeder spring influences (Figure 3-5). Mean periphyton abundance on plants did not differ
between the three feeder springs (Mean value ± SE; Singing Spring = 0.30 mg chl a g WW-1 ±
0.13; Devil’s Eye Spring = 0.42 mg chl a g WW-1 ± 0.16; Mill Pond Spring = 0.19 mg chl a g
WW-1 ± 0.02) (ANOVA; df = 2, F = 0.48, P = 0.64). Overall, the mean periphyton abundance in
19
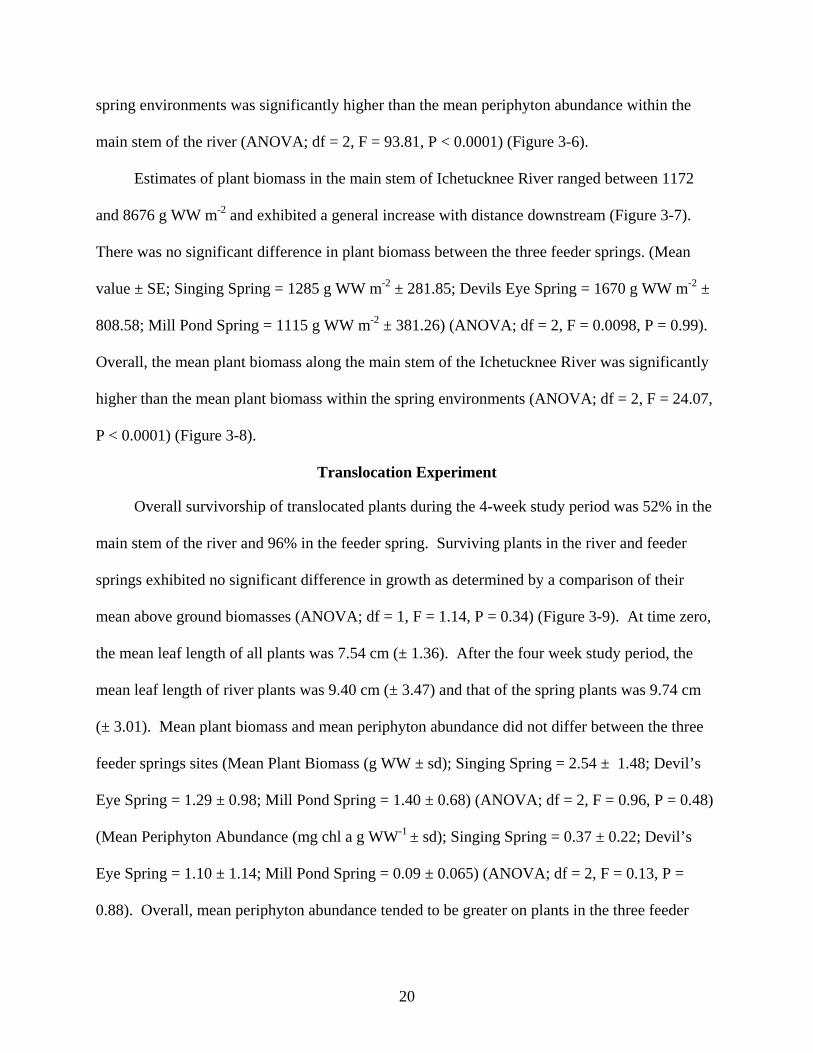
spring environments was significantly higher than the mean periphyton abundance within the
main stem of the river (ANOVA; df = 2, F = 93.81, P < 0.0001) (Figure 3-6).
Estimates of plant biomass in the main stem of Ichetucknee River ranged between 1172
and 8676 g WW m-2 and exhibited a general increase with distance downstream (Figure 3-7).
There was no significant difference in plant biomass between the three feeder springs. (Mean
value ± SE; Singing Spring = 1285 g WW m-2 ± 281.85; Devils Eye Spring = 1670 g WW m-2 ±
808.58; Mill Pond Spring = 1115 g WW m-2 ± 381.26) (ANOVA; df = 2, F = 0.0098, P = 0.99).
Overall, the mean plant biomass along the main stem of the Ichetucknee River was significantly
higher than the mean plant biomass within the spring environments (ANOVA; df = 2, F = 24.07,
P < 0.0001) (Figure 3-8).
Translocation Experiment
Overall survivorship of translocated plants during the 4-week study period was 52% in the
main stem of the river and 96% in the feeder spring. Surviving plants in the river and feeder
springs exhibited no significant difference in growth as determined by a comparison of their
mean above ground biomasses (ANOVA; df = 1, F = 1.14, P = 0.34) (Figure 3-9). At time zero,
the mean leaf length of all plants was 7.54 cm (± 1.36). After the four week study period, the
mean leaf length of river plants was 9.40 cm (± 3.47) and that of the spring plants was 9.74 cm
(± 3.01). Mean plant biomass and mean periphyton abundance did not differ between the three
feeder springs sites (Mean Plant Biomass (g WW ± sd); Singing Spring = 2.54 ± 1.48; Devil’s
Eye Spring = 1.29 ± 0.98; Mill Pond Spring = 1.40 ± 0.68) (ANOVA; df = 2, F = 0.96, P = 0.48)
(Mean Periphyton Abundance (mg chl a g WW-1 ± sd); Singing Spring = 0.37 ± 0.22; Devil’s
Eye Spring = 1.10 ± 1.14; Mill Pond Spring = 0.09 ± 0.065) (ANOVA; df = 2, F = 0.13, P =
0.88). Overall, mean periphyton abundance tended to be greater on plants in the three feeder
20

springs than in the main river, although this difference was not statistically significant (ANOVA;
df = 2, F = 2.68, P = 0.18) (Figure 3-10).
21

Table 3-1. Summary of 2007 Survey Data – Means ± Standard Errors (n = # of samples)
Plant
Biomass Periphyton Abundance
Dissolved Oxygen
Stream Velocity
Water Depth
Section (gWW m-2 ) (mg chl a g WW-1 ) (mgL-1) (ms-1) (m) River 4417 ± 611 0.03 ± 0.005 5.18 ± 0.31 0.133 ± 0.02 1.14 ± 0.09
(n=14) (n=14) (n=14) (n=14) (n=14)
Spring 1357 ± 283 0.30 ± 0.07 1.34 ± 0.19 0.05 ± 0.007 0.83 ± 0.20 (n=9) (n=9) (n=9) (n=3) (n=3)
22
Figure 3-1. Mean dissolved oxygen concentration with increasing distance downstream in the
main stem of the Ichetucknee River. Numbers along the x-axis correspond to river transects with ascending values representing distance downstream.
23

Figure 3-2. Mean dissolved oxygen concentration in the main stem of the Ichetucknee River and
three associated feeder springs (i.e. Singing Spring, Devil’s Eye Spring, and Mill Pond Spring).
24

Figure 3-3. Mean stream velocity with increasing distance downstream in the main stem of the
Ichetucknee River. Numbers along the x-axis correspond to river transects with ascending values representing distance downstream.
25

Figure 3-4. Mean stream velocity in the main stem of the Ichetucknee River and three associated
feeder springs (i.e. Singing Spring, Devil’s Eye Spring, and Mill Pond Spring).
26

Figure 3-5. Mean periphyton abundance with increasing distance downstream in the main stem
of the Ichetucknee River. Numbers along the x-axis correspond to river transects with ascending values representing distance downstream.
27

Figure 3-6. Mean periphyton abundance in the main stem of the Ichetucknee River and three
associated feeder springs (i.e. Singing Spring, Devil’s Eye Spring, and Mill Pond Spring).
28

Figure 3-7. Mean plant biomass with increasing distance downstream in the main stem of the
Ichetucknee River. Numbers along the x-axis correspond to river transects with ascending values representing distance downstream.
29

Figure 3-8. Mean plant biomass in the main stem of the Ichetucknee River and three associated
feeder springs (i.e. Singing Spring, Devil’s Eye Spring, and Mill Pond Spring).
30

Figure 3-9. Mean plant biomass in the main stem of the Ichetucknee River and three associated
feeder springs (i.e. Singing Spring, Devil’s Eye Spring, and Mill Pond Spring) following a four week translocation experiment.
31

32
Figure 3-10. Mean periphyton abundance in the main stem of the Ichetucknee River and three
associated feeder springs (i.e. Singing Spring, Devil’s Eye Spring, and Mill Pond Spring) following a four week translocation experiment.

CHAPTER 4 DISCUSSION
The proposed pattern of interaction between dissolved oxygen, stream velocity, grazer
abundance, and periphyton abundance on host macrophytes was well supported by the
observations made during the survey of the Ichetucknee River and its feeder springs (see also
Dormsjo 2007). Dissolved oxygen concentrations were consistently low near spring sources
regardless of whether the spring source was the headspring of the river, any one of the three
feeder springs, or the many spring/river confluences along the main stem course. This finding is
consistent with data reported previously (Kurz et al. 2003 and 2004). Stream velocity, plant
biomass, and grazer abundance exhibited a similar pattern; lowest values for all the
aforementioned parameters occurred near spring sources (see also Dormsjo 2007). These
findings too are similar to those reported by Kurz et al. (2003 and 2004). As hypothesized,
periphyton abundance values were inversely related to dissolved oxygen, stream velocity, grazer
abundance, and plant biomass values. Where dissolved oxygen, stream velocity, grazer
abundance, and plant biomass values were low, periphyton abundance on host plants was high.
Literature on lotic systems suggests that the patterns reported here exhibit some generality.
For example, Sabater et al. (2000) found that benthic algal biomass in the Oria River, a Spanish
river with intense human activity in its watershed, was highest in locations where diel variations
in dissolved oxygen concentrations resulted in acute hypoxia. Episodes of hypoxia in areas of
high algal biomass in the Oria River have been linked to herbivorous fish kills (Sabater 2000)
suggesting that oxygen mediated grazing impacts are likely to be an important process in lotic
systems.
Additionally, stream velocity is often reported as a significant variable affecting both
periphyton and macrophyte abundance. Chambers et al. (1991) showed that sudden increases in
33

current velocity in two slow-flowing rivers in Canada resulted in decreased plant biomass
through uprooting. It’s a logical assumption that periphyton abundance on macrophytes within
the same rivers would also decrease with increasing current velocity. For example, Giorgi et al.
(2005) observed that attached algal biomass decreased during times of flood in Pampean streams
suggesting that increasing current velocity exerts a significant scouring force on periphyton
communities. Similar conclusions have been reported by several additional research efforts (e.g.,
Birkett et al. 2007, Katano et al. 2005, Arnon et al. 2007).
The results of the translocation experiment following the quantitative river survey were
likely confounded by the low survival rates of S. kurziana in the main stem of the river and the
short duration of the study. While 96% of the plants in the feeder springs survived, river plants
exhibited a relatively large loss (48%) resulting in few data for statistical comparison of
periphyton abundance on host plants between the main river and springs. Nevertheless, the rate
of periphyton accrual on plants in the feeder springs was marginally greater than on plants in the
main stem of the river. This finding is consistent with my hypothesis, but I was unable to detect
any statistically significant difference in plant growth that might be attributed to an increase in
periphyton load.
Some mortality of the translocated plants was expected during this experiment as short-
term mortality is common in such studies. For example, Zimmerman, et al. (1995) transplanted
Zostera marina, a functionally similar marine macrophyte, in San Francisco Bay, CA, and
reported high initial losses. Additionally, Hauxwell et al. (2003) transplanted Vallisneria
americana (a plant commonly found with S. kurziana) in Kings Bay, FL in 2001 and 2002 and
observed high initial mortality. In both cases, the investigators emphasized the importance of
transplant timing and experiment duration in relocation success (Zimmerman et al. 1995,
34

Hauxwell et al. 2003). Zimmerman et al. (1995) pointed out that although the eelgrass
transplants in San Francisco Bay, CA were partially successful, transplant survival could have
been improved by taking into account the role of carbon reserves when timing a transplant event
(Zimmerman et al. 1995). Hauxwell et al. (2003) suggested that similar transplant experiments
should run for 1-2 years to ensure natural growth responses from the transplants. The four-week
experimental period chosen for this study was necessary due to the high human use and
disturbance of the system during the summer months. Subsequent efforts to determine the
effects of periphyton accumulation on macrophyte growth in the Ichetucknee River will likely
require some intervention to lessen such impacts.
In addition to transplant duration and timing, it should be noted that experimental plants in
the main stem of the river were maintained at depths of approximately 1.5 m whereas plants in
the feeder springs were maintained at approximately 0.75 m. Although water clarity in the
Ichetucknee system is superb, it is possible that slight differences in water depth contributed to
plant loss in the main river as a consequence of increased light attenuation. The topography of
the Ichetucknee River dictated the depth at which the translocated plants would be placed and so
no depth standardization was possible. It is unclear whether differences in depth influenced the
experimental outcome, but light attenuation has a strong influence on the distribution and
abundance of aquatic macrophytes and many studies have shown a negative relationship between
increased light attenuation and the biomass of aquatic macrophytes (e.g., De Boer 2007, Loiselle
et al. 2007).
Despite the problems associated with plant transplant and translocation, the surviving
plants from this study did provided a natural substrate for a first order approximation of the rate
of periphyton accumulation. The periphyton loads on macrophytes in the Ichetucknee River
35

36
after only a four-week period were similar to standing crop values previously reported in the
river by Kurz et al. (2004). In 2004, mean periphyton abundance was 0.15 mg chl a gWW-1 in
the main stem of the Ichetucknee River and 0.61 mg chl a gWW-1 in the feeder springs. In 2007
(this study), mean periphyton abundance was 0.09 mg chl a gWW-1 in the main stem of the
Ichetucknee River and 0.52 mg chl a gWW-1 in the feeder springs. Interestingly, average rates of
stream velocity in the main stem of the Ichetucknee River during 2007 (0.133 ms-1) were lower
than those in 2004 (0.160 ms-1) as a consequence of a regional drought that affected spring
discharge. Despite these slight differences, my stream velocity and periphyton abundance results
are consistent with previous work relating the two variables (Kurz et al. 2003 and 2004). Results
from this investigation reinforce the need for additional studies on flow rates and periphyton
accrual in this system and how these factors might interact with others such as changes in
nutrient loads, oxygen concentrations, light availability and grazing to affect the structure and
function of the ecological community.
LIST OF REFERENCES
APHA (American Public Health Association) (1995) Standard methods for the examination of water and wastewater. 19th edition. American Public Health Association, American Water Works Association, and Water Pollution Control Federation, Washington DC
Arnon S, Packman AI, Peterson CG, Gray KA (2007) Effects of overlying current velocity on
periphyton structure and denitrification. Journal of Geophysical Research – Biogeosciences 112(G1): Art No G01002
Barko JW, Smart RM (1986) Sediment related mechanisms of growth limitation in submerged
macrophytes. Ecology 67(5): 1328-1340 Birkett C, Tollner EW, Gattie DK (2007) Total suspended solids and flow regime effects on
periphyton development in a laboratory channel. Transactions of the Asabe 50(3): 1095-1104
Caccia VG, Boyer JN (2007) A nutrient loading budget for Biscayne Bay, FL. Marine Pollution
Bulletin 54(7): 994-1008 Canfield DE, Hoyer MV (1988) The nutrient assimilation capacity of the Little Wekiva River:
Final Report District of Public Works, City of Altamonte Springs, FL. 288pp Chambers PA, Prepas EE, Hamilton HR, Bothwell ML (1991) Current velocity and its effect on
aquatic macrophytes in flowing waters. Ecological Applications 1(3): 249-257 De Boer WF (2007) Seagrass-sediment interactions, positive feedbacks and critical thresholds
for occurrence: a review. Hydrobiologia 591: 5-24 Dormsjo KK (2007) Oxygen mediated grazer impacts in Florida springs. Dissertation University
of Florida, Gainesville, FL USA Duarte CM (1995) Submerged aquatic vegetation in relation to different nutrient regimes.
Ophelia 41: 87-112 Ghosh M, Gaur JP (1991) Regulatory influence of water current on algal colonization in an
unshaded stream at Shillong (Meghalaya, India). Aquatic Botany 40(1): 37-46 Giorgi A, Feijoo C, Tell G (2005) Primary producers in a Pampean stream: temporal variation
and structuring role. Biodiversity and Conservation 14(7): 1699-1718 Hauxwell JA, Frazer TK, Osenberg CW (2003) Effects of herbivores and competing primary
producers on Vallisneria Americana in Kings Bay: implications for restoration and management. Final report for the SWFWMD 68 pp
37
Heck KL, Valentine JF, Pennock JR, Chaplin G, Spitzer PM (2006) Effects of nutrient enrichment and grazing on shoalgrass Halodule wrightii and its epiphytes: results of a field experiment. Marine Ecology Progress Series 326: 145-156
Hill WR, Ryon MG, Schilling EM (1995) Light limitation in a stream ecosystem: responses by
primary producers and consumers. Ecology 76(4): 1297-1309 Huryn A, Koebel JW, Benke AC (1994) Life history and longevity of the pleurocerid snail
Elimia: a comparative study of eight populations. Journal of the North American Benthological Society 13(4): 540-556
JMP IN v. 5.1 (1989) SAS Institute, Inc Jowett IG, Biggs BJF (1997) Flood and velocity effects on periphyton and silt accumulation in
two New Zealand rivers. New Zealand Journal of Marine and Freshwater Research 31(3): 287-300
Katano I, Mitsuhashi H, Isobe Y, Sato H, Oishi T (2005) Reach-scale distribution dynamics of a
grazing stream insect, Micrasema quadriloba martynov (Brachycentridae, Trichoptera), in relation to current velocity and periphyton abundance. Zoological Science 22(8): 853-860
Kirk, JTO (1994) Light and Photosynthesis in Aquatic Ecosystems. Cambridge University Press:
New York 401pp Kurz RC, Sinphary P, Hershfeld WE, Krebs AB, Peery AT, Woithe DC, Notestein SK, Frazer
TK, Hale JA, Keller SR (2003) Mapping and monitoring submerged aquatic vegetation in Ichetucknee and Manatee Springs. Final report for the Suwannee River Water Management District. 50 pp
Kurz RC, Woithe DC, Notestein SK, Frazer TK, Hale JK, Keller SR (2004) Mapping and
monitoring submerged aquatic vegetation in Ichetucknee Springs-2004. Final report for the Suwannee River Water Management District. 35pp
Loiselle SA, Cozar A, Dattilo A, Bracchini L, Galvez JA (2007) Light limitations to algal growth
in tropical ecosystems. Freshwater Biology 52(2): 305-312 Mattson RA, Epler JH, Hein MK (1995) Description of benthic communities in karst, spring-fed
streams of north central Florida. Journal of the Kansas Entomological Society 68(2): 18-41
McKinsey DM, Chapman LJ (1998) Dissolved oxygen and fish distribution in a Florida Spring.
Environmental Biology of Fishes 53: 211-223
38

39
Moss B (1981) The effect of fertilization and fish on community structure and biomass of aquatic macrophyte and epiphytic algae populations: An ecosystem experiment. Journal of Ecology 64: 313-342
Notestein SK, Frazer TK, Hoyer MV, Canfield DE (2003) Nutrient limitation of periphyton in a
spring-fed, coastal stream in Florida, USA. Journal of Aquatic Plant Management 41:57-60
Odum HT (1957) Trophic structure and productivity of Silver Springs, Florida. Ecological
Monographs 27(1): 55-112 Rosenau JC, Faulkner GL, Hendry CW Jr., Hull RW (1977) Springs of Florida. Florida
Geological Survey – Geological Bulletin No 31, revised. From http://www.flmnh.ufl.edu/springs_of_fl/aaj7320/content.html
Sabater S, Armengol J, Comas E, Sabater F, Urrizalqui I, Urrutia I (2000) Algal biomass in a
disturbed Atlantic river: water quality relationships and environmental implications. Science of the Total Environment 263(1-3): 185-195
Turner ER, Rabalais NN (1994) Coastal eutrophication near the Mississippi River delta. Nature
368: 619-621. Wright RM, McDonald AJ (1986a) Macrophyte growth in shallow streams. Field investigations.
Journal of Environmental Engineering 112: 952-966 Wright RM, McDonald AJ (1986b) Macrophyte growth in shallow streams. Biomass model.
Journal of Environmental Engineering 112: 967-981 Zimmerman RC, Reguzzoni JL, Alberte RS (1995) Eelgrass (Zostera marine L) transplants in
San-Francisco Bay – role of light availability on metabolism, growth and survival. Aquatic Botany 51(1-2): 67-86

BIOGRAPHICAL SKETCH
Vince Politano graduated summa cum laude from the University of Rhode Island with a
Bachelor of Science degree in marine biology. He completed his Master of Science degree at the
University of Florida in the Department of Fisheries and Aquatic Sciences.
40