FACTORS AFFECTING HOUSEHOLD PARTICIPATION IN … · FACTORS AFFECTING HOUSEHOLD PARTICIPATION IN...
113
FACTORS AFFECTING HOUSEHOLD PARTICIPATION IN NON-TIMBER FOREST PRODUCTS MARKET IN EASTERN UGANDA BY MOUBARAKATOU TASSOU A thesis submitted to the Department of Agricultural Economics in Partial Fulfilment of the requirements for the award of a Master of Science Degree in Agricultural and Applied Economics, University of Nairobi July 2017
Transcript of FACTORS AFFECTING HOUSEHOLD PARTICIPATION IN … · FACTORS AFFECTING HOUSEHOLD PARTICIPATION IN...
FACTORS AFFECTING HOUSEHOLD PARTICIPATION IN NON-TIMBER FOREST
PRODUCTS MARKET IN EASTERN UGANDA
BY
MOUBARAKATOU TASSOU
A thesis submitted to the Department of Agricultural Economics in Partial Fulfilment of the
requirements for the award of a Master of Science Degree in Agricultural and Applied
Economics, University of Nairobi
July 2017
i
DECLARATION
I declare that this thesis is my original work and has not been submitted for the award of a degree
in any other university.
Signature: ………………. Date: …………………..
Moubarakatou Tassou
Reg: A56/75579/2014
This thesis has been submitted for examination with our approval as supervisors:
Signature: ………………. Date: ……………………
Dr. Cecilia Ritho
Department of Agricultural Economics, University of Nairobi
Signature: ………………… Date: …………………….
Dr. Amos Gyau
World Agroforestry Centre

ii
DEDICATION
This thesis is dedicated to my family whose love and support has continually inspired my academic
life.

iii
ACKNOWLEDGEMENTS
I am grateful to World Agroforestry Center (ICRAF) for funding this research under the project
“Value chain innovation platforms for food security”. I am highly indebted to my supervisors Dr.
Cecilia Ritho and Dr. Amos Gyau for their invaluable guidance, advice, constructive criticism and
encouragement. My special gratitude goes to Dr. Judith Oduol and Dr Patrick Irungu for their
guidance.
My exceptional appreciation goes to the African Economic Research Consortium (AERC) for
facilitating my third semester studies at the University of Pretoria. I also thank the Intra ACP-UE
Arise program for sponsoring my master studies at the University of Nairobi. I am grateful to the
CMAAE program and lecturers who equipped me with important skills that contributed immensely
to the success of this research. I appreciate households in Kapchorwa and Manafwa districts who
took part in the survey for their time and patience. I also thank the enumerators involved in data
collection for their committed effort to collect reliable data during fieldwork. Lastly I thank my
colleagues whose moral and material support during course work was timely. All these efforts bore
fruit through God’s abundant love, grace and mercy.
iv
ABSTRACT
It is recognized that non-timber forest products can contribute to poverty alleviation in areas with high poverty
rate like Eastern Uganda. These products are particularly vital for the rural poor who collect them for diverse
needs and functions. Therefore the Ugandan Government has recently focused on developing markets for
non-timber forest products (NTFPs). This is also due to the surging demand for NTFPs, driven by increased
consumer’s awareness of their medicinal, nutritional and economic value. In Uganda the markets of NTFPs
are not yet as developed as that of staple food. Furthermore, there is little information about factors that
influence household decision to collect or produce NTFPs as well as their decision to sell them in Uganda.
The identification of these factors will help the Uganda Government in designing effective programs to boost
households’ income in the short term and enable the sustainable use of forest resources in a way that they will
be available for use by the future generation. Using data from a sample of 633 households selected through
multistage sampling procedure, this study assesses factors affecting households’ decision to collect or produce
NTFPs using a Probit model and identifies factors affecting households’ choice of a source of NTFPs using
a Probit model. The study also analyses the determinants of households’ decision to sell NTFPs by use of a
Probit model. The study found that the household characteristics (age, household size and wealth status) and
other characteristics (agro-ecological zones and access to agricultural and market information) significantly
affect household decision to participate in NTFPs or not as collector or producer. Household and farm
characteristics (farm size, age, presence of trees on farm and occupation of the head of household) and other
characteristics (agro-ecological zones and access to agricultural and market information) had a significant
effect on household decision to collect NTFPs from the forest instead of producing them on farm. In addition,
household and farm characteristics (education of the head of household, gender, presence of trees on farm and
wealth status) and agro-ecological zones significantly affect household decision to sell NTFPs. Therefore the
study recommends as follows: stakeholders should promote sound extension services on appropriate
v
agroforestry practices in the lowland communities. This is considering the land poor households who rarely
plant trees on their farm. Poor households should be encouraged to invest more in NTFPs extraction and
selling in order to take advantage of the growing market for products with high premium price. There is also
a need for concerted effort among policy makers, non-governmental organizations and other stakeholders
towards improving women participation in harvesting and marketing of NTFPs in the study area.
vi
TABLE OF CONTENTS
DECLARATION ............................................................................................................................ i
DEDICATION ............................................................................................................................... ii
ACKNOWLEDGEMENTS .......................................................................................................... iii
ABSTRACT .................................................................................................................................. iv
TABLE OF CONTENTS .............................................................................................................. vi
LIST OF TABLES ........................................................................................................................ ix
LIST OF FIGURES ....................................................................................................................... x
ACRONYMS AND ABBREVIATIONS ..................................................................................... xi
CHAPTER 1: INTRODUCTION .................................................................................................. 1
1.1 Background ......................................................................................................................... 1
1.2 Statement of the research problem ...................................................................................... 4
1.3 Objectives and hypotheses .................................................................................................. 6
1.4 Justification .......................................................................................................................... 7
1.5 Organisation of the Study ..................................................................................................... 8
CHAPTER 2: LITERATURE REVIEW ....................................................................................... 9
2.1 Definition and classification of non-timber forest products ................................................ 9
2.2 Contribution of Forest to Household Livelihoods ............................................................... 9
2.2.1 Contribution of Forest to Livelihood Assets ............................................................... 10
2.2.2 Contribution of Forest to Livelihood Capabilities ...................................................... 11
2.2.3 Contribution of Forest to Livelihood Activities .......................................................... 11
2.3 Adoption of agroforestry practices by households in Sub-Sahara Africa .......................... 14
2.4 Harvesting technologies for non-timber forest products .................................................... 16
2.5 Factors affecting households decision to participate or not in non-timber forest
products as producer or collector ...................................................................................... 17
2.6 Market for Non-Timber Forest Products ............................................................................ 22
vii
2.7 Factors Affecting Households Participation in Non-timber forest products Markets
as seller .............................................................................................................................. 23
CHAPTER 3: METHODOLOGY ............................................................................................... 30
3.1 Conceptual Framework ...................................................................................................... 30
3.2 Theoretical Framework ..................................................................................................... 31
3.3 Empirical Methods used in the Three Hurdle Decision Making Process .......................... 34
3.4 Empirical studies that used Probit model ........................................................................... 35
3.5 Estimating Equations.......................................................................................................... 36
3.6 Variables hypothesized to influence households in the three decision making
process ............................................................................................................................... 38
3.7 Study Areas ........................................................................................................................ 40
3.8 Sampling Design and Data Collection ............................................................................... 43
3.8.1 Sampling Design ......................................................................................................... 43
3.8.2 Data collection procedure ........................................................................................... 45
3.8.3 Data analysis ............................................................................................................... 45
CHAPTER 4: RESULTS AND DISCUSSION ........................................................................... 48
4.1 Socio-Economic Characteristics that affect Collection or Production of NTFPs by
Households ........................................................................................................................ 48
4.1.1 Household and Farm Characteristics .......................................................................... 48
4.1.2 Main occupation of the respondents ........................................................................... 50
4.1.3 Sources of non-timber forest products ........................................................................ 50
4.1.4 Non-timber forest products collected from the forest or produced on farm ............... 51
4.2 Household Socioeconomic Characteristics that affect market participation ...................... 52
4.2.1 Households Characteristics ......................................................................................... 52
4.2.2 Other Characteristics ................................................................................................... 53
4.2.3 Distribution of non-timber forest products sold by households.................................. 57
4.3 Factors affecting households’ decision to participate in NTFPs or not as
collector or producer ......................................................................................................... 58
4.4 Factors affecting households decision to produce NTFPs on farm or to collect them
form the forest ................................................................................................................... 60
viii
4.5 Factors affecting households decision to participate in non-timber forest
products market ................................................................................................................. 64
CHAPTER 5: SUMMARY, CONCLUSION AND RECOMMENDATIONS .......................... 67
5.1 Summary ........................................................................................................................... 67
5.2 Conclusion .......................................................................................................................... 68
5.3 Recommendations .............................................................................................................. 72
6.0: REFERENCES ..................................................................................................................... 74
7.0: APPENDICES ...................................................................................................................... 91
Appendix 1: Results of the multicollinearity tests ....................................................................... 91
Appendix 2: Survey questionnaire ................................................................................................. 1
ix
LIST OF TABLES
Table 3.1: Variables hypothesized to influence households’ decision to participate in
NTFPs or not as collector or producer ....................................................................... 38
Table 3.2: Variables hypothesized to influence households’ decision to grow NTFPs on
farm or to collect NTFPs from the forest ................................................................... 39
Table 3.3: Variables hypothesized to influence households’ decision to sell NTFPs ................. 40
Table 4.1 Socioeconomics characteristics of respondents ........................................................... 49
Table 4.2: Sources of non-timber forest products ........................................................................ 51
Table 4.3: Non-timber forest products collected grouped by site of collection ........................... 52
Table 4.4: Household characteristics ........................................................................................... 53
Table 4.5: Comparing group membership, wealth status, infrastructure, access to
information and credit among households ................................................................. 56
Table 4.6: Non-timber forest products sold by source of collection ............................................ 58
Table 4.7: Result of the Probit model for the determinants of households decision to
collect or produce non-timber forest products ........................................................... 59
Table 4.8: Result of the Probit model for the determinants of households decision to
produce NTFPs on farm or to collect from the forest ................................................ 61
Table 4.9: Results of the Probit model for the factors affecting households’ decision to
participate in non-timber forest products market ....................................................... 65
x
LIST OF FIGURES
Figure 3. 1: Conceptual framework for the linkage between socioeconomics characteristics
of households and their decisions in the three hurdles ............................................. 32
Figure 3. 2: Map of the study area ............................................................................................... 42
xi
ACRONYMS AND ABBREVIATIONS
CARPE: Central African Regional Program for the Environment
FAO: Food and Agriculture Organization
FOSA: Forestry Outlook Studies in Africa
IFAD: International Fund for Agricultural Development
IFPRI: International Food Policy Research Institute
IUCN: International Union for Conservation of Nature
MEAAI: Ministry of Economic Affairs, Agriculture and Innovation
MoFPED: Ministry of Finance, Planning and Economic Development
NAAD: National Agricultural Advisory Services
NaFORRI: National Forestry Resources Research Institute
NDPII: Second National Development Plan
NEMA: National Environment Management Authority
NTFPs: Non-Timber Forest Products
UBOS: Uganda Bureau of Statistics
UMCA: University of Missouri Center for Agroforestry
UNEP: United Nations Environment Program
US$: United States of America Dollars
1
CHAPTER 1: INTRODUCTION
1.1 Background
Sustaining forests is important to food security of the poor because they rely on its products
(Pimentel et al., 1997). In developing countries about 220 million people are food insecure (IFAD,
2015). In Uganda about 9 million people suffer from food insecurity and even those who have
food, don’t eat in a balanced manner (FAO, 2015). These people tend to rely on a range of
strategies to cope with periods of food insecurity (Shumsky et al., 2014). The strategies include
measures such as reducing food intake or selling livestock for income. Non-timber forest products
(NTFPs) are defined as any forest-derived tradable products apart from timber and have been
identified as an important way for households in developing countries to adapt to food insecurity
situations (Neumann and Hirsch, 2000).
Non-timber forest products include products such as bark, roots, tubers, leaves, fruits, flowers,
seeds, resins, honey, mushrooms, and fuelwood (Sunderland et al., 2003). It is estimated that about
60 percent of the population in Sub-Sahara Africa live and work near forested land (Mulenga et
al., 2011). They rely on NTFPs in order to satisfy their basic needs such as income, food, medicine,
wood, fodder for animals, shade and soil fertilization (Belem et al., 2007). For example fuelwood
is collected for subsistence and income generation while wild fruits and leaves are also collected
because they are the major source of micronutrients for rural households (Sunderland et al., 2013).
Hence NTFPs is important to rural households in developing countries
because they contribute to their nutrition and provides income which may be used to buy food for
the family (Shackleton and Shackleton, 2004).
2
Population growth has increased the demand for forest products leading to severe pressure on
forest products by people living around forested areas (Rademaekers et al., 2010). For example in
Sub-Sahara Africa, fuelwood and charcoal remain the main source of fuel for populations in rural
and urban areas (MEAAI, 2010). In developing countries about 15 million people earn their
income from forest-related activities such as fuelwood and charcoal sales, commercial hunting,
and handicraft production (Kaimowitz, 2003).
Agroforestry is a practice that combines trees or shrubs with crops or livestock, it has been
encouraged to curb deforestation (UMCA, 2015). It has the advantages to increase social,
economic and environmental benefits for smallholder farmers (Lenkey, 1996). Agroforestry
produces non-timber forest products for commercial purposes. For example, Jamnadass et al.,
(2011) reported that in Kenya and Malawi, respectively 90 percent and 50 percent of households
practicing agroforestry grew fruit trees such as Avocado (Persea americana), Mango (Mangifera
indica), Papaya (Carica papaya) and Orange (Citrus sinensis). In Nigeria NTFPs such as nuts,
mushrooms, wild fruit, herbs, spices, honey and bamboo are part of the diet of many rural dwellers
especially during the period of food scarcity (Jimoh, 2006). According to Fentanun and Hager
(2009) NTFPs are consumed by many households as food supplements in Ethiopia.
Non-timber forest products enable the sustainable use of forest resources; using resources in a way
that they will be available for use by the future generation. Unlike timber, NTFPs are by products
that depend on availability of forests and hence its conservation by users. NTFPs are collected by
rural households for diverse products and functions, they are particularly vital for the rural poor,
who are mainly women and youth (Kamara, 1986). Furthermore, Shackleton et al., (2011)
concluded that women are most of the time responsible for non-timber forests products (NTFPs)
3
related activities; for income, fuel and craft materials (Neumann and Hirsch, 2000). Therefore,
promotion of NTFPs is an avenue for women empowerment and poverty reduction at large
(Shillington, 2002).
Uganda’s population is estimated at 30.7 million and 50 percent of these are women (UBOS,
2009). Like most developing countries, agriculture is the backbone of Uganda’s economy. It is
practiced on 40 percent of her land (Okorio, 2006), sustaining 3 million smallholder farmers and
it contributes to 22 percent of the country’s Gross Domestic Product (GDP) in 2014 (FAO, 2003;
UBOS, 2014). The main food crops are bananas, cereals and root crops whereas the major cash
crops for the economy are: coffee, cotton, tea, tobacco, sugar cane and cocoa. Food crops
production and forestry contribute respectively to 12 percent and 4 percent of total GDP in 2014
(UBOS, 2014).
In Uganda, forests are made up of tropical high forests and woodlands and they cover about 2.6
million hectares (UBOS, 2014). About nine percent of the total land area is established as a
permanent forest estate which is aimed at protecting the environment and providing forests
products and services to the society. It consists of central forest reserves, local forest reserves and
forested areas in national parks. Increased population pressure has led to depletion of forest
resources. Therefore, people are encouraged by forest conservation agencies like CIFOR and
ICRAF to collect non-timber forest products as compared to timber products. Agroforestry
practices are also promoted in Uganda according to the National Forestry Policy in 2001 (Kaggwa
et al., 2009). According to a baseline survey conducted in Uganda by the Farm Income
Enhancement and Forest Conservation project in 2007, about 76 percent of the households in the
4
rural areas practiced agroforestry. Uganda has pursued policies aimed at promoting market
liberalization since 1990. Commercialization of NTFPs also generates about US$ 33 million per
year (IFPRI, 2002). However, the country is disadvantaged as far as international trade of NTFPs
is concerned. For example, the bulk of non-timber forest products are exported in semi-processed
forms reducing opportunity for job creation and value addition (Kanabahita, 2001).
In Uganda, natural resources are a source of livelihood to rural smallholder farmers (NEMA,
2001). The country is endowed with a variety of NTFPs that can be commercialized to improve
livelihoods through poverty reduction. The market for NTFPs in Uganda is growing with the
surging population and better awareness of their nutritional and economic values (Kaboggoza,
2011). By taking advantages of this opportunity rural populations are likely to diversify their
source of income through sale of NTFPs. Furthermore, marketing of NTFPs has been recognized
in Uganda’s national strategic and operational framework for poverty eradication as a way of
reducing poverty through increased household incomes (MoFPED, 2014). Such interventions are
best suited for areas with the highest rate of poverty like Kapchorwa and Manafwa districts (UNEP,
2008). This justify why the government is interested in promoting the sale of NTFPs. The term
“non-timber forest products” in this study is taken in a broad sense and entails products derived
from trees which may be found in the forest or farm.
1.2 Statement of the research problem
In Uganda, rural households depend on non-timber forest products collected from the forest or
produced on farm for their nutritional needs (Agea et al., 2011). Their diets are mainly made up of
staple grains and the main source of vitamins are NTFPs. Trees provide products such as oil seeds,
edible leaves, and fruits rich in important vitamins (Hoskins 1990; Ogden 1990). Non-timber forest
5
products do not only contribute directly to nutrition and health; they also contribute to increase
household purchasing power. For instance, sale of non-timber forest products contributes to 27
percent of household cash incomes in rural areas in Uganda (Bush and Nampindo, 2004).
In the 1990s, about 56 percent of the population in Uganda were living below the poverty line
(MoFPED, 2014). In 2014, Uganda achieved the first target of the Millennium Development Goals
(MDG) by reducing the proportion of people living in extreme poverty by a substantial margin.
While Uganda national poverty level has declined, there are some disparities across regions. The
eastern region where Kapchorwa and Manafwa districts are located continues to lag behind with
poverty levels higher than the national average (MoFPED, 2014).
The Eastern part of Uganda is classified by IFPRI in 2002 to be part of the region within which
sale of NTFPs can contribute to poverty reduction. Therefore, the Ugandan Government is
committed to promote NTFPs value chains, in line with the Sustainable Development Goals
(SDGs) aim of ending poverty. Several interventions have been planned such as development of
markets for forest products and services, promotion of forestry in urban development planning and
scaling up of agroforestry-based alternative livelihood system (NDPII, 2015). In order to achieve
these objectives, there is need to ensure that households have access to tradable quantity of NTFPs
through appropriate sources. However, there are limited studies on factors that determine
household decision to collect or produce NTFPs.
The Eastern part of Uganda is adjacent to Mount Elgon National park from where households can
collect non-timber forest products. Households have also witnessed the implementation of projects
that promote agroforestry practices in the area. For example, the project entitled ‘trees for food
6
security’ aimed to promote tree planting in Kapchorwa and Manafwa districts was implemented
by Uganda National Forestry Resources Research Institute (NaFORRI) and World Agroforestry
Centre (ICRAF). As a result, households could also produce NTFPs on farm. However, the NTFPs
market is not as organized as that of staple foods and very few members of the community are
engaged in the selling of NTFPs (Wilson, 2015). According to Sebatta et al., (2014) research done
on farmer market participation in Uganda have mainly covered the staples commodities
particularly maize even though NTFPs can contribute to household income generation in the study
area (IUCN, 2008). Therefore, there is need to study households’ socioeconomic factors that affect
their participation in non-timber forest products market given that this gap in knowledge prevented
the Government from considering NTFPs as an avenue for poverty alleviation.
1.3 Objectives and hypotheses
Household’s decision to sell non-timber forest products is contingent on their decision to collect
them; therefore the overall objective of this study is to assess the factors that affect household
decision to participate in non-timber forest products market as sellers by collecting them from the
forest or producing them on farms in Eastern Uganda.
Specific objectives were to:
1. To identify the factors that affects households decision to participate or not in NTFPs as
collector or producer
2. To determine the factors that influence households decision to produce NTFPs on farm or
to collect them from the forest
3. To examine the key factors that influence decision of the households to participate or not
in non-timber forest products market as a seller.
7
This study hypothesizes that:
1. Socioeconomic and physical factors (gender, age, agro-ecological zones, wealth status
and land size) do not significantly affect household’s decision to participate or not to
participate in the collection or production of non-timber forest products.
2. Socioeconomic factors (age of the household head, farm size, presence of trees on farm
and access to agricultural and market information) do not significantly influence
household’s decision to choose forest as a source of non-timber forest products over farm.
3. Socioeconomic factors (gender of the household head, access to agricultural and market
information, distance to market, sources of NTFPs) have no influence on household
decision to participate in non-timber forest products market as seller.
1.4 Justification
This study provides information about the socioeconomic factors that contribute to literature on
households’ decisions to collect NTFPs from the forest or to produce them on farm. This study is
a baseline study that will give useful information to international organizations aimed to promote
long term conservation of the Mont Elgon National park. The identification of the significant
factors that affect households’ decision to sell non-timber forest products will help the Uganda
Government in designing effective programs to boost households’ income in the short term and
the country’s economy in the long term through collection and sale of NTFPs. Moreover,
smallholders and development organizations alike can clearly understand the important factors for
farmers’ decision to participate in non-timber forest products market.
8
1.5 Organisation of the Study
The rest of the thesis is organized as follows: Chapter 2 reviews past studies and discusses the
literature on agroforestry practices’ adoption by rural households and determinants of their market
participation. Chapter 3 presents the methodology which includes the conceptual framework,
empirical methods, the study area, data collection procedure and research design. Chapter 4
presents the results and discussion while chapter 5 presents the summary, conclusion and
recommendations of the study.
9
CHAPTER 2: LITERATURE REVIEW
Introduction
This chapter provides a discussion based on the available literature on NTFPs and their
contribution to household livelihood. The review emphasizes those studies carried on household
adoption of agroforestry practices as well as factors influencing household decisions to collect and
sell agricultural products. The existing gap in knowledge concerning determinants of household
decision to sell NTFPs is also highlighted.
2.1 Definition and classification of non-timber forest products
According to FAO (2006), deforestation is the deliberate removal of forest cover for agriculture
or urban development. The pressure on forest has increased during the last decade due the growing
population in Sub-Sahara Africa hence inducing climate change, soil resource losses and decrease
of biodiversity (Chakravarty et al., 2012). Therefore there is a need to come up with a strategy that
will allow forest dependent people to continue collecting products and at the same time help in
reducing the pressure on the forest. The term “non-timber forest products” came up because forest
conservation agencies are shifting the attention of population near forest areas from timber towards
more environment friendly uses of forest. According to FAO (1992) non-timber forest products
are very diverse and can be classified into different categories such as extractive, edible,
pharmaceutical plant, bee products as well as handicrafts and biofuels.
2.2 Contribution of Forest to Household Livelihoods
Livelihood has been defined by the British Department for International Development (DFID) as
the set of the capabilities, assets, and activities that are needed to make a living (Krantz, 2001).
10
Forest contributes to a household livelihood through its different components that are capabilities,
assets and activities. These components are made up of capital such as natural, social, economic
and human capital. The contribution of forest to these components of livelihood is made through
sustainable use of forest resources which will take place if the communities living in forested areas
are given the right to manage the forest (Dev et al., 2003) as explained in the subsections below.
2.2.1 Contribution of Forest to Livelihood Assets
Livelihood assets include natural, social and economic capital. Natural capital incorporates land,
water, common-property resources, flora or fauna from which households derive resources and
services (Krantz, 2001). Forest is a natural capital that provides resources such as NTFPs and
timber. Community management of forest will improve the condition and sustainable use of the
forest resources, hence improving its natural capital. This is possible through diligent protection
of forests from forest fire, illegal tree felling and unregulated extraction of forest products.
Social capital are networks, social relations, affiliations and associations upon which households
rely for collective action (FAO, 2000). Community management of forest can contribute to
creation of forest user groups, networks and institutions for collective selling of forest resources,
capacity building and local development activities. This improves the social cohesion in the
community. In South Africa for example a network of 30, 000 NTFPs collectors was created in
2006, which make possible the delivery of high-quality products to global markets on time (IFAD,
2008). The benefits of creation of social capital depends upon participation of households in the
activities of the groups or networks.
11
Economic assets include cash, micro-credit, basic infrastructure, production equipment or
technologies (Krantz, 2001). Through community management of the forest, development
activities that improve the level of infrastructure of the community can take place. Dev et al.,
(2003) found that in the Middle Hills of Nepal, community management led to the development
of the infrastructure. The main examples are: trail making, construction of community halls and
village electrification. Community management of forest can also provide cash to its members.
This is generally possible if the members have access to marketable NTFPs and a nearby market
(IFAD, 2008).
2.2.2 Contribution of Forest to Livelihood Capabilities
Capabilities or human capital include education, skills and psychological orientation (Krantz,
2001). Community forestry can contribute to improving human capital in various ways. In Nepal
for instance, forest user groups in the Middle hills provide support to schools by paying teachers’
salaries and funding school building construction. Moreover the Nepal UK Community Forestry
Project was also providing training to women in the forest user groups to increase their social role
in conservation of forest resources (Dev et al., 2003). In Burkina Faso, the United Nations
Development Fund for Women provided improved technologies and marketing assistance to
groups of women that collect and process shea nuts (IFAD, 2008).
2.2.3 Contribution of Forest to Livelihood Activities
Generally, communities adjacent to forests have the opportunity to engage in forest related
activities such as hunting, collection and selling of NTFPs. These activities contribute to income
generation, food security and health improvement of the households as explained below (Dovie et
al., 2001).
12
• Sources of employment and cash income
Activities related to NTFPs provide employment for rural households in many countries. In South
Africa, women earn an average of US$ 2,000 per year from trading bark material from a tree called
cape Onion wood (Cassipourea flanaganii) (Wynberg, 2004). Sale of bamboo shoot, rattan and
medicinal plants creates employment to a large number of educated youth. These products are used
as fresh vegetables and are also sold in local markets. Mushrooms are also harvested for
subsistence and commercial use (Agustino et al., 2011). In developing countries NTFPs contribute
significantly to economic growth (Chikamai and Tchatat, 2004). Dabiré (2003) found that NTFPs
contribute to 14 percent GDP in Senegal with an annual income ranging from US$ 194 to US$
1,114.
In the forest zones many poor households have been domesticating indigenous fruit trees as a
means of income generation. In Cameroon about 70 percent of African pears (Dacryodes edulis)
produced are sold, providing households with a gross annual income of US$ 160 (Schreckenberg
et al., 2006). For example, in Ghana FAO (1996) found that 72 percent of the households
interviewed identified income generated from NTFPs activities as being important in meeting their
nutrition and healthcare needs.
• Food security
Ahenkan and Boon (2011) reported that trees contribute to food security in many ways across the
world. They can provide a direct source of food as well as essential nutrients that increase the
nutritional impact of other foods. They also help in filling food gaps by providing food during
seasonal shortages. In developing countries, NTFPs contribute to the food security of nearly 80
percent of the population (FAO, 2003). In Sub-Saharan Africa where crops’ yields decline due to
climate change, NTFPs are consumed by the population during seasonal shortages, hence
13
contributing to the food security of about 12 million people (Moseley, 2012). In Uganda NTFPs
are consumed by a least 76 percent of the population (Kaggwa et al., 2009). A study on NTFPs
contribution to food security in Cross River State in Nigeria revealed that NTFPs contribute to the
food security of 70 percent of the population (Offiong and Ifa 2013). In that region the leaves of
the forest trees like African nut tree (Myrianthus arboreus) and Silk-cotton (Ceiba pentandra) are
highly valued because they are the main source of vegetable at the end of the dry season. In
Swaziland, Ogle and Grivetti (1985) found that more than 200 species of the wild plants were
consumed. In Machakos district of Kenya vegetables from forests are delicacies during the rainy
season. Fruits are mostly seasonal and consumed mostly by children. In Zambia wild vegetable is
used as ingredients in 42 percent of the meals served in Mukupu village. For example, in the Ferlo
region of Senegal, 150 wild plants including Adansonia digitata, Balanites aegyptiaca have been
recorded to be consumed by the local communities (Agustino et al., 2011).
• Health improvement
In Sub-Saharan Africa, forests and trees are important to local communities because they supply
medicinal plants that are important for their health (Chege, 1994). Households in forested areas
use NTFPs as supplement in their diet and hence their health is improved through the prevention
of diseases. Fruits, leaves, nuts, tubers, roots and honey are rich in vitamins (A, B, C, D), minerals,
(calcium, magnesium, potassium, iron) carbohydrates (fructose, soluble sugars) and protein which
are indispensable for vulnerable groups such as children and older people. Fruits from tree species
such as Baobab (Adansonia digitata), Tamarind (Tamarindus indica), Blackjack (Bidens pilosa)
and Vitex (Vitex doniana) are sources of food and vitamins for most rural communities (Achigan-
Dako et al., 2010).
14
Violet tree (Securidaca longepedunculata) is a multipurpose plant found in Africa. In East Africa
the dried bark and root of this plant are used to treat nervous system disorders. The dried leaves
are used for wounds and sores, coughs, venereal diseases, and snakebites in Nigeria. Another
multipurpose medicinal plant is Prunus (Prunus Africana). It is found in the afro-montane forests
of Cameroon, Uganda and Kenya. It is traditionally used to treat malaria, chest pains and heartburn.
Therefore, forests would provide the only medicines available to about 90% of the developing
world (Cunningham and Mbenkum, 1993).
2.3 Adoption of agroforestry practices by households in Sub-Sahara Africa
Agroforestry is “the incorporation of commercial tree growing and management by farmers into
farming systems for the production of both wood and non-wood products, increasing agricultural
productivity and encouraging sustainable natural resource management” (NSW, 2003, p. 2). The
five recognized agroforestry practices are upland forest buffers (combination of trees, shrubs and
grasses established in distinct zones), windbreaks, alley cropping, silvo-pasture (combination of
trees, forage and livestock managed as a single integrated system) and forest farming. Among
those practices alley farming and forest farming are the most important in providing non-timber
forest products to adopters (UMCA, 2015).
Alley farming
Alley farming is a combination of trees planted in single or multiple rows with agricultural crops
cultivated in the wide alleys. The trees may include species that can provide non-timber forest
products for sale (UMCA, 2015). Farmers’ adoption of this practice is affected by different factors
that are worth reviewing. For example, in Cameroon a study on determinants of farmers’ adoption
15
of alley farming showed that it is commonly adopted by male household heads that have access to
extension services and are members of farmer groups (Adesina et al., 2000). Moreover they found
that the adoption increased in areas where there is a high fuelwood scarcity but decreased in the
highly populated areas. A similar study in Nigeria by Adesina and Chianu, (2002) revealed that
income generated from NTFPs selling as well as farmer characteristics such as gender and age
were significant in explaining farmers’ adoption of alley farming.
Krause et al., (2007) also analyzed smallholder farmers’ decisions to integrate woody plants on
farm in Ethiopia. The study reveals that resource-based factors like farm size and land tenure were
the major determinants. Farmers’ perception of alley farming was also found to affect farmers’
decision to adopt it. In West Africa the reason for the low adoption of alley farming was that
farmers perceive it as difficult to undertake (Douthwaite et al., 2002).
Forest farming
Forest farming is the management of shade in forests for the cultivation of trees that can provide
marketable NTFPs (UMCA, 2015). This agroforestry practice improves forest composition while
enhancing farmers’ income opportunities through NTFPs selling. Socioeconomic factors of
farmers such as farm size, land tenure, marital status and household size were found to affect their
decision to adopt forest farming. For instance, Thangata et al., (2002) studied household decision
to practice forest farming in Malawi and found that their decision is mainly driven by the
availability of land and labour. In Tanzania factors such as marital status, household size, tenure
security and credit access were found to significantly affect the adoption of agroforestry practices
(Bullock et al., 2013).
16
The fact that forest farming can also provide direct economic benefits through sale of NTFPs is
crucial for its adoption. For example, in Rwanda a study on determinants of tree planting on farm
revealed that farmers’ adoption of forest farming was driven mainly by the following factors:
availability of food, firewood and total income from tree products selling (Ndayambaje et al.,
2012). Similarly, environmental values and perceptions regarding the extent to which forest
farming can contribute to forest conservation were found to affect the probability of farmers’
participation in forestry in Ethiopia (Mekoya et al., 2008). These studies lead to the conclusion
that alley farming and forest farming can contribute to production of NTFPs and income
diversification. The factors that determine household adoption of alley farming and forest farming
include socioeconomic and environmental factors as well as the perception of the household about
those practices. Therefore policies aimed at promoting agroforestry need to be guided by a better
understanding of the motivations of adopters.
2.4 Harvesting technologies for non-timber forest products
Harvesting techniques of NTFPs including pre-harvest and post-harvest treatment are different
from those of timber. According to Agustino et al., (2011) the difference is related to the
equipment, pre-harvest preparations and post-harvest treatment used (Agustino et al., 2011). The
process of harvesting NTFPs does not involve a whole tree as it is the case for timber; hence it is
less harmful to the forest. It also differs depending on the type of NTFPs involved. For example,
technics such as root digging and debarking are used to harvest some medicinal plants, which is
not the case while harvesting nuts or fruit. The procedures of harvesting NTFPs other than honey
are not well elaborated because volumes harvested are usually small. Therefore, there is need to
develop elaborate harvesting procedures in order to prevent post-harvest losses.
17
2.5 Factors affecting households decision to participate or not in non-timber forest products
as producer or collector
Socioeconomics characteristics of the household were found by several authors to affect their
decision to participate or not in NTFPs as collector or producer. These factors are also the factors
likely to influence their decision to produce NTFPs on farm or to collect them from the forest.
Therefore the conclusions made are valid for the two objectives.
Gender of head of household
Campbell (1991) found that in Ethiopia men like taking risk and hence are more likely to go to
the forest and collect NTFPs compared to women. In contrast, Opaluwa et al., (2011) found that
in Nigeria women were more likely to collect NTFPs as compared to men. Therefore in this study
gender is hypothesized to positively or negatively affect household decision to participate in
NTFPs as collector or producer as well as their decision to choose the forest as their main source
of NTFPs in Uganda.
Age of head of household
The age of the head of household may positively or negatively influence household decision to
collect NTFPs. Collection of NTFPs is labour intensive, hence young people may be more
dependent on forest products than elderly people (Mamo et al., 2007). McElwee (2008) also
analyzed the socio-economic factors that affect household’s decision to collect forest products.
They found that the elderly people are less likely to collect NTFPs from the forest, hence they rely
more on their farm because they may not have the strength to carry out forest-related activities.
However, Rodrigez (2009) found that adult household heads were more likely to collect NTFPs in
18
India. Many other researchers; (Hedge et al., 1996; Hedge and Enters, 2000; Shone and Caviglia-
Harris 2006) have found a positive association between age and decision to collect NTFPs.
Therefore in this study age is hypothesized to positively or negatively affect household decision
to participate in NTFPs as collector or producer as well as their decision to choose the forest as
their main source of NTFPs.
Occupation of head of household
Main occupation of the head of households is the type of work they do irrespective of the place or
education level. In Uganda nearly 64 percent of the working populations were engaged in
subsistence agriculture in the year 2014, according to the Uganda Bureau of Statistics. This
variable is expected to positively affect the households’ decision to participate in NTFPs as
collector or producer as well as their decision to choose the forest as their main source of NTFPs.
Household size
Household size affects significantly household decision to collect NTFPs. The larger the household
size, the more non-timber forest products they need like fuelwood for cooking. Therefore,
households look for a way to secure a source of NTFPs relying on either the forest or own farm.
This suggests that larger households have a greater demand for NTFPs, hence are more likely to
collect NTFPs (Adikhari, 2014). Similarly, a study conducted by Rodrigez (2007) in India on the
determinants of NTFPs collection revealed that the presence of an additional individual in the
household increases the household probability of collecting NTFPs. Household members can also
provide labour that may help in collecting NTFPs. Therefore the larger the household size, the
more labour they have to collect NTFPs. Size of household is then hypothesized to positively
19
influence the decision to participate in NTFPs as collector or producer as well as their decision to
choose forest as their main source of NTFPs.
Farm size
In Uganda, the average size of farmland owned by a rural household is 1.1 ha (UBOS, 2010).
Household farm size is related to their decision to grow trees on their farm. When farm size is
large, farmers are more likely to own a woodlot. The larger the area they allocate to agroforestry
the more will be the quantity of NTFPs collected. Thus farm size is hypothesized to be positively
linked to the household’s decision to participate in NTFPs as collector or produce as well as their
decision to choose the forest as their main source of NTFPs.
Level of education of head of household
Level of education is an important indicator of the society’s stock of human capital and refers to
the highest level of education that an individual has completed (UBOS, 2014). In every
socioeconomic studies education is included to measure the level of socioeconomic development
in the area. Education has a significant negative influence on household decision to collect non-
timber forest products. Adhikari et al., (2004) studied the relationship between household
characteristics and collection of NTFPs in Nepal and found that a higher level of education
provides opportunities for better jobs and reduces the households dependency on NTFPs, hence
they are less interested in collecting NTFPs. Therefore in this study, education is hypothesized to
negatively affect household decision to participate in NTFPs as collector or producer as well their
decision to choose the forest as their main source of NTFPs.
20
Access to agricultural and market information
Household access to market information such as prices and availability of buyers affects
households’ decision to collect non-timber forest products. According to Angelsen and Kaimowitz
(1999), greater access to prices and buyers information often accelerates NTFPs extractions and
induces people to earn more income by selling the NTFPs in the market. Therefore in this study
access to agricultural and market information is expected to positively affect household’s decision
to participate in NTFPs as collector or producer as well as their decision to choose the forest as
their main source of NTFPs.
Household wealth status
Household income level has a significant effect on the decision to collect non-timber forest
products. On one hand, higher income households might not be interested in collecting or selling
NTFPs compared to lower income households because they can afford to purchase NTFPs from
local markets (Ndayambaje et al., 2012; Angelsen and Kaimowitz, 1999). Therefore poor
households are more likely to collect NTFPs. Moreover the better-off households collect lower
amount of NTFPs especially firewood because they can afford substitutes like gas for cooking. On
the other hand, higher income household may be attracted by prices of forest products; hence they
might be interested in NTFPs collection (Springate-Baginski et al.,1999). Material used for wall
construction can be used to capture the state of wealth of the household. In rural areas in Uganda,
walls are constructed with permanent materials like cement, burnt bricks and stones or with
temporary materials like mud, dirt, zinc and iron. Households who have their walls built with
permanent materials are considered to be wealthier than others. Therefore in this study wealth
status is hypothesized to positively or negatively affect household’s decision to participate in
21
NTFPs as collector or producer as well as their decision to choose the forest as their main source
of NTFPs.
Distance to source of non-timber forest products
Distance from homestead to the source of non-timber forest products has negative and significant
relationship with non-timber forest product collection. A study conducted by Opeluwa et al.,
(2011) on determinants of NTFPs collection and utilization in Nigeria revealed that the distance
separating the households to the source of NTFPs negatively affected their decision to collect
NTFPs. It suggested that households residing close to the source of NTFPs are more likely to
collect NTFPs or to acquire higher amount of NTFPs. This result contrasts the findings by Adhikari
et al., (2004) who found that distance to the forests positively affect household decision to collect
NTPFs like firewood in Nepal indicating that as distance to the source of collection increases
household still collect firewood because it is not easily substituted by other source of energy in
that area. According to Ndayambaje et al., (2012) agro-ecological zones can be used as a proxy to
assess distance to the forest. In Eastern Uganda there are three agro-ecological zones which are
high, middle and low agro-ecological zones. Households in high and middle agro-ecological zones
are closer to the forested areas; hence they have better access to the resources that it provides
(Paumgarten, 2007). It is expected that they are more involved in NTFPs collection. Based on
these findings, it is hypothesized that householdds in high and middle lands are more likely to
participate in NTFPs as collector or producer and to choose the forest as their main source of
NTFPs.
22
2.6 Market for Non-Timber Forest Products
Geographically, NTFPs are sold in the village markets as well as at the national and international
markets. In developing and developed countries, there are large domestic markets for NTFPs.
NTFPs like edible nuts and resin are commonly sold in the producing countries and special types
of honey need specific niches (Agustino et al., 2011). However, industrialized countries in Europe,
Japan and North America absorb the bulk of most of the internationally traded NTFPs. With regard
to end-use, non-timber forest products are sold in raw or primary processed forms in several
markets. The main end-use sectors served by NTFPs in raw form include cattle feeds, food industry
and pharmaceutical industry. Pharmaceutical industries in Europe and America are increasingly
importing NTFPs for their medicinal properties. For example Prunus African was worth US$ 200
million to pharmaceutical industries in 1999 (CARPE, 2001). In Namibia, annual export of
medicinal plant was worth US$ 2 million in 1998 (Agustino et al., 2011).
From the gatherers point of view collectors of NTFPs include the middlemen and national
organizations who sell their products directly to consumers in village or town markets (Achigan-
Dako et al., 2010). These reviewed studies demonstrate the importance of non-timber forest
products from different sources in contributing to rural households’ food security as well as their
economic returns. It also shows the potential of NTFPs in contributing to international trade, hence
Uganda Government can take advantage of the market opportunities by developing the value
chains of NTFPs.
23
2.7 Factors Affecting Households Participation in Non-timber forest products Markets as
seller
There is scarce literature on household participation in NTFPs markets but it is likely that factors
affecting household decision to sell agricultural products are also the factors likely to affect
household decision to sell NTFPs. Several factors have been identified as affecting market
participation of smallholder farmers. These factors include socioeconomic factors (age, gender,
education of the household head, household size and land size) and institutional factors (road
infrastructure, distance to market and access to information).
Gender of the head of household
The gender of the household head affects the decision to participate in the market. Male headed
household are more likely to sell farm products because they own more productive resources than
the female headed households (Jagwe et al., 2010). Furthermore, Demeke et al., (2014) found that
female headed households are more likely to be resource constrained and it affects negatively their
market participation decision in Central Ethiopia. Similarly Hlongwane et al., (2014) investigated
factors affecting market participation of the small-scale maize farmers in South Africa and found
that female headed households are less likely to sell maize because of the high transaction cost of
searching for buyers as opposed to the male headed households. Gender also plays an important
role in NTFPs selling. According to Tugume et al., (2015) women are mostly involved in collection
of wild food and medicinal plants for home use due to low volumes collected while men are
involved in more labour intensive activities involving commercial extraction of firewood and
rattam which offer high values. For example, Mulenga et al., (2014) found that in Zambia male-
headed households are more likely to participate in NTFPs markets and depend more on NTFPs
24
income than households headed by women. Therefore this study expects gender to influence
household decision to commercialize NTFPs.
Age of the head of household
Several studies show that age of the household head may negatively or positively affect market
participation. According to Adegbola and Gardebroek (2007) older farmers may easily decide to
participate in the market than the young farmers because they are likely to have bigger land size
that allow them to have more surplus. Another study was conducted on factors influencing
household participation in maize market in Ghana and revealed that older farmers were more likely
to sell maize compared to younger ones (Musah et al., 2014). However, young household heads
who are risk takers may also be more likely to participate in product markets (Zegeye et al., 2001).
Also, Chalwe (2011) found that in Zambia younger people participate more in beans selling than
older people. Similarly, Sigei et al., (2014) found that older household heads were less likely to
sell pineapple in Kenya. Effect of age on NTFPs commercialization is expected to be
indeterminate. It can either be positive or negative. On one hand collection of NTFPs products
demand a lot of physical strength which excludes older people. Similarly older people are more
knowledgeable about NTFPs with medicinal value hence they are more incline in
commercialization of medicinal NTFPs. A study by Tugume et al., 2015 shares similar insights
when it found that older people with more knowledge on medicinal NTFPs in Central Uganda
were involved in commercialization as traditional healers.
Education of head of household
According to Enete and Igbokwe (2009) household heads with higher education level have access
to better remuneration activities as compared to collection or selling of NTFPs. Piya et al., (2015)
25
found that better educated household heads depend lesser on NTFPs as a source of income in
Nepal. However income obtained from other economic activities could be used by the educated
household with higher education level, to engage in commercial exploitation of forest products
which require capital thus justifying the positive relationship (Tugume et al., 2015). Therefore it
is expected that education is hypothesized to positively or negatively affect households’ decision
to sell NTFPs.
Land size
Land size has significant effect on farmers’ decision to sell their products. According to Key et al.,
(2000) land size is positively related to farmers’ decision to sell their agricultural products because
they can produce more output with large land size. In Bangladesh and Ethiopia farm size was
found to positively affect the probability of being a commercial farmer (Osmani and Hossain,
2015; Demeke et al., 2014). In Kenya, Olwande and Mathenge (2012) investigated factors
affecting participation of rural households in the market and found that larger per capita land size
is significantly associated with a higher probability of participating in fruits market. Contrary to
this observation farm size is expected to negatively affect selling of NTFPs since Tugume et al.,
(2015) found that households with big land sizes are less likely to sell NFTPs as compared to those
with less land size because the ones with large land can engage in agriculture which provides
alternative sources of income than NTFPs. Therefore for this study it is also expected that farm
size is negatively related to households’ decision to sell NTFPs.
Household size
The household size can negatively or positively affects household market participation decision.
A positive influence could be because larger household provide cheaper labour for collection of
26
more surpluses of NTFPs that can be sold (Alene et al., 2008). For instance, Tugume et al., (2015)
analyzed the socio-economic predictors of dependence on NTFPs in Uganda and found that
household size is positively related to farmer decision to sell NTFPs. However, larger family size
may also require larger amounts of NTFPs for households’ consumption which in turn reduces the
marketable surplus (Gebregziabher 2010). Therefore household size is expected to negatively or
positively affect farmers’ decision to sell NTFPs.
Distance from homestead to the market
Distance from homestead to the nearest market influence negatively households’ participation in
the market as it indicates the extent to which road infrastructure is developed in the area of study
(Chilundika, 2011). For example, Hlongwane et al., (2014) in their study on household
participation in agricultural products market, found that distance to the market negatively affects
farmer decision to sell their agricultural products because it increases the transportation cost.
Distance from homestead to the market was also found by several authors (Sebatta et al., 2014,
Glover et al., 2013, Omiti et al., 2009) to have a negative effect on market participation. This
might also be the case for NTFPs since Paumgarten (2006) and Timko et al., (2010) also found
that household proximity to the market is important in selling NTFPs because it reduces the
transportation cost. Therefore distance from homestead to nearest market is expected to negatively
affect household’s decision to sell NTFPs.
Access to agricultural and market information
Households need to have access to information about the market such as prices, demand, supply
and expectations; before they take the decision to sell what they produced or collected. They may
27
also be reluctant to collect or produce NTFPs on farm if they know that prices of the products
fluctuate widely. Market information has been found to positively affect market participation for
NTFPs (Kar and Jacobson, 2012) suggesting that poor access to market information results in high
transaction costs such as transportation and communication cost. This is because NTFPs sellers
have to use other means that is calling their counterpart or incurring transport costs to the market
to get the information. Therefore access to market information is also hypothesized to positively
affect household’s decision to sell NTFPs.
Group membership
Some authors found that membership to farmer groups influence the probability of market
participation. According to Mbowa et al., (2012), groups are usually formed to facilitate access to
better agricultural technologies and transportation of goods to markets. In that case it positively
impacts on market participation (Olwande and Mathenge, 2012). Similarly, Sebatta et al., (2014)
analyzed the factors that influence smallholder farmers’ decision to participate in potato market in
Uganda and found households belonging to farmer groups were more likely to sell potato because
the group helps them to get information on the prices of potato on different markets and increase
their bargaining power. Membership in a group would enable NTFPs sellers to have better access
to loans, training and processing technologies from government or international organizations and
to supply global market (IFAD, 2008). For example, Harsch (2001) found that in Burkina Faso,
100 groups of shea butter sellers received training from a cosmetic company. The company also
pay for the product in advance thus promoting greater economic security. Therefore, membership
to farmer groups is hypothesized to positively affect household decision to sell NTFPs.
28
Access to credit
Access to credit positively affects market participation because credit is a production-enhancing
input which boosts productivity and consequently increases the level of marketable surplus, hence
encouraging farmers to sell their products. Hlongwane et al., (2014) in South Africa and Musah et
al., (2014) in Ghana found that households who have access to credit were more likely to sell
maize in South Africa and Ghana respectively. Similarly, Franzel et al., (2007) found that lack of
capital, especially during the rainy season is a constraint for effective trade in NTFPs as collectors
who have access to credit have the ability to afford transportation means, market information hence
they are more likely to sell NTFPs as compared to those without credit. For these reasons it is also
suggested that access to credit is positively related to households’ decision to sell NTFPs.
Wealth status
Wealth can have a positive or negative effect on household market participation. Wealth status is
a proxy for household income therefore higher income households might not be interested in
selling NTFPs compared to lower income households because they do not collect or produce
NTFPs, instead they purchase NTFPs from the local markets (Ndayambaje et al., 2012). Mulenga
et al., (2013) also found that poorer households are relatively more dependent on income from the
extraction and sale of NTFPs than wealthier households in Zambia. However, Kepe (2002) found
that in Zimbabwe wealthier households are more involved in NTFPs selling because they are
attracted by the prices of the products. Therefore, wealth status is expected to positively or
negatively affect households’ decision to sell NTFPs.
29
Distance from homestead to forest
According to Timko et al., (2010) household decision to sell NTFPs is influenced by where they
are physically situated in relation to forests. Dash et al., (2016) found that in India, living far from
the forest is clearly associated with low commercialization. Kamanga et al., (2009) also found that
in Malawi households close to forests had higher forest incomes than those who are far from
forests, suggesting that households close to forests were more likely to sell NTFPs. While agro-
ecological zones help to capture variation across different regions particularly in terms of climatic
risk, according to Ndayambaje et al., (2012) it can be used as a proxy to assess distance to the
forest. In Eastern Uganda there are three agro-ecological zones which are high, middle and low
agro-ecological zones. Households in high and middle agro-ecological zones are closer to the
forested areas; hence they have better access to the resources that it provides (Paumgarten, 2007).
Therefore it is expected that household living in high and middle lands are more likely to sell
NTFPs.
In summary these studies broadly covered socioeconomics factors that explain collection of
NTFPs as well as market participation of smallholder farmers. It was found that little attention has
been given to factors affecting household decision to sell non-timber forest products. Therefore
the current study will contribute to the growing literature on market participation studies on
NTFPs. It will also identify areas of policy interventions that need to be emphasized in order to
achieve high participation of household in selling of non-timber forest products.
30
CHAPTER 3: METHODOLOGY
Introduction
This chapter begins with the conceptual framework of how the study sought to address the
identified research gap. The theoretical framework under which the study is grounded is also
discussed. The chapter further presents the sampling procedure, sample size determination, data
collection and description of the study area.
3.1 Conceptual Framework
The conceptual framework for the assessment of factors affecting households’ participation in non-
timber forest products market is presented in figure 1. The figure underscores important linkages
in three levels of decision making processes and stresses the variables that are likely to have the
take home message. The incentives suggested in level 1 are the basis for household decision
making process and they are perceived differently by household based on their socioeconomic
characteristics. All together they shape household decision making process in level 3.
At level 1 household decision is visualized to be influenced by incentives such as household access
to market information such as prices and demand, proximity to market and agro-ecological zones
(proximity to the forest). These factors are likely to have a negative or positive influence on
household in the decision making process. They can also be perceived as incentives or
disincentives depending on households’ socioeconomic characteristics such as age, land size,
gender of the household head and land ownership. It is hypothesized that different decisions are
likely to be made and implemented based on varying conditions of these factors as shown in level
3. Three stages of decisions are identified in this study. The decision process leading to household
31
behavior in this study can be visualized as a triple hurdle where the first hurdle is for the household
to decide whether to participate in NTFPs as producer or collector or not to participate. The second
hurdle is for the household to choose to produce NTFPs on farm or to collect them from the forest.
The third hurdle is to decide on whether to sell NTFPs or not.
3.2 Theoretical Framework
Households’ decision making process can be explained by the utility maximization theory whose
basis is rooted in random utility theory (McFadden, 1974). Utility maximization theory assumes
that households evaluate each opportunity that comes to them with complete knowledge of
alternatives and choose the opportunity that maximize the utility. According to this theory, choice
that households make among a set of options depends on the utility of each alternative relative to
the utilities of all alternatives (Clifton and Handy, 2001). In another words, given two options that
is selling NTFPs or not for example, household i confronted with a choice between the two options
will assign to each alternative a perceived utility. Hence household i will choose the option that
maximizes the utility after comparing the expected utility of participation in NTFPs selling with
non participation. If a household chooses to participate in NTFPs selling, that means it yield a
highest utility.
32
Level 1: Incentives
Level 2: Household
Socio-economics factors
Level 3: Participants
in the three stages of
decisions
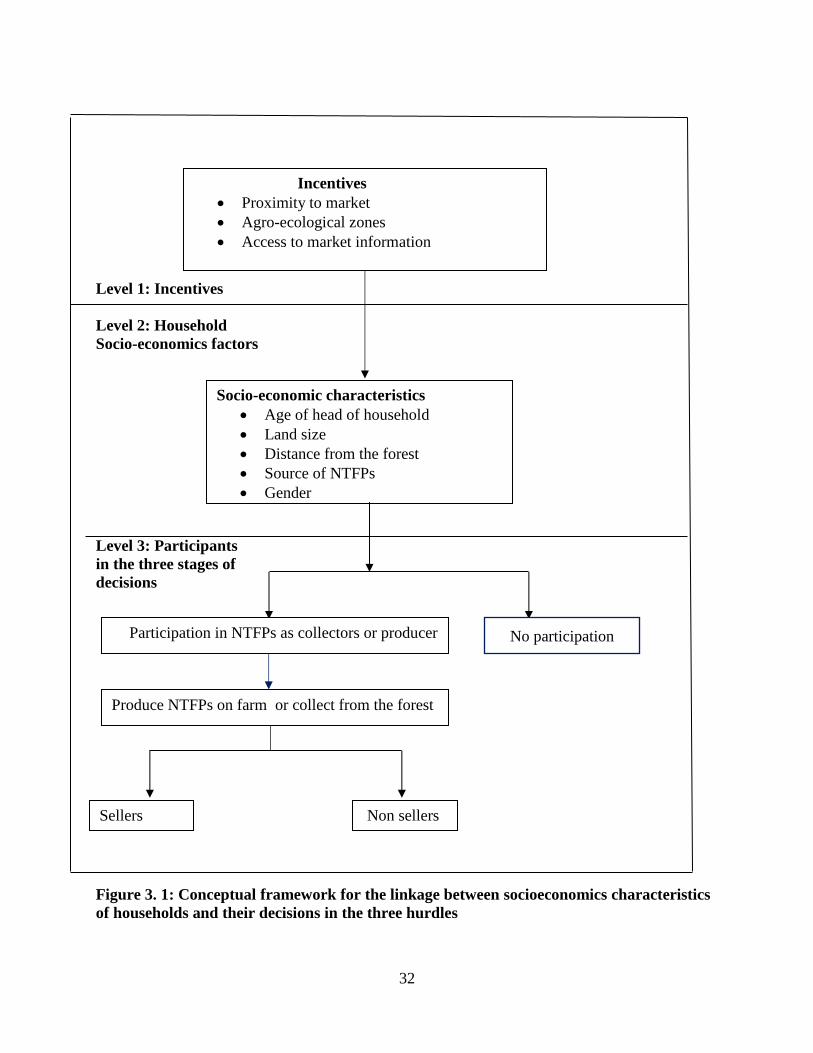
Figure 3. 1: Conceptual framework for the linkage between socioeconomics characteristics
of households and their decisions in the three hurdles
Sellers Non sellers
Incentives
• Proximity to market
• Agro-ecological zones
• Access to market information
Socio-economic characteristics
• Age of head of household
• Land size
• Distance from the forest
• Source of NTFPs
• Gender
Participation in NTFPs as collectors or producer No participation
Produce NTFPs on farm or collect from the forest
33
Assuming:
(i) a set of alternatives B, presented to the household i. For the first objective the alternatives are
to participate in NTFPs as producer or collector or not to participate. For the second objective the
alternatives are to produce NTFPs on farm or to collect them from the forest and finally households
have to decide on whether to sell NTFPs or not.
(ii) a set of household socioeconomic characteristics 𝑋𝑖𝑗
(iii) a family of choice probabilities {𝑃𝑖𝑗(𝐵), 𝑗 ∈ 𝐵}, where 𝑃𝑖𝑗(𝐵) is the probability of choosing
alternative j inside B. According to Dagsvik (2004), the utility maximization theory implies that
probability of choosing alternative j inside B depends on the maximum utility it provides expressed
as in equation 1:
𝑃𝑖𝑗(𝐵) = 𝑃𝑟𝑜𝑏 (𝑌𝑖 = 𝑗) = 𝑃𝑟𝑜𝑏 ( 𝑈𝑖𝑗 = max𝑘∈𝐵
𝑈𝑖𝑘) (1)
Where Yi is the outcome of the decision and also represents the utility 𝑈𝑖𝑗 assigned by the
household i to alternative j. In equation 1, the utility Uij is a latent construct that is in the mind of
the household and cannot be observed directly or measured (McFadden, 1974). That utility
assigned by the household i to alternative j is not known with certainty by an external observer.
According to Gujarati (2003), the utility Uij can be expressed as a linear combination of the
systematic utility 𝑉𝑖𝑗 that household i gets from the choice of alternative j and the random factors
𝜀𝑖𝑗 expressed as in equation 2. The random component (ε) arises both because of the randomness
in the households’ preferences and because the attributes do not cover all of their preferences.
𝑈𝑖𝑗 = 𝑉𝑖𝑗 + 𝜀𝐼𝐽 (2)
Where:
𝑉𝑖𝑗 = 𝛽𝑖𝑗𝑋𝑖𝑗 = 𝛽𝑖𝑗 𝐹 (𝑋𝑖𝑗) (3)
34
= unobserved parameters
𝑋𝑖𝑗 = vector of explanatory variables
Therefore by replacing equation 3 in equation 2, it results to equation (4) which implies that the
utility a household derives from a choice depends on its characteristics 𝑋𝑖𝑗 and those of the
alternative choices (Rungie et al., 2012).
𝑈𝑖𝑗 = 𝛽𝑖𝑗𝑋𝑖𝑗 + 𝜀𝐼𝐽 (4)
According to Vojacek and Pecakova (2010), if the household chooses the alternative which brings
the greatest utility then the probability of the choice of the alternative j over alternative j’ is derived
from equation (5) and is expressed as:
𝑃𝑟𝑜𝑏 (𝑌𝐼 = 𝑗) = P (𝑈𝑖𝑗 > 𝑈𝑖𝑗′)
= P (𝑉𝑖𝑗 + 𝜀𝑖𝑗 > 𝑉𝑖𝑗′ + 𝜀𝑖𝑗′)
= P (𝜀𝑖𝑗 − 𝜀𝑖𝑗′) > (𝛽𝑖𝑗′ − 𝛽𝐼𝐽) 𝐹(𝑋𝑖𝑗, 𝑋𝑖𝑗′)
= 𝐹(𝛽𝑖 𝑋𝑖) (5)
3.3 Empirical Methods used in the Three Hurdle Decision Making Process
Different approaches have been used to evaluate factors that explain household decision making
process based on the utility maximization theory. In this study households have to make decision
in two steps. The first step is to decide whether to collect non-timber forest products or not and the
second step is to decide whether to sell or not after having collected NTFPs. Participation decision
taken as dependent variable can be modelled with discrete choice models. According to Gujarati
(2003) the most commonly used approaches to estimate such models are Linear Probability Model,
Logit and Probit model. In all these cases the households are categorized as being either
participants or non-participants. The dependent variable takes the value of 1 for participants and 0
35
for non-participants. Linear Probability Model is the regression approach used to analyse a binary
choice when the dependent variable is discrete. With the Linear Probability Model, an event will
occur given Xi explanatory variables and this probability is linearly related to the independent
variables. LPM is plagued by several problems such as non-normality and heteroscedasticity of
the errors terms as well as the possibility of the probability that an alternative j selected is greater
than 1.
For these reasons Probit and Logit models are preferred because the conditional probabilities are
nonlinearly related to the independent variables and have the characteristic to not exceed 0 and 1
asymptotically. Logit model is based on cumulative logistic probability distribution while Probit
model is based on cumulative normal probability distribution (Greene, 2008). Logit model
encompasses some limitations. It does not assume normality, linearity and homogeneity of
variance for the independent variables. These assumptions are important because Logit model
cannot represent the variation of the random taste (Train, 2003). Probit model deals with this
problem, hence it was preferred for this study.
3.4 Empirical studies that used Probit model
Analysts have used Probit model alone or in two stage models to explain households decision
making process. For example, Oladejo et al., (2011) have used Probit model to analyse women
participation in agricultural production in Egbedore Local Government Area of Osun State in
Nigeria. Specifically, the study examined the influence of selected socio-economic characteristics
of women and access to economic resources on their participation in agricultural production. Two
stage models such as double-hurdle, Heckman and Tobit allows analysts to study determinants of
market participation using Probit model at the first stage. Bellemare and Barrett (2006) in their
36
study on determinants of livestock market participation in Kenya used an ordered Tobit model. In
the first stage of their analysis they used an ordered Probit regression in order to take into account
buyers, sellers and autarkic separately. More recently Musah et al., (2014) in their study on
determinants of farmers’ participation in maize market in western Ghana used the double-hurdle
model for a sample of maize producers to evaluate determinants of market participation using a
Probit model in the first stage. Sebatta et al., (2014) also used Heckman model to analyze factors
that influence smallholder farmers’ decision to participate in the potato market in eastern Uganda.
They used Probit model in the first stage to determine factors affecting households participation
in the potato market.
3.5 Estimating Equations
This section defines variables mentioned in equation 5 that are used to estimate equations for this
study:
𝑌𝑖 = dependent variable for the participation decisions
j = alternative decisions
The decisions to participate in NTFPs or not as collector or producer is then stated as:
𝑗 = {1 𝑖𝑓 ℎ𝑜𝑢𝑠𝑒ℎ𝑜𝑙𝑑 𝑝𝑎𝑟𝑡𝑖𝑐𝑖𝑝𝑎𝑡𝑒𝑠 𝑖𝑛 𝑁𝑇𝐹𝑃𝑠 𝑎𝑠 𝑐𝑜𝑙𝑙𝑒𝑐𝑡𝑜𝑟 𝑜𝑟 𝑝𝑟𝑜𝑑𝑢𝑐𝑒𝑟
0 𝑜𝑡ℎ𝑒𝑟𝑤𝑖𝑠𝑒
The decisions to produce NTFPs on farm or to collect from the forest is then stated as:
𝑗 = { 1 𝑖𝑓 ℎ𝑜𝑢𝑠𝑒ℎ𝑜𝑙𝑑 𝑐𝑜𝑙𝑙𝑒𝑐𝑡𝑠 𝑁𝑇𝐹𝑃𝑠 𝑓𝑟𝑜𝑚 𝑡ℎ𝑒 𝑓𝑜𝑟𝑒𝑠𝑡
0 𝑖𝑓 ℎ𝑜𝑢𝑠𝑒ℎ𝑜𝑙𝑑 𝑝𝑟𝑜𝑑𝑢𝑐𝑒𝑠 𝑁𝑇𝐹𝑃𝑠 𝑜𝑛 𝑓𝑎𝑟𝑚
The decision to sell NTFPs or not is stated as:
𝑗 = { 1 𝑖𝑓 ℎ𝑜𝑢𝑠𝑒ℎ𝑜𝑙𝑑 𝑠𝑒𝑙𝑙𝑠 𝑁𝑇𝐹𝑃𝑠
0 𝑜𝑡ℎ𝑒𝑟𝑤𝑖𝑠𝑒
37
𝑋𝑖 = the vector of the independent variables for each objective as defined in tables 3.1, 3.2 and
3.3 below.
βi = vector of coefficients to be estimated
ε = the normally distributed error term.
Given the above, the probability that a household belongs to a group j is function of the
independent variables 𝑋𝑖 and the normally distributed error terms 𝜀, hence following Greene
(2008) equation (5) is rewritten as:
𝑃𝑟𝑜𝑏 (𝑌𝑖 = 1) = 𝑈𝑖𝑗 = 𝐹(𝛽𝑖 𝑋𝑖) 𝑗 = 0 𝑎𝑛𝑑 1 (6)
According to Jones (2009) Probit model assumes that F represents the cumulative distribution
function (Φ) of a standard normal variable. The cumulative distribution function (Φ) is then
expressed as follow:
𝑃𝑟𝑜𝑏 (𝑌𝑖 = 1) = Φ (𝛽𝑖 𝑋𝑖) = ∫ 2𝜋−𝑜.5 exp (−𝑋𝑖
2
2) 𝑑𝑋𝑖
𝑋𝑖
−∞ (7)
The inverse of equation (7) gives the linear form of the Probit model also estimated in studies by
Oladejo et al., (2011) and Sebatta et al., (2014). It is stated as:
Φ−1(𝑝𝑖𝑗) = 𝑌𝑖∗ = 𝛽𝑖 𝑋𝑖 + 𝜀 (8)
The parameter estimates of the Probit model provide only the direction of the effect of the
independent variables on the dependent variable but they do not represent either the actual
magnitude of change (Demeke et al., 2014). The magnitudes of the coefficients of the Probit model
can be obtained by computing partial effects of the explanatory variables that is differentiating
equation (8) with respect to each explanatory variable.
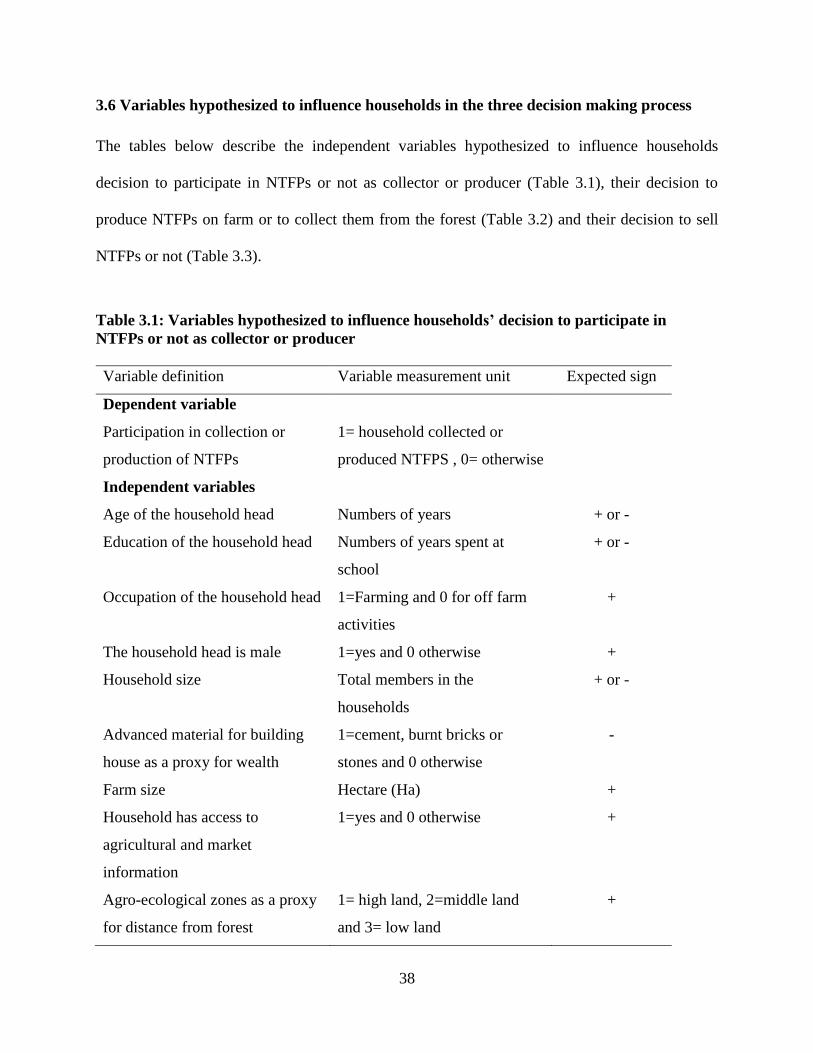
38
3.6 Variables hypothesized to influence households in the three decision making process
The tables below describe the independent variables hypothesized to influence households
decision to participate in NTFPs or not as collector or producer (Table 3.1), their decision to
produce NTFPs on farm or to collect them from the forest (Table 3.2) and their decision to sell
NTFPs or not (Table 3.3).
Table 3.1: Variables hypothesized to influence households’ decision to participate in
NTFPs or not as collector or producer
Variable definition Variable measurement unit Expected sign
Dependent variable
Participation in collection or
production of NTFPs
1= household collected or
produced NTFPS , 0= otherwise
Independent variables
Age of the household head Numbers of years + or -
Education of the household head Numbers of years spent at
school
+ or -
Occupation of the household head 1=Farming and 0 for off farm
activities
+
The household head is male 1=yes and 0 otherwise +
Household size Total members in the
households
+ or -
Advanced material for building
house as a proxy for wealth
1=cement, burnt bricks or
stones and 0 otherwise
-
Farm size Hectare (Ha) +
Household has access to
agricultural and market
information
1=yes and 0 otherwise
+
Agro-ecological zones as a proxy
for distance from forest
1= high land, 2=middle land
and 3= low land
+
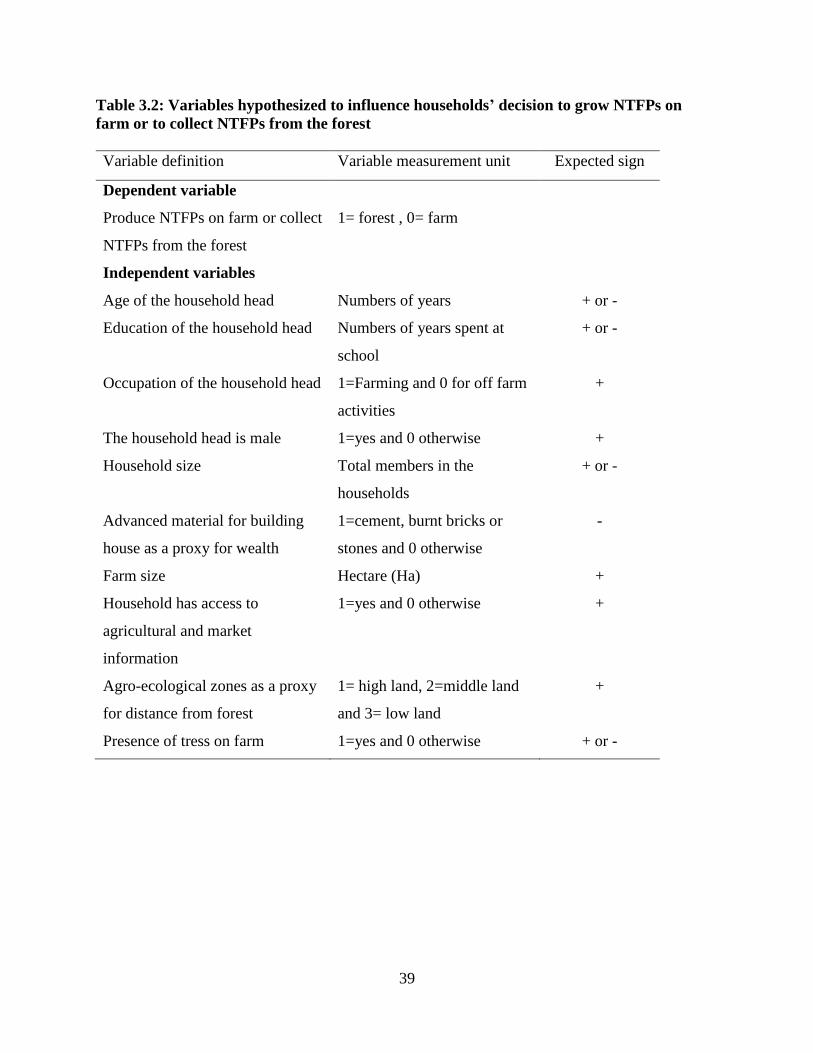
39
Table 3.2: Variables hypothesized to influence households’ decision to grow NTFPs on
farm or to collect NTFPs from the forest
Variable definition Variable measurement unit Expected sign
Dependent variable
Produce NTFPs on farm or collect
NTFPs from the forest
1= forest , 0= farm
Independent variables
Age of the household head Numbers of years + or -
Education of the household head Numbers of years spent at
school
+ or -
Occupation of the household head 1=Farming and 0 for off farm
activities
+
The household head is male 1=yes and 0 otherwise +
Household size Total members in the
households
+ or -
Advanced material for building
house as a proxy for wealth
1=cement, burnt bricks or
stones and 0 otherwise
-
Farm size Hectare (Ha) +
Household has access to
agricultural and market
information
1=yes and 0 otherwise
+
Agro-ecological zones as a proxy
for distance from forest
1= high land, 2=middle land
and 3= low land
+
Presence of tress on farm 1=yes and 0 otherwise + or -
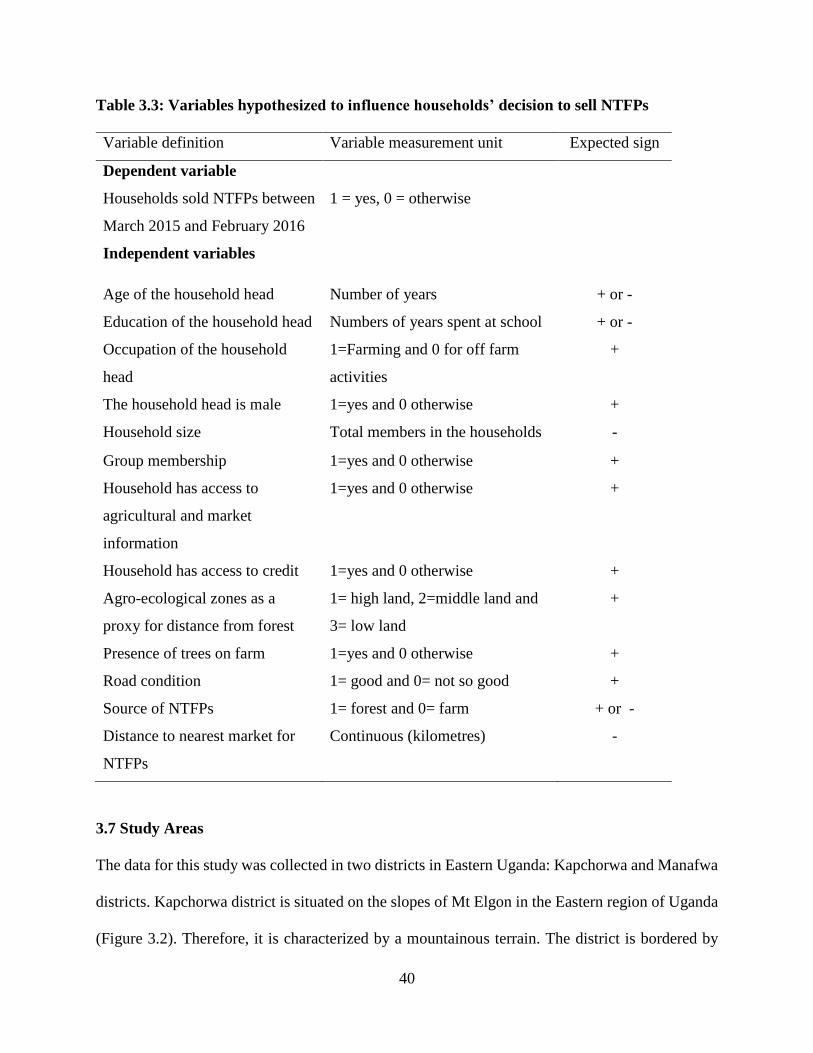
40
Table 3.3: Variables hypothesized to influence households’ decision to sell NTFPs
Variable definition Variable measurement unit Expected sign
Dependent variable
Households sold NTFPs between
March 2015 and February 2016
1 = yes, 0 = otherwise
Independent variables
Age of the household head Number of years + or -
Education of the household head Numbers of years spent at school + or -
Occupation of the household
head
1=Farming and 0 for off farm
activities
+
The household head is male 1=yes and 0 otherwise +
Household size Total members in the households -
Group membership 1=yes and 0 otherwise +
Household has access to
agricultural and market
information
1=yes and 0 otherwise
+
Household has access to credit 1=yes and 0 otherwise +
Agro-ecological zones as a
proxy for distance from forest
1= high land, 2=middle land and
3= low land
+
Presence of trees on farm 1=yes and 0 otherwise +
Road condition 1= good and 0= not so good +
Source of NTFPs 1= forest and 0= farm + or -
Distance to nearest market for
NTFPs
Continuous (kilometres) -
3.7 Study Areas
The data for this study was collected in two districts in Eastern Uganda: Kapchorwa and Manafwa
districts. Kapchorwa district is situated on the slopes of Mt Elgon in the Eastern region of Uganda
(Figure 3.2). Therefore, it is characterized by a mountainous terrain. The district is bordered by
41
Kween district in the Northeast and Eastern part, Sironko district in the Southern part and
Bulambuli district in the West and Northeast parts. A third of the area is public land that comprises
Mt. Elgon National Park (NEMA, 2008). Manafwa district lies on the South-Western slopes of
Mount Elgon and is bordered by Kenya to the East. The nearby town of Mbale serves as the
administrative and trading hub of the sub-region. Kapchorwa and Manafwa districts population
were estimated respectively at 104,580 and 352,864 respectively in 2014 (UBOS, 2014).
Agriculture is the primary economic activity in Kapchorwa and Manafwa districts. The area
receives high rainfall and is characterized mainly by volcanic soil which is favourable for growing
crops. The main crops are: maize, banana, beans, cassava, millet, cabbage, onions, tomatoes, sweet
potatoes, sorghum, potatoes, soya beans and groundnuts. Many farmers keep livestock such as
pigs, goats, chicken, and dairy cows, therefore animal manure is important for soil fertility. The
main trees on farm are coffee, avocado, mango, passion fruit, jack fruit, orange, guava, and papaya
(IUCN, 2008). Tree planting interventions in the area lead farmers to plant trees on farm. Some
common tree species include natal fig (ficus natalensis), red gum (eucalyptus grandis), grevillea
(grevillea robusta) and silk trees (albiza coriaria) (Wilson, 2015). The proximity of the districts
to Mt Elgon national park suggests that forest resource utilization by the local communities is not
new. The most commonly collected forest products are firewood, crop stakes and vegetables like
mushrooms, bamboo shoots (Scott, 1994).
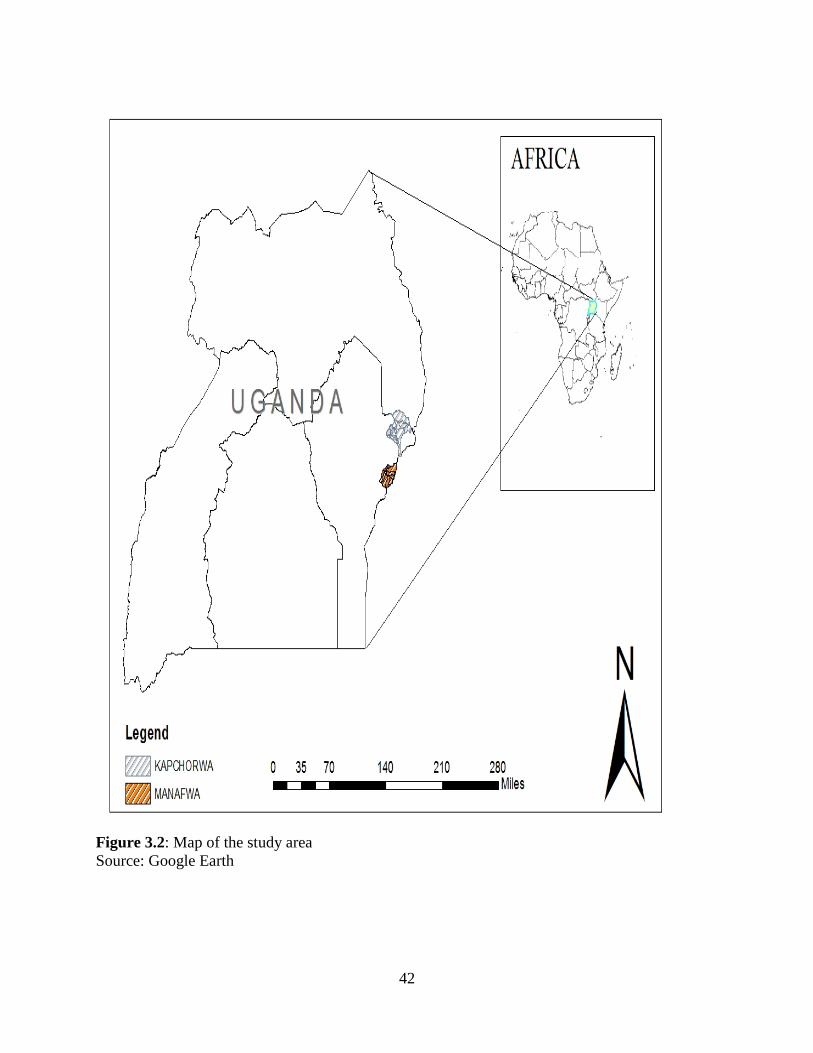
42
Figure 3.2: Map of the study area
Source: Google Earth
43
3.8 Sampling Design and Data Collection
3.8.1 Sampling Design
The sampling frame in this study is the household. Multistage sampling procedure was used to
sample households in Kapchorwa and Manafwa districts. First, one sub county was randomly
selected from each agro-ecological zones (the high land, middle land and low land) in each district.
Random sampling was preferred because it allows statistical inferences. In Manafwa district the
sub counties selected were Mukoto, Namabya and Butiru sub counties. In Kapchorwa district the
sub counties selected are Tegeres, Kapsesombe and Kabeywa sub counties. Households in high
and middle lands were expected to participate more in NTFPs collection. Projects promoting
agroforestry focus more on the low land, hence households in this area were expected to produce
NTFPs on farm. Therefore, the sub counties were chosen to ensure a representation of NTFPs
collectors from the forest and producers on farm. Second, six villages were randomly selected from
sub counties of Manafwa district and ten villages from sub counties of Kapchorwa district because
of the small population size of the district. Finally, the lists of households in each village were
provided by the chairman of each village. Simple random sampling was used to select households
from the villages. The name of the household heads in each sub county was numbered and the
table of random numbers was used to select those that appeared in the sample.
The sample size was determined using Cochran (1963) formula and following studies by Lehmann
et al., (2013) and Singh et al., (2014) as shown below:
𝑛𝑓 = 𝑍2𝑝𝑞
𝑑2 (9)
Where:
44
𝑛𝑓 = the desired sample size when the population is more than 10 000. Kapchorwa and Manafwa
districts population were estimated respectively at 104,580 and 352,864 in 2014 (UBOS,
2014).
p = proportion in the target population estimated to participate in NTFPs as collectors producers
or sellers NTFPs
d = the level of statistical significance
q = 1 - p
Fisher et al., (1983) recommend to use p = 50 percent when the standard deviation of the sample
is not known like it is the case for this study and hence p = 50 percent was used for this study. It
implies that the z-statistics is 1.96 and the desired level of statistical significance is 5 percent. The
minimum sample size according to equation (6) was:
𝑛𝑓 = 1.962 ∗ 0.5 ∗ 0.5
0.052= 384
Although calculated sample size was 384, the project financing this thesis covered a scope beyond
this study and aimed for a bigger sample. Since the study covered two districts 350 households
were surveyed in each district making 700 households. However, data from 67 households was
finally dropped due to missing information from data collection. Therefore, the total sample size
for this study came to 633 households with 321 households and 312 households in Kapchorwa and
Manafwa districts respectively. Overall, about 42 percent of households sampled were located in
the high land areas, approximately 35 percent and 22 percent were based in the medium and
lowland agro-ecological zones respectively. Households located in the high land are nearer to the
forest than households located in the middle and low land, the latter are the furthest from the forest.
45
3.8.2 Data collection procedure
Data collection was funded by World Agroforestry Center (ICRAF) through the project “Value
chain innovation platforms for food security”. A household survey was conducted to collect
primary data between May and June 2016 in Kapchorwa and Manafwa districts. Cross sectional
data was collected to identify factors that affect household participation in collection or production
of NTFPs as well as factors that affect their decision sell their products. The factors considered
include head of household’s age, farm size, household size, gender, access to market information,
distance of household’s dwelling to the market, type of land tenure and source of NTFPs.
Ten enumerators were selected based on their level of education and trained for data collection.
Enumerators with undergraduate degree in agriculture, experience with administration of
questionnaires and ability to communicate in local languages were selected. The training involved
explaining the objectives of the study, the meaning and implication of each question, interviewing
skills, time management during interviews, recording of answers and ethical issues related to
surveys. A total of 20 farmers were used to pre-test the questionnaires
3.8.3 Data analysis
The data collected was assessed to ensure that they were no missing information. Households with
missing information were removed from the sample. To ensure that the assumptions of the
econometric models are met heteroscedasticity and multicollinearity were tested for.
Test for Heteroscedasticity
Heteroscedasticity exists when the assumption that the variance of the error term is constant across
the observation is violated (Greene, 2008). In this case standard errors are large leading to small t-
46
value. Test for the presence of heteroscedasticity was done by use of the Breusch-Pagan and Cook-
Weisberg test. The specification tests of the null hypothesis, that the error term variances are not
constant across the observations. The test was implemented using hettest command in STATA
software version 13. The results of the heteroscedasticity test for household decision to participate
in NTFPs or not as collector or producer are given below:
Chi2 (1) = 3.37
Prob > Chi2 = 0.06
Similarly, the results of the heteroscedasticity test for household decision to produce NTFPs on
farm or to collect NTFPs from the forest are given below:
Chi2 (1) = 9.32
Prob > Chi2 = 0.00
For household decision to sell NTFPs the results are shown below:
Chi2 (1) = 10.29
Prob > Chi2 = 0.00
The chi-square value of 3.37 was small and was not statistically significant at 1 percent
consequently the null hypothesis of constant variance of the error terms across observations was
not rejected meaning that heteroscedasticity was not a problem. The chi-square values of 9.32 and
10.29 were large and were statistically significant at 1 percent consequently the null hypothesis of
constant variance of the error terms across observations was rejected meaning that
heteroscedasticity was a problem, therefore robust Probit model was used.
47
Test for Multicollinearity
Multicollinearity refers to the presence of linear relationships among the explanatory variables
used in a model. In the presence of multicollinearity the model yields wrong signs of coefficients,
high standard errors of coefficients and high R2 value even when individual parameter estimates
are not significant (Gujarati, 2003). The variance inflation factor (VIF) for each variable was
assessed to check for multicollinearity using STATA software version 13. If the VIF of a variable
exceeds 10, that variable is said to be highly collinear and can be excluded from the model. The
results of the multicollinearity tests are presented in the appendix 1. The test showed that none of
the variables of the three Probit models had a VIF greater than 10 indicating that there was no
serious problem of multicollinearity among the explanatory variables. After all these tests;
descriptive statistics and Probit models were used to achieve the specific objectives of the study
using STATA software version 13.
48
CHAPTER 4: RESULTS AND DISCUSSION
4.1 Socio-Economic Characteristics that affect Collection or Production of NTFPs by
Households
4.1.1 Household and Farm Characteristics
About 59 percent of the respondents collect or produce NTFPs while 41 percent did not collect or
produce (Table 4.1). The overall average age of the respondents was 44 years. A study on
determinants of market participation for potato’s farmers in Eastern Uganda by Sebatta et al.,
(2014) revealed that the average age in a sample of 200 potatoes farmers was about 40 years which
is similar to the result of this study. The mean age of NTFPS collectors was found to be 44 years
and that of non-collectors was also 44 years meaning that the mean age between collectors of
NTFPs and non-collectors were equal. The average number of years of schooling for the household
heads was seven years, showing that majority of the households had acquired primary education.
The average number of years of schooling of NTFPs collectors was found to be 7 years and that
of non-collectors was also 7 years meaning that both collectors and non-collectors had equal level
of education. This finding implies that both collectors and non-collectors in the study area are
relatively young and have an acceptable level of human capital.
The average family has four members while the highest membership was 12 people for some
households. Similarly the average family within collectors and non-collectors has four members.
About eighty-eight percent of the households surveyed are headed by men while 20 percent are
female headed. This is in line with the gender distribution in Uganda where about 77 percent of
households are male-headed and 30 percent are female-headed (UBOS, 2016). About 90 percent
of NTFPs collectors are headed by men while 10 percent are female headed. The explanation for
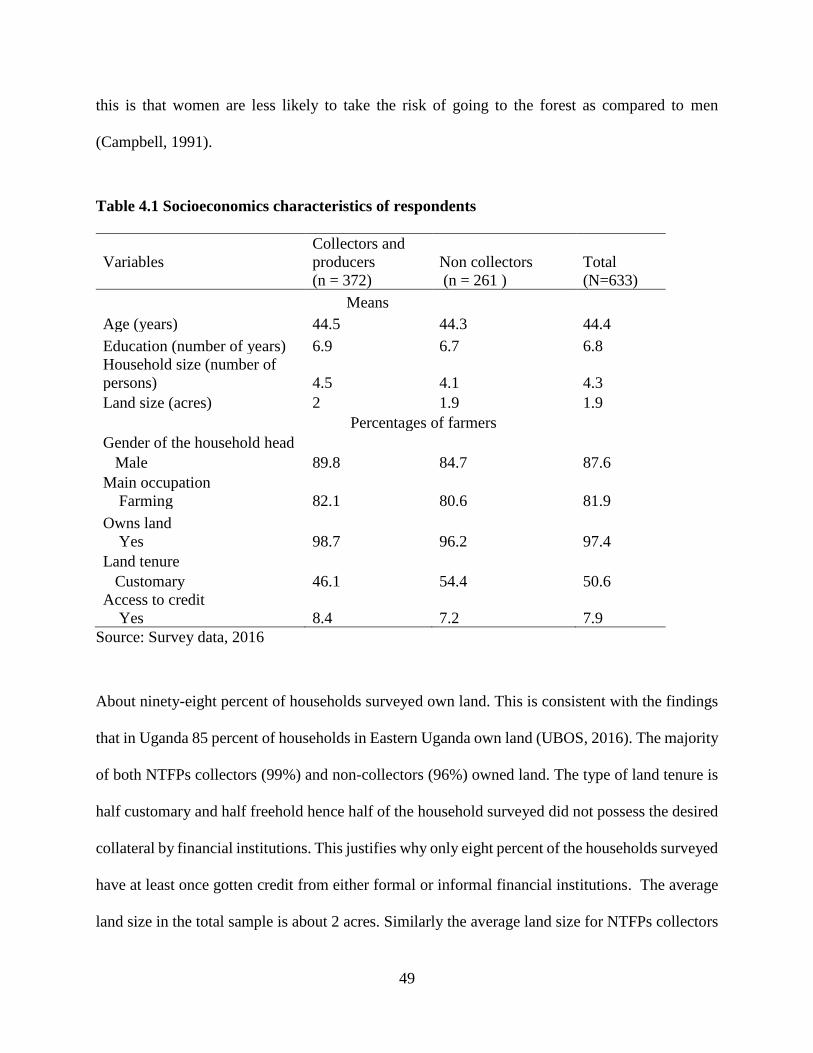
49
this is that women are less likely to take the risk of going to the forest as compared to men
(Campbell, 1991).
Table 4.1 Socioeconomics characteristics of respondents
Variables
Collectors and
producers
(n = 372)
Non collectors
(n = 261 )
Total
(N=633)
Means
Age (years) 44.5 44.3 44.4
Education (number of years) 6.9 6.7 6.8
Household size (number of
persons) 4.5 4.1 4.3
Land size (acres) 2 1.9 1.9
Percentages of farmers
Gender of the household head
Male 89.8 84.7 87.6
Main occupation
Farming 82.1 80.6 81.9
Owns land
Yes 98.7 96.2 97.4
Land tenure
Customary 46.1 54.4 50.6
Access to credit
Yes 8.4 7.2 7.9
Source: Survey data, 2016
About ninety-eight percent of households surveyed own land. This is consistent with the findings
that in Uganda 85 percent of households in Eastern Uganda own land (UBOS, 2016). The majority
of both NTFPs collectors (99%) and non-collectors (96%) owned land. The type of land tenure is
half customary and half freehold hence half of the household surveyed did not possess the desired
collateral by financial institutions. This justifies why only eight percent of the households surveyed
have at least once gotten credit from either formal or informal financial institutions. The average
land size in the total sample is about 2 acres. Similarly the average land size for NTFPs collectors
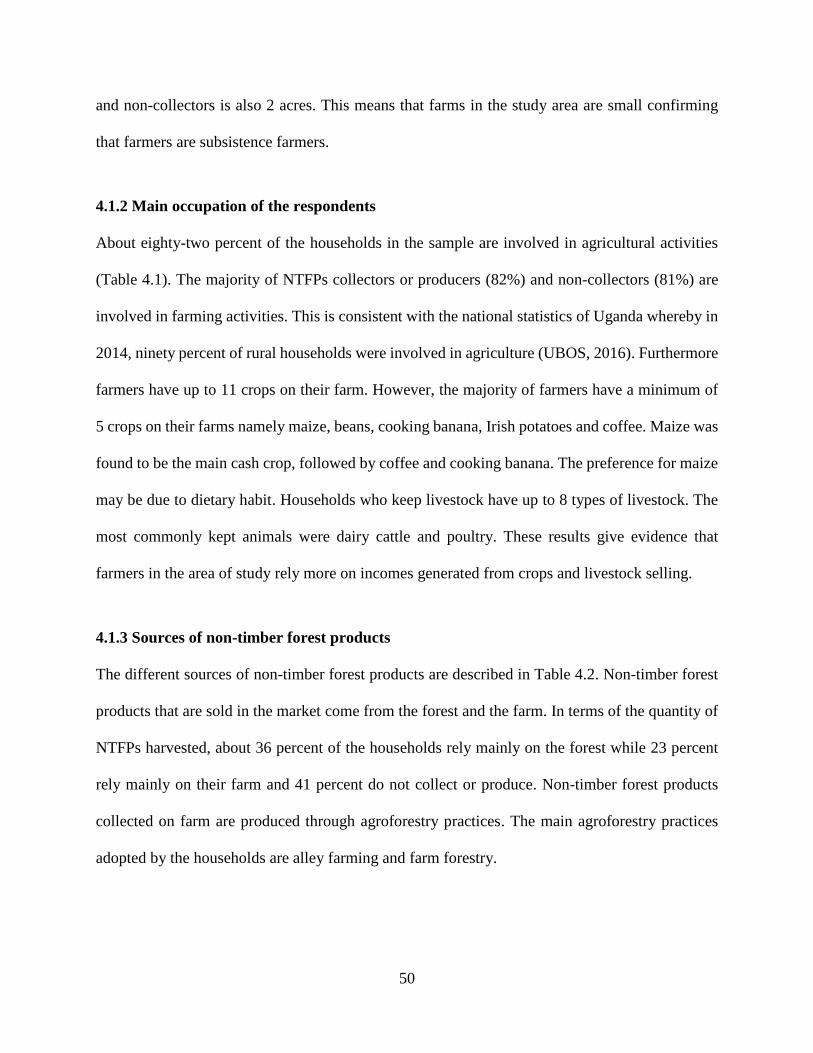
50
and non-collectors is also 2 acres. This means that farms in the study area are small confirming
that farmers are subsistence farmers.
4.1.2 Main occupation of the respondents
About eighty-two percent of the households in the sample are involved in agricultural activities
(Table 4.1). The majority of NTFPs collectors or producers (82%) and non-collectors (81%) are
involved in farming activities. This is consistent with the national statistics of Uganda whereby in
2014, ninety percent of rural households were involved in agriculture (UBOS, 2016). Furthermore
farmers have up to 11 crops on their farm. However, the majority of farmers have a minimum of
5 crops on their farms namely maize, beans, cooking banana, Irish potatoes and coffee. Maize was
found to be the main cash crop, followed by coffee and cooking banana. The preference for maize
may be due to dietary habit. Households who keep livestock have up to 8 types of livestock. The
most commonly kept animals were dairy cattle and poultry. These results give evidence that
farmers in the area of study rely more on incomes generated from crops and livestock selling.
4.1.3 Sources of non-timber forest products
The different sources of non-timber forest products are described in Table 4.2. Non-timber forest
products that are sold in the market come from the forest and the farm. In terms of the quantity of
NTFPs harvested, about 36 percent of the households rely mainly on the forest while 23 percent
rely mainly on their farm and 41 percent do not collect or produce. Non-timber forest products
collected on farm are produced through agroforestry practices. The main agroforestry practices
adopted by the households are alley farming and farm forestry.
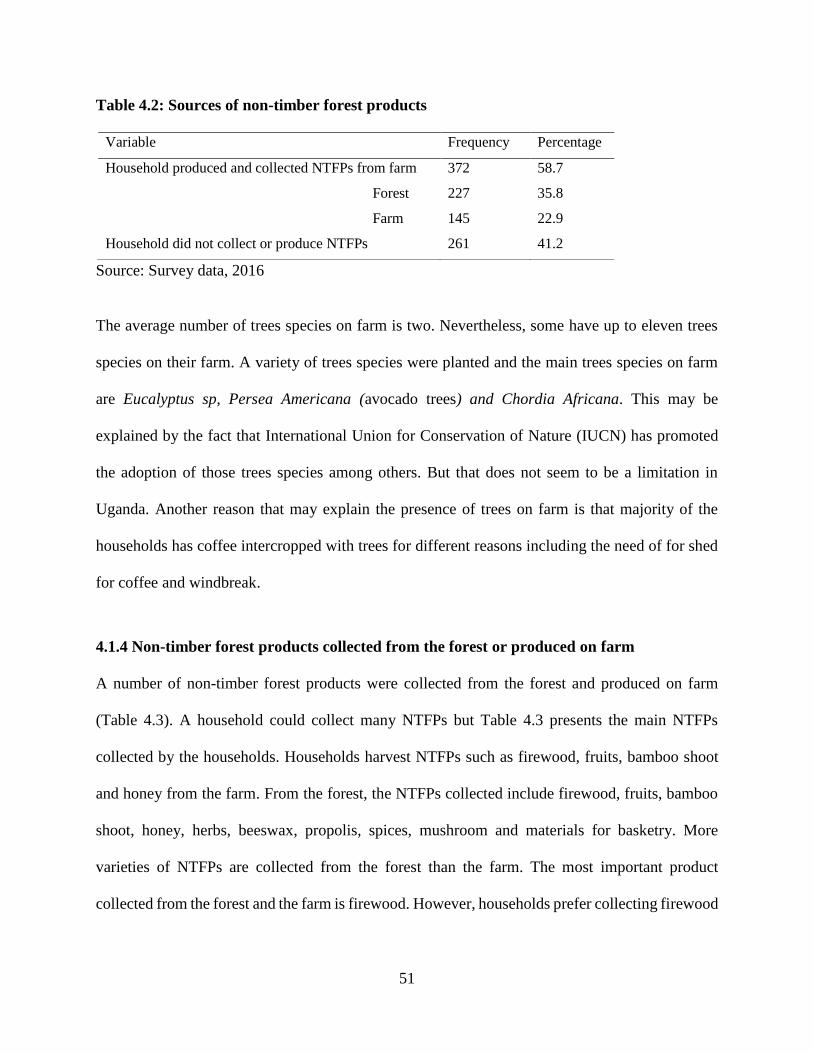
51
Table 4.2: Sources of non-timber forest products
Source: Survey data, 2016
The average number of trees species on farm is two. Nevertheless, some have up to eleven trees
species on their farm. A variety of trees species were planted and the main trees species on farm
are Eucalyptus sp, Persea Americana (avocado trees) and Chordia Africana. This may be
explained by the fact that International Union for Conservation of Nature (IUCN) has promoted
the adoption of those trees species among others. But that does not seem to be a limitation in
Uganda. Another reason that may explain the presence of trees on farm is that majority of the
households has coffee intercropped with trees for different reasons including the need of for shed
for coffee and windbreak.
4.1.4 Non-timber forest products collected from the forest or produced on farm
A number of non-timber forest products were collected from the forest and produced on farm
(Table 4.3). A household could collect many NTFPs but Table 4.3 presents the main NTFPs
collected by the households. Households harvest NTFPs such as firewood, fruits, bamboo shoot
and honey from the farm. From the forest, the NTFPs collected include firewood, fruits, bamboo
shoot, honey, herbs, beeswax, propolis, spices, mushroom and materials for basketry. More
varieties of NTFPs are collected from the forest than the farm. The most important product
collected from the forest and the farm is firewood. However, households prefer collecting firewood
Variable Frequency Percentage
Household produced and collected NTFPs from farm 372 58.7
Forest 227 35.8
Farm 145 22.9
Household did not collect or produce NTFPs 261 41.2
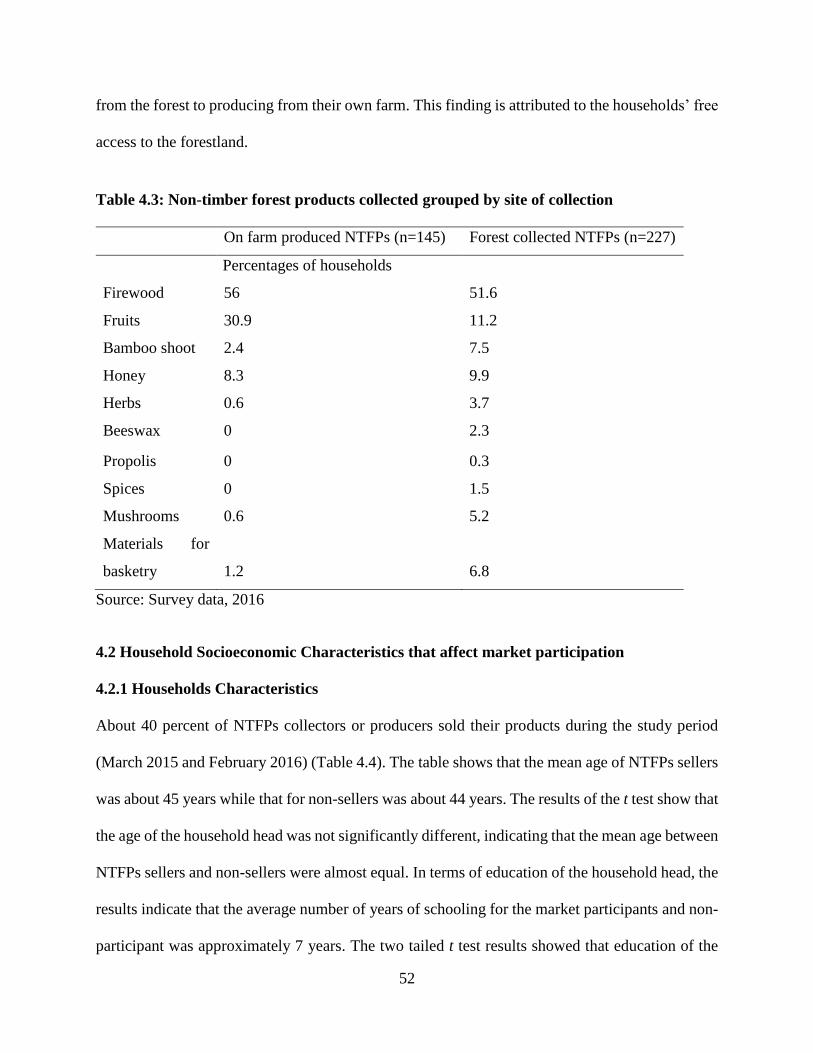
52
from the forest to producing from their own farm. This finding is attributed to the households’ free
access to the forestland.
Table 4.3: Non-timber forest products collected grouped by site of collection
On farm produced NTFPs (n=145) Forest collected NTFPs (n=227)
Percentages of households
Firewood 56 51.6
Fruits 30.9 11.2
Bamboo shoot 2.4 7.5
Honey 8.3 9.9
Herbs 0.6 3.7
Beeswax 0 2.3
Propolis 0 0.3
Spices 0 1.5
Mushrooms 0.6 5.2
Materials for
basketry 1.2 6.8
Source: Survey data, 2016
4.2 Household Socioeconomic Characteristics that affect market participation
4.2.1 Households Characteristics
About 40 percent of NTFPs collectors or producers sold their products during the study period
(March 2015 and February 2016) (Table 4.4). The table shows that the mean age of NTFPs sellers
was about 45 years while that for non-sellers was about 44 years. The results of the t test show that
the age of the household head was not significantly different, indicating that the mean age between
NTFPs sellers and non-sellers were almost equal. In terms of education of the household head, the
results indicate that the average number of years of schooling for the market participants and non-
participant was approximately 7 years. The two tailed t test results showed that education of the
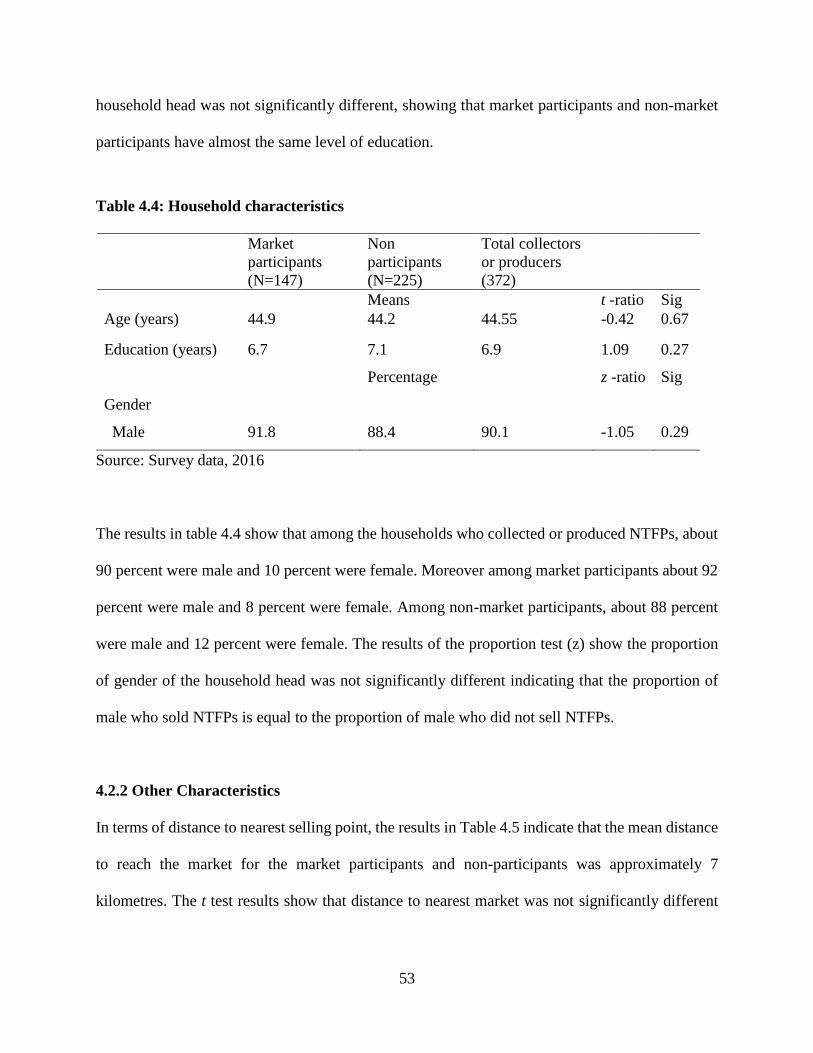
53
household head was not significantly different, showing that market participants and non-market
participants have almost the same level of education.
Table 4.4: Household characteristics
Market
participants
(N=147)
Non
participants
(N=225)
Total collectors
or producers
(372)
Means t -ratio Sig
Age (years) 44.9 44.2 44.55 -0.42 0.67
Education (years) 6.7 7.1 6.9 1.09 0.27
Percentage z -ratio Sig
Gender
Male 91.8 88.4 90.1 -1.05 0.29
Source: Survey data, 2016
The results in table 4.4 show that among the households who collected or produced NTFPs, about
90 percent were male and 10 percent were female. Moreover among market participants about 92
percent were male and 8 percent were female. Among non-market participants, about 88 percent
were male and 12 percent were female. The results of the proportion test (z) show the proportion
of gender of the household head was not significantly different indicating that the proportion of
male who sold NTFPs is equal to the proportion of male who did not sell NTFPs.
4.2.2 Other Characteristics
In terms of distance to nearest selling point, the results in Table 4.5 indicate that the mean distance
to reach the market for the market participants and non-participants was approximately 7
kilometres. The t test results show that distance to nearest market was not significantly different
54
meaning the mean distance that separate NTFPs sellers and non-sellers to the market were almost
equal.
Approximately 33 percent of households who collected or produced NTFPs reported that they have
ever been a member of a farmer group. This can be explained by the fact that the groups do not
always meet their expectations. This result is almost similar to the finding of the Uganda census
of agriculture in 2009 where 17 percent of households in Eastern Uganda were reported to belong
to groups. According to Davis et al., (2010) the low membership in farmer groups in African
countries may be explained by the lack of information and the low budgetary allocations to farmer
institution development. Approximately 69 percent of households who were able to join groups
were motivated by the fact that it helps them to increase their income. Therefore, fixed transaction
costs faced by farmers are reduced. The majority of the groups are composed of men and women
of different ages. It has been reported that the main services that the majority of groups offer is
savings services. The results of the z test presented in table 4.5 shows that there was no difference
between market participants and non-participants in terms group membership of the household
head. It suggests that the proportion of NTFPs sellers who belong to groups is almost equal to the
proportion on non-sellers who also belong to groups.
About twenty-eight percent of the NTFPs collectors had access to agricultural and market
information mainly through radio, government extension agents and others farmers. Advice is
received about crop production, natural resources management and market opportunities of NTFPs
such as potential buyers and best prices for their products. In most of the cases the extension agents
visit the households. In 2009, 19 percent of agricultural households surveyed reported that they
had been visited at least once by extension agents (UBOS, 2011). One possible reason for that
55
might be the failure of the national programme entitled ‘operation wealth creation’ to take over the
advisory services as planned. Instead it leaned toward input distribution. The program was
established in 2002 and its objective is to facilitate socioeconomic transformation of household by
raising their incomes to eradicate poverty. The results of the z test further show that, access to
credit and agricultural information did not vary significantly between market participants and non-
participants. This means that equal proportion have access to credit and agricultural information
from the two groups.
About thirty-five percent of the NTFPs collectors or producers in the sample used permanent
construction materials such as cement, burnt bricks and stones while others used mud, dirt, zinc
and iron to build their wall (Table 4.5). Similarly, the Uganda national population and housing
census reported that about 35 percent of rural households have built their walls with permanent
materials (UBOS, 2016). This variable is a proxy for the standard of living of the households and
the result gives evidence that majority of households have low standard of living. This result
suggests that more developmental actions are required in the area of study. The results of the z test
show that wealth status did not vary significantly between market participants and non-
participants. This means that equal proportion of households were rich and poor (as shown by
quality of construction materials) from the two groups.
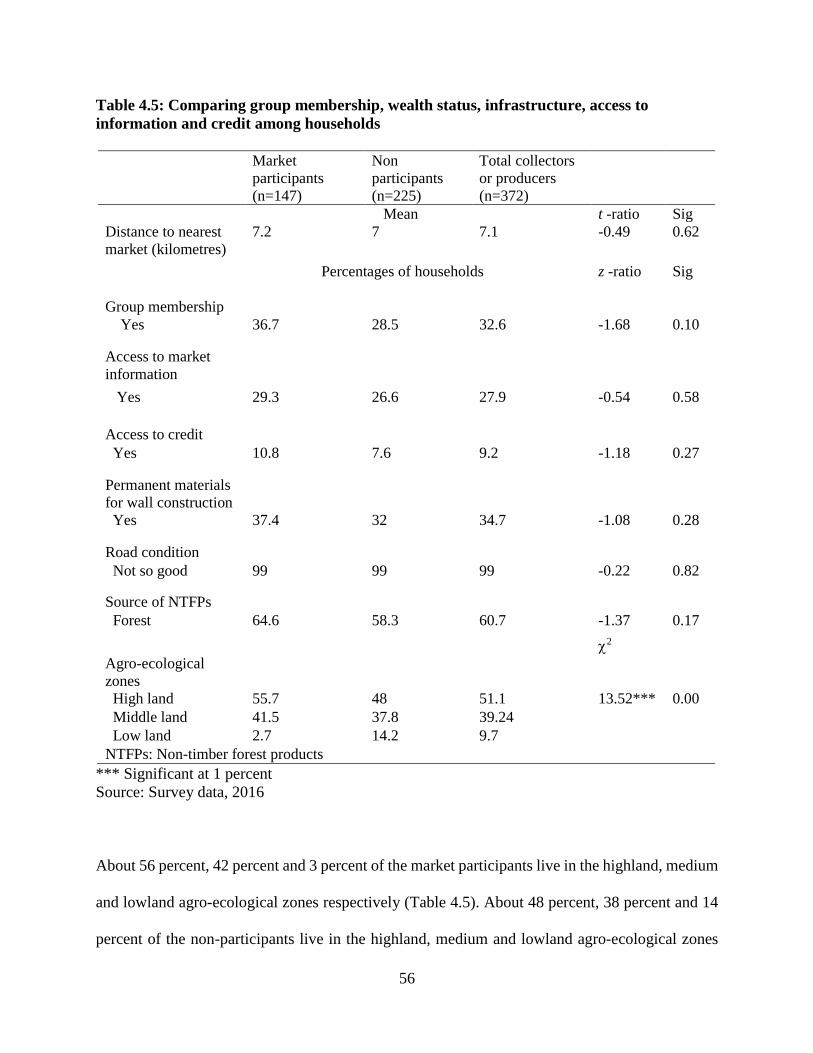
56
Table 4.5: Comparing group membership, wealth status, infrastructure, access to
information and credit among households
*** Significant at 1 percent
Source: Survey data, 2016
About 56 percent, 42 percent and 3 percent of the market participants live in the highland, medium
and lowland agro-ecological zones respectively (Table 4.5). About 48 percent, 38 percent and 14
percent of the non-participants live in the highland, medium and lowland agro-ecological zones
Market
participants
(n=147)
Non
participants
(n=225)
Total collectors
or producers
(n=372)
Mean t -ratio Sig
Distance to nearest
market (kilometres)
7.2 7 7.1 -0.49 0.62
Percentages of households z -ratio
Sig
Group membership
Yes 36.7 28.5 32.6 -1.68 0.10
Access to market
information
Yes 29.3 26.6 27.9 -0.54 0.58
Access to credit
Yes 10.8 7.6 9.2 -1.18 0.27
Permanent materials
for wall construction
Yes 37.4 32 34.7 -1.08 0.28
Road condition
Not so good 99 99 99 -0.22 0.82
Source of NTFPs
Forest 64.6 58.3 60.7 -1.37 0.17
2
Agro-ecological
zones
High land 55.7 48 51.1 13.52*** 0.00
Middle land 41.5 37.8 39.24
Low land 2.7 14.2 9.7
NTFPs: Non-timber forest products
57
respectively. The results of the z test show that the proportion of households living in the different
agro-ecological zones varied significantly between market participants and non-participants at one
percent. It suggests that the majority of the households living in lowland do not sell NTFPs. Agro-
ecological zones is also a proxy to access the distance to source of NTFPs meaning that households
in lowland do not sell NTFPs because they are far from the main source of NTFPs which is forest.
Table 4.5 also shows that among the market participants, almost 65 percent collected NTFPs from
the forest while 35 percent collected them from the farm. Among the non-participants about 59
percent collected their products from the forest while 42 percent produced them on the farm. The
results of the z test further show that the choice of source of NTFPs did not vary significantly
between market participants and non-participants. This means that equal proportions choose forest
and farm as source of NTFPs from the two groups.
4.2.3 Distribution of non-timber forest products sold by households
Among the 147 households that sold NTFPs, about 48 percent (70 households) sold NTFPs
harvested on farm while 52 percent (77 households) sold NTFPs collected from forest (Table 4.6).
A Household could sell many NTFPs but Table 4.6 presents the main NTFPs sold by the
households. The results show that main NTFPs sold by households include firewood, fruits,
bamboo shoot, honey, herbs produced on the farm and materials for basketry collected from the
forest. Among those products firewood, fruits and honey are sold by most of the households.
Barany (2003) also found that firewood is highly demanded because it is the main source of
cooking energy used to convert food supplies into adequate diets in rural areas. Non-timber forest
products are sold directly to individuals.
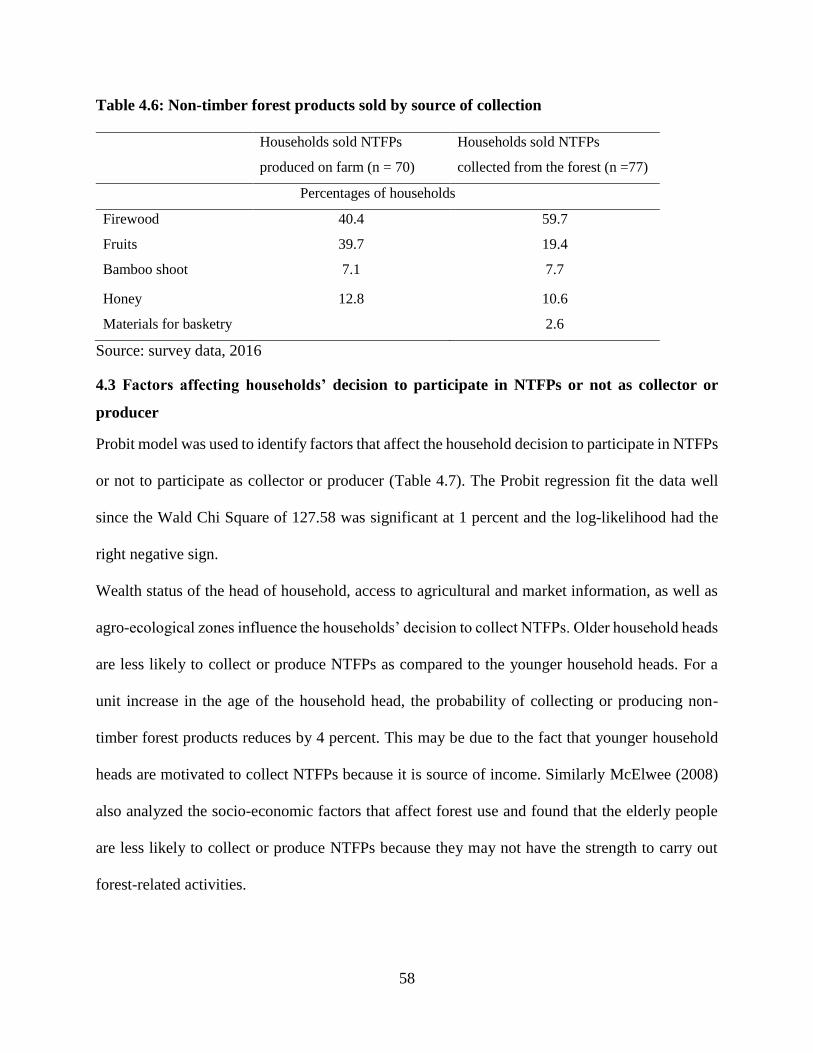
58
Table 4.6: Non-timber forest products sold by source of collection
Households sold NTFPs
produced on farm (n = 70)
Households sold NTFPs
collected from the forest (n =77)
Percentages of households
Firewood 40.4 59.7
Fruits 39.7 19.4
Bamboo shoot 7.1 7.7
Honey 12.8 10.6
Materials for basketry 2.6
Source: survey data, 2016
4.3 Factors affecting households’ decision to participate in NTFPs or not as collector or
producer
Probit model was used to identify factors that affect the household decision to participate in NTFPs
or not to participate as collector or producer (Table 4.7). The Probit regression fit the data well
since the Wald Chi Square of 127.58 was significant at 1 percent and the log-likelihood had the
right negative sign.
Wealth status of the head of household, access to agricultural and market information, as well as
agro-ecological zones influence the households’ decision to collect NTFPs. Older household heads
are less likely to collect or produce NTFPs as compared to the younger household heads. For a
unit increase in the age of the household head, the probability of collecting or producing non-
timber forest products reduces by 4 percent. This may be due to the fact that younger household
heads are motivated to collect NTFPs because it is source of income. Similarly McElwee (2008)
also analyzed the socio-economic factors that affect forest use and found that the elderly people
are less likely to collect or produce NTFPs because they may not have the strength to carry out
forest-related activities.
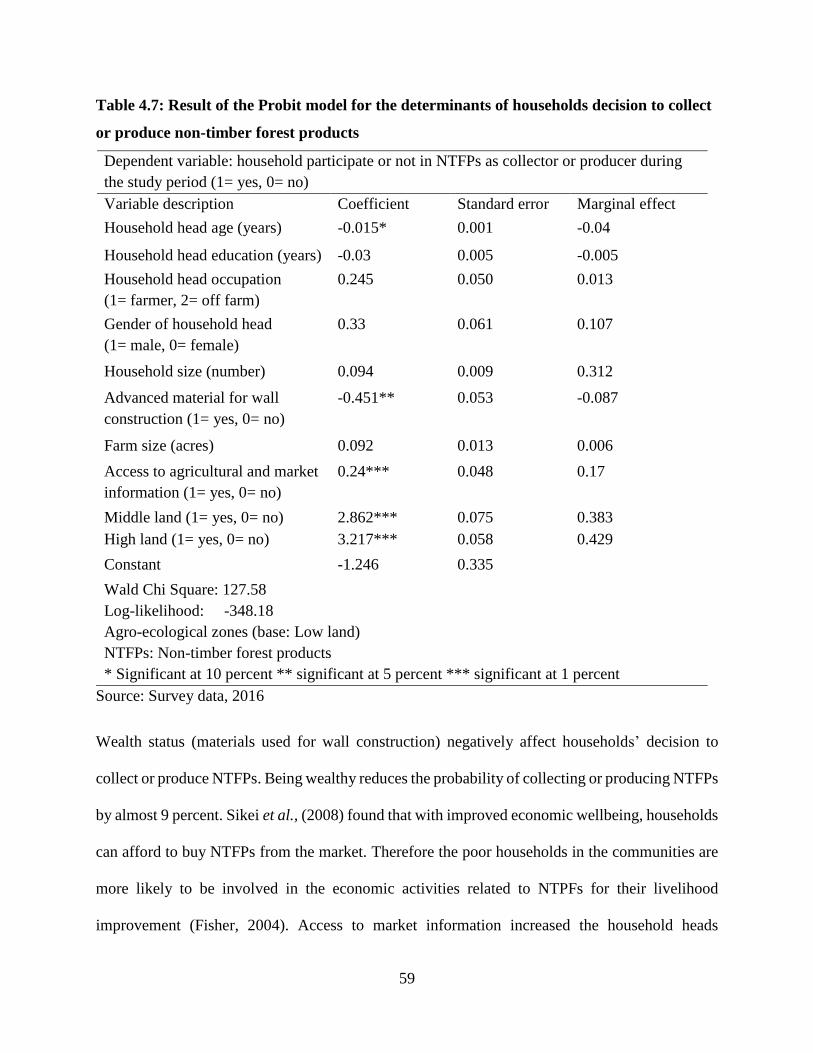
59
Table 4.7: Result of the Probit model for the determinants of households decision to collect
or produce non-timber forest products
Dependent variable: household participate or not in NTFPs as collector or producer during
the study period (1= yes, 0= no)
Variable description Coefficient Standard error Marginal effect
Household head age (years) -0.015* 0.001 -0.04
Household head education (years) -0.03 0.005 -0.005
Household head occupation
(1= farmer, 2= off farm)
0.245 0.050 0.013
Gender of household head
(1= male, 0= female)
0.33 0.061 0.107
Household size (number) 0.094 0.009 0.312
Advanced material for wall
construction (1= yes, 0= no)
-0.451** 0.053 -0.087
Farm size (acres) 0.092 0.013 0.006
Access to agricultural and market
information (1= yes, 0= no)
0.24*** 0.048 0.17
Middle land (1= yes, 0= no) 2.862*** 0.075 0.383
High land (1= yes, 0= no) 3.217*** 0.058 0.429
Constant -1.246 0.335
Wald Chi Square: 127.58
Log-likelihood: -348.18
Agro-ecological zones (base: Low land)
NTFPs: Non-timber forest products
* Significant at 10 percent ** significant at 5 percent *** significant at 1 percent
Source: Survey data, 2016
Wealth status (materials used for wall construction) negatively affect households’ decision to
collect or produce NTFPs. Being wealthy reduces the probability of collecting or producing NTFPs
by almost 9 percent. Sikei et al., (2008) found that with improved economic wellbeing, households
can afford to buy NTFPs from the market. Therefore the poor households in the communities are
more likely to be involved in the economic activities related to NTPFs for their livelihood
improvement (Fisher, 2004). Access to market information increased the household heads
60
probability of collecting or producing NTFPs by 17 percent. This may be because greater access
to market information often accelerates collection or production of NTFPs that can be sold by
households (Angelsen and Kaimowitz, 1999).
For a unit increase in the household size the probability of collecting or producing non-timber
forest products increased by 30 percent. This may be because bigger households can be associated
with the availability of labour for NTFPs collection or production. Similarly, a study conducted by
Rodrigez (2007) on the determinants of NTFPs collection revealed that the presence of an
additional individual in the household will increase household probability to collect NTFPs in
India.
Agro-ecological zones positively affect a household’s decision to collect or produce NTFPs.
Residing in highland and middle land increases the probability of collecting or producing non-
timber forest products by 43 percent and 38 percent respectively. Households based in high and
middle agro-ecological zones are more likely to collect or produce NTFPs as compared to
households in the lowland maybe because they are closer to the source of NTFPs as found by
Opaluwa et al., (2011) in Nigeria.
4.4 Factors affecting households decision to produce NTFPs on farm or to collect them form
the forest
Probit model was used to identify factors that affect household head’s decision to produce NTFPs
on farm or to collect NTFPs from the forest; choice of the source non-timber forest products (Table
4.8). The robust Probit regression fit the data well since the Wald Chi Square of 96.54 was
significant at 1 percent and the log-likelihood had the right negative sign.
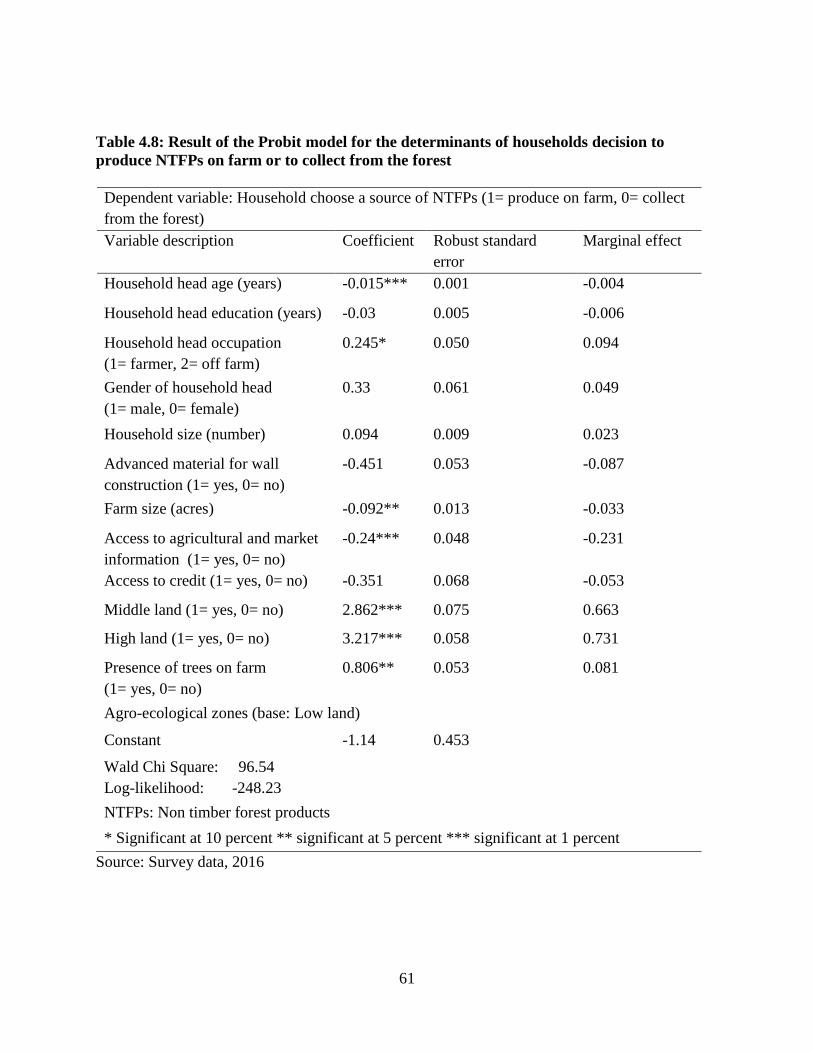
61
Table 4.8: Result of the Probit model for the determinants of households decision to
produce NTFPs on farm or to collect from the forest
Dependent variable: Household choose a source of NTFPs (1= produce on farm, 0= collect
from the forest)
Variable description Coefficient Robust standard
error
Marginal effect
Household head age (years) -0.015*** 0.001 -0.004
Household head education (years) -0.03 0.005 -0.006
Household head occupation
(1= farmer, 2= off farm)
0.245* 0.050 0.094
Gender of household head
(1= male, 0= female)
0.33 0.061 0.049
Household size (number) 0.094 0.009 0.023
Advanced material for wall
construction (1= yes, 0= no)
-0.451 0.053 -0.087
Farm size (acres) -0.092** 0.013 -0.033
Access to agricultural and market
information (1= yes, 0= no)
-0.24*** 0.048 -0.231
Access to credit (1= yes, 0= no) -0.351 0.068 -0.053
Middle land (1= yes, 0= no) 2.862*** 0.075 0.663
High land (1= yes, 0= no) 3.217*** 0.058 0.731
Presence of trees on farm
(1= yes, 0= no)
0.806** 0.053 0.081
Agro-ecological zones (base: Low land)
Constant -1.14 0.453
Wald Chi Square: 96.54
Log-likelihood: -248.23
NTFPs: Non timber forest products
* Significant at 10 percent ** significant at 5 percent *** significant at 1 percent
Source: Survey data, 2016
62
Household size, land size, age and occupation of the household head, presence of trees on farm
and agro-ecological zones do influence the household choice of the source of non-timber forest
products. For a unit increase in the age of the household head, the probability of collecting non-
timber forest products from the forest reduces by 0.4 percent. This may be due to the fact that
younger household heads have insecure tenure arrangements compared to older household heads,
hence they have to rely on the forest. Moreover, in Uganda older household heads have large farms
as compared to the younger household heads. Ndayambaje et al., (2012) also found that in Rwanda
that, age of the household head is strongly related to farm size. Therefore younger households who
have small land size are less likely to plant trees on farm, and they are more likely to collect NTFPs
from the forest.
For a unit increases in the land size the probability of collecting NTFPs from the forest over
producing on farm will reduce by three percent. This may be because households adopt
agroforestry practices when the size of their land is increases. Mukuralinda et al., (1999) also found
that small farm size is one the factors that limit farmers to plant trees or the intensity of tree
planting. Therefore, when the size of land increases the reliance on forest may likely reduce.
Farmers are more likely to choose the forest as the source NTFPs over farm as compared to the
household heads who are not involved in farming activities. Calculated marginal effects indicate
that the state of being a full time farmer increases the probability of collecting non-timber forest
products from the forest over producing them on farm by nine percent. This might be due to the
fact that farmers are constrained by the size of their land to plant trees on farm hence they collect
NTFPs from the forest because it is free.
63
Access to both agricultural and market information reduces the probability of collecting NTFPs
from the forest over producing on farm by 23 percent. This may be explained by the fact that in
the study area government extension agents in collaboration with private donors promote
agroforestry practices in which 42 percent of the respondents are involved and hence they can
produce NTFPs on their farm.
Having trees on farm increases the probability of collecting NTFPs from the forest over producing
them from the farm by eight percent. This finding can be explained by the fact that household who
have trees on farm also collect NTFPs from the forest in order to supplement the NTFPs produced
on the farm. This result is in line with the descriptive statistics which reveal that most of the
household heads that have trees on farm are still collecting NTFPs from the forest. This might be
because access to the forest is free. Similarly, according to FAO (1985) as long as NTFPs can be
collected from the forests without paying for it, farmers will not be motivated to harvest NTFPs
from the farm. Another possible reason could be that households could be having young trees,
which may not be ready for harvesting; hence they have to rely on the forest or the market.
Being a resident of high and middle lands, increase the probability of collecting non-timber forest
products from the forest as compared to producing from the farm by 73 percent and 66 percent
respectively. Households based in the high and middle agro-ecological zones are more likely to
choose the forest as the source of NTFPs over farm as compared to households in the low agro-
ecological zone. These results can be explained by the fact that households in middle and high
lands are closer to the forest than those in the low land. Fisher et al., (2005) and Vikram (2006)
64
also found that there is an inverse relationship between decision to choose a source of NTFPs and
distance to the source of non-timber forest products.
4.5 Factors affecting households decision to participate in non-timber forest products market
About 40 percent of the households who collected NTFPs were selling NTFPs during the last
agricultural year. Robust Probit regression was estimated and it fit the data well since the Wald
Chi Square of 42.80 was significant at 1 percent and the log-likelihood had the right negative sign.
The result of the Probit model shows that presence of trees on farm, wealth status and agro-
ecological zones like high and middle lands are significant at one percent, while head of household
education and gender are significant at 10 percent. All those variables have the expected signs.
However, some variables that are expected to be significant are not significant. A unit increases in
the year of education reduces the probability of selling NTFPs by one percent. The possible
explanation might be that households with a higher level of education are more likely to get white
collar jobs. This observation is similar to findings by Musah et al., (2014), who argued that heads
of households who spent more time at school are less likely to participate in maize market in
Ghana. However, the results of this study contradicts the expectation of Randela et al., (2008) who
found that highly educated household heads were more likely to participate in the market since
they are empowered with better production and managerial skills.
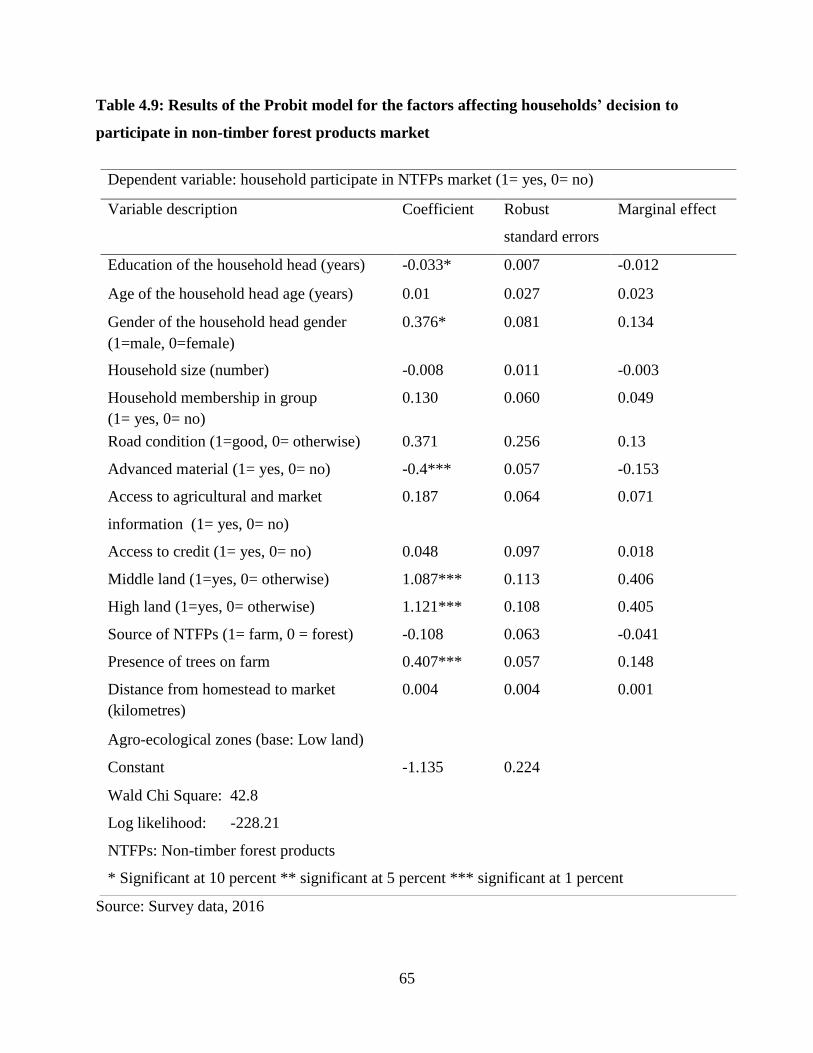
65
Table 4.9: Results of the Probit model for the factors affecting households’ decision to
participate in non-timber forest products market
Source: Survey data, 2016
Dependent variable: household participate in NTFPs market (1= yes, 0= no)
Variable description Coefficient Robust
standard errors
Marginal effect
Education of the household head (years) -0.033* 0.007 -0.012
Age of the household head age (years) 0.01 0.027 0.023
Gender of the household head gender
(1=male, 0=female)
0.376* 0.081 0.134
Household size (number) -0.008 0.011 -0.003
Household membership in group
(1= yes, 0= no)
0.130 0.060 0.049
Road condition (1=good, 0= otherwise) 0.371 0.256 0.13
Advanced material (1= yes, 0= no) -0.4*** 0.057 -0.153
Access to agricultural and market
information (1= yes, 0= no)
0.187 0.064 0.071
Access to credit (1= yes, 0= no) 0.048 0.097 0.018
Middle land (1=yes, 0= otherwise) 1.087*** 0.113 0.406
High land (1=yes, 0= otherwise) 1.121*** 0.108 0.405
Source of NTFPs (1= farm, 0 = forest) -0.108 0.063 -0.041
Presence of trees on farm 0.407*** 0.057 0.148
Distance from homestead to market
(kilometres)
0.004 0.004 0.001
Agro-ecological zones (base: Low land)
Constant -1.135 0.224
Wald Chi Square: 42.8
Log likelihood: -228.21
NTFPs: Non-timber forest products
* Significant at 10 percent ** significant at 5 percent *** significant at 1 percent
66
Male headed households had 13 percent higher probability of selling NTFPs. In most cases, it is
the males in a family who make the decisions on whether to sell most of the agricultural
commodities and this seems to be the case even for NTFPs in the study area. This means that
females are less likely to participate in the process of selling NTFPs. Related to that Sebatta et al.,
(2014) and Demeke et al., (2014) showed that women rarely had similar access to assets and
markets as men, which led to different levels of participation in the markets. But male headed
households were found to be less involved in maize market in Western Ghana (Musah et al., 2014).
Being rich as shown by quality of construction materials; reduces the household probability to sell
NTFPs by 15 percent. Similar result was found by Ndayambaje et al., (2012) in Rwanda. However
this result contradicts the finding of Kepe (2000), who found that in Zimbabwe wealthier
households were more likely to sell NTFPs. Having trees on farm increases the probability of
selling NTFPs by almost 15 percent. This suggests that trees on farm positively influences the
decision to sell NTFPs. Ndayambaje et al., (2012), found that selling of tree products could have
a strong impact on the presence of trees on farms showing that the relation between the two
variables are vice versa. Being a resident of high and medium agro-ecological zones increases the
probability of selling NTFPs by 40 percent each. The possible explanation for this is that
households in high and middle lands also collect NTFPs from farm apart from collecting them
from the forest and therefore are likely to have more surplus than households in the lowland.
67
CHAPTER 5: SUMMARY, CONCLUSION AND RECOMMENDATIONS
5.1 Summary
In Uganda, rural households depend for their diverse needs on non-timber forest products collected
from the forest, farm or bought from the market. Non-timber forest products (NTFPs) are forest-
derived tradable products and they play an important role in improving household nutritional and
economic status. Since the Eastern region continues to register poverty levels above the national
average, it is likely that NTFPs selling can be one source of income which can help to reduce the
level of poverty and improve the livelihood of the households in the study area. For this reason,
one of the objectives of the Uganda Government is to develop markets for non-timber forest
products (NDPII, 2015). However the majority of studies done on farmers’ market participation in
Uganda have concentrated on grain staple especially maize. Little attention has been given to
NTFPs even though it is generally recognized that they contribute to household income generation
in the study area (IUCN, 2008).
To increase the contribution of NTFPs to household livelihood, it is important to study the factors
that affect households’ decision to participate in NTFPs or not as collector and producer, their
decision to produce NTFPs on farm or to collect them from the forest and their decision to
participate in non-timber forest products market as seller or not. This is important given that this
gap in knowledge prevented the Government from considering NTFPs as an avenue for poverty
alleviation.
Since household’s decision to sell non-timber forest products is contingent on their decision to
collect NTFPs, the overall objective of this study was to assess the factors that affect household
decision to participate in non-timber forest products market as sellers by collecting them from the
68
forest or producing them on farm in Eastern Uganda. The specific objectives were to identify the
key factors that affect households’ decision to collect NTFPs, to determine the factors that
influence their choice of the source of NTFPs and to examine the key factors that influence their
decision to participate in non-timber forest products market as sellers.
To achieve these objectives, primary data on socio-economic characteristics of rural households
were collected in Kapchowa and Manafwa districts using a semi-structured questionnaire. The
districts were selected because of their proximity to Mount Elgon national park and the diversity
of tree planting projects in the area. A sample of 633 households was randomly selected through
multistage sampling procedure. First, one sub-county was identified from each agro-ecological
zones (high, middle and low land) in each district. Second, six villages were selected in every sub-
county of Manafwa district and ten villages in every sub-county of Kapchorwa district because of
the small population size of villages in that district. Finally, the lists of households in each village
were provided by the chairman of each village and simple random sampling was used to select
households from the villages. Descriptive statistics and Probit model was used to achieve the three
objectives
5.2 Conclusion
Characteristics of households in the area of study
About 42, 35 and 22 percent of the households interviewed were located in the high land, middle
land and low land respectively. About 59 percent of the households surveyed collected NTFPs
from the forest or produced them on farm. Non-timber forest products collected from the forest or
produced on farm include firewood, fruits, bamboo shoot, herbs, medicinal plants, beeswax,
honey, propolis, spices, mushroom and materials for basketry. Of the 372 households that collected
69
or produced NTFPs, about 61 percent collected them from the forest while 39 percent produced
them on farm. Moreover about 40 percent of NTFPs collectors or producers sold their products
between March 2015 and February 2016. Non-timber forest products sold include firewood, fruits,
honey and bamboo shoot.
The study found that only twenty percent of the households surveyed had land title implying that
majority of households did not possess the desired collateral by financial institutions. This could
explain why only eight percent of the households had access to financial services. Only twenty-
three percent of the households had access to both extension services and market information in
terms of the prices of NTFPs. Therefore effort should be made to avail technical knowledge to
households especially on NTFPs harvesting technology and market opportunities using existing
farmer groups. The mean distance to reach the market for crops and non-timber forest products
was seven kilometres. Furthermore, majority of the households (70 percent) reported that the road
conditions were bad. This means that households are constrained by long distances to urban market
outlets as well as poor roads infrastructure.
Determinants of households decision to collect or produce NTFPs
The results of the Probit model showed negative significant influence of age and wealth status of
the household heads on their decision to participate in NTFPs as collector or producer. Most
importantly younger household heads are more likely to collect or produce NTFPs as compared to
the older ones. It is concluded that younger household heads are motivated to collect or produce
NTFPs because it is cheap source of income. Similarly, households considered to be richer (as
assessed by type of construction material of wall of their houses) are less likely to collect or
70
produce NTFPs. It is then concluded that NTFPs are important for poor and young households in
the area of study and they can improve their incomes through NTFPs selling.
The study also found positive and significant effect of access to market information and agro-
ecological zones on the households’ decision to participate in NTFPs as collector or producer. As
expected households in the middle and highland are more likely to collect or produce NTFPs. This
suggests that households’ proximity to the collection site especially the forest is an important factor
in the decision to collect or produce NTFPs. Household heads that have access to market
information are more likely to collect or produce NTFPs as compared to households without.
Therefore improving household access to market information will increase households’
participation in NTFPs collection or production.
Factors affecting households’ decision to produce NTFPs on farm or to collect them from the
forest
This study confirms that farm size and access to extension services negatively affects the
household heads’ decision to choose the forest as the source of NTFPs over farm. Household heads
with big land size prefer to produce NTFPs on farm than to collect them from the forest. It suggests
a positive contribution of land size to households’ decision to plant tree on their farm. Moreover,
household heads that have access to extension services are less likely to collect NTFPs from the
forest as compared to households without access to extension services. Therefore an improvement
in the household access to extension services will increase households’ participation in NTFPs
production on farm.
71
The study found that occupation of the household heads, presence of trees on farm and living in
high and midlands positively affect the household heads’ decision to choose the forest as the source
of NTFPs over farm. Farmers prefer to collect NTFPs from the forest than to produce them on
farm. As expected, households that are closer to the forest prefer to collect NTFPs from forest even
though they have trees on farm. It is then concluded that household who collect NTFPs from the
forest and also produce them on farm are like to have more surplus of NTFPs that can be marketed.
Factors affecting household decision to participate in non-timber forest products market or
not
The findings show significant effect of factors mainly, presence of trees on farm, agro-ecological
zones, gender, education and wealth status of the household head on households’ decision to sell
NTFPs. Male headed households are more likely to sell NTFPs. As it is the case for most of the
agricultural products, the decision to sell or not to sell non-timber forest products is done by male
household heads. Less educated households are more likely to sell non-timber forest products too.
Household heads that have trees on farm are more likely to sell NTFPs compared to those who do
not have. It is concluded that the presence of trees on farm increases the households’ decision to
sell NTFPs. Location of the household head is positively associated with the probability of selling
NTFPs. Households based in the high and middle land are more likely to sell NTFPs because they
have forest as a secondary source of NTFPs and therefore are more likely to have marketable
surplus relative to household heads in the lowland.
72
5.3 Recommendations
The recommendation emerging from this study can be summarized as follows:
There is need for public enlightenment and awareness campaign on appropriate and sustainable
forest extraction methods taking into consideration youth headed households from high and middle
lands communities who largely depend on NTFPs from forestlands. This is important in order to
sustain collection of non-timber forest products in the long term.
The management authorities of the Mount Elgon National park should redesign their resource user
right policy by finding ways of limiting the number of NTFPs collection hours per week. That
would help in the long run in encouraging the households to also produce more NTFPs from their
farm or to start planting trees on their farm in order to supplement the quantity of NTFPs collected
from the forest.
Extension services should promote tree species that are compatible with crops to maximize returns
from small land sizes and encourage farmers with small land sizes to plant trees especially in high
and middle land. This would result in mutual beneficial situation of enhancing their market
participation for NTFPs and environmental conservation. Poor households should be encouraged
to invest more in NTFPs extraction and selling in order to take advantage of the growing market
for those products with high premium price. There is a need for concerted effort among policy
makers, non-governmental organizations and other stakeholders towards improving female
participation in NTFPs harvesting and marketing in the study area. This is necessary due to their
low participation in NTFPs collection and selling.
73
Lastly, establishment of market outlets for NTFPs especially in lowland communities is highly
recommended. This would largely increase the participation of more local people in non-timber
forest products in the study area. As long as policies to improve commercialization of trees
products is designed and implemented, trees planting on farm will increase, hence generating more
surplus for the local markets. Government agencies should undertake market and marketing
research to collect information that the households can use to plan marketing activities and develop
delivery channels. Moreover, the development of appropriate technology to process raw NTFPs
should also be encouraged. As topic for further research, the link between the development of
NTFPs value chain and its impact on the livelihoods of farmers in Eastern Uganda needs to be
explored beyond the current study.
74
6.0: REFERENCES
Achigan-Dako, E. G., Pasquini, M. W., Assogba Komlan, F., N’Danikou, S., Dansi, A., and
Ambrose-Oji, B. (2010). Traditional Vegetables in Benin. Institut National des Recherches
Agricoles du Bénin. Imprimeries du CENAP, Cotonou, 285 pp.
ActionAid (2012). Women’s rights in agriculture, Uganda.
Adegbola, P., and Gardebroek, C. (2007). The Effect of Information Sources on Technology
Adoption and Modification Decisions. Journal of Agricultural Economics, 37 (1): 55 – 65.
Adesina, A. A., and Chianu, J. (2002). Determinants of farmers’ adoption and adaptation of alley
farming technology in Nigeria. Agroforestry systems, 55 (2), 99–112.
Adesina, A. A., Mbila, D., Nkamleu, G. B., and Endamana, D. (2000). Econometric analysis of
the determinants of adoption of alley farming by farmers in the forest zone of southwest
Cameroon. Agriculture ecosystems & environment, 80 (3), 255–265.
Adhikari, B., Di Falco, S., and Lovett, J.C. (2004). House-hold Characteristics and Forest
Dependency: Evidence from Common Property Forest Management in Nepal. Ecological
Economics 48: 245-257.
Agea, J. G., Okia, C. A., Abohassan, R. A. A., Kimondo, J. M., Obua, J., Hall, J. and
Teklehaimanot, Z. (2011). Wild and semi wild food plants of Bunyoro Kitara Kindom of
Uganda: Growth Forms, Collection Niches, parts Consumed, Consumption patterns, Main
gatherers and consumers. Environmental Resources Journals, 5(2): 74-86.
Agustino, S., Mataya, B., Senelwa, K., and Achigan-Dako, G. E. (2011). Non-wood forest
products and services for socio-economic development. A Compendium for Technical and
Professional Forestry Education. The African Forest Forum, Nairobi, Kenya. 219 pp.
Ahaibwe, G., Mbowa, S., and Lwanga, M. M. (2013). Youth Engagement in Agriculture in
75
Uganda : Challenges and Prospects. Kampala, Uganda.
Ahenkan, A. and Bonn, E. (2011). Improving Nutrition and Health through Non-timber Forest
Products in Ghana
Alene, A. D., Manyong, V. M., Omanya, G., Mignouma, H. D., Bokanga, M., and Odhiambo, G.
(2008). Smallholder Market Participation under Transactions Costs: Maize Supply and
Fertilizer Demand in Kenya. Journal of Food Policy, 33
Alinyo, F., and Leahy, T. (2012). Designing Food Security Projects in Kapchorwa and Bukwo
districts, Uganda. Development in Practice, 22(3), 334–346.
Angelsen, A., and Kaimowitz, D. (1999). Rethinking the Causes of Deforestation: Lessons from
Economic Models. The World Bank Research Observer 14: 3-98.
Astewel, T. (2010). Analysis of Rice Profitability and Market chain: The Case of Fogera Woreda,
South Gondar Zone, Amhara National Regional State, Ethiopia. An Msc. Thesis Presented to
School of Graduate Studies of Haramaya University.
Barany, M. E. (2003). Non-timber forest products in the livelihood and coping strategies of
households and communities affected by HIV/AIDS. Virginia Polytechnic Institute and
State University.
Belem, B., Nacoulma, B., Gbangou, R., Kambou, S., Hansen, H. H., Gausset, Q., …and Boussim,
I. J. (2007). Use of non wood forest products by local people bordering the“ Parc National
Kaboré Tambi”, Burkina Faso. Journal for Transdisciplinary Environmental Studies, 6(1),
18 pp.
Bellemare, M. F., and Barrett, C.B. (2006). “An Ordered Tobit Model of Market Participation:
Evidence from Kenya and Ethiopia.” American Journal of Agricultural Economics, 88(20)
: 324-337.
76
Bett, C. (2004). Farm level adoption decisions of soil and water management technologies in semi-
arid Eastern Kenya. In 48th Annual Conference of the Australium Agricultural and Resource
Economics Society.
Bush, G., and Nampindo, S. (2004). The Value of Uganda's Forests: A Livelihoods and
Ecosystems Approach. National Forestry Authority, Kampala.
Butler, E., & Kebba, A. (2014). Youth and Agriculture in Uganda. Washington, DC, USA.
Byers, A. L., Allore, H., Gill, T. M., and Peduzzi, P. N. (2003). Application of negative binomial
modeling for discrete outcomes: A case study in aging research. Journal of Clinical
Epidemiology, 56 (6), 559–564.
Campbell, J. (1991). Land or peasant? The dilemma confronting Ethiopian resource conservation.
Afr. Aff. 90, 5–21.
CARPE (2001). Non-timber forest products: economics and conservation potential. Congo Basin.
Central African Regional Program for the Environment Information Series 10. 4 p.
Chakravarty, S., Gosh, S. K., Surech, C. P., Dey, A. H., and Shukla, G. (2012). Deforestation:
Causes, Effects and Control Strategies. Global Perspective on Sustainable Forest
Management, p. 12.
Chalwe, S. (2011). Factors Influencing Bean Producers’ Choice of Marketing Channels in Zambia.
An Msc. Thesis Presented to the School of Graduate Studies of Zambia University.
Chandrasekharan, C. (1993). Issues involved in the sustainable development of Non-Wood Forest
Products. Proceedings for the Expert consultation on NWFPs for English speaking African
Countries, Arusha, Tanzania.
Chege, N. (1994). Africa’s non-timber forest economy. World Watch 7 (4):19-24.
Chikamai, B., and Tchatat, M. (2004). Forest Management for Non-Wood Products and Services
77
in Africa. A Report prepared for the Project: Lessons Learnt on Sustainable Forest
Management in Africa. AFORNET, Nairobi.
Chilundika, N. (2011). Market participation of bean smallholder farmers in Zambia: a gender
based approach. A Research Report presented to the Department of Agricultural Economics
and Extension Education of the University of Zambia.
Clifton, K. J., and Handy, S. L. (2001). Qualitative Methods In Travel Behavior Research.
Cochran, W. G. (1963). Sampling Techniques, 2nd Ed., New York: John Wiley and Sons, Inc.
Cunningham, A. B., and Mbenkum, F. T. (1993). Sustainability of harvesting Prunus africana bark
in Cameroon: A medicinal plant in international trade. People and Plants Working Paper.
Paris, UESCO.
Dabiré, A. B. (2003). Note analytique sur le Processus d'amélioration de la gouvernance et de
l'application des lois dans le secteur forestier en Afrique. IUCN.
Dagsvik, J. K. (2004). Random Utility Models for Discrete Choice Behavior. Statistics Norway,
Research Department. Oslo, Norway.
Dash, M., Behera, B. and Rahut, D. B. (2016). Determinants of household collection of non-timber
forest products (NTFPs) and alternative livelihood activities in Similipal Tiger Reserve,
India.
Forest Policy and Economics, vol. 73, pp 215-228
Davis, K., Nkonya, E., Kato, E., Mekonnen, D. A., Odendo, M., Miiro, R., and Nkuba, J. (2010).
Impact of Farmer Field Schools on Agricultural Productivity and Poverty in Uganda. IFPRI
Discussion Paper 00992 June 2010.
Demeke, L. B., and Haji, J. (2014). Econometric analysis of factors affecting market participation
of smallholder farming in Central Ethiopia. Journal of Agricultural Extension and Rural
78
Development, 2(6), 94–104.
Dev, O. P., Yadav, N. P., Springate-Baginski, O. and Soussan, J. (2003). Impacts of Community
Forestry on Livelihoods in the Middle Hills of Nepal. Journal of Forest and Livelihood
vol. 3(1)
Douthwaite, B., Manyong, V. M., Keatinge, J. D. H., and Chianu, J. (2002). The adoption of alley
farming and Mucuna: lessons for research, development and extension. Agroforestry
systems, 56 (3), 193–202.
Dovie, D. B. K., Shackleton, C. M., and Witkowski, E. T. F. (2001). Valuing non-timber forest
products - indicator for interplay between poverty, livelihoods and the environment.
Proceedings: Open Meeting of the Global Environmental Change Research Community,
Rio de Janeiro, October 6-8, 2001.
Enete, A.A., and Igbokwe, E.M. (2009). Cassava Market Participation Decision of Producing
Households in Africa. Tropicultura, 27, 129-136.
FAO (1985). Tree growing by rural people. Food and Agricultural Organization, Rome, Italy
FAO (1992). More than wood. Special options on multiple use of forests. Forestry Topics Report
No. 4. FAO, Rome Italy.
FAO (1996). Domestication and commercialisation of non-timber forest products in agroforestry
systems Non -Wood Forest Products 9. Food and Agricultural Organization, Rome, Italy.
FAO (2000). Forest, food security and sustainable livelihoods. Food and Agricultural
Organization, Rome, Italy.
FAO (2003). Harvesting of the non-wood forest products. Rome: Food and Agriculture
Organization of the United Nations.
FAO (2006) Global forest resources assessment. Progress towards sustainable forest management.
79
Food and Agriculture Organization of the United Nations Forestry Paper 147. Rome, Italy.
FAO (2015). Uganda country fact sheet on food and agriculture policy trends. Food and
Agricultural Organization, Rome, Italy.
Feder, G., Just, R., and Zilberman, D. (1985). Adoption of Agricultural Innovations in Developing
Countries: Economic Development and Cultural Change. The University of Chicago Press,
33: 255-298.
Fentanun, M.I., and Hager, H. (2009). Exploiting locally available resources for food and
nutritional security enhancement: Wild fruit diversity, potential and state of exploitation in
the Amahara Region of Ethiopia. Food Security, 1: 207-219.
Fisher, M., Shively, G.E., and Buccola, S. (2005). Activity choice, labor allocation and forest use
in Malawi. Land Econ 81(4): 503–517.
Franzel, S., Wambugu, C., Nanok, T., Kavana, P., Njau, T., Aithal, A., Muriuki, J., Kitalyi, A.
(2007). Production and marketing of leaf meal from fodder shrubs in Tanga, Tanzania: a
pro-poor enterprise for improving livestock productivity. ICRAF Working Paper no. 50.
Nairobi: World Agroforestry Centre.
Gebregziabher, D. (2010). Market chain analysis of poultry: The case of Alamata and Atsbi-
Wonberta Woredas of Tigray region [on line]. Available at
www.ipmsethiopia.org/content/.../FinalTHesis%20_DawitGebregziabher.pdf
Glover, E. K., Ahmed, H. B., and Glover, M. K. (2013). Analysis of Socio-Economic Conditions
Influencing Adoption of Agroforestry Practices. International Journal of Agriculture and
Forestry, 3(4), 178–184. http://doi.org/10.5923/j.ijaf.20130304.09.
Greene, W. (2008). Econometric Analysis; 6th edition. Pearson International Edition, NJ,
Prentice Hall.
80
Gujarati (2003). Basic Econometrics. Fouth Edition. Tata McGraw-Hill Publishing Company
Limited, New Delhi.
Haglund, E., Ndjunga, J., Snook, L., and Pasternak, D. (2011) Dry land tree management for
improved household livelihoods: Farmer managed natural regeneration in Niger. J Environ
Manag 92: 1696–1705.
Harsch, E. 2001. Making trade work for poor women. Africa Recovery, vol. 15(4)
Hedge, R., and Enters, T. (2000). Forest products and household economy: a case study from
Mudumalai Wildlife Sanctuary, Southern India. Environmental Conservation 27, 250–259.
Hedge, R., Suryaprakash, S., Achoth, L., and Brawa, K.S. (1996). Extraction of non-timber forest
products in the forest of Biligiri Rangan Hills, India. 1. Contribution to rural income. Economic
Botany 50, 243-251.
Hlongwane, J. J., Ledwaba, L. J., and Belete, A. (2014). Analyzing the factors affecting the market
participation of maize farmers: A case study of small-scale farmers in greater Giyani Local
Municipality of the Mopani District, Limpopo Province. African journal of agricultural
research, Vol.9 (10), 895 – 899, 6 March, 2014.
Hoskins, M., (1990). The contribution of forestry to food security. Unasylva Vol. 41, No.1: 3– 13.
Howley, P., Hynes, S., and Donoghue, C.O. (2012). Explaining the non-economic behaviour of
farm foresters: The effect of productivist and lifestyle motivations.
IFAD (2008). Gender and non-timber forest products: Promoting food security and economic
empowerment. International Fund for Agricultural Development. International Fund for
Agricultural Development, Rome, Italy.
81
IFAD (2015). The State of Food Insecurity in the World 2015. Meeting the 2015 international
hunger targets: taking stock of uneven progress. International Fund for Agricultural
Development. International Fund for Agricultural Development, Rome, Italy.
Ita, P. B., and Offiong, E. (2013). ACCESS Non-Timber Forest Products for Food Security and
Development in Nigeria. American Journal of Social Issues and HUmanities, 3 (July).
IUCN (2008). Securing the sustainability of the Mount Elgon forest ecosystem. International
Union for Conservation of Nature.
Jagwe, J., Machethe, C., and Ouma, E. (2010). Impact of Transaction Cost on the Participation of
Smallholder Farmers and Intermediaries in the Banana Market in Burundi, Democratic
Republic of Congo and Rwanda. African Journal on Agricultural and Resource Economics,
6:1.
Jagwe, J.N. (2011). Impact of Transaction Costs on the Participation of Smallholder Farmers and
Intermediaries in the Banana Markets of Burundi, Democratic Republic of Congo and
Rwanda. Ph.D. Thesis (Agricultural Economics), University of Pretoria, Pretoria,
submitted.
Jamnadass, R. H., Dawson I.K., Franzel, S., Leakey, R. R. B., Mithöfer, D., and Akinnifesi, F. K.
(2011). Improving livelihoods and nutrition in Sub-Saharan Africa through the promotion
of indigenous and exotic fruit production in smallholders’ agroforestry systems: a review.
International Forest Review 13: 338 – 354.
Jimoh, S. (2006). Sustaining the roles of non-timber forest products in rural poverty-Reduction
and household food security in Nigeria. Journal of Fisheries International, 63–69.
Jones, B. (2009). Logit and Probit. Department of Political Science, University of California,
Davis.
82
Kaggwa, R., Hogan, R., and Hall, B. (2009). Enhancing Forests’ Contribution to Growth,
Employment and Prosperity. UNEP Poverty Environment Initiative. Kampala, Uganda.
Kaimowitz, D. (2003). Forests and Rural Livelihoods in Sub-Saharan Africa. In Forests in Poverty
Reduction Strategies: Capturing the Potential, EFI Proceedings, No. 47, Joensuu, Finland.
Kalu, C., and Rachael, E. (2006). Women in Processing and Marketing of Non-timber Forest
Products: Case Study of Benin City, Nigeria. Journal of Agronomy 5(2): 326–331.
Kamanga, P., Vedeld, P. and Sjaastad, E. (2009). Forest incomes and rural livelihoods in
Chiradzulu District, Malawi. Ecological Economics, vol.68 (3): 613-624
Kamara, J.N. (1986). Firewood energy in Sierra Leone: production, marketing and household use
patterns. Studies No. 9, Hamburg, West Germany.
Kanabahita, C. (2001): Forestry Outlook Studies in Africa (FOSA). Uganda Forestry Department:
Ministry of Water, Land and Environment.
Kar, S. P. and Jacobson, M. G. (2012). Market constraints in NTFP trade: household perspectives
in Chittagong Hill Tracts of Bangladesh. International Forestry Review, 14: pp 50–61.
Kepe, T.V. (2002). Grassland vegetation and rural livelihoods: a case study of resource value and
social dynamics on the Wild Coast, South Africa. PhD thesis, University of the Western
Cape, Cape Town. p. 267.
Key, N., Sadoulet, E., and DeJanvry, A. (2000). Transactions Costs and Agricultural Household
Supply Response. American Journal of Agricultural Economics, 88 (2): 245-259.
Kideghesho, J.R., Msuya, T.S. (2010). Gender and socio-economic factors influencing
domestication of indigenous medicinal plants in the West Usambara Mountains, northern
Tanzania. Int J Biodivers Sci Manag 6(1/2): 3–12.
83
Krantz, L. (2001). The sustainable livelihood approach to poverty reduction. Swedish International
Development Cooperation Agency (SIDA).
Krause, M., Uibrig, H., and Kidane, B. (2007). Decision modelling for the integration of woody
plants in smallholder farms in the central highlands of Ethiopia. Journal of agriculture and
rural development in the tropics and subtropics, 108 (1), 1–17.
Leakey, R.R.B., and Jaenicke, H. (1996). The domestication of indigenous fruit trees:
opportunities and challenges for agroforestry. In: Proceedings of 4th International BIO-
REFOR Workshop. Tampere, Finland, 15-26.
Lehmann, N., Finger, R., Tommy Klein, T., and Calanca, P. (2013). Sample Size Requirements
for Assessing Statistical Moments of Simulated Crop Yield Distributions Agriculture 2013,
3, 210-220.
Mamo, G., Sjaastad, E., and Vedeld, P. (2007). Economic dependence on forest resources: a case
from Dendi District, Ethiopia. Forest Policy Econ. 9 (8), 916–927.
Marshall, E., Newton, AC., and Schreckenberg, K. (2005). Commercialization of Non-Timber
Forest Products: First Steps in Analysing the Factors Influencing Success. IntFores Rev, 5:
128-135.
Mbowa, S., Shinyekwa, I., and Lwanga, M. (2012). Dairy Sector Reforms and Transformation in
Uganda since the 1990s. Economic Policy Research Centre (EPRC) Research Report No.
4. Kampala, Uganda.
McElwee, P.D. (2008). Forest environmental income in Vietnam: household socioeconomic
factors influencing forest use. Environ. Conserv. 35, 147–159.
McFadden, D. (1974). Conditional Logit Analysis of Qualitative Choice Behavior in Zarembka.
P. (ed.), Frontiers in econometrics. New York: Academic Press.
84
MEAAI. (2010). Making charcoal production in Sub Sahara Africa sustainable. The netherlands.
Mishra, S.N., Sharma, N., & Sharma, K. (1984). Participation and development. NBO Publishers'
Distributors Delhi.
MoFPED. (2014). the Republic of Uganda Poverty Status Report 2014.
Moseley, W. G. (2012). Famine myths: five misunderstandings related to the 2011 hunger crisis
in the Horn of Africa. Dollars and Sense, 299, pp 17-21
Muhammad, I., Khan, A., and Mitsuhiro, I. M. (2011). Identifying factors affecting agroforestry
system in Swat, Pakistan. Afr J Agric Res 6(11): 2586–2593.
Mukuralinda, A., Ndayambaje, J.D., and Marara, J. (1999). Situation de l’agroforesterie au
Rwanda apres 1994: Rapport d’enquete. Projet AFRENA-ECA, Butare.
Mulenga, B. P., Richardson, R. B., Mapemba, L., and Tembo, G. (2011). The Contribution of Non-
Timber Forest Products to Rural Household Income in Zambia. Working Paper No. 54,
Food Security Research Project, Lusaka, Zambia (Vol. 2011).
Mulenga, B. P., Richardson, R. B., Mapemba, L., and Tembo, G. (2013). Rural household
participation in markets for non-timber forest products in Zambia. Environment and
Development Economics, vol. 19(4), pp 487 -504
Musah, A.B., Osei-Asare, Y. B., and Wayo, S. (2014). Market participation of smallholder maize
farmers in the upper west region of Ghana. African journal of agricultural research, Vol.
9(31), 2427-2435, 31 July, 2014
Ndayambaje, J.D., Heijman,W.J.M., and G.M.J. Mohren (2012). Household determinants of tree
planting on farms in rural Rwanda. Small-scale forestry, 11 (4), 1–32.
NDPII (2015). Strenghtnening Uganda Competitiveness for Sustainable Wealth Creation,
employement and Inclusive Growth. Second National Development Plan. The Republic of
85
Uganda Kampala, Uganda.
NEMA (2001). State of environment report for Uganda 2000-2001. National Environment
Management Authority, Kampala, Uganda.
NEMA (2004). State of Environment Report. Kampala, Uganda.
Neumann, R. P., and Hirsch, E. (2000). Commercialisation of non-timber forest products: review
and analysis of research. Center for International Forestry Research, (Bogor, Indonesia).
NSW. (2003). Farm Forestry Strategy for NSW.
Offiong, E. E. and Ita, P. B. (2013). Non-Timber Forest Products for Food Security and
Development in Nigeria. American Journal of Social Issues and Humanities, vol. 3(4)
Ogden, C. (1990). Building nutritional considerations into forestry development efforts. Unasylva
Vol. 41, No.1: 20–28.
Ogle, B.M. and Grivetti, L.E. (1985). Legacy of the chameleon. Edible wild plants in the Kingdom
of Swaziland, southern Africa: a cultural, ecological and nutritional study. Ecology of Food
and Nutrition, in four parts: 16(3): 193–208, Parts II-IV: 17(11): 1–64.
Okigbo, B.N. (1975). Neglected plants of horticultural and nutritional importance in traditional
farming systems of tropical West Africa. Acta Horticulturae, 53: 131–150.
Okorio, J. (2006). Final report on status of forestry and agroforestry in the lower kagera, uganda.
FAO Transboundary Agro-ecosystem Management Programme (TAMP). 40 pages.
Oladejo, J. A., Olawuyi, S., and Anjorin, T. D. (2011). “Analysis of Women Participation in
Agricultural Production in Egbedore Local Government Area of Osun State, Nigeria”,
International journal of agricultural economics and rural development, vol 4 n01, 2011.
86
Olwande, J., and Mathenge, M. (2012). Market Participation among the Poor Rural household in
Kenya. Tegemeo Institute, Egerton University, Kenya. International Association of
Agricultural Economists (IAAE) Triennial Conference, Foz do Iguaçu, Brazil, 18-24 August.
Omiti, J. M., Otieno, D. J., Nyanamba, T. O., and Mccullough, E. (2009). Factors Influencing the
Intensity of Market Participation by Smallholder Farmers: A Case Study of Rural and Peri-
urban areas of Kenya. Afjare 3 (1): 57-82
Osmani, A. G., and Hossain, E. (2015). Market Participation Decision of Smallholder Farmers and
Its Determinants in Bangladesh. Economics of Agriculture, 62(1), 163–179.
Patience Tugume. P., Buyinza, M., Namaalwa, J., Kakudidi, E. K., Mucunguzi, P., Kalema, J.,
Kamatenesi, M. (2015). Socio-economic predictors of dependence on Non-timber forest
products: lessons from Mabira Central Forest Reserve Communities. Journal of
Agriculture and Environmental Sciences, Vol 4(2), pp 195-214
Paumgarten, F. (2007). The significance of the safety-net role of NTFPs in rural livelihoods, south
africa, environmental sciences. Rhodes University, Grahamstown, South Africa.
Pimentel, D. M., McNair, L., Buck, M., Pimentel, M., and Kamil, J. (1997). The Value of Forests
to World Food Security. Human Ecology 25: 91-120.
Piya, L., Maharjan, K. L., Joshi, N. P. and Dangol, D. R. (2011). Collection and marketing of non-
timber forest products by Chepang community in Nepal. the journal of agriculture and
environment, vol. 12
Rademaekers, K., Eichler, L., Berg, J., Obersteiner, M., and Havlik, P. (2010). Study on the
evolution of some deforestation drivers and their potential impacts on the costs of an
avoiding deforestation scheme. Rotterdam, The Netherlands.
87
Randela, R., Alemu, G., and Groenewald (2008). Factors enhancing market participation by small-
scale cotton farmers: Agrekon 47:4.
Rodrigez F.Z. (2007). Socio - economic determinants of Non-Timber Forest Products Collection.
A case study among indigenous people in Karnataka, India. Universitat Autònoma de
Barcelona, Spain.
Rungie, C. M., Coote, L. V., and Louviere, J. J. (2012). Latent variables in discrete choice
experiments. Journal of Choice Modelling, 5(3), 145–156.
Rutto, J. K., Odhiambo, E. M., and Murithi, F. M. (2013). Determinants of market participation
decisions in small ruminants’ market by livestock keepers in Isiolo and Marsabit Districts,
Kenya. Department of Agricultural Economics and Resource Management, Moi University.
Schreckenberg, K., Awono, A., Degrande, A., Mbosso, C., Ndoye, O. and Tchoundjeu, Z. (2006).
Domesticating Indigenous Fruit Trees as A Contribution To Poverty Reduction. Forests,
Trees and Livelihoods, Vol. 16: 35–51.
Scott, P. (1994). Assessment of Natural Resource Use by Communities from Mount Elgon
National Park. Technical Report No. 15. IUCN unpublished.
Sebatta, C., Johnny, M., Enid, K., Apolo, K., and Kyomugisha, H. (2014). Smallholder Farmers’
Decision and Level of Participation in the Potato Market in Uganda. Modern Economy,
2014, 5, 895-906. Published Online July 2014 in SciRes.
Shackleton and Shackleton, S. (2004). The importance of non-timber forest products in rural
livelihood security and as safety nets: a review of evidence from South Africa. Journal of
Science. 26(2004):364-381.
88
Shackleton, S., Paumgarten, F., Kassa, H., Husseelman, M., and Zida, M. (2011). Opportunities
for enhancing women’s economic empowerment in the value chains of three African non‐
timber forest products (NWFPs). International Forestry Review, special issue, 13 (2).
Shiferew, B.A., Obare. G., Muricho, G., and Silim. S. (2009). Leveraging Institutions for
Collective Action to Improve Market for Smallholder Producers in Less – Favored Areas.
African Journal of Agricultural and Resource Economics, 3:1-18.
Shillington, L. J. (2002). Non-timber Forest Products, Gender, and Households in Nicaragua: A
Commodity Chain Analysis. M.Sc. thesis, Virginia Polytechnic Institute and State
University, Virginia. 103 p.
Shone, B.M., Caviglia-Harris, J. L. (2006). Quantifying and comparing the value of non-timber
forest products in the Amazon. Ecological Economics 58, 249– 267.
Shumsky, S. A., Hickey, G. M., Pelletier, B. and Johns, T. (2014). Understanding the contribution
of wild edible plants to rural social- ecological resilience in semi-arid Kenya. Ecology and
Society, vol. 19(4): 34
Sigei, G., Bett, H., and Kibey, L. (2014). Determinants of Market Participation among Small-scale
Pineapple Farmers in Kericho County, Kenya. Egerton University, Kenya. Munich Personal
RePEc Archive, Paper No. 56149, posted 26. May 2014.
Sikei, G., Mburu, J., Lagat, J. K. (2008). Household labor allocation to forest extraction and other
activities in areas adjacent to tropical forests: the case of Kakamega forest, Western Kenya.
Int J Environ Workplace Employ 1(4):32–44.
Singh, N. (2006). Women's Participation in Local Water Governance: Understanding Institutional
Contradictions. Gender, Technology and Development. 10(1): p.61-76.
89
Soini, E. (2007). Land tenure and land management in the districts around Mount Elgon: An
assessment presented to Mount Elgon Regional Ecosystem Conservation Programme
(MERECP). ICRAF Working Paper no. 49. Nairobi, Kenya.
Sood, K. K., and Mitchell, C. P. (2009). Identifying important biophysical and social determinants
of on-farm tree growing in subsistence-based traditional agroforestry systems. Agrofor Syst
75:175–187.
Springate-Baginski, O., Soussan, J.G., Dev, O.P., Yadav, N.P., and Kiff, E. (1999). Community
Forestry in Nepal: Impacts on Common Property Resource Management. School of
Environment and Development, Series No. 3. University of Leeds, UK.
Sunderland, T., Besong S., and Ayeni, J. (2003). Distribution, Utilization and Sustainability of
Non-timber Forest Products from Takamanda Forest Reserve, Cameroon. Smithsonian
Institute/MAB Biodiversity Program, Series 8. Washington D.C., USA.
Timko, J. A., Waeber, P.O. and Kozak, R.A. (2010). The socio-economic contribution of non-
timber forest products to rural livelihoods in Sub-Saharan Africa: knowledge gaps and new
directions. International Forestry review, vol. 12(13)
UBOS (2009). Population Estimate, Uganda Bureau of Statistics, Kampala, Uganda.
UBOS (2010). Summary report on Uganda Census of agriculture 2008-2009. Kampala, Uganda.
UBOS (2011). Uganda Census of Agriculture (UCA) 2008-2009 at a glance. The Republic of
Uganda.
UBOS (2016). The National Population and Housing Census 2014. Uganda Bureau of Statisitics,
Main Report. Kampala, Uganda.
UMCA (2015). Training Manual for Applied Agroforestry Practices. University of Missouri
Center for Agroforestry 203 ABNR Columbia, Mo 65211.
90
UNEP (2008). Non Timber Forest Products in Uganda. Retrieved April 26, 2016, from
http://www.unep.org/training/programmes/Instructor
Van Dijk, J. F. W. (1999). Non-timber forest products in the Bipindi-Akom II Region, Cameroon:
A socio-economic and ecological assessment. Tropenbos-Cameroon Series, 197 p.
Vikram, D. (2006). A microeconometric analysis of household extraction of forest biomass goods
in Ranthambhore National Park, India. J For Econ 12(2):145–163.
Vojacek, O., and Pecakova, I. (2010). Comparison of Discrete Choice Models for Economic
Environmental Research. Prague Economic Papers (Vol. 19).
Wilson, M. (2015). Agroforestry tree products , markets and decision making: a grounded theory
study of smallholders’ experience of market participation in Manafwa district, Uganda.
World Bank (2016). World Bank. Retrieved from:
http://databank.worldbank.org/data/views/reports/tableview.aspx
Wynberg, R. (2004). Achieving a fair and sustainable trade in devil’s claw. In Sunderland, T and
Ndoye, O. (eds.). Forest Products, Livelihoods and Conservation. Case Studies of Non-
Timber Forest Product Systems. Volume 2 – Africa.
Zegeye, T., Tadesse, B., Tesfaye, S., Nigussie, M., Tanner, D., and Twumasi. A. S. (2001).
Determinants of Adoption of Improved Maize Technologies in Major Growing Region of
Ethiopia. Second National Maize Workshop of Ethiopia, 12 - 16 November, 2001.
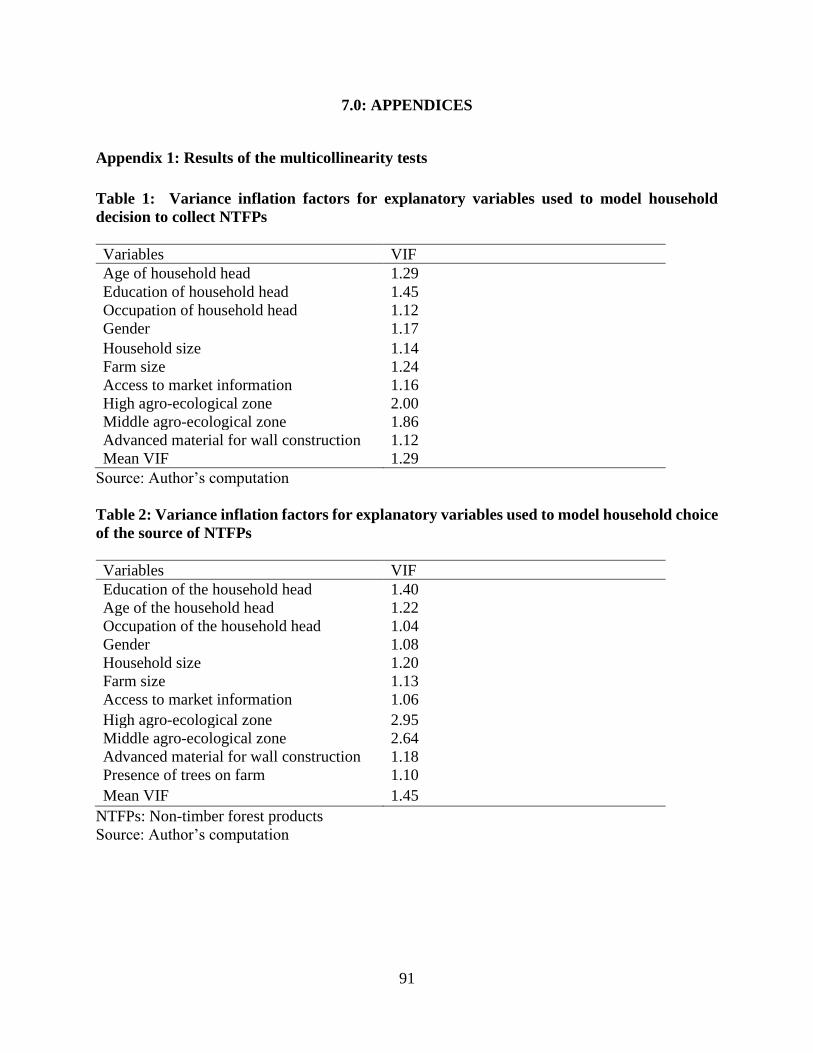
91
7.0: APPENDICES
Appendix 1: Results of the multicollinearity tests
Table 1: Variance inflation factors for explanatory variables used to model household
decision to collect NTFPs
Variables VIF
Age of household head 1.29
Education of household head 1.45
Occupation of household head 1.12
Gender 1.17
Household size 1.14
Farm size 1.24
Access to market information 1.16
High agro-ecological zone 2.00
Middle agro-ecological zone 1.86
Advanced material for wall construction 1.12
Mean VIF 1.29
Source: Author’s computation
Table 2: Variance inflation factors for explanatory variables used to model household choice
of the source of NTFPs
Variables VIF
Education of the household head 1.40
Age of the household head 1.22
Occupation of the household head 1.04
Gender 1.08
Household size 1.20
Farm size 1.13
Access to market information 1.06
High agro-ecological zone 2.95
Middle agro-ecological zone 2.64
Advanced material for wall construction 1.18
Presence of trees on farm 1.10
Mean VIF 1.45
NTFPs: Non-timber forest products
Source: Author’s computation
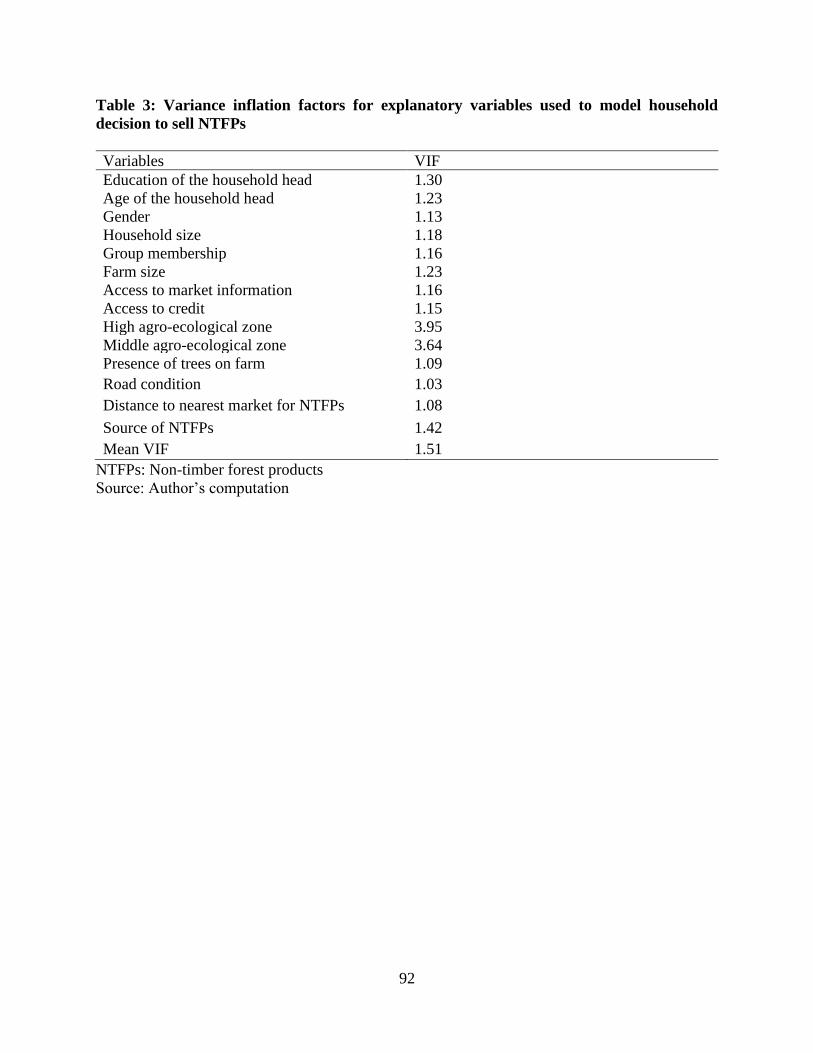
92
Table 3: Variance inflation factors for explanatory variables used to model household
decision to sell NTFPs
Variables VIF
Education of the household head 1.30
Age of the household head 1.23
Gender 1.13
Household size 1.18
Group membership 1.16
Farm size 1.23
Access to market information 1.16
Access to credit 1.15
High agro-ecological zone 3.95
Middle agro-ecological zone 3.64
Presence of trees on farm 1.09
Road condition 1.03
Distance to nearest market for NTFPs 1.08
Source of NTFPs 1.42
Mean VIF 1.51
NTFPs: Non-timber forest products
Source: Author’s computation

1
Appendix 2: Survey questionnaire
Factors affecting households’ participation in non-timber forest products market in Kapchorwa district, Uganda
The aim of this questionnaire is to gather information on household activities related to non-timber forest products and their socioeconomics characteristics. The
non-timber forest products that this study is interested in are products such as bamboo shoot, honey, nuts, mushroom, fuelwood, materials for basketry. These
products can be found in the forests or households can also produce them through agroforestry (trees planting on farm)
Confidentiality: All information collected in this survey is strictly confidential and will be used for statistical purposes only
Household Number ______________________
Date: (dd /mm /yy) DATE_________________
Head of Household Name _______________________________________
Respondent Name _________________________________________
(Instruction: Record the member number (MEMID) of the Respondent from the Demography table on page 2 after the survey is completed)
Enumerator’s name
County
District
Division
Location
Sub location
Village
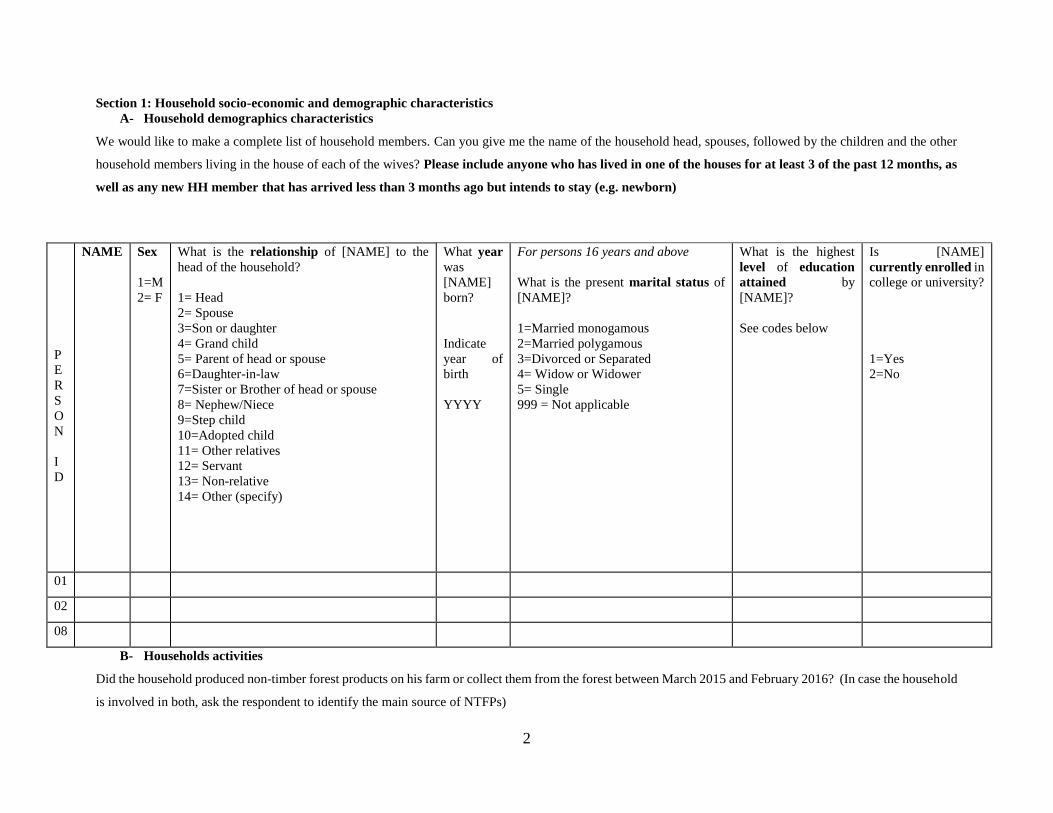
2
Section 1: Household socio-economic and demographic characteristics
A- Household demographics characteristics
We would like to make a complete list of household members. Can you give me the name of the household head, spouses, followed by the children and the other
household members living in the house of each of the wives? Please include anyone who has lived in one of the houses for at least 3 of the past 12 months, as
well as any new HH member that has arrived less than 3 months ago but intends to stay (e.g. newborn)
P
E
R
S
O
N
I
D
NAME
Sex
1=M
2= F
What is the relationship of [NAME] to the
head of the household?
1= Head
2= Spouse
3=Son or daughter
4= Grand child
5= Parent of head or spouse
6=Daughter-in-law
7=Sister or Brother of head or spouse
8= Nephew/Niece
9=Step child
10=Adopted child
11= Other relatives
12= Servant
13= Non-relative
14= Other (specify)
What year
was
[NAME]
born?
Indicate
year of
birth
YYYY
For persons 16 years and above
What is the present marital status of
[NAME]?
1=Married monogamous
2=Married polygamous
3=Divorced or Separated
4= Widow or Widower
5= Single
999 = Not applicable
What is the highest
level of education
attained by
[NAME]?
See codes below
Is [NAME]
currently enrolled in
college or university?
1=Yes
2=No
01
02
08
B- Households activities
Did the household produced non-timber forest products on his farm or collect them from the forest between March 2015 and February 2016? (In case the household
is involved in both, ask the respondent to identify the main source of NTFPs)
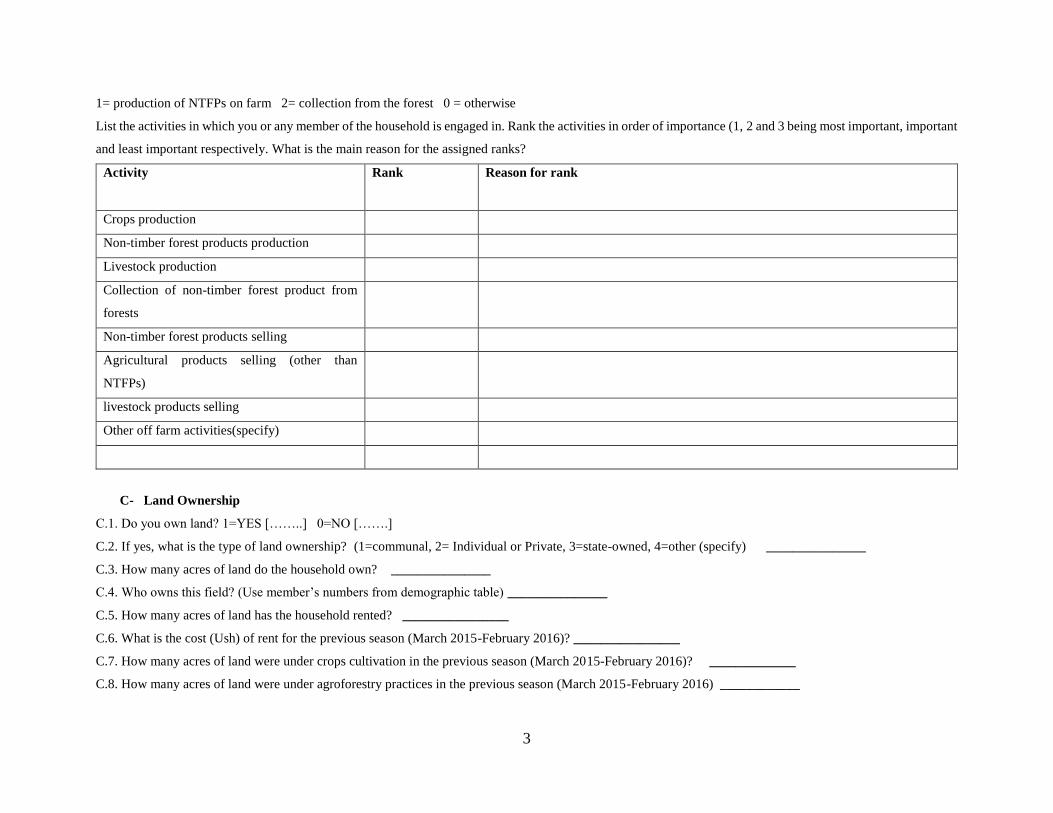
3
1= production of NTFPs on farm 2= collection from the forest 0 = otherwise
List the activities in which you or any member of the household is engaged in. Rank the activities in order of importance (1, 2 and 3 being most important, important
and least important respectively. What is the main reason for the assigned ranks?
Activity Rank
Reason for rank
Crops production
Non-timber forest products production
Livestock production
Collection of non-timber forest product from
forests
Non-timber forest products selling
Agricultural products selling (other than
NTFPs)
livestock products selling
Other off farm activities(specify)
C- Land Ownership
C.1. Do you own land? 1=YES [……..] 0=NO […….]
C.2. If yes, what is the type of land ownership? (1=communal, 2= Individual or Private, 3=state-owned, 4=other (specify) _______________
C.3. How many acres of land do the household own? _______________
C.4. Who owns this field? (Use member’s numbers from demographic table) _______________
C.5. How many acres of land has the household rented? ________________
C.6. What is the cost (Ush) of rent for the previous season (March 2015-February 2016)? ________________
C.7. How many acres of land were under crops cultivation in the previous season (March 2015-February 2016)? _____________
C.8. How many acres of land were under agroforestry practices in the previous season (March 2015-February 2016) ____________
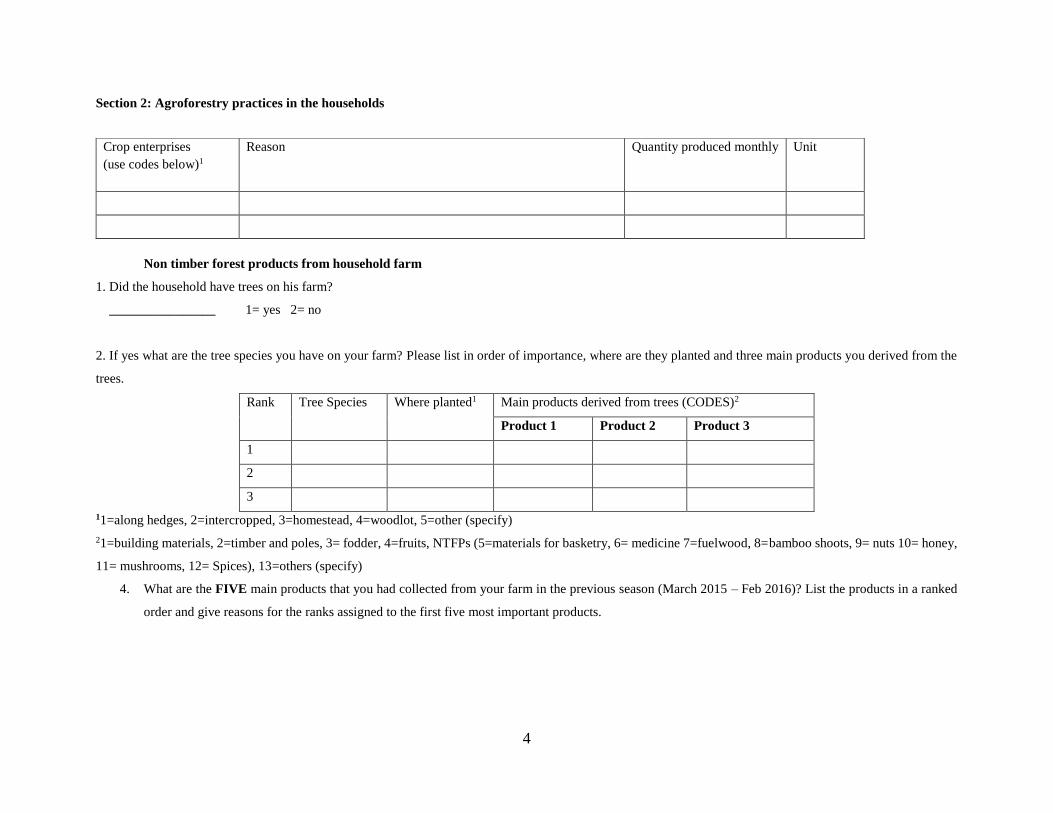
4
Section 2: Agroforestry practices in the households
Non timber forest products from household farm
1. Did the household have trees on his farm?
________________ 1= yes 2= no
2. If yes what are the tree species you have on your farm? Please list in order of importance, where are they planted and three main products you derived from the
trees.
Rank Tree Species
Where planted1
Main products derived from trees (CODES)2
Product 1 Product 2 Product 3
1
2
3
11=along hedges, 2=intercropped, 3=homestead, 4=woodlot, 5=other (specify)
21=building materials, 2=timber and poles, 3= fodder, 4=fruits, NTFPs (5=materials for basketry, 6= medicine 7=fuelwood, 8=bamboo shoots, 9= nuts 10= honey,
11= mushrooms, 12= Spices), 13=others (specify)
4. What are the FIVE main products that you had collected from your farm in the previous season (March 2015 – Feb 2016)? List the products in a ranked
order and give reasons for the ranks assigned to the first five most important products.
Crop enterprises
(use codes below)1
Reason
Quantity produced monthly
Unit
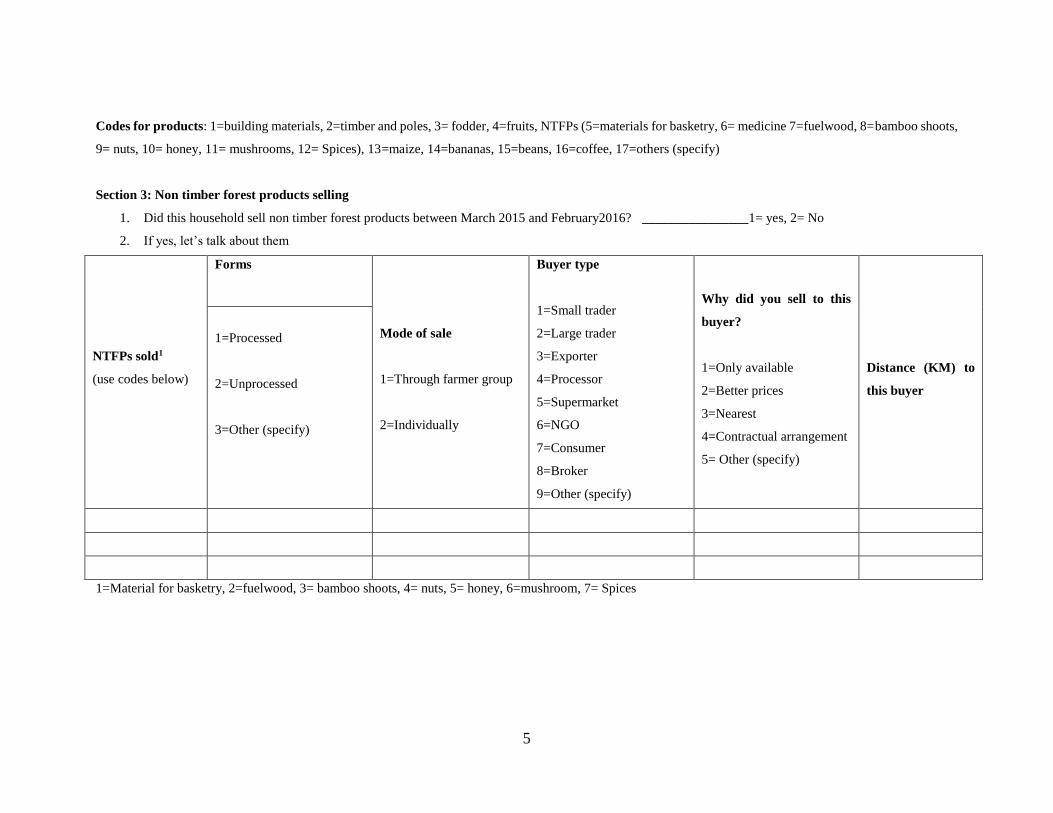
5
Codes for products: 1=building materials, 2=timber and poles, 3= fodder, 4=fruits, NTFPs (5=materials for basketry, 6= medicine 7=fuelwood, 8=bamboo shoots,
9= nuts, 10= honey, 11= mushrooms, 12= Spices), 13=maize, 14=bananas, 15=beans, 16=coffee, 17=others (specify)
Section 3: Non timber forest products selling
1. Did this household sell non timber forest products between March 2015 and February2016? ________________1= yes, 2= No
2. If yes, let’s talk about them
NTFPs sold1
(use codes below)
Forms
Mode of sale
1=Through farmer group
2=Individually
Buyer type
1=Small trader
2=Large trader
3=Exporter
4=Processor
5=Supermarket
6=NGO
7=Consumer
8=Broker
9=Other (specify)
Why did you sell to this
buyer?
1=Only available
2=Better prices
3=Nearest
4=Contractual arrangement
5= Other (specify)
Distance (KM) to
this buyer
1=Processed
2=Unprocessed
3=Other (specify)
1=Material for basketry, 2=fuelwood, 3= bamboo shoots, 4= nuts, 5= honey, 6=mushroom, 7= Spices
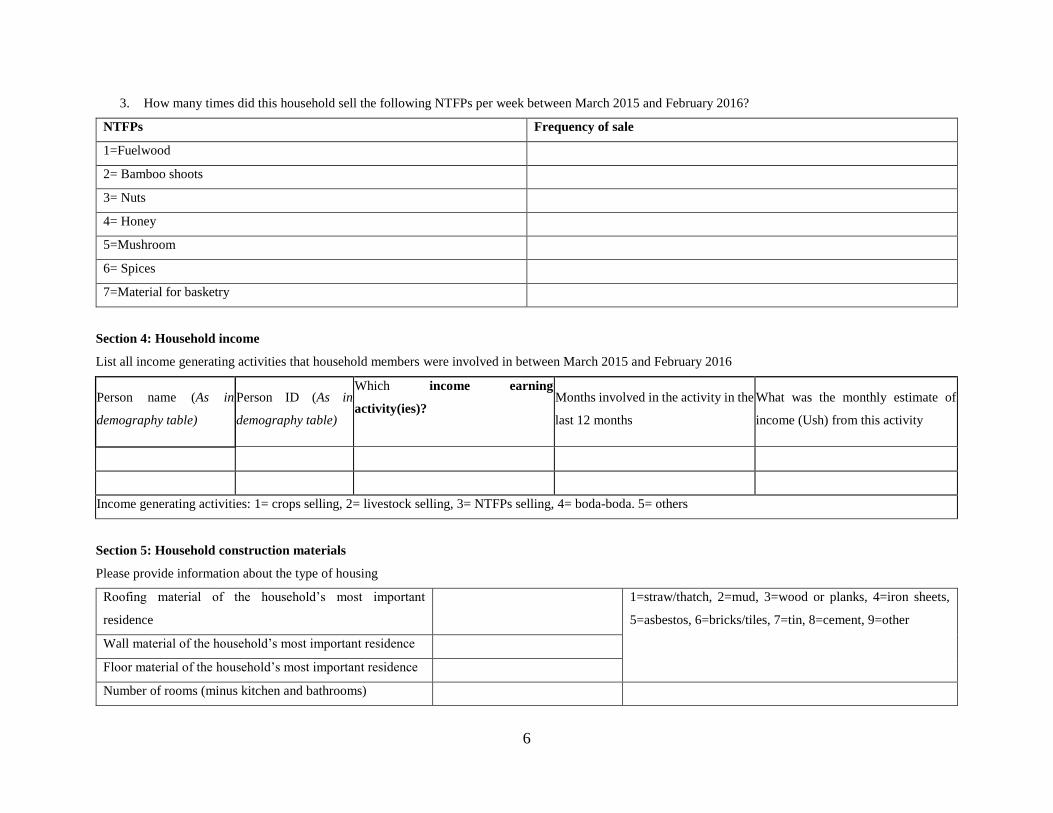
6
3. How many times did this household sell the following NTFPs per week between March 2015 and February 2016?
NTFPs Frequency of sale
1=Fuelwood
2= Bamboo shoots
3= Nuts
4= Honey
5=Mushroom
6= Spices
7=Material for basketry
Section 4: Household income
List all income generating activities that household members were involved in between March 2015 and February 2016
Person name (As in
demography table)
Person ID (As in
demography table)
Which income earning
activity(ies)?
Months involved in the activity in the
last 12 months
What was the monthly estimate of
income (Ush) from this activity
Income generating activities: 1= crops selling, 2= livestock selling, 3= NTFPs selling, 4= boda-boda. 5= others
Section 5: Household construction materials
Please provide information about the type of housing
Roofing material of the household’s most important
residence
1=straw/thatch, 2=mud, 3=wood or planks, 4=iron sheets,
5=asbestos, 6=bricks/tiles, 7=tin, 8=cement, 9=other
Wall material of the household’s most important residence
Floor material of the household’s most important residence
Number of rooms (minus kitchen and bathrooms)
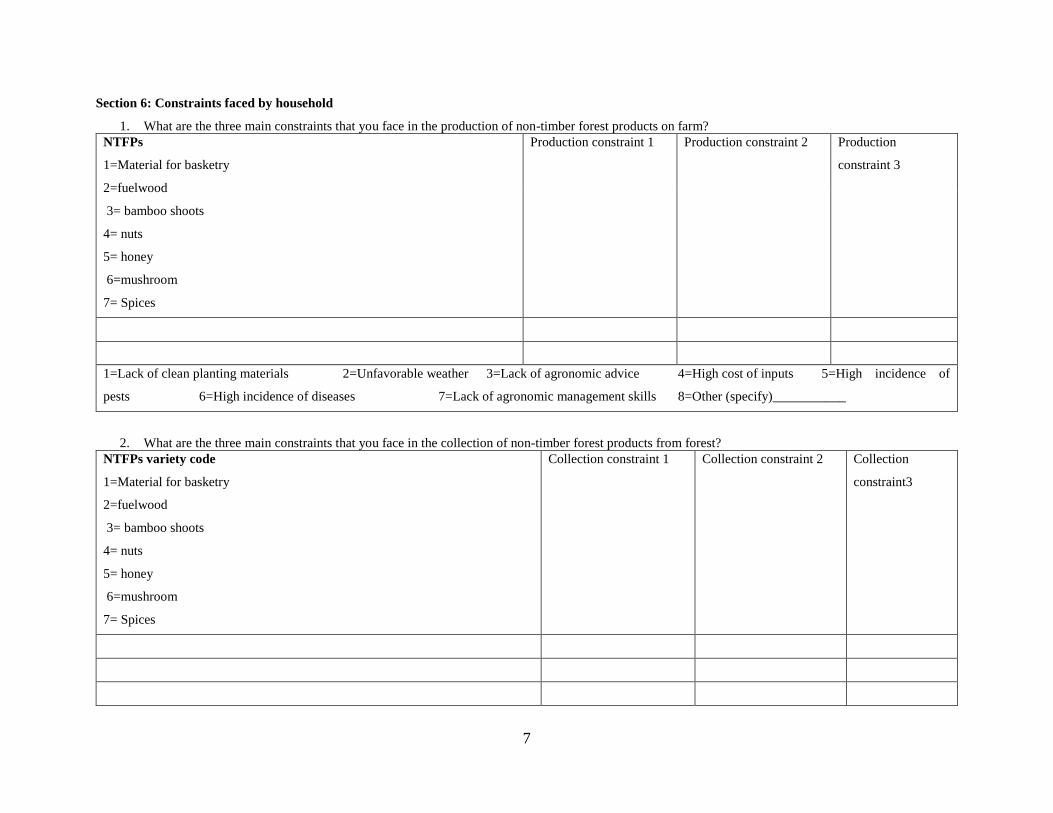
7
Section 6: Constraints faced by household
1. What are the three main constraints that you face in the production of non-timber forest products on farm?
NTFPs
1=Material for basketry
2=fuelwood
3= bamboo shoots
4= nuts
5= honey
6=mushroom
7= Spices
Production constraint 1 Production constraint 2 Production
constraint 3
1=Lack of clean planting materials 2=Unfavorable weather 3=Lack of agronomic advice 4=High cost of inputs 5=High incidence of
pests 6=High incidence of diseases 7=Lack of agronomic management skills 8=Other (specify)___________
2. What are the three main constraints that you face in the collection of non-timber forest products from forest?
NTFPs variety code
1=Material for basketry
2=fuelwood
3= bamboo shoots
4= nuts
5= honey
6=mushroom
7= Spices
Collection constraint 1 Collection constraint 2 Collection
constraint3

8
3. What are the four main constraints that you face in selling of non-timber forest products?
NTFPs variety code
1=Material for basketry
2=fuelwood
3= bamboo shoots
4= nuts
5= honey
6=mushroom
7= Spices
Marketing constraint 1 Marketing constraint 2 Marketing constraint 3
Section 7: Access to agricultural and market information
What are your main sources of information on agricultural production and marketing? (Rank in order of importance)
FINFO1____ FINFO2______ FINFO3_______
1=Government extension agents 6=Newspapers 11=mobile phones
2=Non-governmental extension
agents
7=Farmers’ magazines 12=Private service providers
3=Other farmers 8=Input dealers 13=Research institutions
4=Farmers organizations 9=Field demonstrations 14=Commodity traders
5=Radio 10=Extension leaflets 15=Other (specify) ________________
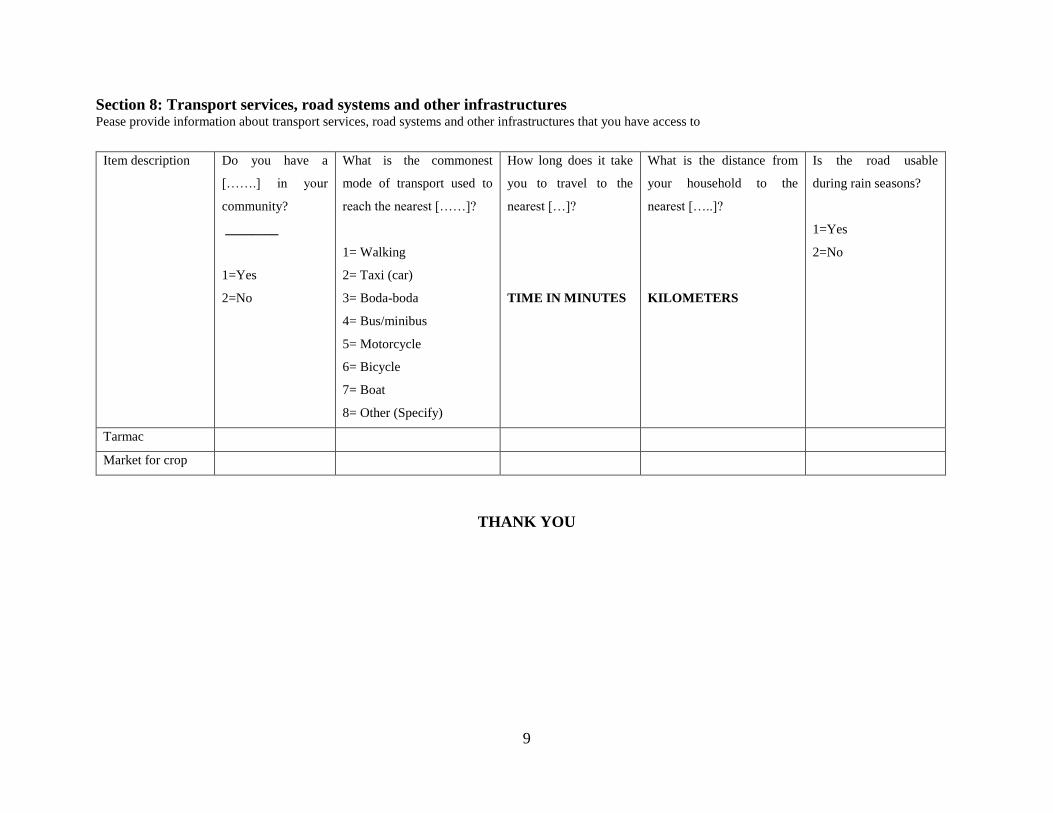
9
Section 8: Transport services, road systems and other infrastructures Pease provide information about transport services, road systems and other infrastructures that you have access to
Item description Do you have a
[…….] in your
community?
________
1=Yes
2=No
What is the commonest
mode of transport used to
reach the nearest [……]?
1= Walking
2= Taxi (car)
3= Boda-boda
4= Bus/minibus
5= Motorcycle
6= Bicycle
7= Boat
8= Other (Specify)
How long does it take
you to travel to the
nearest […]?
TIME IN MINUTES
What is the distance from
your household to the
nearest […..]?
KILOMETERS
Is the road usable
during rain seasons?
1=Yes
2=No
Tarmac
Market for crop
THANK YOU