1 Improving Productivity of Office Employees Improving Productivity of Office Employees Chapter 16.

1
FACTORS AFFECTING EMPLOYEES PRODUCTIVITY
IN COUNTY GOVERNMENTS IN KENYA; A CASE STUDY OF THE COUNTY
GOVERNMENT OF LAIKIPIA
FAITH WACHEKE GIKONYO
ODL-BML/4/00163/3/2014
A RESEARCH REPORT SUBMITTED TO THE SCHOOL OF MANAGEMENT AND
LEADERSHIP IN PARTIAL FULFILLMENT FOR THE AWARD OF DEGREE OF
BUSINESS ADMINISTRATION OF MANAGEMENT UNIVERSITY OF AFRICA.
NOVEMBER 2017
brought to you by COREView metadata, citation and similar papers at core.ac.uk
provided by The Management Univesity of Africa Repository

ii
DECLARATION
This research report is my original work and has not been presented to any university for
any award
Sign: _____________________________ Date: ________________________
FAITH WACHEKE
This proposal has been submitted for examination with my approval as University
Supervisor
Sign: _________________________ Date: ________________________
DANIEL MAINA KOMU

iii
DEDICATION
I dedicate this research report to my children who encouraged me to go on even when
it meant being away from them.

iv
ACKNOWLEDGEMENT
I take this opportunity to acknowledge the entire staff of the Management University of
Africa, Department of management and their aspiring guidance, invaluably constructive
criticism and friendly advice and relentless support they accorded me. Special thanks go to Mr.
Komu whose guidance led to the completion of this work. I also acknowledge the entire staff
working for Laikipia County Government who allowed me to use data within the organization for
academic purposes.
May the Almighty God Bless you all.

v
ABSTRACT
Productivity is a requirement for organizations employees. There are various factors
attributed to the level of productivity in an organization. The recently formed county
governments in Kenya have been faced with the problem of poor service delivery which
can be attributed to employee low productivity. As such, this study set out to understand
some of the factors that have resulted in the low productivity among county governments
with the Laikipia county government being a case study.
The study has the specific objective of understanding the effects of motivation, staff
skills, performance appraisal and leadership and on the productivity of employees at the
county government of Laikipia. Literature review has shown that indeed various factors
are at play in determining the level of productivity. However, the specific effects these
factors have on productivity of the employee still needs to be determined. For this
reason, the researcher has set out to collect and analyze data on the same. The study has
employed a descriptive format where the effects of any given factor are described. The
data collection has been done on the basis of a questionnaire which offers a lot of
advantages which the researcher has taken. Data was collected from a sample drawn
from employees of the Laikipia County working at the headquarters in Nanyuki. The
sample is determined on a stratified random case to give every employee an equal
chance to be part of the sample.
Data collected is analyzed manually and presented in tables and percentages largely
describing the correlation between a variable and the effect it has on productivity. From
the analysis, the study has found out that indeed, there is a strong correlation between
motivation and productivity whereby, the more motivated employees are, the higher the
likelihood of more productivity. In case of performance appraisal, it has been found to
have a largely negative effect on productivity. In the same token, the study has found
out that workers skills and levels of education are important to a very large extent in
raising productivity. However, leadership seems to be most influential factor affecting
productivity. The overall effect is that poor and uninspiring leadership tends to kill
productivity.
The study has recommended that county government leadership needs to facilitate
training and acquisition of skills for the employees to be more productive. It also needs
to motivate the employees for productivity to rise. In the case of performance appraisal,
the method used for this purpose is currently demoralizing employees leading to
disaffection and thus low productivity. The leadership needs to be more inspiring to the
employees. Dull or poor leadership is found to lower productivity by a very large
extent. The results of the findings are important to the other county governments and
the national government and indeed to all organizations in that they can be used as
guide in enhancing productivity.

vi
TABLE OF CONTENTS
Page
DECLARATION.............................................................................................................. ii
DEDICATION .............................................................................................................. iii
ACKNOWLEDGEMENT.................................................................................................iv
ABSTRACT ....................................................................................................................v
TABLE OF CONTENTS ................................................................................................vi
LIST OF TABLES ....................................................................................................... viii
ACRONYMS AND ABBREVIATIONS .........................................................................x
CHAPTER ONE ............................................................................................................1
INTRODUCTION TO THE STUDY ............................................................................1
1.1 Introduction to the chapter ....................................................................................1
1.2 Background of the study .......................................................................................1
1.3 Problem Statement.................................................................................................3
1.4 General Objective of the Study .............................................................................4
1.4.2 Research Questions ..............................................................................................5
1.5 Justification of the Study .......................................................................................5
1.6 Scope of the Study ..................................................................................................6
1.7 Chapter Summary .................................................................................................6
CHAPER TWO................................................................................................................7
LITERATURE REVIEW ................................................................................................7
2.0 Introduction to the Chapter ......................................................................................7
2.1.1 Management Theories ...............................................................................................7
2.1.2 Motivational Theories ............................................................................................. 10
2.2 Empirical review .................................................................................................. 12
2.2.1 Employees Productivity ......................................................................................... 12
2.2.2 Staff Skills ........................................................................................................... 13
2.2.3 Leadership .......................................................................................................... 15
2.2.4 Motivation ........................................................................................................... 17
2.2.5 Performance Appraisal ......................................................................................... 18
2.3 Summary and Research Gaps.............................................................................. 19
2.4 Conceptual Framework ....................................................................................... 21
2.5 Operationalization of Variables........................................................................... 22
2.6 Chapter Summary ............................................................................................... 22
CHAPTER THREE ....................................................................................................... 24

vii
RESEARCH DESIGN AND METHODOLOGY .......................................................... 24
3.0 Introduction ........................................................................................................ 24
3.1 Research Design.................................................................................................. 24
3.2 Target Population ................................................................................................ 24
3.3 Sample and Sampling Technique ......................................................................... 25
3.3.1 Sample size ......................................................................................................... 25
3.3.2 Sampling Technique ............................................................................................. 26
3.4 Research Instrument ............................................................................................ 26
3.5 Pilot Study .......................................................................................................... 27
3.6 Data Collection Procedure ................................................................................... 27
3.6.1 Validity ............................................................................................................. 27
3.6.2 Reliability Test ................................................................................................... 27
3.9 Chapter Summary ............................................................................................... 28
CHAPTER FOUR ....................................................................................................... 30
RESEARCH FINDINGS AND DISCUSSION............................................................ 30
4.0 Introduction ........................................................................................................ 30
4.1 Presentation of Research Findings ...................................................................... 30
4.2 Limitations of the Study ..................................................................................... 43
4.3 Chapter Summary ............................................................................................... 44
CHAPTER FIVE ......................................................................................................... 46
SUMMARY, RECOMMENDATIONS AND CONCLUSIONS ................................ 46
5.0 Introduction ........................................................................................................ 46
5.1 Summary of Findings ......................................................................................... 46
5.2 Recommendations .............................................................................................. 49
5.3 Conclusion ......................................................................................................... 50
APPENDIX II: QUESTIONNAIRE ................................................................................ A

viii
LIST OF TABLES
Page
Table 3.1: Target Population .......................................................................................... 25
Table 3.2: Sample Population ........................................................................................ 26
Table 4.1: Response Rate ............................................................................................... 30
Table 4.2: Distribution of Respondents by Gender ......................................................... 31
Table 4.3: Distribution of Respondents by Age .............................................................. 31
Table 4.4: Education Levels........................................................................................... 32
Table 4.5: Need for professional Qualifications ............................................................. 33
Table 4.7: Professional Qualifications and productivity ................................................. 34
Table 4.8: leadership support for employees .................................................................. 35
Table 4.9: Extent to which employees feel inspired by their superiors ........................... 36
Table 4.10: Management's Interest in Motivating Employees ......................................... 37
Table 4.11: Sources of motivation for Employees .......................................................... 37
Table 4.12: Extent of provision of motivating factor to employees ................................. 38
Table 4.13: level of satisfaction with the performance appraisal system in use ............... 39
Table 4.14: Extent individual’s improvement with right motivation ............................... 40
Table 4.15: Impact of performance appraisal on morale ................................................ 41
Table 4.16: Frequency of getting expected results .......................................................... 42

ix
LIST OF FIGURES
Page
Figure 2.1: Conceptual Framework ................................................................................ 21
Figure 2.2: Operational framework …………………………………………………. 22

x
ACRONYMS AND ABBREVIATIONS
CUE; Commission of University Education
MUA; Management University of Africa
NEMA; National Environmental Management Authority
ICT; Information and Communication Technology
CGL; County Government of Laikipia

1
CHAPTER ONE
INTRODUCTION TO THE STUDY
1.0 Introduction to the chapter
This chapter discusses the background of the study, statement of the problem, the general
specific objectives of the study, the research questions, justification, limitations and scope of
the study.
1.1 Background of the study
There is no question that productivity in any organization is important for the good
performance of the organization. Identifying the factors that influence productivity is a
research done over the years all over the world indicate that productivity is affected by
relatively few factors, some of which are organizational specific while others can be seen
as universal. According to Armstrong, (2006), workers are generally aware of the factors
that inhibit their performance. However, the way the government works is case specific
and as such the need to identify those factors. Identification of the specific productivity
factors relevant the government sector workforce may yield opportunities for significant
productivity gains in public sector. According to Lawrence (2010), a comparison
between productivity advancement in governmental organizations and those in the private
sector reveals that the governmental organizations have not kept pace with the increases in
productivity as found in the private sector.

2
According to Armstrong (20002) an organization's success mostly depends on the
employees. The level of employee performance determines the level of organizational
success in any industry. Chebet, (2015) argues that exploring and understanding those factors
that affect the employee performance and hence productivity is of major concern in every
Economy worldwide. A study by Coole in 2009 found that productivity level in 2009 in sub-
Saharan Africa economies have been reported as having the lowest level of productivity
(Coole, 2009).
Nigel, (2009) points out that Human Resources Management practices have significant
impact on organizations productivity. According to Nigel training and development, team
work, human resources planning and performance appraisal are do influence employee
performance.
The constitution of Kenya 2010, gave rise to county governments with the 2013 general
elections marking the official launch of 47 Counties, Laikipia County included. Since then,
functions and funds have been transferred to the new counties, and new county
institutions have gained prominence. The County Governments are under the
leadership of the Governors with of a couple of departments as stipulated in the fourth
schedule Part 2 of Constitution Of Kenya 2010 namely:- Executive, Treasury, Education,
Health. Water, Environment & Natural Resources, Youth, gender and sports, Transport
and infrastructure, Agriculture, livestock and fisheries, Tourism, land and planning.

3
Each function is under the management of an Executive Member assisted by a Chief Officer, but
the County Secretary heading the Administration Department is the Chief Executive Officer. The
chief officer is mandated to ensure that there is smooth operation of the County (Alande, 2013.
Strikes and go slows have been witnessed in most of the counties since their inception. Alande
(2015) has pointed out the case of increasing client complaints being experienced in almost all
counties mainly because of poor service delivery. In Laikipia County, there has been a hue and
cry over the quality of services ranging from poor garbage and solid waste management,
pollution, water shortages and poor roads among others. The main reason cited is poor
service delivery by the employees. His is nothing other than poor performance meaning that
the employee productivity is very low. This has challenged the researcher to examine the factors
that influences the employee performance in Laikipia County. Understanding such factors could
enable the county raise the employees performance so as to provide satisfactory services and in a
better way.
1.2 Problem Statement
After the Promulgation of the constitution of Kenya 2010 and thereafter, the 2013 general
election, a number of people left other sectors of the economy including renowned
companies and joined the work force of the County governments (Chebet, 2015). This was as
a result of perceived attractive compensation and better terms of engagement, coupled by
high level of optimism which a lot of people had. It was then expected that the quality of
services, effectiveness and efficiency by employees would be irreproachable. This is
not the case as quite a number of studies have pointed out the poor performance of

4
employees in various County Governments. Various reasons have been cited for this state
of affairs. Some of the reasons cited include subjective performance appraisal, poor
working conditions, leadership method, employee management method, training,
compensation, and political factors. This study embarks on trying to determine those
factors which affect employees' productivity in County Governments to the due to many
complaints documented on the poor services offered to citizens by the County
Governments.
1.3 General Objective of the Study
This study has the general objective of explaining the factors that affect County
Government’s employees' productivity in Kenya.
13.1 Specific Objectives
i. To establish the effects of staff skills on employee’s productivity at Laikipia
County Government
ii. To examine the effects of leadership style on employees productivity at Laikipia
County Government
iii. To establish the effect of Motivation on employees productivity at Laikipia
County Government
iv. To examine the effect of Performance Appraisal on employees productivity at
Laikipia county government

5
1.4 Research Questions
i. What is the effect of skills on employee productivity at Laikipia County
Government?
ii. What are the effects of leadership style on employees' productivity at Laikipia
County Government?
iii. What are the effects of motivation on employees' productivity at Laikipia
County
Government?
iv. How does performance appraisal affect employees' productivity at Laikipia county
Government?
1.5 Justification of the Study
This study will be useful to the County Governments in Kenya. It will help to understand
the perceived factors affecting employee performance in the devolved system. Results of
this study could be used by the County Governments in formulating the necessary human
resource management policies and strategies that will culminate in the counties giving better
service to the citizens of this country
Other scholars who may want to carry out similar studies in future ill find this study useful as it will
assist them gain a better insight in the dynamics affecting the human resources in county
governments.

6
1.6 Scope of the Study
The study focused on Laikipia County government staff members who are based at the
headquarters in Nanyuki Town. The target population is the Laikipia county government
employees who working at the county headquarters in Nanyuki town.
The study focuses on the factors of staff skills, leadership, motivation and Appraisal and
how they affect employee productivity. The study covers a period of six months from February
to august 2017.
1.7 Chapter Summary
This chapter has discussed the background to the study, the research questions and
justified the study. The chapter has been able to clearly spell out the problem that is under
study and why, in the author’s view, it is important to carry out the research as it will be
beneficial to the general public, scholars and the County Governments in Kenya.

7
CHAPTER TWO
LITERATURE REVIEW
2.0 Introduction
The chapter reviews the various theories that inform the understanding of employee
productivity. The chapter presents the empirical literature that explains how various factors
affect employees' productivity in an organizational setup as explained by other scholars.
2.1 Theoretical Literature Review
Various human resource management theories are reviewed here to inform the study on how
human resources are influenced by various factors. There are several human management
theories and motivation theories that that explain the how workers can be made to be more
productive. These theories are primarily used to inform the direction of this study
2.1.1 Management Theories
2.1.1.1 Classical Approach Theory
The Classical approach theory emphasizes Training on the job and the provision of monetary
incentives to raise employee performance. According to the theory, it is possible to increase
productivity from individual workers. This can be done through training the workers on the
job. This can be enhanced by providing incentives to the employee. Monetary incentives are
cited as one way of motivating the employee. According to this theory, the two, (Training on
the job and the provision of monetary incentives) can act as the major factors for higher levels
of output.

8
The twin goals of Productivity and efficiency as explained by Fredrick Taylor’s principles of
scientific management offer a scientific approach on raising productivity. Such an approach
as explained by Taylor comprises of three central elements:
Gathering knowledge of employees’ abilities to work based on the work process used, tightly
controlling workers activities by removing discretion, standardizing work procedures and time
allowed for each procedure. Through this approach, the worker is made to believe that they
will get compensation commensurate with their input while the management can expect
increased output. For the employee to maximize his compensation, he needs to reach peak
performance (Owen et al, 2007).
2.1.1.2 Systems Approach Theory
According to Jackson, (2007), the systems approach theory indicates that everything in the
organization is linked to everything else in the organization. As such, there is a place for
everything and everything in its place. At the final end, there is stability in the organization.
Jackson concludes that it is the management who has the responsibility to plan, organize, control
and coordinate all the activities of the organization.
According to (Hatch, 2006), the systems approach focuses on the interrelationships of structure and
behavior. The organizational structure will modify behaviour and vice versa. The organization
is seen both as a whole and as part of a larger environment. This environment includes the
relationships between the technical and social variables within the system. In this regard,
technology is believed to be a critical factor affecting the organizational design contrary to the
assertion of one way relationships as seen in the classical theory.
From the arguments of Judge (2007), the systems theory of organization consists of five
components; inputs, process, outputs, feedback and environment.
According to judge, inputs are the material, human, financial and the information resources
transformation, process is the management's use of production technology to change the

9
inputs into outputs, Outputs include the organization’s products and services.
Feedback is the knowledge of results that would influence the selection of inputs.
The Environment is the social, economic and political forces that influence the
organization.
According to Jackson (2007), employing Henri Fayols' Principles of Management can
result to more and better work from the same effort through the benefits of
specialization. This, in addition, has to be in an environment where discipline and
authority are paramount. From Jackson’s arguments, authority brings in responsibility
and so generates useful actions. Here, discipline is essential such that workers receive
orders from only one supervisor thus providing a unity of direction. From this argument, it is
clear that effective coordination requires that there should be one leader and subordination of
individual group interests with the interests of the organization taking precedence over those of
the individual. However, respect for line authority needs to be reconciled with the need for initiative
at lower levels order ii nth organization’s hierarchy.
The Contingency Approach
According to Judge et al (2007) the contingency approach emphasizes the need for flexibility. There
is no one best way to structure or manage organizations but management decisions should take
situational and contextual factors into account. Management's job is to learn and identify the
specific characteristics of the situation and then fit solutions to overcome these contingencies.
The size of the organization, the technology employed, the industry characteristics and the
environment in terms of external changes and uncertainty are some of some of the
Contingency factors influencing organizational design and effectiveness.
the contingency theory is criticized on the basis of lacking a clear description of what the
organization is in light of the fact that some businesses have the ability to create can create their
own environments or influence the existing environment to their advantage. The contingency
10
approach draws attention to the possibilities of different structures of the organization, each with a
different impact on the organizational effectiveness (Judge, 2007).
2.1.2 Motivational Theories
Many commentators on the theory believe that motivation is the driving force behind human
behaviour. For the many proponents of this approach to employee motivation, businesses
are basically formed with the intention of achieving certain objectives and thus to be
successful. Despite this, businesses or organizations are run by human being or human
resources. It is not lost in this approach that human resources are the most difficult resource
to manage for any organization. People have to be interested enough in what they are set
out to do in the organization if they are to perform in the way they are expected to. If they are not
interested and are not driven into action from within, there is little the organization can do to
improve its performance (Rousseau, 2009).
According to Mullins (2007), employees need to be motivated. Mullins describes Motivation as
a managerial process of engaging employees into behaviour whose objective is to drive the
organization to effectively achieve its objectives. Other scholars when analyzing this approach
define Motivation as a process that is initiated by a physiological or psychological need, which
causes a specific behavior or drive in order to achieve a goal or incentive. In this definition,
motivation is seen in three dimensions which are independent and interacting elements, needs,
drive and incentives.
Mullin (2007) defines motivation as the 'degree to which an individual wants are met. The
employee will choose to engage in certain specified behaviors' depending on the level of
motivation. Accordingly, employee's behavior is determined of by the availability of what motivates
them.

11
Rousseau, (2009) argues that the underlying concept of motivation is some driving force within
individuals by which they attempt to achieve some goal in order to fulfill some need or expectation.
Their performance is a product of both ability and the level of motivation. The relationship
between organization and its members is influenced by what motivates them to work and the
rewards and fulfillment they derive from it. The work organization, and the design and content of
jobs can have a significant effect on the satisfaction of staff and their levels of performance
(Rousseau, 2009).
Hatch et al (2006) explains that the management needs to know how best to elicit the
cooperation of staff and direct their efforts to achieving the goals and objectives of the organization.
He has strongly hinted that motivation is the key to achieving organizational objectives. To Hatch,
Motivation could be extrinsic or intrinsic. Motivation is extrinsic where tangible rewards such as
salary and fringe benefits, security, promotion, contract or service, the work environment and
conditions of work are the primary causes. Such tangible rewards are determined at
organizational level and may be outside the control of individual managers. However, the
organization as a whole should cultivate this type of motivation by putting on place systems that
work towards the provision of such.
Intrinsic Motivation results from the provision of psychological rewards. Such rewards include
the opportunity to use one's ability. This is simply empowering the individual employee by the
provision of such things as individualized training. According to Armstrong (2006), making
work challenging to the employee raises the worker’s motivation. Other such motivators include
the employee receiving some form of appreciation and positive recognition. To Armstrong, these
motivators are available to line managers and can be employed with a very high degree of
success.

12
2.2 Empirical review
2.2.1 Employees Productivity
According to Elliot (2009), employee productivity is basically related to performance in
terms of individual goals. Again, performance measurement is one of the most difficult
topics for managers. Measuring performance is similar to performance appraisal.
Performance appraisal provides an assessment of how an individual employee is
performing and gives an insight into what such an employee would have to do to raise their
effectiveness. Some employers peg employee remuneration on the basis of their scores in
performance measures. There many aspects that are looked into during such exercises. The
most prominent is arguably the rate of completion of assigned tasks, the accuracy and
deliverability of such tasks. According to Coole, (2012) such measures are difficult at best and
re often inaccurate. In such circumstances, relying on them for anything could be prejudicial to
the employee. Coole adds that they are subjective rather than objective and as such should not be
a basis for determining emoluments to employees.
Productivity has been described by Herti, et al (2011) as the level of an individual's
work achievement after having exerted effort. They believe that productivity is an
individual phenomenon. However, certain environmental factors will have a significant bearing
on performance. According to Herti, determining the individuals work as attempted by various
evaluations gives the organization certain advantages. Evaluations and assessments could also
have a negative influence on the individual. Herti, however, points out that successful
organizations in the private sector are adherents of the various work measurement and
evaluation schemes. Hatch (2006) gives the example of certain organizations that have seen
sustained superior performance over the years. He also links these organizations’ success to
their superior organizational culture. Measuring performance is part of that corporate

13
culture. Organizational structures and advanced human resource management practices,
including the use of realistic job pre-view techniques as well as employee evaluation have also
been cited as part of that organizational culture (Harackiewicz, 2003).
The concern of managers at different levels in organizations centers is effective in
improving productivity (Mamoria, 2004). The organizational culture should inspire co-
operation and teamwork, from top to bottom in the company. The manager should provide
incentives to workers in an organization, preferably by transferring a suitable kind of
leadership to bring about the kind of organizational culture where people identify their
interests with that of the cooperation. The managers should also find out the kind of
organizational culture where people identify their interests with that of the corporation, find
dignity and satisfaction in their work, with consequent effects on increased productivity,
morale and pride in being part of the organization (Marten, 2012).
2.2.2 Staff Skills
Lawrence, (2010) argues that skills development in organizations is a key plank in
improving organizational performance. For organizations to become competitive, it must
have the skills needed for its sector. This means that organizations that go out of their way
to have their employees acquire the necessary skills will ultimately do better than those
who frown at such undertakings.
Skills are acquired through training and practice (Pigors P, 2007). Training should be
planned, should be systematic and should also be geared towards obtaining some
predetermined objectives. Pigors demonstrates the positive co-relationship between training

14
and performance. This is because of the fact that training imparts the ability to perform the
tasks with ease and efficiency
Training generates benefits for the employee as well as for the organization by positively
influencing employee performance through the development of employee knowledge, skills,
ability, competencies and behavior, Organizations that are dedicated to generating profits for
its owner's shareholders, providing quality service to its customers and beneficiaries,
invests in the training of its employees (Pigors P, 2007).
Training should be tied to the potential of earning more money; this is a highly motivating
factor since because a highly motivated trainee learns much more quickly than a less
motivated trainee. The possibility of promotion and or recognition also influences the
learning curve. The learning curve is steeper where the two are a real possibility.
The management should also prompt the employee to acquire more training. This is
through communicating to the trainee that such possibilities are possible where new skills
and competencies in line with the organization’s objectives are acquired (Elliot. 2009).
Productivity can be defined as the achievement of specified task measured against
predetermined or identified standards of accuracy, completeness, cost and speed. Efficiency
and effectiveness are ingredients of performance with training being a way of increasing
individual's performance (Shaker A, 2003).
According to Nigel et al (2009) employee's productivity must be expressed as measure of
how well the individual workers output compare to some set standard. Good performance
shows a high measure against the set standards. In every organization there are some
expectations from the employees with respect to their performance. And when they
perform up to the set standards and meet organizational expectations they are believed good
performers. Functioning and presentation of employees is also termed as employee performance.

15
This means that effective administration and presentation of employees' tasks which reflect the
quality desired by the organization can also be termed as performance (Marten, 2012).
2.2.3 Leadership
A leader is considered as a person with the ability to persuade others to his/her views
and thus a course of action. The Leader, thus, is able to take his followers with him
through a process of guiding and influencing others to in achieving some predetermined
goals. The leader has to interact with the followers in some way for him to be able to
influence them. In an organization, the leader will try to influence the behavior of employees
with the aim of having them assist the organization to achieve its objectives. Any leader
should be able to inspire those he is leading, make appropriate decisions and show
them the best way to achieve whatever they set out to do. Leadership is thus
responsibility to lead others to achieve organizational goals: (Kradwoski, 2004).
A manger is basically a leader for those under them. As such, according to Kotler (2003),
Managers have to positively inspire their workers to achieve better results. They are leaders.
Managers may be overwhelmed by their responsibilities as a lot is expected of them. To acquire
all the necessary skills necessary to ensure that managers are leaders, they have to accurately
predict what would happen in the foreseeable future and plan for such. An organization therefore
needs to nurture new manager’s who will take the organization to higher levels of performance.
Harackiewicz, (2003) has identified poor leadership as a major reason for low morale and
unsatisfactory employee performance.
It is understood that mangers are leaders and they are nurtured. However, before this can
happen, a good assessment of the character and deportment of the potential managers must
be carefully assessed. Coole, (2012) notes that star performers in the operational areas are

16
not automatic leaders. So only those with leadership qualities should be considered for such
crucial posts in the organization.
Supervision also requires that one become a leader so as to effectively supervise others. Herti, et
al (2011) in their study noted that the relationship between a supervisor and those he/she is
supervising has a significant effect on productivity. In this case, poor relationships results to the
breeching of employees’ right to good treatment and thus low fulfillment of psychological
needs. The end result is poor organizational performance. Being confident and decisive often
endears supervisors to those under them which promote a positive relationship as argued by
Hagberg, (2014).
Bosses are expected to be in tune to their people. Lawrence (2010) notes that bosses are expected
to take charge effectively of the team they lead. This is echoed by Elliot (2009), who argues that
getting and giving credit, taking responsibility and providing psychological safety are some of
the responsibilities a good supervisor should take up. Hands-on transactional management
provides an opportunity for supervisors to produce results from their teams. It is believed that a
good supervisor will most likely translate to improved employee performance.
A prerequisite to corporate success it is the way its leaders apply management techniques.
Many authors note that the techniques must start from within the organization and they should
include mechanisms to ensure commitment. According to (Judge. 2007), communication,
quality management, benchmarking, process improvement and measurement are some of the
techniques available to a manger who wishes to improve.

17
2.2.4 Motivation
Armstrong (2006) defines motivation as the psychological process that arouses and directs
people's goal-oriented behaviour. They ask why people do the things they do and they answer that
they are mainly motivated to fulfill their wants and their needs. They continue to suggest that
motivation can result from two types of rewards. First is extrinsic reward which is the pay off, such
as money a person receives from others for performing a given job. The second is intrinsic reward
which is the satisfaction in performing the task itself and a feeling of accomplishment. Also says
that there is now substantial research showing that motivation brings high employee (Consuelo,
2010) involvement in organization activities and this enhances the perceptions of employees since
they feel valued by the organization.
Armstrong (2006) argues that capacities of employees are not only the product of their
competencies but also of the motivation and opportunities to utilize those competencies. He says
that Motivation can come in the form of fmancial incentives, the opportunity to get involved in
company projects, a career path that leads to growth and direct involvement in management. He also
observes that human resource management literature has largely emphasized the use of
performance-based pay, feedback, employment security, recognition, teamwork and training to
motivate employees. Motivation can create a productive work force but lack of motivating
factors can leave employees searching for reasons as to why they should give their maximum
efforts in their work (Coole, 2012).
Staff motivation improves employee performance by creating a favorable environment for work
and gives employees positive attitude and morale towards work.

18
2.2.5 Performance Appraisal
According to Armstrong (2006), performance appraisal is the identification, measurement and
management of the human resource performance in an organization. He argues that
organizations conduct appraisals for administrative purposes and to ascertain employee
performance. Employee performance appraisal can also be seen as a process of assessing,
summarizing and developing the work performance of an employee in an organization in order to
improve employee productivity in the organization he further indicates that the much of the
employee performance literature and the emphasis of developing employee competencies and
improving employee performance are derived from the resource-based perspective of business
strategy which is used for achieving business goals (Hagberg, 2014).
Under the resource-based perspective, competitive advantage is derived from a firm's physical,
human, and organizational resource and that the human resource controls all the other resources and
thus should be continually checked to ensure it is performing according to set standards (Hatch,
2006). Coole (2012) says that performance appraisals help employees understand how they are
doing in relation to objectives and standards of their job. The feedback given to the employee will
help them improve their perceptions towards their work. Accordingly, a good performance appraisal
system will identify performance standards and core competencies and communicate them to
employee. Periodical appraisals help the company to compare employees' performance with
desired performance and to take apt and appropriate decisions for further improvement. High
performance may merit salary increment, bonuses or promotion says that performance appraisals
are used to describe how well individuals perform their work.
The success of performance appraisals depends on the frequency of feedback concerning
the performance of the employees. According to, feedback should be provided on a regular
basis as it will improve employee perceptions towards their work. The performance

19
appraisal systems began as simple methods of income justification (Alande, 2013). The
process was firmly linked to material outcomes.
Performance appraisals affect employee perceptions towards work by enabling the
employees know what is expected of them on the job and measuring the actual performance
against the expected performance indicates that employees work hard to achieve set
targets. Lack of performance appraisals may reduce employee performance since the
employees may relax knowing they will not be evaluated against any set targets .
2.3 Summary and Research Gaps
A look at the available literature on factors that can influence staff performance indicates
that the factors involved are many and varied. Usually, a combination of several of these
factors is responsible for the state of affairs that an organization finds itself in on matters of
staff productivity. Several theories have been put forth to explain this phenomena.
However, the theories fall short of fully explaining the state of affairs and more so on new
entities such the county governments.
Motivation, skills of the employees, leadership style and performance appraisal have been
defined adequately by various scholars. However, not one scholar has fully explained the
precise effects that any of these factors will have on staff effectiveness. There is also need
to take cognizance of the fact that, the county governments are relatively new entities with
a different standard on what is regarded as effectiveness, efficiency and ability to give
service. Being nonprofit making bodies, they are driven by a different set of objectives
from the common objectives of profit for the majority of organizations mentioned or
explained in the available literature.
From the argument above, it becomes clear that there is a very clear and wide gap between
what is known on the effects of motivation in private sector organizations and what it could

20
possibly be in a new entity with very high expectations on the part of clients but with very
different objectives. This research will try to bridge such a gap as far as the four factors
being studied are concerned. This means that by zeroing in on the precise effects of these
factors on the performance of employees (employee productivity) as spelt out by the
specific objectives of the study.
The theories reviewed in this study have been developed under a very different
environment. This is not to say that they are inapplicable as far as County Governments in
Kenya are concerned but more so, there is need to actually test how they work under the
environment we have today.
Staff appraisal has been hailed as good move to assess the effectiveness of staff in carrying
out their assigned duties. However, the reviewed literature seems to discourage its use as it
could be detrimental to staff morale and hence motivation. This calls for the need to
actually asses its precise effects as far as the county governments are concerned.

21
2.4 Conceptual Framework
Figure 2.1: Conceptual Framework
Independent Variables Dependent Variable
Source: Author (2016)
Employee Productivity:
Optimal employee result as a result of the Employee efforts based on measured
performance outcomes.
Skills:
Organizational activity aimed at improving employee Skills levels to enhance their
efficiency and effectiveness. It is also known as learning.
Leadership:
A supervisor's style of providing direction to the team they supervise, implementing plans and
decision making processes in their day to day job roles.
Staff Skills
Leadership
Motivation
Employee productivity
Staff appraisal

22
Motivation:
Is the actions including the benefit that employee receive in the form of pay, wages and
also some rewards like monetary exchange for the employee's to increases the their work
output (Performance)
2.5 Operationalization of Variables
Figure 2.6: Operational Framework
Contents of training
Training frequency
Style of leadership
Competence of leaders
Accuracy of results of
appraisal
Method of performance appraisal in use
Motivating factors
Staff skills
Level of Motivation
Leadership
commitment
Staff performance
Management support
Increased output by individual
employee
Higher quality output by
employee

23
2.6 Chapter Summary
This chapter has extensively looked at the available literature on the factors under
investigation. Several theories dealing with the subject of what influences employee
performance have been examined. At the same time, the empirical literature has been
looked at in order to come up with a better understanding of the effects of various factors
on employee performance. From that review the chapter has identified the areas that need
to be looked into in order to bridge the gap between what is currently understood and what
needs to be understood as far as the subject is concerned.
Finally, the chapter has portrayed a schematic representation of the relationship between
the independent factors and the dependent factor. This is necessary so as to clearly see the
interdependencies between all the factors in play and the independent variable.

24
CHAPTER THREE
RESEARCH DESIGN AND METHODOLOGY
3.0 Introduction
This section describes the research design, target population, sampling design and sample
size, and the data collection methods that were used. The chapter also discusses validity
and reliability of research instruments, data collection method and procedure, analysis and
presentation techniques and the ethical considerations of this study.
3.1 Research Design
This study has adopted a descriptive survey research design. This is because it attempts
to collect data from members of a population in order to determine the current status of that
population in respect to one or more variables. In addition, descriptive research design was
thought suitable because the researcher was to collect data and report the way the situation
is without manipulating any variable as explained by Consuelo, (2010).
3.2 Target Population
The target population was all the employees of County Government of Laikipia who are
stationed at the county headquarters in Nanyuki town. The County Government of
Laikipia human resources department has listed 1875 employees who are based at the
Nanyuki headquarters. The employee databank indicated that the organization had a total
of 1800 employees spread between eight ministries and directorates. The target population

25
was thought sufficient to allow for generalizations on determinants of employees
productivity in County government of Laikipia and the other County government in Kenya.
The targeted population is spread as indicated in table 3.1.
Table 3.1: Target Population
Ministry/Directorate Number of Employees
Public Service and County Administration 310
Finance & Economic Planning 240
Health 256
Agriculture, Livestock and Fisheries 120
Water, Environment and Natural Resources 95
Land, Infrastructure and Urban Development 360
Directorate of Energy, Roads and Transport 280
Education, Gender, Youth, Sports and ICT 139
Total 1800
Source: CGL Human Resources Department (2016)
3.3 Sample and Sampling Technique
3.3.1 Sample size
The main factor to consider in determining the sample size is the need to keep the sample size
manageable enough. A sample size of between 10 and 30% of the population is considered as
adequately representing the population it is drawn from.(Consuelo, 2010). A sample size of 10% will
be used to ensure that the sample size is manageable enough.

26
3.3.2 Sampling Technique
The study has employed the Stratified random sampling method to get a suitable sample
from the population. Employees are grouped in their respective categories and then
randomly selecting10% of the respondents from each category. This allows every
individual to have a chance of being included in the sample. The sample population is as
shown in Table 3.2.
Table 3.2: Sample Population
Ministry/Directorate Population Sample size
Public Service and County Administration 310 31
Finance and Economic Planning 240 24
Health 256 25
Agriculture, Livestock and Fisheries Development 120 12
Water, Environment and Natural Resources Management 95 10
Land, Infrastructure and Urban Development 360 36
Directorate of Energy, Roads and Transport 280 28
Education, Gender, Youth, Sports and ICT 139 14
Total 1800 180
Source: Author (2016)
3.4 Research Instrument
The research used a questionnaire as the research instrument. The questions were designed
to elicit responses appropriate to the questions that needed to be answered for the study to
achieve its specific objectives. The Questionnaires were distributed to randomly selected
staff in their respective offices. This provided an opportunity for respondents to think
through their answers and consult where necessary.

27
3.5 Pilot Study
Since the questionnaires were self-administered they were pre-tested to ensure elimination
of vague questions for ease of understanding by giving a few to some of the employees
before the actual study. The responses obtained from these initial questionnaires guided
the research in formulating appropriate questions that enabled respondents to provide
relevant and precise information needed for the research. They also made tabulation of
information much easier among other benefits of using the tool
3.6 Data Collection Procedure
3.6.1 Validity
A pilot study was conducted to help establish content validity of the questionnaire. The
questions were carefully constructed and refined after the pilot study. The research
instrument was also reviewed and amended by experts in the area of study
3.6.2 Reliability Test
To establish the reliability of the questionnaires the instrument was provided to a total of
35 respondents (at least 10% of the sample size) at the county government. The reliability
respondents were repeatedly asked the same questions and the answers were eventually
used in the construction of the final questionnaire.
3.7 Data Analysis and Presentation
Both qualitative and quantitative data was collected. Data collected was then be classified
according to the properties that characterized each of them. Respondents' total scores and
percentages were used to analyze the data. Respondents' scores were analyzed in descriptive

28
statistics using tables and percentages. Furthermore charts and graphs are used in
presentation the results of data analysis.
3.8 Ethical Considerations
The researcher obtained an authorization letter from MUA and from the CUE giving
her permission to conduct research. The researcher carried the letter during data collection
and presented it to appropriate authorities to be allowed to conduct research. The
respondent in this study were not required to use their names or provide any form of
identification.
Full consent of all respondents was sought before the questionnaires ware administered.
All subjects were assured of total confidentiality and the data obtained was to be used for
research purpose only. The study tried to avoid creating any form of risk to the
participants. There were no direct benefits to the respondents but the results are expected to
be of value to the entire organization.
3.9 Chapter Summary
The chapter has discussed the methodology used in conducting this research. The questionnaire is
the primary data collection tool used to collect data from the field. The study used a target
population of 1800 individuals who are employed by CGL and are based in Nanyuki. From this
population, a sample comprising 180 individuals was drawn on a stratified random basis to ensure
that all individuals in every department had a chance of being selected into the sample.

29
Data analysis was manual where every question responded to by an individual was analyzed
individually and interpreted accordingly. The analyzed data is presented in terms of charts and
tables.
The study has considered all relevant ethical and logistical aspects and this has been taken care of
to ensure that individuals’ rights are not violated and they are not inconvenienced.
To ensure validity and reliability the study has computed the relevant coefficient using the
Pearson Product-Moment Correlation Coefficient formula and has had experts test the
questionnaire.

30
CHAPTER FOUR
RESEARCH FINDINGS AND DISCUSSION
4.0 Introduction
This chapter will present the research findings according to research questions, discuss the
limitations encountered during the research and how the researcher resolved them and
finally give a summary of the chapter.
4.1 Presentation of Research Findings
4.1.1 Response Rate
The researcher issued 180 questionnaires. Out of those questionnaires, only 10 were found
to be unusable because they were not filled. The rest were found to be in order and thus
the responses could be analyzed. This gives a response rate of 94%. According to
Mugenda (2009), a response rate of 50% and above is considered adequate and data can
be analyzed thereof. The response is as shown by table 4.1 below.
Table 4.1: Response Rate
Number of questionnaires issued Number of questionnaires returned and
filled
Response rate
(%)
180 170 94
Source: Field Data (2017)

31
4.1.2 Gender of Respondents
Table 4.2: Distribution of Respondents by Gender
Gender Frequency Percentage (%)
Male 110 61.1
Female 60 33.3
Non response 10 5.6
Total 180 100.0
Source: Field Data (2017)
Males constituted the majority at 61% of the valid responses while females were 33% of
the valid responses. In this respect, the organization meets the requirement of gender
parity by having at least a third of the female gender as employees. For the research, there
is likely to be a balanced opinion on matters being asked as there is enough of each
gender.
4.1.3 Distribution of respondents by Age
Table 4.3: Distribution of Respondents by Age
Age group Frequency Percentage (%)
18-25 6 3.3
26-33 20 11.1
34-41 40 22.2

32
41-48 42 23.4
49-56 40 22.2
57 and above 22 12.2
Non response 10 5.6
Total 174 100.0
Source: Field Data (2017)
The majority age group here is aged between 41-48 years representing 23% of the
population. From the distribution, the organization’s workforce has all working ages
represented here. This indicates that there is no bias by one age group and the responses
are therefore valid as they will reflect all ages.
4.1.4 Education Levels
Table 4.4: Education Levels
Education Level Frequency Percentage
(%)
Primary school 0 0.0
Secondary School 50 27.8
Diploma 74 41.1
Degree 42 23.3
PhD 4 2.2
Non response 10 5.6
Total 180 100.0
Source: Field Data (2017)

33
Data collected and analyzed shows that the majority of the employees at the county
government of Laikipia have attained at least some post secondary level of education.
Those holding a diploma certificate are 41.1% of those sampled, secondary school
certificate holders are 27.8%, with degree holders are 23.3%, while none hold only a
primary school certificate. The indication is that the level of education here is relatively
high with employee trained in various fields to relatively high levels. We can expect the
level of skills to be high.
4.1.5 Need for Professional Qualifications
Table 4.5: Need for professional Qualifications
Frequency Percentage (%)
Strongly agree 50 27.8
Agree 100 55.5
Strongly disagree 6 3.3
Disagree 10 5.6
Neutral 4 2.2
Non response 10 5.6
Total 180 100.0
Source: Field Data (2017)
There is agreement by the majority that there is need to have professional qualification for
the work they do. The majority agree (55.5%) followed by 27.8 percent who strongly
agree that one needs to have professional qualification for the work they do. This question

34
and the response indicate the need to have the professional skills to perform the duties
assigned.
4.1.6 Frequency of Trainings/Seminars per year
How many times do you attend
trainings/seminars per year?
Frequency Percentage
(%)
Several times per year 20 11.1
Once per year 30 16.6
Never 120 66.7
Non response 10 5.6
Total 180 100.0
Source: Field Data (2017)
Majority of employees (66.7%) do not go for any trainings or seminars at all. The
indication is that the majority of employees do not upgrade their skills at all. Only a
minority (11.1%) and probably the top managers of sections go for seminars severally
per year. Without upgrading the skills, we cannot expect the productivity to increase
among this big majority.
4.1.7 Professional Qualifications and Productivity
Table 4.7: Professional Qualifications and productivity
Professional qualifications : Frequency Percentage (%)
Greatly enhances productivity 120 66.7

35
Moderately enhances productivity 30 16.5
Does not enhance productivity at all 10 5.6
Don’t know 10 5.6
Non response 10 5.6
Total 180 100.0
Source: Field Data (2017)
From the analysis of the responses, the majority (66.7%) are of the view that professional
qualifications greatly enhance one’s productivity. For 16.5% of the respondents, there is a
moderate enhancement of productivity with professional qualifications. There is a small
minority (5.6%) who are of the opinion that professional qualifications do not enhance
productivity at all while another 5.6% of the respondents do not have any idea whether
professional qualifications enhances productivity or not.
4.1.8 Satisfaction of employees with Support given by leadership
Table 4.8: leadership support for employees
Are you satisfied with the support given to you by the HR
department? Frequency Percentage (%)
Highly satisfied 30 16.5
Satisfied 39 21.7
Dissatisfied 43 23.9
Highly dissatisfied 38 21.1
Neutral 20 11.2
Non response 10 5.6
Total 180 100.0

36
Source: Field Data (2017)
The majority of employees (23.9) are not satisfied with the support they receive from the
top managers in the human resource department. The implication is that the majority do
not feel that there is good leadership. There is also a sizeable minority (21.1%) that is
highly dissatisfied with the support from the H.R department. This also indicates poor
leadership which is not good for improving productivity. However, there is a sizeable
number (16.5%) who are highly satisfied with the support they receive from HR.
4.1.9 How well employees are inspired by their superiors to work better
Table 4.9: Extent to which employees feel inspired by their superiors
Level of inspiration by superiors Frequency Percentage (%)
Highly inspired 30 16.5
Moderately inspired 39 21.8
Not inspired at all 63 35.0
Don’t know 38 21.1
Non response 10 5.6
Total 180 100.0
Source: Field Data (2017)
Superiors do not inspire their juniors according to the majority. From the data analyzed,
35% of employees do not feel inspired by their superiors at all by their leaders, 21.8% feel
moderately inspired, while 16.5% are highly inspired. The greater majority who feel
uninspired at all indicates that there is poor leadership.

37
4.1.10 Managements Interest in Motivating Employees
Table 4.10: Management's Interest in Motivating Employees
Management is interested in motivating employees Frequency Percentage (%)
Strongly agree 25 13.8
Agree 34 18.9
Strongly disagree 63 35.0
Disagree 38 21.1
Neutral 10 5.6
Non response 10 5.6
Total 180 100.0
Source: Field Data (2017)
The majority are of the opinion that the management is not interested in motivating the
employees. This is because the majority (35%) strongly disagree with the statement that
management or leadership for that matter is interested in motivating the employees.
However, there is a sizeable number (18.9%) who agree with the statement while 13.8%
are in strong agreement with the statement. The implication is that leadership is poor as it
does not really motivate the rank and file employees.
4.1.11 Sources of motivation for Employees
Table 4.11: Sources of motivation for Employees
Management is interested in motivating employees Frequency Percentage (%)

38
Remuneration 70 38.9
Working conditions 65 36.1
Recognition 30 16.6
Promotion 5 2.8
Non response 10 5.6
Total 180 100.0
Source: Field Data (2017)
Remuneration tops the list of the factors that motivate employees at the organization with
38.9% of respondents saying that remuneration is their greatest motivator here. Another
36.1% are motivated by working conditions while 16.6% are motivated by being
recognized. The implication of this data is that the county government of Laikipia
probably does not remunerate its employees as much as they hope for or as according to
their perceived worth. Another implication is that productivity cannot be expected to be
high with so many employees feeling that they are not motivated enough because their
basic motivator is not met.
4.1.12 Level to which the organization provides the motivating factor to employees
Table 4.12: Extent of provision of motivating factor to employees
This organization provides you with what motivates you Frequency Percentage (%)
Highly 21 11.6

39
Moderately 25 13.9
Low 102 56.7
Not at all 22 12.2
Non response 10 5.6
Total 180 100.0
Source: Field Data (2017)
This organization does not provide the employees with what motivates them. According to
the data collected and analyzed, 56.7% of the employees feel that the extent of providing
them with whatever motivates them is low, moderate (13.9%), and high (11.6%), not at all
(12.2%). As such, majority of employees cannot be motivated to improve their
productivity.
4.1.13 Satisfaction with performance appraisal System
Table 4.13: level of satisfaction with the performance appraisal system used
To what extent are satisfied with the current performance
appraisal system? Frequency Percentage (%)
Highly satisfied 12 6.7
Moderately satisfied 25 13.9
Low satisfaction 113 62.8
Not satisfied at all 20 12.2
Non response 10 5.6
Total 180 100.0
Source: Field Data (2017)

40
The performance appraisal system in this organization is unpopular and there is low
satisfaction with its use according to the majority (62.8%). The current system is thus not
able to enhance employee productivity as very few of them have faith in it. Only 6.7% of
them are highly satisfied. These could be the people who actually perform the duty of
appraising performance. There is a sizeable number (12.2%) who are totally unsatisfied
with the system in use. Productivity cannot thus be enhanced using the system.
4.4.14 Level of improving individual’s service delivery levels with the
organization providing the individual’s motivating factors.
Table 4.14: Extent individual’s improvement with right motivation
To what extent would you improve in your service deliver if
you were provided with what motivates you? Frequency Percentage (%)
Very high Improvement 92 51.1
Moderately improvement 63 35.0
Low improvement 15 8.3
Not improvement at all 0 0.0
Non response 10 5.6
Total 180 100.0
Source: Field Data (2017)
Should the management organization deliver to employees what they feel motivates them,
majority (51.1%) would make a very great improvement in the individual delivery of

41
services. Another 35% would make a moderate improvement while 8.3% would realize a
low improvement individually in their work delivery. N one would not realize any
improvement. The indication is that productivity would improve with the right motivator
for the individual employee
4.1.15 Effects of performance appraisal on morale of employees
Table 4.15: Impact of performance appraisal on morale
How does performance appraisal impact on your morale? Frequency Percentage (%)
Highly improves morale 9 5.0
Moderately improves morale 12 6.7
Not change in morale at all 20 11.1
Moderately demoralising 80 44.4
Highly demoralising 49 27.2
Non response 10 5.6
Total 180 100.0
Source: Field Data (2017)
Performance appraisal is largely demoralizing. According to the statistics collected and
analyzed for this study, 44.4% of respondents are of the opinion that to them performance
appraisal is moderately demoralizing to them, 27.25% find it highly demoralizing and
11.1 5 find no change in their moral even after going through a performance appraisal.
This data indicates that employee performance appraisal impacts negatively on
42
individuals’ productivity because a demoralized individual cannot be as productive as
they would.
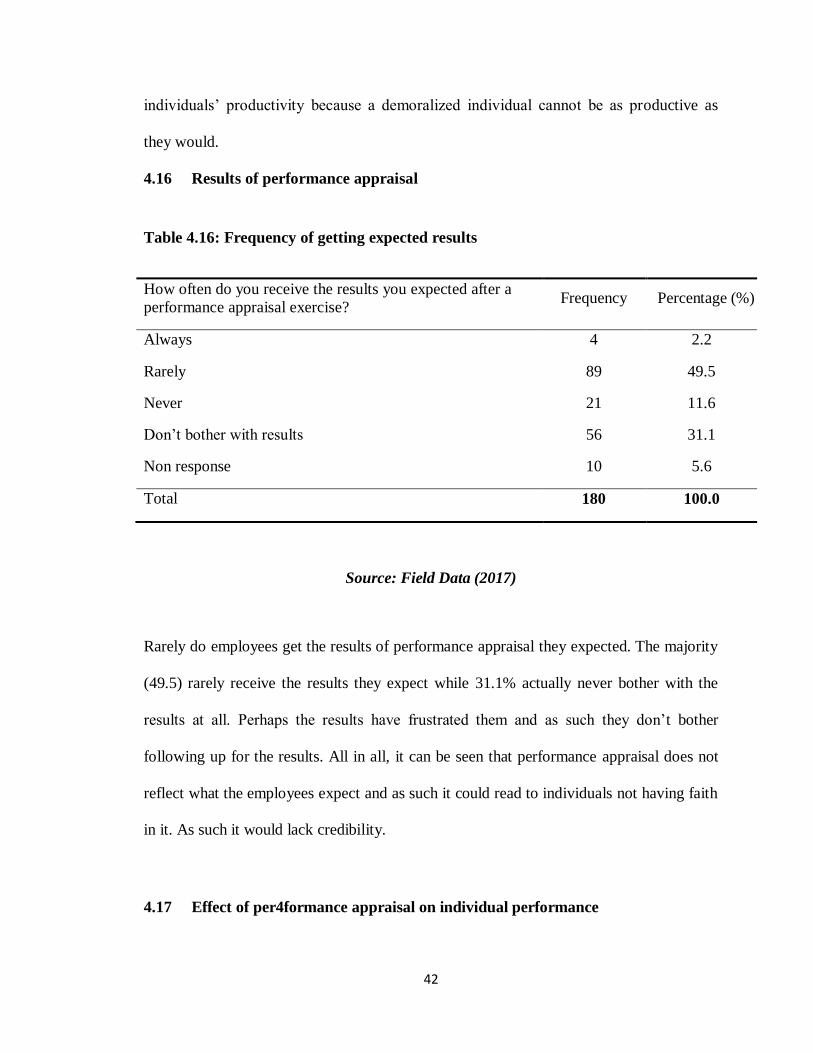
4.16 Results of performance appraisal
Table 4.16: Frequency of getting expected results
How often do you receive the results you expected after a
performance appraisal exercise? Frequency Percentage (%)
Always 4 2.2
Rarely 89 49.5
Never 21 11.6
Don’t bother with results 56 31.1
Non response 10 5.6
Total 180 100.0
Source: Field Data (2017)
Rarely do employees get the results of performance appraisal they expected. The majority
(49.5) rarely receive the results they expect while 31.1% actually never bother with the
results at all. Perhaps the results have frustrated them and as such they don’t bother
following up for the results. All in all, it can be seen that performance appraisal does not
reflect what the employees expect and as such it could read to individuals not having faith
in it. As such it would lack credibility.
4.17 Effect of per4formance appraisal on individual performance

43
Table 4.17: Effect of performance appraisal on employee performance
How does performance appraisal impact on your
performance? Frequency Percentage (%)
Highly improves performance 7 3.8
Moderately improves performance 14 7.8
Not change in performance 18 10.0
Moderately lowers performance 84 46.7
Highly lowers performance 47 26.1
Non response 10 5.6
Total 180 100.0
Source: Field Data (2017)
Performance appraisal lowers individuals’ performance. According to the majority
(46.7%), performance appraisal moderately lowers performance and for 26.1%,
performance appraisal highly lowers performance. Only 7.8% of respondents feel that
performance appraisal moderately improves performance while 3.8% feel that it highly
improves performance. From the earlier question, it was found that appraisal is
demoralizing to the majority of employees and as such we can expect their performance
and hence productivity to go down.
4.2 Limitations of the Study
The study faced some very significant limitations. For one, access to the offices of the
CGL was limited. In some instances, completely denied. As such, getting respondents to

44
respond to queries raised through their submissions was not easy. The researcher had to
have some prior appointment with certain individuals so as to meet and have them clarify
things.
A lot of the information needed for the research was considered confidential by a lot of the
respondents. However, by assuring them it was for research purposes only, they eventually
opened up and provided the necessary information albeit reluctantly.
A lot of the targeted respondents were really very busy in their work and could barely
have time to fill the questionnaire. Some filled it hurriedly requiring the researcher to have
to revisit them to clarify some issues. By scheduling collection of the filled questionnaires
after three days, this problem was minimized.
4.3 Chapter Summary
This chapter has presented the data as per the research questions. The data is as collected
and analyzed from the field, there is an extensive use of charts to present the findings with
each response analyzed and interpreted individually. The interpretation is reflective of
what was gleaned from the theoretical review and the empirical review. The chapter also
gives a summary of the limitations faced while conducting the research and the steps taken
to handle these limitations. The major finding in this analysis is that the county
government needs to motivate the employees and desist from carrying out performance
appraisals as they are currently done. The data and consequent analysis shows that these
two actually lowers the productivity of the employees to very large extent.

45
The chapter has also shown that the employees are fairly well skilled and have relatively
high levels of education which could lead to the expectation of highly productive
individuals. However, there is rarely any case of skills upgrade as employees rarely go for
training or even seminars. This can explain the relatively low productivity. Again, due to
low

46
CHAPTER FIVE
SUMMARY, RECOMMENDATIONS AND CONCLUSIONS
5.0 Introduction
This chapter aims to give a summary of the research findings, give recommendations on
how productivity can be positively influenced by working on motivation of employees,
leadership, working on the skills of the employees, and by suitable employee adopting
employee appraisal methods or systems. This is as guided by the research findings as
discussed in chapter four. Also, the chapter concludes the study by enumerating the
findings as per the objectives of the study.
5.1 Summary of Findings
The response rate for this study is very high at 94 %. As mentioned in the analysis, this
rate means that the study findings are representative of the population and as such valid.
Gender wise, though males are more than females, still the sample population meets the
agreed minimum of gender parity where neither gender is less than 60% of the total.
Males constitute 61% of the population while females constitute the rest (39%). All
working ages are represented by the sample population. That is there are representatives
from the lowest working age of 18 years to the age of 57 years and above. This indicates
that there is no bias towards any one age group and the responses are therefore valid as
they reflect all working ages.

47
Employees are well educated with all levels of education from secondary school to PhD
being represented. This indicates a high level of skills amongst the population. The
expectation is that due to the high levels of education, productivity of the individual
should be high. However, there are other factors in play here other than education. Hardly
do the employees advance their training through seminars and other means of imparting
skills and knowledge. The effect is that skills do improve productivity but they need to be
upgraded regularly. This does not happen here as only a minority attended trainings and
seminars on a regular basis. Still, there is general agreement that there is need to have
professional qualifications for the work or tasks one does. Those without such skills need
to have them, yet they hardly ever attend any training and it can be safely assumed that
such skills are absent amongst the majority of the workforce. The overall effect is that
skills improve productivity but one needs to constantly update them to maintain that
productivity. For this county government, it needs to have the employees attend regular
trainings to enhance their skills by organizing for seminars, in-house trainings etc. this is
clearly shown by the statistics where the majority (66.7%) agree that professional
qualification greatly enhances productivity of the individual.
In this organization, employees are not motivated. They are of the opinion that the
leadership does not support them adequately. Without leadership support, productivity
cannot be expected to be high. Further analysis of the collected data supports this assertion
The majority of employees (23.9) are not satisfied with the support they receive from the
top managers in the human resource department. The implication is that the majority do
not feel that there is good leadership. The effect on productivity is largely negative.

48
Support for this comes from the fact that few feel inspired to do better their leaders. This
is because the majority, (35%) feel that the leadership does not inspire them at all.
Additionally, there is ample evidence that the leadership does not and is not interested in
motivating the employees. The support comes from the fact that 35% of the population
are of the strong opinion that management is not interested in motivating the employees.
Employees are largely motivated by a good remuneration as is the feeling of the majority
at 38.9%. Further analysis indicates that the management does not provide the
motivating factor to an appreciable extent. This is the opinion of 56.7% of the
population. The import of all this is that the employee is not motivated as much as he/she
could be. From the empirical literature, it is a fact that motivated employees are more
productive. Thus, productivity in this organization is low simply because the employees
are not motivated. Therefore lack of motivation for any reason should lead to low
employee productivity. This is borne by the data analyzed which points out that Should
the management organization deliver to employees what they feel motivates them,
majority (51.1%) would make a very great improvement in the individual delivery of
services. The indication is that productivity would improve with the right motivator for the
individual employee.
The performance appraisal system in this organization is unpopular and there is low
satisfaction with its use according to the majority (62.8%). The current system is thus not
able to enhance employee productivity as very few of them have faith in it. The effect is
that the appraisal system in place has lead to lower levels of productivity among the

49
employees of the organization. A further analysis clearly demonstrates this fact. From the
statistics, 44.4% of respondents are of the opinion that to them performance appraisal is
moderately demoralizing to them. There is a good reason for this. The reason is that the
majority of employees (49.5%) rarely ever get the results they expect. The effect of this is
that performance appraisal lowers individuals’ performance according to the majority
(46.7%).
5.2 Recommendations
From the study, several recommendations may be made. For one, there is poor leadership
that is uninspiring to the majority of employees. For this reason, the management needs to
change its leadership style and adopt a leadership style that inspires the employees to
reach higher in their service delivery. This if adopted will raise productivity of the
employees. This is because there is a direct relationship between the type of leadership
and productivity as established in the analysis. This applies to all other similar
organizations (county Government). They need to have inspiring leadership if the level of
productivity is to rise.
Motivation is a factor of productivity as demonstrated by the findings of this study.
However, employees are motivated by different things. Top among them is remuneration
and management of every organization needs to recognize this and provide it. Should this
happen, level of productivity will rise accordingly. It is recommended that the
management should go out of its way to motivate employees for productivity to rise.
Again, employee should feel supported by their superiors for productivity to rise.

50
Performance appraisal should be relooked as there is evidence that it could demoralize
employees with the consequent drop in productivity. It is recommended that the
organization should adopt an appraisal system that gives results acceptable to employees
at least. Again, employees should feel that the results reflect what they expect.
Education attainment is important for basic skills. However, this must be complemented
by professional trainings which should be regular for all employees. It is recommended
that this particular organization and other similar organizations should scout for the
employees with professional skills in the jobs they are assigned to and not just that but
also institute trainings regularly to enhance the skills as the work environment is
continuously changing for productivity to improve. There is ample evidence that with
professional qualifications coupled with regular trainings, the level of productivity would
improve to very great extent.
5.3 Conclusion
From the above discussion, the study concludes by saying that county government s and
other similar organizations are facing poor employee productivity as a result of four
factors working together. Though they have highly educated employees, they are not
training them regularly and as such their level of skill remains low. For this reason, their
productivity hardly rises but more often it goes down. This translates to poor service
delivery. Skills acquisition and upgrading is thus important in ensuring a rise in
productivity. This answers the research question “what are the effects of skills on
productivity” by saying that the level of skills has a positive and direct relationship with

51
productivity in that the higher the level of skills and the more they are upgraded, the more
we can expect productivity to rise.
On the other hand, motivation is very important in determining the level of productivity.
Less motivated employees have low productivity. The research question on what the
effects of motivation are on productivity is addressed, thus answered in that motivation
would increase productivity of the individual employees and the organization as a whole.
Leadership effects productivity. For productivity to rise, the leaders have to inspire their
followers to higher levels of service delivery. Good leadership that inspires individuals
must be cultivated. The research question on the effects of leadership on productivity can
be addressed thus good leadership that inspires individuals’ raises productivity.
Performance appraisal is another factor that significantly influences productivity. The
relationship is that with a given system of appraisal, individuals may end up being
demoralized and therefore less productive. The available evidence supports this assertion
but cannot be conclusive given that there several employee performance appraisal
methods. However, the important thing is that the method used should resonate with the
individual employee and the results should be acceptable to the individual. Without this,
there is danger that any performance appraisal could have negative effect(s) on the
productivity.

52
REFERENCES
Alande, j. (2013). The role of human resource management in devolution of counties in Kenya.
International Journal of Social Sciences and Entrepreneurship, 568-582.
Armstrong. (2006). Handbook of human resource management. London, England: Kogan
Park Ltd.
Chebet, J. (2015). Determinants of Employees' Performance in the County
Governments of Kenya. Nairobi: UON.
Consuelo, S. G. (2010). Research Methods. Manila: Rex Book Store.
Coole. (2012). Theory and Practice of Management. Boston, United states of America:
Irwin McGraw-Hill.
Elliot, A. J. (2009). Approach and avoidance achievement goals and intrinsic motivation. A
meditational analysis. Journal of Personality and Social Psychology„ 230-245.
Hagberg, R. a. (2014). organization culture. New York:: Harper and rows.
Harackiewicz, J. M. (2003). Predictors and consequences of achievement goals in the college
classroom: Maintaining interest and making the grade. Journal of Personality and
Social Psychology„ 11101123.
Hatch, M. J. (2006). Organization Theory: Modern, Symbolic, and Postmodern
Perspective. Oxford : Oxford University Press,.
Hirt, F. (2011). Business: A Changing World. (8 ed.). (n. Edition., Ed.) Mc Graw-Hill.
Jackson, A. ,. (2007). Principles of Management. New York: McGraw Hill.
Judge, L. &. (2007). Management Practice. New York: Palgrave Macmillan.
Lawrence. (2010). Business week. Chicago, US: Unproductive slam man.
Mamoria, C. B. (2004). Personnel Management. Mumbai:: Himalaya Publishing House.
Martyn, D. (2012). Ground Rules for Good Research. Philadelphia: Open University Press.

A
APPENDIX II: QUESTIONNAIRE
Dear Sir/Madam
As part of my project, I would like to gather some information from you which will help
me to complete this study. This study seeks to find the effects of motivation, employee
appraisal, leadership and employee skills on the productivity at the county government of
Laikipia. I would be obliged if you cooperate with me in filling the questionnaire. This
information is for research purposes only and will be treated with utmost confidentiality.
Section A: General Information
1. Gender
A. Male
B. Female
2. Age (years)
A. 18-25
B. 26-33
C. 34-41
D. 41-48
E. 49-56
F. 57 and above
3. Length of employment at your current station (years)
A. Under 1 years
B. 2-4 years
C. 5-7 Years
D. 8-10 years

B
E. Above 10 years
Section B: Effects of Staff Skills on Employees' Productivity
4. Highest level of education
A. Primary school
B. Secondary school
C. Diploma
D. Degree
E. PhD
5. To what extent do you agree that you need Professional qualification(s)
for the work you do here?
A. Strongly agree
B. Agree
C. Strongly disagree
D. Disagree
E. Neutral
6. How often do you go for training and or seminars
A. Never
B. Once per year
C. Several times every year
7. To what extent would you say that your qualifications help you to do your
work
A. It has greatly helped

C
B. Has fairy helped
C. Has not helped at all
D. I don’t know
Section C: Leadership and Employees' Productivity
8. Are you satisfied with the support from the HR department?
A. Highly satisfied Satisfied
B. Neutral
C. Dissatisfied
D. Highly dissatisfied
9. To what extent Does your supervisor inspire you to work better
A. Very highly
B. Fairy well
C. Does not inspire me at all
D. Don’t know
Section D: Motivation on Employees' Productivity
10. Are you satisfied with the support from the HR department?
A. Highly satisfied Satisfied
B. Neutral
C. Dissatisfied
D. Highly dissatisfied
11. “The Management is really interested in motivating the employees”
A. Strongly agree
B. Agree

D
C. Strongly disagree
D. Neutral
12. What motivates you to work better
A. Pay
B. Working conditions
C. Recognition
D. Promotion
13. To what extent would you say this organization provides you with what
motivates you?
A. Very highly
B. Moderate
C. Low
D. Not at all
14. To what extent would you improve your work delivery if your employer
provides you with what motivates you?
A. Very high
B. High
C. Moderate
D. Low
E. Not at all
Section E: Appraisal and Productivity
15. How often do you get the results you expect after every performance
appraisal

E
A. Always
B. Rarely
C. Never
D. Never bother with the results
16. To what extent does performance appraisal impact on your morale?
A. Highly positive
B. Moderately positive
C. Positive
D. Highly Negatively
E. Moderately Negatively
F. Neutral
17. How does Performance Appraisal affect your performance?
A. Highly improves performance
B. Moderately improves performance
C. No effect on performance
D. Highly lowers performance
E. Moderately lowers performance
Thank you for your cooperation