Factors Affecting Customer Satisfaction on Brand X Green ...
12
Factors Affecting Customer Satisfaction on Brand X Green Tea: A Case Study of Bangkok Consumers Tipjaree Chanruechai Master of Business Administration, Graduate School of Business Assumption University, Thailand Maria Socorro Cristina L. Fernando, Ph.D. Lecturer and Associate Director , MMOD Graduate School of Business Assumption University, Thailand Abstract This research determines the factors affecting customer satisfaction on Brand X green tea as well as the relationship between independent variables (quality of tea, price, brand image, and health concern) and dependent variable (customer satisfaction). The quantitative method was used in this research. The sampling procedure is non-random snowball sampling. The survey questionnaire is an online questionnaire via social network including Facebook, Line application, and Twitter. The scope of this research includes 385 Bangkokians who have purchased Brand X green tea. The data analysis used a statistical analysis program to perform descriptive, correlation, and multiple linear regression. The research found that the quality of tea is the most significant factor in customer satisfaction. Price and brand image have significant relationships with customer satisfaction. In contrast, health concern has no significant relationship with customer satisfaction on Brand X green tea. Keywords: customer satisfaction, quality of tea, price, brand image, health concern Introduction Tea (Camellia sinensis) is the most consumed drink in the world. It was discovered around 2,700 BC and it is one of the oldest drinks in the world. World tea production (Black, Green, and Instant) in 2013 was 5,063,900 tons. China was the biggest tea producing nation with a yield of 1,924,500 tons, representing more than 38 percent of the world aggregate, while production in India, the second biggest manufacturer, yielded 1,200,400 tons (FAO IGG Secretariat, 2015). World tea export in 2013 was 1,768,500 tons. Kenya exported the most tea with 419,500 tons, while China ranked the second with 329,700 tons (FAO IGG Secretariat, 2015). World tea consumption in 2013 was 4,842,100 tons. China had the most tea consumption with 1,614,200 tons, while India’s was 1,001,400 tons, ranked the second (FAO IGG Secretariat, 2015).
Transcript of Factors Affecting Customer Satisfaction on Brand X Green ...
Factors Affecting Customer Satisfaction on Brand X Green Tea:
A Case Study of Bangkok Consumers
Tipjaree Chanruechai
Master of Business Administration,
Graduate School of Business
Assumption University, Thailand
Maria Socorro Cristina L. Fernando, Ph.D.
Lecturer and Associate Director , MMOD
Graduate School of Business
Assumption University, Thailand
Abstract
This research determines the factors affecting customer satisfaction on Brand X green tea
as well as the relationship between independent variables (quality of tea, price, brand
image, and health concern) and dependent variable (customer satisfaction). The
quantitative method was used in this research. The sampling procedure is non-random
snowball sampling. The survey questionnaire is an online questionnaire via social
network including Facebook, Line application, and Twitter. The scope of this research
includes 385 Bangkokians who have purchased Brand X green tea. The data analysis
used a statistical analysis program to perform descriptive, correlation, and multiple linear
regression. The research found that the quality of tea is the most significant factor in
customer satisfaction. Price and brand image have significant relationships with customer
satisfaction. In contrast, health concern has no significant relationship with customer
satisfaction on Brand X green tea.
Keywords: customer satisfaction, quality of tea, price, brand image, health concern
Introduction
Tea (Camellia sinensis) is the most consumed drink in the world. It was
discovered around 2,700 BC and it is one of the oldest drinks in the world. World tea
production (Black, Green, and Instant) in 2013 was 5,063,900 tons. China was the biggest
tea producing nation with a yield of 1,924,500 tons, representing more than 38 percent of
the world aggregate, while production in India, the second biggest manufacturer, yielded
1,200,400 tons (FAO IGG Secretariat, 2015).
World tea export in 2013 was 1,768,500 tons. Kenya exported the most tea with
419,500 tons, while China ranked the second with 329,700 tons (FAO IGG Secretariat,
2015). World tea consumption in 2013 was 4,842,100 tons. China had the most tea
consumption with 1,614,200 tons, while India’s was 1,001,400 tons, ranked the second
(FAO IGG Secretariat, 2015).
Worldwide volumes of both hot tea and packaged ready-to-drink (RTD) tea
increased by two percent in retail channels in 2015, with four percent rise evaluated in tea
sold into foodservice channels for out of home consumption. At the category level, it
continues to rise steadily. The Euromonitor International has determined a 2% yearly
volume rise in 2016, with value sales strengthening slightly (Tea & Coffee Trade Journal,
2016).
The scenario of green tea consumption has become popular in the recent years.
The elderly people drink green tea because of health concern but nowadays younger
people who live a modern lifestyle also drink green tea.
There are many green tea producers in Thailand. The popularity of green tea is
still steady thus each competitor has to promote its brand in different ways or find the
strong point to attract customers. In Thailand, the ready to drink green tea market value
decreased by 2.5 percent to 15,574 million Baht in 2015 (Ichitan group public company
limited, 2016). The consumed amount was 470.7 million liters with growth rate at 0.7
percent (Ichitan group public company limited, 2016).
Brand X green tea is a product of Brand X restaurant company under Brand X
group. It is a market follower in the ready to drink green tea business. The scope of this
research includes Bangkokians who have consumed Brand X green tea.
Literature Review
Customer satisfaction
Measuring customer satisfaction assesses the organization’s present point in a
rivalry. It can categorize potential market opportunities and comprehend client conduct to
predict the future sales. In addition, it communicates customer preferences to the
company. It is additionally feasible to analyze whether new activities, endeavors and
projects have any effect on the companies’ clients. The organization’s weaknesses and
strengths against competitors are resolved, in view of clients' observations and judgment.
The staff is persuaded to build its efficiency (Grigoroudis & Siskos, 2010).
Hansemark and Albinsson (2004) cited in Singh (2006:1) that satisfaction is a
general state of mind towards a product provider or a passionate response to the
distinction between what clients expect and what they really get with respect to the
satisfaction of a need. Kotler (2000) likewise defined fulfillment as a man’s sentiments of
joy, enthusiasm, happiness or dissatisfaction that comes about because of contrasting a
product’s perceived performance to his desires (Lu & Lukoma, 2011).
Product Quality
Clients’ perceived quality of food, for example, delicious, nutritious, and visually
attractive, is an important indicator of customer satisfaction, and perceived price directs
the relationship between quality of food and customer satisfaction. When clients perceive
that the price is reasonable, their fulfillment with food quality can be upgraded (Ryu &
Han, 2009).
Better product quality will keep up a high state of customer satisfaction which
urges clients to make their next buy. Furthermore, there are various studies which
demonstrated that enhanced product quality advantages organizations by building a long
term client base, and making a significant resource for company–customer loyalty (Yuen
& Chan, 2010).
Zamazalová (2008) mentioned the important components influencing customer
satisfaction and which can be utilized to quantify customer satisfaction. The components
are product (in terms of its quality, accessibility and so forth.); services; price (convenient
payment conditions and others); image of a product; and distribution (Suchánek, Richter
& Králová, 2014). Service quality and food quality impact customer satisfaction (Al-
Tit, 2015).
Price
Peng and Wang (2006) mentioned the significant reason of clients in switching is
the issue of price, such as the high, unreasonable and unreliable pricing strategies (Malik,
Ghafoor, & Iqbal, 2012).
A high price could trigger client switching, as a quick physiological reaction to
negatively valence data. The impression of price directly affects customer satisfaction, the
probability of shifting, and of expanding positive word-of-mouth (Lymperopoulos,
Chaniotakis, & Soureli, 2013).
Brand Image
Quality is an important factor of price premium, yet including other image
measurements doubles the consistency and comprehension about price premium. The
strongest factors of price premium are social image, uniqueness and home country origin
(Anselmsson, Bondesson, & Johansson, 2014). Other important factors are corporate
social responsibility (CSR) and attention (Anselmsson, Bondesson, & Johansson, 2014).
Lau and Phau (2007) mentioned that brand image is identified with the customers’
utilization of the brand to mirror their symbolic meaning of utilization and character in
self-expression (Sasmita & Suki, 2015).
Health Concern
Consumers purchase Ready-to-drink (RTD) tea refreshments since the taste,
flavor, packaging, and ingredients (attributes) fulfill their craving to drink RTD tea and
satisfy the advantages of being tasty to drink, having revitalizing properties, and having
health-promoting properties (perceived consequences), whereby satisfying their optimal
objective of encountering delight (perceived product value) (Wang & Yu, 2016).
Many participants of the study thought that adding any sweetener would reduce
tea’s health benefits, but that notion would require much further examination. A great
majority of the respondents would use natural flavoring with their tea, such as
peppermint, lemon, cinnamon and lavender. Improving tea’s taste was the most picked
option, while some participants thought that adding such natural flavoring might improve
tea’s health benefits, which also needs thorough investigation (AlHafez, Kheder &
AlJoubbeh, 2016).
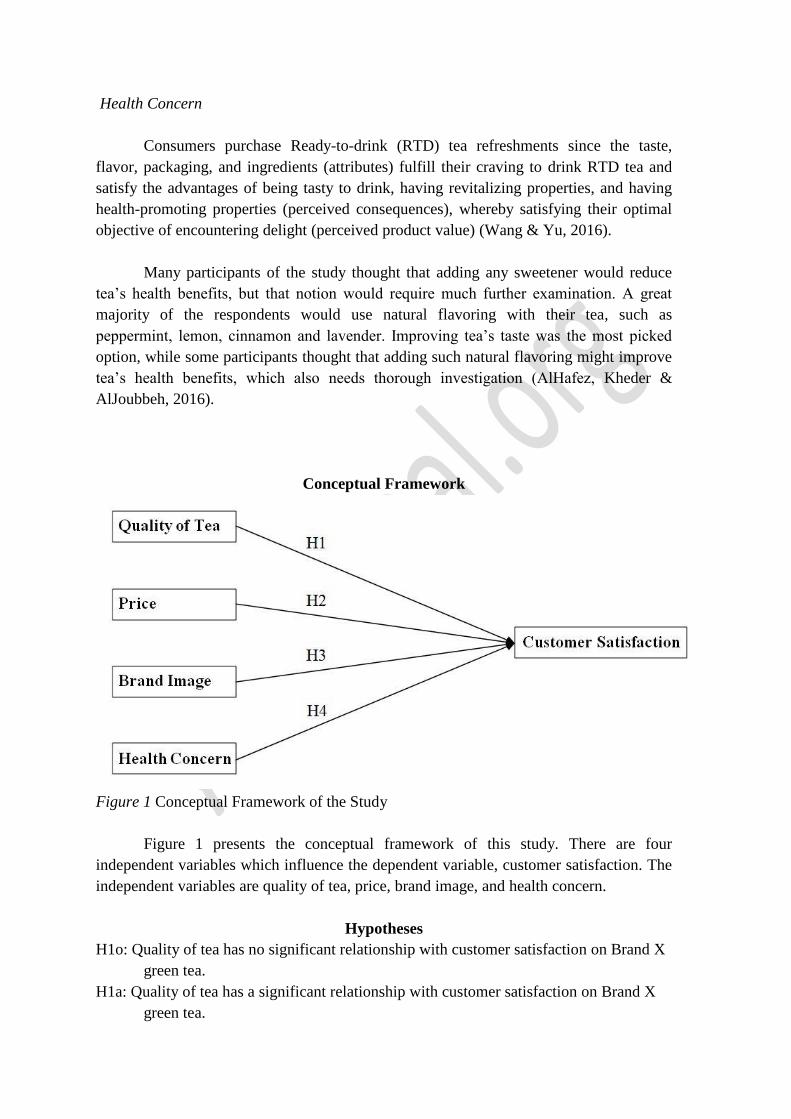
Conceptual Framework
Figure 1 Conceptual Framework of the Study
Figure 1 presents the conceptual framework of this study. There are four
independent variables which influence the dependent variable, customer satisfaction. The
independent variables are quality of tea, price, brand image, and health concern.
Hypotheses
H1o: Quality of tea has no significant relationship with customer satisfaction on Brand X
green tea.
H1a: Quality of tea has a significant relationship with customer satisfaction on Brand X
green tea.
H2o: Price has no significant relationship with customer satisfaction on Brand X green
tea.
H2a: Price has a significant relationship with customer satisfaction on Brand X green tea.
H3o: Brand image has no significant relationship with customer satisfaction on Brand X
green tea.
H3a: Brand image has a significant relationship with customer satisfaction on Brand X
green tea.
H4o: Health concern has no significant relationship with customer satisfaction on Brand
X green tea.
H4a: Health concern has a significant relationship with customer satisfaction on Brand X
green tea.
Research Methodology
The method used in this research was the quantitative method. The quantitative
method is easy to record the answer, and the respondents could reply without much time
consumption. The data analysis used a statistical analysis program to perform descriptive,
correlation, and multiple linear regression.
The respondents were from residents of Bangkok. As of December 2015, the
number of citizens in Bangkok was 5,696,409 where the male numbered 2,695,051 and
female were 3,001,358 (Bangkok Metropolitan Administration, 2016). Since there are
millions with population count, the scope of research included 385 Bangkokians who
have purchased Brand X green tea.
In this research, the sampling procedure was non-random snowball sampling. The
researcher distributed online questionnaires via social network including Facebook, Line
application, and Twitter. A survey questionnaire was used in this research. The
questionnaire contained two sections, which were personal information and measuring
variables.
Data Analysis
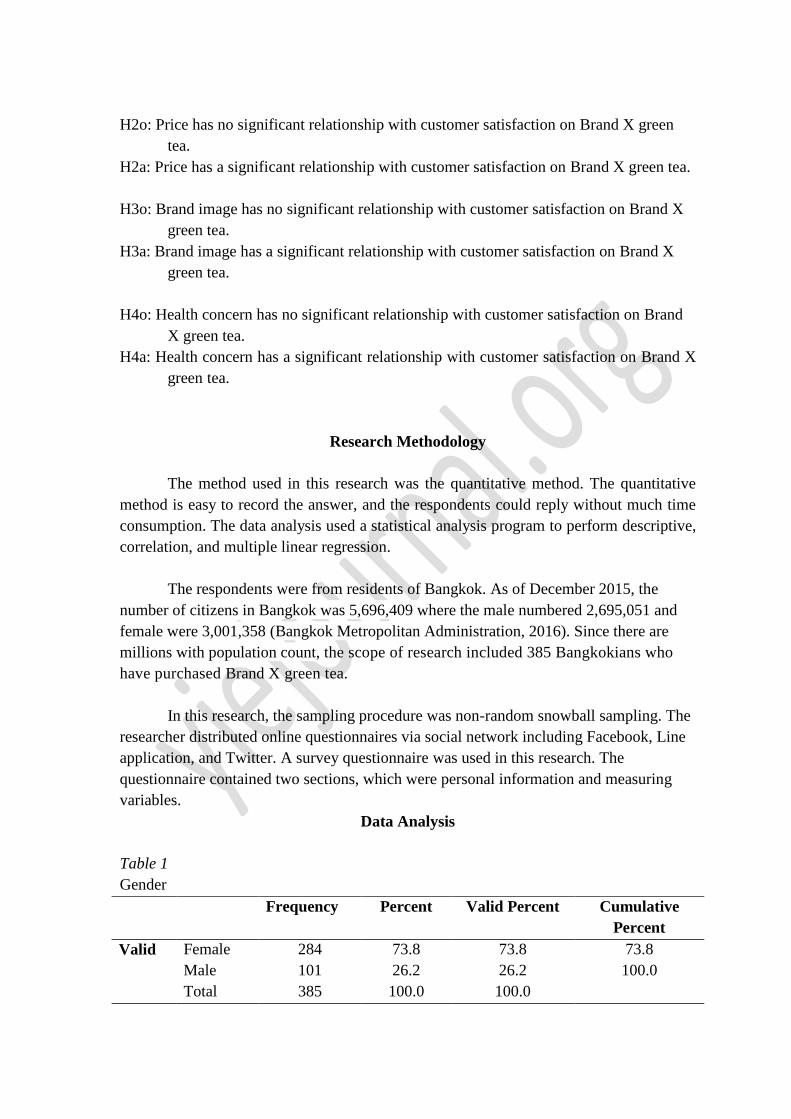
Table 1
Gender
Frequency Percent Valid Percent Cumulative
Percent
Valid Female 284 73.8 73.8 73.8
Male 101 26.2 26.2 100.0
Total 385 100.0 100.0
According to Table 1, the respondent consisted of 284 female (73.8%) and 101
male (26.2%).
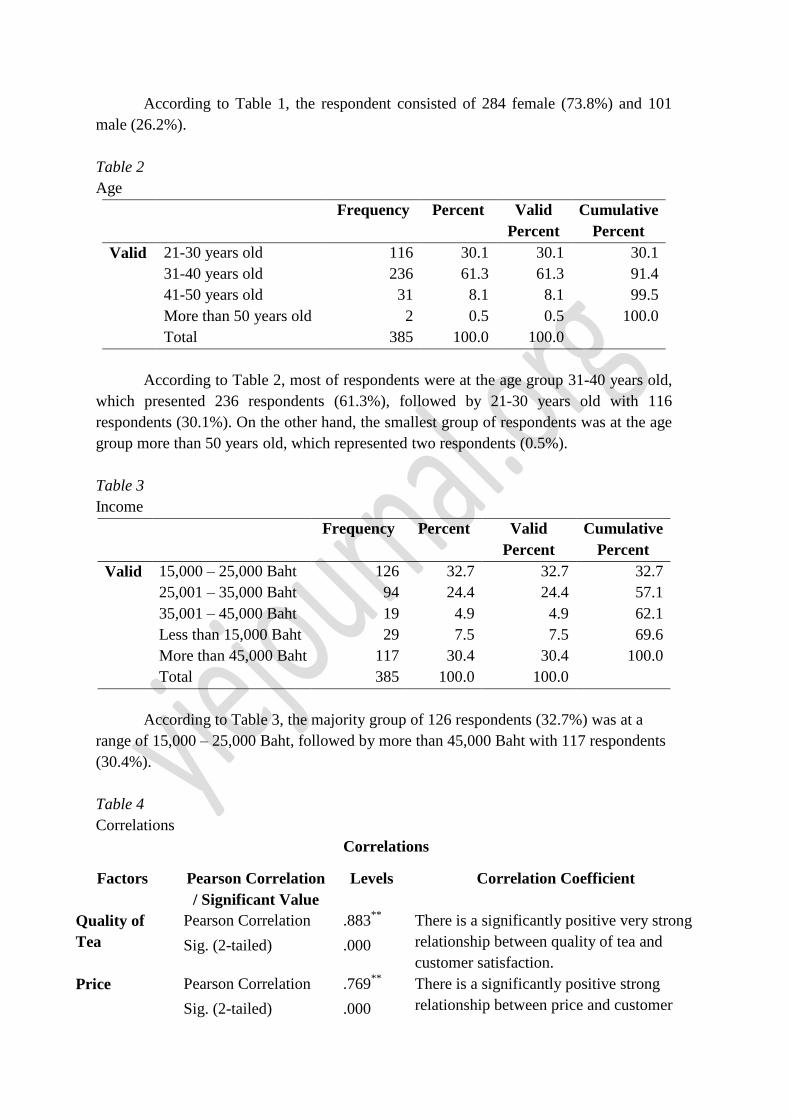
Table 2
Age
Frequency Percent Valid
Percent
Cumulative
Percent
Valid 21-30 years old 116 30.1 30.1 30.1
31-40 years old 236 61.3 61.3 91.4
41-50 years old
More than 50 years old
31
2
8.1
0.5
8.1
0.5
99.5
100.0
Total 385 100.0 100.0
According to Table 2, most of respondents were at the age group 31-40 years old,
which presented 236 respondents (61.3%), followed by 21-30 years old with 116
respondents (30.1%). On the other hand, the smallest group of respondents was at the age
group more than 50 years old, which represented two respondents (0.5%).
Table 3
Income
Frequency Percent Valid
Percent
Cumulative
Percent
Valid 15,000 – 25,000 Baht 126 32.7 32.7 32.7
25,001 – 35,000 Baht 94 24.4 24.4 57.1
35,001 – 45,000 Baht 19 4.9 4.9 62.1
Less than 15,000 Baht 29 7.5 7.5 69.6
More than 45,000 Baht 117 30.4 30.4 100.0
Total 385 100.0 100.0
According to Table 3, the majority group of 126 respondents (32.7%) was at a
range of 15,000 – 25,000 Baht, followed by more than 45,000 Baht with 117 respondents
(30.4%).
Table 4
Correlations
Correlations
Factors Pearson Correlation
/ Significant Value
Levels Correlation Coefficient
Quality of
Tea
Pearson Correlation .883**
There is a significantly positive very strong
relationship between quality of tea and
customer satisfaction. Sig. (2-tailed) .000
Price Pearson Correlation .769**
There is a significantly positive strong
relationship between price and customer Sig. (2-tailed) .000
satisfaction.
Brand
Image
Pearson Correlation .840**
There is a significantly positive very strong
relationship between brand image and
customer satisfaction. Sig. (2-tailed) .000
Health
Concern
Pearson Correlation .712**
There is a significantly positive strong
relationship between health concern and
customer satisfaction. Sig. (2-tailed) .000
**. Correlation is significant at the 0.01 level (2-tailed).
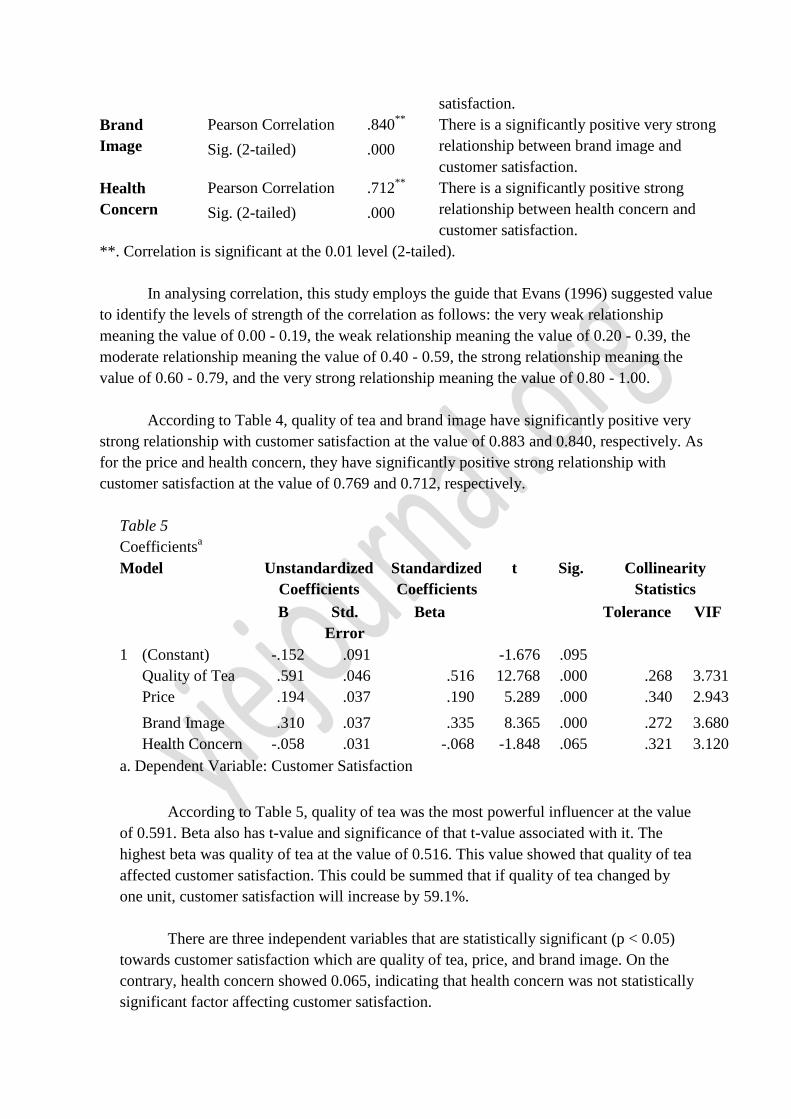
In analysing correlation, this study employs the guide that Evans (1996) suggested value
to identify the levels of strength of the correlation as follows: the very weak relationship
meaning the value of 0.00 - 0.19, the weak relationship meaning the value of 0.20 - 0.39, the
moderate relationship meaning the value of 0.40 - 0.59, the strong relationship meaning the
value of 0.60 - 0.79, and the very strong relationship meaning the value of 0.80 - 1.00.
According to Table 4, quality of tea and brand image have significantly positive very
strong relationship with customer satisfaction at the value of 0.883 and 0.840, respectively. As
for the price and health concern, they have significantly positive strong relationship with
customer satisfaction at the value of 0.769 and 0.712, respectively.
Table 5
Coefficientsa
Model Unstandardized
Coefficients
Standardized
Coefficients
t Sig. Collinearity
Statistics
B Std.
Error
Beta Tolerance VIF
1 (Constant) -.152 .091 -1.676 .095
Quality of Tea .591 .046 .516 12.768 .000 .268 3.731
Price .194 .037 .190 5.289 .000 .340 2.943
Brand Image .310 .037 .335 8.365 .000 .272 3.680
Health Concern -.058 .031 -.068 -1.848 .065 .321 3.120
a. Dependent Variable: Customer Satisfaction
According to Table 5, quality of tea was the most powerful influencer at the value
of 0.591. Beta also has t-value and significance of that t-value associated with it. The
highest beta was quality of tea at the value of 0.516. This value showed that quality of tea
affected customer satisfaction. This could be summed that if quality of tea changed by
one unit, customer satisfaction will increase by 59.1%.
There are three independent variables that are statistically significant (p < 0.05)
towards customer satisfaction which are quality of tea, price, and brand image. On the
contrary, health concern showed 0.065, indicating that health concern was not statistically
significant factor affecting customer satisfaction.
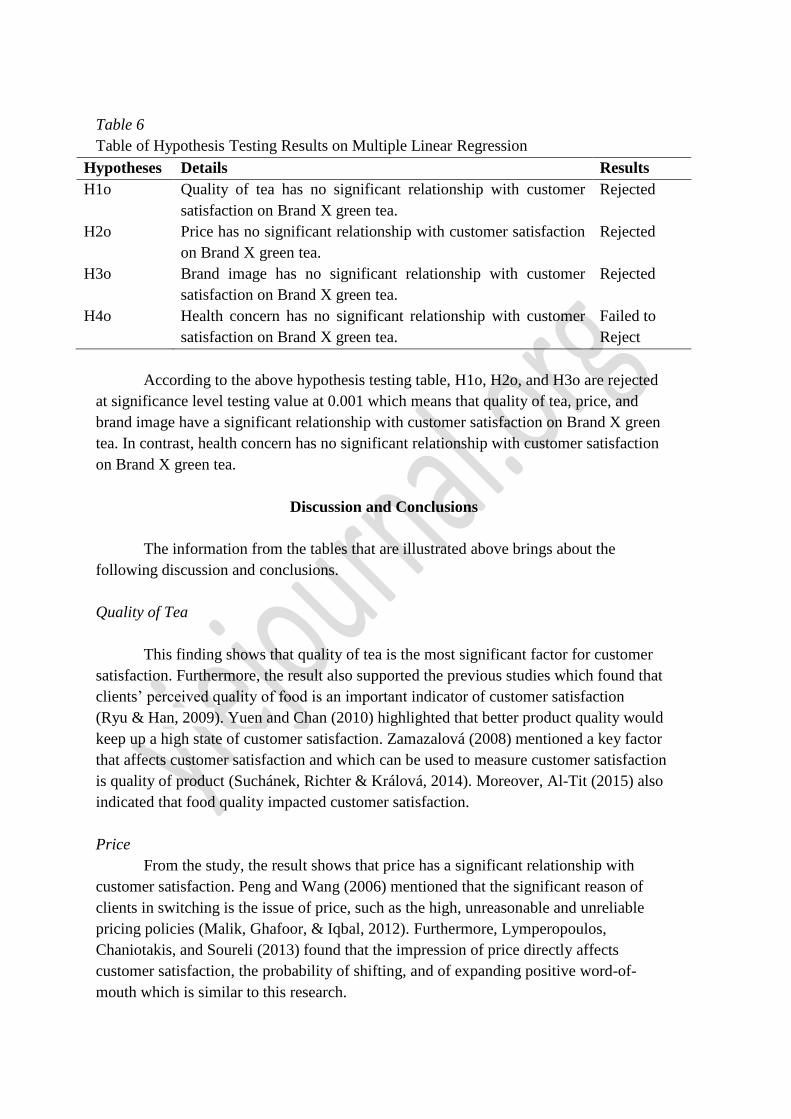
Table 6
Table of Hypothesis Testing Results on Multiple Linear Regression
Hypotheses Details Results
H1o Quality of tea has no significant relationship with customer
satisfaction on Brand X green tea.
Rejected
H2o Price has no significant relationship with customer satisfaction
on Brand X green tea.
Rejected
H3o Brand image has no significant relationship with customer
satisfaction on Brand X green tea.
Rejected
H4o Health concern has no significant relationship with customer
satisfaction on Brand X green tea.
Failed to
Reject
According to the above hypothesis testing table, H1o, H2o, and H3o are rejected
at significance level testing value at 0.001 which means that quality of tea, price, and
brand image have a significant relationship with customer satisfaction on Brand X green
tea. In contrast, health concern has no significant relationship with customer satisfaction
on Brand X green tea.
Discussion and Conclusions
The information from the tables that are illustrated above brings about the
following discussion and conclusions.
Quality of Tea
This finding shows that quality of tea is the most significant factor for customer
satisfaction. Furthermore, the result also supported the previous studies which found that
clients’ perceived quality of food is an important indicator of customer satisfaction
(Ryu & Han, 2009). Yuen and Chan (2010) highlighted that better product quality would
keep up a high state of customer satisfaction. Zamazalová (2008) mentioned a key factor
that affects customer satisfaction and which can be used to measure customer satisfaction
is quality of product (Suchánek, Richter & Králová, 2014). Moreover, Al-Tit (2015) also
indicated that food quality impacted customer satisfaction.
Price
From the study, the result shows that price has a significant relationship with
customer satisfaction. Peng and Wang (2006) mentioned that the significant reason of
clients in switching is the issue of price, such as the high, unreasonable and unreliable
pricing policies (Malik, Ghafoor, & Iqbal, 2012). Furthermore, Lymperopoulos,
Chaniotakis, and Soureli (2013) found that the impression of price directly affects
customer satisfaction, the probability of shifting, and of expanding positive word-of-
mouth which is similar to this research.
Brand Image
The result of the study shows that brand image has a significant relationship with
customer satisfaction. From the study of Anselmsson, Bondesson, and Johansson (2014),
the result showed that one of the critical factors of customer satisfaction was brand image.
Moreover, Lau and Phau (2007) mentioned that brand image is identified with the
customers’ utilization of the brand to mirror their symbolic meaning of utilization and
character in self-expression (Sasmita & Suki, 2015).
Health Concern
The previous study (Wang & Yu, 2016) found that health-promoting properties
fulfill customers’ ideal goal of experiencing enjoyment. Furthermore, some people
thought that adding natural flavoring with their tea might improve tea’s health benefits
(AlHafez, Kheder & AlJoubbeh, 2016) which surprisingly contrasted with the findings of
this current research. The health concern has no significant relationship with customer
satisfaction on Brand X green tea. This could be because consumers may purchase Brand
X green tea because of the delicious taste which fulfills the basic benefit of thirst-
quenching property. Thus, the health concern has a minor impact toward customer
satisfaction.
Recommendations
These findings of the current study may be useful for the manager team, especially
for marketing team of Brand X green tea. These results could change status of Brand X
green tea to be a market challenger and gain more market share. From the results of this
research, the manager should focus on quality of tea, price, and brand image which have a
significantly positive relationship with customer satisfaction.
Firstly, the quality of tea is the major factor that managers should concern.
According to the various choices of beverage nowadays, the customer tends to select the
high quality of beverage. Thus, the managerial team should search for the best quality of
tea as they can for customer satisfaction.
Secondly, price is a significant factor. Thus, the manager team should keep the
price competitive for the target market. Furthermore, the perception of direct opponents
would likewise help in setting the price to be similar in order to be able to compete and at
the same time make the most benefit (Parpal, n.d.).
Thirdly, brand image is an important factor to make customer satisfied. The good
image of Brand X green tea makes customer desire to purchase it. The better
distinguished characteristics of Brand X green tea than other brands could attract
customers.
References
AlHafez, M., Kheder, F., & AlJoubbeh, M. (2016). Various preparation conditions of tea
infusion: a worldwide questionnaire. Nutrition & Food Science, 46(4), 583-594.
doi:10.1108/nfs-09-2015-0106
Al-Tit, A. (2015). The effect of service and food quality on customer satisfaction and
hence customer retention. Asian Social Science, 11(23).
doi:10.5539/ass.v11n23p129
Anselmsson, J., Bondesson, N. V., & Johansson, U. (2014). Brand image and customers'
willingness to pay a price premium for food brands. Journal of Product & Brand
Management, 23(2), 90-102. doi:10.1108/jpbm-10-2013-0414
Bangkok Metropolitan Administration. (2016). BMA Data Center. Retrieved from
http://www.bangkok.go.th/info/
Boston University School of Public Health. (2013). Multiple Linear Regression Analysis.
Retrieved from http://sphweb.bumc.bu.edu/otlt/MPH-
Modules/BS/BS704_Multivariable/BS704_Multivariable7.html
Brown, S., Lo, K., & Lys, T. (1999). Use of R2 in accounting research: Measuring
changes in value relevance over the last four decades. Journal of Accounting and
Economics, 28(2), 83-115. doi:10.1016/s0165-4101(99)00023-3
Evans, J. D. (1996). Straightforward statistics for the behavioral sciences. Pacific Grove,
CA: Brooks/Cole Publishing.
FAO IGG Secretariat. (2015). World tea production and trade: Current and future
development. Retrieved from http://www.fao.org/3/a-i4480e.pdf
Food Quality—Definition and a Holistic View - Springer. (n.d.). Springer. Retrieved
from http://link.springer.com/chapter/10.1007/978-3-642-78025-7_2
Fuji group. (2016). Retrieved from http://www.fuji.co.th/2009/TH/home/index.php
Grigoroudis, E., & Siskos, Y. (2010). Customer satisfaction evaluation: Methods for
measuring and implementing service quality. International Series in Operations
Research & Management Science. doi:10.1007/978-1-4419-1640-2
Ichitan group public company limited. (2016). Retrieved from
http://www.ichitangroup.com/index.php
Keane, R. D., & Adrian, R. J. (1992). Theory of cross-correlation analysis of PIV
images. Applied Scientific Research, 49(3), 191-215. doi:10.1007/bf00384623
Keller, K. L. (1993). Conceptualizing, measuring, and managing customer-based brand
equity. Journal of Marketing, 57(1), 1-22. doi:10.2307/1252054
Kolassa, S. (2013). Where do the descriptors for Cronbach's alpha values come from
(e.g., poor, excellent)? Retrieved from
http://stats.stackexchange.com/questions/70274/where-do-the-descriptors-for-
cronbachs-alpha-values-come-from-e-g-poor-exce
Kraft, F. B., & Goodell, P. W. (1993). Identifying the health conscious consumer. Journal
of Health Care Marketing, 13(3), 18. Retrieved from
http://search.proquest.com/docview/232338425?accountid=8401
Lu, P. H., & Lukoma, I.G.B. (2011). Customer satisfaction towards retailers ICA, ICA
NÄRA and COOP FORUM. Diva-portal. Gotland University. Retrieved from
http://www.diva-portal.org/smash/get/diva2:428996/fulltext02
Lymperopoulos, C., Chaniotakis, I., & Soureli, M. (2013). The role of price satisfaction in
managing customer relationships: the case of financial services. Marketing
Intelligence & Planning, 31(3), 216 – 228. doi:10.1108/02634501311324582
Malik, M. E., Ghafoor, M. M., & Iqbal, H. K. (2012). Impact of brand image, service
quality and price on customer satisfaction in Pakistan telecommunication
sector. International Journal of Business and Social Science, 3(23). Retrieved
from http://www.ijbssnet.com/journals/Vol_3_No_23_December_2012/13.pdf
Parpal, M. (n.d.). A quick guide on pricing restaurant menu items.
Foodservicewarehouse. Retrieved from
http://www.foodservicewarehouse.com/restaurant-equipment-supply-marketing-
articles/restaurant-management-and-operations/a-quick-guide-on-pricing
restaurant- menu-items/c28020.aspx
Pattarakitham, A. (2015). The factors influence customer satisfaction and loyalty: A study
of tea beverage in Bangkok. SSRN Electronic Journal. doi:10.2139/ssrn.2593883
Positioning. (2016). Retrieved from http://positioningmag.com/62260
Pricing research and pricing optimisation. (n.d.). Dobney.
Retrieved from http://www.dobney.com/Research/pricing_research.htm
Raza, S. A., Jawaid, S. T., & Hassan, A. (2015). Internet banking and customer
satisfaction in Pakistan. Qualitative Research in Financial Markets, 7(1), 24-36.
doi:10.1108/qrfm-09-2013-0027
Rodgers, J. L., & Nicewander, W. A. (1988). Thirteen ways to look at the correlation
coefficient. The American Statistician, 42(1), 59-66. doi:10.2307/2685263
Ryu, K., & Han, H. (2009). Influence of the quality of food, service, and physical
environment on customer satisfaction and behavioral intention in quick-casual
restaurants: Moderating role of perceived price. Journal of Hospitality & Tourism
Research, 34(3), 310-329. doi:10.1177/1096348009350624
Sasmita, J., & Suki, N. M. (2015). Young consumers’ insights on brand
equity. International Journal of Retail & Distribution Management, 43(3), 276-
292. doi:10.1108/ijrdm-02-2014-0024
Suchánek, P., Richter, J., & Králová, M. (2014). Customer satisfaction, product quality
and performance of companies. Review of Economic Perspectives, 14(4), 329-344.
doi:10.1515/revecp-2015-0003
Tea & Coffee Trade Journal. (2016). Advancing the business of tea. Retrieved from
http://www.teaandcoffee.net/535/white-papers/advancing-business-tes/
The Editors of Encyclopædia Britannica. (n.d.). Price. Britannic. Retrieved from
http://global.britannica.com/topic/price-economics
Wang, E. S., & Yu, J. (2016). Means-end chain approach for exploring the motivation of
ready-to-drink tea consumers. Asia Pacific Journal of Marketing and
Logistics, 28(3), 384-395. doi:10.1108/apjml-08-2015-0121
Yuen, E., & Chan, S. (2010). The effect of retail service quality and product quality on
customer loyalty. Journal of Database Marketing & Customer Strategy
Management, 17(3-4), 222-240. doi:10.1057/dbm.2010.13