Factors affecting cost of power - Geothermal Energy ...geo-energy.org/reports/Factors Affecting Cost...
64
GEOTHERMAL ENERGY ASSOCIATION 209 Pennsylvania Avenue SE, Washington, D.C. 20003 Phone: (202) 454-5261 Fax: (202) 454-5265 Web Site: www.geo-energy.org Factors Affecting Costs of Geothermal Power Development Document prepared by Cédric Nathanaël Hance A Publication by the Geothermal Energy Association for the U.S. Department of Energy August 2005
Transcript of Factors affecting cost of power - Geothermal Energy ...geo-energy.org/reports/Factors Affecting Cost...

GEOTHERMAL ENERGY ASSOCIATION
209 Pennsylvania Avenue SE, Washington, D.C. 20003
Phone: (202) 454-5261 Fax: (202) 454-5265 Web Site: www.geo-energy.org
Factors Affecting Costs of Geothermal Power Development
Document prepared by Cédric Nathanaël Hance
A Publication by the Geothermal Energy Association for the U.S. Department of Energy
August 2005
Acknowledgements: This report is the result of a long research project that involved many geothermal stakeholders and industry experts. These persons helped explain how various and complex parameters affecting the cost of geothermal power development and production may be. I specially want to thank: Gordon Bloomquist for the collaboration, data sharing, advice and comments he provided throughout several research phases. Stuart Johnson for the answers he brought to my numerous questions and for the visit he offered me of ORMAT's Steamboat geothermal power plants. Dan Schochet for the questions to which he took the time to respond, as well as for the crucial information he provided on specific issues. Bernard Raemy for the answers and information he gave me about the Salton Sea Unit #6 project and the very specific challenges related to that geothermal resource. Allan Jelacic and Douglas Jung for the reviews, comments and background information they offered me. John Pritchett and Kenneth Phair for the quality of their review and their help to clarify specific sections. Domenic Falcone and Brandon Owens for the information, data, model explanations, and other details they provided about project financing and tax issues. Dan Entingh, Jeff Hulen, Joel Renner, Greg. Mines, Roger Hill, Arthur Mansure, Joe Greco, and Susan Petty for their numerous responses, comments and explanations. Charlene Wardlow for her interest and precious help in gathering the information about The Geysers geothermal resource and power plants. Keshav Goyal, Dean Cooley, and Dennis Gilles for the information they provided about the particulars of their company. Laurie McClenahan for describing and explaining the factors affecting the cost of the permitting phase of geothermal power exploration and site development. Tom Ettinger & J Bruggman for their input on technology choices and options, and the effect of such options on the power plant cost. Thomas Petersik for the relevancy of his comments. Karl Gawell for his perceptive supervision, support, and ideas brought throughout this research. Alyssa Kagel for her help in editing this document.
II
Table of Contents:
Context and Background..............................................................................................................1 Introduction ...................................................................................................................................3 Executive Summary ......................................................................................................................4
A. Levelized Cost of Capital Investment: Up-Front Capital Investment and Cost of money5
1. Exploration................................................................................................................. 6
2. Confirmation............................................................................................................ 11
3. Site Development...................................................................................................... 13 3.1. Drilling............................................................................................................... 13
A. Resource and Brine Characteristics: ................................................................ 13 Factors influencing the cost of drilling and completing one well: ................... 13 Factors influencing the number of wells to drill:.............................................. 16
B. Learning Effects: .............................................................................................. 17 C. Market Parameters: .......................................................................................... 18 D. Conclusions:..................................................................................................... 18
3.2. Other On-Site Development Costs..................................................................... 19 A. Project Permitting: .......................................................................................... 19 B. Steam Gathering System: ................................................................................. 22 C. Power Plant Design and Construction:............................................................. 24
1. Impact of resource characteristics on technology choices and power system cost: ................................................................................................................... 24 2. Impact of site characteristics on technology choices and power system cost:.......................................................................................................................... 27 3. Other Technologies....................................................................................... 29 4. Transmission................................................................................................. 29 5. Economies of Scale....................................................................................... 30 6. Other costs associated with geothermal power development. ...................... 30
3.3. Conclusions........................................................................................................ 32
4. Financing mechanisms and Macro-economic environment .................................... 34 A. Interest Rate. .................................................................................................... 34 B. Debt Length...................................................................................................... 36
B. Operation and Maintenance Costs ................................................................................ 39
1. Operation costs .............................................................................................................. 39
2. Maintenance costs.......................................................................................................... 40
3. Royalties and Taxes....................................................................................................... 43
4. Conclusions.................................................................................................................... 43
C. Conclusions ................................................................................................................... 45
III

Context and Background The Geothermal Energy Association, in support of the US DOE Geothermal Technologies Program, surveyed the existing literature dealing with the socio-economic aspects of geothermal energy in the U.S. This survey was part of an effort to verify the information used by DOE with current data from industry experience. The compiled literature review was submitted to DOE, but a series of immediate problems were evident with the information. A great deal of the information was old, incomplete or presented serious inconsistencies. Meetings with senior DOE geothermal program staff helped identify priorities for GEA's efforts to improve the available information. It was decided that publishing the literature review would have little value, but instead GEA would examine in more detail the literature related to the cost/price of geothermal energy and develop better and more consistent information about the current status of the fundamental economics of the technology being used today. Secondly, GEA would examine industry employment and conduct the first employment survey of the industry in some thirty years. The issue of conflicts in the available cost/price data had been raised on several prior occasions. One of the most recent was the March 2004 Geothermal Program Review held at the Lawrence Berkeley Laboratory. GEA widely circulated a draft geothermal program research plan for review, and selected individuals to present a synthesis of feedback at the review session. GEA's Executive Director was tasked with presenting the input received on the issue of price/cost data and goals. His presentation at that meeting stated: “There is considerable confusion and contradiction in how individuals within the geothermal community talk about cost. Also, there are many pieces to the total cost of a geothermal project. We may wish to have a government-industry discussion session about “costs,” how to discuss and measure them, what the known facts are about the cost of geothermal energy, and similar related issues”. This document addresses the first of the priorities identified for GEA's work -- an examination of price/cost data and issues. A separate report discusses the results of GEA's employment survey and research1. This report examines the literature about the costs of geothermal power development and production, and presents an analysis of new information obtained from a wide range of individuals and companies. The first step of the cost analysis consisted of further literature review and data gathering. Several authors and industry experts were interviewed in order to discuss apparent discrepancies and understand underpinning assumptions. The second phase consisted of meeting power plant operators and project developers in order to confront cost data available in the literature with actual, current cost figures. Executives and project managers of all major geothermal companies were interviewed and provided information about their power plants and prospective projects.
1 Hance C. N. “Assessing total employment involved in the Geothermal Industry: Employment Survey Results & Analysis”, Geothermal Energy Association, 2005.
1

It is however important to understand that this analysis focuses on verifying existing data, presenting it in a consistent way and updating prior cost information. This analysis does not investigate the impact of future technology improvements, policy changes or market variation on future project costs. It identifies important parameters affecting cost of projects in the US today, and provides ranges of cost values for the major cost components but should not be interpreted to substitute further in-depth analysis of technology, policy or cost issues beyond this limited scope. The objective of this report is to give Department of Energy decision makers an accurate view of, and context for, geothermal power's economics in the US marketplace today. It is the author's understanding that this will provide a basis for an informed discussion about how federal programs and policies can best contribute to expanding the use of both the identified and presently hidden geothermal resources known to exist in the U.S.2 We hope this report helps DOE identify priorities for new research and other programs that will achieve this goal.
2 As part of the Western Governors CDEAC initiative, in July and August of 2005 GEA and NREL examined the available information on the status of the US geothermal resource base. This information was used to provide a supply-curve to the WGA Geothermal Subcommittee. The available information published on the US resource base identifies over 100 specific sites having an estimated 25,000MW of power potential. The last estimate for hidden sites made by the USGS in 1978 indicates another 100,000MW of geothermal potential from the hydrothermal resources remain to be discovered. Resources beyond the hydrothermal resource base would be substantially greater. The public data about geothermal resource potential is presented in an Excel spreadsheet available from the GEA web site: www.geo-energy.org.
2

Introduction Factors affecting the cost of geothermal power development and production are often poorly understood by persons not directly involved in geothermal project development and power production. Many articles dealing with geothermal costs incorporate restrictive assumptions and thus lead to oversimplified conclusions that do not correctly reflect site-specific particularities. In order to help the reader better understand the structure and parameters affecting the cost of geothermal power development, this study breaks down the cost of power into its major components and analyzes the various factors influencing each cost component. Levelized cost of geothermal power corresponds to the sum of two major components: the levelized cost of capital investment and operation and maintenance costs. The levelized cost of capital investment (LCCI) corresponds to the cost associated with the reimbursement of the initial capital investment (i.e. site exploration and development & power plant construction) and its related financial returns, divided by the total output of the facility throughout the entire payback period. Operating and maintenance (O&M) costs consist of fixed and variable costs directly related to the electricity production phase. In most cases, the LCCI represents a major part of the levelized cost of energy (LCOE) of geothermal projects. Both these components are affected by a series of parameters. Accordingly, the levelized cost of geothermal power has a large range of variability. This document details the major cost components and identifies key parameters influencing cost. When possible, cost variability ranges are provided to help understand why the price of geothermal power varies from site to site and from project to project. Except when otherwise stated, any dollar value is expressed in 2004$. Cost figures from existing literature have been inflated with the "inflation calculator" provided by the US Bureau of Labor Statistics (http://data.bls.gov/cgi-bin/cpicalc.pl).
3

Executive Summary
Geothermal power production costs are composed of two major cost components: amortization of the initial capital investment and power production operation and maintenance costs. Both these components are affected by a series of parameters detailed in the following analysis. Initial capital costs correspond to all expenses related to the project development. These include lease acquisition, permitting, exploration, confirmation and site development costs as well as a series of associated costs lumped together as soft costs. Capital costs of geothermal projects are very site and resource specific. The resource temperature, depth, chemistry and permeability are major factors affecting the cost of the power project. The resource temperature will determine the power conversion technology (steam vs. binary) as well as the overall efficiency of the power system. The site accessibility and topography, local weather conditions, land type and ownership are additional parameters affecting the cost and time required to bring the power plant online. Capital structure and financial conditions (debt length and interest rate) accessible to the developer also have a major impact on the resulting power production costs. These financial parameters also impact the cost of the interests paid during construction or the cost related to any time delays. Market parameters also impact the price of goods and services needed during construction. Raw material and service costs may become volatile and rise significantly due to market imbalance. The project size determines the extent of economies of scale, and its type (greenfield vs. expansion) provides information about the extent of new exploration, confirmation and infrastructure construction work needed to build the project. Power plant and steam field operation and maintenance (O&M) costs correspond to all expenses needed to keep the power system in good working status. O&M costs are also strongly affected by site and resource characteristics, notably through the resource depth and chemistry. Important economies of scale apply to labor costs of large power plants. Important trade-offs between initial capital costs and later O&M costs were noted in the early years of the industry. These may be explained by the lack of experience of the industry and the high interest rates of the late seventies. Geothermal production costs are thus extremely related to the site and resource characteristics. Market parameters however seriously impact capital costs and, to a lesser extend, O&M costs. Future projects may concern sites and resources with less favorable characteristics. Regular industry grow is therefore the best way to learn how to deal with more difficult conditions at reasonable cost. Market parameters also play an important role on the resulting cost of power but are behind the control of developers. A more favorable legislative framework could reduce permitting procedures and delays and provide guarantees helping developers leverage less expensive capital.
4
A. Levelized Cost of Capital Investment: Up-Front Capital Investment and Cost of money
Developing a new geothermal resource is a long and expensive process. Initial development steps are risky and upfront capital costs are important. Consequently, a major part of the cost of power is related to the reimbursement of capital invested and associated returns. In 2001, EPRI3 estimated that capital reimbursement and associated interest account for 65% of total cost of geothermal power. This cost share compares to typical fuel charges of fossil fuel fired power facilities4. Geothermal power development consists of successive development phases that aim to locate the resources (exploration), confirm the power generating capacity of the reservoir (confirmation) and build the power plant and associated structures (site development). Various kinds of parameters will influence the length, difficulty and materials required for these phases thereby affecting their cost. This chapter successively addresses each development phase, identifying major cost components and analyzing factors affecting them. The first section of this chapter deals with the exploration phase, the second with confirmation and the third with site development. Finally, the fourth section investigates the impacts of project finance and other financial parameters on the resulting capital costs.
3 G. Simons, "California Renewable Technology Market and Benefits Assessment", EPRI, 2001. 4 Capital cost of a combined cycle natural gas power plant only represents about 22% of the levelized cost of electricity produced from the plant whereas the fossil fuel cost accounts for 67%. (Source: "An assessment of the economics of future electric power generation options and the implication for fusion", Oak Ridge National Laboratory, 1999).
5
1. EXPLORATION Exploration is the initial development phase and seeks to locate a geothermal resource that can provide sufficient energy to run a power plant and produce electricity. This phase begins with various kinds of prospecting and field analysis and ends with the drilling of the first successful full-size commercial production well. Different technologies that aim to locate a productive geothermal reservoir are used at each exploration phase. The breakdown of exploration steps presented below, inspired by Nielson (1989), provides an order of magnitude for exploration costs based on a 100 MW development scenario. The original cost estimates for the three exploration phases detailed below (i.e. regional reconnaissance, district exploration, and prospect evaluation) have been inflated to represent current US Dollar values. Prior to investing any money on exploration activities, geothermal developers will make sure they control, or will be able to control, the land and mineral rights associated with the site. Costs related with these activities are typically lumped together as “lease acquisition costs”. A. Regional reconnaissance.
Regional reconnaissance screens a region (1000's km2) in order to narrow the focus and identify areas of potential interest. It involves geologic studies, analysis of available geophysical data, and geochemical surveys to identify more limited areas for detailed exploration. Assuming the development of a 100 MW power project, the cost of these activities was estimated to average $770,000 (Nielson 1989). This corresponds to $7.7 per kW5 installed. Regional reconnaissance costs are however heavily influenced by both the amount of resource information already available and by the accessibility of prospective areas. National government, international development institution or multilateral aid programs typically finance these activities. In the U.S., the USGS completed such surveys in the 1970's. Today, most developers tend to rely on the USGS data rather than funding this kind of activities of their own. The age and quality of the information currently available is becoming an issue. B. District Exploration.
District exploration applies within more concise areas (100's km2) and aims to site an initial narrow diameter hole or production well. Geophysical surveys and temperature gradient holes are the major components of this phase. According to the site characteristics and other exploration requirements, geophysical technologies may include gravity surveys, ground magnetic surveys, magnetotelluric surveys, electrical resistivity surveys and seismic surveys. These provide information about the subsurface rock formations and the probability of discovering a new geothermal reservoir6. Encouraging results from prior exploration steps may lead to the drilling of the first deep exploration well. Drilling is the most expensive component of the district exploration 5 Nielson (1989) estimated this exploration phase to cost $500,000 for a 100 MW geothermal power project. The $500,000 value has been inflated according to the US BLS inflation calculator in order to represent 2004 dollar values. The inflation index for the 1989-2004 period corresponds to 1.54. 6 See appendix A for further information about estimated individual costs of each technology.
6

phase but is the only means currently available to confirm the temperature and productive capacities of the subsurface resource. Either a production-sized well or a slim-hole is drilled. Slim-holes, especially cored holes, provide a great deal of information related to fractures, minerals, etc. Since slim holes are relatively shallow and do not always reach the resource, they do not allow detailed flow tests and are rarely useful as production or injection wells. Some developers therefore prefer not to use them and directly drill a full size production well. While the cost of drilling one full diameter production well may correspond to the cost of two slim holes, the well will be usable for precise flow rate tests and will be available for future energy production. If the developer chooses to drill a slim hole, the average cost of the "district exploration" phase ranges from 1.5 to 3 million US$. (i.e. $22.5 per kW). This cost depends heavily on the geology of the resource area and the resource depth. Although it might be difficult and painful to abandon a million-dollar investment, exploration activities would only be continued at a particular site if information shows that there is a high probability of finding a productive geothermal reservoir. C. Prospect Evaluation.
Prospect evaluation seeks to locate the best sites to drill production wells with high fluid temperatures and flow rates. Wells drilled during this phase are called "wildcats" and have an average success rate of 20-25%7. Geophysical surveys help locate subsurface fractures that will be targeted by the drilling. Once a resource is discovered, almost all activities consist of drilling production and injection wells, testing well flow rate, and reservoir engineering. This provides crucial information about the resource depth, temperature, and potential capacity. According to Nielson (1989), the "prospect" phase usually costs about $7.7 million (i.e. 77$/kW). The exploration phase typically ends with the drilling of the first successful production well8. The cost value provided here is indicative and may vary greatly according to the number of unsuccessful wells and the size of the project. Factors affecting the cost of exploration are closely related to site characteristics and location. Exploration for a "greenfield" geothermal project usually includes the district exploration phase, while expansion of existing plants may skip this phase and even present significant cost reduction in the prospect evaluation phase. Since the type of activities required to locate a new resource is independent of the project size, important economies of scale apply when exploration costs are spread out over a larger project. Current exploration activities in the U.S. typically concern 10 to 50 MW projects. Recent interviews with geothermal developers provided exploration cost estimates averaging $150/kW9. Total exploration cost figures may thus range from the low $100/kW to
7 NB: Historically, the first well drilled in many geothermal fields currently under production has been dry. 8 Any additional drilling costs would be included in the confirmation phase. 9 From the developer's point of view, the distinction between the exploration and confirmation phase is somewhat artificial since all exploration and confirmation activities are sequential, use the same kind of capital (i.e. equity investment) and aim to determine the feasibility of the project. Cost values provided by developers therefore range around $250 - $350 per KW and were shared out between both phases.
7
$200+/kW according to the nature of the project (greenfield vs. expansion), the amount of information initially available, the suite of technologies involved in each exploration phase, and the size of the project and resulting economies of scale. Since exploratory drilling is the most important cost component of the exploration phase, factors affecting drilling costs will strongly influence the resulting cost of the exploration phase. Specific attention is paid to those parameters in the "site development" section. (See below). Other parameters affecting exploration costs are lease costs and timing, site remoteness, accessibility, topography as well as geologic engineering related to slope stability issues. If the cost of building new roads and other connection infrastructure are added to the exploration expenses, exploration costs may rise rapidly10. Exploration cost estimates found in the literature may be somewhat lower but are considered consistent with those provided above. The difference is justified by the current nature and size of exploration activities: current projects tend to be smaller, focus on more difficult areas than past projects and may use more advanced and thus more expensive exploration technologies. Some particularly low exploration cost figures (not included in the following table) may also be found but are thought to correspond to projects that do not require a full exploration program or contain unrealistic assumptions.
Table 1: Exploration cost values in the literature: Authors: Exploration cost values: Nielson (1989) 107.2 $/kW EPRI (1996) 125.9 $/kW EPRI (1997) 101.1-130.8$/kW GeothermEx (2004) 88.5-142$/kW11
In the latest publication, GeothermEx (2004) provides exploration cost figures as low as 14$/kW and as high as 263$/kW12. These figures should, however, be considered with caution since these estimates come from a model which may not reflect all site particulars and characteristics. ORMAT recently reported exploration cost of $250 per MW for a 20 MW greenfield binary projects (PowerGen Conference, 2005). This figure however includes the cost of at least two full size production wells (and thus some costs considered in the confirmation phase partially overlap) and corresponds to a relatively small power project.
10 These costs are part of the exploration phase even if they may be capitalized if exploration is successful. 11 Average specific exploration costs for minimum and most-likely resource capacity of projects areas where little information is currently available (D-projects: downhole temperature > 212°F is not proven). 12 Minimum and maximum exploration cost estimates for D-projects in "New Geothermal Site Identification and Qualification", GeothermEx, 2004. The high end of these values is more realistic than the low end.
8

Considering that investment is expected to pay-back...
An important factor that increases the actual cost of exploration is the tremendous associated risk and possible time delay that may take place before the project begins to pay-back. Private companies active in exploration do not have access to commercial bank loans to finance these activities and are thus required to use their own capital or look for investors willing to share risks and ownership (equity). In finance, high risk means high rates of return. Equity invested in geothermal projects is expected to yield an annual rate of return of about 17% (Owens, 2002). Investments related to particularly risky activities (i.e. initial exploration phases) should thus expect even higher rates of return. Since it takes a minimum of 3 to 5 years to put a geothermal power plant on line13, the initial exploration cost might in fact represent a much higher cost for the project. (e.g. $150 borrowed during 4 years at 17% corresponds to an actual cost of 150*(1.17)4 = $281/kW when the power plant is finally on-line and begins to pay-back). It sometimes takes much more time to bring a power plant on-line. Permitting delays and community reluctance to accept a project may last a very long time. For example, exploration at the Glass Mountain KGRA in Northern California began over 20 years ago. Figure 1: Financial impact of delay on exploration costs.
The following table and chart shows the evolution of the expected value of a $100 and $150 capital investment when a 17% rate of return is considered. This illustrates the financial impact delays may have on the project viability.
Delay (years) 0 1 2 3 4 5 6 7 8 9 10 100 117 137 160 187 219 257 300 351 411 481Exploration Costs 150 176 205 240 281 329 385 450 527 616 721
0
500
1000
1500
2000
2500
3000
3500
0 2 4 6 8 10 12 14 16 18 20
Years of delay
Delay (years) 11 12 13 14 15 16 17 18 19 20 562 658 770 901 1054 1233 1443 1688 1975 2311Exploration Costs 844 987 1155 1351 1581 1850 2164 2532 2962 3466
13 This assumes that all permits are obtained easily and without law suits.
9

If a rate of return of 17% is applied to a specific exploration cost of 150$/kW during 20 years, the resulting cost of exploration would be 3466 $/kW14. This cost corresponds to the total capital costs for the most expensive projects currently under development. Figure 1 shows the evolution of exploration cost when long delays take place. After to the oil crisis in the mid 1970s, oil companies invested larger amounts of money in geothermal exploration programs and were enjoying appreciable government incentives to explored energy alternatives. Compared to that period, current exploration is very limited, and governmental incentives such as exploration co-funding and loan guarantee programs are usually not available. The recent extension of the production tax credit will boost the development of new geothermal projects and thus trigger additional exploration. However, given the short-term nature of the tax credit, most sites likely to be developed are known geothermal sites with at least one well already in place. Undiscovered resources are likely to be deeper or more difficult to locate with traditional exploration techniques. Additional long-term incentives are thus needed to ensure exploration activities focused on discovering new sites and guarantee the development of exploration technologies helping find new resources or reduce exploration costs. Major factors affecting the cost of exploration are thus:
1. The nature of the project (greenfield vs. expansion) and extent of exploration activities. 2. The size of the project (economies of scale) 3. The rock and resource characteristics affecting drilling costs, 4. The site accessibility, leasing costs, remoteness & topography (road and connection infrastructure), 5. The high financing costs (interest rates/ rates of return) related to financial risk, 6. Total delay time before the power plant is put online (e.g. permitting).
14 The actual cost and conditions of venture capital is determined by a contract between the developer and the venture capitalist. This contract specifies the responsibilities and risks taken by each party. In most cases the "cost of delays" will be borne by the venture capital provider and, if the project is build, result in lower return on investment. If the project is abandoned, the venture capitalist looses his investment.
10

2. CONFIRMATION The confirmation phase mainly consists of drilling additional production wells and testing their flow rates until approximately 25% of the resource capacity needed by the project is confirmed. It also involves reservoir design and engineering and the drilling of some injection capacity to dispose of fluids from production well tests. In addition to confirming the energy potential of a resource, an important characteristic of this phase is linked to its financial component. Most lending institutions will require 25% of the total project capacity to be confirmed prior to lending any money to geothermal developers15. This means that, similar to the exploration phase, all expenses incurred during the confirmation phase have to be funded with equity investment. Drilling expenses usually account for eighty percent (80%) of total confirmation costs. Other activities and costs consist mainly of road and pad construction, well testing, reporting, regulatory compliance & permitting, and administration. Two major factors will affect total drilling costs: (1) the cost of drilling individual wells and, (2) the number of wells to drill. The cost of an individual well is mainly related to the depth and diameter of the well as well as the properties of the rock formation. The number of wells to drill is determined by the average well productivity and the size of the project. Well productivity directly depends on the resource temperature and the rock permeability. Compared to the exploration phase, the drilling success rate increases significantly during the confirmation phase and averages 60%16. Such improvements are due to learning effects and are explained by a better understanding of the resource location and other site-specific characteristics. (A detailed analysis of factors influencing drilling cost is provided in the following section) Confirmation cost estimates for commercially viable projects are considered to average 150 $/kW17. This corresponds roughly to one-fourth of the total drilling costs but may be somewhat lower since confirmation does not require 25% of injection capacity to be drilled. Resulting confirmation costs may however vary widely according to the resource characteristics and drilling success rate. Major factors affecting confirmation costs are related to drilling costs (see following section). Other parameters are the site's accessibility and the possible delays due to regulatory or permitting issues or accessibility of drilling rigs. Like the exploration phase, money involved in the confirmation phase is usually venture capital (equity) which requires a high rate of return and therefore affects the all in cost of the project. Any delay 15 For small projects, a second successful production well is required even if the first one has a wellhead capacity exceeding 25% of the project capacity. (The size of the project may thus greatly affect total confirmation cost even if resulting site development drilling may be significantly reduced) 16 GeothermEx (2004) estimates that a 60% success rate for production wells during the confirmation phase is reasonable, because confirmation drilling is based on very limited data about the deep resource, and the reservoir information gathered during confirmation later leads to the higher overall success rate." 17 The average confirmation costs of projects considered as "cost competitive" by GeothermEx (2004) (i.e. capital investment ≤ 2400$/kW) is 153$/kW. Inflated confirmation cost estimates published in EPRI 1997 correspond to 140.35 $/kW.
11
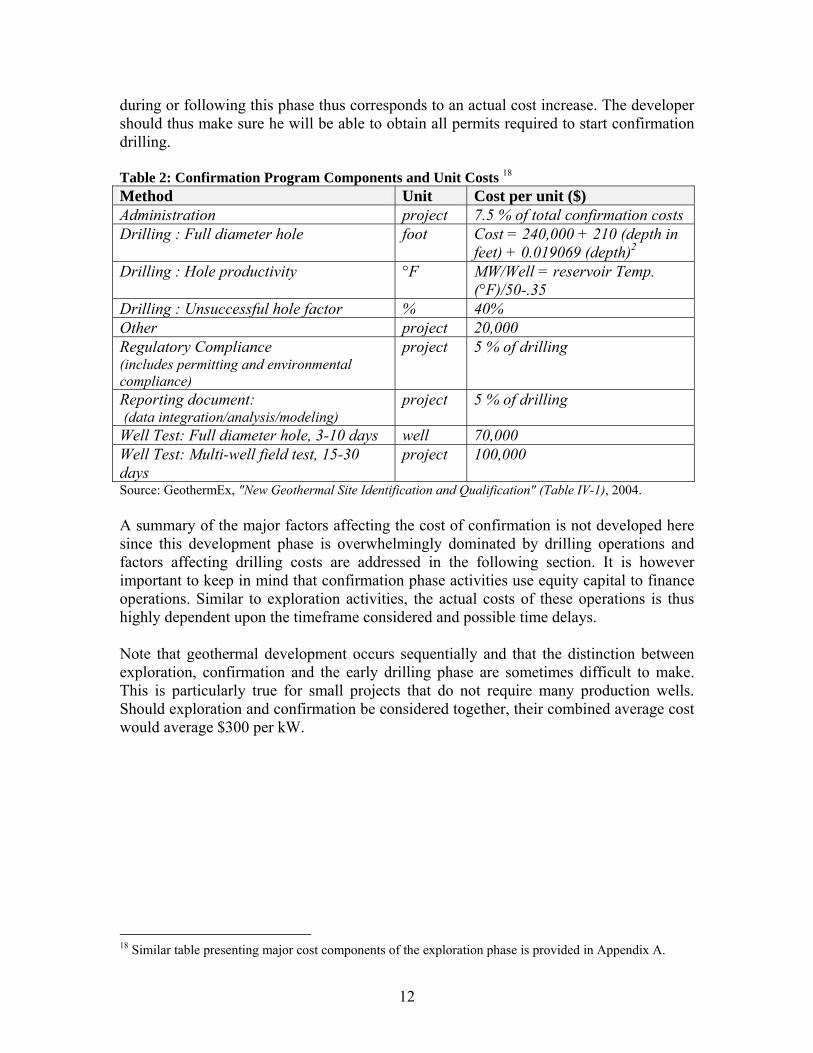
during or following this phase thus corresponds to an actual cost increase. The developer should thus make sure he will be able to obtain all permits required to start confirmation drilling. Table 2: Confirmation Program Components and Unit Costs 18
Method Unit Cost per unit ($) Administration project 7.5 % of total confirmation costs Drilling : Full diameter hole foot Cost = 240,000 + 210 (depth in
feet) + 0.019069 (depth)2
Drilling : Hole productivity °F MW/Well = reservoir Temp. (°F)/50-.35
Drilling : Unsuccessful hole factor % 40% Other project 20,000 Regulatory Compliance (includes permitting and environmental compliance)
project 5 % of drilling
Reporting document: (data integration/analysis/modeling)
project 5 % of drilling
Well Test: Full diameter hole, 3-10 days well 70,000 Well Test: Multi-well field test, 15-30 days
project 100,000
Source: GeothermEx, "New Geothermal Site Identification and Qualification" (Table IV-1), 2004. A summary of the major factors affecting the cost of confirmation is not developed here since this development phase is overwhelmingly dominated by drilling operations and factors affecting drilling costs are addressed in the following section. It is however important to keep in mind that confirmation phase activities use equity capital to finance operations. Similar to exploration activities, the actual costs of these operations is thus highly dependent upon the timeframe considered and possible time delays. Note that geothermal development occurs sequentially and that the distinction between exploration, confirmation and the early drilling phase are sometimes difficult to make. This is particularly true for small projects that do not require many production wells. Should exploration and confirmation be considered together, their combined average cost would average $300 per kW.
18 Similar table presenting major cost components of the exploration phase is provided in Appendix A.
12

3. SITE DEVELOPMENT The site development phase covers all the remaining activities that bring a power plant on line. This includes power plant design and associated technological choices, drilling and well testing until all steam/brine requirements of the project are met,19 power plant construction and installation, and connection to the grid. Once the resource characteristics are known, developers can relatively easily estimate the cost of putting the project online and thus approximate the minimal power price needed to make the project economically viable. This phase includes a series of technological choices that depend on the resource characteristics and location and might significantly affect the resulting cost of development.
3.1. Drilling Drilling a geothermal well consists of a succession of steps of drilling and well casing construction until the top of the resource is reached. Once the well penetrates into the geothermal reservoir, the only additional casing that may be required would be an uncemented slotted liner to prevent rocks and debris from falling into the wellbore, however if the formation rock is competent then no additional casing is required. The productivity of the well will be influenced by its length in the permeable rock as well as the number of productive fractures it crosses. Drilling costs are highly dependent upon resource characteristics. Other economic parameters may however also influence the total cost of drilling. All the parameters listed below affect the cost of drilling, whatever the phase of development.
A. RESOURCE AND BRINE CHARACTERISTICS:
Factors influencing the cost of drilling and completing one well: The depth of the resource is one of the major parameters influencing the cost of drilling a geothermal well. Along with the rock formation (nature, structure and hardness), which determines the drilling speed, these parameters influence the initial well diameter, the number of casing strings needed and, thereby, the time required to drill the well. According to the variability of these parameters, the drilling of a geothermal well may last from 25 to over 90 days, with a reasonable average of 45 days. Deeper wells also require larger and thus more expensive drilling rigs.
19 In order to secure steam delivery, developers usually drill over 105% of the brine requirements of the power plant and have at least one spare productive well available to compensate any steam supply problem. In some cases, financial institutions may require development of 125% of required flow to the plant.
13

The pressure of the geothermal resource and rock formations above it will influence both the drilling process and the strength of the well casing. High pressure may result in well blow-out. In addition to being dangerous for the drilling crew, well blow-out may be very expensive and can threaten the economic viability of the project. In order to prevent this, the developer must install a stronger and heavier casing along with a highly specialized blow-out prevention system. This may involve the drilling of a larger, and thus more expensive, well diameter, the handling of a specialized well casing and the use of special and better quality "blow-out prevention" equipment. When the geological formation above the resource has an internal pressure less than hydrostatic20 and is permeable, loss of circulation fluid may become problematic. In such cases, the drilling process may require more frequent casing stages or other specific measures (e.g. use of lower density drilling fluids) that significantly increase drilling costs. Each additional casing layer results in additional work (casing construction and well head completion21), delays the drilling process (drilling activities are on hold during these casing and wellhead completion activities), and results in a narrower well diameter (which will affect the brine flow and thereby the well productivity22). In some cases compressed air, aerated mud or water as well as foam can be utilized as a drilling media rather than drilling mud. Compressed air or similar systems increase the cost of drilling for both the equipment that compresses the air and the system to handle the exhausted air and cuttings discharged from the well. Loss of circulation fluid in a productive zone of the resource has a major effect on drilling costs. If the drill bit enters a highly permeable zone (e.g. a open fracture) in which formation pressure doesn't compensate for the pressure of the column of drilling fluids, this fluid may flow into the resource rock formation (i.e. loss of circulation fluid). If the developer wants to pursue the drilling to enhance the productivity of the well, that zone must be temporarily plugged with specific material (e.g. cotton seed hulls). This decision is however difficult to make since the productive zone may remain permanently plugged. The total number of casing strings is determined by both the depth and the type of geologic structures drilled through and determines the resulting productive diameter of the well, which, in turn, influences the overall well productivity through frictional losses. Once the resource characteristics are known23, the developer may target a certain well diameter at a certain depth. For self-flowing wells, this aims to minimize frictional losses, while in the case of pumped resources it permits the pump to be installed at sufficient
20 Except for geopressured resources, well pressures are hydrostatic or below dependent on the depth to the water table. At The Geysers, pressures are below hydrostatic for the given depth because the continuous fluid in the field is steam. In most Basin and Range systems pressures are somewhat below what would be expected at a given depth because the top of the water table is below the land surface. However pressures in the well increase at the normal hydrostatic gradient below the water table. 21 Each casing step requires the installation of a new well head corresponding to the new well diameter. 22 Due to frictional losses throughout the ascending movement of the brine in the well, the well diameter strongly influences the maximum productive flow rate. 23 Information about temperature and pressure changes as the brine ascends in the well permits the location of the boiling point to be determined.
14
depth. As brine rises in the well, the pressure decreases but temperature stays approximately constant, so at some particular depth the brine will begin to boil and steam will form. Since two-phase flows (i.e. water & steam) squander much more energy in frictional losses than single-phase flows, the developer may want to reduce frictional losses above the "boiling point" depth by employing a larger well diameter. For pumped resources, the developer must install the pumps at sufficient depth to avoid two-phase flow24. This usually means that a 13 3/8 diameter well completion is needed down to a level below the brine "boiling point" depth in order to accommodate the downhole pump. Since the cost of the well is directly proportional to its diameter, such diameter requirements may significantly affect the resulting cost of the well. The chemistry of the brine is another important factor that determines the nature of the materials used in the well casing process. A corrosive geothermal fluid may require the use of resistant pipes and cement. Adding a titanium liner to protect the casing may significantly increase the cost of a well. Current cost estimates for titanium pipes average $1000 per foot25 (i.e. 2.4 M$ for a 2400 feet deep casing). This kind of requirement is rare, and in the U.S., limited to the Salton Sea geothermal resource. Statistical analyses of historical drilling costs data show that the depth of the well is the major parameter explaining its overall cost. GeothemEx (2004) built the following empirical function to estimate drilling cost: Drilling cost (in US$) = 240,785 + 210 x (depth in feet) + 0.019069 x (depth in feet)2
For this relation, the coefficient of determination26: R2 = 0.558. This means that depth explains 56% of the cost variability of geothermal wells considered in the analysis. Such a correlation factor is relatively low and thus means that the actual cost of a well may vary significantly with the estimated cost value provided by this equation. The diameter of the well is another important parameter influencing the cost of drilling. More generally, drilling costs vary with the operating time of the drilling rig. Since this time may vary widely, the resulting cost of individual wells fluctuate accordingly. Inexpensive wells may cost as little as $1 million while expensive wells may cost over $8-9 million. An average well cost estimate would probably be in the range of $2-5 million27. Inexpensive wells usually correspond to shallow resources located in sedimentary rock areas while expensive wells are usually characterized by deep
24 Downhole pumps are generally designed to fit in 13 3/8 inch diameter pipes and repressurize the brine in order to prevent the formation of a two-phase flow. A continuous single phase flow will indeed reduce frictional losses in the brine gathering system and prevent cavitation and scaling problems at the heat primary exchanger level of binary power plants. 25 Confidential sources indicated that 13 3/8 inch titanium pipes price was about 800$/foot in 2003, rose significantly in 2004 (up to $1400/foot), and can be expected near $1000 per foot in 2005. 26 The coefficient of determination compares estimated and actual values, and ranges in value from 0 to 1. If it is 1, there is a perfect correlation in the sample and the actual value. At the other extreme, if the coefficient of determination is 0, the regression equation is not helpful in predicting values. 27 A 2M$ cost figure is most likely applicable to low average cost figure (e.g. a shallow resource) while a 5M$ well would rather correspond to the high end of the “average” cost figure.
15

reservoirs located in hard rock formations with corrosive brine and/or those that are under high pressure.
Factors influencing the number of wells to drill: Rock permeability and resource temperature and pressure are the major parameters influencing the well flow rate. These factors will also determine the well productivity and thus the number of wells needed to supply the power plant's energy requirements. In the U.S., flow rates of commercial wells vary greatly (from pumped resources, to low and high natural flow rates), and temperatures of commercially viable resources vary from slightly below 250°F to over 500°F. Since well productivity is directly related to both these parameters, the resulting productivity of a geothermal well varies even more (1-2 MW to 25-50 MW/well) but average values range 3-5 MW. For resources with brine temperature below 400°F, downhole pumps are commonly used to enhance the well flow rate. For low temperature systems [212-400°F], GeothermEx (2004) established a roughly linear correlation between well productivity and temperature: Well productivity (MW) = resource temperature (°F) /50 - 3.5 Downhole pumps are intolerant of high temperatures and their use is therefore limited to low or medium temperature resources, which, in most cases, use binary power systems28. On the other hand, high temperature resources with reasonable rock permeability are characterized with self-discharging wells. Their natural discharge rate increases as the temperature of the resource rises29. Another major factor affecting the well's natural flow rate is the rock permeability of the geologic structure. This characteristic determines the ability of the geothermal fluid to flow through a porous or fractured media. The resource productivity may vary widely from place to place within the reservoir, and may also change with time. Well productivity decline is a common phenomenon in geothermal power projects. It justifies the drilling of at least one additional productive well above the estimated brine/energy requirements of the power plant during the initial drilling phase. The impact of productivity decline on make-up well drilling costs is addressed in the O&M cost section. Although make-up drilling costs are considered as depreciable costs rather than expenses and thus appear as capital costs in accounting books, this paper considers them as O&M costs that help maintain power production to an optimal level during the entire lifetime of the power plant.
28 In case of binary power projects, down-hole pumps not only enhance the productivity of the wells, but keep the resource under pressure to prevent the emergence of the vapor phase. 29 The flow rate of self-discharging wells is directly related to the temperature of the resource. The higher the fluid temperature, the deeper the brine boiling-point. Above this point, the flow is two-phased (liquid-vapor) and characterized with a lower density. The vapor phase of the flow creates the upward movement ("steam lift effect") that result in the "self-discharge" property of the well.
16
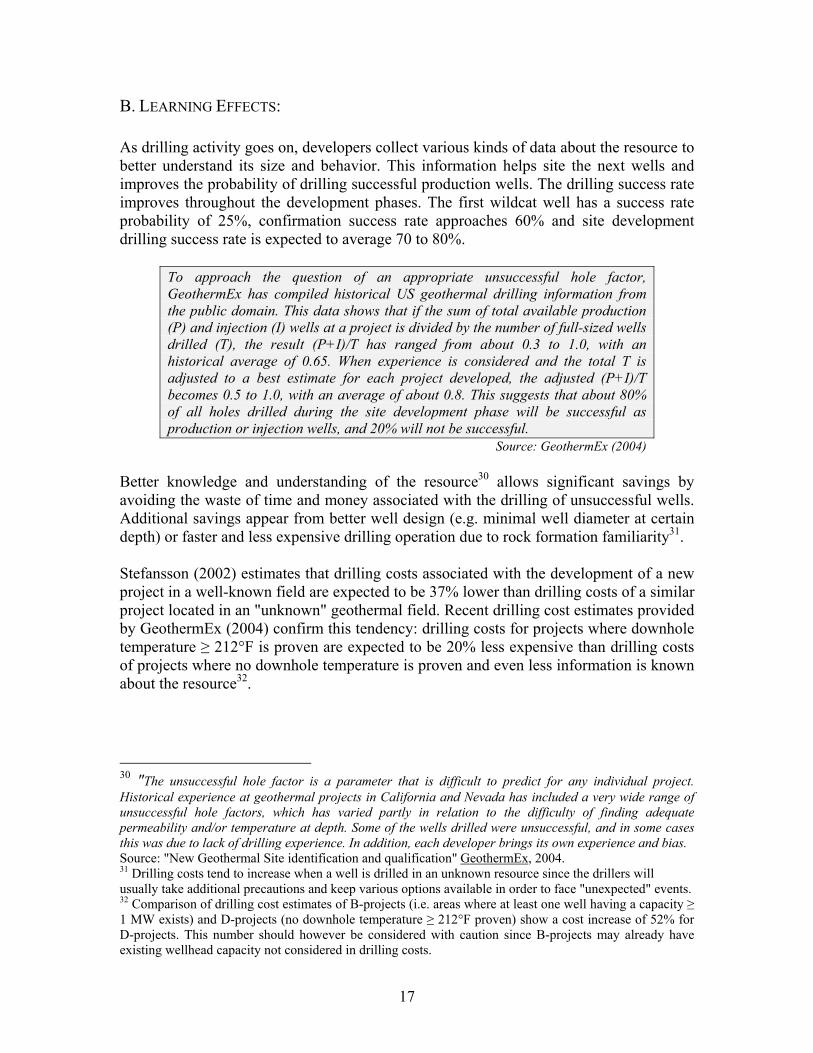
B. LEARNING EFFECTS: As drilling activity goes on, developers collect various kinds of data about the resource to better understand its size and behavior. This information helps site the next wells and improves the probability of drilling successful production wells. The drilling success rate improves throughout the development phases. The first wildcat well has a success rate probability of 25%, confirmation success rate approaches 60% and site development drilling success rate is expected to average 70 to 80%.
To approach the question of an appropriate unsuccessful hole factor, GeothermEx has compiled historical US geothermal drilling information from the public domain. This data shows that if the sum of total available production (P) and injection (I) wells at a project is divided by the number of full-sized wells drilled (T), the result (P+I)/T has ranged from about 0.3 to 1.0, with an historical average of 0.65. When experience is considered and the total T is adjusted to a best estimate for each project developed, the adjusted (P+I)/T becomes 0.5 to 1.0, with an average of about 0.8. This suggests that about 80% of all holes drilled during the site development phase will be successful as production or injection wells, and 20% will not be successful.
Source: GeothermEx (2004) Better knowledge and understanding of the resource30 allows significant savings by avoiding the waste of time and money associated with the drilling of unsuccessful wells. Additional savings appear from better well design (e.g. minimal well diameter at certain depth) or faster and less expensive drilling operation due to rock formation familiarity31. Stefansson (2002) estimates that drilling costs associated with the development of a new project in a well-known field are expected to be 37% lower than drilling costs of a similar project located in an "unknown" geothermal field. Recent drilling cost estimates provided by GeothermEx (2004) confirm this tendency: drilling costs for projects where downhole temperature ≥ 212°F is proven are expected to be 20% less expensive than drilling costs of projects where no downhole temperature is proven and even less information is known about the resource32.
30 "The unsuccessful hole factor is a parameter that is difficult to predict for any individual project. Historical experience at geothermal projects in California and Nevada has included a very wide range of unsuccessful hole factors, which has varied partly in relation to the difficulty of finding adequate permeability and/or temperature at depth. Some of the wells drilled were unsuccessful, and in some cases this was due to lack of drilling experience. In addition, each developer brings its own experience and bias. Source: "New Geothermal Site identification and qualification" GeothermEx, 2004. 31 Drilling costs tend to increase when a well is drilled in an unknown resource since the drillers will usually take additional precautions and keep various options available in order to face "unexpected" events. 32 Comparison of drilling cost estimates of B-projects (i.e. areas where at least one well having a capacity ≥ 1 MW exists) and D-projects (no downhole temperature ≥ 212°F proven) show a cost increase of 52% for D-projects. This number should however be considered with caution since B-projects may already have existing wellhead capacity not considered in drilling costs.
17

C. MARKET PARAMETERS: Since the oil & gas industry competes with the geothermal industry for drilling equipment, drilling rigs may not be readily available. When market conditions and energy prices trigger further exploration and development of both industries, the limited number of drilling rigs has to be shared between them, and drillers usually take the most favorable offer. The cost of drilling services may thus become volatile during the period characterized by market imbalance between supply and demand and rapidly rise 20% or more. The same logic applies for other drilling cost components. The recent evolution of steel, cement and fuel prices illustrates the volatility of equipment and goods needed for drilling.
D. CONCLUSIONS: Resource specific characteristics profoundly affect both the cost of individual wells and the total number of wells that must be drilled. Market conditions may also affect the cost of drilling through the cost and nature of the equipment, goods and services required. Better resource knowledge and "learning effects" usually correspond to improved drilling success rates thereby lowering the drilling costs. Reasonable drilling cost estimates are very difficult to provide. Entingh and McLarty (1997) suggest that average drilling costs account for 629 $/kW installed for a flash plant project and 323 $/kW33 for binary projects. Projects examined under NGGPP34 suggest average drilling costs of 555$/kW for flash plants and 996 $/kW35 for binary plants. GeothermEx (2004), which estimates drilling cost for a variety of geothermal resources, provides cost figures varying from 368 to over 4500$/kW. However, this study did not select the resources analyzed with economic feasibility criteria and therefore includes extremely high cost values. Considering only projects with specific capital costs under 2400$/kW36, the average drilling expenses correspond to 648 $/kW. However, this estimate only considers known geothermal sites with existing production wells and excludes confirmation drilling costs. Interviews of geothermal developers revealed that total drilling costs (confirmation + site development drilling) range from $600/kW to over $1200/kW with an average drilling costs figure close to 1000/kW.
33 Original cost figures of Entingh & McLarty "Renewable Energy Technology Characterization", USDOE & EPRI, 1997, have been inflated to represent current cost values. 34 NGGPP: "Next Generation of Geothermal Power Plants", EPRI, 1996 35 This cost figure however becomes 548$/kW when the most expensive binary power project is ignored. 36 This specific capital cost value is considered as the economic feasibility threshold in GeothermEx 2004.
18
3.2. Other On-Site Development Costs Other on-site development costs correspond to all other expenses needed to put the power plant on line. These include the cost of the power plant and the gathering system, all pipelines and pumps, pollution abatement systems and environmental compliance work, the electric substation and transmission-line connection, civil work (roads, etc.) engineering, legal, regulatory, documentation and reporting activities.
A. PROJECT PERMITTING: Geothermal power projects have to comply with a series of legislative requirements related to environmental and construction issues. These legislations vary significantly from state to state and, to some extent, depend on the land ownership type (i.e. private, state or federal land). For more information on environmental requirements and issues for geothermal projects, please see GEA’s Guide to Geothermal Energy and the Environment.37 On Federal land, environmental requirements are related to the National Environmental Policy Act (NEPA). Other environmental requirements besides NEPA related to geothermal development include the Clean Water Act, the National Pollutant Discharge Elimination System Permitting Program (NPDES), the Safe Drinking Water Act (Underground Injection Control Regulations), the Resource Conservation and Recovery Act (RCRA), the Toxic Substance Control Act, the Noise Control Act, the Endangered Species Act, the Archaeological Resources Protection Act, Hazardous Waste and Materials Regulations, the Occupational Health and Safety Act, the Indian Religious Freedom Act, and the Clean Air Act (CAA).38 State and local governments issue most of the air permits required by Title V of the Clean Air Act. These air permits include enforceable air emissions limitations and standards as established by the state or local government. Title V permits are issued to certain air pollution sources after they have begun to operate. In certain circumstances, for example on tribal lands, EPA may issue Title V permits as needed. EPA permits do not supersede state permits but rather serve areas not under traditional state and local government jurisdictions. Because geothermal power plants emit pollutants at lower levels than those regulated by the Clean Air Act, they do not face the same constraints as new fossil fuel facilities seeking air and operating permits from state governments. Generally speaking the permitting process investigates a range of potential impacts of the project, e.g. potential archeological, cultural/religious and biological values at the site, local hydrology, etc. The kind and extent of studies required by the permitting process varies according to the legislation of each state. In California, the permitting process is usually much longer and more costly than in neighboring states due to stricter environmental regulations and much great levels of public participation. In California, the
37 The GEA Guide is available on the web at http://www.geo-energy.org/Facilities/Links/GeothermalGuide.pdf. 38 Brown, Kevin L. (1995). Environmental Aspects of Geothermal Development. International Geothermal Association Pre-Congress Course. CNR. Pisa, Italy.
19
extent of the permitting process is also related to the size (power production capacity) of the projected power plant39. Environmental documents are prepared for agency decision makers to provide them with information enabling them to decide whether to issue a permit or not. "Permitting" includes both environmental document preparation and obtaining permits. The development of a geothermal power project generally requires two phases of environmental review. The first phase is related to exploration activities (notably exploratory drilling) to identify and characterize the geothermal resource. Exploration permitting can be less complicated because of the short term nature of exploration drilling, the limited surface disturbance, and the well-defined effects. The exploration phase generally requires preparation of an environmental document that describes the project, identifies the existing environment, and identifies environmental impacts of the proposed project. The environmental document prepared depends on the location of the project. Projects on federal lands require an environmental document prepared under the guidelines of the National Environmental Policy Act (NEPA). Projects in California also require a document prepared under the California Environmental Quality Act (CEQA). Joint federal/state documents are prepared to streamline review because the requirements of NEPA and CEQA are similar. Exploration activities are usually addressed in an Environmental Assessment (EA) under NEPA and an Initial Study/Mitigated Negative Declaration under CEQA. Exploration activities may also require permits from state or local agencies, such as air and water boards, for discharge of air emissions and waste fluids. Exploration may require the lead agency to consult with the State Historic Preservation Office or Native American tribes if cultural resources are affected, and the US Fish and Wildlife Service (USFWS) if plant or animal species of concern may be affected. Other federal regulatory agencies involved in the geothermal development process include the Bureau of Land Management (BLM), the Forest Service, and the Federal Energy Regulatory Commission (FERC).40 State and local regulations and agencies are also involved in the geothermal development process. The cost and time requirements estimates for environmental review documents for the exploration phase are $65,000 and 6 months. These values may double, however, if problems are encountered, or be slightly lower for "best cases" scenarios. Consultants often prepare the environmental documents for the government agency at the expense of the applicant. Staff of the applicant company often conducts the permitting activities, although consultants are also often used to prepare permit applications and assist with government agency consultation. 39 In California, the extent of the Environmental Impact Study (EIS) depends on the capacity of the proposed power facility. Power projects are categorized in three types: smaller than 50 MW, between 50 and 80 MW and larger than 80 MW. EIS requirements rise as the projects belong to a higher category. As a result, most projects under development in California are smaller than 50 MW or substantially larger, suggesting that the cost increase related to environmental permitting process prevent the development of middle range capacity power plants (50-70 MW) although substantial economies of scale would apply. 40 Fourmile Hill Geothermal Project Final EIS, vol 1.
20

The environmental permits needed for site development drilling and power plant construction require more extensive analysis of the more complicated development and utilization proposals. On federal land, power plant and transmission line development may be addressed in either an Environmental Assessment (EA) or an Environmental Impact Statement (EIS). If results of an Environmental Assessment find that the project could have significant effects upon the environment, a more detailed EIS must be prepared. The environmental document would be an Initial Study/Mitigated Negative Declaration under CEQA if impacts can be mitigated to less than significant levels; if impacts cannot be mitigated, an Environmental Impact Report (EIR) would be required. These documents generally take about 8 months to a year to complete. In some cases, the biological component of the baseline studies may require seasonal specific observation of migratory species or flowering of certain type of plants and thus delay the completion of the environmental document of issuance of permits. Opposition of local communities may induce much longer delays and larger costs, particularly if conflicts degenerate into lawsuits. Once the environmental documents are prepared and approved, the developer still has to apply for various kinds of permits (e.g. construction) issued by local authorities. This may also be time consuming and costly but is usually less expensive than the environmental document review process. Interviews of geothermal power developers and industry experts provided indicative cost and time values for the permitting process (exploration and site development permits considered together). While permitting of small projects in Nevada may only cost about $200,000 and take less than one year (best case scenario), permitting of a large project in California may cost over a million dollars and last over 3 years. On November 2004, the National Geothermal Collaborative “Geothermal Leasing Panel”41 stated that an Environmental Impact Study related to NEPA requirements typically costs $600,000 and takes up to 2 years.
41 http://www.geocollaborative.org/publications/default.htm
21

B. STEAM GATHERING SYSTEM: The steam gathering system is the network of pipes connecting the power plant with all production and injection wells. The cost for these facilities varies widely depending on the distance from the production and injection wells to the power plant, the flowing pressure and chemistry of the produced fluids. Carbon steel pipelines are used in the majority of geothermal resources and can be completely installed for between $15 - $25 per inch of diameter per foot of pipe length (example: 24” pipe x 1000 feet x $20 = $480,000)42. For highly corrosive brine, alloy systems such as various duplex stainless, high nickel alloys or lined pipe can be two to over five times the cost of carbon steel. Dry steam systems are relatively simple, requiring only steam and condensate injection piping and minimal steam cleaning devices43. Single-flash power systems have four sets of piping: (1) the two-phase (brine + steam) flow that supplies the separator, (2) the steam pipes supplying the turbine, (3) the brine pipe that leaves the separator (and may aliment a second low pressure separator in case of a dual flash power system), and (4) the spent brine + condensate that is returned for injection. For binary systems, only the hot brine line and the cooler brine injection lines are required. Valves, instrumentation, control and data acquisition must be included in the gathering and injection system, which can be significant. The piping and controls can vary from $100 to $250+/kW. Personal conversation with developers however indicated that the steam gathering system of high temperature dual-flash system can exceed $400/kW installed44. Steam processing is an integral part of the gathering system for dry steam and flash steam projects. Separators are used to isolate and purify the geothermal steam before proceeding to the turbine. A flash system requires three or more stages of separation. This includes the primary flash separator (that isolate steam from brine), drip pots along the steam line, and a final polishing separator/scrubber. A steam wash process is often employed to further enhance steam purity. Poor steam processing results in high O&M costs and low plant availability. In most cases45, the steam processing costs vary from $25 to $100 per kW depending on the complexity of the system required. Very few cost estimates are currently available in the literature and these cost figures are significantly lower than cost estimates recently obtained from power developers. This difference may be explained by the extent of the components included in the "steam gathering system" definition (which vary according to the authors) as well as by the recent cost increase of raw materials.
42 Cost estimates including insulation and supports provided by Mr. Douglas Jung (Two-Phase Engineering). 43 Dry steam systems require a rock catcher to remove large solids, a centrifugal separator to remove condensate and small solid particulates, condensate drains along the pipeline and a final scrubber to remove small particulates and dissolved solids. Some sites also require caustic injection to titrate acid gasses. 44 This cost figure includes all equipment and installation costs (i.e. pipeline, alongside roads construction, high and low pressure steam separators, electric control and steam scrubbing and metering equipment) for a system supplying steam at two level of pressure (high and low) to the power plant. 45 When the resource is hyper-saline and characterized by high corrosion and scaling potential, particular equipment has to be added to the power plant. The Salton Sea case is discussed on page 25.
22

Low and moderate temperature resources (T < 350 °F) are usually pumped to enhance well productivity and brine flow. Production pump costs should be included in the cost of the gathering system. The use of pumps significantly enhances the brine flow and thus reduces the number of production wells needed as well as the overall size of the gathering system. On the other hand, pumped resources have relatively moderate temperatures and, compared to high temperature resources, require a larger brine flow to provide the same amount of energy to the power system. In some cases (e.g. upward slopes) high temperature brines may however require complex pipeline design to circulate liquid brine and vaporized steam separately. Although one pound of steam has a much higher energy content than one pound of water at the same temperature, the volume occupied by steam is considerably larger and its flow may require larger and thus more costly pipelines to diminish frictional losses46. Site topography and slope stability, average well productivity, size and spread of the steam field, and brine status are thus the major factors affecting the cost of the steam gathering system. Other important parameters to consider are the site accessibility (road construction needs and difficulties) and the chemical characteristics of the brine. Highly corrosive brines or fluids with important scaling potential may require protective coating of the inner part of the pipes. Consequently, steam gathering system costs appear much higher than suggested in existing literature. Entingh & McLarty (1997) suggest costs of 95$/kW for binary power systems47 (field piping: 41$/kW + production pumps: 54$/kW) and 55$/kW for flash power system. NGGPP suggested a steam gathering system cost as low as 30$/kW. Recent cost estimates provided by geothermal power developers, for both steam and binary projects, however average 250$/kW and, in some cases, exceeded $400/kW. Interviews with industry experts also resulted in conflicting views about the cost difference between binary and flash systems. Generally speaking, Entingh & McVeigh (2003) noted that the cost of the steam gathering system corresponds to 5% of total capital cost.
46 Brine energy content and power efficiency is directly related to its temperature, pressure and physical status (liquid vs. vapor). The flow into the pipeline system is determined by the difference in pressure and height (gravity) between the production wells and the power plant. Frictional losses throughout the pipeline are influenced by the speed and status (liquid or vapor) of the fluid as well as the diameter and length of the pipes. 47 Given the temperature of the resource, most production pumps are encountered at binary power systems.
23
C. POWER PLANT DESIGN AND CONSTRUCTION: Power plant design is a complex activity that aims to minimize both construction and operation & maintenance costs in a long-term perspective. It thus consists of defining the optimal size of power plant equipment and choosing the best suited technologies and construction materials to deal with site and resource particularities. Power plant engineering along with resource capacity assessment is a time and resource consuming activity. Since engineering and design begins early in the development process, the developer may face tight financial constraints. Capital invested in early development stages is venture capital (equity) that may be difficult to find. In the past, some developers have therefore neglected this development phase in order to diminish upfront expenditures and reduce time delays. This, along with the relatively young age and limited experience of the industry, has led to the construction of some less efficient power systems. In other cases, financial constraints during the construction phase may have led the developer to use less expensive and less resistant construction material that resulted in higher maintenance costs during later years of operation. Most geothermal resources are unique in terms of site and resource characteristics. As a result, most power plants currently in operation are equally unique. This paper aims to provide basic information about the major technology choices and help explain how site and resource characteristics affect the cost of the power plant. Although various kinds of technologies may be used to deal with particular problems, the optimum choice is usually dictated by the resource characteristics (temperature, chemistry, etc.) and power plant environment (weather conditions, water availability, etc.). Note that this document focuses on current technologies and does not address the potential impacts of future technology improvements.
1. Impact of resource characteristics on technology choices and power system cost:
A. Temperature. The temperature of the resource is an essential parameter influencing the cost of the power plant equipment. Each power plant is designed to optimize the use of the heat supplied by the geothermal fluid. The size and thus cost of various components (e.g. heat exchangers) is determined by the resource's temperature. As the temperature of the resource goes up, the efficiency of the power system increases and the specific cost of equipment decreases (more energy being produced with similar equipment). The temperature of the resource also determines the technology choice (steam vs. binary). High temperature resources use steam power systems, which are usually simpler and less costly. The specific cost of steam plant equipment rises quickly, however, as brine temperature decreases (as a result of efficiency losses) and binary systems become competitive at temperatures close to 350°F. Despite a more complex design, binary power systems are generally less expensive than steam system for temperature below 350°F. The specific cost of binary systems also rises as temperature drops.
24

Figure 2: Specific Cost of Power Plant Equipment vs. Resource Temperature.
500
1000
1500
2000
2500
3000
3500
4000
4500
265 300 330 375 425 450 510 525 570
Resource temperature (°F)
Spec
ific
cost
of P
ower
Pla
nt
($/k
W)
SteamBinary
Cost estimates and temperature data from: "Next Generation of Geothermal Power Plants", EPRI, 1996. Source data for Figure 2 are actual cost estimates for nine geothermal projects located at different resources with various temperature characteristics. These estimates however consider factors other than brine temperature. The apparent cost increase of the steam power plant corresponding to the 525°F resource temperature project is explained by other site and resource characteristics (e.g. brine chemistry, etc.). If brine temperature was the only parameter considered in the above figure, the cost evolution of flash plants would also have a hyperbolic shape48. Figure 2 reinforces the statement of Forsha & Nichols (1991) which suggest that equipment cost of a binary power system may decrease by 10% (or more) when resource temperature increases from 250 to 300°F. Optimum efficiency of the power system is also a function of the energy content and thus pressure of the fluid spinning the turbine. For flash steam plants49 the pressure of the steam will directly depend on the temperature of the brine50 while in binary systems, the pressure of the working fluid will depend on the heat transferred to it in the heat exchanger.
B. Chemistry. The chemistry of the brine is another essential parameter that may significantly affect the cost of the power system. The four major chemical characteristics that have to be studied and addressed at the beginning of the power plant design phase are: the brine scaling 48 Cost estimates appearing in Figure 2 are neither normalized nor inflated. These values are thus expressed in 1993 Dollars. 49 A distinction is made between two kinds of steam technologies: Flash steam geothermal systems refer to the technology that "flashes" the liquid brine into steam (sometimes in two separators at different pressures) in order to produce the optimal amount of steam at adequate pressure to spin the steam turbine. Dry steam geothermal systems refer to (simplified) technologies used when the resources directly produce "dry steam" (as opposed to liquid brine). “The Geysers” is the only dry steam field under production in the U.S. 50 This is explained by the "Ideal Gas Law" that states that PV = nRT. In this equation P represents the gas Pressure, V its volume, n the number of moles of gas, R is a physical constant and T is the gas temperature.
25
potential, corrosiveness, non-condensable gas (NCG) and hydrogen sulfide (H2S) content. Each of these characteristics may require additional equipment that can deal with specific problems or may influence the size of some power plant components. The resulting impact on the project cost is sometimes significant. Geothermal brines may be highly corrosive and thus progressively corrode metal components of the power plant (pipes, heat exchanger, tanks, etc.) To avoid or reduce this phenomenon, the developer must either use resistant materials (e.g. stainless steel or titanium in place of carbon steel) or add protective coatings to sensitive equipment. Both solutions translate into higher capital costs. Scaling potential of aqueous fluids is directly related to their mineral content. Variations of the physical and chemical conditions (essentially temperature and pH), will affect the solubility of the minerals, which may induce the precipitation of dissolved elements. Since the entire geothermal process consists of extracting heat from hot underground fluids to convert that thermal energy into power, geothermal brines are cooled during this process. Additionally, when the brine is "flashed" in order to produce steam in the separators, it naturally emits CO2 that was originally dissolved in the brine. This phenomenon slightly increases the pH of the brine, further promoting scaling of dissolved minerals. As a result, the chemical balance of minerals may be disturbed to the point of solid precipitation. In order to avoid or mitigate this, the developer may reduce the heat captured from the brine (thereby reducing the plant efficiency), add scaling inhibitors, or acidify the brine to maintain minerals in solution (with impact to O&M costs). In severe cases, much more complex equipment may be required to clean the brine and control mineral precipitation (e.g. Crystallizer Reactor Clarifier technology). Such equipment is extremely costly and will constitute a major cost component of the power plant. The Salton Sea Unit 6 project is a perfect example of a power system designed to deal with geothermal fluid characterized by severe scaling and corrosive potential. Rough cost estimates consider that the "resource production facility" (i.e. brine/steam separators, crystallizers, clarifiers, steam scrubbers and demisters, brine injection pumps and precipitated solids disposal51), correspond to forty percent of the project cost. Almost none of this equipment is needed when the geothermal resource directly produces clean, dry steam. Geothermal brines also contain dissolved gases that may not easily be injected back into the reservoir. Flash power plants therefore have to deal with non-condensable gases (NCG), which usually consist of gases (e.g. CO2, H2S, CH4, etc.) that were initially dissolved in the brine and then mixed with the steam but which cannot be condensed. In order to maintain condenser operation, NCG have to be removed and special equipment is therefore required. Two main technologies exist (steam jet ejectors or vacuum pumps) and the choice of either technology will either result in higher capital cost or lower plant efficiency (through higher parasitic load). Some NCG may also require abatement measures to comply with environmental laws. This is particularly the case for H2S, which may be burnt or converted to elementary sulfur. Other NCG naturally emitted by the 51 Note: this type of equipment is usually considered to be part of the steam gathering system.
26

reservoir (e.g. methane, benzene, etc.) may also require specific abatement equipment to comply with environmental regulations. Each of the above chemical characteristics may thus require specific equipment that will affect the project’s capital costs. If different technologies are available to deal with specific problems, the optimal choice is usually determined by the brine characteristics and the site conditions. Current detailed cost estimates and variability ranges for these impacts are unfortunately not available. The "Next Generation of Geothermal Power Plants" report (NGGPP, 1996) provides cost estimates for different projects with various resources characteristics and locations. Cost information displayed in the following table corresponds to average, low and high specific cost estimates for equipment needed to dealing with NCG disposal and H2S in the various projects studied in NGGPP:
(Costs Unit: $/kWinstalled) Average [Low - High] Non Condensable Gas 9 [3 - 85] Sulfur Abatement 33 [0 - 75]
2. Impact of site characteristics on technology choices and power system cost: Weather conditions or water availability are essential parameters affecting the choice of the power plant heat rejection system. Two different kinds of cooling system exist: air-cooled or water-cooled. Water-cooled systems are generally considered to be less expensive to build and operate as long as water is cheap and readily available. Since steam power plants produce water through steam condensation, most steam technologies are equipped with cooling towers that circulate condensed steam. Alternatively, binary plants usually inject all the brine back into the reservoir. In order to use a water-cooled system, binary facilities thus require an additional source of water that can be evaporated. In arid areas, despite higher construction costs, an air-cooled heat extraction system may be the most cost efficient choice52. The electric output of power plants equipped with air-cooling systems are quite sensitive to diurnal and seasonal weather conditions (air temperature and humidity) and net energy output typically fluctuates 20-25% on both a diurnal and a seasonal basis53. The turbine output of a binary power system depends on the backpressure in the plant's hydrocarbon condenser which, in turn, depends on the cooling potential of the heat rejection system. The cooling potential of an air-cooled system is directly related to the air temperature. Unfortunately, maximal energy output of air-cooled power plant occurs when the outdoor temperature is low (i.e. at night), while summer peak energy demand typically takes place during the hottest hours of the day (notably due to air conditioning)54. By contrast, water-cooled systems use the energy 52 Another advantage of the air-cooled system is that the construction is usually much lower and less visible than cooling towers (which emit vapor plumes) and may thus benefit from less reluctance from local communities. 53 Appendix D provides a detailed description of the impact of diurnal and seasonal weather conditions on the power output of an air-cooled binary power plant located in desert area. 54 Since the power purchase contracts may allow the power producer to enjoy higher energy prices for power delivery during "peak electricity demand hours" or, inversely, inflict penalties for power output fluctuations, such incentive may be critical parameters in the choice of the cooling system.
27
required to evaporate water to cool the condenser. Local weather conditions thus affect water consumption used in the cooling process but have much less impact on the power plant energy output. Since the literature provides conflicting opinions about typical O&M costs of both cooling technologies, the following paragraph attempts to provide further insight on the major O&M cost components of each technology. Operation costs of air-cooled systems mostly consist of power required by the cooling fan motors. Some maintenance is also needed, but typically consists of an annual check-up of fan motors and belts as well as system lubrication. The parasitic load of an air-cooled system is usually considered to be higher than that required by a cooling tower (electric power needed to spin air fans vs. water pumps and air fans). However, much less work is needed to operate and maintain a well-designed air-cooled system. Water-cooled systems require biotic and sometimes chemical water treatment to prevent algae blooms or mineral deposition. Some developers therefore claim that operation costs of air-cooled systems are lower than those of water cooled systems55. This statement is confirmed by NGGPP (1996), who estimate that, over the entire lifetime of the power plant, the actual capital cost increase of an air-cooled system corresponds to $84 per kW installed. Since Forsha & Nichols (1991) estimate that the initial construction cost of air-cooling system are $222 more expensive per kW installed, this suggests that, compared to a water-cooled system, cumulative O&M costs savings of an air-cooled system, during the lifetime of the power plant, account for $138. Unfortunately, clear comparison of both technologies could not be done since this would require the analysis of comparable cooling systems designed to optimize long term economics for each technology. When discussing this issue with industry experts it appeared that important trade-offs may take place between initial construction costs and later O&M costs. (e.g. system design, construction materials used, etc.) Local weather conditions may also induce delays that will affect construction costs when the power project is located in an area characterized by particularly long snow seasons. Availability of skilled labor may also be an issue for projects located in remote areas. The project developer may have to build construction camps to provide housing and meals to workers, and this may increase labor cost by 8-12% (Bloomquist, 2002) Bloomquist (2002) also estimated that local terrain topography and geologic factors (e.g. ground and slope stability) may affect construction costs by another 2-5%.
55 According to Dan Schochet (ORMAT), air-cooled power systems have a higher parasitic load (energy needed to spin air-fans) but requires much less maintenance and thus result in significantly lower (10-15% lower) O&M costs.
28

3. Other Technologies Other power plant technology choices (e.g. condenser type, turbine generator design and characteristics, control technologies, etc.) will also affect the cost of the power system, but such issues are beyond the scope of this analysis. As mentioned in the introduction of this section, it is generally admitted that trade-offs exist between initial capital costs and operational flexibility. Although rational economics favors an optimization of all costs incurred (i.e. capital and O&M costs) over the entire lifetime of the power plant, financial constrains, short-term vision or uncertainty and lack of experience related to resource and power plant sustainability has led to the construction of some poorly designed power plants using inappropriate construction materials.
4. Transmission Valuable geothermal resources are not always located in areas furnished with transmission facilities. Some projects thus include the cost of building a new transmission line to connect the power plant to the grid. Transmission lines are quite expensive and their cost may be a hurdle to a project's competitiveness. The construction cost of a new transmission line is linked to its length but is also affected by the topography, slope stability, and accessibility of the site considered. The following table provides cost estimates for new transmission lines. Table 2: Construction cost of transmission lines ($/mile). Sifford & Beale (1991) $360,600/mile (58% labor cost & 42% material cost) Lesser (1993) $340,000/mile (61% labor cost & 39% material cost) GeothermEx (2004) $268,000/mile Developer's interview: 350,000 - 450,000 $/mile Note: All cost figures appearing in this table are expressed in 2004 $ The capacity of the transmission line is another parameter affecting its construction cost. GeothermEx (2004) therefore distinguishes 115 kV and 345 kV transmission lines and estimates their respective cost per mile to be 164 and 388 k$. Another crucial parameter influencing the specific cost of connection is the size (capacity) of the project. Similar to other infrastructure work, economies of scale are particularly important for transmission costs. Should a 10 MWe and a 100 MWe project have similar transmission requirements, specific transmissions costs for the larger project will be 10 times smaller since this cost will be shared out over a much larger power output. Projects considered economically viable by GeothermEx (2004) have transmission costs ranging from $13 to $236 per kW with an average of $104/kW.
29

5. Economies of Scale As illustrated above, economies of scale might significantly decrease the specific cost of some components. Sanyal (2005) estimates that capital costs of geothermal projects with capacity ranges of 5 to 150 MW decline exponentially with their capacity according to the following relationship: CC=2500e-0.0025(P-5) where CC represents capital costs and P the project's power capacity. (See chart in Appendix C). Most of these economies of scale are related to activities (costs) that have to be borne independently of the project's capacity (e.g. excavation, road building, electric, phone and other connections, etc.). Geothermal resources are usually located in remote areas with little existing infrastructure. Lovekin (2000) also states that larger plants are more efficient thermodynamically. This may be explained by efficiency gains related to better design. Proportionally, engineering and design costs are smaller for larger projects and their economic impact larger, due to the size of the plant. On the other hand, pre-designed modules exist for smaller facilities. The choice of such modules allows savings on engineering cost and construction time but may result in less optimization between the power system and the resource. It is difficult to accurately estimate the capacity of the resource before operating a power plant for several years. Phased development of geothermal resources is therefore considered preferable to reduce risks of overexploiting a resource. Operational experience provides valuable data about the reservoir behavior and helps assess its actual capacity. Some oversized projects failed or faced serious viability problems due to accelerated resource productivity decline as well as thermal breakthrough.
6. Other costs associated with geothermal power development. Soft costs: The developer’s soft costs encompass a series of costs related to project development and financial issues. They generally correspond to 6 to 10 % of total expenditures and include all expenses related to engineering, legal, regulatory, documentation and reporting activities. Another important component of soft costs is the financial charges and fees required to gather the capital needed to finance the project and provisions for overhead costs. Developers also amortize unsuccessful exploration ventures with fruitful projects. Project cost estimates incorporate provisions for contingencies that usually correspond to 10% of total budgeted costs. Land costs: Geothermal developers tend to lease land rather than buy it. Land costs should thus be considered as operation and maintenance costs rather than capital costs. A clear distinction should however be made between surface and subsurface land rights. Surface land leases represent minimal expenditures while subsurface mineral rights (steam rights) typically correspond to 10% of the value of steam. Steam rights are a significant O&M
30

cost component. The nature and location of the land will affect its surface value (e.g. desert vs. agricultural land; rural land vs. land close to cities). Labor costs: Bloomquist, Geyer & Sifford (1989) estimated that labor costs account for 41% of total project costs while materials and “other” costs respectively represented the remaining 40% and 19%. This cost breakdown is confirmed by the fact that NGGPP (1996) applies a 2.5 multiplier to material costs to estimate total project costs. According to the Bureau of Labor Statistics, inflation-adjusted labor cost statistics show that construction labor cost only increase 9 % over the past 20 years. Raw material costs: According to the above statement, raw material and equipment costs account for 40% of the project’s costs. This cost share is however expected to be larger for current projects since raw material prices have sharply increased in recent years, particularly in response to high demand of the Chinese economy. Steel, concrete, oil, wood and other construction materials’ prices have sometimes doubled and thus seriously affect the competitiveness of projects being developed. Assuming that steel costs represent 10-20% of geothermal power systems, the doubling in the price of steel (2003-2004 period) would result in a 10-20% cost increase for power plant equipment.
31

3.3. Conclusions. The previous sections provide the reader with basic information needed to understand the cost variability of geothermal projects. Although existing articles may present average cost figures for geothermal power projects, the cost figures they provide usually hide the extreme variability of the cost of components discussed above. Additionally, existing articles rarely detail the exact extent of the components included in the analysis as well as the specifics of the project considered. Most article include power plant construction and steamfield development costs (drilling and steam gathering system) but few appear to address financing costs or the developer's soft costs. Almost none consider transmission costs or specify whether the project is an extension of an existing power facility or a greenfield project. Greenfield projects tend to cost 10 to 15% more than power plant expansion. Recent literature tends to focus on expansions since most recently built projects are expansions. These considerations should be kept in mind when capital cost figures, such as those appearing in the following table, are examined. Table 3: Capital cost of geothermal power technologies.
Author Technology Capital Cost Capital Cost range
Inflation adjusted capital costs (2004$)
Entingh & McVeigh (2003) Binary 2400 1700-2700 2464 CEC, RRDR (2003) Binary 2275 2336 CEC, CCCCSEGT (2003) Binary 2293 2354 Owens (2002) Binary 2112 2218 Kutscher (2000) Binary 2100 2304 EPRI (1997) Binary 2112 2485 Average Capital Cost Binary 2215 1700-2700 2360
CEC, RRDR (2003) Flash 1950 2002 CEC, CCCCSEGT (2003) Flash 1911 1962 Owens (2002) Flash 1444 1516 Stefanson (2002) Flash 1750 1062-1992 1838 Kutscher (2000) Flash 1450 1591 EPRI (1997) Flash 1444 1700 Entingh & McVeigh (2003) Flash Dual 1800 1500-2400 1850 Entingh & McVeigh (2003) Flash Single 1500 1200-1800 1540 Average Capital Cost Flash 1656 1062-2400 1750
Sanyal (2004) ns* 2184 1600-2500 2184 World Bank ns 1675 1150-2200 1675 EPRI (2001) ns 1400 1493 DiPippo (1999) ns 1700 1550-1950 1928 Average Capital Cost non specified 1740 1820 Average Capital Cost Total 1861 1969 *ns: non specified Appendix E displays similar table provided by GeothermEx (2004). Table 3 suggests that capital costs of binary projects are higher than those of flash technologies. Although it is generally agreed that the power equipment of binary systems
32
is more expensive than flash systems, other cost components of the project (e.g. drilling cost, difficult brine chemistry, etc.) may compensate for this cost advantage. Resources supporting binary projects tend to be shallower and usually face less corrosion and scaling problems56. Compared to the cost figures appearing in the above table, estimates from flash projects currently under development show significantly higher cost values57. This statement is confirmed by the latest cost figures published by the California Energy Commission58, which claims that: "The total capital cost to build a 25 to 50 MW flash plant in today's market varies from $2100/kW to $2600/kW. The capital costs of developing 10 to 30 MW binary plants range from $3000 to 3300/kW". High end values of cost estimates typically correspond to the economic feasibility threshold of projects and are thus directly related to the price of power. According to one geothermal developer, a project with capital costs of $3400 per kW would be economically viable with today's power prices if geothermal power received similar incentives as wind power (i.e. 10 year production tax credit). Since most projects currently under development are close to the economic viability threshold, changes in the cost of some components may threaten the economic viability of the entire project. Drilling costs, transmission costs, and investment related to scaling and corrosion prevention are perceived as the major components affecting the site development phase of the project. External parameters such as market price variations of raw materials (e.g. steel and concrete) can also significantly affect the resulting cost of new projects and threaten their economic viability.
56 Binary power systems keep the geothermal brine confined and manage to maintain thermo-chemical conditions that do not allow scaling or the flashing of dissolved gas (which affect the brine pH). 57 CALPINE (PowerGen Renewable Conference, 2005) estimates the development cost of the Glass Mountain projects to average $3400 per kW. Such high costs are mainly related to high permitting costs (notably related to local communities opposition to the project), expensive exploration programs (notably due to the kind of capital involved and the time delays related to pending permitting issues, and particularly long snow seasons), important drilling cost related to the depth of the resource, and costly transmission lines requirements. Other confidential sources suggest that capital costs for a new flash power projects average $3250 per kW. This high cost figure is mainly related to the extremely difficult brine chemistry (i.e. scaling and corrosion potential). 58 California Energy Commission, "Comparative Study of Transmission Alternatives - Background Report", June 2004.
33

4. FINANCING MECHANISMS AND MACRO-ECONOMIC ENVIRONMENT The prime objective of every project is to be profitable. For a geothermal project, profits are related to the difference between the price obtained for power and the cost of producing it. The financial structure, conditions and related costs are an important factor influencing the levelized cost of energy and profitability of the project. Besides the amount of the initial capital investment, the origin of the money invested and the way it is secured will influence the resulting cost of power. The cost of borrowing money is directly related to the interest rate and the length of the debt period. Both these parameters (i.e. interest rate & debt length) may vary widely according to conditions and circumstances.
A. INTEREST RATE.
Capital owners expect return for the money they lend or invest. Theoretically, financial markets are like all other markets: interest rates are determined by the amount of capital supply (investors - money lenders) and the amount of capital demand (entrepreneurs - money borrowers)59. High demand for capital will raise its price (i.e. interest rate), while low demand will decrease its price. Inversely, large capital supply will decrease its relative value and thus interest rate, while low supply will raise it. Entrepreneurs compete with each other to obtain capital at the lowest price to realize their project while investors compete with each other to invest their money in the most lucrative business. Perceived probability of success or risk of failure of the project is an essential parameter that will also tremendously affect the interest rate. Investors want to be sure that the revenues generated by the project will be capable of reimbursing the initial capital and paying for the interest. Each project is characterized by a specific risk related to the nature of the project60, the economic and political environment, etc. Investors tend to compensate for the risk of project failure, and thus loss of investment, with higher interest rates. In case of equity, this corresponds to a higher rate of return. Venture capital may have annual rates of return as high as and even higher than 35%61. Basically, interest rates consist of the average cost of borrowing money (e.g. LIBOR62) to which the lender adds a compensation for the risk associated with its use. Geothermal developers have to convince investors that their project is competitive with alternative investments and negotiate the interest rate. Most projects are financed with two different kinds of capital characterized by different interest rates: equity and debt. 59 In practice, this rule is however also influenced by other macroeconomic (e.g. inflation) and political (e.g. political stability of a country) parameters. See www.worldbank.org for further information on risks associated with geothermal power development. 60 Remember that the probability of success of exploration drilling ( wildcat wells) is around 25%. In order to estimate the risk associated with geothermal projects, investors will look to historical success rate of similar projects and ask detailed resource analysis of independent industry experts. 61 http://www.bcfm.com/financial_manager/DecJan0203/VentureCapital.pdf and
http://econ.mckenna.edu/papers/2000-51.pdf 62 LIBOR is the "London Inter Bank Offering Rate" and correspond to a reference interest rate for lenders.
34

Equity holders are investors willing to share ownership, profits, and risks associated with the project or company63. In case of project failure or company bankruptcy, equity holders are the last financial stakeholders to recover their investment. To compensate this risk, geothermal equity holders expect high rates of return (about 16-20% annually64). On the other hand, debt usually comes from relatively risk averse financial lenders. (e.g. commercial banks). Debt owners are among the first financial stakeholders to recover their money in case of project failure. Their interest rate is therefore lower (about 6-8%). A distinction may be made between long term debt and construction financing but is not discussed below. Construction financing is actually short term debt which is replaced with longer term debt upon project completion. However, interest during construction is a very real project cost component. Given the cost difference between these two types of financial participation, developers have a huge preference for debt financing. However, debt providers usually require that a certain amount of equity be invested in the project in order to secure the debt. Given the current legal framework and existing regulations, the capital structure of geothermal projects is usually composed of 70% debt and 30% equity. The debt interest rate will decrease slightly when the percentage of equity involved in the project increases. Large companies may also decrease debt interest rate in securing debt with corporate assets65. As expressed in the section dealing with the confirmation development phase, debt lenders (commercial banks) will also require 25% of the resource capacity to be proven before lending any money. This means that all early phases of the project have to be financed by equity. The actual cost of these phases rises quickly as time goes on. The amount of interest paid during the project's construction period is another cost component rarely addressed in cost analysis. The following table estimates this cost by calculating the actual cost of a project characterized by an initial capital investment of 2400$/kW, a 3 years development timeframe (which correspond to a "best case" scenario), and financed by 25% equity with a rate of return of 17% and 75% debt with an interest rate of 7%. The table breaks down the total capital cost in likely yearly expenses (i.e. $150 for exploration in year 0; $150 for confirmation in year 1 and; $1050 for site development in year 2 and 3) and shows the impact of the cost of borrowing money (impact of interest rate) for each annual expense during this 3 year timeframe.
63 According to http://www.investorwords.com, equity's definition is : "Ownership interest in a corporation in the form of common stock or preferred stock. It is the risk-bearing part of the company's capital and contrasts with debt capital which is usually secured and has priority over shareholders if the company becomes insolvent and its assets are distributed. 64 Return on equity figures provided above are nominal. To obtain real interest rates, inflation has to be subtracted from nominal interest rates. 65 Secure debt with corporate assets means that the company chooses to involve its assets as guarantees of its capacity to reimburse the debt in case of project failure. This type of financial agreement is however extremely rare. See: Owens B. "An economic valuation of a Geothermal Production Tax Credit", NREL, 2002 for more detailed explanation on the various ways to finance a geothermal project.
35

Table 4: Annual expenses breakdown during a 3 year project development years Exploration Confirmation Site Development Actual Value
of Expenses 0 150 100 1 176 150 326 2 240 176 1050 1466 3 281 240 115466 1050 2725
According to these assumptions, the actual cost of exploration when the project comes on line is 281$/kW. For this example, the cost of interest during the construction phase amount to 325$/k and the actual cost of the power plant corresponds to 2725$/kW when it finally comes online and begins to produce electricity.
B. DEBT LENGTH.
In order to secure the revenue flow of the project, commercial banks will also require the developer to have a power purchase agreement (PPA) that covers at least the length of the debt period. This power purchase agreement is negotiated with local power authorities and guarantees that the power plant will be able to deliver its power to the grid at a fixed price for a certain period of time67. The length of the debt is usually tied to the length of the power purchase agreement, although the PPA is usually slightly longer. Increasing the debt length usually means increasing the total number of times when the developer must reimburse a portion of the initial debt amount. The value of the debt reimbursement (principal) in each annuity (i.e. principal and interest payment) is thus less and thereby reduces the total value of the payment. Conversely, reducing the debt period increases the value of the capital reimbursement of each annuity thereby increasing the amount corresponding to each annuity payment68. Geothermal power plants usually have a planned lifetime of 30 years. However, power purchase agreements typically last 10 to 20 years. This means that the debt payback period of the project has to fit into the power purchase agreement period. The power purchase agreement period is thus an important factor that determines the minimum price of electricity that makes the project viable.
66 This value was obtained considering that only 25% of total investment was financed with equity. Its origin may thus be distinguished as $300 equity at 17%66 and $750 debt at 7%. 67 Power Purchase Agreements are long term contracts that specify power prices and output for the period considered. They are usually the result of political commitment that aims to diversify the energy mix and promote alternative sources of energy (renewable energy) to stabilize long term price projections but are not always available neither easy to obtain. 68 Note: Since the future is always uncertain, reducing the length of the debt period corresponds to reducing the risk of the investment, thereby decreasing the interest rate. On the other hand, a longer debt period means that the developer will have to pay interest for the money he borrows during a longer period, increasing the total amount of interest he will pay. See Appendix F for further explanation about the annuities, interests and reimbursement payments.
36

The Debt Service Coverage Ratio (DSCR69) is another constraint that may affect the minimal power price corresponding to the project's economic viability. The DSCR is a financial constraint imposed by the debt provider that requires the total annual revenue of the project to exceed the annual debt service payment (annuity) by a certain ratio (usually ≥ 1.5 for geothermal projects). One way to decrease the DSCR is to lower the debt share in the capital structure, but more equity means higher rate of return requirements. According to Brandon Owens (2002), the minimum price of energy of geothermal projects therefore corresponds to the optimum capital structure where both constraint lines (i.e. DSCR and cost of capital) intersect. (Appendix F provide a chart to visualize the effect of these constrains) To illustrate the impact of interest rates and debt period, EPRI (1997) provides an interesting analysis comparing the levelized cost of energy for power projects developed by four different types of power developers with access to various financing opportunities. These financial assumptions are presented in the table below. Financial conditions may change over time as financial markets and legislative framework evolve. Table 5: Typical financing opportunities of power developers.
Financing Type Capital Structure Average Interest Rate Debt Period
Municipal Utility 100 % debt at 5.5% 5.5 % 30 years Regulated Investor-Owned Utility
47% debt at 7.5 % 6% preferred stock at 7.2% 47% common stock at 12%
9.6% 30 years
Generating Company
35% debt at 7.5% 65% equity at 13% 11.1% 28 years
Independent Power Producer
70% debt at 8% 30% equity at 17% 10.7% 15 years
Source: Renewable Energy Technology Characterizations, US DOE-EPRI, 1997. Analysis of the levelized cost of capital investment (i.e. principal and interest payment divided by the quantity of energy produced annually70) of projects with initial capital investments of $2400/kW, $2900/kW and $3400/kW shows that the cost of money is 89.4% higher for the typical finance package of an Independent Power Producers (IPP) compared to those available for municipal utilities (see Table 6).
69 The Debt Service Coverage Requirement constraint is another guarantee for the lender that consists in the constitution of financial reserves that aims to ensure that the developer will still be able to face the debt service even if he faces unexpected operational expenses or other revenue losses. 70 The annuity is the periodic payment that reimburses the capital borrowed and pays for the interests. The quantity of energy produced annually assumes a capacity factor of 90%. This assumption is a conservative since new projects are expected to be available on-line and produce power 95 to 98% of the time.
37

Table 6: Levelized Cost of Capital Investment (cost of money: ¢/kWh) Initial Capital Investment
Municipal Utility
Regulated IOU
Generating Company
Independent Power Producer
$2400 per kW 1.99 2.85 3.20 3.76 $2900 per kW 2.4 3.44 3.89 4.54 $3400 per kW 2.81 4.06 4.54 5.33
Assuming that average operation and maintenance costs correspond to 2¢/kWh, the levelized cost of power produced by independent power producer is at least 44% more expensive than power produced by municipal utilities. In the U.S., all but one geothermal power producer are independent power producers. Table 7: Levelized Cost of Capital Electricity (cost of power: ¢/kWh) Initial Capital Investment
Municipal Utility
Regulated IOU
Generating Company
Independent Power Producer
$2400 per kW 3.99 4.85 5.20 5.76 $2900 per kW 4.4 5.44 5.89 6.54 $3400 per kW 4.81 6.06 6.54 7.33
Note: Table 7 assumes that O&M costs are 2 cents per kWh produced. The nature of geothermal developers may however evolve. In addition to the recent extension of the production tax credit, Section 45 of the Energy Bill includes provisions for “Clean Renewable Energy Bonds” which provides not-for-profit public power systems and rural electric cooperatives with interest-free loans to finance qualified energy projects. Section 45 also allows eligible cooperatives71 to pass any portion of the renewable electricity production credit to their patrons.
71 An eligible cooperative is defined as a cooperative organization that is owned more than 50 % by agricultural producers or entities owned by agricultural producers.
38
B. Operation and Maintenance Costs Operation and Maintenance (O&M) costs consist of all costs incurred during the operational phase of the power plant. Economic analysis usually distinguishes fixed and variable O&M costs, but in the case of geothermal power production, variable costs are relatively low and the marginal cost of power production increase is thus considered to be minimal. Consequently, geothermal power plant operators will keep capacity as high as possible in order to minimize the cost of each kWh produced.
1. Operation costs Operation costs include all expenses related to the operation of the power plant. An important part of these costs is labor. Other cost components include spending for consumable goods (e.g. lubricants, chemicals for H2S abatement, scaling and corrosion control, vehicle fuel, spare parts, etc.), taxes and royalties, and other miscellaneous charges (e.g. waste disposal, parasitic load for various kind of pumps (e.g. cooling system), lighting and other internal electricity uses.). Assuming a staff requirement of 40 employees, EPRI (2001) estimates the operating cost of a 50 MW power plant to be $7/MWh. Current workforce requirements for new plants are however expected to be much lower. According to Gallo (2002), labor requirement for the two 50 MW flash plants to be built in the Glass Mountain area are expected to be 23 and 15 respectively.72 Such reductions in manpower requirement are the result of acute competition among energy producers, a sharp increase in the use of subcontractor for specific activities, as well as the integration of various technological innovations. In the U.S., average employment value for companies operating existing power plants is 0.52 jobs/MW. This value varies significantly according to the structure and activity range of each company. When subcontracted employment is considered, this value becomes 0.74 jobs/MW73. The size of the power plant is another important parameter that affects labor costs. The number of operators needed to run a geothermal plant is relatively independent of its size. Therefore, most existing power plants ranging from 15 to 100 MW require similar crews of 5 to 7 employees (working on 24-hour/7-day shifts). Significant economies of scale thus apply and small plants have substantially higher labor costs than large plants. For some tasks, human workforce is progressively replaced by remote control technologies. Besides labor costs, expenses related to chemical and other consumables goods may also be important and vary widely according to the geochemistry of the brine. This variability is illustrated in Table 9. Additionally, pollution abatement and crystallizer-clarifier
72 The second power plant constructed would require less staff since the two projects are located close to each other and economies of scale will apply to workforce requirements. This employment figure however doesn’t include subcontracted workers which typically account for an additional 42% workforce. 73 Hance C. N. "Assessing Total Workforce Involved in the Geothermal Industry: Employment Survey Results & Analysis", Geothermal Energy Association, 2005.
39

technologies as well as other activities may produce various types of waste that must be disposed of. Other miscellaneous expenses may apply according to the resource characteristics (e.g. downhole pumps electric load), geographical location and weather conditions (snow removal and fire prevention), etc. Insurance costs are another component of operating costs which have been dramatically increasing in recent years.
2. Maintenance costs Maintenance costs encompass all expenses related to the maintenance of the equipment (field pipes, turbine, generator, vehicles, buildings, etc.) in good working status. This includes a large variety of tasks (e.g. machinery overhaul, painting, road repair, etc.) and some activities may be subcontracted to specialized companies. In the following, a clear distinction is made between power plant maintenance costs and expenses related to the steam field maintenance and make-up drilling. In 2001, EPRI74 estimated the annual cost of power plant maintenance as 5% of the initial capital costs. They considered an initial investment of $1400/kW and estimated that maintenance costs average $9/MWh. Besides maintaining the production and injection wells75, pipelines, roads, etc., expenses related to steam field maintenance mainly involve make-up drilling activities. Make-up drilling aims to compensate for the natural productivity decline of the project startup wells by drilling additional production wells. The well productivity decline is a complex phenomenon mainly explained by the pressure and/or temperature drop of the reservoir. Siting injection wells is therefore often a tradeoff between maintaining the resource pressure around production wells and cooling the surrounding resource area with injection fluids. More generally, the resource productivity decline rate is directly related to its capacity76 to supply energy to the power plant. Resource and power plant capacity have to be balanced to ensure sustainable power production throughout the lifetime of the power plant. The size (capacity) of the power plant is thus a major factor affecting resource productivity decline. Well productivity decline rates may vary widely according to the geothermal resource77. The power system technology is also expected to influence the productivity decline rate. While air-cooled binary power plants inject 100% of the brine used by the power system back into the reservoir, water-cooled flash plants lose 75 to 80% of the steam through evaporation in cooling towers. The quantity of steam obtained
74 "California Renewable Technology Market and Benefits Assessment", EPRI, 2001. 75 Production and injection well work-over is required to maintain steam production and generation. 76 The long-term capacity of the resource to deliver energy to the power plant mainly depends on the size, rock nature, energy content, water content, and permeability of the reservoir. 77 Well productivity decline rate may have various origins. In the late eighties, annual decline rates at The Geysers averaged 30% and where related to reservoir pressure drop. In other geothermal fields with acute scaling problems, important well productivity decline rate may be related to silicate deposition in the well bore, thereby reducing the brine flow, although the resources energy potential is not affected.
40

from the brine is highly variable and depends on the energy and chemical characteristics of the resource. If natural recharge of the resource does not compensate this loss, well productivity will decrease along with the pressure of the reservoir78. Additional sources of water may be needed for vapor dominated systems to mine the heat from the reservoir and maintain generation. Appropriate reservoir assessment and management is essential to maintain production capacity. Other resource characteristics (e.g. resource permeability, brine enthalpy and scaling potential.) may also affect individual well production declines. Interview of geothermal developers revealed that annual make-up drilling costs approximately correspond to 5% of the initial drilling costs79. Considering that initial drilling costs average $900/kW (cost range: 600-1200$/kW) and that the remaining steam field maintenance costs correspond to an additional 2% of initial drilling costs annually, total annual steam field maintenance costs correspond to $8/MWh. Consequently, total O&M costs are expected to average 2.4 ¢/kWh. (i.e. operation cost: 7$/MWh, power plant maintenance: 9$/MWh and, steam field maintenance & make-up drilling costs: 8 $/MWh) This figure is slightly higher than typical O&M cost figures found in the literature, but, as explained above, O&M costs are fairly variable and depend on the size of the power plant as well as various resource and site-specific characteristics. Some authors therefore prefer to give O&M cost ranges rather than precise values. The following table provides representative O&M cost values and ranges found in the literature. Table 8: O&M costs value and ranges (Inflation adjusted $/MWh). Source: O&M Cost Sanyal (2004) 14 - 20* Owens (2002) 18 - 21 EPRI (2001) [16 - 27] Lovekin (2000) 20 - 22 http://www.eere.energy.gov/geothermal/faqs.html [10 - 30] http://www.saintmarys.edu [15 - 45]
* These values do not include well make-up drilling costs. Other articles present O&M cost figures ranging from 9 to 13 $/MWh but are thought to exclude make-up drilling costs. Since the size of the power plant is an important parameter affecting O&M costs, Sanyal (2004) estimated and modeled this effect for power plants capacities ranging from 5 to 150 MW. The relationship obtained is exponential: O&M costs = 2e-0.0025(P-5) (P 78 This pressure drop phenomenon has been experienced at The Geysers. In order to compensate this water loss, initiatives have been taken to inject additional water into the resource (i.e. Lake County and Santa Rosa waste water pipelines). 79 Well productivity decline rates and thus make-up drilling costs are highly resource specific. EPRI (2001) estimated that total steam field maintenance costs correspond to 10% of initial steam field development costs annually, but considered very conservative field development costs (i.e. $320 - $747/kW installed).
41

representing the power production capacity of the power plant). Sanyal's values appearing in the Table 8 correspond to 150 and 5 MW projects respectively. Similarly, the two values provided by Lovekin (2000) correspond to power systems of 90 and 30 MW respectively. O&M costs are not constant during the lifetime of the power plant. Values appearing in Table 7 are average O&M cost figures for the entire lifetime of the power plant. During the first years of operation, O&M costs are expected to be relatively low but climb progressively as equipment ages and needs more maintenance or replacement. On the other hand, Sanyal (2004) estimates that make-up drilling activities should be pursued for at least ten years to keep the power plant at maximal capacity80 but argues that the economic relevancy of pursuing this activity after that period depends on the resource potential, the expected lifetime of the project and the power sale conditions. Some analyses also provide distinct O&M cost values for steam and binary technologies. Steam plants are usually considered to have slightly higher O&M costs than binary systems. In the table above, this is illustrated by the values provided by Owens (2002). Very few articles provide detailed analyses of O&M cost components. Precise breakdown of O&M costs and further understanding of parameters influencing them is therefore a difficult task. Cooley (1997) provides an informal survey of operators of The Geysers that classifies and provides variability ranges for power plant operational costs. (see Table 9). Until 1999, The Geyser's power plants and steam field were managed by different companies. Power plant O&M costs presented in this table thus include steam costs as a distinct "fuel" cost. These steam costs include all costs related to steam production (i.e. payoff for initial drilling costs and field gathering system, steamfield O&M and make-up drilling as well as overhead costs of the resource producing company). Currently, most geothermal operators manage both the power plant and the steam field. In this analysis, initial steamfield investments (i.e. initial wells, steam gathering system, roads, etc.) are considered to be capital costs and their amortization is excluded from O&M costs81. Table 9: Components and variability of Operating cost of geothermal power plants Cost category % of total O&M expenses Labor 8 - 32 % Steam 42 - 74 % Chemical 1 - 15 % Other/Miscellaneous 6 - 41 %
Source: Cooley D. "Making the Operation of a Geothermal Power Plant Cost Competitive", Geothermal Resources Council Transacions, Vol 21, Sept/Oct 1997.
80 Maximal capacity corresponds to the maximum efficiency of the power system and thus to minimal production costs. 81 Since royalties are calculated on the value of steam, geothermal power producers are still expected to have precise cost breakdown for steam production.
42

According to Tom Box (Calpine) variable operation costs (i.e. chemicals, waste disposal, royalties, etc.) of The Geysers power plants represent 25-30% of total O&M costs.
3. Royalties and Taxes Royalties correspond to payments the power producers are required to make to the owners of the geothermal resource. Exact royalty values are difficult to provide since terms and conditions of geothermal leases vary, notably according to the resource owner (private vs. government). When power plants and steam fields were managed by distinct companies, the value of royalties was calculated as a percentage of the value of steam used to produce power. Nowadays, since most geothermal power producers are operating both the power plant and the steam field, the value of the royalties is usually calculated as a percentage of the revenue obtained from the power sale. Royalty values range from 0.5 to 5.5 % from gross proceeds (i.e. price of power) and typically account for 10 to 15 % of O&M costs. Effective royalty rates however vary annually according to power prices. For 2004, the Bureau of Land Management (BLM) and the Mineral Management Service (MMS) estimated that the effective royalty rate of flash, dry-steam and binary power plants corresponded to 5.32 %, 4.73 % and 0.63 % respectively. Globally, the "average effective royalty rate" paid by geothermal power producers in 2004 for leases concerning resources located on federal land was 3.94%82. Geothermal power producers also contribute to government budgets through different kinds of taxes: - Property taxes are based on the estimated value of the company assets. Tax rules may be different from one jurisdiction to another. - Federal and State income taxes are calculated upon the net revenue of the company. Rules may vary from one state to another and their amount will vary according to the company structure and annual profits) - Sales taxes paid on consumables and services will depend on the amount and value of goods needed for O&M (which varies with the technologies used) and will also vary from one state to another.
4. Conclusions Each power plant has specific O&M costs that depend on the quality and design of the power plant, the characteristics of the geothermal resource, the environmental regulations and requirements applicable to the site, and the structure and efficiency of the company. Major parameters affecting O&M cost are related to the plant labor requirement, the amount of chemicals and other consumables used during operation, the extent of make-up drilling requirements, and the cost of the equipment that has to be replaced throughout the years. The variability of many of these cost components is also related to trade-offs that may apply between initial capital cost and O&M costs. Improved power plant design
82 The royalty ranges provided above were provided by BLM and MMS to the Royalty Policy Committee for the “Geothermal Valuation Subcommittee Report” that was published in May 2005.
43
and adequate material choice during the power plant construction are expected to significantly decrease O&M costs. Since design and material quality parameters also impact initial capital investment, their effect on both capital and O&M costs should be evaluated and result in choices that minimize total production costs (capital and O&M) during the entire expected lifetime of the power plant. Some of these trade-offs might explain part of the O&M cost variability encountered in the literature. It is also important to keep in mind that O&M costs always rise throughout the lifetime of the power plant and that average O&M cost values hide this reality. Note: Companies usually consider make-up drilling as a capital expense. This analysis considers them as O&M costs since make-up drilling is considered to maintain the full production capacity of the power plants.
44

C. Conclusions This entire analysis shows how variable most cost components of geothermal projects are. With regard to capital costs, the site and resource characteristics (e.g. site geology, access, spread and weather conditions, resource temperature, chemistry and depth, etc.) are the most important factors affecting geothermal power development costs. The project size and type (greenfield vs. expansion) will also impact capital costs since significant economies of scale apply to large projects and substantial savings occur during many development phases of already well known resources supporting existing geothermal power plants. Market parameters also have a significant impact on the cost of the project. These impacts are particularly important for the drilling and power plant construction phase. Strong demand for drilling services or construction materials drives prices up and translates into higher project costs. It is therefore important to make a clear distinction between the cost parameters affected by market prices (volatile cost components: e.g. steel prices, drilling services, etc.) and those independent from market prices (e.g. resource characteristics, technology evolutions, etc.) Chapter four described the impact of financial conditions and parameters on major cost components and development phases, notably through the cost of borrowing money. This impact is particularly strong for the exploration and confirmation phases financed with equity but also applies to the more cost intensive site development phase. Financial parameter will also determine the cost of any time delay. Additionally, the perceived risk of exploration activities is such that venture capital investors ask for high rates of return. As a result, very few developers actually spend money on unsubsidized exploration programs. The cost of money also influences the amount of money the developer is willing to spend on power plant design and construction material, even though saving money on both these issues may result in higher O&M costs. Small developers also typically struggle to gather the amount of capital require to develop the entire project. Capital constraints and high interest rates may thus favor the construction of a less carefully designed power plant built with less expensive and inappropriate construction materials in order to reduce the initial capital investment. Most parameters affecting capital costs also impact O&M costs. The geothermal resource characteristics and the project's size both impact O&M. Particularly important economies of scales apply to the workforce requirement of large power plants. The chemical composition of the geothermal brine (e.g. NCG, scaling, corrosion, etc.) and the depth of the resource (which influences make-up drilling costs) significantly impact O&M costs. Similar to capital costs, consumable goods and subcontracted service costs vary according to market conditions. The quality of the power plant design and construction material is another parameter that explains the variability of O&M costs among projects.
45

Trade-offs between initial capital costs and later O&M costs are an important issue and may be explained by (1) the cost of capital83 and (2) the time perspective of the power plant designer and developer. During the industry's initial development steps, trade-offs may also have resulted from (3) uncertainty about the capacity of the resource to sustain production over a long period of time (e.g. reservoir's behavior, size, energy and water content, difficult brine conditions, etc.) Another important factor that will affect the cost of power is the "capacity factor" (CF) of the power plant. The capacity factor of geothermal power plants corresponds to the ratio between the amount of energy actually delivered to the grid and the potential energy that it could have delivered during the period of time considered84. Geothermal plants typically have a CF around 90%85, which is higher than most other power production technology. This means that geothermal power plants typically deliver power at full capacity during 90% of the time, while outages (planned and unplanned events) prohibit power delivery during the remaining time. The capacity factor will determine the quantity of electricity produced and thus the amount of kWh on which all power production costs (i.e. Capital Costs & O&M costs) will be spread out. Given its extraordinary reliability, geothermal power is considered to be an ideal source of baseload power. This advantage, along with the remarkable price stability of geothermal power86, makes geothermal power highly valuable as a price stabilizer which buffers the dependency and thus high volatility of power markets against fossil fuel prices. Further exploration and development of geothermal resources is an important issue for the U.S. energy mix. It will allow geothermal developers and power producers to improve their ability to find, develop, and deal with resources that may be more difficult to discover or exploit, notably through the development and use of advanced technologies. Constant growth of the industry will also rebuild a reliable network of suppliers able to deliver quality goods and services to the industry. This will result in lower development costs as well as less uncertainty about the most likely costs of new projects. Constant industry growth will offer further opportunity for cost reduction through “learning effects” and enable senior experts to transmit their knowledge to young professionals. Unfortunately, the evolution of the industry during the last decade did not result in much hiring and many highly experienced experts are approaching retirement age. Should their experience not be transmitted to future generations, the U.S. geothermal industry would lose an important part of its valuable assets. This issue is already expected to increase the cost of current geothermal projects but may have a much larger impact in the future.
83 When the cost of money is high, it may be more economical to borrow a minimal amount of capital even if this implies higher O&M costs. The economic optimum between capital investments and O&M cost evolves with (financial) market conditions and the experience acquired by the industry. 84 The power plant installed capacity (MW) is the reference for the potential power delivery calculations (MWh) and the period of time considered is typically one year (8760 hours). 85 New geothermal power plants are considered to have a CF around 95% and some geothermal facilities deliver power 98% of the time (i.e. CF = 98%). 86 Geothermal power plants do not need external fuel to operate. Once the power project is built, most of its power production costs are known and extremely few market parameters can modify them. Market prices can only impact labor and consumables costs which are minor components of the power cost.
46
Long-term power purchase agreements (PPA) are essential instruments that allow geothermal developers to overcome the risk of power price fluctuations. They help prevent project failure (bankruptcy) when energy prices are falling and guarantee power supply at a reasonable price when fossil fuel prices rise excessively. Once the PPA expires, power production costs typically fall 50%87 since the debt is reimbursed and the capital cost of the power plant is amortized. The power plant then has a second lifetime where the geothermal power producer may either look for another PPA that covers the expected remaining lifetime of the power plant or sell its power competitively on the electric market. Because geothermal development costs must be appraised on a case-by-case basis, and since future prospects may concern resources more difficult to find or use, it appears more appropriate to see future geothermal development costs as a dynamic evolution of various parameters. Research and development along with experience will lead to further cost reductions. These may however be balanced by market price evolution and/or more challenging resource characteristics. It thus appears more appropriate to speak about geothermal costs in terms of a certain quantity of geothermal power that can be developed economically at a certain power price (i.e. a geothermal supply curve). Should the low-end of the capital cost range of future geothermal power projects be around $2800 per kW installed, the analysis provided in Appendix F suggests that corresponding minimal power production cost would be around 5.7 ¢/kWh. Since each geothermal resource is unique, it is however far more accurate to consider geothermal costs on a case-by-case basis. Appendix G provides a matrix highlighting the most important factors affecting the cost of geothermal power production according to the different geothermal development phases. Typical cost breakdown presented in this matrix is summarized in figure 3. However, emphasis should be put on the variability of each cost component and its related range of values rather than on the average cost value provided for each component. Low development costs are associated with optimal site and resource characteristics, as well as favorable market conditions. Economic viability of projects with higher development costs and associated cost ranges are directly related to the price of power. Given today’s technology and economic conditions, participants88 to a workshop organized by GEA on July 25, 2005 at University of Nevada, Reno, to review existing cost data for geothermal development agreed that minimal capital costs for new greenfield projects averaged $3000 per kW installed. Project expansions could have slightly lower capital costs but most projects currently under development have estimated capital costs between $3000 and $3500/kW. This suggests that the cost of geothermal power projects rose sharply during the last few years. The current high prices of raw materials explain part of this increase, but in-depth
87 According to Renewable Northwest Project (www.rnp.org): "Geothermal plants are relatively capital-intensive, with low variable costs and no fuel costs. Usually financing is structured so that the project pays back its capital costs in the first 15-20 years, delivering power at 5-10¢/kWh. Costs then fall by 50-70 percent, to cover just operations and maintenance for the remaining 15-30 years that the facility operates". 88 Workshop attendance was composed of 26 geothermal experts, including most geothermal developers, research organizations and major government officials.
47

study of the existing literature also suggests that the lack of new development during the last decade prevented regular updates of construction cost estimates and led to the use of optimistic cost reduction assumptions. Decreasing government support and abundance of cheap fossil fuels (particularly natural gas) undercut the development of geothermal power plants during the last thirteen years. Today, soaring oil prices and recently adopted government incentives restore an economically viable framework for geothermal development. Environmental awareness and government support initiatives (green certificates, renewable portfolio standard and tax credits, etc.) are powerful instruments that will help overcome the current level of raw material prices. Changes in the legislative framework directing geothermal development (e.g. lease access provisions, permitting procedures, exploration support initiatives, guarantees to access venture capital, etc.) would however further favor the development of this clean and renewable energy source. Figure 3: Typical cost breakdown of geothermal power projects.
Exploration (5%)
Confirmation (5%)
permitting (1%)
drilling (23%)
steam gathering(7%)power plant (54%)
transmission (4%)
As outlined in the introduction of this document, serious gaps existed between cost figures appearing in the literature and cost values provided by developers. Despite articles claiming competitiveness of geothermal power with the least expensive fossil-fuel technologies, the lack of industry growth highlighted this problem and confirmed the age and/or inaccuracy of traditionally accepted cost data. Updating this information was the prime objective of this analysis. A couple of very recently published articles confirm this report’s findings. This study also aimed to extend the scope of the cost discussion to include resources that constitute most of the growth opportunities of the geothermal industry (i.e. undiscovered resources, greenfield projects, resources more difficult/costly to develop). Analyzing geothermal costs is a long and difficult process. The industry typically provides information expressed in a way that is not comparable to published data and, although most existing studies use similar notions to qualify cost components, they typically give them different meanings or definitions. The notion of capital cost is a good example of this. The scope of the cost components included in the capital cost definition
48

is quite variable and, in most cases, unclear. Similarly, few studies detail the assumptions underpinning the cost analysis. Cost articles used to focus on projects likely to be built despite very competitive conditions and thus described the least expensive expansion-type projects. This led to widely accepted low capital cost figures excluding any cost components specific to difficult brine or drilling characteristics or related to greenfield projects. Future studies should thus develop a standardized methodology that breaks cost down in well defined cost-categories encompassing all possible geothermal power technologies and resource type. A major distinction is made between binary and steam power systems but additional breakdowns should be made between technologies applying to flash, dry-steam, and hypersaline resources. Given the variability of drilling costs, an additional classification may sort resources according to geological characteristics. Up-to-date cost information is often site-specific and tends to be held proprietary by researchers and consultants. As a result, governmental research funds tend to be absorbed by a small network of consultants, typically working on very specific issues and reluctant to share their information89. Few articles thus address geothermal development costs in a comprehensive way and those tend to be based on out-dated data. Companies willing to help improve the quality of publicly available cost data have recently been harassed by different research groups looking for similar information. Upcoming government research contracts should thus look for a better collaboration between research teams to reduce the burden on companies. Government agencies should also ensure that each project results in publicly available reports using transparent data gathering and processing methodologies. Articles dealing with general cost figures should always provide variability ranges reflecting the variability of power projects or clearly state the assumptions and limits of the study. Gathering cost information documenting the variability of geothermal projects and resources is however a difficult task since major geothermal power producers deal with very different resources and some are reluctant to provide any kind of cost information. Current and accurate information about costs and parameters affecting costs of geothermal power development is essential to help governmental agencies implement appropriate policies. It is also needed to prioritize the focus of future research projects. Geothermal developers still face a series of technological challenges and scarce research funds need to be allocated to research projects susceptible to bring the most significant cost reductions. Research trade-offs and priorities thus vary according to the evolution of individual cost components. The United States has tremendous geothermal resources but still needs dynamic research programs to ensure that future geothermal development includes resources more difficult to find or to deal with.
89 Part of this information was obtained from companies with confidentiality agreements.
49

Bibliography:
Bloomquist G. in "Economics and Financing", Geothermal Energy (UNESCO), Chapter 9. M.H. Dickson and M. Fanelli. 2002. Brugman J., Hattar M., Nichols K., Esaki Y., "Next Generation of Geothermal Power Plants", Electric Power Research Institute, 1996 California Energy Commission, "Renewable Resources Development Report", September 30, 2003. California Energy Commission, "Comparative Cost of California Central Station Electricity Generation Technologies", June 5, 2003. California Energy Commission, "Comparative Study of Transmission Alternatives - Background Report", June 2004. Cooley D. "Making the Operation of a Geothermal Power Plant Cost Competitive", Geothermal Resources Council Transactions, Vol. 21, Sept/Oct. 1997. Delene J. & all "An Assessment of the Economics of Future Electric Power Generation Options and the Implications for Fusion", Oak Ridge National Laboratory, 1999. Entingh D. & McVeigh J. "Historical Improvements in Geothermal Power System Costs" Geothermal Resources Council Transactions, Vol. 27, Oct. 2003, pp 533-537. Entingh D. & McVeigh J. "Geothermal Power Capital Cost Improvements since 1985" Princeton Energy Resources International, May 2003. DiPippo R. "Small Geothermal Power Plants Design, Performance and Economics", Geo-Heat Center Bulletin, June 1999. Falcone D. "Financing Geothermal Projects", International Renewable Energy Conference, Honolulu, Sept. 1988. Forsha M. & Nichols K. "Factors affecting the Capital Cost of Binary Power Plants", Barber-Nichols Inc., Hiriart G. & Andaluz J. "Strategies and economics of geothermal Power Development in Mexico", World Geothermal Congress, Japan, June 2000. Klein C.W., Lovekin J.W., S.K. Sanyal, "New Geothermal Site Identification and Qualification" GeothermEx, Inc. 2004. Kutscher Ch. "The Status and Future of Geothermal Electric Power", National Renewable Energy Laboratory, August 2000.
- 1 -

Liebowitz H. & Markus D. "Economic Performance of Geothermal Power Plants using the Kalina Cycle Technology", Geothermal Resources Council Transactions, Vol. 14, August 1990. Lovekin J. "The economics of sustainable geothermal development", World Geothermal Congress, Japan, June 2000. Mansure A & Carson C. "Geothermal Completion Technology Life-Cycle Cost Model (GEOCOM)”, Geothermal Resources Council Transactions, Vol. 6, October 1982. Meidav T. "Export Potential of Geothermal Technology", National Geothermal Association, 1993. Moscatelli G. & Sormani G. "A New Generation of Low Cost High Performance Steam Turbines for Geothermal Applications" Geothermal Resources Council Transactions, Vol. 22, September 1998. Murphy H. & Niitsuma H. "Strategies for compensating for higher costs of geothermal electricity with environmental benefits", Geothermics 28 (1991) 693-711. Nielson D., "Competitive economics of Geothermal Energy: The Exploration and Development Perspective", University of Utah, 1989. Owens B. "An Economic Valuation of a Geothermal Production Tax Credit", National Renewable Energy Laboratory, April 2002. Owens B. "Financing Wind", PR&C Renewable Power Service: RPS-4, March 2004. Owens B. "Does the PTC Work?", PR&C Renewable Power Service: RPS-5, July 2004. Sanyal S. "Cost of Geothermal Power and Factors that affect it", GeothermEx, 2004. Sifford A. & Beale K "Economic Impacts of geothermal Power Development in Harney County, Oregon", Geothermal Resources Council Transactions, Vol. 15, Oct. 1991. Simons G., Peterson T. & Poore R. "California Renewable Technology Market and Benefits Assessment", Electric Power Research Institute, 2001 Sison-Lebrilla E. & Tianco V. "Geothermal Strategic Value Analysis” California Energy Commission, June 2005. Stefansson V. "Investment cost for geothermal power plants", Geothermics 31, pp 263-272, 2002.
- 2 -

Thorhallsson S. & Ragnarssson A. "What is Geothermal Steam Worth?", Geothermics, Vol. 21 No5/6, pp 901-915, 1992. US Department of Energy - Office of Power Technologies and the Electric Power Research Institute, "Renewable Energy Technology Characterizations", 1997 "United States Geothermal Technology - Equipment and Services for Worldwide Applications", DOE/EE-0044 , 1995. Websites: The Bureau of Labor Statistics: http://www.bls.gov and http://data.bls.gov The World Bank: http://www.worldbank.org/html/fpd/energy/geothermal/ Steel prices: http://www.meps.co.uk www.usatoday.com/money/industries/manufacturing/2004-02-20-steel_x.htm www.china.org.cn/english/BAT/89869htm US Department of Energy - Energy Efficiency and Renewable Energy: http://www.eere.energy.gov/power/techchar.html
"Renewable Energy Technology Characterizations", U.S.DOE-EPRI, 1997 The Renewable Energy Policy Project: http://solstice.crest.org/articles/static/1/binaries/geothermal_issue_brief.pdf
"Geothermal Energy for Electric Power", Renewable Energy Policy Project, December 2003.
The Renewable Northwest Project: http://rnp.org/RenewTech/tech_geo.html The Idaho National Energy Laboratory: http://www.inel.gov/ The National Renewable Energy Laboratory: http://www.nrel.gov/ The Geothermal Resources Council: http://www.geothermal.org/ US Geothermal: http://www.usgeothermal.com/
- 3 -

APPENDIX A: EXPLORATION PROGRAM COMPONENTS AND UNIT COST.
Table A.1: Exploration Program Components and Unit Costs Method unit Cost per unit Administration project 10 % of total exploration costs Drilling : ID slim hole foot 140 Drilling : ID Slim hole: roads and pads well 50.000 Drilling : ID Slim hole: temperature logs well 5000 Drilling : TG hole(s) foot 15 Geochemistry survey project 30.000 Geology: field mapping project 20.000 Geophysical survey: gravity project 25.000 Geophysical: ground magnetics project 12.500 Geophysical survey: MT or DC resistivity project 200.000 Other project 10.000 Reporting document project 10 % of total exploration costs Well Test: ID Slim hole, 3-10 days well 40.000 Source: GeothermEx, "New Geothermal Site Identification and Qualification" (Table IV-1), 2004. Geophysical surveys may also include a seismic survey. Further insight concerning this technology is provided by B. Honjas, CEO of Optim: "Seismic surveys can be performed to produce either two-dimensional (2D) or three-dimensional (3D) subsurface images revealing both the geologic and structural (tectonic) setting of a geothermal prospect. The estimated cost of building an extended 2D (pseudo-3D) seismic structural model of a geothermal prospect encompassing nine square miles to a depth of 8,000 feet is about $175,00090, which should accommodate a typical 30 MW project. Seismic imaging has been demonstrated to both decrease the risk associated with drilling and also to enhance understanding of field production once the geothermal power plant is on-line. It is the only geophysical method that can provide high resolution drill targets at greater depths. For this reason, seismic is the primary exploration tool for petroleum exploration, having been cited as the single most important technical factor contributing the relative low cost and wide-spread availability of oil and gas in the world today, even exceeding advances in drilling technology (Brunck, 2002)91. As with petroleum exploration seismic surveys do not directly reveal the location of fluids but reveal subsurface structure that may trap, channel and/or control the flow of fluids in the subsurface. This information provides geologists, geophysicists, and engineers with the insight necessary to make intelligent decisions as to where to locate exploration drill hole, to understand the “plumbing”, or mechanics, of a geothermal field in order to enhance production and for determining the potential size of the resource. Primary factors affecting the cost of a seismic survey include the remoteness of the prospect (mobilization of equipment), the data acquisition parameters of the survey (required depth and resolution in order to meet project goals and the advanced data processing techniques required to image structures within complex geologic environments." 90 2D (vs. 3D) seismic survey usually cost about $10,000 (vs. $40.000) per square mile. 91 Brunck, R., 2002: Role of the service industry in bringing innovation into practice, First Break, Vol. 20. No. 7, pages 444-446.
- 4 -

APPENDIX B: CONFIRMATION PROGRAM COMPONENTS AND UNIT COST. Table B.1: Confirmation Program Components and Unit Costs Method unit Cost per unit Administration project 7.5 % of total confirmation costs Drilling : "Full" Diameter Hole foot Cost = 0.019*(depth)^2 +
210*(depth) +240,785 Drilling : Hole Productivity °F MW/well = (brine Temp)/50-3.5 Drilling : Unsuccessful Hole Factor % 40% (60% of successful wells) Other project 20,000 Regulatory Compliance project 5% of Drilling Reporting Document project 5% of Drilling Well Test: Full Diameter Hole, 3-10 days well 70,000 Well Test: multi-well field test, 15-30 days project 100,000 Source: GeothermEx, "New Geothermal Site Identification and Qualification" (Table IV-), 2004.
APPENDIX C : ECONOMIES OF SCALE. According to the Sanyal (2004), capital cost varies with project size according to the following equation: CC=2500e-0.0025(P-5) CC representing the Capital Costs and P the power capacity of the system.
Capacity Capital Cost 5 2500
20 2411 34 2325 49 2242 63 2163 78 2086 92 2011
107 1940 121 1871 136 1804 150 1740
1500170019002100230025002700
5 55 105
Plant Capacity
Spe
cific
Cos
t
Compared to the data displayed in the above table and chart, current capital cost estimates suggest a 33% cost increase for a 50 MW power project.
- 5 -

APPENDIX D: OUTPUT VARIATION OF AIR-COOLED BINARY POWER SYSTEMS.
Air-cooled binary power plants located in desert areas typically present important power output variations. Figure 1 displays typical seasonal (monthly) and diurnal output fluctuation expected throughout the year. The line represents the average monthly power output while the variation bars show how the power output will vary according to the hour of the day. Maximum power delivery typically takes place during the coolest hours of the day while the lower power production happens during the hottest hours of the day.
10.0
12.0
14.0
16.0
18.0
20.0
22.0
24.0
26.0
28.0
Jan Feb March April May June July Aug Sept Oct Nov Dec
Source: ORMAT: Estimated power output variation of a 20 MW air-cooled binary power plant. As a result, the widest diurnal output variations occur during the summer time when day and night temperatures vary significantly. These output variation may reach 24% on either sides of the average output value (i.e. less than 12 MW and over 18 MW for an average monthly output of 15 MW). Throughout the year, the average monthly power plant production is also directly related to the outside air temperature and humidity. Winter months are thus characterized by significantly higher power production than summer months. Should the annual average power output be 20MW, the monthly average will vary from 15 MW during the hottest month of the year to 24 MW during the coolest month of the year. This corresponds to seasonal power output fluctuation of 20-25%. Extreme values: The lowest output value is thus expected to be close to 11.5 MW while the higher output value is estimated to average 26.5 MW. These values respectively correspond to 58 % and 133 % of the 20 MW average annual power output value. Weather conditions are thus expected to induce a 42% power production decrease in the hottest summer days and a 33% power output increase during the coolest winter days.
- 6 -

APPENDIX E: CAPITAL COSTS. Table 4: Capital Cost of Power Facilities for different Technologies Single Flash 872 Stefansson (2002) Single Flash 970 Stefansson (2002) Single Flash 1039 Stefansson (2002) Single Flash 1040 Entingh & McVeigh (2003) Single Flash 1047 Stefansson (2002) Single Flash 1150 Stefansson (2002) Single Flash 1837 Wheble & Islam (1995) Single Flash 1938 Wheble & Islam (1995) Single Flash Average 1236.6 Dual Flash 1166 Tianco & Others (1996) Dual Flash 1170 Entingh & McVeigh (2003) Dual Flash 1546 Tianco & Others (1996) Dual Flash Average 1294 Flash 1564 Owens (2002) Flash 2270 Jenkins & Others (1996) Total Flash average 1475.6non specified 2012 Miller (1996) non specified 2513 Miller (1996) Binary 1372 Owens (2002) Binary 1560 Entingh & McVeigh (2003) Binary 1836 Tianco & Others (1996) Binary 1940 Tianco & Others (1996) Binary 3372 Gawlik & Kutscher (2000) Binary 3475 Jenkins & Others (1996) Binary Average 2259.2 All Technologies Total Average 1699.5
Source: GeothermEx, "New Geothermal Site Identification and Qualification", 2004.
Cost breakdown:
Unit: % of total project cost Explo-ration
Well drilling
Field piping
Power Plant
Enthing & McVeigh (2003) 10 25 5 60 World Bank 10 33 57 Valgurdur 9 23 68 CEC (2003) Flash 3 34 63 EPRI (1997) Flash 8 38 3 51 Kutscher (2000) Flash 48 52 CEC (2003) Binary 4 43 53 EPRI (1997) Binary 4 13 2 81 Kutscher (2000) Binary 24 76 Lesser (1993) 39 61
- 7 -

APPENDIX F: COST OF MONEY: INTERESTS RATES VS. TIME. Impact of debt length on annuity payment: The amount of interests paid is directly related to the length of the debt period. Considering constant annuities, the share of interest in the total amount to be paid back thus increases as the debt length increases. The following table displays the value of annuities (i.e. periodic principal and interest payment) according to the debt period considered. Table E.1: Impact of debt length on annuity value and relative interest paid. Capital Cost 10 years 15 years 20 years 25 years 30 years 1400 $/kW 228 184 164 154 149 2400 $/kW 391 316 282 264 255 3400$/kW 553 447 399 375 360 Interest share* 39% 49% 57% 64% 69% * The percentage value in the "interest share" line shows the share that interest payments represent in the total amount reimbursed. For example, if the debt period is 10 years and capital cost: 2400$/kW, the total amount paid back over the years is 10 x 391 = $3910. This amount may be broken down into the initial capital costs reimbursement ($2400) and the value of the interest paid over the years ($1510). The interest share line shows the ratio between the total amount of interest ($1510) and the total amount paid in annuities ($3910), i.e. 39%. If the debt period becomes 30 years, the developer will pay $255 annually during 30 years (i.e. $7650) which may be broken down into $2400 for the principal reimbursement and $5250 for interests. The ratio then becomes 5250/7650 = 69%. Impact of debt length and interest rate on annuity payment: The following table illustrates the variability of annuity values for a 2400$/kW capital investment according to various interest rates and debt periods. Table E.2: Evolution of the annuity value according to the interest rate and debt length. * Debt Length (years) Interest Rate 10 15 20 25 30
9 % 374 298 263 244 234 10 % 391 316 282 264 255 11 % 408 334 301 285 276
* Values in this table assuming a capital cost of 2400$/kW The levelized cost of capital investment (LCCI) value is obtained by dividing the value of the annuity (related to a specific capital cost, debt period, and interest rate) by the amount of power produced during that period by 1 kW (i.e. 1kW x 24hours x 365days x 0.9 (Capacity Factor) = 7884 kWh, if the annuity is paid annually). Assuming a capital cost of 2400$/kW, a debt period of 20 years and an interest rate of 10%, the LCCI correspond to $282 divided by 7884 kWh or 3.5 ¢/kWh. O&M cost have to be added to this value to obtain the actual cost of power production.
- 8 -

Figures E.1 and E.2 display charts illustrating the growing burden of interest rates as debt length grow. Figure E.1: Principal and Interest Share in Annuity payment (Debt: 10 years, Capital Cost: 2400$/kW, Interest Rate: 10%)
$0.00
$50.00
$100.00
$150.00
$200.00
$250.00
$300.00
$350.00
$400.00
$450.00
1 2 3 4 5 6 7 8 9 10
Debt length (years)
Ann
uity
Pay
men
t
interetsprincipal
Figure E.2: Principal and Interest Share in Annuity payment (Debt: 30 years, Capital Cost: 2400$/kW, Interest Rate: 10%)
$0.00
$50.00
$100.00
$150.00
$200.00
$250.00
$300.00
1 4 7 10 13 16 19 22 25 28
Length of Debt (years)
Ann
uity
Pay
men
t
interetsprincipal
- 9 -

Debt Service Coverage Ratio and Return on Investment constraints Assuming fix Debt Service Coverage Ratio (DSCR) and Return on Investment (ROI) constraints, B. Owens (2002) states that the minimum cost/price of geothermal power correspond to the optimal capital structure that minimizes the levelized cost of energy (LCOE) for both constraints. The ROI constraint requires that the minimum LCOE increases as the percentage of equities in the capital structure increases due to a higher rate of return of equities. Conversely, the DSCR, a constraint that require the developer to have revenue exceeding the annuity payment by a certain ratio (usually around 1.5 for geothermal projects), settle the minimum price of power the developer has to obtain. Figure E.3: Impact of DSCR and ROI constraints on minimal cost/price of power.
0
0.01
0.02
0.03
0.04
0.05
0.06
0.07
1 0.9 0.8 0.7 0.6 0.5 0.4 0.3 0.2 0.1 0
Debt percentage in Capital Structure
LCO
E ($
/kW
h)
DSCR constraint Annuity portion related to debtROI constraint Annuity portion related to Equity
Assumptions for the above chart: Capital costs: 2112$/kW Debt interest rate: 6.5% Equities' rate of return: 17% Debt period: 10 years These assumptions correspond to a minimal cost of power of 4.4¢/kWh and correspond to a capital structure of about 68% debt, 32% equity. Should the capital costs be $2800 per kW installed, the minimum cost of power becomes 5.74 ¢/kWh and correspond to a capital structure composed of slightly lower than 70% debt.
- 10 -
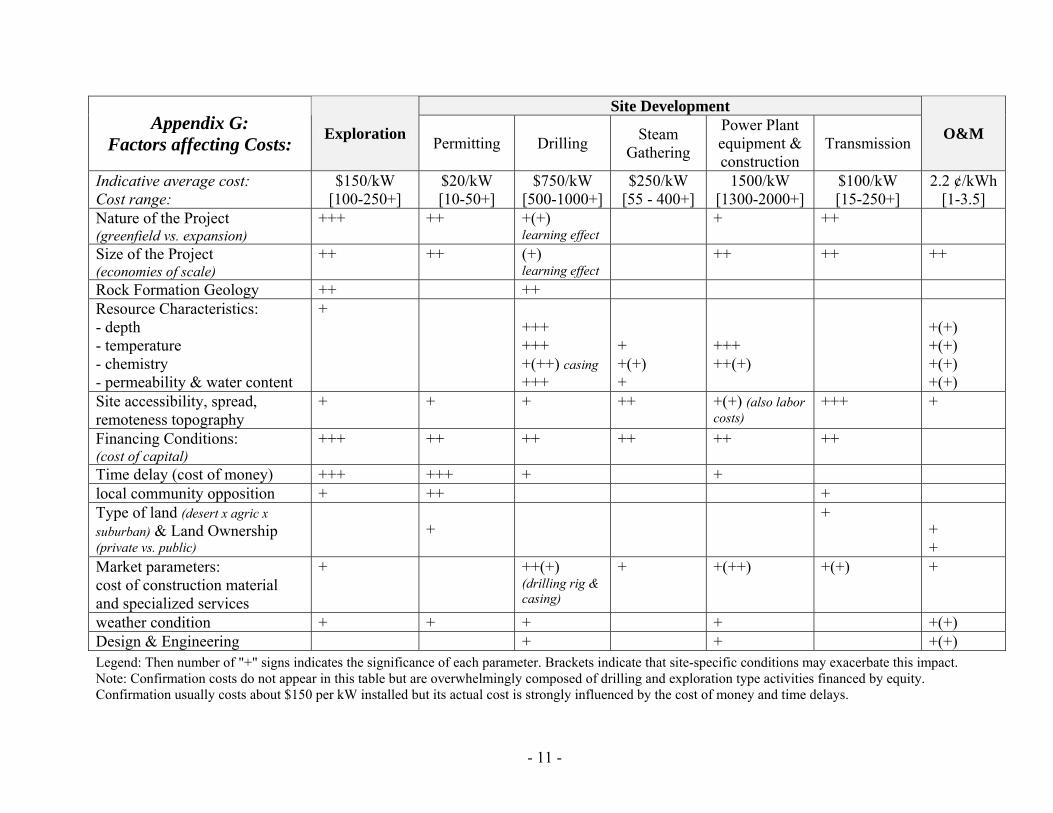
Site Development Appendix G:
Factors affecting Costs: Exploration Permitting Drilling Steam Gathering
Power Plant equipment & construction
Transmission O&M
Indicative average cost: Cost range:
$150/kW [100-250+]
$20/kW [10-50+]
$750/kW [500-1000+]
$250/kW [55 - 400+]
1500/kW [1300-2000+]
$100/kW [15-250+]
2.2 ¢/kWh [1-3.5]
Nature of the Project (greenfield vs. expansion)
+++ ++ +(+) learning effect
+ ++
Size of the Project (economies of scale)
++ ++ (+) learning effect
++ ++ ++
Rock Formation Geology ++ ++ Resource Characteristics: - depth - temperature - chemistry - permeability & water content
+ +++ +++ +(++) casing +++
+ +(+) +
+++ ++(+)
+(+) +(+) +(+) +(+)
Site accessibility, spread, remoteness topography
+ + + ++ +(+) (also labor costs)
+++ +
Financing Conditions: (cost of capital)
+++ ++ ++ ++ ++ ++
Time delay (cost of money) +++ +++ + + local community opposition + ++ +Type of land (desert x agric x suburban) & Land Ownership (private vs. public)
+
+ + +
Market parameters: cost of construction material and specialized services
+
++(+)(drilling rig & casing)
+ +(++) +(+) +
weather condition + + + + +(+) Design & Engineering + + +(+)
Legend: Then number of "+" signs indicates the significance of each parameter. Brackets indicate that site-specific conditions may exacerbate this impact. Note: Confirmation costs do not appear in this table but are overwhelmingly composed of drilling and exploration type activities financed by equity. Confirmation usually costs about $150 per kW installed but its actual cost is strongly influenced by the cost of money and time delays.
- 11 -

Glossary: Production well: A production well is a well drilled through a geothermal resource that produces geothermal brine. Injection well: Injection wells inject the brine back into the reservoir after using it in the power production process. Geophysical survey; Geophysical methodologies used during the exploration and drilling phases to locate the resource and identify the best suited sites to drill production wells. These may include gravity surveys, ground magnetic surveys, magnetotelluric surveys, electrical resistivity surveys, and seismic surveys. Temperature gradient hole: A temperature gradient hole is a relatively slim and shallow hole (50-600 feet deep) that aims to estimate the rate of increase of ground temperature with depth. Slim-hole: Slim-holes are small diameter wells drilled during the exploration phase in order to verify the existence of a productive geothermal resource and provide information about the geologic structure of the site. Such holes are sometimes preferred to "full-diameter production wells" since they are significantly less expensive. Greenfield project: A greenfield project (as opposed to a project expansion) is a project that is developed on a resource (area) that is not used by an existing power plant. Brine: the geothermal brine is the fluid (watery solution or steam) of the geothermal resource. Since that water is able to move through the rock's interfaces and fractures, it is used as the heat transfer media that extracts the heat from the rock and delivers it to the power system. Flash: Hot water tends to evaporate and becomes steam under certain temperature and pressure conditions. This water characteristic is used in the separators of "flash" geothermal power plants that control the process and produces steam at adequate pressure for the steam turbine. Productive fracture: The underground reservoir is characterized by various layers of rocks that have been moved by geologic events through the years. A productive fracture is usually an interface of two rock formations or a fault produced by earthquakes or geologic movements that is relatively permeable and thus allow a high flow of geothermal brine. Scaling: The scaling potential of geothermal brine is to its capacity to deposit solid minerals. Physico-chemical conditions (which are affected throughout the geothermal heat extraction and "flashing" process) disturb the chemical balance of dissolved minerals and determine the scaling potential of a solution. Annuity: The annuity is the periodic reimbursement of the principal and the payment of the interests related to a debt. Cooling tower: A cooling tower is the structure associated with water-cooled heat extraction systems. Hot water is spayed from the top of the structure and cascades against an upwards airflow that cools the water (mainly through evaporation). Casing strings: Well casings are composed of several annular "layers" of cement and casing pipe that correspond to specific depths. These layers are called strings.
- 12 -