FACTORS AFFECTING BUSINESS INCOME TAX REVENUE IN …FACTORS AFFECTING BUSINESS INCOME TAX REVENUE IN...
113
1 FACTORS AFFECTING BUSINESS INCOME TAX REVENUE IN ETHIOPIA. By HAMELMAL AZENE H/GEBRIEL Addis Ababa, October,2017
Transcript of FACTORS AFFECTING BUSINESS INCOME TAX REVENUE IN …FACTORS AFFECTING BUSINESS INCOME TAX REVENUE IN...
1
FACTORS AFFECTING BUSINESS INCOME TAX
REVENUE IN ETHIOPIA.
By
HAMELMAL AZENE H/GEBRIEL
Addis Ababa,
October,2017

2

3
FACTORS AFFECTING BUSINESS INCOME TAX
REVENUE IN ETHIOPIA.
By
HAMELMAL AZENE H/GEBRIEL
Addis Ababa,
October, 2017
4
FACTORS AFFECTING BUSINESS INCOME TAX
REVENUE IN ETHIOPIA.
By
HAMELMAL AZENE H/GEBRIEL
Thesis Submitted to the School of Graduate Studies,
College of Business, Economics and Social Sciences, Unity University
In Partial Fulfillment fortherequirement for the
Degree of Master in Accountingand Finance.
Addis Ababa,
October,2017

5
FACTORS AFFECTING BUSINESS INCOME TAX
REVENUE IN ETHIOPIA.
By
HAMELMAL AZENE H/GEBRIEL
Thesis Submitted to the School of Graduate Studies,
College of Business, Economics and Social Sciences, Unity University
In Partial Fulfillment forthe requirement for the
Degree of Master in Accounting and Finance.
Addis Ababa,
October,2017
6
FACTORS AFFECTING BUSINESS INCOME TAX
REVENUE IN ETHIOPIA.
By
HAMELMAL AZENE H/GEBRIEL
Thesis Submitted to the School of Graduate Studies,
College of Business, Economics and Social Sciences, Unity University
In Partial Fulfillment forthe requirement for the
Degree of Master in Accounting and Finance.
Addis Ababa,
October,2017

7
UNITY UNIVERSITY
College of Business, Economics and Social Sciences
SCHOOL OF GRADUATE STUDIES
FACTORS AFFECTING BUSINESS INCOME TAX
REVENUE IN ETHIOPIA.
HAMELMAL AZENE H/GEBRIEL
Approval of Board Examiners
Internal Examiner External Examiner
Name__________________________ Name__________________________
Signature_______________________ Signature_______________________
Date___________________________ Date___________________________
Advisor
Name_______________________________
Signature____________________________
Date________________________________
Confirmation
Chairperson,Department Graduate Committee:
Name______________________________________
Signature___________________________________
Date_______________________________________

8
DECLARATION
I hereby declare that this thesis entitled “Factors affecting Business Income Tax Revenue in
Ethiopia” is my own original work under the guidance and supervision of Teklu Kassu (Ph.D.)
The thesis has not been submitted for the award of any Degree in any University, and all the
materials used in this thesis have been duly acknowledged.
Researcher’s Name Signature Date
HamelmalAzene H/gebriel –––––––––––– ––––––––––––––––
9
ABSTRACT
Observing the flactuation in business income tax revenue trendes at wider and narrower
perspective analysing the factors and comparing it to Ethiopia’s case reaserch qustion has
been set to figure the quantitative relationship to some factors.
Based on theories and emperical reviews a conceptual frame work was set to see te relationof
Incenives ,Foreign direct investment and Inflation on business income tax revenue in Ehtiopia .
To reach to the desiered conclusion statistical methods both descriptive and inferential were
acted up on 30 years data using SPSS(23).
Form these analysis Important factors such as the correlation matrix ,ANOVA, coefficents
tables along with P-P normal plot and scattered plot have been discussed in detail. The
correlation matrics which turned out to be te same for all regression analysis types revealed the
following facts.
The correlation matrix implies, the relation between business income tax and incentives is .969
(96.9%) where as the relationship of inflation and foreign direct investment to the same is
.170(17%)and.255(25.5%) respectively. Based on the ANOVA tables the listed significant P
values are detected to examine the hypothesis of mean equality against < 0.05 significant P
value. .000b,
,.528b for model -1, .634
c for model -2, .000
d for model-3and .000
b for Standard,
hierarchical and stepwise multiple regression models respectively.P-P normal curve and the
scattered plot nearly show the same distribution except for the stepwise regressionP-P normal
distribution where the abnormally broken line shows.
The model formulated is mentioned as follows:
Business income tax = .804(Incentives) -.152(Foreign direct
investment)+30,046,993.585(Inflation) -848,937,390.864
The interpretation being to obtain a unit change in business income tax revenue.804 incentive
should be induced,.152 foreign direct investment should be reduced,30,046,993.585 inflation
should be increased or if all are constant the revenue would decrease by 848,937,390.864.

10
ACKNOWLEDGMENT
At the completion of this thesis my special gratitude goes to My Advisor Dr. Teklu Kassu for his
countless support and encouragement.
In fact it is impossible for one to fulfill a wish without magnificent people helping you. So the
next honor goes to Family, Friends, Colleagues, Instructors, My company DERBA MIDROC
Cement Plc. for giving me this wonderful chance, People who cooperated in data availing in
different government institutions, My Country at large and finally….
To ALMIGHTY who works behind the screen and gave me additional BREATH.
DEDICATION
This thesis I dedicate for the memorial of Unity University which provided me with the platform
to discover myself, experience joy and team effort.
I thank you!
11
CONTENTS
CHAPTER 1-INTRODUCTION.……………………………………………..……………..…1
1.1 Background ........................................................................................................................... 1
1.2 Statement of the problem ...................................................................................................... 2
1.3 Research question .................................................................................................................. 3
1.4 Research objectives ............................................................................................................... 4
1.5 Hypothesis to be tested .......................................................................................................... 4
1.6 Research Methodology .......................................................................................................... 4
1.7 Significance of the study ....................................................................................................... 6
1.8 Scope of the study ................................................................................................................. 6
1.9 Limitation of the study .......................................................................................................... 7
1.10 Organization of the study .................................................................................................... 7
CHAPTER 2- LITERATURE REVIEW .................................................................................... 8
2.1 Conceptual literature ............................................................................................................. 8
2.1.1 Business income tax ........................................................................................................... 8
2.1.3 Incentives ........................................................................................................................... 9
2.1.4.1 Reduced corporate income tax rate ................................................................................. 9
2.1.4.2 Loss carry forwards ......................................................................................................... 9
2.1.4.3 Tax holidays .................................................................................................................. 10
2.1.4.4 Investment allowances .................................................................................................. 10
2.1.4.5 Investment tax credits.................................................................................................... 10
2.1.4.6 Reduced taxes on dividends and interest paid abroad ................................................... 10
2.1.4.7 Preferential treatment of long-term capital gains .......................................................... 10
2.1.4.8 Deductions for qualifying expenses .............................................................................. 11
2.1.4.9 Zero or reduced tariffs ................................................................................................... 11
2.1.4.10 Employment-based deduct .......................................................................................... 11
2.1.4.11 Tax credits for value addition...................................................................................... 11
12
2.1.4.12 Tax reductions/credits for foreign hard currency earnings ......................................... 11
2.1.3 Foreign direct investment ................................................................................................. 12
2.1.4 Inflation ............................................................................................................................ 13
2.2 Theoretical analysis ............................................................................................................. 15
2.2.1 Theories of business income tax ...................................................................................... 15
2.2.1.1 Corporate income tax as a form of business taxation.................................................... 15
2.2.1.2 Corporate income taxes supplementing individual income taxes ................................. 16
2.2.1.3 Corporate income tax as a technique of economic control ........................................... 16
2.2.2 Theories of Incentives ...................................................................................................... 16
2.2.2.1 Distortion- correcting export promotion ....................................................................... 16
2.2.2.2 Export promotion for It’s own sake .............................................................................. 17
2.2.2.3 Export promotion to capture larger share of global profits ........................................... 17
2.2.3 Theories of Foreign direct investment ............................................................................. 18
2.2.3.1. Capital theory ............................................................................................................... 18
2.2.3.2. International trade tradition theory ............................................................................... 18
A. Mundell & Heck Scher-Ohlin model ................................................................................... 18
B. Kojma’s macroeconomic approach ...................................................................................... 18
C. Product cycle theory ............................................................................................................. 18
2.2.3.3 Industrial organization................................................................................................... 19
2.2.3.4 Cost of capital................................................................................................................ 19
2.2.3.5 Corporate investment theory ......................................................................................... 19
2.2.3.6 Portfolio theory ............................................................................................................. 19
2.2.4 Theories of inflation ......................................................................................................... 19
2.3 Empirical review ................................................................................................................. 22
2.3.1 Incentives ......................................................................................................................... 22
2.3.2 Foreign direct investment ................................................................................................. 24
2.3.3 Inflation ............................................................................................................................ 25
CHAPTER 3- RESEARCH METHODOLOGY ...................................................................... 28
3.1. Research approach and design ........................................................................................... 28
3.2. Data types ........................................................................................................................... 28
3.3. Sample design ................................................................................................................... 29

13
3.4. Statistical Analysis ............................................................................................................. 31
I. Descriptive Analysis ............................................................................................................. 31
II. Inferential Analysis............................................................................................................... 33
3.5 Model Presentation .............................................................................................................. 35
3.6 Tests for Assumptions ......................................................................................................... 35
CHAPTER 4- ANALYSIS ....................................................................................................... 38
4.1 Findings ............................................................................................................................... 38
4.1.1 Data Summary…..………………………………………………………………………..38
4.1.2 Distributions ..................................................................................................................... 39
4.1.3 Descriptive Statistics ........................................................................................................ 43
4.1.4 Inferential Statistics .......................................................................................................... 44
4.1.4.1 Regression Output -1 /Standard multiple regression/ ................................................... 44
4.1.4.2 Regression /Hierarchical multiple linear regression/ .................................................... 55
4.1.4.3 Regression / Stepwise multiple linear regression/......................................................... 68
CHAPTER 5-CONCLUSION AND RECOMMENDATION ................................................. 79
5.1 Conclusion ........................................................................................................................... 79
5.2 Recommendation ................................................................................................................. 84

14
LIST OF TABLES
1. Sample table..………………………………………………………………………………….31
2. Frequency table ......................................................................................................................... 38
3. Descriptive table...…....……………………………………………………………………….43
4. Variables information ............................................................................................................... 44
5.Correlation matrix ...................................................................................................................... 45
6. Regression information ............................................................................................................. 46
7. Coefficient of determination .................................................................................................... 46
8. ANOVA table ........................................................................................................................... 47
9. Coefficients table ...................................................................................................................... 50
10. Co linearity table ..................................................................................................................... 51
11. Outliers table ........................................................................................................................... 51
12. Outliers test table .................................................................................................................... 52
13. Variables information ............................................................................................................. 55
14.Correlation matrix .................................................................................................................... 57
15. Regression information ........................................................................................................... 57
16. Coefficient of determination ................................................................................................... 58
17. ANOVA table ......................................................................................................................... 60
18. Coefficients table .................................................................................................................... 62
19. Regression information ........................................................................................................... 63
20. Co linearity table ..................................................................................................................... 64
21. Outliers table ........................................................................................................................... 64
22. Outliers test table .................................................................................................................... 65
23. Variables information ............................................................................................................. 68
24.Correlations matrix .................................................................................................................. 70

15
25. Regression information ........................................................................................................... 70
26. Coefficients of determination ................................................................................................. 71
27. ANOVA table ......................................................................................................................... 72
28. Coefficients table .................................................................................................................... 73
29. Regression information ........................................................................................................... 74
30. Co linearity table ..................................................................................................................... 75
31. Outliers test table .................................................................................................................... 75
LIST OF FIGURES
1. Self constructed from the discussion…………………………………………………….........15
2. Data distribution graph-1……………………………………………………………………...39
3. Data distribution graph-2……………………………………………………………………...40
4.Data distribution graph-3……………………………………………………………………...41
5. Data distribution graph-4……………………………………………………………………...42
6.Normal distribution graph-1…………………………………………………………………..53
7. Scattered plot-1………………………………………………………………………………..54
8. Normal distribution graph-1…………………………………………………………………..66
9.Scattered plot-2………………………………………………………………………………..67
10 .Normal distribution graph-1…………………………………………………………………76
11. Scattered plot-2……………………………………………………………………………...77
APPENDICES
1.Table of African development indicators
2.Table of Business income tax data
3.Table of Inflation data
4.Screen shoots of SPSS lecture
5.Additional sources for data processing

16
KEY WORDS
ANOVA Analysis of Variance
CAPM Capital Assets Pricing Model
CEMAC Economic and Monetary Community of Central African States
CIT Corporate Income Tax
ECOWAS Economic Community of West African States
EPRDF Ethiopian People Revolutionary Democratic Front
FDI Foreign Direct Investment
GST Goods and Services Tax
MOFEC Ministry of Finance and Economic Cooperation
NGO Non-Governmental Organization
OECD Organization for Economic Cooperation and Development
R&D Research and Development
SACU Southern Africa Customs Union
SCF Standard Committee on Finance
SPSS Statistical Package for Social Sciences
UK United Kingdom
EAC East African Community
US United States
VAT Value Added Tax
WAEMU West African states Economic and Monetary Union
17
CHAPTER 1- INTRODUCTION
1.1 Background
A variety of business income tax trend has been observed around the world in the past few
decades. The trend in the OECD countries implies that there has been declining revenue with
some inclination lately. This is attributable to business income tax rate falls. In fact the
inclination in revenue is due to widening the tax base despite the reduction in rate.( Tomonori
S.2012) On the other hand the United States of America witnessed fall in business income tax
revenue from 1965-1985G.C. And this decline is attributed partially to government regulations
regarding incentives and narrowed tax bases that is less profit along with more investment in
capital assets.( Alan J. and James M. , 1987)
In countries where business income tax to GDP ratio is high the corporate sector contributes
much to the revenue and is also profitable(Joanna P., Werner V.,2008) It is also explained that
corporatization and income shifting from personal to corporate income tax contributed to
increased tax revenue as tax rate reduced. This means where the countries are not well
corporatized and the existing corporations are not profitable it follows that business income tax
declines .As per the US case tax breaks contributed to business income tax decline for instance
statistics indicates by the year 2003 the revenue foregone due to tax break for multi nationals,
research and experimentation as well as US export subsidy amounted 11,000,000,000.00,
9,000,000,000.00 and 5,000,000,000.00 all in $ respectively.
In European Union Germany and Italy are among the nations where decrease in business income
tax resulted for increased foreign direct investment .In addition this literature reveals that foreign
direct investments can have adverse effect on corporate tax revenue due to competition and this
has been manifested in some OECD countries. (Reint G.and Kristina K.,2000) .In tax policy for
developing countries it has been mentioned that the impact of inflation and incentives is visible
as well. It is mentioned in an article that depreciation rates and mechanisms should take in to
account the likely price appreciation of fixed assets which in most cases is not adjusted for. This
incorporation of inflation effect directly is applied on gross profit deductions influencing
business income tax. More over in the same article it has been mentioned that cost –
effectiveness of export incentives should be emphasized over it’s foreign investment attraction.
18
This is because as mentioned in the document some incentives are least effective like that of tax
holidays and investment subsidies. It is also mentioned that incentive by discretion and indirectly
have their own draw backs. (Vito T. and Howell Z.,2001)
From the literature sited:( Mario Mansour,2014) for the period 1980-2010 the trend for trade
taxes, indirect taxes, corporate taxes and direct taxes contribution has been disclosed. Declining
trade , inclining indirect and static corporate as well as direct tax has been observed. Focusing on
the area of the study the trend for corporate tax has been inclining exceptionally for Southern
African countries. Regarding* EAC (East African Community) corporate tax trend is more like
slight upward curve.The reasons can be like mentioned in the (OXFAM,2016) publication much
corporate tax is foregone each year by different developing countries .In sub Saharan countries it
mentions the governments have shifted to cut of development activities or taxes burdening low
income society by taxes like VAT(It contributes about 67% in the region) compensating for the
income lost in corporate income.
1.2 Statement of the problem
Ethiopian tax system is believed to have it’s base between 1942-1944.Then the tax system was
composed of property taxes namely land and cattle. Then in 1950’s taxes on goods and services
applied, followed by rate and structure amendment on income taxes in 1960’s. From 1974-1991
privet investments were nationalized so capital and surplus were transferred from such
companies. (Alemayehu G. and Abebe S., 2005) Based on Income Tax Proclamation No.
173/1961 of the 1990’s Business income of juridical persons is taxable at the rate of 30%.
Taxable Business Income other than that of Juridical Persons ranges from 10% -35% for yearly
income earned categories running from 1,800 up to over 60,000 br. (Source: MOFEC)
Regarding the revenue generation trend of business income tax there is some irregularity. Data
from 1974-2013 reveals that direct tax contribution to tax revenue has fallen from 37% in the
Derg regime to 34% in EPRDF. Specific to pre and post reform periods in 2002 the revenue
contribution of direct taxes has fallen from 36% to 33% respectively. (Delessa D., 2014)
*Note :EAC: East African Community ;ECOWAS: Economic Community of West African States (includes non-WAEMU
members only);CEMAC: Economic and Monetary Community of Central African States ;SACU :Southern African Customs union;
WAEMU: West African Economic and Monetary Union.
19
Hence this study was made before the personal income tax reform the decline can only be
justified by narrowing tax base.
Returning to business income tax the trend as contributing to the total direct tax has the
following issues: Observing the trend from 1979-2008, of the contribution personal income tax
and business income tax made to the total direct tax, business profit tax takes the upper hand
except for some interruptions in 1992.However 2003/04 on wards the trend shifts the opposite
direction and the personal income tax begins to rise.(Tsegabirhan w.,2010) Trying to obtain the
latest business income tax earnings from MOFEC the researcher discovered the nearly persistent
contribution of business income tax revenue inclined for nearly two decades (Data:1997/98-
2015/16).
The trend resembles that of the OECD counties unlike the US which still indicates decline in
corporate tax. The case of Incentive strategies for US, foreign direct investment in some
European countries and inflation as another likely cause has been justified in the back ground.
Besides this foreign direct investment and inflation are proofed to be among the factors
influencing business income tax revenue in Ethiopia (Tesfaye A., 2015). Another study also
indicates incentives which in most cases are granted to the export sector are hazardous to
Ethiopian business income tax revenue. (Million Timer J, Azime A. H.andGollagari R., 2016)
However these studies fall in short of determining the cause and magnitude of these variables in
Ethiopian context.
Far beyond the studies reviewed the fact that incentives are provided in two streams in the
prevailing duty free and investment directives, foreign direct investment is vigorously promoted
and inflation especially the food inflation has always been acquainted with earning in personal
income tax it is critical to place all their effect in model predicting the flourishing business’s
income tax revenue in Ethiopia.
Because Incentives, Foreign direct investment and Inflation are believed to influence business
income tax revenue in Ethiopia, this study aims at filling the information gap regarding the
magnitude of this influence. In the study the variables considered are statistically analyzed so
that a model explaining the numerical relationship between Business income tax and the
respective explanatory variables Incentive, Foreign direct investment and Inflation is developed.
20
Hence the study forecasts the magnitude in effect of the aforementioned factors on Business
income tax revenue of Ethiopian government.
1.3 Research question
From the above stated problem this study tries to answer the questions:
1. How much incentive changes for a unit change in business income tax revenue?
2. What is the coefficient of change in foreign direct investment that results in a unit change
of business income tax revenue?
3. What is the extent of shift in inflation sufficient to result in a unit change in business
income tax?
4. What the degree of model accuracy explaining the relationships is?
1.4 Research objectives
The general objective of this study is to investigate the factors affecting business income tax
revenue in Ethiopia and give recommendation.
Specific objectives:
1.4.1 To explore the effect of incentives on business income tax
1.4.2 To examine the effect of foreign direct investment on business income tax
1.4.3 To evaluate the effect of inflation on business income tax
1.4.4To establish the joint effect model for the three independent variables (factors) acting on
business income tax revenue
1.5 Hypothesis to be tested
H1: There is relationship between incentive and business income tax revenue
H2: There is relationship between foreign direct investment and business income tax revenue
H3: There is relationship between inflation and business profit tax revenue
H4: There is positive relationship between incentives and business income tax revenue
21
H5: There is negative relationship between foreign direct investment and business income tax
revenue
H6: There is negative relationship between inflation and business income tax revenue
1.6 Research Methodology
In general the purpose of this session is to discuss the techniques we used to bring the required
output. Hence the target is to achieve representing, fit model that would explain the factors
affecting business income tax along with their magnitude. Therefore, the model would indicate
the possible forecast in business income tax revenue provided amendment in the predicted
variables.
With respect to research approach, explanatory research method has been employed since our
purpose is to clarify on the factors affecting business income tax revenue in Ethiopia and the
extent there by. To enhance the process samples of Business income tax revenue, foreign direct
investment, inflation and incentive data have been obtained just for 30 years because of
inconveniencies encountered. Ministry of Finance and Economic Cooperation, Ethiopian
Investment Commission, Ethiopian Revenues and Customs Authority and the remaining from
African Development Indicators-World Bank Data Base were the primary sources. In fact this
adds to the secondary data sources obtained through books, journals, articles and different
publications. These sources were back bone in establishing the conceptual frame work based on
theories and empirical reviews. All quantitative data included are more or less representatives of
the population as can be observed depicted in research methodologies chapter. Statistical
Package for Social Sciences (SPSS-23) found to be adaptive and convenient for the data type
(Scale in SPSS to mean Ratio or Interval data) and quantity was prime.
Further step required to come up with practical model was statistical operation on the data
acquired. Relationship between the predicting variables and the resultant magnitude in the
forthcoming business income tax revenue could only be foreseen from past data and hence both
descriptive and inferential analysis was rendered. Some of the operations include measures of
central tendency like sum mean, mode; measures of dispersion like range , variance and standard
deviation measures of relations; like correlation and measures of the relation parameter like
ANOVA , Multiple Linear Regression and coefficient of determination are made.Followed by
22
test of assumptions for multiple linear regression model to make sure the model doesn’t indicate
exponential or logistic relationships.
Based on the model stated as:
Y= βo + β1 X1 +β2X2 + β3X3+ei
Where Y= Total Business income tax revenue, βo = Y intercept,β1 = Coefficient of incentives ,X1
= Incentives, β2= Coefficient of foreign direct investment,X2 = Foreign direct investment,β3 =
Coefficient of inflation,X3 = Inflation, and ei=Error term
Finally conclusion is made up on the hypothesis tested ,which are all stated in alternative
hypothesis form where the negation or null is just the reverse , and the whole study concluded to
lead to recommendations aligned to the research questions set.
1.7 Significance of the study
The political significance in this study is all about becoming influential in regional and
international affairs. Basically more tax collection results in empowering government provided it
has set the right administrative tools. So once the right administrative tools are employed the tax
revenue in general and business income tax revenue in particular would be dependent on the tax
structure. The structure is broadly composed of the rate and the rate and tax base. In our case the
tax rate is fixed for the past three decades so it would be critical that government identifies the
factors narrowing the tax bases.
The economic significance of this study is largely mentioned above. It helps build a nation
further. So it enhances the investment on infrastructure and public services by the government.
The other perspective by which the economy can benefit from this study is that it would
comment on which macro and fiscal factors to focus so as enhance economic growth resulting
from magnified business income tax.
The societal benefit of this study goes to identifying causes for reduction of business income tax
revenue. This process benefits the society because unnecessary burdens on the low income
society can be shared. On the other hand developed economy and politics lead to increased social
services and social conscious.
23
Academically this study contributes to the development of tax accounting because it widens the
knowledge on business income tax, it serves as spring board to further studies and intellectual
debates regarding business income tax .Specific to Ethiopian business income tax revenue trend
it helps academicians focus on it and the government take actions regarding the rate or base of
the tax.
1.8 Scope of the study
The study observes the trend of business income tax revenue in the finalized two decades as a
plat form to identify the effect of factors involved. The theories and empirical reviews made are
of foreign direct investment, inflation and incentives to set the concepts of how they affect
business income tax. The quantitative approach is primarily used regarding the input data and
it’s analysis and it does not incorporate the views of officials. This data is composed of
reasonable time series data dating back 30 years from 2016 G.C. .The geographic scope is
limited to Ethiopia indicating absence of cross sectional data.
1.9 Limitation of the study
The lack of complete and well organized data regarding the interaction of the considered
predictor and predicted variables made it hard to ensure relationship. Almost none discussion is
available on the subject in secondary data sources that the researcher was forced to drop some
critical predictor variables like transfer pricing were dropped. However the fragmented
information obtained from web sources was thoroughly analyzed in order to figure out what sort
of interaction and effect they had one another. Some articles even vividly indicated the financial
statement aspect of the predictor variables considered. Another difficulty encountered was data
availability .This problem in addition to dropping nominated variables led to use of international
data sources .In addition to data unavailability on incentives dated beyond 10 years, the
definition of incentives for world bank early period data and the contemporary ERCA data
differs. To provide a clarified view in the earlier times incentive is considered only for local
businesses which took the form of import tax relief, where as the contemporary legislations
include another incentive wing for foreign direct investments and industrial parks. The model
could fall in short of explaining the impact of these investment incentives however captures all
of the incentives to support local producers. Time and finance constraints were also observable.

24
1.10 Organization of the study
The study is organized in such a manner that in chapter two the concepts of business income tax,
incentives, foreign direct investment and inflation are discussed briefly in the conceptual
literature work. The empirical review tries to navigate practical issues of the relationships in
different parts of the world. So this wind-up the literature reviews part. Chapter three the
methodology discusses the research approach and design, data type, sample design, statistical
analysis, model presentation and tests foe assumptions. Chapter four delivers the findings and at
last the conclusion and recommendation is made in chapter five.
25
CHAPTER 2- LITERATURE REVIEW
This literature review part of the study discusses the definitions and concepts embracing the
variables in consideration as well as their interaction. Another point in the conceptual framework
to be discussed is the conceptual boundaries of these variables in this specific study. It also
provides theoretical background for business income tax, foreign direct investment, inflation and
export incentives .Empirical review on the relationships of the above mentioned variables cited
from different publications would also be availed.
2.1 Conceptual literature
In this part the researcher tries to define and analyze the concepts of the variables included in the
study so as to give a clue on the concept boundaries of the study and the interaction of the
variables.
2.1.1 Business income tax
Business income tax corporate income taxes are defined as taxes dependent on business activities
and profitability. In addition the business income tax is computed not just on the gross profit but
after the allowable deductions according to each country’s legislation. In addition this tax claims
the charge on businesses net profit from goods and services (Tākemoniwhiwhi ,2017)
Business income tax Ethiopian context is defined as tax imposed on taxable business income/ net
profit realized from entrepreneurial activity .Taxable business income is determined per tax
period on basis of profit and loss account or income statement, which shall be drawn
incompliance with generally accepted accounting standards. Corporate businesses are required to
pay 30% flat rate of business income tax. For unincorporated or individual businesses the
business income tax ranges from 10%-35%. (Atsbha T.,2016)
Where the concepts in business income tax of Pakistan is discussed implies the gross business
income tax computed should consider deductions like reductions in tax liability, foreign tax
credits, tax credits on donations ,investment and tax credit on exempt share from association of
persons. (Government of Pakistan, 2014) From this business income tax concept not only
expenses but also other deductions involve in determination of the business income tax liability.
Some of the deductions resemble incentive like in case of investment deduction. Others like that

26
of foreign tax credit seem controlling; donation deduction is also not applicable in other tax
regimes.
In Ethiopian context the definition and concept of business income tax does not lay far behind
what we discussed. The annual income less expense deduction concept is the same. It’s
computation is guide line based income statement. Service and good provision, asset transfer or
other income are considered. Deductions include administrative expenses, depreciation to the
extent of operation, Interest excluding inter-banks, donation for national purpose and NGOs and
loss carry forward. (Income tax – proclamation No.979-2008)
2.1.2 Incentives
To explain vividly the incentive on tax or foreign direct investment is the package of programs
the government of a specific country under takes looking forward to in flow of capital and
investment. The incentive may be designed in such a manner that it increases return or reduces
the attached investment risk. The incentives in most cases are offered to specific sectors,
industries, at times as narrow as companies or regions. (A global survey, 2000)
Classification of tax incentives ( A global survey ,2000)
2.1.2.1 Reduced corporate income tax rate: these are incentives by the government to reduce the
income tax payable by multinational companies or foreign investments in general. These
incentives may be vested on all inclusive or requirement meeting investment basis .Hong Kong
(China), Indonesia, Ireland, the Lao People’s Democratic Republic, Cambodia and Estonia are a
few countries that use this type of incentive.
2.1.2.2 Loss carry forwards this is in short an accounting treatment of foreign direct investments
to report the loss they incurred in the forth coming profit years as a shield to tough market
penetration and profitable operation. Taken together, a low tax rate accompanied by loss carry
forwards for tax purposes and accelerated depreciation is considered to be a major element in an
effective tax system and one that is highly attractive to foreign investors. Loss carry forward is
usually provided for periods ranging three to five years and there is threshold for the loss.
27
2.1.2.3 Tax holidays tax holidays are a common form of tax incentives used by developing
countries and countries with economies in transition to attract FDI. Under a tax holiday,
qualifying “newly established firms” are exempt from paying corporate income tax for a
specified time period (e.g. five years). The provisions may exempt firms from other tax liabilities
as well. Tax holidays eliminate tax on net revenues from investment projects over the holiday
period, which, depending on the case considered, tends to encourage investment.
2.1.2.4 Investment allowances Investment allowances are deductions from taxable income based
on some percentage of new investment (depreciation). They tend to lower the effective price of
acquiring capital. Both investment allowances and investment tax credits are given as a specified
percentage of qualifying investment expenditures. Because they are deducted against the tax
base, however, their value to the investing firm depends, among other things, on the value of the
corporate income tax rate applicable to the tax base — the higher (lower) the tax rate, the higher
(lower) is the amount of tax relief on a given amount of investment allowance claimed.
One of the investment allowances available is accelerated depreciation.
2.1.2.5 Investment tax credits investment tax credit is an incentive that takes into consideration
the investment on cost of capital. This is like investment allowance in that it allows the company
to recover on capital expenditure it made at a given percentage. There are also two forms of
investment tax credit. The first flat rate and the second incremental rate. The flat rate considers
the one time investment costs companies incurred so that they will be compensated. On the other
hand the incremental investment tax credit considers the series of investment costs incurred by a
company to constitute the overall tax credit.
2.1.2.6 Reduced taxes on dividends and interest paid abroad Governments generally levy taxes
on dividends remitted abroad by foreign investors. These taxes may be reduced in order to attract
foreign investment. Typically these taxes are about 10 per cent. Leaving aside the tax-shifting
phenomenon, the lower the dividend tax, the greater the tax incentive. On the other hand, the
lower the dividend tax, the lower the penalty for remitting dividends, and the lower the incentive
to reinvest profits.
2.1.2.7 Preferential treatment of long-term capital gains this tax incentive is mainly focusing on
investors with intention to keep their investment in the host country. Capital gain is the profit
made by the multinational company in its investment abroad in this case. But it is not the profit

28
share of the investor by the amount which is allotted for reinvestment. Because this investment
virtue provides host country with more capital inflow the government would attempt to give
more incentive to re investing owners. In the same manner this preferential capital gain tax relief
is made to those who invest longer than who resign shortly.
2.1.2.8 Deductions for qualifying expenses in such cases where training and research and
development are important for technology transfer, some countries allow more than full
deduction for tax purposes of qualifying expenses. For example, they may allow double
deduction of training expenses, R&D expenses, or export marketing expenses. This type of
incentive may be considered in association with measures to encourage transfer of technology.
2.1.2.9 Zero or reduced tariffs primarily developing countries used to give import and export
tariff incentives this is because the import tariff eases for the cost of capital investment. And the
export tariff helps local producers to compete with the foreign multi nationals. However it is
recommended by world trade organization that the two tariffs be exempted to benefit from
international trade and to allow for free competition resulting from globalization. Therefore now
the two tariffs are considered inefficient, high-cost, distorted industrial structure resulting
incentives.
2.1.2.10 Employment-based deductions to encourage investment in specific sectors or
geographic areas, Governments may reduce social security contributions or provide tax credits or
allowances based on the number of employees hired. Bulgaria, on the other hand, offers tax
incentives to further its social goal of providing employment to persons with disabilities.
2.1.2.11 Tax credits for value addition In order to promote domestic capacity building and
discourage export of raw commodities, Governments may provide tax credits or allowances for
value addition in processing or for the net local content of outputs (defined as the value of sales
less depreciation of capital equipment, and the value of imported raw material and supplies).
2.1.2.12 Tax reductions/credits for foreign hard currency earnings one of the reasons many
developing countries encourage export is in order to earn much needed foreign hard currency.
Not only export processing, but also many industries in the services sector (e.g. tourism and
hotels) are provided tax reductions or credits based on earnings of such hard currency.(Imtiaz
Ahmad,2015,Dorsati H. Madani &Natàlia Mas-Guix,2011)
In Ethiopian context the intention to benefit more from the currency in flow remains intact.
Therefore there are different schemes like provided in any part of the world. To begin with the
29
proclamation addresses it’s objective to be the increment in foreign currency and because it is a
necessary tool to employ the export sector. Then it continues with the incentives
(a) Duty Draw-Back Scheme: This is refund on imported input tax
(b) Voucher Scheme: Allowed voucher candidates are import of raw materials tax exempted so
long as they keep on exporting their product- they provide the voucher they are given to customs
authority.
(c) Bonded export factory scheme: In this system the input is tax free and transport and proper
consumption or disposal is under close watch of customs.
(d) Industrial zone scheme: In this system all the measures taken in”(c)” are undertaken in
addition to controlling the local and export out puts. Based on the type of market tax is levied.
(e) Bonded export manufacturing warehouse scheme: This scheme is all about making inputs tax
free controlling the inputs and out puts at warehouse and levying tax and penalty when inputs are
compelled for sale locally.(Proclamation No. 768/2012 )
However there is one thing to note here in Ethiopian context there seem to be confusion
regarding export incentive and investment incentive (Regulation No.312/2014) for investment
incentives exempts industrial development zones of income tax for 10 and 15 years the incentive
further discusses exemption based on export volume.
2.1.3 Foreign direct investment
As the academic literature does not always agree about the definition of FDI, it seems
appropriate to turn to the definition of an official organization. According to OECD (1996),
‘foreign direct investment reflects the objective of obtaining a lasting interest by a resident entity
in one country (‘direct investor’) in an entity resident in an economy other than that of the
investor (‘direct investment enterprise’). The lasting interest implies the existence of a long-term
relationship between the direct investor and the enterprise and a significant degree of influence
on the management of the enterprise.’ To implement this statement, the OECD recommends that
‘a direct investment enterprise be defined as an [...] enterprise in which a foreign investor owns
10 percent or more of the ordinary shares or voting power of an [...] enterprise’.
(Essay2000_02.pdf)

30
The important concepts of this definition are that FDI involves a ‘lasting interest’, a ‘long-term
relationship’, and a ‘significant degree of influence’, although the latter part of the definition has
increasingly become less important in recent years (Lipsey, 1999)Regarding the OECD scope
foreign direct investment includes 10% investment with or without significant influence on
decision making this is set to standardize data reporting across the countries.(OECD,2008)
The foreign direct investment in Ethiopian context begins with reserved investments for local
investors.
Banking and insurance
Packing , forwarding and shipping
Broad casting
Mass media
Attorney and legal consultancy services
Preparation of indigenous traditional medicines
Advertizing , promotion and translation works and
Air transport using air craft with a seating capacity up to 50 passengers services
(Investment Regulations No 270 -2012)
As can be observed in the proclamation foreign investors can engage in numerous investment
aspects except for the above services. From this it can be inferred that foreign direct investment
being a lasting interest, long-term relationship and significant influence affects a country’s
economy power. Therefore it is vivid why strategic sectors are reserved for citizens. On the other
hand the proclamation for investment defines foreign investor as fully owning the foreign capital
, jointly owning the local capital or capital owned by permanently foreign residing Ethiopian
preferring foreigner treatment.(Investment proclamation No.769 of 2012)
2.1.4 Inflation
Because the term inflation is such a generic term used in many contexts, there is no commonly
accepted definition of inflation, nor is there a common agreement on what constitutes acceptable
levels of inflation, bad inflation, or hyperinflation. Generally it can be said that inflation is a
measure of a general increase of the price level in an economy, as represented typically by an
31
inclusive price index, such as the Consumer Price Index in the United States. The term indicates
many individual prices rising together rather than one or two isolated prices, such as the price of
gasoline in an otherwise calm price environment. The inflation rate is typically expressed as an
annual growth rate in prices (again, as measured by an index) even if measured over a shorter
period of time. For example, if a radio report states that "consumer prices rose at an inflation rate
of four percent last quarter," that would typically mean than the Consumer Price Index for All
Urban Consumers (the most quoted index) rose over the last three months at an annualized rate
of around four percent, and the press would generally refer to the current inflation rate as around
four percent.(Inflation pdf,2017)
The four concepts of inflation are believed to be deflation, reflation stagflation and disinflation.
Deflation is exact opposite of inflation in that it is a persistent fall in price. reflation is a
deliberate inflation adopted by governments when there is economic depression and any more
production is discouraged to price fall. Stagflation is a persistent price increase accompanied
with high unemployment and less production. Disinflation on the other hand is the measure a
government takes to reduce increasing price without increasing unemployment.(Muhammad
zubair,2012)
Regarding inflation in Ethiopia some scholars agree it results from supply side of products like
that of agricultural. Others say the monetary supply locally and international inflation have got
both impact. And also some say the demand side should also be considered.(Sisay Menji
,2008)Otherwise the definition and concept are no different in Ethiopian case in fact the
administration of the national bank of Ethiopia is limited to core (non-food) inflation.(national
bank of Ethiopia,2012)
To generalize this study concentrates on the relationships of the afore mentioned variables .As
previously discussed at the core of business income tax is income obtained from goods and
services operating in a specific year considering the net income. Incentive has basic aim of
increasing foreign currency reserve .Whereas foreign direct investment is all about degree of
influence lasting interest and long-term relationship. Inflation is all about price upward
movement which is persistent, with It’s four concepts involving government intervention. The
relation among business income tax, foreign direct investment and incentives is clear that both
affect the first through economic resource and income gain. Inflation however largely relates
32
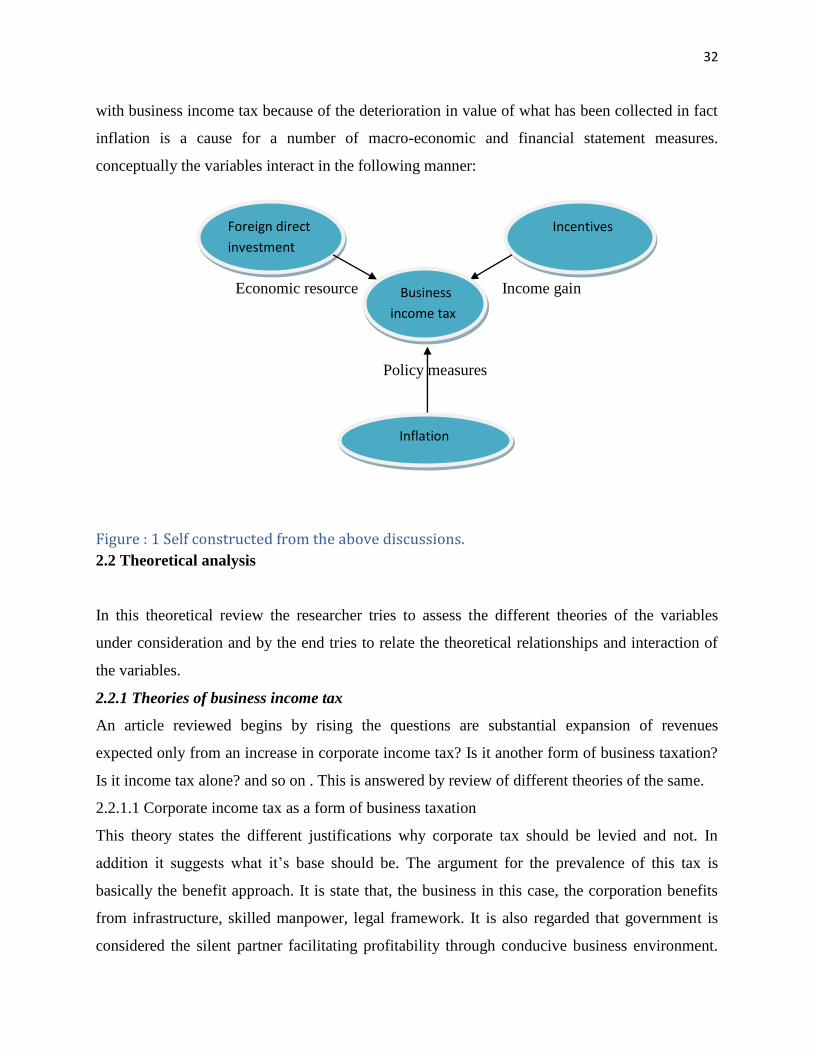
with business income tax because of the deterioration in value of what has been collected in fact
inflation is a cause for a number of macro-economic and financial statement measures.
conceptually the variables interact in the following manner:
Economic resource Income gain
Policy measures
Figure : 1 Self constructed from the above discussions.
2.2 Theoretical analysis
In this theoretical review the researcher tries to assess the different theories of the variables
under consideration and by the end tries to relate the theoretical relationships and interaction of
the variables.
2.2.1 Theories of business income tax
An article reviewed begins by rising the questions are substantial expansion of revenues
expected only from an increase in corporate income tax? Is it another form of business taxation?
Is it income tax alone? and so on . This is answered by review of different theories of the same.
2.2.1.1 Corporate income tax as a form of business taxation
This theory states the different justifications why corporate tax should be levied and not. In
addition it suggests what it’s base should be. The argument for the prevalence of this tax is
basically the benefit approach. It is state that, the business in this case, the corporation benefits
from infrastructure, skilled manpower, legal framework. It is also regarded that government is
considered the silent partner facilitating profitability through conducive business environment.
Incentives Foreign direct
investment
Business
income tax
Inflation

33
Though is given less weight the ability to pay principle indicated it is better to charge individuals
because whatever businesses save is invested on the society. The base is also suggested to be
cost instead of profit which is more stable.
2.2.1.2 Corporate income taxes supplementing individual income taxes
In this theory what has been discussed deeply is the corporate income tax as a tool. As it is
commonly understood individuals may have different form of earnings. One of the forms of
income takes the form of dividend. As a corporation makes profit, it pays tax after the periodic
interest payables are settled. Then is the turn for owners, provided dividend is declared
individual owners pay tax on dividend income collected by the corporation. However whenever
the investment is retained the individual tax liability remains unsettled .This is the case specially
where there is no capital gain taxes therefore it is recommended to tax the undistributed profit
hence it should be treated like any other saving.
2.2.1.3 Corporate income tax as a technique of economic control
The presence of corporate income tax initially affects forms of organization .Which one is taxed
more the corporate or the partnership affects the economy through the saturation of one. On the
other hand another direct benefit marked is it diminishes monopoly through sharing what has
been obtained by the company. The remaining are related to Undistributed profit taxation. The
arguments support undistributed profit taxation because it is cause for ideal resource, capital
market can benefit the economy than self financing, controlling can better catalyze the economic
activity through capital market, reduces the economic power of single corporation which re
invests it’s idle cash and the last but not the least people tend to take dividend and consume.
(Gerhard C.,1940)
2.2.2 Theories of Incentives
According to an article here under mentioned export incentives can be of three sources. These
sources are in most cases attached to economic development and profit making while others are
related to wrong export promotions ( Sarath R.,1993).
2.2.2.1 Distortion- correcting export promotion: In this category we have wrong government
policies resulting in distortion in the economy. Therefore in order to minimize the effect of this
34
variables government induces export incentives/promotion skims/. Some of the possible
distortions are:
Import protecting and export encouraging policies these policies have the overall effect of
trade performance and import is deprived of delivering its benefits to the economic
sectors demanding it.
Overvalued exchange rate policy would also have negative impact on countries export
hence exporters would earn little from their investment. The other dimension of over
valuation is also reduced local purchase/ less import/ export and foreign direct investment
which all damage a countries economy. A simple example to this effect is ,if a country’s
currency appreciate against US dollar it can be explained in that country one person
would buy one item instead of two due to price appreciation, hence the individual would
buy from somewhere cheap where it demands less US dollar to buy the same item.
Tax on export would also negatively affect the economy hence is not encouraging trend.
In order to reduce It’s diminishing income effect government can take export incentive
actions.
2.2.2.2 Export promotion for it’s own sake: In this theory export brings about economic growth.
This economic growth is brought about different means some of which are competition, use of
economies of scale available for export exhaustively and access to improved technology
.Literally speaking competition is a factor in every countries growth because consumer has the
power to decide to which quality and price to incline. In that case least cost high quality product
would be the standard of many companies to achieve that companies compete locally and
internationally .The other point exhausting exporting capacity to the maximum is experienced by
government and companies as well as other stake holders. This capacity building demanding
duty synchronized with the availability of improved technology access give rise to improved
export sector involving foreign direct investment.
2.2.2.3 Export promotion to capture larger share of global profits: This approach holds true for
the basic reason that most export firms or multinational companies are oligopolistic in nature.
This nature of these companies implicitly indicates the price they charge is more than the
marginal cost. Hence marginal cost is the cost of producing additional unit of the product, these

35
companies set price considering the highest possible cost and their profit margin. Due to this
advantage of oligopoly the literature says “Countries importing such a good pay rents to the
exporting firm”. Therefore countries are in strategic position to have more of such multinational
companies. ( Sarath R.,1993)
2.2.3 Theories of Foreign direct investment
2.2.3.1. Capital theory
There are two theories of foreign direct investment according to an article written on foreign
direct investments and multinational corporations. This article mentions the global issues behind
foreign direct investment in detail .how ever these factors are summarized to two theories the
first one under lined the return on capital aspect of the foreign direct investments. It argues the
higher rate of return attached to these investments due to the risk attaches to them is the source
and cause of the foreign direct investments. The case observed in this analysis was the US
investments in the UK. This investment is named as Capital theory of foreign direct investment.
2.2.3.2. International trade tradition theory
The other theory is named; The International trade tradition theory of foreign direct investment.
This theory is divided into three as
A. Mundell & Heck Scher-Ohlin model emphasizing foreign direct investment is due to
substitution of trade effect. This is for example like saying multinational companies move to
countries where there is less import tariff or incentive. This way they take advantage of capital
investment over export trading.
B. Kojma’s macroeconomic approach this is where the host country is considered comparatively
advantageous to work in .It is like saying in other words where the multinational company has
more privilege in the host country than the country of origin this will serve as a motive for
migration of foreign direct investment.
C. Product cycle theory this model states that in this world where technology and market barriers
are ample, the multinational companies serve as a means to mobilize resources and access
market around the globe.
36
The other theories obtained from (Essay2000_02.pdf) explain some four more theories are
behind the motives or flows of foreign direct investment. They are discussed in detail here under.
2.2.3.3 Industrial organization: This approach postulates that firm-specific characteristics (e.g.
product technology, management skills, economies of scale) are the major determinant of FDI, as
they confer certain advantages on foreign subsidiaries. One of the main assumptions of this
model is that the investing firm cannot reap the benefits from these advantages simply by a
licensing process. For example, an invention or a production process is very difficult to value,
and in the presence of asymmetric information it is even more difficult to get two companies to
agree on a price. However through patent or subsidiary establishment benefits from the parent
can be obtained.
2.2.3.4 Cost of capital :(Graham and Krugman, 1995). A foreign firm might be willing to invest
in a domestic firm because it applies a lower discount rate to expected cash flows. This approach
focuses on firm-specific aspects.
2.2.3.5 Corporate investment theory: Here, locational aspects play the most important role in
determining FDI. These include the importance of the size of the host market, factor prices,
protection afforded to investing firms by tariffs and/or other measures.
2.2.3.6 Portfolio theory: (Brainard and Tobin, 1992). FDI is modeled as part of a portfolio choice
of the investor. This theory is basically introducing FDI into the capital-asset-pricing model
(CAPM). FDI leads to a diversification of the portfolio of the foreign company, which reduces
overall risk. (Essay2000_02.pdf)
2.2.4 Theories of inflation
Monetary theory of inflation is a theory that strongly argues, inflation is due to the demand and
supply of money. The monetary theory of inflation asserts that money supply growth is the cause
of inflation. Faster money supply growth causes faster inflation. In particular, 1% faster money
supply growth causes 1% more inflation. With other things constant, the price level is
proportional to the money supply. Doubling the money supply would double prices. According
to the article stated below there are what we call real fundamental factors. These factors in turn
affect economic variables. They affect real quantities, price, wage and real interest rates. These
37
fundamentals affect the economic variables in the long run but money does not. These real
fundamental factors are consumer preference, technology and resource endowment.
(Monetary Theory of Inflation, 2017)
The neo classical theory of inflation originating from monetary demand and supply factors is
discussed by George L. as follows .He implies the inflation is result of monetary surprise in neo
classical theory. In the mean time the discussion indicates the significance of the relation of
employment and inflation. Mentioning the non- stop inflation in 1960s while it was possible to
manage unemployment during this same period. Indicating reduced unemployment could be
source of inflation. On the other hand it discusses the wage increase and inflation relation of
Keynesian theory.
Within this Neo-Keynesian model of the macro economy, a Phillips curve represents the short-
run response of wage inflation to cyclical variations in unemployment. Most prices are largely
determined by the costs of inputs, the most important of which is labor. But the response of the
average price level to cyclical fluctuations is magnified by the movement of volatile raw
materials prices and by a small cyclical response of price-wage margins. The model also takes
account of inertia in wage inflation and of some feedback from prices back to wages. Exogenous
shocks to prices or wages are additive to the price or wage change generated by the Phillips
curve-inertia mechanism.
An alternative view of the macro economy comes from the "new classical" or "pre-Keynesian
school." It is rooted in a world of price takers and only transitory departures from full-
employment equilibrium. Although rational expectations are neither necessary nor sufficient for
most of its results, this Neo classical school is closely identified with the macroeconomic
literature based on rational expectations about prices. In that literature, the observed Phillips
curve reflects quantities fluctuating in response to unanticipated disturbances to prices. If price
movements are anticipated, output will not depart systematically from its equilibrium path, and
unemployment will not depart systematically from some natural or equilibrium rate. In most
versions of these new classical models, unanticipated changes in prices come from monetary
surprises. Expected changes in money are fully reflected in corresponding changes in the average
price level and have no effects on output or employment ( George L.,1997)
38
There are two theories of inflation the monetary and keynesian theories the monetary theorists
argue that inflation is due to many factors in the short run but the factor affecting the inflation is
the monetary supply alone. They disregard changes in the fiscal policy of the government,
change in price of fuel or food items. On the other hands the keynesians’ argue inflation is due to
demand pulled, cost pushed or concentrated industries. This school emphasizes that the inflation
is either due to high capital investments, high labor cost or pricing trend of monopolistic and
oligopolistic companies.(3040_s83,2015)
To conclude with business income tax has perspectives of benefit approach, means of collecting
individual income tax and controlling the economy theories. Where as in case of Incentive on
the other hand is composed of Distortion- correcting export promotion, Export promotion for it’s
own sake, Export promotion to capture larger share of global profits. These theories are about the
causes of incentives ranging from government policy distortion amendment through economic
growth through different factors and finally owning large share of profit. For foreign direct
investment there are a number of reasons and justifications/causes/ like; Capital theory
,International trade tradition theory ,Industrial organization., Cost of capital ,Corporate
investment theory, Portfolio theory .All these theories range from return advantage to incentive
and considered discounting rate set by foreign direct investors. In case of inflation as well there
are at least two causes. Inflation of Monetary and Keynesian theory. In these theories the cause
for inflation is monetary supply along with demand pull, cost push and concentrated industries
factors respectively.
Finally what we can grasp from our theoretical review is that foreign direct investment through
It’s theories like portfolio, corporate and cost of capital theories largely relate to the benefit
approach of business income tax theory.. This is because as these factors determine where to
locate investment, where they benefit from the country is where they need to pay business
income tax. If they do not pay as much as they gain then there is a problem. On the other hand
inflation whether demand pulled or cost pushed can stabilize through taxing undistributed profit
and minimizing money supply. This proves negative relation between the two variables.
Incentives are on the other hand associated to control of the economy theory .This is because the
theory deals with control of the finance and financial system where the export sector is active.

39
Therefore weighting the benefits from export against the losses of encouraging it falls to be the
concern of the economy.
2.3 Empirical review
In this part of the literature review the researcher tries to magnify the impact of incentives
foreign direct investment and inflation. This is facilitated through the observation of the
arguments in different studies as well as the model measured effects of those factors in as much
countries as data is available and possible. By the end the researcher hopes to establish a link
between the prevailing empirical findings and the statement of the problem through the
background information.
2.3.1 Incentives
China is often quoted as an example of effective (tax) incentive policies. During its transition
period between the mid-1980s and mid-2000s, it experimented with a wide range of industrial
policy instruments, including tax incentives for special economic zones, reduced tax rates for
FDI, and tax holidays for strategic industries. FDI inflows accelerated during this period and the
country became a top destination for many multinationals. In a panel of 29 regions between 1985
to 1995, Chen and Kwan (2000) find, for instance, that special economic zones systematically
boosted FDI inflows. Examples of less effective tax incentives can be found in Africa. Providing
more generous tax incentives did not have any demonstrable effect on FDI (Van Parys and
James, 2010).
Evidence for 40 Latin American, Caribbean and African countries between 1985 and
2004suggests that changes in the length of tax holidays systematically increased FDI inflows.
These FDI inflows did not, however, increase total investment, nor did they increase economic
growth. This suggests full displacement of domestic by foreign capital (Klemm and Van Parys,
2010).
In 2000, the government of India removed incentives for exporters, except those located in
export processing zones or qualified as export-oriented units. Investment behavior hardly
changed due to this reform. Indeed, firms that lost their incentives maintained the same level of
investment as before, despite higher tax rates, similar to the control group that kept their
40
incentives. However, reported profits did respond aggressively to the loss of incentives. In
particular, reported pre-tax profits dropped by half on average in firms that lost their incentives,
despite little change in sales. (James, 2007).And hence countries are under taking tax expenditure
analysis with the help of international organizations. These countries include Kenya, Morocco,
South Africa and Tanzania from Africa. (Reside, 2006)
The World Bank Group finds that a few politically connected firms have captured tax incentives
in Egypt and Tunisia. This selective access caused a dual economy with large differences in
profitability between insiders and outsiders, undermining a level playing field and reducing
competition, significantly reducing job growth (Shiffbauer et al., 2015).
There are several examples of considerable discretionary interpretation. For instance, the
recently promulgated Foreign Investment Law of Myanmar loosely defines eligibility for tax
exemptions over a “suitable period” for businesses that are “beneficial for the State.”(Myanmar
Foreign Investment Law, 2012). The Gambia’s investment promotion authority confers a special
status on investors, which are then awarded special investment certificates entitling them to
benefit from incentive packages; the investment promotion authority states that ,“Apart from
these specific incentive packages, others can be negotiated with the Agency depending on the
strategic nature of the investment.” (James , 2014). Tanzania’s ‘Strategic Investor Status’ allows
companies investing over US$ 20 million to negotiate individual tax breaks. These “special
concessions to individual companies … have never formally been made public” (Tax Justice
Network, 2012). Haiti’s Investment Code covers virtually any economic activity and provides no
selection criteria to be applied by the inter-ministerial committee in charge of granting
discretionary incentives, which include both a 15-year CIT holiday and accelerated depreciation
(Investment law of Haiti, 1989).
In 2013, Jamaica undertook a major tax reform, eliminating many of its generous and
discretionary tax incentives. The Minister of Justice said: “The Jamaican economy has not been
well served by the existing regime of sector based incentives. The consensus is that such
incentives may have been partly responsible for Jamaica’s lackluster record of growth by
encouraging the misallocation of limited economic resources in our country.” (James, 2013)In
2009, India’s Ministry of Finance released a draft Direct Taxes Code and a discussion paper on
the bill, which recommended that India should move away from profit-based tax incentives in
41
favor of expenditure-based tax incentives. A final bill was sent to Parliament in 2010, and passed
to a Standing Committee on Finance (SCF), which released its report in March 2012.
The SCF report concurred with the Ministry of Finance that profit-based incentives facilitate
artificial tax planning, and that this form of incentive should no longer be granted (while existing
tax holidays previously granted for firms in special economic zones would continue to be
respected) (Standing Committee on Finance 2011-12).
Egypt passed a new income tax law in mid-2005 that provided for the phasing out of tax holidays
while grandfathering current beneficiaries. Between 2005 and 2006, FDI into Egypt doubled.
(Keen and Mansour, 2010)
In 2006, Mauritius normalized the taxation of its export processing zone companies with that in
other sectors and removed all provisions relating to tax credits and tax holidays (except for a
four-year income tax holiday for small business). At the same time, the corporate tax rate was
gradually reduced from 25 to 15 percent in 2008. (Keen and Mansour, 2010)
In his latest budget speech, the Finance Minister of India proposed to reduce the corporate tax
rate from 30 to 25 percent over the next 4 years, accompanied by rationalization and removal of
various tax incentives and exemptions, which, he argues, have led to pressure groups, litigation
and loss of revenue. The Minister expects base broadening and rate reduction to lead to higher
levels of investment and growth and more jobs (Government of India, Ministry of Finance,
February 28, 2015). Of 7,000 companies in 19 Sub-Saharan African countries active in
agriculture, mining, manufacturing, utilities, construction, and services sectors. Investors were
asked to rank the importance of twelve location factors and to assess how they might have
changed, improved and worsened. The results suggest that tax incentives packages ranked 11th
out of 12 in importance; and this importance fell over time. (UNIDO, 2011).In addition a serious
of discussions are taking place among the western eastern and southern Africa states in order to
set collective tax incentive frame work where their interest is safeguarded. (Cebotari et al.,
2013).hence it can be concluded that there are numerous advantaged through incentive while
some have regrets and amendments for it’s short falls.
42
2.3.2 Foreign direct investment
Though the exact effect of tax competition on tax revenue is ambiguous It’s cause is deep rooted
in foreign direct investment attraction. The OECD have declared tax competition to be harmful
while the Monetary Union of West African States have decided to harmonize their tax incentives
for foreign direct investments.( Jacques M. and Neda P.,2000)
On the other hand there is evidence that tax competition and foreign direct investment have
adverse effect on corporate tax revenue. In fact, these effects may have already become evident
in the sharp decline in corporate tax revenue in some member countries of the OECD. It is
interesting that the countries experiencing revenue declines also offer the least attractive
corporate tax regimes within the OECD. Although part of the decline can be attributed to
business-cycle variations or changes in tax codes, its extent and persistence suggest that
additional factors may be at work, including the direction and size of FDI flows. (Reint Gropp
and Kristina Kostial, 2001)
A study examining the effect of foreign direct investment on the host country’s tax revenue
considers such variables as relevant to the contribution of the economy: 1.compitition effect
2.demand creation effect 3.technology transfer costs and 4.technology spillovers analyzing these
variables using a model, the outcome suggests the competition effect reduces production of
domestic firms and thereby, lowers the level of corporate tax revenue. ( Huu Thanh Tam
Nguyen, Manh Hung Nguyen, Aditya Goenka,2010)
Publics across the world, forced to bear the pain of tax increases or cuts to public services – even
as just 62 people own half the world’s wealth– have had enough. In response, world leaders are
saying things must change. If governments want to make change happen and end the race to the
bottom in corporate taxation, they must launch a new generation of comprehensive international
tax reforms. This suggestion of the publication is summarized from the idea that corporate tax
payers are paying less tax for the sake of multi nationals’ attraction. As a result the government
is either facing financial (revenue) problem to tackle poverty or it is compensating the loss
through taxing the poor which has double effect on the poverty alleviation.(OXFAM,2016)
43
2.3.3 Inflation
The impact of inflation on the business income tax has already been observed that countries have
adjusted their tax for inflation. In countries like Argentina, Brazil and OECD have already been
adjusted and further is recommended for countries that have not yet. For high, average and low
inflation countries some adjusting methods have been recommended because even if the rate of
inflation is low it has it’s own impact on business income tax. For example, if the inflation rate is
2 percent and the real rate of interest is 4 percent, the inflationary component is one-third the
nominal interest rate of 6 percent. The absence of inflation adjustment can result in a substantial
incentive to borrow in order to earn tax-deferred income. (Victor Thuronyi,1998)
Inflation can alter the characteristics of tax- and contribution systems in numerous ways. A novel
European tax-benefit model was used to look at the distortions of the tax schedule in Germany,
The Netherlands and the UK. The integrated framework provided by the model permits the use
of common income concepts across countries and therefore enables one to make informative
comparisons of the distributive consequences of the inflation induced erosion of tax-band limits,
thresholds, deductions, tax credits, etc.
Real income tax revenues rise and receipts from employee social insurance fall when policy rules
are not adjusted for inflation. The revenue effects can be very substantial –even at the presently
prevailing low inflation rates. If tax and contribution rules were left unadjusted, Dutch income
tax payers would experience the largest tax increases. In Germany, where there is no statutory up
rating regime and where income taxes are relatively more important than in The Netherlands, the
increase in tax revenues is also large.
The inflation adjustment regimes used in The Netherlands and the UK are successful in
counteracting the distortions during times of inflation. However, tax revenues and contributions
can still vary depending on (1) whether inflation rises or falls; (2) the size of the time lags built
into the adjustment process; and (3) differences between the consumer price index and the index
used for up rating. (Herwig Immervoll, 2016)
From another regression model the analysis suggests that the inflation rate in a country was
significant and directly affect the components of tax revenue especially taxes on goods and
services (GST). The higher inflation rate in low and middle income countries has the highest
percentage of GST to total tax revenue ratio.(Taufik Abdul Hakim and Imbarine Bujang,2012)
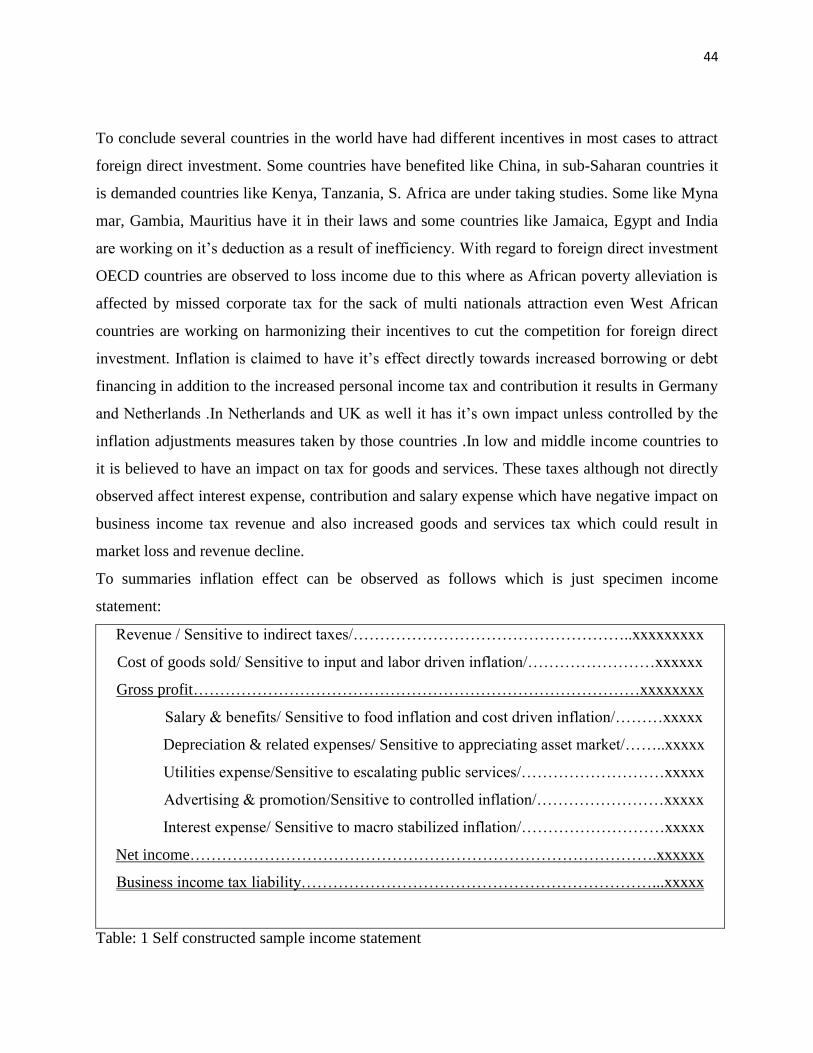
44
To conclude several countries in the world have had different incentives in most cases to attract
foreign direct investment. Some countries have benefited like China, in sub-Saharan countries it
is demanded countries like Kenya, Tanzania, S. Africa are under taking studies. Some like Myna
mar, Gambia, Mauritius have it in their laws and some countries like Jamaica, Egypt and India
are working on it’s deduction as a result of inefficiency. With regard to foreign direct investment
OECD countries are observed to loss income due to this where as African poverty alleviation is
affected by missed corporate tax for the sack of multi nationals attraction even West African
countries are working on harmonizing their incentives to cut the competition for foreign direct
investment. Inflation is claimed to have it’s effect directly towards increased borrowing or debt
financing in addition to the increased personal income tax and contribution it results in Germany
and Netherlands .In Netherlands and UK as well it has it’s own impact unless controlled by the
inflation adjustments measures taken by those countries .In low and middle income countries to
it is believed to have an impact on tax for goods and services. These taxes although not directly
observed affect interest expense, contribution and salary expense which have negative impact on
business income tax revenue and also increased goods and services tax which could result in
market loss and revenue decline.
To summaries inflation effect can be observed as follows which is just specimen income
statement:
Revenue / Sensitive to indirect taxes/……………………………………………..xxxxxxxxx
Cost of goods sold/ Sensitive to input and labor driven inflation/……………………xxxxxx
Gross profit…………………………………………………………………………xxxxxxxx
Salary & benefits/ Sensitive to food inflation and cost driven inflation/………xxxxx
Depreciation & related expenses/ Sensitive to appreciating asset market/……..xxxxx
Utilities expense/Sensitive to escalating public services/………………………xxxxx
Advertising & promotion/Sensitive to controlled inflation/……………………xxxxx
Interest expense/ Sensitive to macro stabilized inflation/………………………xxxxx
Net income…………………………………………………………………………….xxxxxx
Business income tax liability…………………………………………………………...xxxxx
Table: 1 Self constructed sample income statement
45
It can be deduced that in order to earn more in business income tax all incentives, foreign direct
investment and inflation can be used. This is because incentive targets increased currency
reserve; foreign direct investment can also serve as a means to achieve this while inflation
simply escalates product prices which are nearly off sated by expenses and further regulated by
taxes. Based on theories incentive is solely revenue agent while foreign direct investors look
after their returns. Inflation theories set macro and fiscal policy to be basic drivers which allow
interaction and instrument for benefit and economic control theories of business income tax.
Practice indicates many countries are rushing in to incentives with some reservations. Stiff
competition for foreign direct investment even damaging some OECD countries and inflation
prevails on both income and expense of firms.

46
CHAPTER 3- RESEARCH METHODOLOGY
As it is a well established fact that research methodology at the core of any valuable study, this
chapter tries to discuss the means and techniques applied to enhance the quality of the same. It
tells of the road map the researcher depicted to achieve the results aimed at the beginning of the
study. It also justifies the reasons for the structures of the road map.
3.1. Research approach and design
This research is of the type that tries to explain the relationship between different variables based
on quantitative data.Explanatory studies look for explanations of the nature of certain
relationships. Hypothesis testing provides an understanding of the relationships that exist
between variables (Research Methods_Some Notes.pdf,)
Because of this reason the study is explanatory, however the study is not ignorant of descriptive
statistical tools in analyzing the variables. Regarding the analysis based on the data obtained
quantitative analysis is intended. (John W., 2003). In this study time series data is obtained from
the Ethiopian investment commission, ministry of finance and economic cooperation, Ethiopian
customs and revenue authority As well as World Bank African development indicators database.
These data compiled by SPSS version 23 would be used to asses and quantify the relationship
among the variables considered. By the end the quantitative data analysis would result in the
appropriate recommendations to assist policy makers.
3.2. Data types
In this study primary and secondary data sources are used. As it is well known primary data is
first hand information from the source that has not been extracted and organized before while
secondary data is a well organized data. Accordingly primary data sources incorporate Data and
Original Research ,Diaries and Journals, Speeches and Interviews, Letters and Memos,
Autobiographies and Memoirs,Government Documents, Census Statistics, Organizational
Records, Documentaries, Photographs and Internet communications. On the other hand
Secondary sources are comprised of Most journal articles (unless written at the time of the
event), Most published books (unless written at the time of the event), Abstracts of articles,
Paraphrased quotations, Dictionaries and Textbooks.(Source: www.concordia.edu/library)

47
The primary data are critical in revealing the statistical relation between the aforementioned
variables along with the dimension and direction. To facilitate this 30 years data of the foreign
direct investment, inflation rate and incentives provided would be compared to business income
tax data for the same period. These are quantitative data obtained from record and publications of
the respective institutions. The publications, records, archives and data banks of those
institutions have been considered for completeness.
The secondary data have played irreplaceable role in establishing the concepts, theories and
evidences serving as a springboard for the attainment of the study objective. The various issues
regarding business income tax trend, the causes for the fluctuations and the related scenarios
observations all lied It’s foundation in these secondary data sources. The study was framed to
overview prevailing issues in the background and then elaborate the relations in the review of
related literature. To increase the credibility of the study wider investigation on the influencing
factors of business income tax revenue generation has been made. The sufficiency of the
available data for acute influencing variables has also been assessed. The preliminary evaluation
on the subject, scope and variables of the study are facilitated through the secondary data sources
in addition to observation and discussion with tax specialists .In particular secondary data
sources are obtained through the internet communication. A number of data availed in the form
of website information, manuals, and journals and largely in the form of published and
unpublished articles. It is indicated in the reference part that over 80 sources are sited.
3.3. Sample design
In every sampling concept population definition comes first the wide pool from which we have
to pick the sample .This population has certain characteristics and behaves in a certain pattern.
For us to exhaust all data form the whole population would be time consuming and cumbersome
so we apply the concept of sampling .Sampling is a technical process of selecting representative
individual respondent or data that can represent the population under observation.
(https://en.wikipedia.org/wiki/Sampling_(statistics)).
The next point to rise is the issue of sampling technique applied to result in representative data.
Valid data is similarity of the researcher and data source definition for the same population while
the reliability is about data parameter definition overtime and the accuracy of the data obtained
there by (Research Methods STA630,). For quantitative data, which we have in this study, the

48
time laps considered is 30 year record of the variables considered. This data is sufficient for the
analysis required both in terms of manifesting the relevant, useful model and statistical
recommendation for the applied data processing software i.e. SPSS (23). All of the data for the
specified duration is selected instead of random or any other systematic selection. The reason for
sampling variability is the population size ,the representation, data management and interaction
of final, time and data collector skills in addition to the very nature of variables involved
(C.R.Kothari,1985). In order to result in realistic regression model output It is necessary and vital
to include all the possible observations. To generalize there are three justifications for selecting
up to 30 years data for each institution data:
I. The unavailability of well organized data for prior periods
II. The representativeness of this data as majority from all the available data in the
institutions
III. The analysis is based on time series data so it should be analogous
Data type with
source
Total number of years
for which data is
available
Number of years
considered for the
study
Foreign direct investment-
Ethiopian Investment
Commission
26 26
Incentives- Ethiopian
Revenues and Customs
Authority source
10 10
Incentives- African
development indicators/
World bank data base
19 11
Inflation- Ethiopian Ministry
of Finance and Economic
36 30
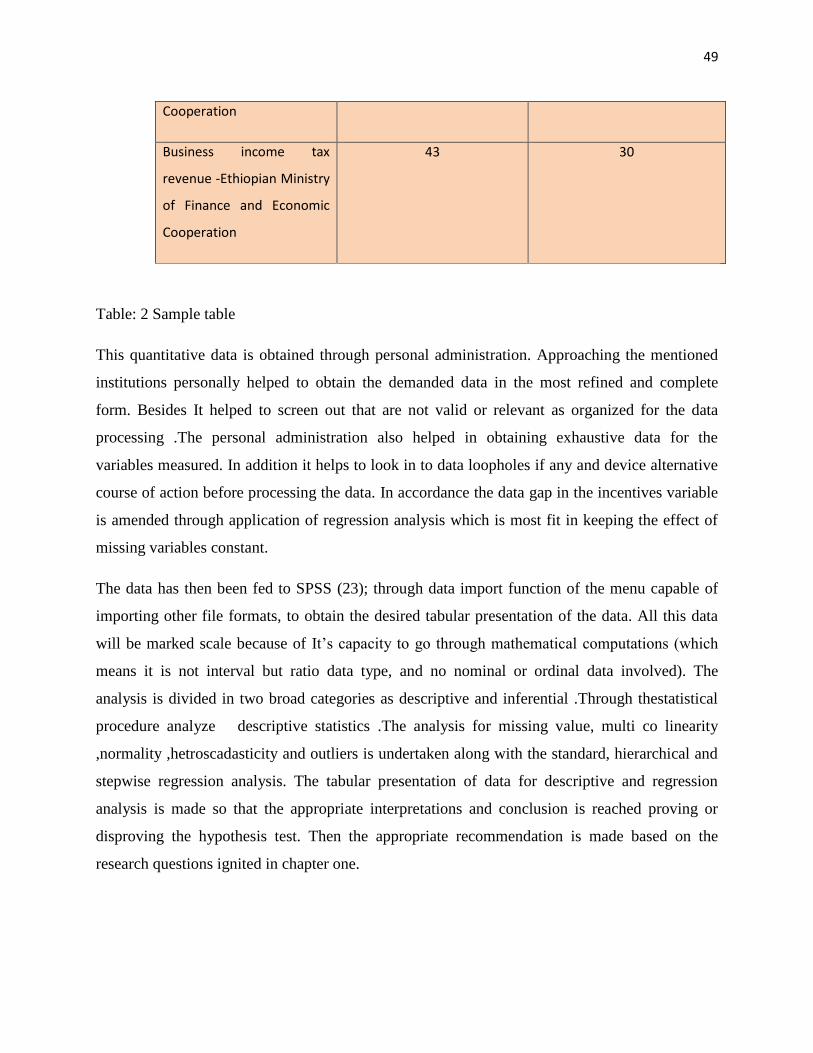
49
Cooperation
Business income tax
revenue -Ethiopian Ministry
of Finance and Economic
Cooperation
43 30
Table: 2 Sample table
This quantitative data is obtained through personal administration. Approaching the mentioned
institutions personally helped to obtain the demanded data in the most refined and complete
form. Besides It helped to screen out that are not valid or relevant as organized for the data
processing .The personal administration also helped in obtaining exhaustive data for the
variables measured. In addition it helps to look in to data loopholes if any and device alternative
course of action before processing the data. In accordance the data gap in the incentives variable
is amended through application of regression analysis which is most fit in keeping the effect of
missing variables constant.
The data has then been fed to SPSS (23); through data import function of the menu capable of
importing other file formats, to obtain the desired tabular presentation of the data. All this data
will be marked scale because of It’s capacity to go through mathematical computations (which
means it is not interval but ratio data type, and no nominal or ordinal data involved). The
analysis is divided in two broad categories as descriptive and inferential .Through thestatistical
procedure analyze descriptive statistics .The analysis for missing value, multi co linearity
,normality ,hetroscadasticity and outliers is undertaken along with the standard, hierarchical and
stepwise regression analysis. The tabular presentation of data for descriptive and regression
analysis is made so that the appropriate interpretations and conclusion is reached proving or
disproving the hypothesis test. Then the appropriate recommendation is made based on the
research questions ignited in chapter one.

50
3.4 Statistical Analysis
I. Descriptive Analysis
A. Range is the crudest measure of dispersion. It measures in what range the foreign direct
investment, inflation and export incentive falls. This helps analyze the trend of past performance
of each variable in order to determine the future contribution of each variable.
B. Minimum is the lowest possible observation in all the considered variables. It is highly
related to the measure of dispersion range but only observes the minimum amount recorded of
the variables considered.
C. Maximum this is the reciprocal of the minimum values; it considers only the upper most
value of the variables under observation. The figure says the highest amount each observed
variable registered in the past 30 years.
D.Sum is a statistical method listed among measures of central tendency. It implies the total
quantity of foreign direct investment, inflation and export incentives for the given years. It helps
us analyze the total amount obtained, exposed or provided during all the observation period.
E.Mean measures the average value for the sample distribution. This is another measure of
central tendency. It helps understand the average (not the maximum or minimum)value of
foreign direct investment, inflation as well as business income tax and incentives. There are
types of mean each of which are applicable to different types of distribution. Here applied is
arithmetic mean there are also geometric and harmonic means.
F.Standard deviation this is a widely known measure of dispersion. It indicates how dispersed
the individual observations are about the mean. This value is presented with the mean to express
the range of the data dispersion to the right and left of the mean value with a given level of
confidence interval. The more this value the more the data is scattered about the mean.
G. Variance the other well known measure of dispersion equally expressing the squared sum of
the distance of observations from the mean divided by the number of observations. It explains
the same thing as standard deviation tells but the figures vary since the standard deviation is the
square root of variance .In both case we observe how far on average individual observations are
away from the mean of the population.
51
H. Skewness is a measure of normality .It measures how the observations distribute across
increasing value straight line .A straight line across the distribution graph shows whether the
observations are abundant at the lower values at the upper values or just at the middle indicating
the normality of the distribution. Skewed to the left tells the majority of the observations fall
below the mean value. Skewed to the right on the other hand means majority of the observations
fall above the mean .Normal distribution is expected to have a skewness approaching zero.
I. Kurtosis is a measure of normality which tells how frequent the distributions are. It measures
the height of the distribution curve and the expected kurtosis value for normal distribution is
more than three. There are three forms of kurtosis curves namely: Leptokurtic- high and thin,
Mesokurtic - normal in shape and Platykurtic - flat and spread out.
J. The frequency distribution for this model has intentionally been omitted in this study
because the other functions like mean sum, maximum, minimum, and distribution plots of each
variable in addition to mode and median computations have been incorporated in the descriptive
analysis. However, the mode and median are irrelevant for the data type considered. This is
because data for all variables is neither nominal nor ordinal but scale. This implies quantitative
data capable of going through different statistical computations. Scale data in SPSS means ratio
or interval variable. But the mode and median apply to and are relevant for categorical data
namely categorical scores and ordinal data respectively. The sum, maximum and minimum have
been discussed in detail formerly. With respect to distribution curve of the involved variables the
histogram plots are presented. Once the frequency analysis is made it automatically generates the
number of observations along with missing values.
II. Inferential Analysis
K.Correlation is the measure of degree of association between two variables .It explains the
degree to which each of the variables under consideration are related. This analysis has got two
dimensions. The first one the relation or co movement of the dependent variable with it’s
respective predictors/ independent variables/. The other perspective is it measures the co
movement between the independent variables themselves. In fact higher percentage correlation
in this case is a pre caution on the existence of multi co linearity .There is specific test conducted
for this phenomenon, to be discussed later on. This procedure helps us determine the value for
hypothesis H1, H2 and H3.Since they are concerned about the relationship between business
52
income tax and foreign direct investment, inflation and incentives respectively, the association if
any and the level of this association is obtained from the correlation matrix.
L.Coefficient of determination (R2) measures to what extent the total variability in the
dependant variable is explained by the independent variables. The R2is not just about relation or
co movement it tells of the possible impact the independent variables have on the examined
dependant or predicted variable. In practice the R2value tends to increase with the number of
independent or predictor variables but this does not mean coefficient of determination has no
significant implication on the validity of the model. For more reliability the adjusted R2
is
considered .This means we need to reduce redundant values in R2 while computing the adjusted
R2 which makes it more reliable. In other words R
2 is about the precision in percentage of the
model.
M.ANOVA Analysis of variance comes in to picture just before preceding the coefficient table
analysis in applying multiple regressions .ANOVA is used to compare two means from two
independent (unrelated) groups using the F-distribution. The null hypothesis for the test is that
the two means are equal. Therefore, a significant result means that the two means are unequal. It
determines whether the model is statistically significant in explaining the relationship of the
variables. To ensure the significance the null hypothesis is always considered to be the
independent variables are identical or have the same mean. Therefore to proof the variability the
significance column is checked for. If the significance is less than 0.05 then the null hypothesis
which says the variables are of the same mean and identical is rejected; which means the
variables are tested fit for model formulation and there is justifiable association among them .If
greater than 0.05 the reverse holds true.
N.Test for multiple linear regressions It is based on statistician’s recommendation that the time
series data has been increased from 10 to 30 years to reduce model specification errors. This
analysis is performed in order to obtain the magnitude and direction of the relationship among all
the variables. Multiple linear regressions is applied in cases where more than one independent
variable has impact on the change in the given dependent variable. The name multiple stands for
the number of determinant or at least influencing factors compelled on the dependent variable
business income tax. Because there are three independent variables relating to business income
53
tax, in this specific study, this test explains H4,H5 and H6. From this analysis all the coefficients
for X1,X2 and X3 in addition to the value of the constant or the slope of the equation are obtained
.To make it easy for understanding. The regression model has been computed trice. This is not
just redundancy but it enables readers what impact the independent variables have on the
dependent variable business income tax through Standard multiple, Hierarchical and Stepwise
regression analysis clearly indicating what factors to focus on. Therefore the model applied in
chapter one is applied in the following manner.
3.5 Model Presentation
Y= βo + β1 X1 +β2X2 + β3X3+ei
Where Y= Total Business income tax revenue
βo = Y intercept
β1 = Coefficient of foreign direct investment
X1 = Foreign direct investment
β2 = Coefficient of inflation
X2 = Inflation
β3 = Coefficient of incentives
X3 = Incentives
ei=Error term
So this model would find the appropriate numerical values explaining how the predictor
variables affect the business income tax revenue in Ethiopia. Once the model is formulated the
rest of the analysis will be to define and interpret the observed relation. The coefficients of the
foreign direct investment, inflation and incentives indicate the unit change in the respective
variables required to bring about a single unit change in the dependent variable that is business
income tax. On the other hand the constant explains how much the value of business income tax
will be if all the independent variables did not exist.
3.6 Tests for Assumptions
In any study that involves statistical analysis there are standards or bench marks to ensure the
credibility of the analysis. As model formulation and regression analysis is among the many

54
there are testes for such recognition. Some of the tests for assumptions considered, which are
basic in any multiple regression analysis, are impacts of missing variable, test for normality,
presence of multi co linearity, test for homoscadasticity and test for out layers. The reason why
these testes are mandatory is. The existence of one or many of these phenomenon results in
disqualification of the analysis. Unless the impact of these incidences is kept constant or minimal
they usually result in worthless conclusion and recommendation.
Test for missing variables test for missing values can be checked by frequency distribution
table .In this analysis the total number of observations along with the missing values number can
be found. In fact missing value can result in miss leading conclusion. However there are methods
to reduce the effect of these missing data. According to Environmental Management center –
Mumbai note: Missing values or data gaps could be filled out in any of these techniques.1)Use
the average of the distribution to fill in data gaps.2) Taking mean of adjacent values,3) Linear
interpolation and 4) Using a “Regression model”. In this specific study it was quite an
opportunity as the SPSS (23) supports missing value damage neutralizing system through
exclusion of case pair wise .Just found in the regression analysis menu of options button, so here
applied is the same.
Test for normality this normality check is not similar to the one mentioned in the descriptive
analysis methodology. This is because in the descriptive analysis the concern was all about the
distribution of each variable considered, while in this test the predictive capacity of the model is
checked. The graph is plotted using continuous predicted values against the resulting residuals.
This all about computing the likely hood of the model telling what exactly could happen. In the
regression analysis plot button is indicated the inclination to the diagonal straight line (The
model) of the values proving tobe predictive through the normal p-p plot.
Test for multi co linearity if the independent variables are related each other it is impossible to
explain their association to the dependent variable free of the self-association effect. This implies
highly correlated independent variables should be discarded. The reason is the model fails to
measure the impact of the independent variables up on the dependent or predicted because the
relationship among the independent variables themselves is out shining how they appeared to be
factors influencing the dependent.VIF (Variance Inflation Factor) is the standard test for
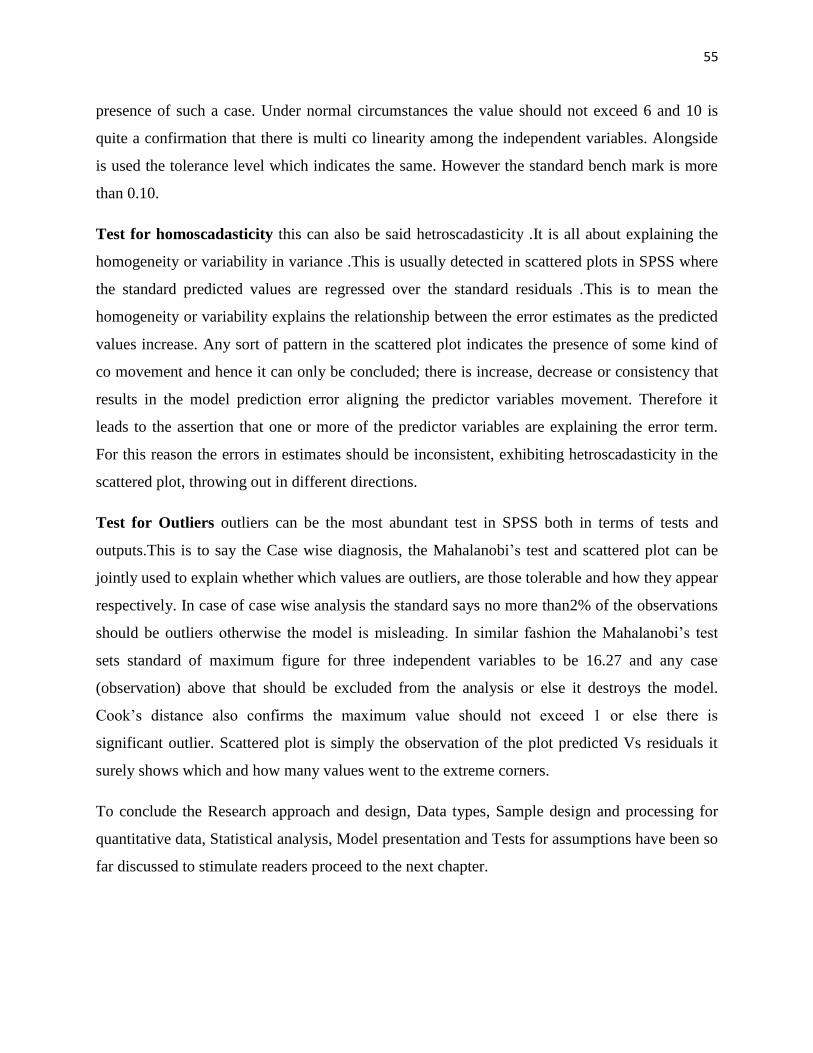
55
presence of such a case. Under normal circumstances the value should not exceed 6 and 10 is
quite a confirmation that there is multi co linearity among the independent variables. Alongside
is used the tolerance level which indicates the same. However the standard bench mark is more
than 0.10.
Test for homoscadasticity this can also be said hetroscadasticity .It is all about explaining the
homogeneity or variability in variance .This is usually detected in scattered plots in SPSS where
the standard predicted values are regressed over the standard residuals .This is to mean the
homogeneity or variability explains the relationship between the error estimates as the predicted
values increase. Any sort of pattern in the scattered plot indicates the presence of some kind of
co movement and hence it can only be concluded; there is increase, decrease or consistency that
results in the model prediction error aligning the predictor variables movement. Therefore it
leads to the assertion that one or more of the predictor variables are explaining the error term.
For this reason the errors in estimates should be inconsistent, exhibiting hetroscadasticity in the
scattered plot, throwing out in different directions.
Test for Outliers outliers can be the most abundant test in SPSS both in terms of tests and
outputs.This is to say the Case wise diagnosis, the Mahalanobi’s test and scattered plot can be
jointly used to explain whether which values are outliers, are those tolerable and how they appear
respectively. In case of case wise analysis the standard says no more than2% of the observations
should be outliers otherwise the model is misleading. In similar fashion the Mahalanobi’s test
sets standard of maximum figure for three independent variables to be 16.27 and any case
(observation) above that should be excluded from the analysis or else it destroys the model.
Cook’s distance also confirms the maximum value should not exceed 1 or else there is
significant outlier. Scattered plot is simply the observation of the plot predicted Vs residuals it
surely shows which and how many values went to the extreme corners.
To conclude the Research approach and design, Data types, Sample design and processing for
quantitative data, Statistical analysis, Model presentation and Tests for assumptions have been so
far discussed to stimulate readers proceed to the next chapter.
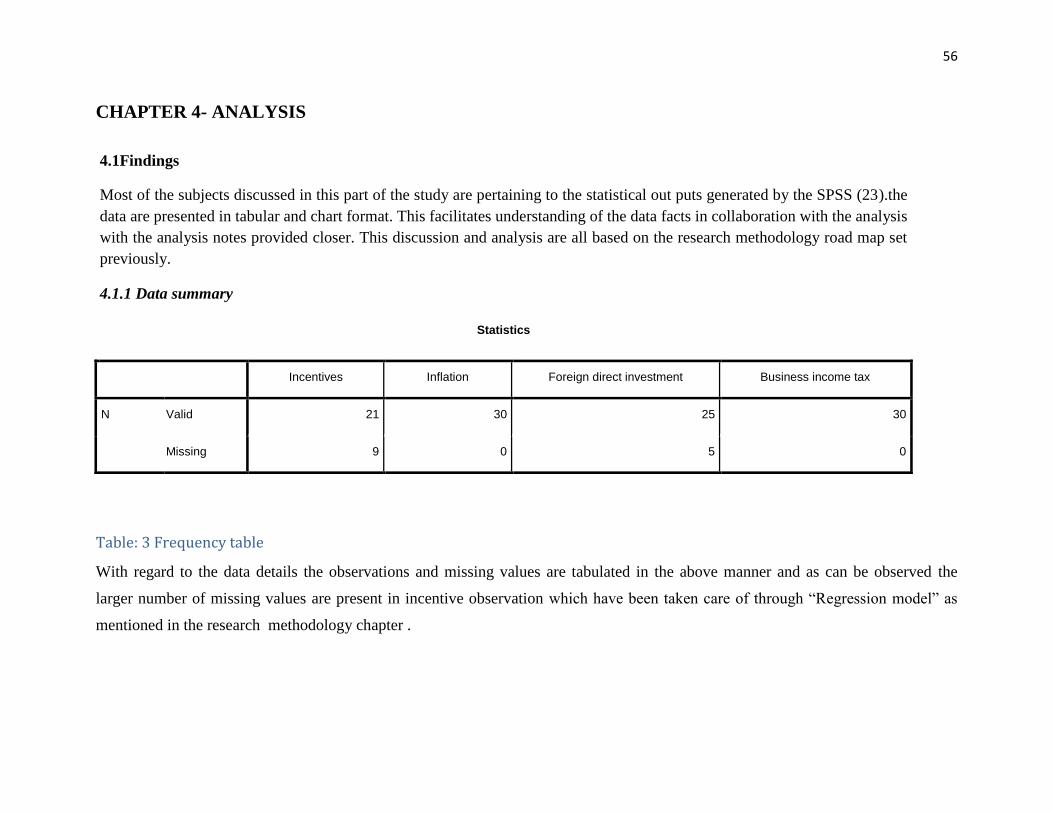
56
CHAPTER 4- ANALYSIS
4.1Findings
Most of the subjects discussed in this part of the study are pertaining to the statistical out puts generated by the SPSS (23).the
data are presented in tabular and chart format. This facilitates understanding of the data facts in collaboration with the analysis
with the analysis notes provided closer. This discussion and analysis are all based on the research methodology road map set
previously.
4.1.1 Data summary
Statistics
Incentives Inflation Foreign direct investment Business income tax
N Valid 21 30 25 30
Missing 9 0 5 0
Table: 3 Frequency table
With regard to the data details the observations and missing values are tabulated in the above manner and as can be observed the
larger number of missing values are present in incentive observation which have been taken care of through “Regression model” as
mentioned in the research methodology chapter .
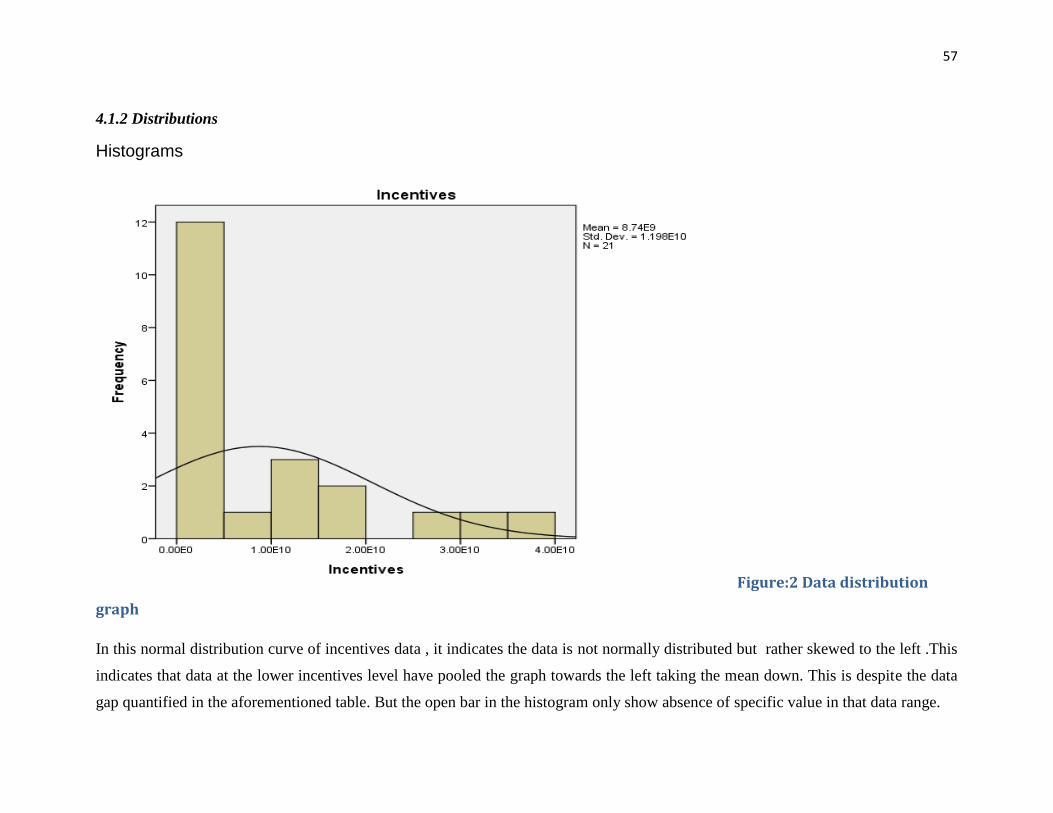
57
4.1.2 Distributions
Histograms
Figure:2 Data distribution
graph
In this normal distribution curve of incentives data , it indicates the data is not normally distributed but rather skewed to the left .This
indicates that data at the lower incentives level have pooled the graph towards the left taking the mean down. This is despite the data
gap quantified in the aforementioned table. But the open bar in the histogram only show absence of specific value in that data range.
58
Figure:3 Data distribution
graph

59
The graph for inflation does seem somehow normal since the curve is symmetric as it folds to the other side. However this does not
mean there are no ups and downs. There are even missing values for which data was not found. This only implies mean, median, and
mode of the distribution are found around the same place or are equal because they are not affected by extreme values.
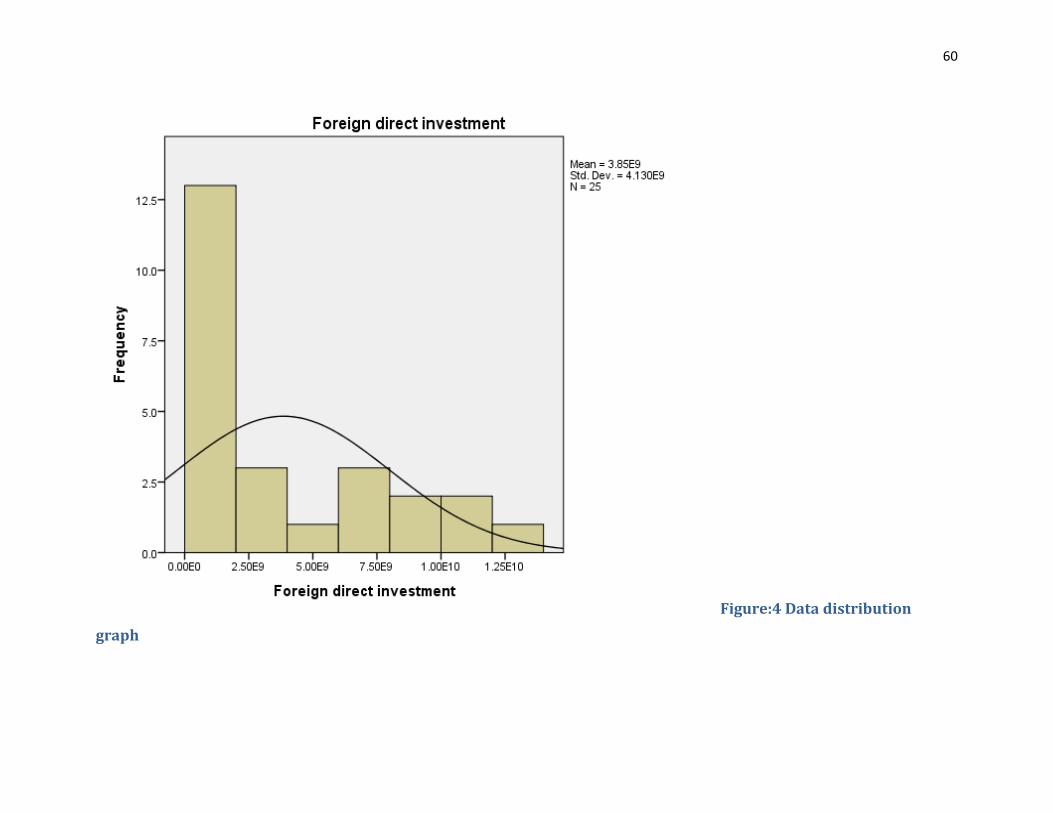
60
Figure:4 Data distribution
graph
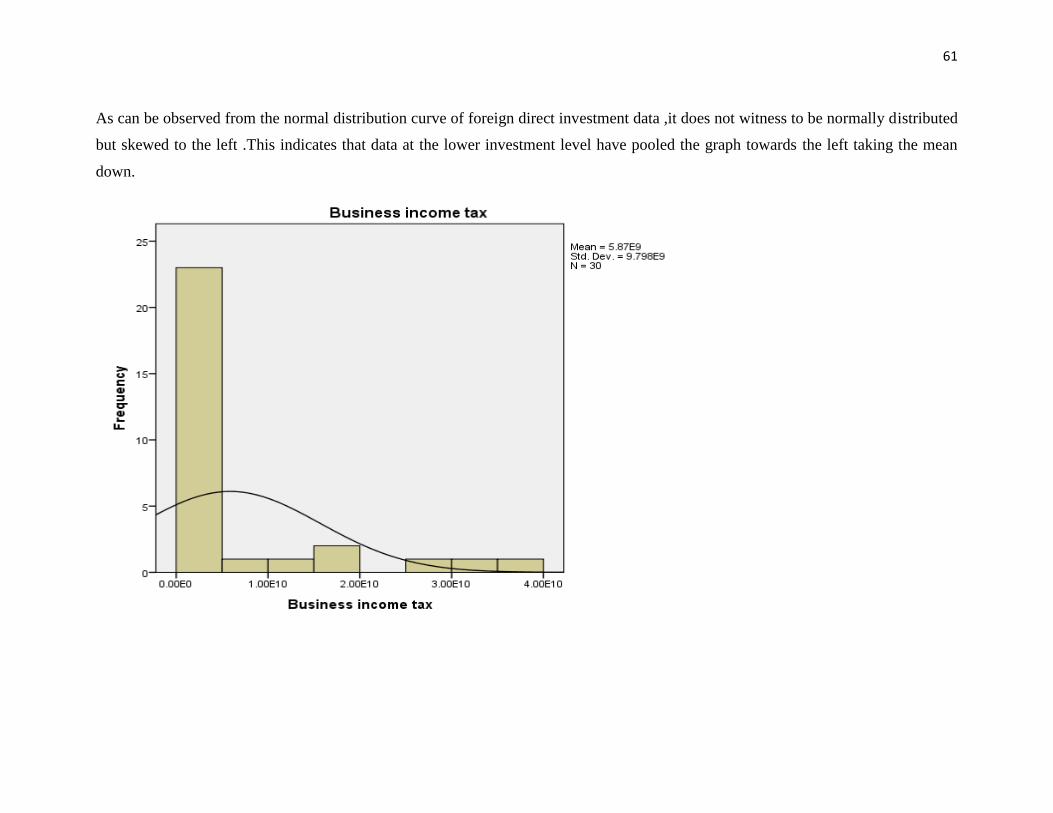
61
As can be observed from the normal distribution curve of foreign direct investment data ,it does not witness to be normally distributed
but skewed to the left .This indicates that data at the lower investment level have pooled the graph towards the left taking the mean
down.
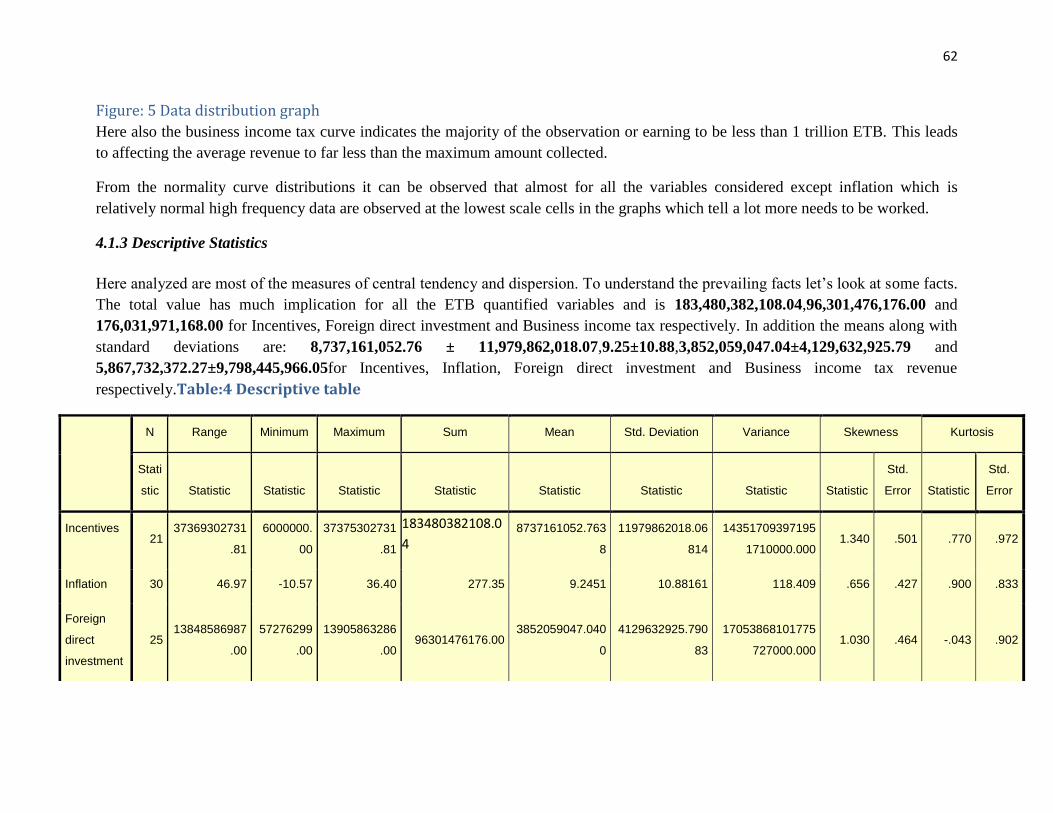
62
Figure: 5 Data distribution graph
Here also the business income tax curve indicates the majority of the observation or earning to be less than 1 trillion ETB. This leads
to affecting the average revenue to far less than the maximum amount collected.
From the normality curve distributions it can be observed that almost for all the variables considered except inflation which is
relatively normal high frequency data are observed at the lowest scale cells in the graphs which tell a lot more needs to be worked.
4.1.3 Descriptive Statistics
Here analyzed are most of the measures of central tendency and dispersion. To understand the prevailing facts let’s look at some facts.
The total value has much implication for all the ETB quantified variables and is 183,480,382,108.04,96,301,476,176.00 and
176,031,971,168.00 for Incentives, Foreign direct investment and Business income tax respectively. In addition the means along with
standard deviations are: 8,737,161,052.76 ± 11,979,862,018.07,9.25±10.88,3,852,059,047.04±4,129,632,925.79 and
5,867,732,372.27±9,798,445,966.05for Incentives, Inflation, Foreign direct investment and Business income tax revenue
respectively.Table:4 Descriptive table
N Range Minimum Maximum Sum Mean Std. Deviation Variance Skewness Kurtosis
Stati
stic Statistic Statistic Statistic Statistic Statistic Statistic Statistic Statistic
Std.
Error Statistic
Std.
Error
Incentives 21
37369302731
.81
6000000.
00
37375302731
.81
183480382108.0
4 8737161052.763
8
11979862018.06
814
14351709397195
1710000.000 1.340 .501 .770 .972
Inflation 30 46.97 -10.57 36.40 277.35 9.2451 10.88161 118.409 .656 .427 .900 .833
Foreign
direct
investment
25 13848586987
.00
57276299
.00
13905863286
.00 96301476176.00
3852059047.040
0
4129632925.790
83
17053868101775
727000.000 1.030 .464 -.043 .902

63
Business
income tax 30
36169924892
.00
36652000
0.00
36536444892
.00 176031971168.00
5867732372.266
7
9798445966.054
34
96009543349686
600000.000 2.123 .427 3.566 .833
Valid N
(listwise) 16
4.1.4 Inferential Statistics
4.1.4.1 Regression Output -1 /Standard multiple regression/
Descriptive Statistics
Mean Std. Deviation N
Business income tax 5867732372.2667 9798445966.05434 30
Incentives 8737161052.7638 11979862018.06814 21
Inflation 9.2451 10.88161 30
Foreign direct investment 3852059047.0400 4129632925.79083 25
Table: 5 variables information
Correlations
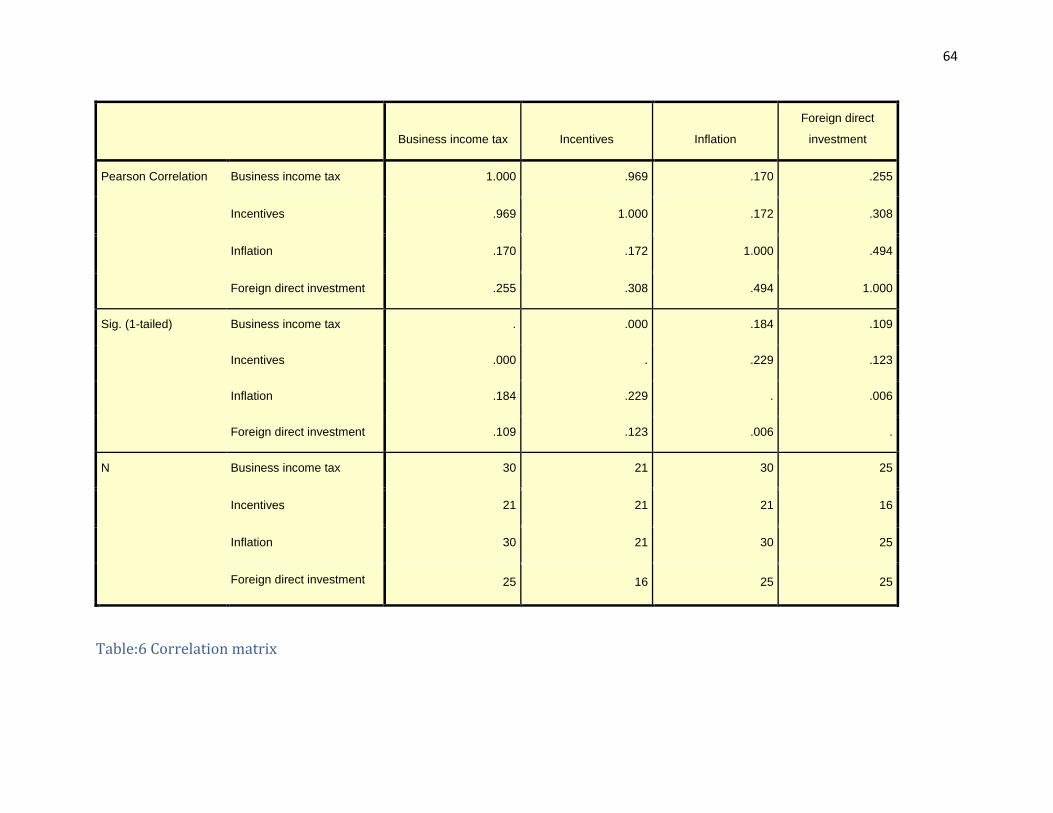
64
Business income tax Incentives Inflation
Foreign direct
investment
Pearson Correlation Business income tax 1.000 .969 .170 .255
Incentives .969 1.000 .172 .308
Inflation .170 .172 1.000 .494
Foreign direct investment .255 .308 .494 1.000
Sig. (1-tailed) Business income tax . .000 .184 .109
Incentives .000 . .229 .123
Inflation .184 .229 . .006
Foreign direct investment .109 .123 .006 .
N
Business income tax 30 21 30 25
Incentives 21 21 21 16
Inflation 30 21 30 25
Foreign direct investment 25 16 25 25
Table:6 Correlation matrix
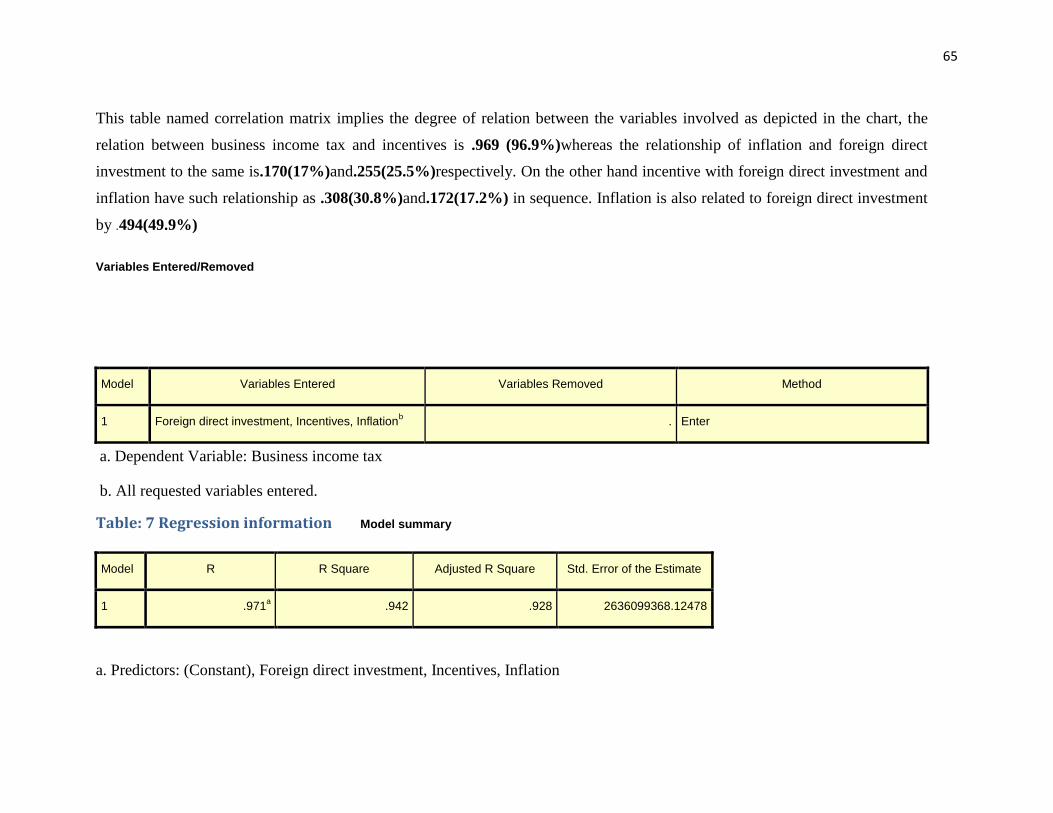
65
a. Dependent Variable: Business income tax
b. All requested variables entered.
Table: 7 Regression information Model summary
Model R R Square Adjusted R Square Std. Error of the Estimate
1 .971a .942 .928 2636099368.12478
a. Predictors: (Constant), Foreign direct investment, Incentives, Inflation
This table named correlation matrix implies the degree of relation between the variables involved as depicted in the chart, the
relation between business income tax and incentives is .969 (96.9%)whereas the relationship of inflation and foreign direct
investment to the same is.170(17%)and.255(25.5%)respectively. On the other hand incentive with foreign direct investment and
inflation have such relationship as .308(30.8%)and.172(17.2%) in sequence. Inflation is also related to foreign direct investment
by .494(49.9%)
Variables Entered/Removed
Model Variables Entered Variables Removed Method
1 Foreign direct investment, Incentives, Inflationb . Enter

66
b. Dependent Variable: Business income tax
Table:8 Coefficient of determination
ANOVAa
Model Sum of Squares df Mean Square F Sig.
1 Regression 1356754911701765000000.000 3 452251637233921600000.000 65.081 .000b
Residual 83388238543534310000.000 12 6949019878627859500.000
Total 1440143150245299400000.000 15
a. Dependent Variable: Business income tax
b. Predictors: (Constant), Foreign direct investment, Incentives, Inflation
Table:9 ANOVA table
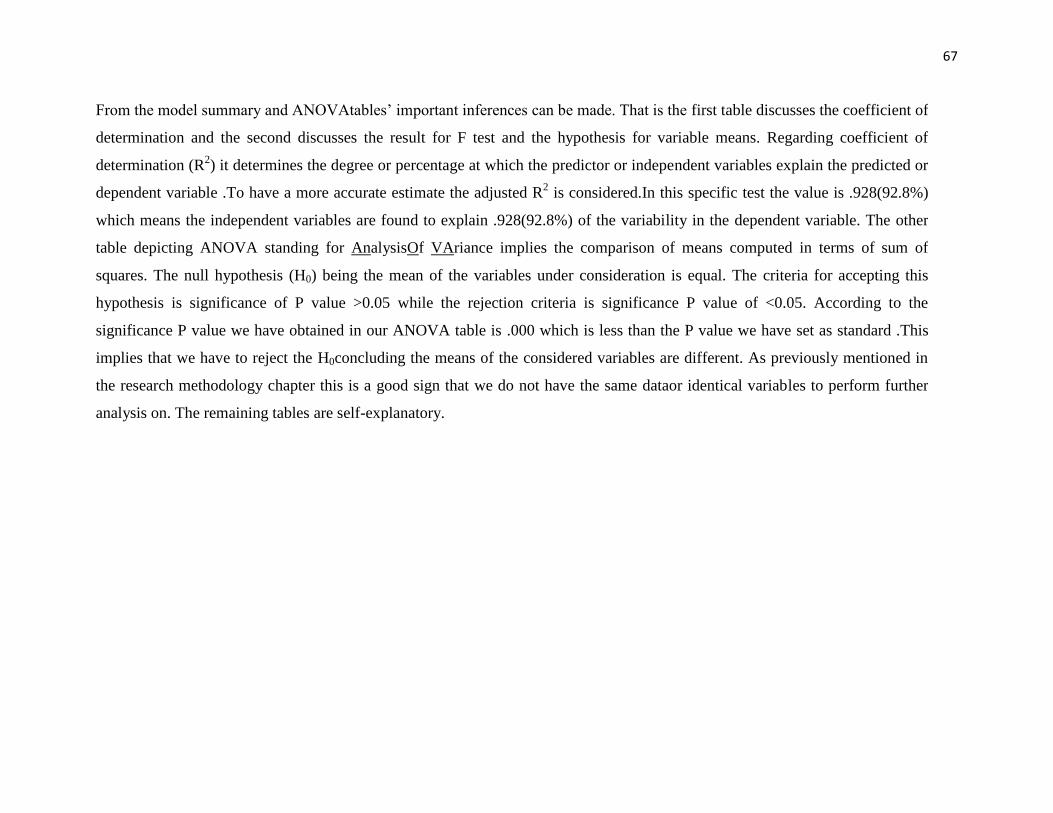
67
From the model summary and ANOVAtables’ important inferences can be made. That is the first table discusses the coefficient of
determination and the second discusses the result for F test and the hypothesis for variable means. Regarding coefficient of
determination (R2) it determines the degree or percentage at which the predictor or independent variables explain the predicted or
dependent variable .To have a more accurate estimate the adjusted R2 is considered.In this specific test the value is .928(92.8%)
which means the independent variables are found to explain .928(92.8%) of the variability in the dependent variable. The other
table depicting ANOVA standing for AnalysisOf VAriance implies the comparison of means computed in terms of sum of
squares. The null hypothesis (H0) being the mean of the variables under consideration is equal. The criteria for accepting this
hypothesis is significance of P value >0.05 while the rejection criteria is significance P value of <0.05. According to the
significance P value we have obtained in our ANOVA table is .000 which is less than the P value we have set as standard .This
implies that we have to reject the H0concluding the means of the considered variables are different. As previously mentioned in
the research methodology chapter this is a good sign that we do not have the same dataor identical variables to perform further
analysis on. The remaining tables are self-explanatory.
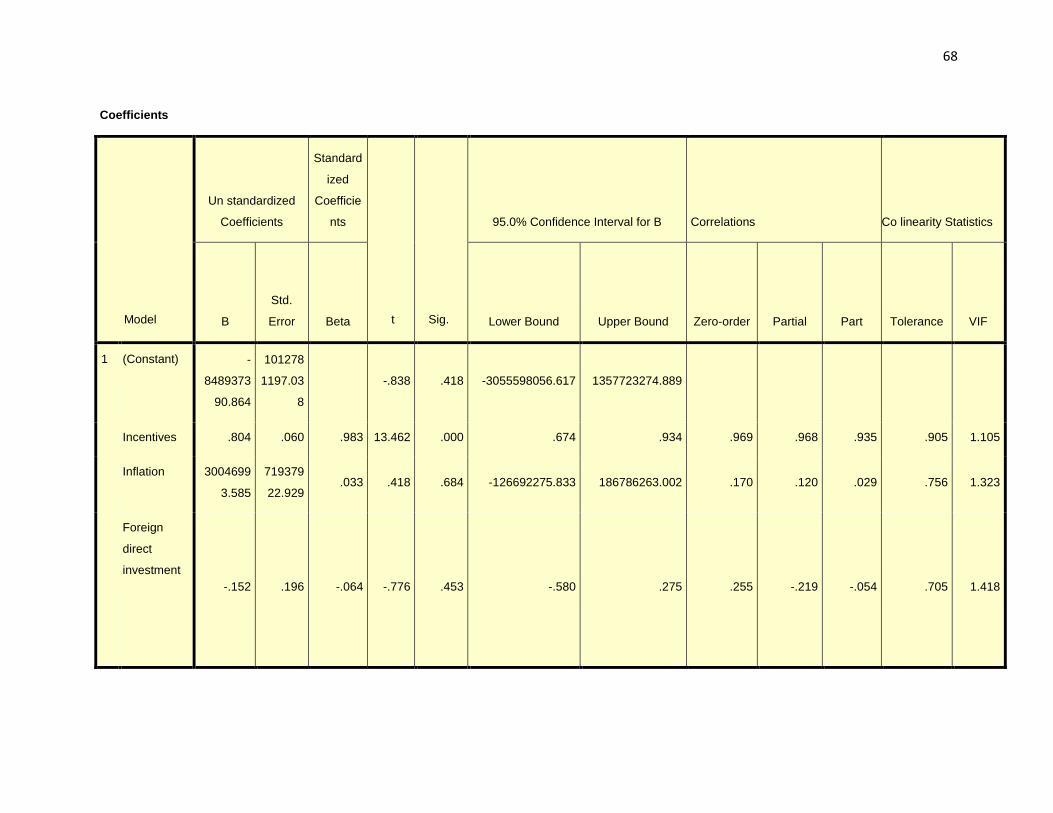
68
Coefficients
Model
Un standardized
Coefficients
Standard
ized
Coefficie
nts
t
Sig.
95.0% Confidence Interval for B Correlations
Co linearity Statistics
B
Std.
Error Beta Lower Bound Upper Bound Zero-order Partial Part Tolerance VIF
1 (Constant) -
8489373
90.864
101278
1197.03
8
-.838 .418 -3055598056.617 1357723274.889
Incentives .804 .060 .983 13.462 .000 .674 .934 .969 .968 .935 .905 1.105
Inflation 3004699
3.585
719379
22.929 .033 .418 .684 -126692275.833 186786263.002 .170 .120 .029 .756 1.323
Foreign
direct
investment
-.152 .196 -.064 -.776 .453 -.580 .275 .255 -.219 -.054 .705 1.418
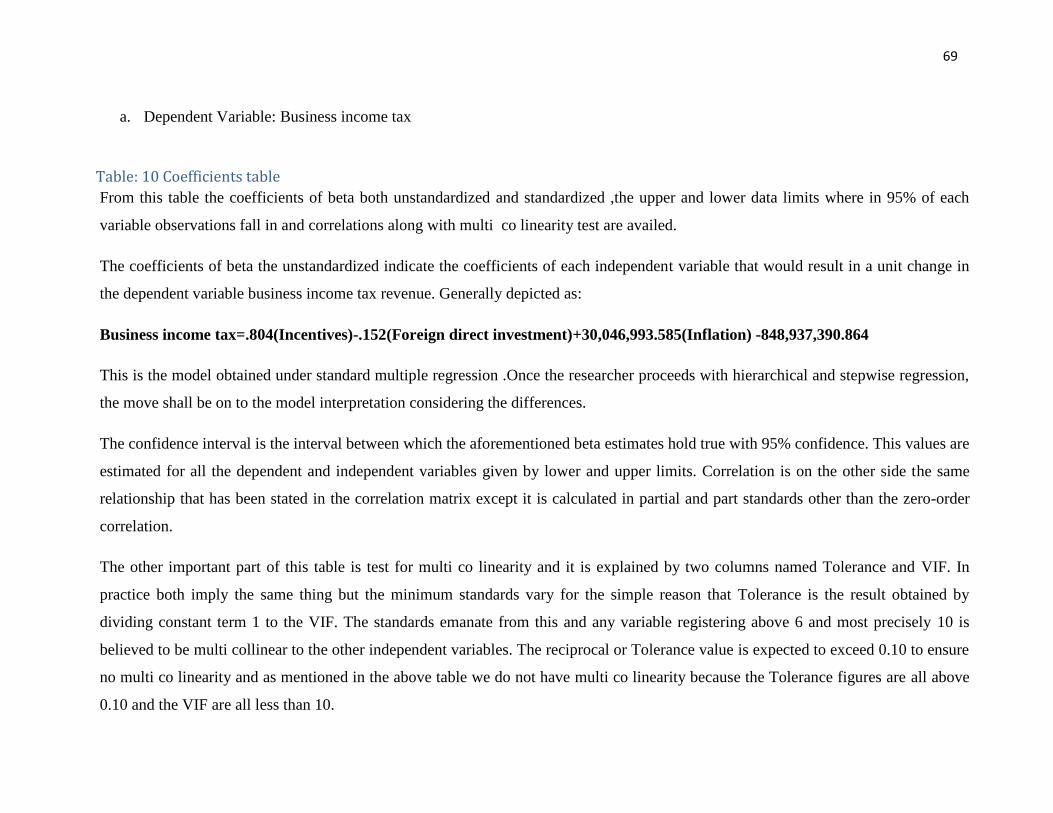
69
a. Dependent Variable: Business income tax
Table: 10 Coefficients table
From this table the coefficients of beta both unstandardized and standardized ,the upper and lower data limits where in 95% of each
variable observations fall in and correlations along with multi co linearity test are availed.
The coefficients of beta the unstandardized indicate the coefficients of each independent variable that would result in a unit change in
the dependent variable business income tax revenue. Generally depicted as:
Business income tax=.804(Incentives)-.152(Foreign direct investment)+30,046,993.585(Inflation) -848,937,390.864
This is the model obtained under standard multiple regression .Once the researcher proceeds with hierarchical and stepwise regression,
the move shall be on to the model interpretation considering the differences.
The confidence interval is the interval between which the aforementioned beta estimates hold true with 95% confidence. This values are
estimated for all the dependent and independent variables given by lower and upper limits. Correlation is on the other side the same
relationship that has been stated in the correlation matrix except it is calculated in partial and part standards other than the zero-order
correlation.
The other important part of this table is test for multi co linearity and it is explained by two columns named Tolerance and VIF. In
practice both imply the same thing but the minimum standards vary for the simple reason that Tolerance is the result obtained by
dividing constant term 1 to the VIF. The standards emanate from this and any variable registering above 6 and most precisely 10 is
believed to be multi collinear to the other independent variables. The reciprocal or Tolerance value is expected to exceed 0.10 to ensure
no multi co linearity and as mentioned in the above table we do not have multi co linearity because the Tolerance figures are all above
0.10 and the VIF are all less than 10.
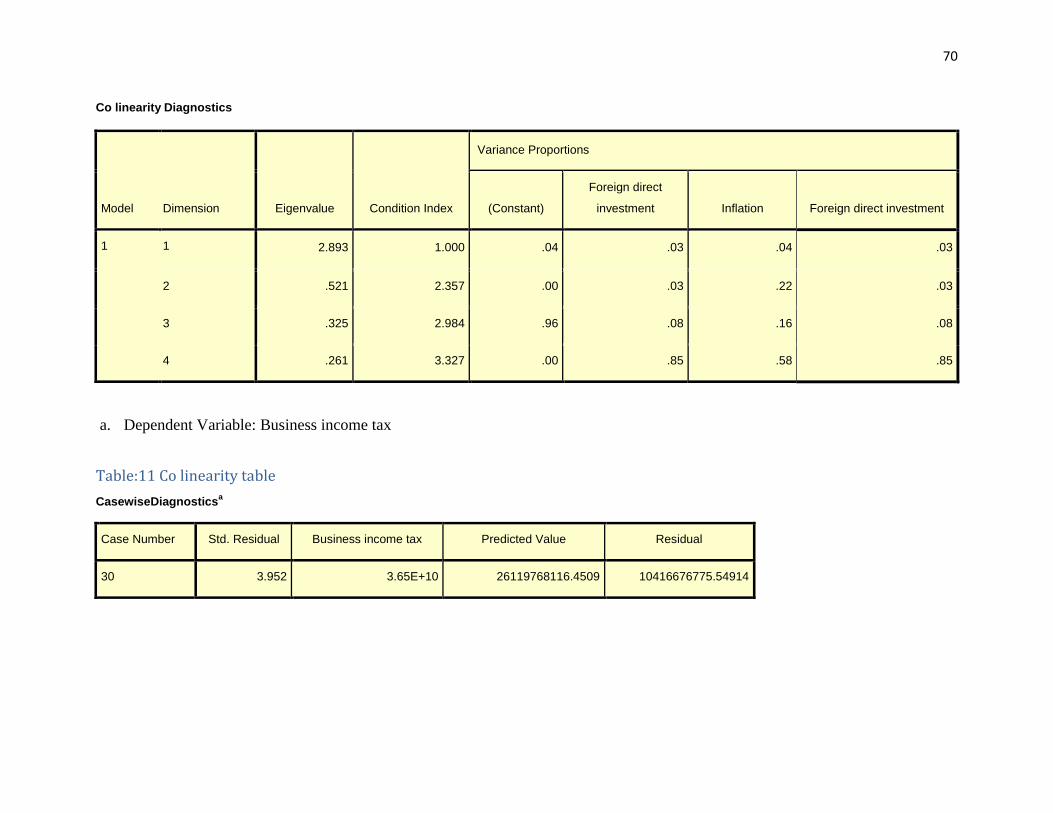
70
Co linearity Diagnostics
Model Dimension Eigenvalue Condition Index
Variance Proportions
(Constant)
Foreign direct
investment Inflation Foreign direct investment
1 1 2.893 1.000 .04 .03 .04 .03
2 .521 2.357 .00 .03 .22 .03
3 .325 2.984 .96 .08 .16 .08
4 .261 3.327 .00 .85 .58 .85
a. Dependent Variable: Business income tax
Table:11 Co linearity table
CasewiseDiagnosticsa
Case Number Std. Residual Business income tax Predicted Value Residual
30 3.952 3.65E+10 26119768116.4509 10416676775.54914
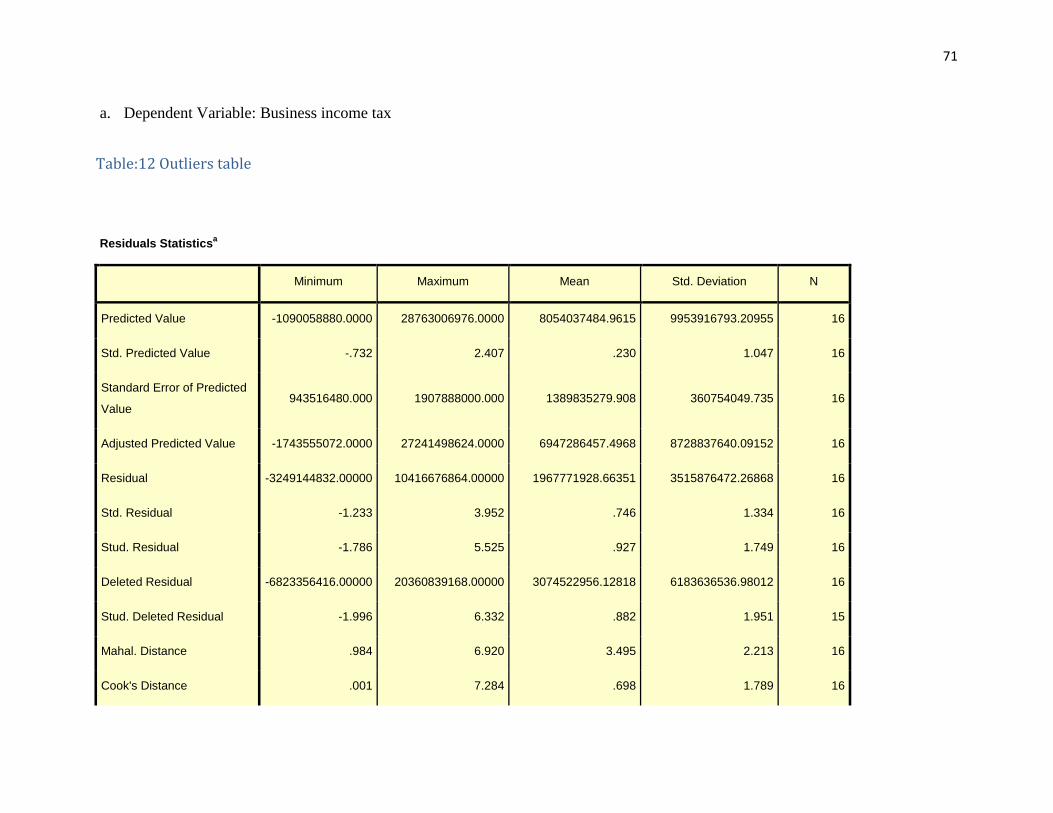
71
a. Dependent Variable: Business income tax
Table:12 Outliers table
Residuals Statisticsa
Minimum Maximum Mean Std. Deviation N
Predicted Value -1090058880.0000 28763006976.0000 8054037484.9615 9953916793.20955 16
Std. Predicted Value -.732 2.407 .230 1.047 16
Standard Error of Predicted
Value 943516480.000 1907888000.000 1389835279.908 360754049.735 16
Adjusted Predicted Value -1743555072.0000 27241498624.0000 6947286457.4968 8728837640.09152 16
Residual -3249144832.00000 10416676864.00000 1967771928.66351 3515876472.26868 16
Std. Residual -1.233 3.952 .746 1.334 16
Stud. Residual -1.786 5.525 .927 1.749 16
Deleted Residual -6823356416.00000 20360839168.00000 3074522956.12818 6183636536.98012 16
Stud. Deleted Residual -1.996 6.332 .882 1.951 15
Mahal. Distance .984 6.920 3.495 2.213 16
Cook's Distance .001 7.284 .698 1.789 16

72
Centered Leverage Value .066 .461 .233 .148 16
a. Dependent Variable: Business income tax

73
Table:13 Outliers test table
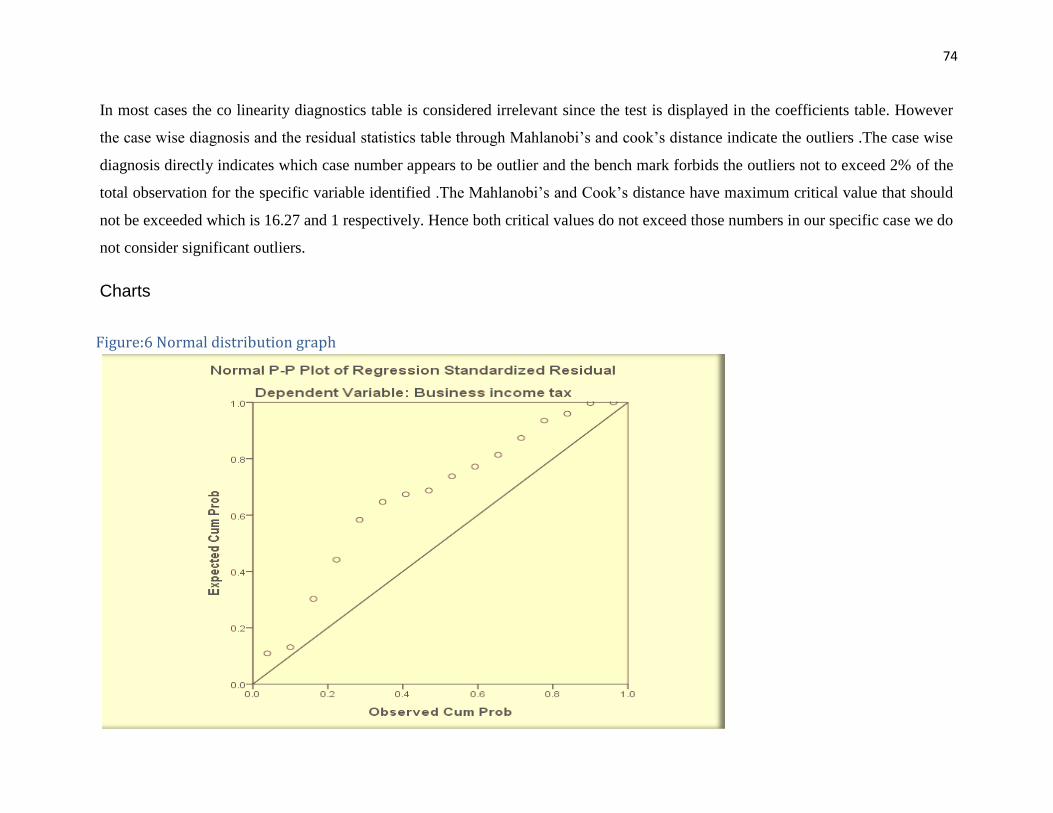
74
In most cases the co linearity diagnostics table is considered irrelevant since the test is displayed in the coefficients table. However
the case wise diagnosis and the residual statistics table through Mahlanobi’s and cook’s distance indicate the outliers .The case wise
diagnosis directly indicates which case number appears to be outlier and the bench mark forbids the outliers not to exceed 2% of the
total observation for the specific variable identified .The Mahlanobi’s and Cook’s distance have maximum critical value that should
not be exceeded which is 16.27 and 1 respectively. Hence both critical values do not exceed those numbers in our specific case we do
not consider significant outliers.
Charts
Figure:6 Normal distribution graph
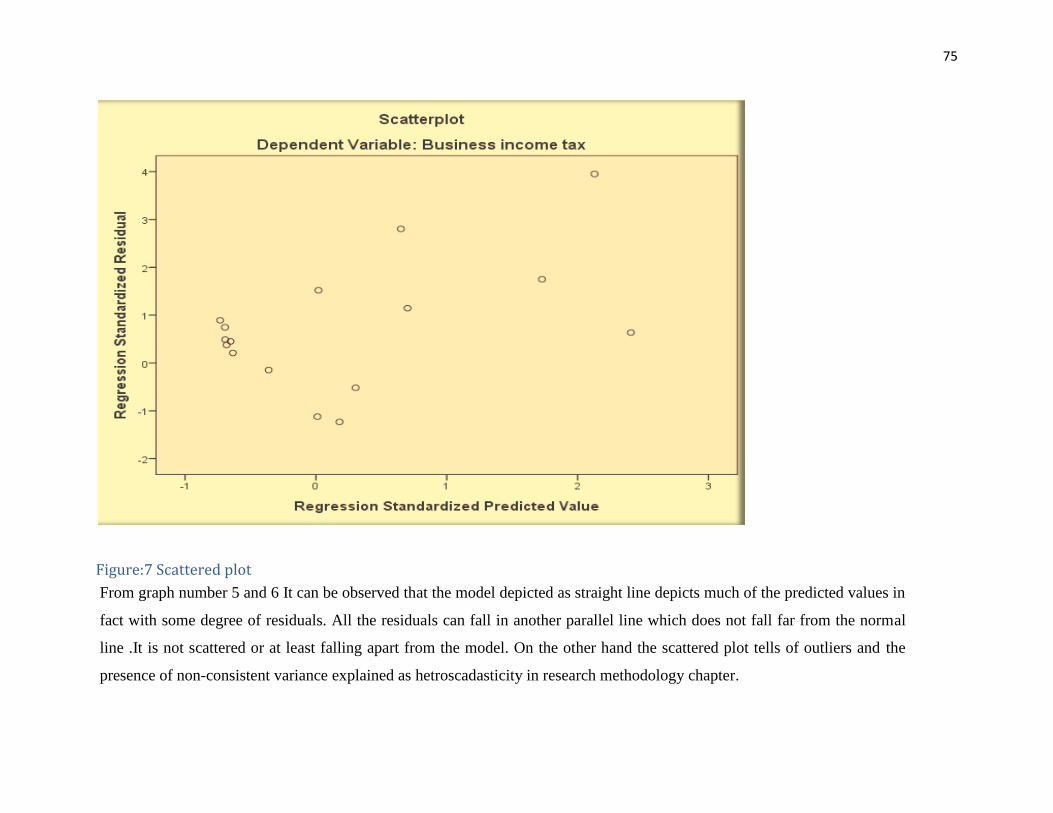
75
Figure:7 Scattered plot
From graph number 5 and 6 It can be observed that the model depicted as straight line depicts much of the predicted values in
fact with some degree of residuals. All the residuals can fall in another parallel line which does not fall far from the normal
line .It is not scattered or at least falling apart from the model. On the other hand the scattered plot tells of outliers and the
presence of non-consistent variance explained as hetroscadasticity in research methodology chapter.
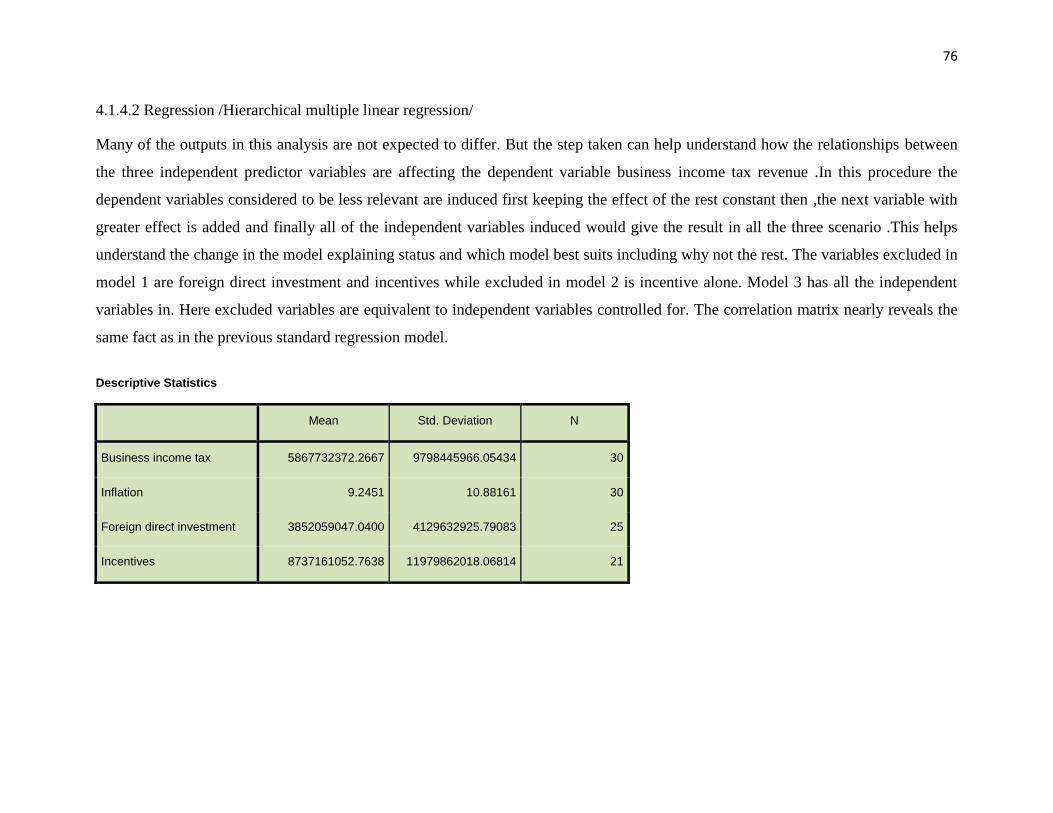
76
4.1.4.2 Regression /Hierarchical multiple linear regression/
Many of the outputs in this analysis are not expected to differ. But the step taken can help understand how the relationships between
the three independent predictor variables are affecting the dependent variable business income tax revenue .In this procedure the
dependent variables considered to be less relevant are induced first keeping the effect of the rest constant then ,the next variable with
greater effect is added and finally all of the independent variables induced would give the result in all the three scenario .This helps
understand the change in the model explaining status and which model best suits including why not the rest. The variables excluded in
model 1 are foreign direct investment and incentives while excluded in model 2 is incentive alone. Model 3 has all the independent
variables in. Here excluded variables are equivalent to independent variables controlled for. The correlation matrix nearly reveals the
same fact as in the previous standard regression model.
Descriptive Statistics
Mean Std. Deviation N
Business income tax 5867732372.2667 9798445966.05434 30
Inflation 9.2451 10.88161 30
Foreign direct investment 3852059047.0400 4129632925.79083 25
Incentives 8737161052.7638 11979862018.06814 21

77
Table:14 Variables information
Correlations
Business income tax Inflation
Foreign direct
investment Incentives
Pearson Correlation Business income tax 1.000 .170 .255 .969
Inflation .170 1.000 .494 .172
Foreign direct investment .255 .494 1.000 .308
Incentives .969 .172 .308 1.000
Sig. (1-tailed) Business income tax . .184 .109 .000
Inflation .184 . .006 .229
Foreign direct investment .109 .006 . .123
Incentives .000 .229 .123 .
N Business income tax 30 30 25 21
Inflation 30 30 25 21
Foreign direct investment 25 25 25 16
Incentives 21 21 16 21
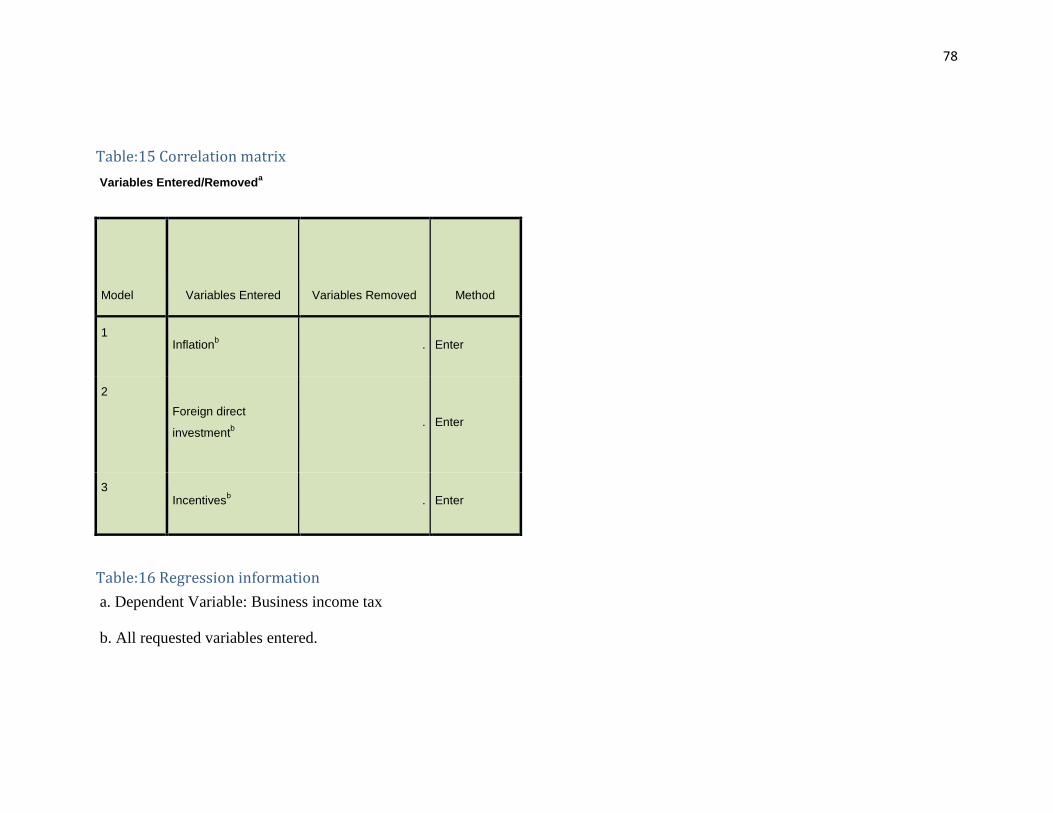
78
Table:15 Correlation matrix
Variables Entered/Removeda
Model Variables Entered Variables Removed Method
1 Inflation
b . Enter
2
Foreign direct
investmentb
. Enter
3 Incentives
b . Enter
Table:16 Regression information
a. Dependent Variable: Business income tax
b. All requested variables entered.
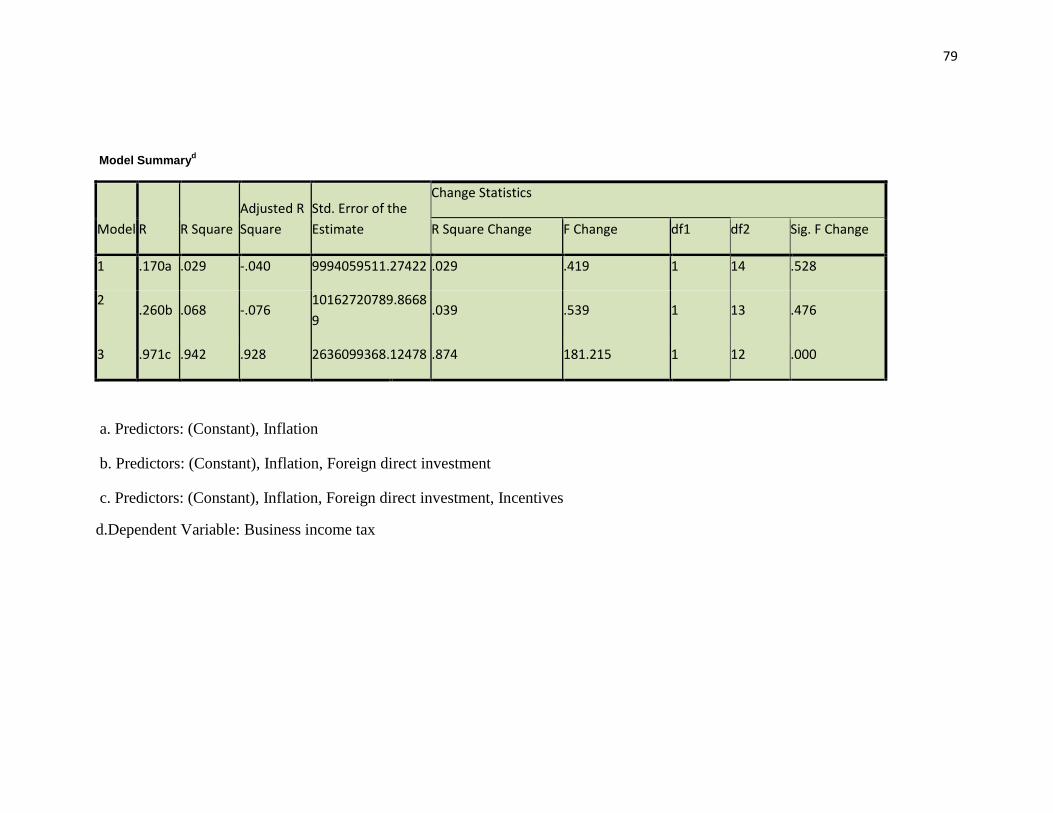
79
Model Summaryd
Model R R Square
Adjusted R
Square
Std. Error of the
Estimate
Change Statistics
R Square Change F Change df1 df2 Sig. F Change
1 .170a .029 -.040 9994059511.27422 .029 .419 1 14 .528
2 .260b .068 -.076
10162720789.8668
9 .039 .539 1 13 .476
3 .971c .942 .928 2636099368.12478 .874 181.215 1 12 .000
a. Predictors: (Constant), Inflation
b. Predictors: (Constant), Inflation, Foreign direct investment
c. Predictors: (Constant), Inflation, Foreign direct investment, Incentives
d.Dependent Variable: Business income tax
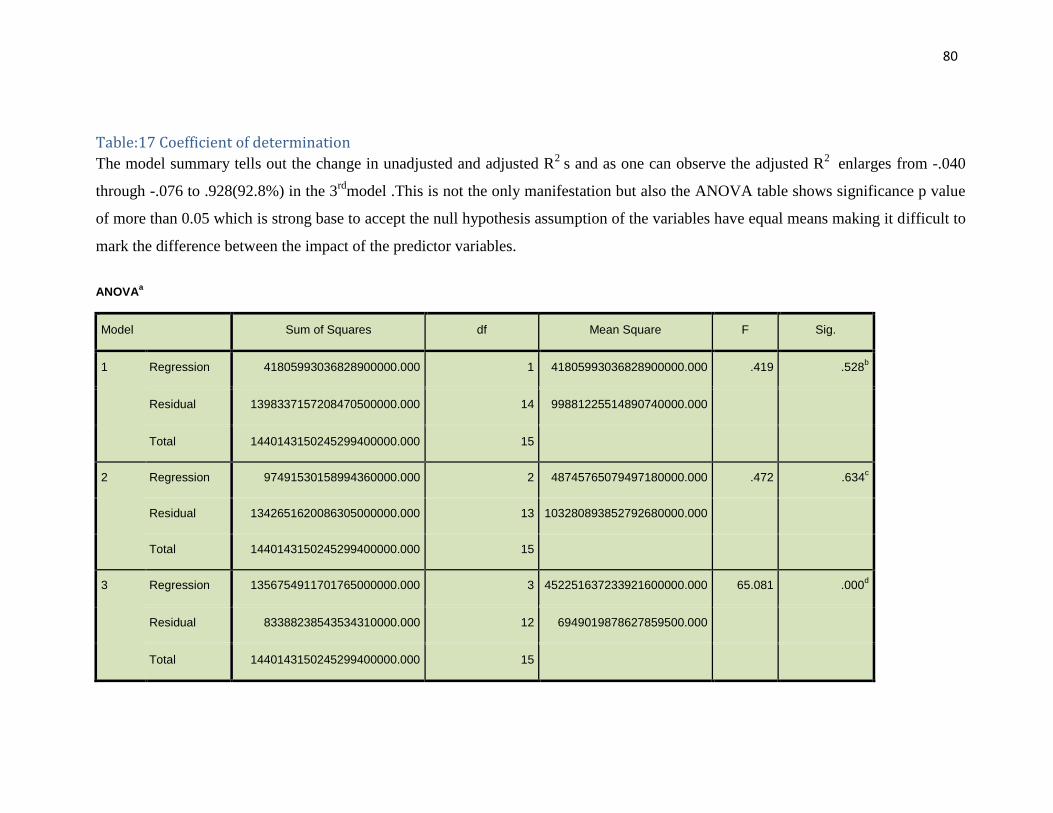
80
Table:17 Coefficient of determination
The model summary tells out the change in unadjusted and adjusted R2
s and as one can observe the adjusted R2
enlarges from -.040
through -.076 to .928(92.8%) in the 3rd
model .This is not the only manifestation but also the ANOVA table shows significance p value
of more than 0.05 which is strong base to accept the null hypothesis assumption of the variables have equal means making it difficult to
mark the difference between the impact of the predictor variables.
ANOVAa
Model Sum of Squares df Mean Square F Sig.
1 Regression 41805993036828900000.000 1 41805993036828900000.000 .419 .528b
Residual 1398337157208470500000.000 14 99881225514890740000.000
Total 1440143150245299400000.000 15
2 Regression 97491530158994360000.000 2 48745765079497180000.000 .472 .634c
Residual 1342651620086305000000.000 13 103280893852792680000.000
Total 1440143150245299400000.000 15
3 Regression 1356754911701765000000.000 3 452251637233921600000.000 65.081 .000d
Residual 83388238543534310000.000 12 6949019878627859500.000
Total 1440143150245299400000.000 15
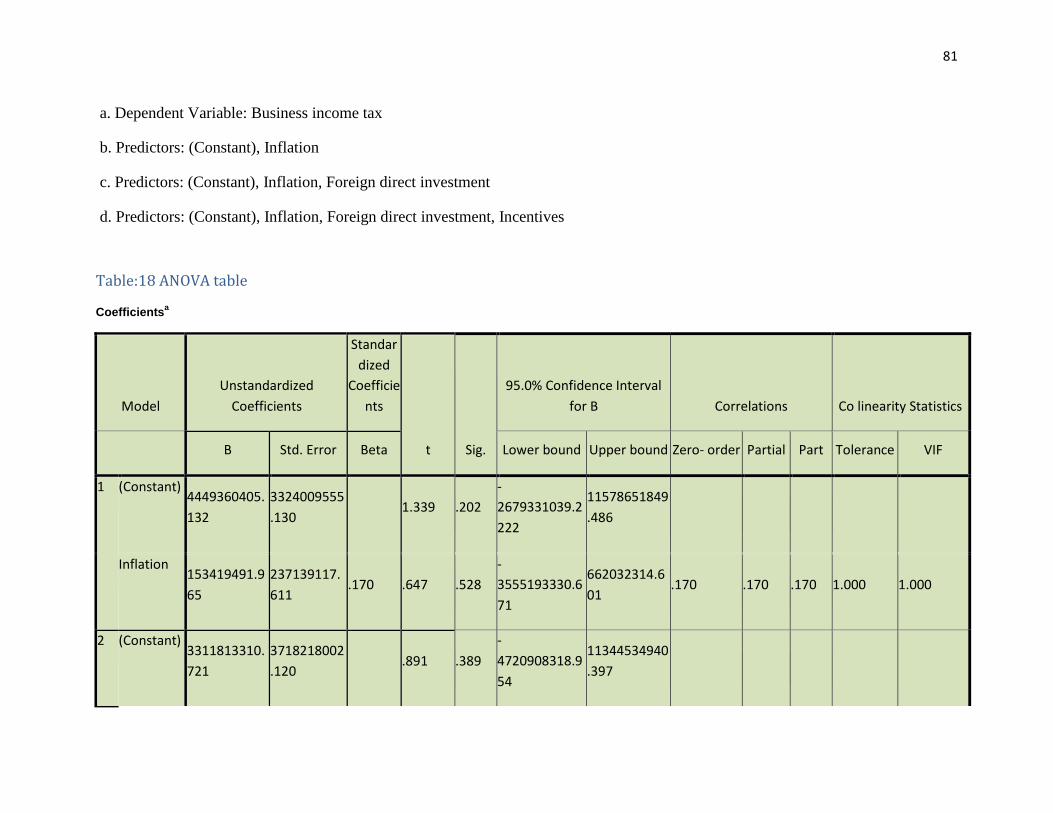
81
a. Dependent Variable: Business income tax
b. Predictors: (Constant), Inflation
c. Predictors: (Constant), Inflation, Foreign direct investment
d. Predictors: (Constant), Inflation, Foreign direct investment, Incentives
Table:18 ANOVA table
Coefficientsa
Model
Unstandardized
Coefficients
Standar
dized
Coefficie
nts
t
Sig.
95.0% Confidence Interval
for B Correlations Co linearity Statistics
B Std. Error Beta Lower bound Upper bound Zero- order Partial Part Tolerance VIF
1 (Constant) 4449360405.
132
3324009555
.130 1.339 .202
-
2679331039.2
222
11578651849
.486
Inflation 153419491.9
65
237139117.
611 .170 .647 .528
-
3555193330.6
71
662032314.6
01 .170 .170 .170 1.000 1.000
2 (Constant) 3311813310.
721
3718218002
.120 .891 .389
-
4720908318.9
54
11344534940
.397
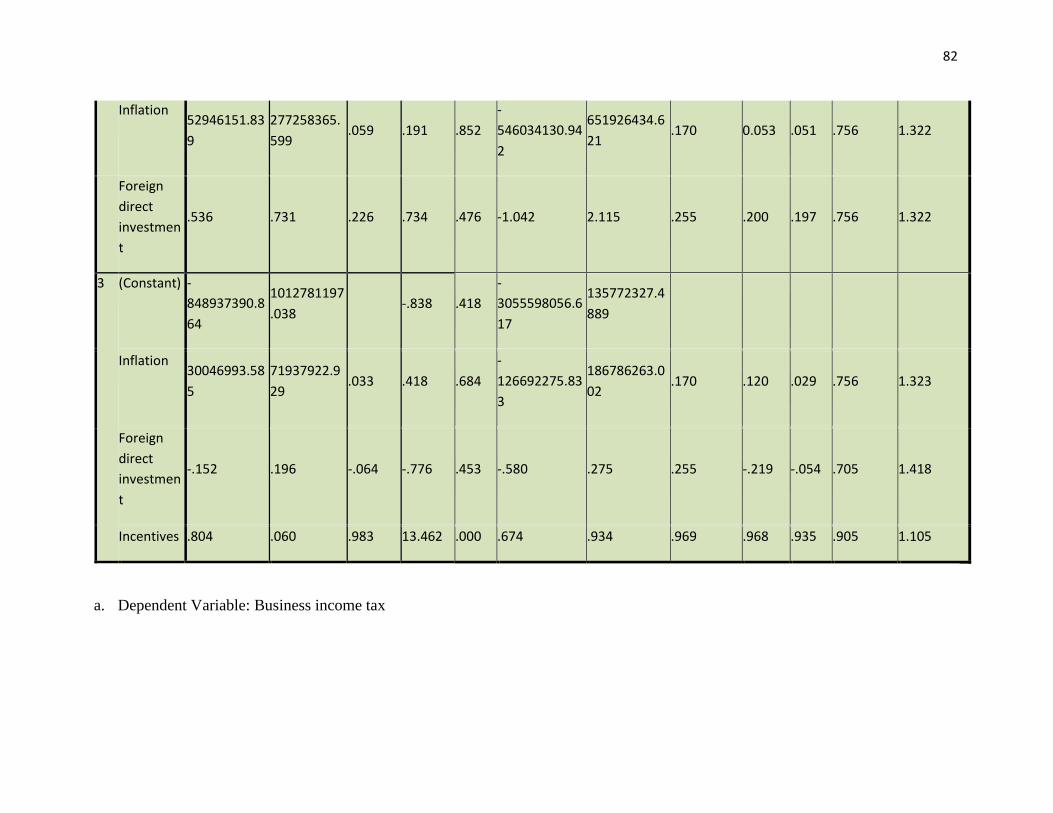
82
Inflation 52946151.83
9
277258365.
599 .059 .191 .852
-
546034130.94
2
651926434.6
21 .170 0.053 .051 .756 1.322
Foreign
direct
investmen
t
.536 .731 .226 .734 .476 -1.042 2.115 .255 .200 .197 .756 1.322
3 (Constant) -
848937390.8
64
1012781197
.038 -.838 .418
-
3055598056.6
17
135772327.4
889
Inflation 30046993.58
5
71937922.9
29 .033 .418 .684
-
126692275.83
3
186786263.0
02 .170 .120 .029 .756 1.323
Foreign
direct
investmen
t
-.152 .196 -.064 -.776 .453 -.580 .275 .255 -.219 -.054 .705 1.418
Incentives .804 .060 .983 13.462 .000 .674 .934 .969 .968 .935 .905 1.105
a. Dependent Variable: Business income tax
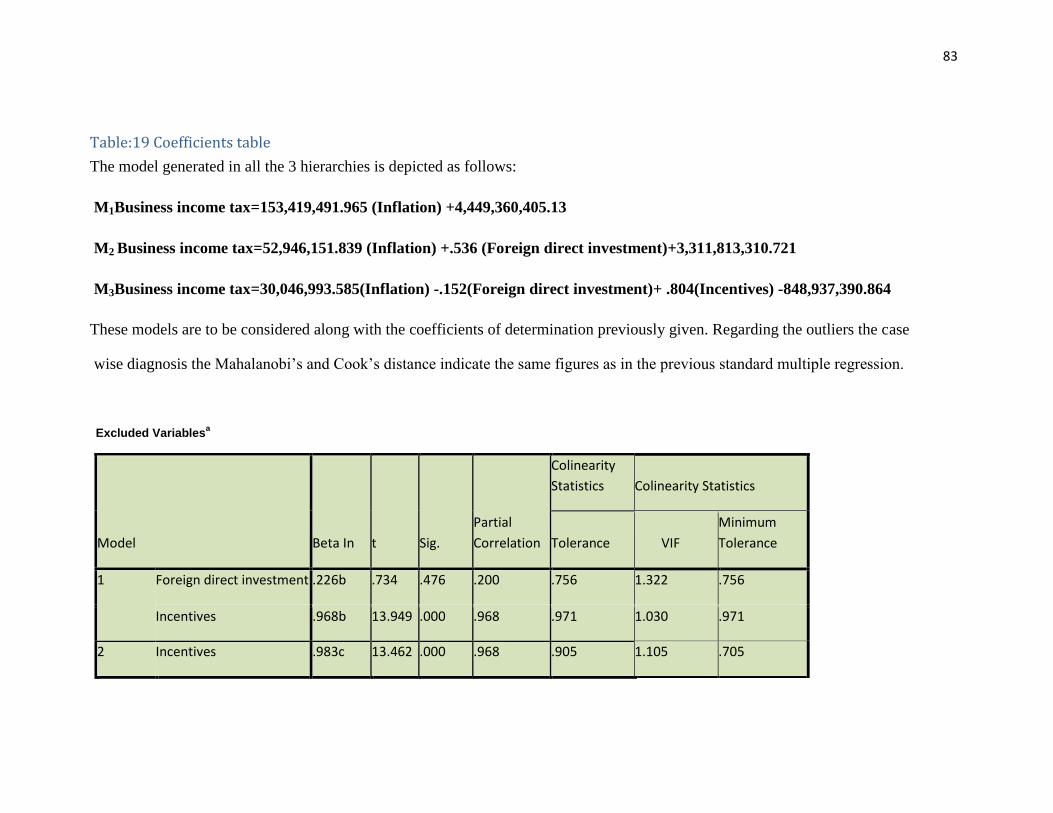
83
Table:19 Coefficients table
The model generated in all the 3 hierarchies is depicted as follows:
M1Business income tax=153,419,491.965 (Inflation) +4,449,360,405.13
M2 Business income tax=52,946,151.839 (Inflation) +.536 (Foreign direct investment)+3,311,813,310.721
M3Business income tax=30,046,993.585(Inflation) -.152(Foreign direct investment)+ .804(Incentives) -848,937,390.864
These models are to be considered along with the coefficients of determination previously given. Regarding the outliers the case
wise diagnosis the Mahalanobi’s and Cook’s distance indicate the same figures as in the previous standard multiple regression.
Excluded Variablesa
Model Beta In t Sig.
Partial
Correlation
Colinearity
Statistics Colinearity Statistics
Tolerance VIF
Minimum
Tolerance
1 Foreign direct investment .226b .734 .476 .200 .756 1.322 .756
Incentives .968b 13.949 .000 .968 .971 1.030 .971
2 Incentives .983c 13.462 .000 .968 .905 1.105 .705
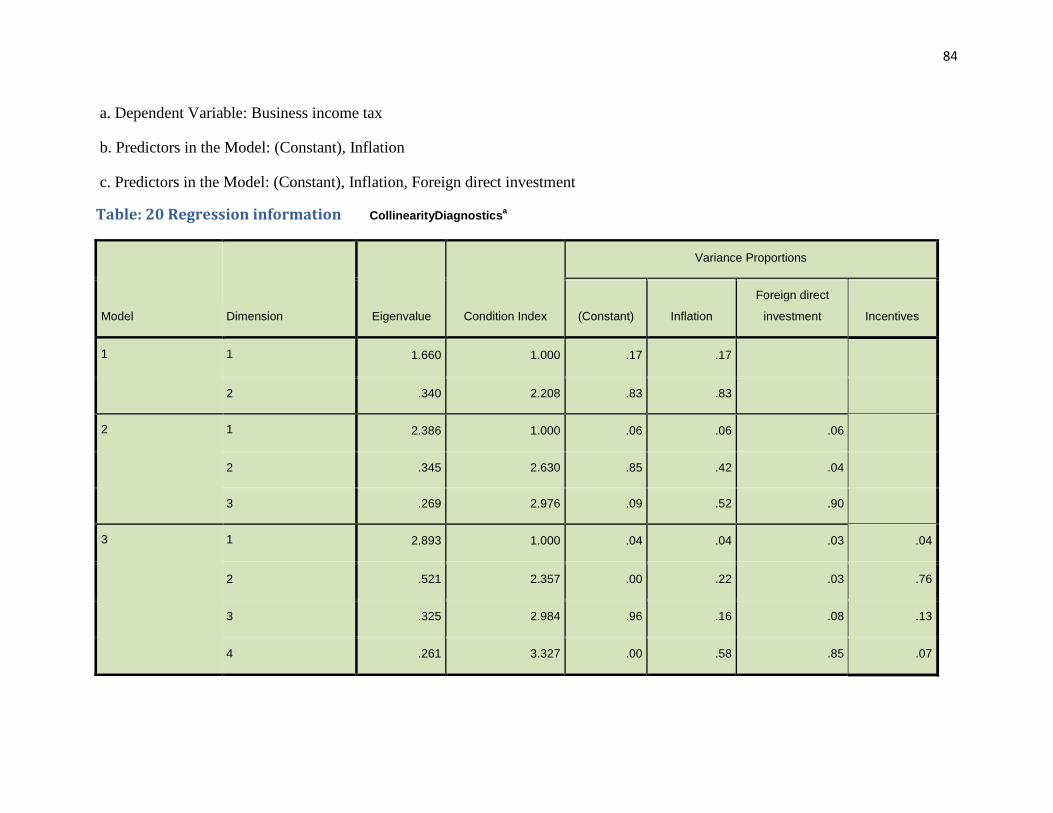
84
a. Dependent Variable: Business income tax
b. Predictors in the Model: (Constant), Inflation
c. Predictors in the Model: (Constant), Inflation, Foreign direct investment
Table: 20 Regression information CollinearityDiagnosticsa
Model Dimension Eigenvalue Condition Index
Variance Proportions
(Constant) Inflation
Foreign direct
investment Incentives
1 1 1.660 1.000 .17 .17
2 .340 2.208 .83 .83
2 1 2.386 1.000 .06 .06 .06
2 .345 2.630 .85 .42 .04
3 .269 2.976 .09 .52 .90
3 1 2.893 1.000 .04 .04 .03 .04
2 .521 2.357 .00 .22 .03 .76
3 .325 2.984 .96 .16 .08 .13
4 .261 3.327 .00 .58 .85 .07

85
a. Dependent Variable: Business income tax
Table:21 Co linearity table
Casewise Diagnosticsa
Case Number Std. Residual Business income tax Predicted Value Residual
30 3.952 3.65E+10 26119768116.4509 10416676775.54914
a. Dependent Variable: Business income tax
Table:22 Outliers table
Residuals Statisticsa
Minimum Maximum Mean Std. Deviation N
Predicted Value -1090058880.0000 28763006976.0000 8054037484.9615 9953916793.20955 16
Std. Predicted Value -.732 2.407 .230 1.047 16
Standard Error of
Predicted Value 943516480.000 1907888000.000 1389835279.908 360754049.735 16
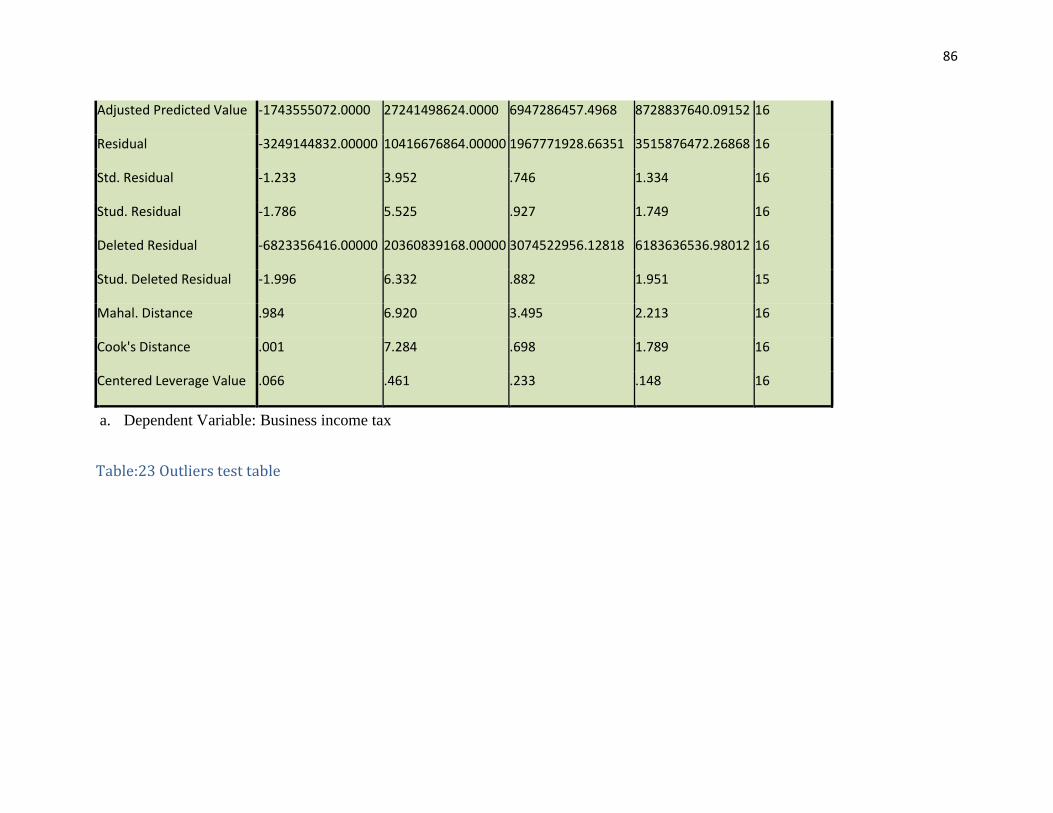
86
Adjusted Predicted Value -1743555072.0000 27241498624.0000 6947286457.4968 8728837640.09152 16
Residual -3249144832.00000 10416676864.00000 1967771928.66351 3515876472.26868 16
Std. Residual -1.233 3.952 .746 1.334 16
Stud. Residual -1.786 5.525 .927 1.749 16
Deleted Residual -6823356416.00000 20360839168.00000 3074522956.12818 6183636536.98012 16
Stud. Deleted Residual -1.996 6.332 .882 1.951 15
Mahal. Distance .984 6.920 3.495 2.213 16
Cook's Distance .001 7.284 .698 1.789 16
Centered Leverage Value .066 .461 .233 .148 16
a. Dependent Variable: Business income tax
Table:23 Outliers test table
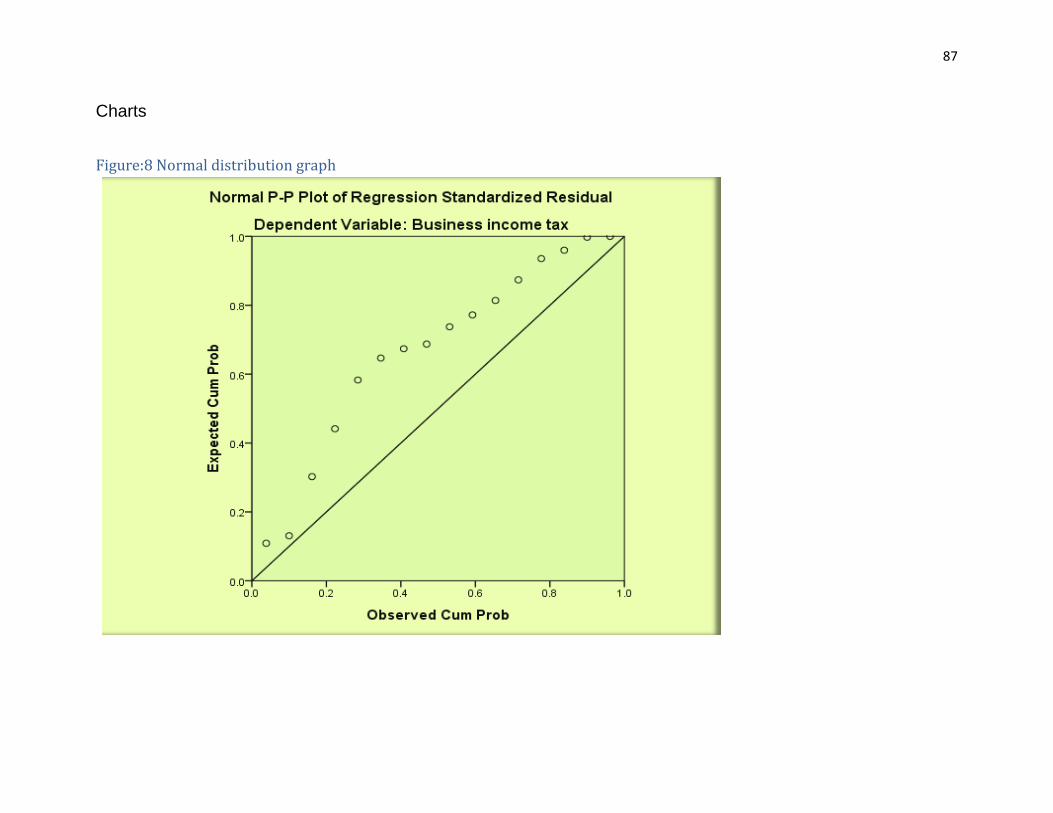
87
Charts
Figure:8 Normal distribution graph
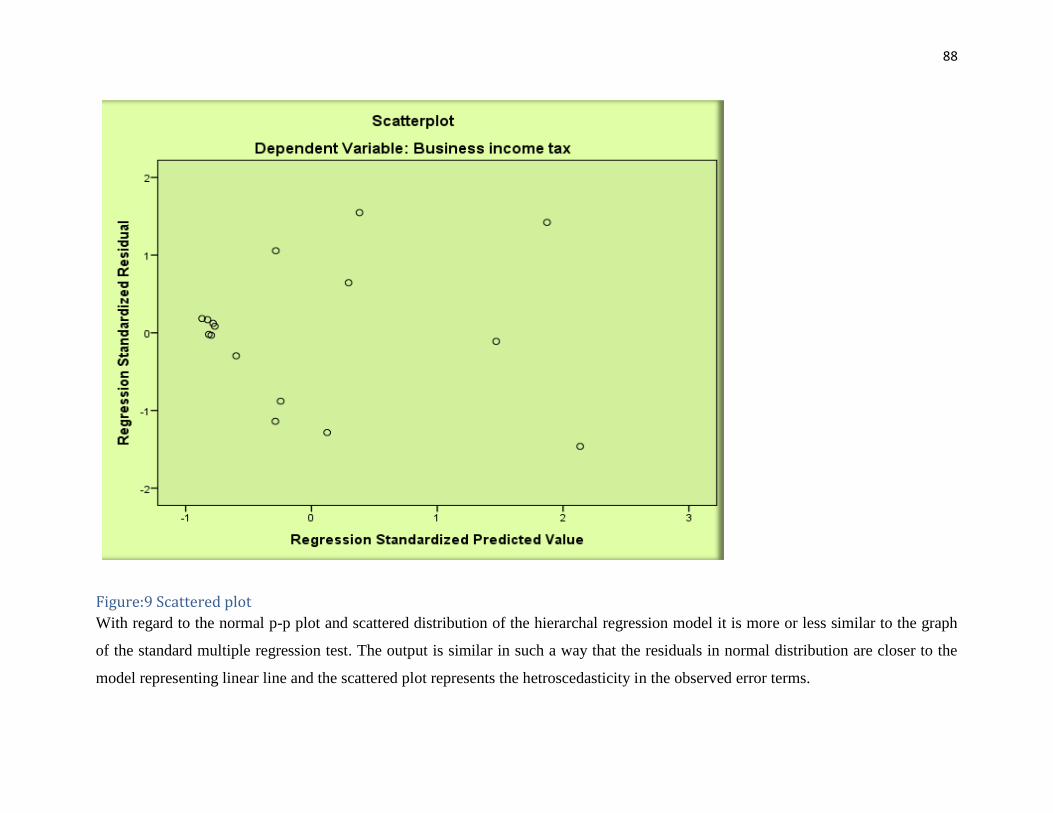
88
Figure:9 Scattered plot
With regard to the normal p-p plot and scattered distribution of the hierarchal regression model it is more or less similar to the graph
of the standard multiple regression test. The output is similar in such a way that the residuals in normal distribution are closer to the
model representing linear line and the scattered plot represents the hetroscedasticity in the observed error terms.
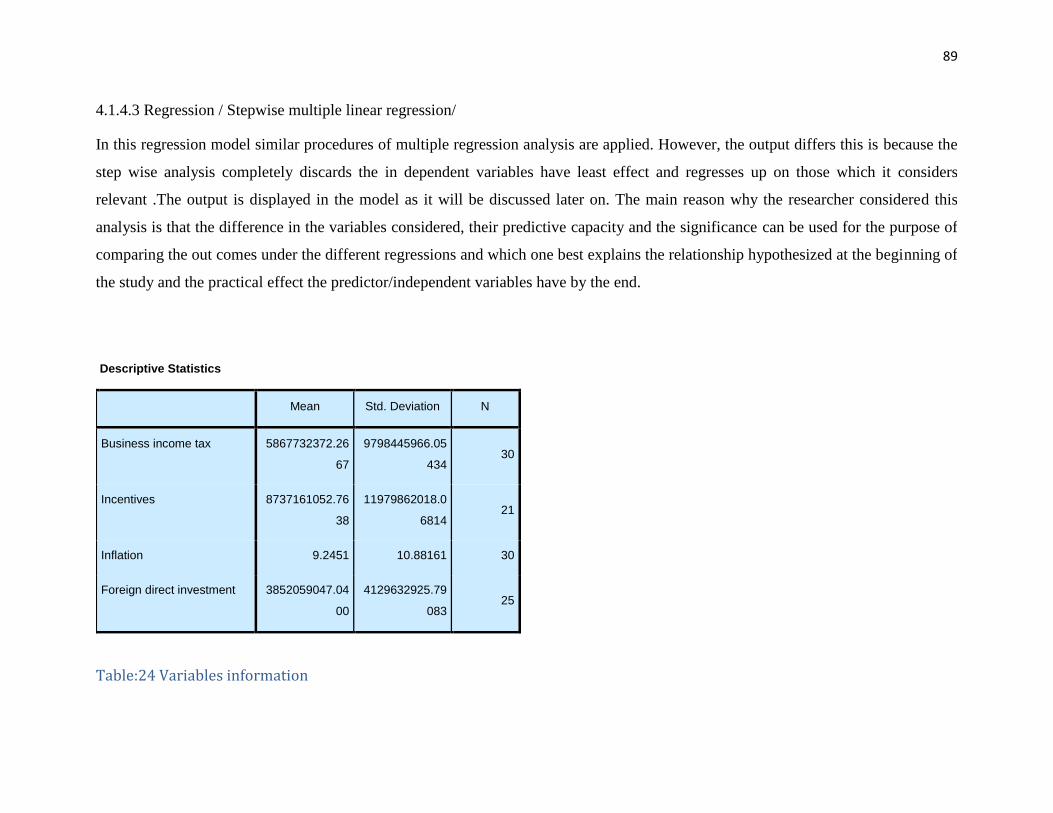
89
4.1.4.3 Regression / Stepwise multiple linear regression/
In this regression model similar procedures of multiple regression analysis are applied. However, the output differs this is because the
step wise analysis completely discards the in dependent variables have least effect and regresses up on those which it considers
relevant .The output is displayed in the model as it will be discussed later on. The main reason why the researcher considered this
analysis is that the difference in the variables considered, their predictive capacity and the significance can be used for the purpose of
comparing the out comes under the different regressions and which one best explains the relationship hypothesized at the beginning of
the study and the practical effect the predictor/independent variables have by the end.
Descriptive Statistics
Mean Std. Deviation N
Business income tax 5867732372.26
67
9798445966.05
434 30
Incentives 8737161052.76
38
11979862018.0
6814 21
Inflation 9.2451 10.88161 30
Foreign direct investment 3852059047.04
00
4129632925.79
083 25
Table:24 Variables information
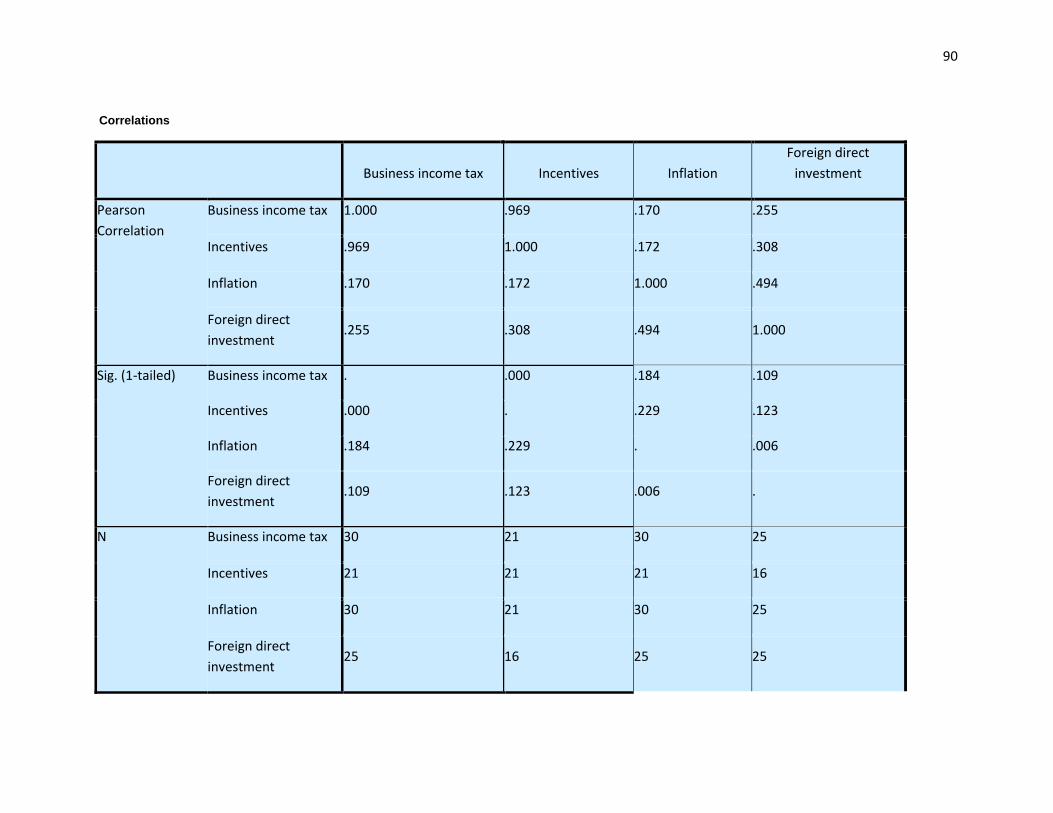
90
Correlations
Business income tax Incentives Inflation
Foreign direct
investment
Pearson
Correlation
Business income tax 1.000 .969 .170 .255
Incentives .969 1.000 .172 .308
Inflation .170 .172 1.000 .494
Foreign direct
investment .255 .308 .494 1.000
Sig. (1-tailed) Business income tax . .000 .184 .109
Incentives .000 . .229 .123
Inflation .184 .229 . .006
Foreign direct
investment .109 .123 .006 .
N Business income tax 30 21 30 25
Incentives 21 21 21 16
Inflation 30 21 30 25
Foreign direct
investment 25 16 25 25
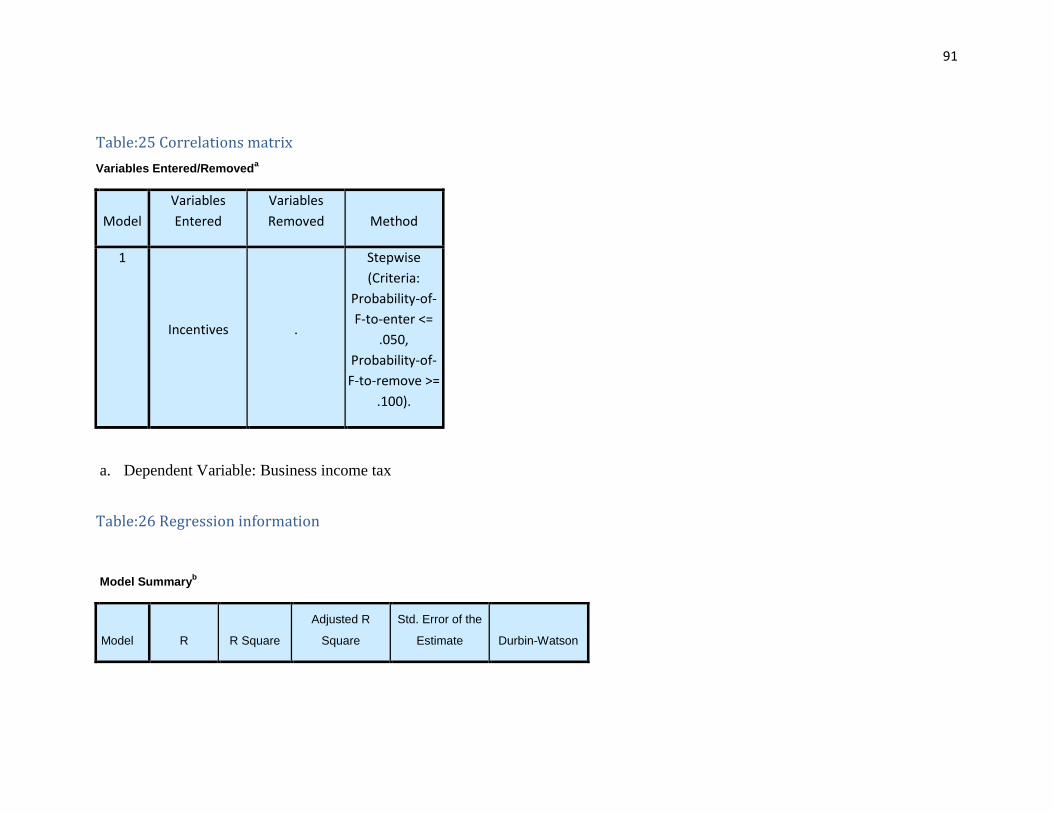
91
Table:25 Correlations matrix
Variables Entered/Removeda
Model
Variables
Entered
Variables
Removed Method
1
Incentives .
Stepwise
(Criteria:
Probability-of-
F-to-enter <=
.050,
Probability-of-
F-to-remove >=
.100).
a. Dependent Variable: Business income tax
Table:26 Regression information
Model Summaryb
Model R R Square
Adjusted R
Square
Std. Error of the
Estimate Durbin-Watson
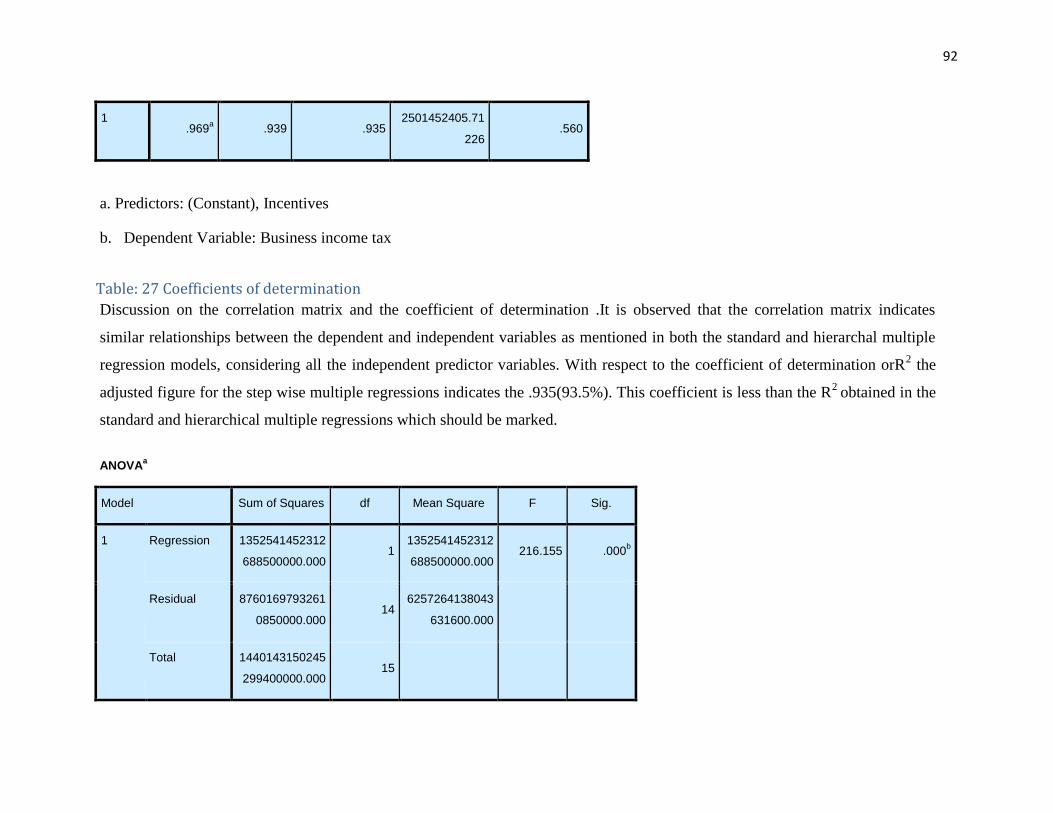
92
1 .969
a .939 .935
2501452405.71
226 .560
a. Predictors: (Constant), Incentives
b. Dependent Variable: Business income tax
Table: 27 Coefficients of determination
Discussion on the correlation matrix and the coefficient of determination .It is observed that the correlation matrix indicates
similar relationships between the dependent and independent variables as mentioned in both the standard and hierarchal multiple
regression models, considering all the independent predictor variables. With respect to the coefficient of determination orR2 the
adjusted figure for the step wise multiple regressions indicates the .935(93.5%). This coefficient is less than the R2
obtained in the
standard and hierarchical multiple regressions which should be marked.
ANOVAa
Model Sum of Squares df Mean Square F Sig.
1 Regression 1352541452312
688500000.000 1
1352541452312
688500000.000 216.155 .000
b
Residual 8760169793261
0850000.000 14
6257264138043
631600.000
Total 1440143150245
299400000.000 15

93
a. Dependent Variable: Business income tax
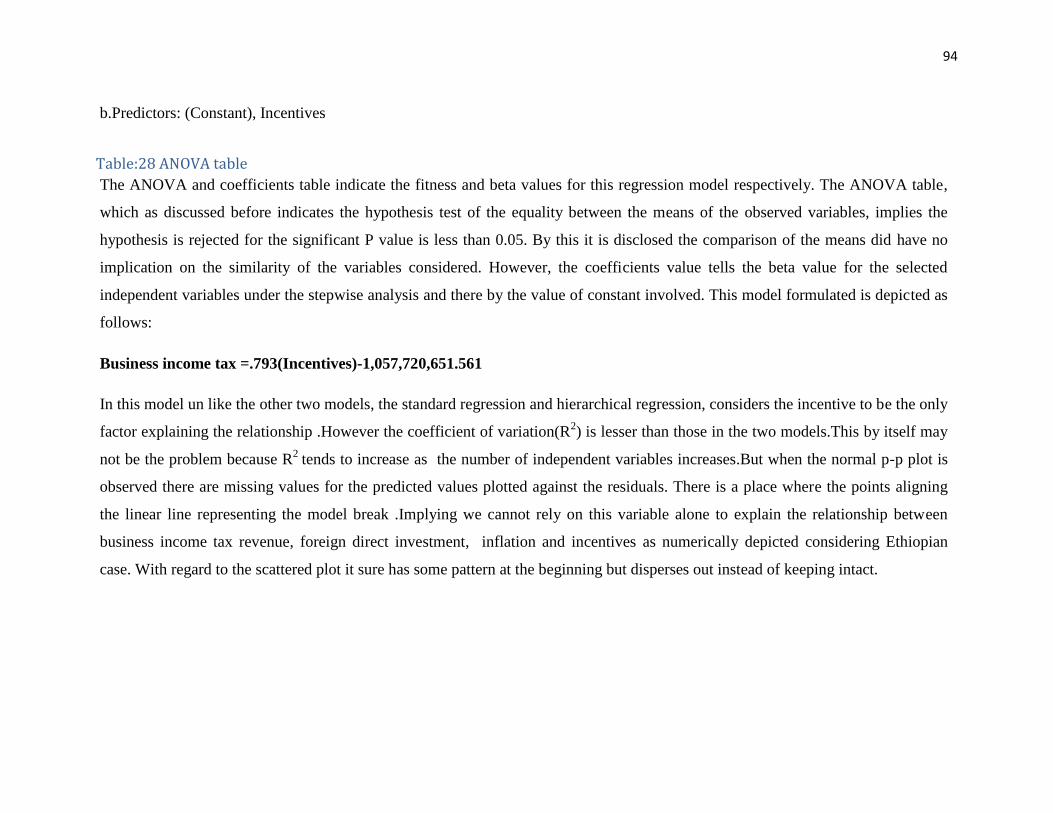
94
b.Predictors: (Constant), Incentives
Table:28 ANOVA table
The ANOVA and coefficients table indicate the fitness and beta values for this regression model respectively. The ANOVA table,
which as discussed before indicates the hypothesis test of the equality between the means of the observed variables, implies the
hypothesis is rejected for the significant P value is less than 0.05. By this it is disclosed the comparison of the means did have no
implication on the similarity of the variables considered. However, the coefficients value tells the beta value for the selected
independent variables under the stepwise analysis and there by the value of constant involved. This model formulated is depicted as
follows:
Business income tax =.793(Incentives)-1,057,720,651.561
In this model un like the other two models, the standard regression and hierarchical regression, considers the incentive to be the only
factor explaining the relationship .However the coefficient of variation(R2) is lesser than those in the two models.This by itself may
not be the problem because R2
tends to increase as the number of independent variables increases.But when the normal p-p plot is
observed there are missing values for the predicted values plotted against the residuals. There is a place where the points aligning
the linear line representing the model break .Implying we cannot rely on this variable alone to explain the relationship between
business income tax revenue, foreign direct investment, inflation and incentives as numerically depicted considering Ethiopian
case. With regard to the scattered plot it sure has some pattern at the beginning but disperses out instead of keeping intact.
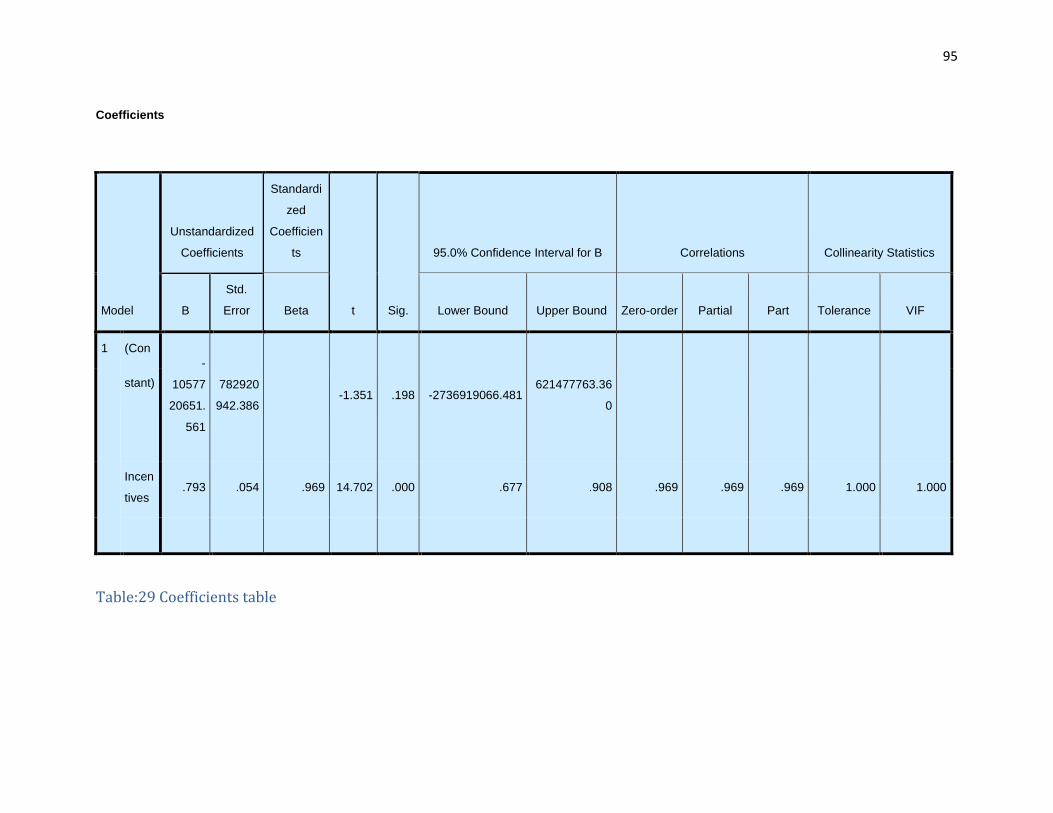
95
Coefficients
Model
Unstandardized
Coefficients
Standardi
zed
Coefficien
ts
t Sig.
95.0% Confidence Interval for B Correlations Collinearity Statistics
B
Std.
Error Beta Lower Bound Upper Bound Zero-order Partial Part Tolerance VIF
1 (Con
-
10577
20651.
561
782920
942.386
-1.351 .198 -2736919066.481 621477763.36
0
stant)
Incen
tives .793 .054 .969 14.702 .000 .677 .908 .969 .969 .969 1.000 1.000
Table:29 Coefficients table
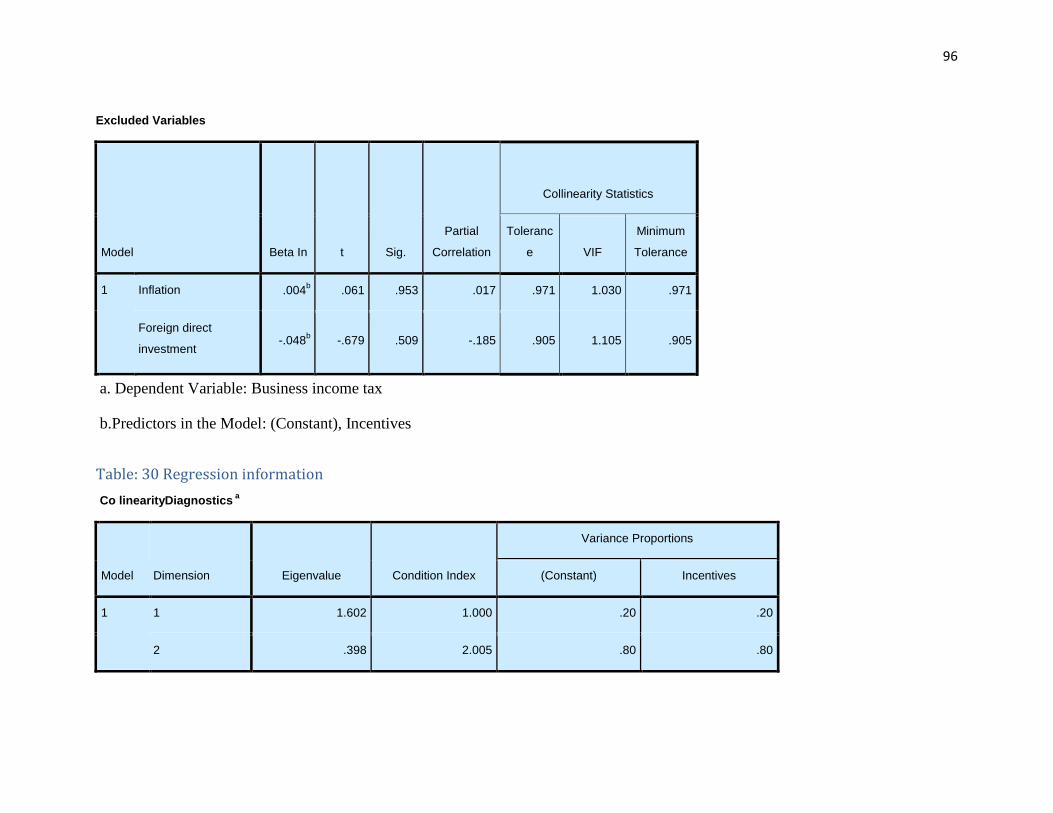
96
Excluded Variables
Model Beta In t Sig.
Partial
Correlation
Collinearity Statistics
Toleranc
e VIF
Minimum
Tolerance
1 Inflation .004b .061 .953 .017 .971 1.030 .971
Foreign direct
investment -.048
b -.679 .509 -.185 .905 1.105 .905
a. Dependent Variable: Business income tax
b.Predictors in the Model: (Constant), Incentives
Table: 30 Regression information
Co linearityDiagnostics a
Model Dimension Eigenvalue Condition Index
Variance Proportions
(Constant) Incentives
1 1 1.602 1.000 .20 .20
2 .398 2.005 .80 .80
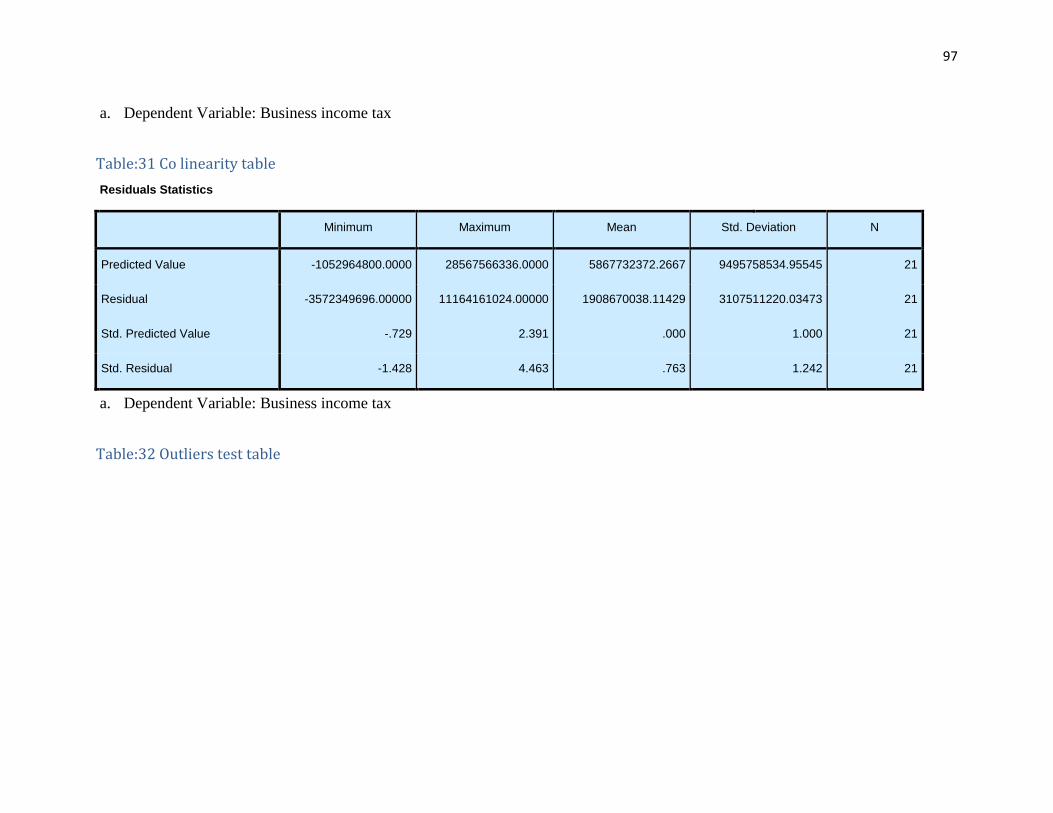
97
a. Dependent Variable: Business income tax
Table:31 Co linearity table
Residuals Statistics
Minimum Maximum Mean Std. Deviation N
Predicted Value -1052964800.0000 28567566336.0000 5867732372.2667 9495758534.95545 21
Residual -3572349696.00000 11164161024.00000 1908670038.11429 3107511220.03473 21
Std. Predicted Value -.729 2.391 .000 1.000 21
Std. Residual -1.428 4.463 .763 1.242 21
a. Dependent Variable: Business income tax
Table:32 Outliers test table
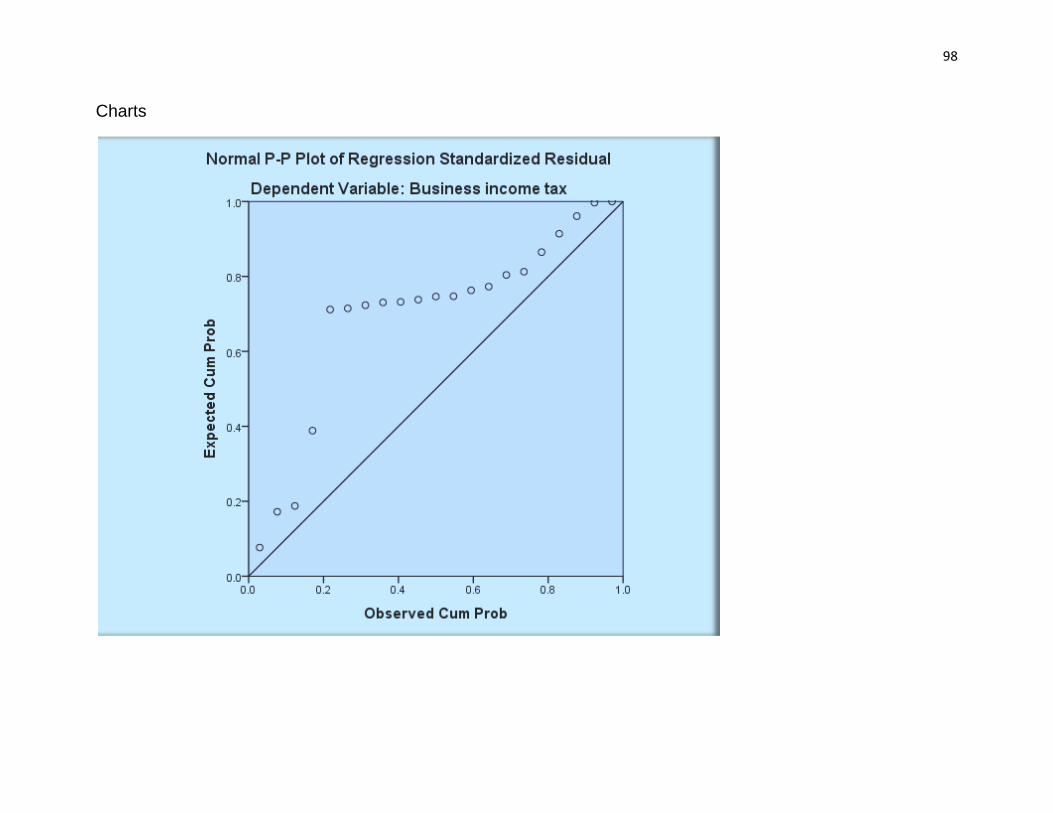
98
Charts
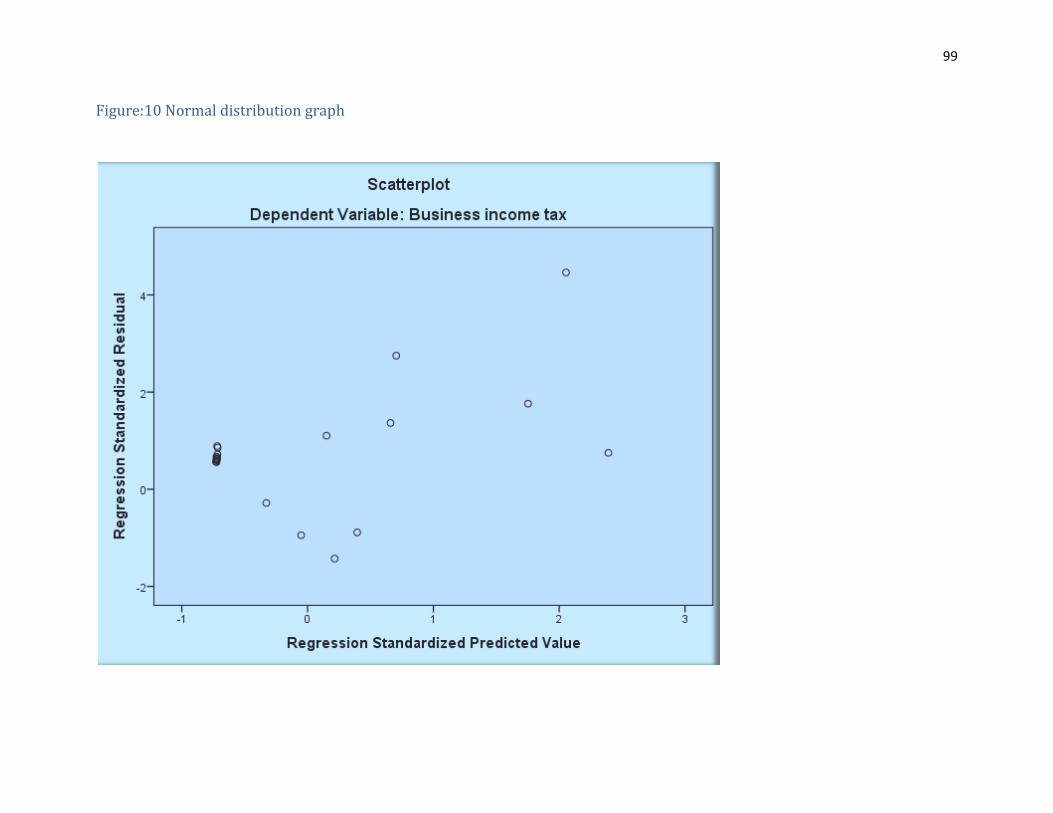
99
Figure:10 Normal distribution graph

100
Figure:11 Scattered plot
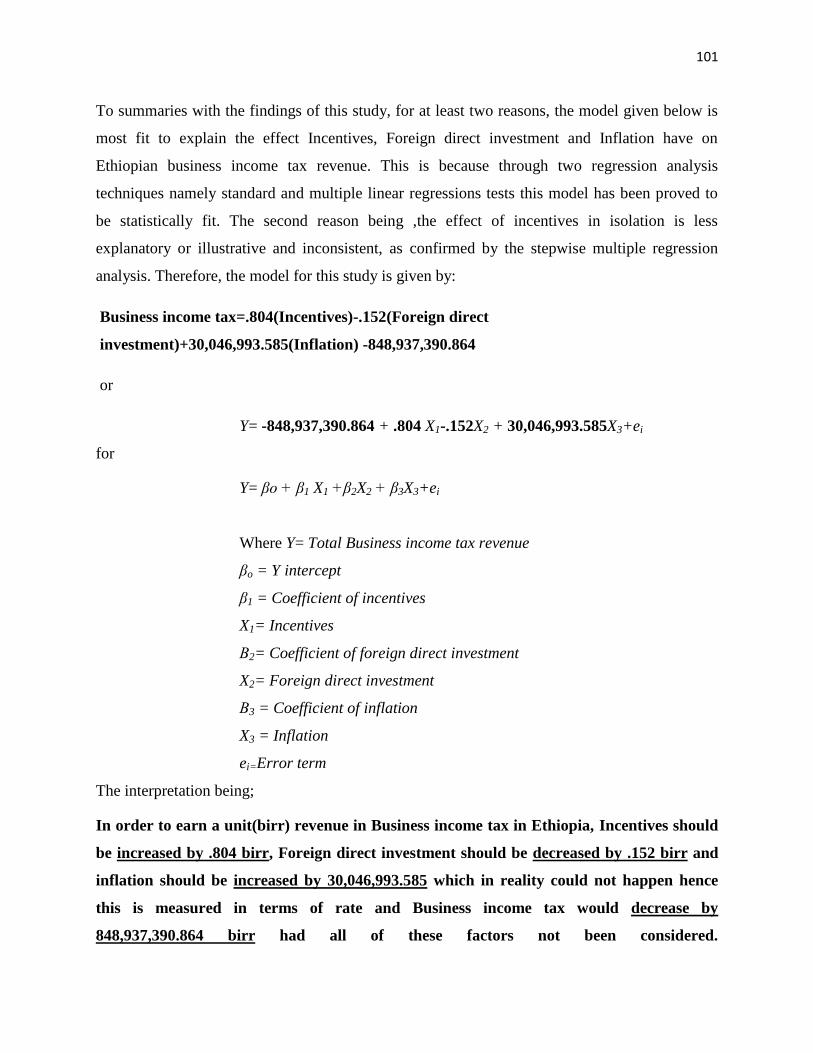
101
To summaries with the findings of this study, for at least two reasons, the model given below is
most fit to explain the effect Incentives, Foreign direct investment and Inflation have on
Ethiopian business income tax revenue. This is because through two regression analysis
techniques namely standard and multiple linear regressions tests this model has been proved to
be statistically fit. The second reason being ,the effect of incentives in isolation is less
explanatory or illustrative and inconsistent, as confirmed by the stepwise multiple regression
analysis. Therefore, the model for this study is given by:
Business income tax=.804(Incentives)-.152(Foreign direct
investment)+30,046,993.585(Inflation) -848,937,390.864
or
Y= -848,937,390.864 + .804 X1-.152X2 + 30,046,993.585X3+ei
for
Y= βo + β1 X1 +β2X2 + β3X3+ei
Where Y= Total Business income tax revenue
βo = Y intercept
β1 = Coefficient of incentives
X1= Incentives
Β2= Coefficient of foreign direct investment
X2= Foreign direct investment
Β3 = Coefficient of inflation
X3 = Inflation
ei=Error term
The interpretation being;
In order to earn a unit(birr) revenue in Business income tax in Ethiopia, Incentives should
be increased by .804 birr, Foreign direct investment should be decreased by .152 birr and
inflation should be increased by 30,046,993.585 which in reality could not happen hence
this is measured in terms of rate and Business income tax would decrease by
848,937,390.864 birr had all of these factors not been considered.

102
5. CONCLUSION AND RECOMMENDATION
5.1 Conclusion
In conclusion the cause for this study as discussed at the beginning is the business income tax
trend in the World(at least significant economies),African and Ethiopian context.In fact the
trend is not the immidiate cause for this study, rather the factors observed to be influencing
these trends were stricking facts behind the study.Hence some litratures revealed the same so
the reasercher declined to the specific factors incentives,foreign direct investment and inflation
affecting business income taxrevenue in Ethiopiato measure their quantitave relationship based
on statistically computed model.
The hypothesis tested initially were:
H1: There is relationship between incentive and business income tax revenue
H2: There is relationship between foreign direct investment and business income tax revenue
H3: There is relationship between inflation and business profit tax revenue
H4: There is positive relationship between incentives and business income tax revenue
H5: There is negative relationship between foreign direct investment and business income tax
revenue and
H6: There is negative relationship between inflation and business income tax revenue
Based on the literatures reviewed business income tax is income obtained from goods and
services operating in a specific year considering the net income. Incentive has basic aim of
increasing foreign currency reserve. Whereas foreign direct investment is about degree of
influence, lasting interest and long-term relationship among businesses or nations. Inflation
deals with price upward movement which is persistent. The relation among business income
tax, foreign direct investment and incentives is clear that both affect the first through economic
resource and income gain. Inflation however largely relates with business income tax because
of macro-economic and financial statement components.
Theories indicate business income tax has perspectives of benefit approach, means of collecting
individual income tax and controlling the economy theories. Incentive on the other hand is
103
composed of Distortion- correcting export promotion, Export promotion for it’s own sake,
Export promotion to capture larger share of global profits. Where as in case of investment there
are a number of reasons and justifications/causes/ like; Capital theory, International trade
tradition theory, Industrial organization. Cost of capital, Corporate investment theory, Portfolio
theory. In case of inflation there are at least two causes inflation of monetary and Keynesian
theory.
Empirically reviewed a number of countries in the world have had different incentives in most
cases to attract foreign direct investment. Some countries have benefited others are on the study
process. Those like Mynamar, Gambia & Mauritius have it in their laws and countries like
Jamaica, Egypt and India are working on it’s deduction as a result of inefficiency. With regard to
foreign direct investment OECD countries are observed to loss income due to this. While African
poverty alleviation is affected by missed corporate tax for the sack of multi nationals’ attraction.
Inflation is leading to increased borrowing or debt financing in addition to the increased personal
income tax and contribution in Germany as well as Netherlands .In low and middle income
countries to it is believed to have an impact on tax for goods and services which indirectly affect
interest expense, contribution and salary expense which have negative impact on business
income tax revenue. Increased goods and services tax result in market loss and revenue decline.
The data processed by SPSS (23) to obtain the desired tabular presentation of the data. All this
data marked scale because of It’s capacity to go through mathematical computations (which
means it is not interval but ratio data type, and no nominal or ordinal data involved). The
analysis was divided in two broad categories as descriptive and inferential .Through the
statistical procedure analyze descriptive statistics .The analysis for missing value, multi co
linearity ,normality, hetroscadasticity and outliers is undertaken along with the multiple,
hierarchical and stepwise regression analysis. The tabular presentation of data for descriptive and
regression analysis was made so that the appropriate interpretations and conclusion is reached
proving or disproving the hypothesis test. So that the appropriate recommendation is made based
on the research questions ignited in chapter one.
104
In general the analysis part has discussed that, the descriptives and inferentia analysis have been
made in accoradance with the blue print in the reaserch methodology part as broadly
categorised.
As it can be observed the frequency table values along with missing values has been presented.
The normality graph using histogram has then been displaied for all the predicted and predictor
variables(dependant and independent).Next the descriptive statistics encorporaing measures of
central tendncy and dispersion have been discussed. Some of these include sum, mean
,minimum,maximum range,standard deviation along with skewness and kurtosis.
Then moved on to the regression analysis part which contained a large proportion of the
inferential statistics .Three types of the same have been made.Namely standard, hierarchial and
stepwise multiple regression analysis.In all the regressions the discriptive statistics,the
correlation matrics,the removed variables, the ANOVA,the coefficents, the colinearity
diagnostics,the casewise analysis, the residuals table along with the p-p normal plot and
scattered plot are presented.
Form the analysis important factors such as the correlation matrix ,ANOVA, coefficents tables
along with P-P normal plot and scattered plot have been discussed in detail. The correlation
matrics which turned out to be te same for all regression analysis types revealed the following
facts.
The correlation matrix on the other hand implies, the relation between business income tax and
incentives is .969 (96.9%) where as the relationship of inflation and foreign direct investment
to the same is .170(17%)and .255(25.5%)respectively. Incentive with foreign direct investment
and inflation as .308(30.8%) and .172(17.2%) in sequence. Inflation also relates to foreign
direct investment by.494(49.9%).Based on the ANOVA tables the listed significant P values
are detected to examine the hypothesis of mean equality against <0.05 significant P value which
serves as a standard bench mark for the rejection of mean equality hypothesis..000b for
Standard multiple regression model,.528b for model -1 of the hierarchical multiple
regression,.634c for model -2 of the same, .000
d for model-3 and .000
b for the stepwise multiple
regression model .
105
The models formulated are all presented as follows. This is observed in standard, hierarchal and
stepwise multiple regression models respectively.
Business income tax=.804(Incentives)-.152(Foreign direct
investment)+30,046,993.585(Inflation) -848,937,390.864
M1Business income tax=153,419,491.965 (Inflation) +4,449,360,405.13
M2Business income tax=52,946,151.839(Inflation)+.536(Foreign direct
investment)+3,311,813,310.721
M3Business income tax=.804(Incentives)+30,046,993.585(Inflation) -.152(Foreign direct
investment) -848,937,390.864
Business income tax =.793(Incentives)-1,057,720,651.561
The P-P normal curve and the scattered plot nearly show the same distribution and dispersion
respectively except for the stepwise regression model P-P normal distribution where the
distribution indicates some sort of abnormally broken line.
The most fitting model being:
Business income tax=.804(Incentives)-.152(Foreign direct
investment)+30,046,993.585(Inflation) -848,937,390.864
It is interpreted as:
In order to earn a unit (birr) revenue in Business income tax in Ethiopia, Incentives should be
increased by .804 birr, Foreign direct investment should be decreased by .152 birr and inflation
should be increased by 30,046,993.585 which in reality could not happen hence this is measured
in terms of rate and Business income tax would decrease by 848,937,390.864 birr had all of these
factors not been considered.
Finally the hypotheses tested are concluded for here under .The conclusions for hypothesis 1-3
are based on the correlation matrix while the rest consumed the model formulated.
106
H1: There is relationship between incentive and business income tax revenue
This hypothesis is accepted because they have relationship and it amounts to .969
(96.9%).
H2: There is relationship between foreign direct investment and business income tax revenue
This hypothesis is as well accepted for there is.255 (25.5%) correlation.
H3: There is relationship between inflation and business profit tax revenue
This third hypothesis is also accepted as a result of.170 (17%)relation.
H4: There is positive relationship between incentives and business income tax revenue
This hypothesis should be accepted because just like the theoretic base the data indicated
positive relationship detected as .804
H5: There is negative relationship between foreign direct investment and business income tax
revenue
This hypothesis is accepted because of the negative direction of the independent
variable’s coefficient noticed as-.152 and
H6: There is negative relationship between inflation and business income tax revenue
This hypothesis is as well rejected because the coefficient of the inflation did not affect
business income tax revenue in Ethiopia negatively .It is as well less relevant compared
to the other independent variables amounting to 30,046,993.585.
107
5.2 Recommendation
Based on the the study conducted and chapteres covered so far the alternative courses of action
that proceed are recommended.To keep on the consistancy the recommendations depend on the
research questions given at the beginning of the study.
Hence the purpose of the study was to explore the effect of incentives on business income
tax and the correlation output reveals .969 (96.9%).The coefficient pertaining for a unit
change in revenue is.804 in incentives.The concerned authorities should give due
emphasis on which incentives to concentrate and what combination they should have to
enhance business income tax revenue.
In this study the effect of foreign direct investment on business income tax revenue has
been examined. As a result there is correlation of .255(25.5%).The coefficient pertaining
for a unit change in revenue is-.152 in foreign direct investment. It is therefore critical to
evaluate the increasing foreign direct investment from business income tax perspective.
Because fears tax competition is damaging the same in other parts of the world.
The study managed to evaluate the effect of inflation on business income tax as well..170
(17%)individual correlation is observed. The coefficient pertaining for a unit change in
revenue is30,046,993.585in inflation. This could be minimal and not striking because of
the minimal inflation prevailing. But it is also recalled that tax is among the macro
measures to stabilize inflation.
The model established based on the study defines the joint effect for the three
independent variables (factors) acting on business income tax revenue. The model has
already been depicted and interpreted for in the previous discussions. Incentive has
positive significant contribution, foreign direct investment has negative impact and
inflation has insignificant effect in generating a unit of business income tax revenue.
Policy makers should therefore consider the trends in these variables in forecasting the
business income tax revenue.
The remaining general recommendation would be scholars should further investigate
factors affecting business income tax, encouraging scholarly debates on the remaining tax
categories which could enhance up to date and convenient tax policies, generating better
income, enhancing financial reporting and benefiting the society at large.
108
REFERENCES
1. ushistory.org( 2016), American Government Online
http://www.ushistory.org/gov/1a.asp
2. OECD Observer No 300, Q3
(2014)http://oecdobserver.org/news/fullstory.php/aid/4505/Jobs,_unemployment_and_go
vernment_action.html, Jobs, unemployment and government
action,3.http://www.etu.org.za/toolbox/docs/localgov/webmunfin.html, Local
Government Finances and Budgets,
4.http://www.itepnet.org/pdf/guide6.pdf, The TIEP guide to fair state and local taxes,
5.OECD (2016), Tax on corporate profits (indicator). doi: 10.1787/d30cc412-en
(Accessed on 28 November 2016)
6.https://en.wikipedia.org/wiki/Corporate_tax_in_the_United_States
7.http://www.nbe.gov.et/publications/annualreport.html
8.https://en.wikipedia.org/wiki/List_of_countries_by_tax_revenue_as_percentage_of_GD
P#cite_note-6
9.http://www.investopedia.com/terms/i/industry.asp
10.P. Jenkins(1985), Impact of inflation on corporate tax and cash flow business.
11. OECD (2007),Tax Effects on Foreign Direct Investment – No. 17,Recent Evidence
and Policy Analysis
12. ImtiazAhmad(2015),The Value of Export Incentives,The Lahore Journal of
Economic: pp. 99–127
13.Jhone F. Due & Carrie Mayer(1986), Major determinants of tax structure in market
economies.
13. The Institute on Taxation and Economic Policy( 2011),The ITEP guide to fair state
and local taxes, corporate income taxes.
14.ChristophWatrin, Robert Ullmann(2008), Comparing Direct and Indirect Taxation:
The
Influence of Framing on Tax Compliance, The European Journal of Comparative
Economics
Vol. 5, n. 1, pp. 33-56
109
15. Jorge Martinez-Vazquez, VioletaVulovic&YongzhengLiu(2011), Direct versus
indirect taxation: trends, theory, and economic significance , Georgia State University
16. Richard M. Bird and Eric M. Zolt (2003),Introduction to Tax Policy Design and
Development, This is a draft prepared for a course on Practical Issues of Tax Policy in
Developing Countries, World Bank, April 28-May 1, 2003.
17.Uganda Revenue Authority(2011),Taxation hand book a guide to taxation in Uganda.
18. Article in Journal of the American Taxation Association (June 2002),Competitive,
Political, and Economic Factors Influencing State Tax Policy Changes
19. Åsa Hansson, Susan Porter and Susan Perry Williams(2012), The Effect of Political
and Economic Factors on Corporate Tax Rates , IFN Working Paper No. 942, 2012
20. AgnèsBénassy-Quéré, Lionel Fontagné and AminaLahrèche-Révil(2004), How Does
FDI React to Corporate Taxation?*
21. James M. Poterba(January 2001), Tax Policy and the Economy, Volume 15
22. Joanna Bonarriva, Michelle Koscielski, and Edward Wilson(August 2009), Export
Controls: An Overview Of Their Use, Economic Effects, And Treatment In The Global
Trading System
23. Dorsati H. Madani&Natàlia Mas-Guix(March 2011), The Impact of Export Tax
Incentives
on Export Performance Evidence from the Automotive Sector in South Africa
24.LeonidMelnyk (Ukraine), OleksandrKubatko (Ukraine), SerhiyPysarenko (Canada),(
2014)
, The impact of foreign direct investment on economic growth:case of post communism
transition economies, , Volume 12, Issue 1, 17
25.AnetaKrstevska and Magdalena Petrovska(July 2012), The economic impacts of the
foreign direct investments: panel estimation by sectors on the case of Macedonian
economy
26. Martin Feldstein(1983), Inflation, Tax Rules, and Capital Formation, University of
Chicago Press
27. Muhammad Ayyoub, Imran Sharif Chaudhry and Fatima Farooq(June 2011)
Does Inflation Affect Economic Growth?The case of Pakistan, Pakistan Journal of Social
Sciences (PJSS),Vol. 31, No. 1, pp. 51-64
110
28. Martin Feldstein (January 1999), The Costs and Benefits of Price Stability, University
of Chicago Press
29. James M. Poterba (January 2001), Tax Policy and the Economy, Volume 15, MIT
Press
30. Peter Ireland (November 3, 2014), The Classical Theory of Inflation and Its Uses
Today
31. Muhammad Tariq Majeed and Eatzaz Ahmad (Winter 2007), FDI and Exports in
Developing Countries:Theory and Evidence, The Pakistan Development Review
32. Abdel-Hameed M. Bashir,Foreign Direct Investment and Economic Growth In Some
MENA Countries:Theory and Evidence
33. Shiva S. Makki ,Impact of Foreign Direct Investment and Trade on Economic
Growth, The World Bank
34. Selma Kurtishi-Kastrati(2013), The Effects of Foreign Direct Investments for Host
Country’s Economy, Vol. 5 , Issue 1
35. Laura Alfaro (April 2003), Foreign Direct Investment and Growth: Does the Sector
Matter?,
Harvard Business School
36.TinomuongaMoyo(2009- 2012), The Impact of Foreign Direct Investment on
Economic Growth: The Case of Zimbabwe, International Journal of Economics, Finance
and Management Sciences. Vol. 1, No. 6, 2013, pp. 323-329. doi:
10.11648/j.ijefm.20130106.19
37.T. AdemolaOyejide (June 2007), African Trade, Investment And Exchange Rate
Regimes And Incentives For Exporting
38. James P. Walsh And Jiangyan Yu ( July 2010), Determinants Of Foreign Direct
Investment: A Sectoral And Institutional Approach, Imf Working Paper
39.TsegayeTeldu,Investment Promotion And Incentives In Ethiopia
40.Chapter 4,Inflation And Deflation Pdf.
41.Pimco,Inflation And It’s Impact on Investment.
42. Jeremiah Femi Olu1 and Emmanuel OgwuIdih(2015), Inflation and economic growth
in Nigeria ,Scienceweb Publishing

111
43.QuamrulAshrafy ,BorisGershmanz and Peter Howittx (June 2013), How Inflation
Affects Macroeconomic Performance
44. Robert E. Morgan and Constantine S. Katsikeas ,Theories of international trade,
foreign direct investment and firm internationalization
45.VintilaDenisia(December 2010), Foreign Direct Investment Theories:An Overview of
the Main FDI Theories, Volume 2, Issue 2
46.Asit Advisory Studies(2000), United Nations Conference On Trade And
Development, United Nations
47.ReintGropp And Kristina Kostial(September 2000), The Disappearing Tax Base:Is
Foreign Direct Investment Eroding Corporate Income Taxes?
48. Mihir A. Desai and James R. Hines Jr.( July 2001), Foreign Direct Investment in a
World of Multiple Taxes.
49.HuuThanh Tam Nguyen,Manh Hung Nguyen and AdityaGoenka,How does FDI affect
corporate tax revenue of the host country?
50.ReintGropp and Kristina Kostial (October 2000), The disappearing tax base: Is
Foreign Direct Investment (FDI)Eroding Corporate Income Taxes?
51. Robert E. Lipsey (February 2004), Home- and Host-Country Effects of Foreign
Direct
Investment, University of Chicago Press
52.Monetary Theory of Inflation pdf
53.Jagdish N. Bhagwati(Jan., 1988), Export-Promoting Trade Strategy: Issues and
Evidence, Oxford University Press.
54. Chapter x Theory of Inflation pdf.
55. Abdel-Hameed M. Bashir,Foreign Direct Investment and Economic Growth In Some
MENA Countries:Theory and Evidence
56.George L. Perry ,Inflation in Theory and Practice .
57. Muhammad Tariq Majeed And Eatzaz Ahmad, FDI and Exports in Developing
Countries:Theory and Evidence
58. Thomas I. Palley (July 2011), The Rise and Fall of Export-led Growth.
59. Chao-Wei Lan (March 2001),singapore’s export promotion strategy and
Economic growth (1965-84)
112
60.EyjólfurBrynjarEyjólfsson(February 2012), Export Incentives and Barriers to Export
The Icelandic Fishing Industry
61.SarathRajapatirana, policy recommendations for export promotion.
62.chapter 2.foreign direct investment and the multinational corporation pdf.
63.Jeremy I. Bulow and John B.Shoven,,Inflation, CorporateProfits,andthe
Rate of Return toCapital.
64.Alan S.Blinder (January1972), AreIncomeTaxesInflationary OrDeflationaryt:
AuExpositorynote.
65.HerwigImmervoll, The Impact of Inflation on Income Tax and Social Insurance
Contributions in Europe
66. Types of Inflation pdf.
67. VNS Raman(2003), Investment principles an thechniques, Vijay Nicole Imprints
68. H L Bhatia(2006), Public finance, 25th
edition,Vikas Publishing House PVT LTD
69. Bernard P.Herber(2004), Modern public finance ,5th
edition,A.I.T.B.S.Publishers&
distributors(Regd.)
70.http://darp.lse.ac.uk/pdf/EC426/EC426_ExtendedEssays/Essay2000_02.pdf
71.faculty.nps.edu/relooney/3040_s83.pdf
72.www.fep.up.pt/docentes/fcastro/chapter%202.pdf
73.https://www.google.com.et/webhp?sourceid=chrome-
instant&ion=1&espv=2&ie=UTF-
8#q=foreign+direct+investment+and+the+multinational+corporation
74.Linda K. Owens (SRL Spring 2005 Seminar Series),introduction to survey research
design,
75.JohnMilne ,Centre for CBL in Land Use and Environmental Sciences,
Aberdeen University.
76.Research Methods STA630
77.https://en.wikipedia.org/wiki/Sampling_(statistics)
78.www.concordia.edu/library,primary and secondary sources
79.Surbhi S(2016), Difference Between Probability and Non-Probability Sampling
80.John W. creswell(2003),research design qualitative, quantitative. and mixed methods
approaches, second edition

113
81.Types of kurtosis, leptokurtic,
mesokurtic,platykurtic,http://jobsforworld.blogspot.com/2015/12/types-of-kurtosis-
leptokurtic.html a
Environmental Management center –Mumbai,2010
82.https://www.socialresearchmethods.net/kb/sampnon.php
83.http://www.statisticshowto.com/non-probability-sampling/
84.http://www.ird.govt.nz/business-income-tax/bit-income-tax-index.html
85.GerhardColm Spring, 1940),Conflicting Theories of Corporate Income Taxation, Vol.
7, No. 2, Federal Income and Estate Taxation (pp. 281-290
86.Other sources on SPSS analysis form YOUTUBE lectures annexed with screen shots.


![$ EDUCATIONAL FACILITIES REVENUE [AND REVENUE REFUNDING… · EDUCATIONAL FACILITIES REVENUE [AND REVENUE REFUNDING] ... Educational Facilities Revenue [and Revenue ... Aeronautical](https://static.fdocuments.in/doc/165x107/5b16e1207f8b9a686d8e7aa7/-educational-facilities-revenue-and-revenue-refunding-educational-facilities.jpg)