Factor Structure of the Wechsler Intelligence Scale for ... · PDF fileFactor Structure of the...
31
Factor Structure of the Wechsler Intelligence Scale for Children-Fourth Edition among Students with Attention Deficit Hyperactivity Disorder by Michelle Boehm A Thesis Presented in Partial Fulfillment of the Requirements for the Degree Master of Arts Approved April 2011 by the Graduate Supervisory Committee: Marley Watkins, Chair Amanda Sullivan Linda C. Caterino ARIZONA STATE UNIVERSITY May 2011
Transcript of Factor Structure of the Wechsler Intelligence Scale for ... · PDF fileFactor Structure of the...
Factor Structure of the Wechsler Intelligence Scale for
Children-Fourth Edition among Students with Attention Deficit
Hyperactivity Disorder
by
Michelle Boehm
A Thesis Presented in Partial Fulfillment of the Requirements for the Degree
Master of Arts
Approved April 2011 by the Graduate Supervisory Committee:
Marley Watkins, Chair
Amanda Sullivan Linda C. Caterino
ARIZONA STATE UNIVERSITY
May 2011
i
ABSTRACT
The Wechsler Intelligence Scale for Children-Fourth Edition (WISC-IV)
is one of the most popular intelligence tests used for special education eligibility
purposes in the United States. Despite the large prevalence of children and
adolescents with Attention Deficit Hyperactivity Disorder (ADHD), the factor
structure of the WISC-IV among this population has not been explored. Thus, the
factor structure of WISC-IV scores among students with ADHD was investigated
via replicatory factor analysis followed by a comparison with the factorial
structure of the normative sample using the coefficient of congruence. The four
factor model proposed by Wechsler was consistent with the factor structure found
in the sample of students with ADHD for all subtests except Picture Concepts and
Matrix Reasoning. The Verbal Comprehension and Processing Speed factors
appeared to measure the same construct in the study sample as in the normative
sample, while the Perceptual Reasoning and Working Memory factors were only
fairly similar to the normative sample. It is recommended that clinicians interpret
Perceptual Reasoning and Working Memory index scores of students with ADHD
cautiously. Limitations of the study, future directions for research, and
implications for practitioners are discussed.
ii
TABLE OF CONTENTS
Page
LIST OF TABLES ...................................................................................................... iii
CHAPTER
1 BACKGROUND .................................................................................... 1
2 METHOD ............................................................................................... 8
Participants .......................................................................................... 8
Instrument ........................................................................................... 9
Analysis ............................................................................................. 11
3 RESULTS ............................................................................................. 13
4 DISCUSSION ...................................................................................... 15
REFERENCES ........................................................................................................ 19
iii
LIST OF TABLES
Table Page
1. Descriptive Statistics for Sample of 184 Students with Attention
Deficit Hyperactivity Disorder on the Wechsler Intelligence Scale for
Children-Fourth Edition ................................................................... 27
2. Pattern Coefficients and Coefficients of Congruence for the Wechsler
Intelligence Scale for Children-Fourth Edition Normative Sample and
Sample of 184 Students with Attention Deficit Hyperactivity
Disorder (ADHD) ............................................................................. 28
3. Structure Coefficients on the Wechsler Intelligence Scale for Children-
Fourth Edition for Sample of 184 Students with Attention Deficit
Hyperactivity Disorder ..................................................................... 29
1
Chapter 1
BACKGROUND
More than one million students in the United States each year are
administered intelligence tests for special education eligibility purposes (Gresham
& Witt, 1997), and surveys taken by clinical and school psychologists have
consistently demonstrated that the Wechsler scales are the most commonly used
intelligence tests in the United States (Goh, Teslow, & Fuller, 1981; Hutton,
Dubes, & Muir, 1992; Stinnett, Havey, & Oehler-Stinnett, 1994; Watkins,
Campbell, Nieberding, & Hallmark, 1995). The Wechsler Intelligence Scale for
Children-Fourth Edition (WISC-IV; Wechsler, 2003a) is the most current version
of the Wechsler intelligence scales for children and, like previous versions, is
likely to be a popular intelligence battery used in the psychological assessment of
children and adolescents (Whitaker, 2008). Among the children for whom
intelligence tests are commonly used are those with Attention Deficit
Hyperactivity Disorder (ADHD), with 8% of children between the ages of 3 and
17 receiving this diagnosis in 2008 (Bloom, Cohen, & Freeman, 2009).
The WISC-IV Technical and Interpretive Manual (2003b) indicates that
the theoretical foundation of the WISC-IV was influenced by the three-stratum
theory of Carroll (1993, 2003), and that this theoretical underpinning should be
taken into consideration when interpreting test scores and making
recommendations. According to Carroll, cognitive abilities can be divided into
three separate strata based on breadth of coverage: A lower-order stratum of
approximately 50 or 60 linearly independent narrow abilities, a second stratum of
2
approximately 8 to 10 linearly independent broad abilities, and a third and highest
stratum of g, which represents general intellectual ability. The three level
structure of the WISC-IV is similar to Carroll’s model, consisting of 15 subtests,
four composite index scores, and a Full Scale IQ score.
Establishing the construct validity, particularly the structural validity, of a
measure is important because empirical analysis of a test’s structure provides
support for or against the test developer’s assertion that the structure of the test is
consistent with what it is theoretically designed to measure. Wechsler (2003b)
conducted exploratory and confirmatory factor analyses with the WISC-IV
normative data and found that four correlated factors, Verbal Comprehension,
Perceptual Reasoning, Processing Speed, and Working Memory, best represented
the intercorrelations between the 10 core WISC-IV subtests. Wechsler’s factor
analyses also supported the use of the WISC-IV as an adequate measure of
general intelligence. The evidence for four first-order factors and a higher-order
general intelligence score correspond to the factor structure proposed by
Wechsler.
Other studies investigating the structure of the WISC-IV via its
standardization sample have also supported the existence of a four-factor model.
Watkins (2006) and Sattler (2008) found evidence supporting the existence of
four first-order factors. In addition, Watkins (2006) found that the variance
accounted for by g in each of the 10 core subtests was considerably greater than
the variance accounted for by any of the four orthogonal first-order factors. Keith
(2005) conducted a confirmatory factor analysis and found evidence supporting
3
the existence of four first-order factors within a hierarchical model where subtests
were explained by first-order index factors, and these first order factors were
partially explained by the second order general intelligence (g) factor.
Unfortunately, Wechsler (2003b) did not report factor loadings or factor
correlations and did not conduct a higher order factor analysis to confirm and
describe the multilevel structure of the WISC-IV. To remedy these shortcomings,
Keith, Fine, Taub, Reynolds, and Kranzler (2006) investigated the structure of the
WISC-IV standardization sample across ages by conducting a higher order
confirmatory factor analysis. They found that the factor structure of the test was
best supported by a five-factor Cattell-Horn-Carroll (Carroll, 1993; Cattell, 1941;
Horn, 1965) model measuring crystallized ability (Gc), visual processing (Gv),
fluid reasoning (Gf), short-term memory (Gsm), and processing speed (Gs), rather
than the four-factor model described by Wechsler (2003b).
However, an unlikely perfect loading of 1.0 was found between the
general intelligence and fluid reasoning factors. The difference between
comparative fit indices (CFI) between the four-factor and five-factor models was
also very small, with values of .979 and .986, respectively. According to research
conducted by Chen (2007) on measurement invariance and fit indices, the CFI
value difference between these models did not reach a level of practical
significance. Thus, a four factor model may have been more appropriate than a
five-factor model.
Determining whether the factor structure of a test holds across a variety of
test takers and subgroups beyond the normative sample is imperative. Without
4
this information, conclusions about an individual’s performance and the
subsequent actions and consequences based on his or her test performance may be
unfounded (American Educational Research Association, American
Psychological Association, & National Council on Research in Education, 1999).
To this end, Watkins, Wilson, Kotz, Carbone, and Babula (2006) examined the
structural validity of the WISC-IV with a sample of Pennsylvania students
referred for special education. As with data from the normative sample, factor
analysis supported a model consisting of four first-order factors. Similarly, an
analysis of WISC-IV scores obtained from neuropsychological evaluations at a
pediatric hospital in the Southeastern United States supported a higher order four-
factor model with a general intelligence factor accounting for the majority of total
and common variance across subtests (Bodin, Pardini, Burns, & Stevens, 2009).
Finally, the same four factor model was supported in a confirmatory factor
analysis conducted with 355 students referred for special education in 34 states
(Watkins, 2010). These results further supported the existence of a higher order
four-factor model, with a general intelligence factor accounting for the majority of
common and total variance.
Several studies examining the factor structure of the Wechsler Intelligence
Scale for Children-Third Edition (WISC-III; Wechsler, 1991a) with clinical and
referral samples have also been conducted. A four factor model proposed by
Wechsler (1991b) consisting of Verbal Comprehension, Perceptual Organization,
Freedom From Distractibility, and Processing Speed factors was supported in a
special education sample (Konold, Kush, & Canivez, 1997), a mixed clinical
5
sample (Tupa, Wright, & Fristad, 1997), and in a sample of 45 children with a
clinical diagnosis of ADHD (Schwean, Saklofske, Yackulic, & Quinn, 1993).
Alternatively, a five factor model consisting of the factors Verbal Comprehension,
Constructional Praxis, Visual Reasoning, Freedom from Distractibility, and
Processing Speed was supported in a mixed clinical sample including children
with ADHD (Burton, Sepehri, Hecht, Vandenbroek, Ryan, & Drabman, 2001).
The authors suggested that Wechsler had neglected to find this five factor model
due to a failure to include more complex models in his analyses.
Researchers have also looked more specifically at the WISC-III
performance of children and adolescents with ADHD in comparison to other
groups. For example, Schwean et al. (1993) reported that a sample of children
with ADHD scored significantly lower on the Processing Speed and Freedom
from Distractibility factors and Verbal Intelligence Quotient and significantly
higher on the Perceptual Organization Index compared to the standardization
sample. On the other hand, Egeland, Sundberg, Andreassen, and Stensli (2006)
found that children with ADHD did not perform worse on the Processing Speed
and Freedom from Distractibility factors compared to other clinical groups on a
Norwegian translation of the WISC-III and subsequently warned against its
clinical utility in making diagnostic decisions.
Fewer studies have examined the factor structure of the Wechsler
Intelligence Scale for Children-Revised (WISC-R; Wechsler, 1974) in clinical
samples. In a comparison of a sample of children diagnosed with ADHD with
other clinical groups using a Dutch version of the WISC-R, the scores of the
6
subgroup with ADHD were best supported by a three factor model including the
factors Perceptual Organization, Verbal Comprehension, and Freedom from
Distractibility (Rispens, Swaab, van den Oord, Cohen-Kettenis, van Engeland, &
van Yperen, 1997). Furthermore, the subgroup with ADHD achieved lower scores
on the Performance IQ and Full Scale IQ in comparison to overall mean
performance and lower on the Freedom from Distractibility factor in comparison
to other diagnostic groups.
Despite research conducted on the structural validity of the WISC-III and
WISC-R, these results are difficult to generalize to the WISC-IV due to
considerable alterations made to both the content and structure of the test during
its revision. Three WISC-III core subtests were removed in its revision and five
new core subtests were added, decreasing the test’s emphasis on problem solving
ability and increasing its emphasis on fluid reasoning and working memory
(Kaufman, Flanagan, Alfonso, & Mascolo, 2006). In addition, two core subtests
in the WISC-III are now supplemental subtests in the WISC-IV. Other changes
included removing the Verbal IQ (VIQ), and Performance IQ (PIQ) and renaming
the Freedom from Distractibility Index (FDI) to the Working Memory Index
(WMI).
Although a four-factor structure has been established with the WISC-IV
standardization sample (Keith, 2005; Sattler, 2008; Watkins, 2006) samples of
students referred for special education(Watkins, 2010; Watkins et al., 2006), and a
clinical sample of students participating in a neuropsychological evaluation in the
Southeastern U.S. (Bodin, et al., 2009), more information about the structure of
7
the WISC-IV among a variety of clinical samples is needed (Strauss, Sherman, &
Spreen, 2006). Among the clinical samples for which the WISC-IV factor
structure has yet to be investigated are children with ADHD. The high prevalence
rate of ADHD among children in conjunction with the popularity of the WISC-IV
in making special education eligibility decisions (Gresham & Witt, 1997)
underscores the importance of utilizing a valid assessment tool with this particular
group of students. Consequently, the purpose of this study is to investigate the
structural validity of the WISC-IV among students with ADHD.
8
Chapter 2
METHOD
Participants
Following IRB and district approval, anonymous scores from WISC-IV
test administrations were collected by graduate students from 3,086 psychology
files in two school districts in a large city in the Southwestern region of the
United States. One hundred eighty-four children (55 female and 129 male)
between the ages of 6 and 16 years (M = 10.2, SD = 2.6) served as participants,
with 102 children attending school district one and 82 children attending school
district two at the time of WISC-IV administration.
All participants had been administered the WISC-IV as part of an
evaluation for special education services and were placed in special education
under the category Other Health Impairment-ADHD. All students with listed
secondary diagnoses were excluded from this sample, but actual co-morbidity of
participants is unknown. Test scores on norm referenced achievement measures
(e.g., Wechsler Individual Achievement Test-Second Edition, 2001, Woodcock-
Johnson III Tests of Achievement, 2001) were also collected when available, with
an average participant Total Reading score of 95.4 (SD = 11.7) and an average
Total Math score of 93.6 (SD = 13.4). The ethnic background of participants was
79.3% White, 10.3% Hispanic, 4.3% Black, .5% Asian/Pacific Islander, .5 %
American Indian, and 4.9% not specified. To preserve student privacy, no other
demographic information was collected on individual students.
9
School district demographic information was obtained from each school
district’s website and the Arizona Department of Education (ADE; 2011) website.
School district one is located in an urban area with a current enrollment of
approximately 33,500 students. It consists of 31 elementary schools, 8 middle
schools, and 6 high schools. The ethnic composition for the 2009-2010 school
year was 67.2% White, 23.8% Hispanic, 4.0% Black, 3.9% Asian, and 1.1%
Native American. According to a March 2011 report from the ADE, 32.8% of
students were eligible for free or reduced lunch. School district two is located in a
suburban region and currently serves approximately 26,000 students. It consists of
16 elementary schools, 3 K-8 schools, 6 middle schools, 5 high schools, and 1
alternative school. In 2010 the ethnic composition of the population living within
the boundaries of the school district was 83.1% White, 10.5% Hispanic, 2.9%
Asian, 1.7% Black, .6% Native American, and 1.2% Other. According to the
ADE, 26.6% of students were eligible for a free or reduced lunch in 2011.
Instrument
The Wechsler Intelligence Scale for Children-Fourth Edition (Wechsler,
2003a) is an individually administered intelligence test for children of ages 6
years, 0 months through 16 years, 11 months. It is the newest version of the
Wechsler child series and was revised based on the WISC-III. The WISC-IV was
standardized on 2,200 children who were selected to serve as a representative
sample of children from the United States. The standardization sample closely
corresponded with the composition of the 2000 United States census data on
10
characteristics including race, sex, level of parent education (socioeconomic
status), and geographic region (Sattler, 2008).
The WISC-IV contains 10 core subtests (Block Design, Similarities, Digit
Span, Matrix Reasoning, Coding, Vocabulary, Letter-Number Sequencing,
Symbol Search, Comprehension, and Picture Concepts) and 5 supplementary
subtests (Information, Word Reasoning, Picture Completion, Arithmetic, and
Cancellation) with standard score means of 10 and standard deviations of 3. The
10 core subtests combine to form four composite index scores (M = 100, SD =
15): verbal comprehension (VCI), perceptual reasoning (PRI), working memory,
and processing speed (PSI). The Full Scale IQ (FSIQ) represents general
intelligence and is derived from the sum of the 10 core subtest scores.
The WISC-IV Technical and Interpretive Manual (2003b) reports excellent
test-retest reliability and adequate to excellent internal consistency for the WISC-
IV (Hunsley & Mash, 2008). For example, test-retest reliability coefficients for
the four indices (with a mean test interval of 32 days) ranged from .86 to .93, with
a FSIQ test-retest reliability coefficient > .90. The average internal reliability
coefficients for the four indices ranged from .88 to .94, and the FSIQ internal
reliability coefficient was .97. Internal consistency coefficients for individual
subtests ranged from .79 (Cancellation and Symbol Search) to .90 (Letter Number
Sequencing).
The criterion validity properties of the WISC-IV have been demonstrated
by examining its convergent validity with measures of general intelligence from
other Wechsler scales. The WISC-IV is highly correlated with the FSIQs of the
11
Wechsler Adult Intelligence Scale-Third Edition (WAIS-III; Wechsler, 1997)
with a correlation of .89, the Wechsler Preschool and Primary Scale of
Intelligence-Third Edition (WPPSI-III; Wechsler, 2002) with a correlation of .89,
the WISC-III with a correlation of .89, and the Wechsler Abbreviated Scale of
Intelligence (WASI; 1999) with a correlation of .86. The WISC-IV is also highly
correlated with achievement measures such as the Wechsler Individual
Achievement Test (WIAT-II; Wechsler, 2001), with a correlation of .87 between
respective FSIQ and Total Achievement indices. In addition, a comparison of
WISC-IV index scores has revealed its convergent and discriminant validity
properties. The Verbal Comprehension index, for example, has an average
correlation of .83 with other Wechsler measures of verbal intelligence. At the
same time, correlations between the VCI and other indices measuring different
constructs are lower (e.g., an average correlation of .61 with measures of
perceptual abilities).
Analysis
The statistical treatment in this study was consistent with the replicatory
factor analysis (RFA) procedure described by Ben-Porath (1990). RFA involves
applying exploratory factor analytic techniques identical to those employed in the
original study, including extracting the same number of factors and rotating them
to replicate the original solution as closely as possible. As noted by Geisinger
(2003), this is a form of cross validation. Pattern coefficients ≥ .30 were
considered salient and practically significant (Stevens, 2002). Pattern coefficients
were also interpreted using a method appropriate for small samples as described
12
by Stevens, in which the standard error of the pattern coefficient is doubled and
then used as a critical value for statistical significance.
Following these RFA procedures, a principal axis extraction method with
two iterations was conducted followed by promax oblique rotation as described in
the WISC-IV Technical and Interpretive Manual (2003b). Next, a direct
comparison was made between the factorial structures found in the normative and
study samples (Ben-Porath, 1990) with the coefficient of proportionality (van de
Vijver & Leung, 2007) also known as Tucker’s coefficient of agreement or
Tucker’s coefficient of congruence (Guadagnoli & Velicer, 1991; Lorenzo-Seva
& ten Berge, 2006; Tucker, 1951). According to rules of thumb suggested by
Lorenzo-Seva and ten Berge (2006) derived from an analysis of factorial
similarity ratings of 56 judges experienced in factor analysis, coefficient values ≥
+.95 are interpreted as evidence of factorial similarity, values in the range of .85-
.94 are interpreted as evidence of fair factorial similarity, and values < .85 are
indicative of a lack of similarity between factors. The coefficient of congruence
was calculated using the Coefficient of Congruence software developed by
Watkins (2002).
13
Chapter 3
RESULTS
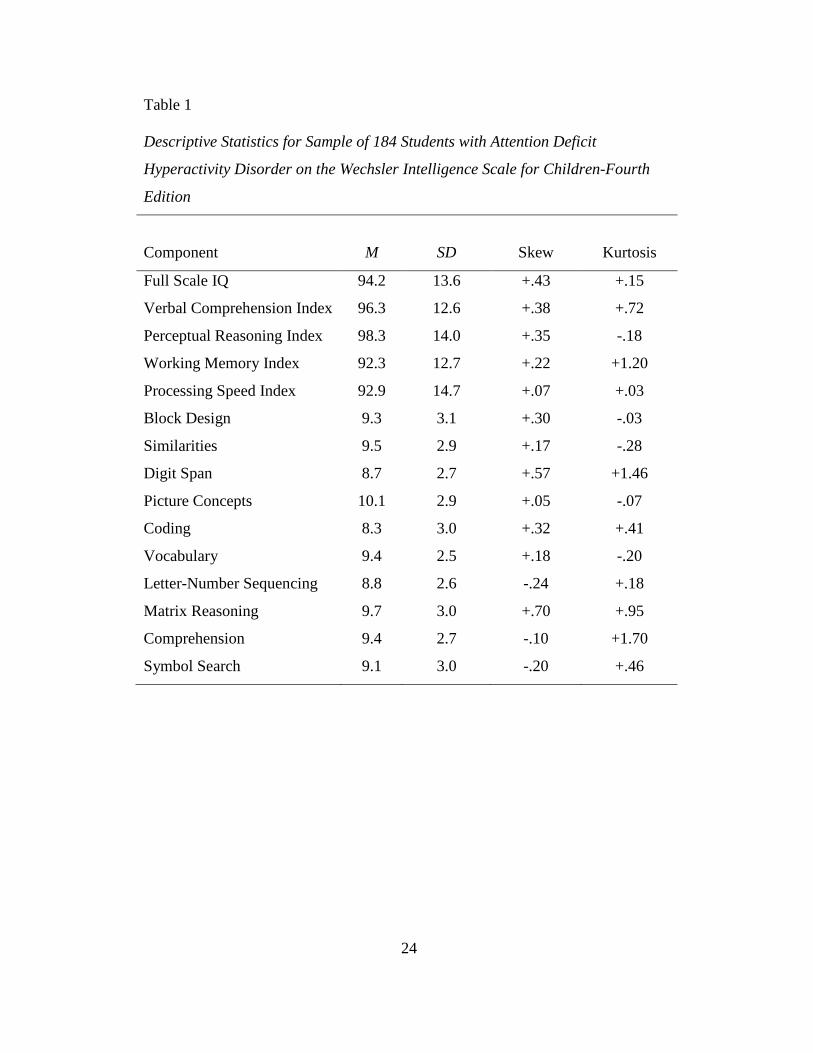
With the exception of the Picture Concepts subtest, the mean subtest,
factor, and general intelligence scores in this sample of students with ADHD were
lower than the normative sample (see Table 1). Lower subtest, factor, and general
intelligence scores have also been found in other research examining the factor
structure of the WISC-IV among referred students (Watkins, 2010; Watkins et al.,
2006). The distribution of scores in the study sample appeared to be relatively
normal, with the largest skew value at .70 and the largest kurtosis value at 1.70.
To assess the factorability of the correlation matrix, the Kaiser-Meyer-
Olkin measure of sampling adequacy (KMO; Kaiser, 1974) and Bartlett’s Test of
Sphericity (Bartlett, 1950) were conducted. Bartlett’s Test of Sphericity indicated
that the correlation matrix was not random (χ2= 570.72, df = 45, p < .001) and a
KMO statistic of .85 was higher than the minimum standard value proposed by
Tabachnick and Fidell (2007). Therefore, it was determined that the correlation
matrix was adequate for factor analysis.
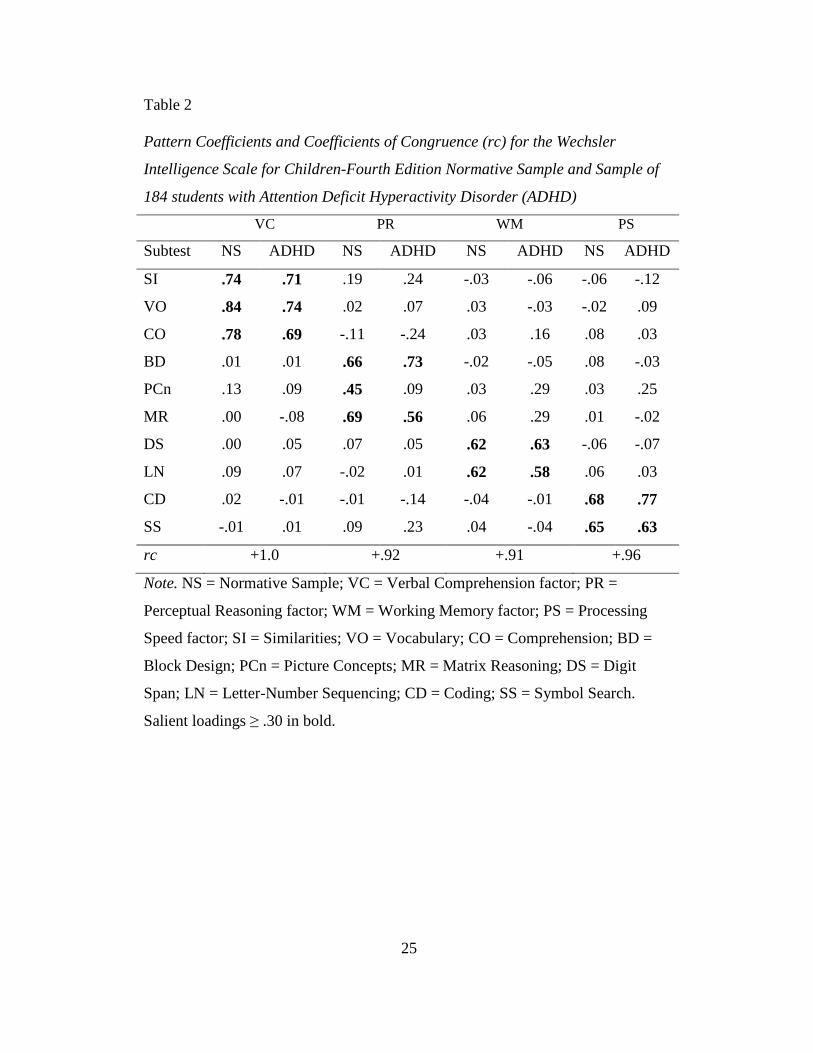
Factor intercorrelations ranging from .53 between the PR and PS factors to
.67 between the VC and WM factors were indicative of a second-order factor.
However, the four factor model proposed by Wechsler was consistent with the
factor structure found in the sample of students with ADHD for all subtests except
Picture Concepts, that failed to load saliently on any single factor (see pattern and
structure coefficients in Tables 2 and 3). All salient pattern coefficients also
exceeded the approximate critical value for statistical significance (.38)
14
recommended by Stevens (2002), indicating that they were not attributable to
chance. Although Picture Concepts did not approach a level of salience or
statistical significance on the PR factor (.09), it approached a level of salience on
the WM and PS factors (.28 and .25, respectively). Furthermore, the Matrix
Reasoning subtest loaded strongly not only on the expected PR factor (.56) but on
the WM factor (.29) as well.
Based on pattern coefficients of the normative and study sample (see
Table 2), the coefficient of congruence was +1.0 for the VC factor, +.91 for the
PR factor, +.92 for the WM factor, and +.96 for the PS factor. Thus, the VC and
PS factors in the sample with ADHD represented good to excellent factorial
similarity while the PR and WM factors were fairly similar to the normative
sample based on the rules of thumb suggested by Lorenzo-Seva and ten Berge
(2006).
15
Chapter 4
DISCUSSION
An RFA of the WISC-IV scores of a sample of 184 school children and
adolescents with ADHD was conducted using the same procedures used with the
normative sample as reported in the WISC-IV Technical and Interpretive Manual
(2003b). Results indicated that a four factor model was also appropriate for
children and adolescents with ADHD, and that the VC and PS factors appeared to
measure the same construct in the normative sample as in this sample of children
and adolescents with ADHD. However, the PR and WM factors in this sample of
students with ADHD were only fairly similar to the normative sample, with a
failure to achieve strong factorial similarity most notably due to the Picture
Concepts and Matrix Reasoning subtests. While these two subtests were expected
to load strongly solely on the PR factor, the factor loadings of both subtests
approached a level of salience (i.e., ≥ .30) on the WM factor (.28 and .29,
respectively).
According to Barkley (1997), ADHD is a disorder defined primarily by
underlying deficits in behavior inhibition and executive functioning. These
deficits result in secondary impairments in other areas including working
memory, with implications including poor impulse control, difficulty using
forethought and planning to solve problems, and diminished success persisting in
goal-directed behavior due to internal and external disruptions within the
environment. The Picture Concepts subtest requires the child to match pictures in
multiple rows based on similar characteristics. The nature of the Picture Concepts
16
task and deficits in working memory identified by Barkley might have resulted in
impulsive answer selection among the participants with ADHD in this study.
Thus, this is a plausible explanation as to why Picture Concepts failed to load
saliently on the Perceptual Reasoning factor and approached a level of salience on
the Working Memory factor.
Like studies examining the factor structure of the WISC-IV normative
sample (Keith, 2005; Watkins, 2006) samples of children and adolescents referred
for special education (Watkins, 2010; Watkins et al., 2006) and a mixed clinical
sample receiving a neuropsychological evaluation (Bodin et al., 2009), a factor
analysis with a sample of children and adolescents with ADHD also suggested
that a four-factor model consisting of Verbal Comprehension, Perceptual
Reasoning, Working Memory, and Processing Speed factors is appropriate. High
intercorrelations between the four factors was also consistent with previous
research on the WISC-IV (Bodin et al., 2009; Keith, 2005; Watkins, 2006;
Watkins, 2010; Watkins et al., 2006) and Carroll’s (2003) three stratum theory,
providing further evidence supporting the existence of a second-order general
intelligence factor. Participants with ADHD in this study achieved lower scores
than the normative sample on the full scale and four index factor scores; a
consistent finding with other studies examining the WISC-IV scores among
students referred for special education (Watkins, 2010; Watkins et al., 2006).
There were several limitations of this study. The psychology files from
which test scores were obtained did not contain information regarding ADHD
diagnostic subtype (i.e., ADHD-Inattentive, ADHD-Hyperactive/Impulsive, or
17
ADHD-Combined). Therefore, it is impossible to determine if there were group
differences in WISC-IV test performance based on ADHD subtype. Additionally,
it is unknown whether or not participants were taking medication for ADHD at
the time of testing and how this might have affected their performance and
subsequent test scores. However, previous research has demonstrated that WISC-
III subtest and factor scores of children with ADHD taking methylphenidate
(Ritalin) did not significantly differ from children with ADHD in a placebo
condition (Schwean et al., 1993). Based on these findings, researchers have
suggested that methylphenidate would similarly not impact test performance on
the WISC-IV (Schwean & Saklofske, 2005). However, the effects of other ADHD
medication other than Ritalin on test performance have not been determined.
Additional research is needed to determine how characteristics such as medication
and ADHD subtype affects performance on the WISC-IV. In addition, only core
subtests were included in the factor analysis for this study. Thus, further research
is needed in order to discern how the factor structure of the WISC-IV
supplemental subtests among children with ADHD compares with the normative
sample.
Although Streiner (1994) and Kline (1991) suggested that a sample size of
at least 100 subjects is desirable when analyzing data using exploratory factor
analysis, this study would have benefited from a larger number of participants.
Additional research with a larger sample of children and adolescents with ADHD
should be conducted in order to determine if the findings of this study are
replicable. Finally, it should be noted that the coefficient of congruence as a
18
measure of factorial similarity is only appropriate in making broad, global
comparisons across groups. Therefore, this statistical measure is “not accurate
enough to identify anomalous items and subtle differences in the factorial
composition and meaning across groups” (Van de Vijver & Leung, 1997, p. 93).
Despite these limitations, this study provides initial evidence supporting
the structural validity of the WISC-IV among students with ADHD and for the
use of the WISC-IV in conducting psychoeducational evaluations with this
particular subgroup. Results support interpreting scores of students with ADHD
based on the same four-factor model that has been proposed for use with the
general population by Wechsler (2003b). An analysis of coefficients of
congruence also provides preliminary evidence that specific constructs of
intelligence, namely verbal comprehension and processing speed are measured
with excellent similarity as in those in the general population while perceptual
reasoning and working memory are fairly comparable. However, interpreting the
performance of students with ADHD based on individual index scores should be
done cautiously, particularly with the Working Memory and Perceptual
Reasoning indices. Interpreting WISC-IV scores based on index score
performance over the Full Scale IQ score is further discouraged based on previous
research indicating that the majority of common and total variance in WISC-IV
scores of referred and clinical samples of children is attributable to a general
intelligence factor (e.g., Bodin et al., 2009; Watkins, 2010; Watkins et al., 2006).
19
REFERENCES
American Educational Research Association, American Psychological
Association, and National Council on Measurement in Education. (1999). Standards for educational and psychological testing. Washington, DC: American Educational Research Association.
Arizona Department of Education (2011, March). Percentage of Free and
Reduced Reports. Retrieved April 1, 2011 from https://www.azed.gov/health-safety/cnp/frpercentages/
Barkley, R. A. (1997). Behavioral inhibition, sustained attention, and executive
functions: Constructing a unifying theory of ADHD. Psychological Bulletin, 121, 65-94.
Bartlett, M. S. (1950). Tests of significance in a factor analysis. British Journal of
Psychology (Statistical Section), 3, 77-85. Ben-Porath, Y. S. (1990). Cross-cultural assessment of personality: The case for
replicatory factor analysis. In J. N. Butcher & C. D. Spielberger (Eds.), Advances in personality assessment: Vol. 8 (pp. 27-48). Hillsdale, NJ: Lawrence Erlbaum Associates.
Bloom, B., Cohen, R. A., & Freeman, G. (2009). Summary health statistics
for U.S. children: National health interview survey, 2008. Vital and Health Statistics 10(244). Retrieved October 22, 2010, from http://www.cdc.gov/nchs/data/series/sr_10/sr10_244.pdf
Bodin, D., Pardini, D. A., Burns, T. G., & Stevens, A. B. (2009). Higher
order factor structure of the WISC-IV in a clinical neuropsychological sample. Child Neuropsychology, 15, 417-424.
Burton, D. B., Sepehri A., Hecht, F., Vandenbroek, A., Ryan, J. J., & Drabman,
R. (2001). A confirmatory factor analysis of the WISC-III in a clinical sample with cross-validation in the standardization sample. Child Neuropsychology, 7, 104-116.
Carroll, J. B. (1993). Human cognitive abilities: A survey of factor analytic
studies. New York, NY: Cambridge University Press. Carroll, J. B. (2003). The higher-stratum structure of cognitive abilities:
Current evidence supports g and about ten broad factors. In H. Nyborg (Ed.), The scientific study of general intelligence: Tribute to Arthur R. Jensen (pp. 5–21). New York, NY: Pergamon Press.
20
Cattell, R. B. (1941). Some theoretical issues in adult intelligence testing.
Psychological Bulletin, 38, 592. Chen, F. F. (2007). Sensitivity of goodness of fit indexes to lack of measurement
invariance. Structural Equation Modeling, 14, 464-504. Egeland, J., Sundberg, H., Andreassen, T. H., & Stensli, O. (2006). Reliability
and validity of Freedom from Distractibility and Processing Speed factors in the Norwegian WISC-III version. Nordic Psychology, 58, 136-149.
Geisinger, K. F. (2003). Testing and assessment in cross-cultural psychology. In
J. R. Graham & J. A. Naglieri (Eds.), Handbook of psychology: Vol. 10. Assessment psychology (pp. 95-117). Hoboken, NJ: Wiley.
Goh, D. S., Teslow, J., & Fuller, G. B. (1981). The practice of psychological
assessment among school psychologists. Professional Psychology, 12, 696-706.
Gresham, F. M., & Witt, J. C. (1997). Utility of intelligence tests for treatment
planning, classification and placement decisions: Recent empirical findings and future directions. School Psychology Quarterly, 12, 249-267.
Guadagnoli, E., & Velicer, W. (1991). A comparison of pattern matching indices.
Multivariate Behavioral Research, 26, 323-343. Horn, J. L. (1965). Fluid and crystallized intelligence: A factor analytic study of
the structure among primary mental abilities. Dissertation Abstracts, 26, 479-480.
Hunsley, J., & Mash, E. J. (2008). A guide to assessments that work. New York,
NY: Oxford University Press. Hutton, J. B., Dubes, R., & Muir, S. (1992). Assessment practices of school
psychologists: Ten years later. School Psychology Review, 21, 271-284. Kaiser, H. F. (1974). An index of factorial simplicity. Psychometrika, 39, 31-36. Kaufman, A. S., Flanagan, D. P., Alfonso, V. P., & Mascolo, J. T. (2006). Test
review: Wechsler Intelligence Scale for Children-Fourth Edition (WISC-IV ). Journal of Psychoeducational Assessment, 24, 278-295.
Keith, T. Z. (2005). Using confirmatory factor analysis to aid in understanding the
constructs measured by intelligence tests. In D. P. Flanagan & P. L.
21
Harrison (Eds.), Contemporary intellectual assessment: Theories, tests, and issues (2nd ed., pp. 581-614). New York, NY: Guilford Press.
Keith, T. Z., Fine, J. G., Taub, G. E., Reynolds, M. R., & Kranzler, J. H.
(2006). Higher order, multi-sample, confirmatory factor analysis of the Wechsler Intelligence Scale for Children–Fourth Edition: What does it measure? School Psychology Review, 35, 108-127.
Kline, P. (1991). Intelligence: The psychometric view. London, England:
Routledge. Konold, T. R., Kush, J. C., & Canivez, G. L. (1997). Factor replication of the
WISC-III in three independent samples of children receiving special education. Journal of Psychoeducational Assessment, 15, 123-137.
Lorenzo-Seva, U., & ten Berge, J. M. F. (2006). Tucker’s congruence coefficient
as a meaningful index of factor similarity. Methodology, 2, 57-64. Rispens, J., Swaab, H., van den Oord, E. J. C. G., Cohen-Kettenis, P., van
Engeland, H., & van Yperen, T. (1997). WISC profiles in child psychiatric diagnoses: Sense or nonsense? Journal of the American Academy of Child and Adolescent Psychiatry, 36, 1587-1594.
Sattler, J. M. (2008). Assessment of children: Cognitive foundations (5th ed.). San
Diego, CA: Author. Schwean, V. L., & Saklofske, D. H. (2005). Assessment of Attention Deficit
Hyperactivity Disorder with the WISC-IV. In A. Prifitera, D. H. Saklofske, & L. G. Weiss (Eds.), WISC-IV clinical use and interpretation: Scientist practitioner perspectives (pp. 235-280). Burlington, MA: Elsevier.
Schwean, V. L., Saklofske, D.H., Yackulic, R. A., & Quinn, D. (1993). WISC-III
performance of ADHD children. Journal of Psychoeducational Assessment. Monograph Series: Advances in Psychoeducational Assessment, 56-70.
Stevens, J. (2002). Applied multivariate statistics for the social sciences (4th ed.).
Mahwah, NJ: Lawrence Erlbaum Associates. Stinnett, T. A., Havey, J. M., & Oehler-Stinnett, J. (1994). Current test usage by
practicing school psychologists: A national survey. Journal of Psychoeducational Assessment, 12, 331-350.
22
Strauss, E., Sherman, E. M. S., & Spreen, O. (2006). A compendium of neuropsychological tests: Administration, norms, and commentary (3rd ed.). New York, NY: Oxford University Press.
Streiner, D. L. (1994). Figuring out factors: The use and misuse of factor analysis.
Canadian Journal of Psychiatry, 39, 135-140. Tabachnick, B. G., & Fidell, L. S. (2007) Using multivariate statistics (5th ed.).
Boston, MA: Allyn and Bacon. Tucker, L. R. (1951). A method for the synthesis of factor analytic studies.
(Personnel Research Report No. 984). Washington, DC: Department of the Army.
Tupa, D. J., Wright, M. O., & Fristad, M. A. (1997). Confirmatory factor analysis
of the WISC-III with child psychiatric inpatients. Psychological Assessment, 9, 302-306.
van de Vijver, F. J. R., & Leung, K. (1997). Methods and data analysis for cross-
cultural research. Newbury Park, CA: Sage. Watkins, C. E., Jr., Campbell, V. L., Nieberding, R., & Hallmark, R. (1995).
Contemporary practice of psychological assessment by clinical psychologists. Professional Psychology: Research and Practice, 26, 54-60.
Watkins, M. W. (2002). Coefficient of congruence (Rc) [Computer software].
Retrieved September 12, 2010 from http://www.public.asu.edu/~mwwatkin/Watkins6.html
Watkins, M. W. (2006). Orthogonal higher order structure of the Wechsler
Intelligence Scale for Children-Fourth Edition. Psychological Assessment, 18, 123-125.
Watkins, M. W. (2010). Structure of the Wechsler Intelligence Scale for Children-
Fourth Edition among a national sample of referred students. Psychological Assessment, 22, 782-787.
Watkins, M. W., Wilson, S. M., Kotz, K. M., Carbone, M. C., & Babula, T.
(2006). Factor structure of the Wechsler Intelligence Scale for Children-Fourth Edition among referred students. Educational and Psychological Measurement, 66, 975-983.
Wechsler, D. (1974). Wechsler Intelligence Scale for Children-Revised. San
Antonio, TX: Psychological Corporation.
23
Wechsler, D. (1991a). Wechsler Intelligence Scale for Children-Third Edition.
San Antonio, TX: Psychological Corporation. Wechsler, D. (1991b). Wechsler Intelligence Scale for Children-Third Edition
technical and interpretive manual. San Antonio, TX: Psychological Corporation.
Wechsler, D. (1997). Wechsler Adult Intelligence Scale-Third Edition. San
Antonio, TX: Psychological Corporation. Wechsler, D. (1999). Wechsler Abbreviated Scale of Intelligence. San Antonio,
TX: Psychological Corporation. Wechsler, D. (2001) Wechsler Individual Achievement Test-Second Edition. San
Antonio, TX: Psychological Corporation. Wechsler, D. (2002). Wechsler Preschool and Primary Scale of Intelligence-Third
Edition. San Antonio, TX: Psychological Corporation. Wechsler, D. (2003a). Wechsler Intelligence Scale for Children-Fourth Edition.
San Antonio, TX: Psychological Corporation. Wechsler, D. (2003b). Wechsler Intelligence Scale for Children-Fourth Edition
technical and interpretive manual. San Antonio, TX: Psychological Corporation.
Whitaker, S. (2008). WISC-IV and low IQ: Review and comparison with the
WAIS-III. Educational Psychology in Practice, 24, 129-137. Woodcock, R. W., McGrew, K. S., & Mather, N. (2001). Woodcock-Johnson III
Tests of Achievement. Itasca, IL: Riverside Publishing.
24
Table 1 Descriptive Statistics for Sample of 184 Students with Attention Deficit
Hyperactivity Disorder on the Wechsler Intelligence Scale for Children-Fourth
Edition
Component M SD Skew Kurtosis
Full Scale IQ
Verbal Comprehension Index
Perceptual Reasoning Index
Working Memory Index
Processing Speed Index
Block Design
94.2
96.3
98.3
92.3
92.9
9.3
13.6
12.6
14.0
12.7
14.7
3.1
+.43
+.38
+.35
+.22
+.07
+.30
+.15
+.72
-.18
+1.20
+.03
-.03
Similarities 9.5 2.9 +.17 -.28
Digit Span 8.7 2.7 +.57 +1.46
Picture Concepts 10.1 2.9 +.05 -.07
Coding 8.3 3.0 +.32 +.41
Vocabulary 9.4 2.5 +.18 -.20
Letter-Number Sequencing 8.8 2.6 -.24 +.18
Matrix Reasoning 9.7 3.0 +.70 +.95
Comprehension 9.4 2.7 -.10 +1.70
Symbol Search 9.1 3.0 -.20 +.46
25
Table 2 Pattern Coefficients and Coefficients of Congruence (rc) for the Wechsler
Intelligence Scale for Children-Fourth Edition Normative Sample and Sample of
184 students with Attention Deficit Hyperactivity Disorder (ADHD)
VC PR WM PS
Subtest NS ADHD NS ADHD NS ADHD NS ADHD
SI .74 .71 .19 .24 -.03 -.06 -.06 -.12
VO .84 .74 .02 .07 .03 -.03 -.02 .09
CO .78 .69 -.11 -.24 .03 .16 .08 .03
BD .01 .01 .66 .73 -.02 -.05 .08 -.03
PCn .13 .09 .45 .09 .03 .29 .03 .25
MR .00 -.08 .69 .56 .06 .29 .01 -.02
DS .00 .05 .07 .05 .62 .63 -.06 -.07
LN .09 .07 -.02 .01 .62 .58 .06 .03
CD .02 -.01 -.01 -.14 -.04 -.01 .68 .77
SS -.01 .01 .09 .23 .04 -.04 .65 .63
rc +1.0 +.92 +.91 +.96
Note. NS = Normative Sample; VC = Verbal Comprehension factor; PR =
Perceptual Reasoning factor; WM = Working Memory factor; PS = Processing
Speed factor; SI = Similarities; VO = Vocabulary; CO = Comprehension; BD =
Block Design; PCn = Picture Concepts; MR = Matrix Reasoning; DS = Digit
Span; LN = Letter-Number Sequencing; CD = Coding; SS = Symbol Search.
Salient loadings ≥ .30 in bold.
26
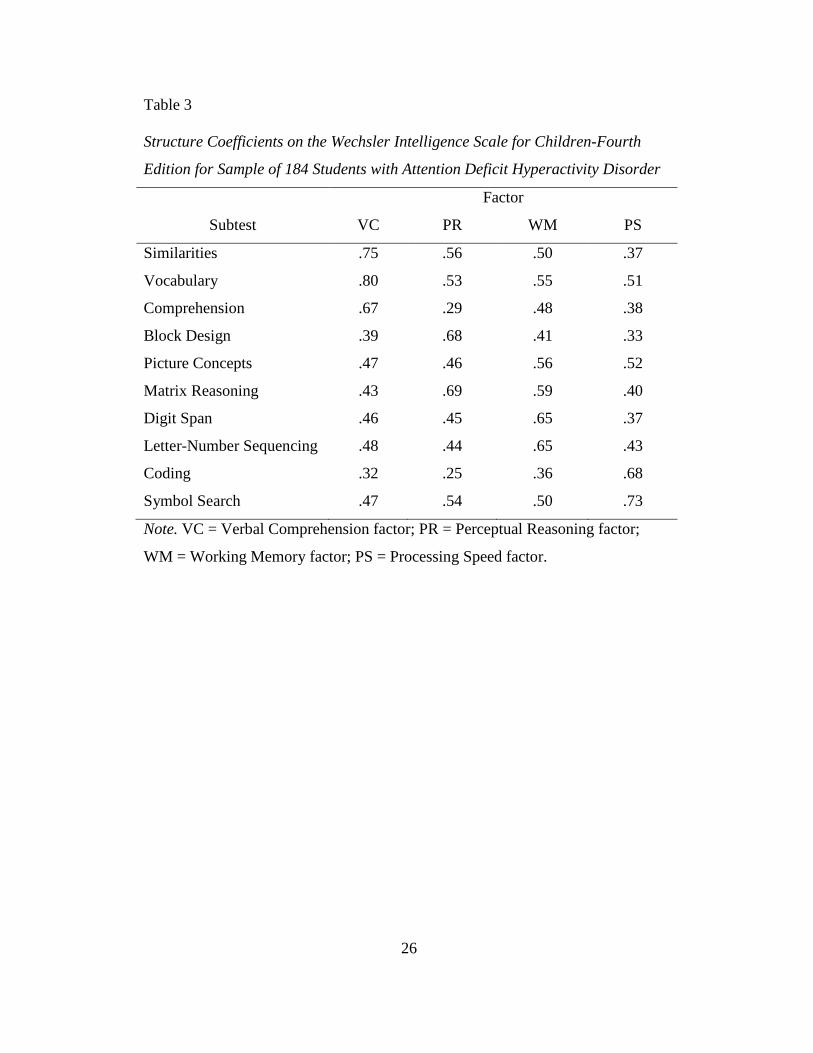
Table 3
Structure Coefficients on the Wechsler Intelligence Scale for Children-Fourth
Edition for Sample of 184 Students with Attention Deficit Hyperactivity Disorder
Factor
Subtest VC PR WM PS
Similarities .75 .56 .50 .37
Vocabulary .80 .53 .55 .51
Comprehension .67 .29 .48 .38
Block Design .39 .68 .41 .33
Picture Concepts .47 .46 .56 .52
Matrix Reasoning .43 .69 .59 .40
Digit Span .46 .45 .65 .37
Letter-Number Sequencing .48 .44 .65 .43
Coding .32 .25 .36 .68
Symbol Search .47 .54 .50 .73
Note. VC = Verbal Comprehension factor; PR = Perceptual Reasoning factor;
WM = Working Memory factor; PS = Processing Speed factor.