Factor analysis reveals differences in brain metabolism in macaques with SIV/AIDS and those with...
10
Factor analysis reveals differences in brain metabolism in macaques with SIV/AIDS and those with SIV-induced encephalitis Margaret R. Lentz, 1 Vallent Lee, 1 Susan V. Westmoreland, 2 Eva-Maria Ratai, 1 Elkan F. Halpern 1 and R. Gilberto Gonza ´ lez 1 * 1 Department of Neuroradiology/A. A. Martinos Center for Biomedical Imaging, Massachusetts General Hospital, Charlestown, MA 02129, USA 2 New England Primate Research Center, Southborough, MA 01772, USA Received 15 January 2008; Revised 6 March 2008; Accepted 7 March 2008 ABSTRACT: MRS has often been used to study metabolic processes in the HIV-infected brain. However, it remains unclear how changes in individual metabolites are related to one another in this context of virus-induced central nervous system dysfunction. We used factor analysis (FA) to identify patterns of metabolite distributions from an MRS study of healthy macaques and those infected with simian immunodeficiency virus (SIV) which were moribund with AIDS. FA summarized the correlations from nine metabolites into three main factors. Factor 3 identified patterns that discern healthy animals from those with SIV/AIDS. Factor 2 was able to differentiate between animals that had encephalitis and those moribund with AIDS but lacking encephalitis. Specifically, Factor 2 was able to distinguish animals with moderate to severe encephalitis from animals with mild or no encephalitis as well as uninfected controls. FA not only confirmed the involvement of neuronal metabolites (N-acetylaspartate and glutamate) in disease severity, but also detected changes in creatine and myo-inositol that have not been observed in the SIV macaque model previously. These results suggest that the divergent pathways of N-acetylaspartate and creatine in this disease may enable the commonly reported ratio N-acetylaspartate/creatine to be a more sensitive marker of disease severity. Copyright # 2008 John Wiley & Sons, Ltd. KEYWORDS: human immunodeficiency virus (HIV); simian immunodeficiency virus (SIV); MRS; N-acetylaspartate; creatine; encephalitis; frontal cortex; factor analysis INTRODUCTION Infection with human immunodeficiency virus (HIV) can often lead to encephalitis and dementia induced by central nervous system penetration by the virus and not as an opportunistic infection (1,2). Proposed mechanisms for this injury include neurotoxic factors and inflammatory cytokines that can produce neuronal injury and gliosis (3). MRS has been used to investigate HIV-induced brain disease, which has documented metabolic changes in patients at various stages of infection (4–7). Such studies have commonly reported decreases in the neuronal marker N-acetylaspartate (NAA) and increases in myo-inositol (MI) and/or choline-containing compounds (Cho). These metabolites are often reported as ratios with respect to total creatine (Cr), which is used as an internal standard because stable energy metabolism is assumed. However, the belief that creatine is unvarying in neurodegenerative disease is debated, and changes in this marker have been reported in neuroAIDS (8). In the simian immunodeficiency virus (SIV) macaque model, NAA/Cr changes have been reported and have, in some instances, been found to be reversible at different stages of SIV infection (9–12). However, significant Cho/ Cr and MI/Cr changes have only been observed during acute infection. Recently, we reported that NAA/Cr could serve as a biomarker that indicates the severity of encephalitis in SIV-infected macaques (13). We also noted changes in other neurotransmitter ratios, such as glutamate (Glu) and g -aminobutyric acid (GABA) relative to Cr, but these were found to have little bearing on the severity of encephalitis when analyzed individu- ally, even though both correlated very well with NAA. Although MRS allows quantification of several brain metabolites, it remains unclear how the various changes NMR IN BIOMEDICINE NMR Biomed. 2008; 21: 878–887 Published online 23 June 2008 in Wiley InterScience (www.interscience.wiley.com) DOI:10.1002/nbm.1276 *Correspondence to: R. G. Gonza ´lez, Neuroradiology Division, GRB 285, Massachusetts General Hospital, 55 Fruit Street, Boston, MA 02114-2696, USA. E-mail: [email protected] Contract/grant sponsor: NIH; contract/grant number: RR13213 (RGG), NS050041 (RGG), NS34626 (RGG), RR000150 (SVW), NS051129 (MRL), EB002026 (Massachusetts Institute of Technol- ogy), RR00168-39 (New England Primate Research Center), and P41 RR14075 (Massachusetts General Hospital). Contract/grant sponsor: Mental Illness and Neuroscience Discovery (MIND) Institute. Abbreviations used: AIDS, acquired immunodeficiency syndrome; ANOVA, analysis of variance; Cho, choline-containing compounds; Cr, creatine; FA, factor analysis; GABA, g -aminobutyric acid; Gln, glutamine; Glu, glutamate; Gly, glycine; HIV, human immunodefi- ciency virus; MI, myo-inositol; NAA, N-acetylaspartate; NAAG, N-acetylaspartylglutamate; SIV, simian immunodeficiency virus; SIVE, SIV-induced encephalitis; S, sum of all metabolites of interest. Copyright # 2008 John Wiley & Sons, Ltd. NMR Biomed. 2008; 21: 878–887
-
Upload
margaret-r-lentz -
Category
Documents
-
view
213 -
download
0
Transcript of Factor analysis reveals differences in brain metabolism in macaques with SIV/AIDS and those with...
NMR IN BIOMEDICINENMR Biomed. 2008; 21: 878–887Published online 23 June 2008 in Wiley InterScience
(www.interscience.wiley.com) DOI:10.1002/nbm.1276Factor analysis reveals differences in brain metabolism inmacaques with SIV/AIDS and those with SIV-inducedencephalitis
Margaret R. Lentz,1 Vallent Lee,1 Susan V. Westmoreland,2 Eva-Maria Ratai,1
Elkan F. Halpern1 and R. Gilberto Gonzalez1*
1Department of Neuroradiology/A. A. Martinos Center for Biomedical Imaging, Massachusetts General Hospital, Charlestown, MA 02129, USA2New England Primate Research Center, Southborough, MA 01772, USA
Received 15 January 2008; Revised 6 March 2008; Accepted 7 March 2008
*Correspondence285, Massachuse02114-2696, USAE-mail: rggonzalContract/grant s(RGG), NS0500NS051129 (MRLogy), RR00168-3RR14075 (MassaContract/grant sp(MIND) Institute
Abbreviations uANOVA, analysiCr, creatine; FA,glutamine; Glu,ciency virus; MN-acetylaspartylgSIVE, SIV-induc
Copyright # 200
ABSTRACT: MRS has often been used to study metabolic processes in the HIV-infected brain. However, it remains unclear
how changes in individual metabolites are related to one another in this context of virus-induced central nervous system
dysfunction. We used factor analysis (FA) to identify patterns of metabolite distributions from an MRS study of healthy
macaques and those infected with simian immunodeficiency virus (SIV) which were moribund with AIDS. FA summarized
the correlations from nine metabolites into three main factors. Factor 3 identified patterns that discern healthy animals from
those with SIV/AIDS. Factor 2 was able to differentiate between animals that had encephalitis and those moribund with
AIDS but lacking encephalitis. Specifically, Factor 2 was able to distinguish animals with moderate to severe encephalitis
from animals with mild or no encephalitis as well as uninfected controls. FA not only confirmed the involvement of neuronal
metabolites (N-acetylaspartate and glutamate) in disease severity, but also detected changes in creatine and myo-inositol that
have not been observed in the SIV macaque model previously. These results suggest that the divergent pathways of
N-acetylaspartate and creatine in this disease may enable the commonly reported ratio N-acetylaspartate/creatine to be a
more sensitive marker of disease severity. Copyright # 2008 John Wiley & Sons, Ltd.
KEYWORDS: human immunodeficiency virus (HIV); simian immunodeficiency virus (SIV); MRS; N-acetylaspartate;
creatine; encephalitis; frontal cortex; factor analysis
INTRODUCTION
Infection with human immunodeficiency virus (HIV) canoften lead to encephalitis and dementia induced by centralnervous system penetration by the virus and not as anopportunistic infection (1,2). Proposed mechanisms forthis injury include neurotoxic factors and inflammatorycytokines that can produce neuronal injury and gliosis (3).MRS has been used to investigate HIV-induced braindisease, which has documented metabolic changes in
to: R. G. Gonzalez, Neuroradiology Division, GRBtts General Hospital, 55 Fruit Street, Boston, MA.
[email protected]: NIH; contract/grant number: RR1321341 (RGG), NS34626 (RGG), RR000150 (SVW),), EB002026 (Massachusetts Institute of Technol-9 (New England Primate Research Center), and P41chusetts General Hospital).onsor: Mental Illness and Neuroscience Discovery.
sed: AIDS, acquired immunodeficiency syndrome;s of variance; Cho, choline-containing compounds;factor analysis; GABA, g-aminobutyric acid; Gln,glutamate; Gly, glycine; HIV, human immunodefi-I, myo-inositol; NAA, N-acetylaspartate; NAAG,lutamate; SIV, simian immunodeficiency virus;ed encephalitis; S, sum of all metabolites of interest.
8 John Wiley & Sons, Ltd.
patients at various stages of infection (4–7). Such studieshave commonly reported decreases in the neuronalmarker N-acetylaspartate (NAA) and increases inmyo-inositol (MI) and/or choline-containing compounds(Cho). These metabolites are often reported as ratios withrespect to total creatine (Cr), which is used as an internalstandard because stable energy metabolism is assumed.However, the belief that creatine is unvarying inneurodegenerative disease is debated, and changes inthis marker have been reported in neuroAIDS (8).
In the simian immunodeficiency virus (SIV) macaquemodel, NAA/Cr changes have been reported and have, insome instances, been found to be reversible at differentstages of SIV infection (9–12). However, significant Cho/Cr and MI/Cr changes have only been observed duringacute infection. Recently, we reported that NAA/Cr couldserve as a biomarker that indicates the severity ofencephalitis in SIV-infected macaques (13). We alsonoted changes in other neurotransmitter ratios, such asglutamate (Glu) and g-aminobutyric acid (GABA)relative to Cr, but these were found to have little bearingon the severity of encephalitis when analyzed individu-ally, even though both correlated very well with NAA.
Although MRS allows quantification of several brainmetabolites, it remains unclear how the various changes
NMR Biomed. 2008; 21: 878–887
CHANGES IN BRAIN METABOLISM WITH AIDS AND SIVE 879
in these markers relate to one another in the context ofHIV/SIV neuropathogenesis. Factor analysis (FA) is atool for uncovering relationships in a multivariate dataset.This statistical technique (of which principal componentsanalysis is the first step) summarizes the variance in thedata by generating linear combinations of variables,reducing the dimensionality down to a few orthogonalfactors, and thus eliminating ‘‘noise’’ caused by otherirrelevant variables measured. This has been particularlyhelpful in research that utilizes MRS, where theidentification of predominant metabolic profiles has beenpivotal to the field of metabonomics (14–17). As moremetabolites become quantifiable from in vivo spectra, FAcould be effective in reducing error from individual tests aswell as uncovering broader patterns in the metabolicprocesses underlying different stages in the pathogenesisof neuroAIDS. As yet, this method has seldom beenapplied to HIV MRS studies. AIDS-related leukoence-phalopathy has been compared with profiles of otherneurological diseases (18,19), and another study examinedpediatric cases of HIV-related encephalopathy (20).More recently, the technique has been applied to meta-bolite ratios of HIV-infected subjects across three otherbrain regions to distinguish between subjects with AIDSdementia complex and those who were asymptomatic(21), and a similar study has correlated MRS-derivedfactors with monocyte chemoattractant protein-1 (22).
Our study uses a multivariate factor analysis (FA)approach to examine distributions of metabolites from aMRS study of SIV-induced encephalitis (SIVE) in rhesusmacaques found to have terminal AIDS (13). The purposeof this analysis was to identify metabolite patternsassociated with SIV/AIDS and severity of virus-inducedencephalitis. By moving beyond analysis of individualmetabolites, this method may (i) improve our under-standing of howMRS markers of metabolic processes arerelated in this disease and (ii) help to resolve apparentinconsistencies in the literature that have arisen fromtraditional univariate methods involving ratios withrespect to Cr or H2O.
EXPERIMENTAL
This is a further analysis of data from a recent study on thepredictive power of NAA/Cr in SIVE (13). Detaileddescriptions of the animals in this study have beenpreviously reported (13). Briefly, 23 rhesus macaques(Macaca mulatta) were infected with SIV (SIVmac251 or239) and euthanized when moribund with AIDS. Theirbrains were classified as non-encephalitic (n¼ 6) orencephalitic (n¼ 17) on the basis of the presence ofmultinucleated giant cells (the hallmark of HIV/SIVencephalitis) in many regions of the brain, including thefrontal cortex. These encephalitic animals were furtherclassified as having mild (n¼ 6), moderate (n¼ 4), orsevere (n¼ 7) encephalitis on the basis of the quantity of
Copyright # 2008 John Wiley & Sons, Ltd.
multinucleated giant cells observed. Six non-infectedmacaques were sacrificed as controls. The age of theanimals ranged from 1.7 to 10.3 years. Previous resultsindicated no age effect between cohorts (13). Nineanimals were female and 20 were male. The study wasapproved by both Massachusetts General Hospital’sSubcommittee on Research Animal Care and theInstitutional Animal Care and Use Committee of HarvardUniversity.
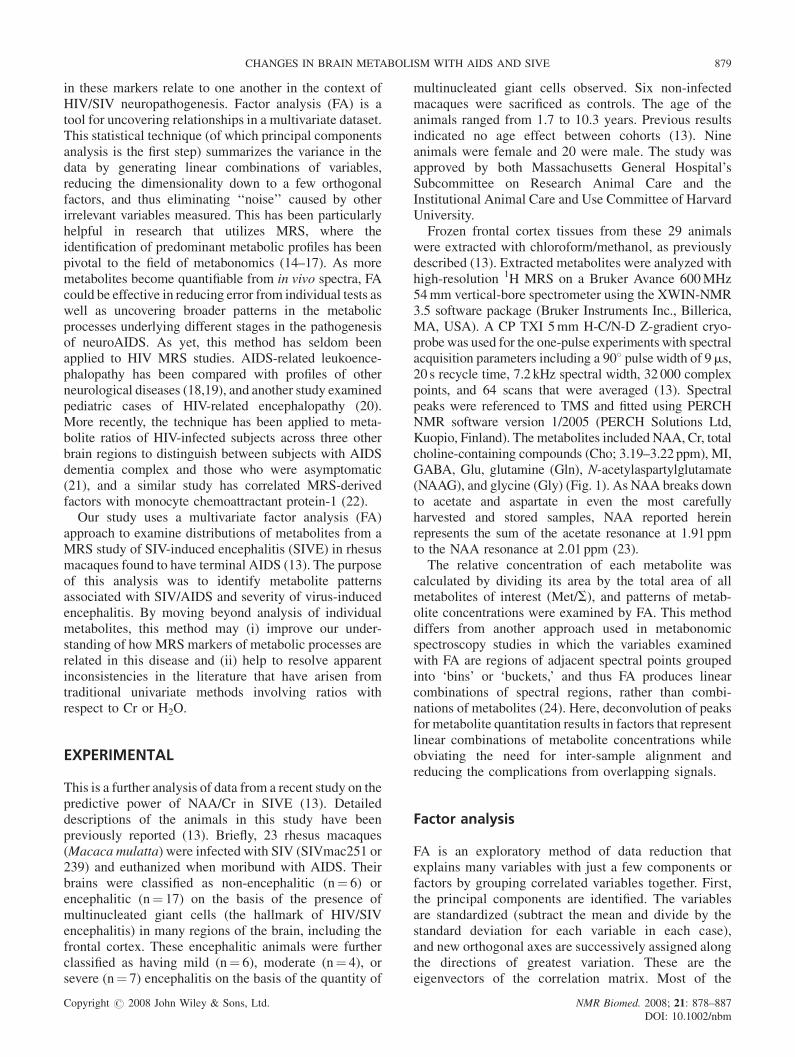
Frozen frontal cortex tissues from these 29 animalswere extracted with chloroform/methanol, as previouslydescribed (13). Extracted metabolites were analyzed withhigh-resolution 1H MRS on a Bruker Avance 600MHz54mm vertical-bore spectrometer using the XWIN-NMR3.5 software package (Bruker Instruments Inc., Billerica,MA, USA). A CP TXI 5mm H-C/N-D Z-gradient cryo-probewas used for the one-pulse experiments with spectralacquisition parameters including a 908 pulse width of 9ms,20 s recycle time, 7.2 kHz spectral width, 32 000 complexpoints, and 64 scans that were averaged (13). Spectralpeaks were referenced to TMS and fitted using PERCHNMR software version 1/2005 (PERCH Solutions Ltd,Kuopio, Finland). The metabolites included NAA, Cr, totalcholine-containing compounds (Cho; 3.19–3.22 ppm), MI,GABA, Glu, glutamine (Gln), N-acetylaspartylglutamate(NAAG), and glycine (Gly) (Fig. 1). As NAA breaks downto acetate and aspartate in even the most carefullyharvested and stored samples, NAA reported hereinrepresents the sum of the acetate resonance at 1.91 ppmto the NAA resonance at 2.01 ppm (23).
The relative concentration of each metabolite wascalculated by dividing its area by the total area of allmetabolites of interest (Met/S), and patterns of metab-olite concentrations were examined by FA. This methoddiffers from another approach used in metabonomicspectroscopy studies in which the variables examinedwith FA are regions of adjacent spectral points groupedinto ‘bins’ or ‘buckets,’ and thus FA produces linearcombinations of spectral regions, rather than combi-nations of metabolites (24). Here, deconvolution of peaksfor metabolite quantitation results in factors that representlinear combinations of metabolite concentrations whileobviating the need for inter-sample alignment andreducing the complications from overlapping signals.
Factor analysis
FA is an exploratory method of data reduction thatexplains many variables with just a few components orfactors by grouping correlated variables together. First,the principal components are identified. The variablesare standardized (subtract the mean and divide by thestandard deviation for each variable in each case),and new orthogonal axes are successively assigned alongthe directions of greatest variation. These are theeigenvectors of the correlation matrix. Most of the
NMR Biomed. 2008; 21: 878–887DOI: 10.1002/nbm
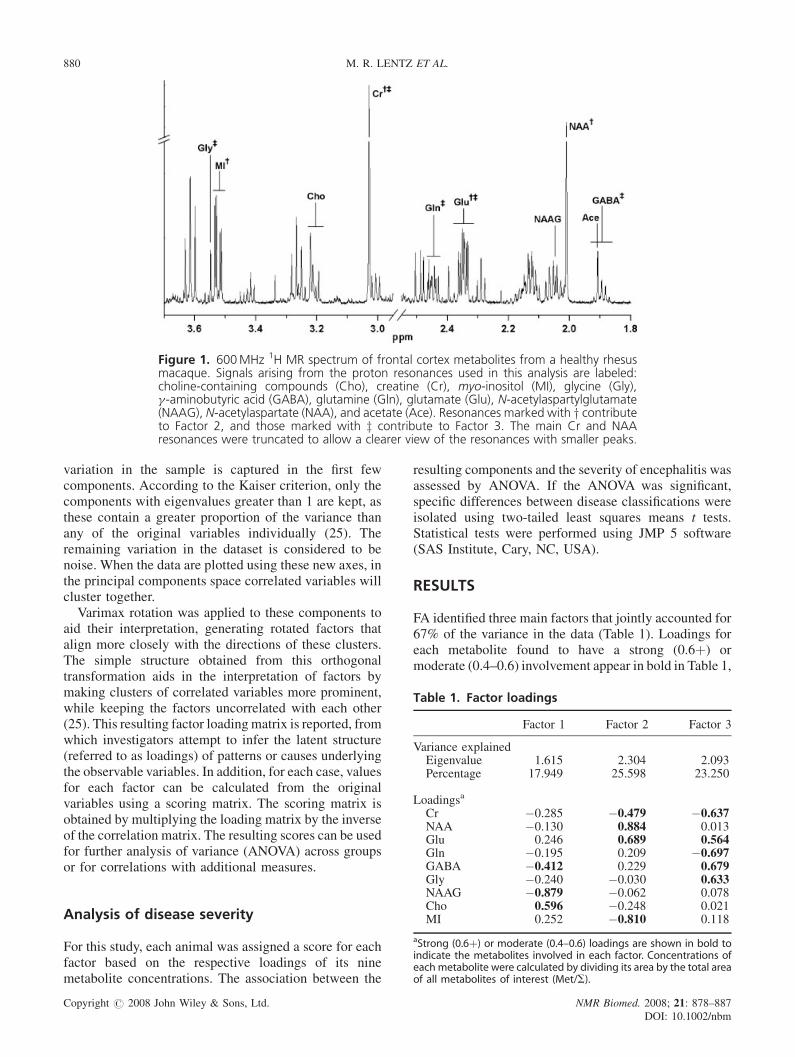
Figure 1. 600MHz 1H MR spectrum of frontal cortex metabolites from a healthy rhesusmacaque. Signals arising from the proton resonances used in this analysis are labeled:choline-containing compounds (Cho), creatine (Cr), myo-inositol (MI), glycine (Gly),g-aminobutyric acid (GABA), glutamine (Gln), glutamate (Glu), N-acetylaspartylglutamate(NAAG), N-acetylaspartate (NAA), and acetate (Ace). Resonances marked with y contributeto Factor 2, and those marked with z contribute to Factor 3. The main Cr and NAAresonances were truncated to allow a clearer view of the resonances with smaller peaks.
880 M. R. LENTZ ET AL.
Table 1. Factor loadings
Factor 1 Factor 2 Factor 3
Variance explainedEigenvalue 1.615 2.304 2.093Percentage 17.949 25.598 23.250
Loadingsa
Cr �0.285 �0.479 �0.637NAA �0.130 0.884 0.013Glu 0.246 0.689 0.564Gln �0.195 0.209 �0.697GABA �0.412 0.229 0.679
variation in the sample is captured in the first fewcomponents. According to the Kaiser criterion, only thecomponents with eigenvalues greater than 1 are kept, asthese contain a greater proportion of the variance thanany of the original variables individually (25). Theremaining variation in the dataset is considered to benoise. When the data are plotted using these new axes, inthe principal components space correlated variables willcluster together.Varimax rotation was applied to these components to
aid their interpretation, generating rotated factors thatalign more closely with the directions of these clusters.The simple structure obtained from this orthogonaltransformation aids in the interpretation of factors bymaking clusters of correlated variables more prominent,while keeping the factors uncorrelated with each other(25). This resulting factor loadingmatrix is reported, fromwhich investigators attempt to infer the latent structure(referred to as loadings) of patterns or causes underlyingthe observable variables. In addition, for each case, valuesfor each factor can be calculated from the originalvariables using a scoring matrix. The scoring matrix isobtained by multiplying the loading matrix by the inverseof the correlation matrix. The resulting scores can be usedfor further analysis of variance (ANOVA) across groupsor for correlations with additional measures.
Gly �0.240 �0.030 0.633NAAG �0.879 �0.062 0.078Cho 0.596 �0.248 0.021MI 0.252 �0.810 0.118
aStrong (0.6þ) or moderate (0.4–0.6) loadings are shown in bold toindicate the metabolites involved in each factor. Concentrations ofeach metabolite were calculated by dividing its area by the total areaof all metabolites of interest (Met/S).
Analysis of disease severity
For this study, each animal was assigned a score for eachfactor based on the respective loadings of its ninemetabolite concentrations. The association between the
Copyright # 2008 John Wiley & Sons, Ltd.
resulting components and the severity of encephalitis wasassessed by ANOVA. If the ANOVA was significant,specific differences between disease classifications wereisolated using two-tailed least squares means t tests.Statistical tests were performed using JMP 5 software(SAS Institute, Cary, NC, USA).
RESULTS
FA identified three main factors that jointly accounted for67% of the variance in the data (Table 1). Loadings foreach metabolite found to have a strong (0.6þ) ormoderate (0.4–0.6) involvement appear in bold in Table 1,
NMR Biomed. 2008; 21: 878–887DOI: 10.1002/nbm
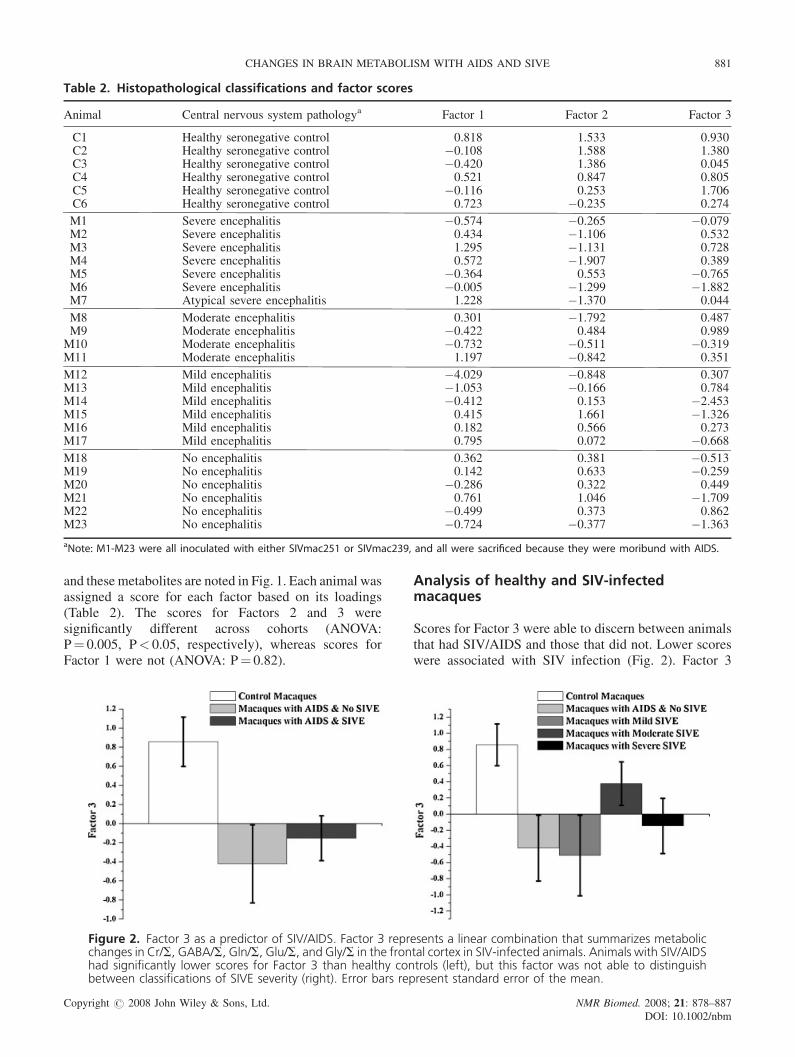
Table 2. Histopathological classifications and factor scores
Animal Central nervous system pathologya Factor 1 Factor 2 Facto
C1 Healthy seronegative control 0.818 1.533 0.9C2 Healthy seronegative control �0.108 1.588 1.3C3 Healthy seronegative control �0.420 1.386 0.0C4 Healthy seronegative control 0.521 0.847 0.8C5 Healthy seronegative control �0.116 0.253 1.7C6 Healthy seronegative control 0.723 �0.235 0.2
M1 Severe encephalitis �0.574 �0.265 �0.0M2 Severe encephalitis 0.434 �1.106 0.5M3 Severe encephalitis 1.295 �1.131 0.7M4 Severe encephalitis 0.572 �1.907 0.3M5 Severe encephalitis �0.364 0.553 �0.7M6 Severe encephalitis �0.005 �1.299 �1.8M7 Atypical severe encephalitis 1.228 �1.370 0.0
M8 Moderate encephalitis 0.301 �1.792 0.4M9 Moderate encephalitis �0.422 0.484 0.9M10 Moderate encephalitis �0.732 �0.511 �0.3M11 Moderate encephalitis 1.197 �0.842 0.3
M12 Mild encephalitis �4.029 �0.848 0.3M13 Mild encephalitis �1.053 �0.166 0.7M14 Mild encephalitis �0.412 0.153 �2.4M15 Mild encephalitis 0.415 1.661 �1.3M16 Mild encephalitis 0.182 0.566 0.2M17 Mild encephalitis 0.795 0.072 �0.6
M18 No encephalitis 0.362 0.381 �0.5M19 No encephalitis 0.142 0.633 �0.2M20 No encephalitis �0.286 0.322 0.4M21 No encephalitis 0.761 1.046 �1.7M22 No encephalitis �0.499 0.373 0.8M23 No encephalitis �0.724 �0.377 �1.3
aNote: M1-M23 were all inoculated with either SIVmac251 or SIVmac239, and all were sacrificed because they were moribund with AIDS
CHANGES IN BRAIN METABOLISM WITH AIDS AND SIVE 881
and these metabolites are noted in Fig. 1. Each animal wasassigned a score for each factor based on its loadings(Table 2). The scores for Factors 2 and 3 weresignificantly different across cohorts (ANOVA:P¼ 0.005, P< 0.05, respectively), whereas scores forFactor 1 were not (ANOVA: P¼ 0.82).
Figure 2. Factor 3 as a predictor of SIV/AIDS. Factor 3 represents a linear combination that summarizes metabolicchanges in Cr/S, GABA/S, Gln/S, Glu/S, and Gly/S in the frontal cortex in SIV-infected animals. Animals with SIV/AIDShad significantly lower scores for Factor 3 than healthy controls (left), but this factor was not able to distinguishbetween classifications of SIVE severity (right). Error bars represent standard error of the mean.
Copyright # 2008 John Wiley & Sons, Ltd. NMR Biomed. 2008; 21: 878–DOI: 10.1002/n
r 3
308045050674
79322889658244
87891951
078453267368
135949096263
.
Analysis of healthy and SIV-infectedmacaques
Scores for Factor 3 were able to discern between animalsthat had SIV/AIDS and those that did not. Lower scoreswere associated with SIV infection (Fig. 2). Factor 3
887
bm

882 M. R. LENTZ ET AL.
was able to distinguish control animals from infectedanimals with SIVE (P< 0.03), as well as from infectedanimals without encephalitis (P¼ 0.02). However, nodistinction between the two SIV-infected groups could befound using this factor (P¼ 0.55).
Analysis of encephalitis and SIVE severityamong macaques
Factor 2 was able to discriminate animals with SIVE fromuninfected controls (P¼ 0.002), and from animalsmoribund with AIDS without SIVE (P¼ 0.04) (Fig. 3,left). This factor was, however, unable to discern betweencontrol animals and infected animals that lack encepha-litis (P¼ 0.32). Further analysis indicated that Factor 2could distinguish between disease classifications(ANOVA: P< 0.002), with lower scores associated withencephalitis severity (Fig. 3, right). Factor 2 was able todifferentiate animals with severe encephalitis fromcontrol animals (P< 0.0003), as well as from thosefound moribund with AIDS but lacking signs ofencephalitis (P< 0.005). Factor 2 was also able todistinguish animals with moderate encephalitis fromcontrol animals (P¼ 0.004), as well as from animalsfound to be moribund with AIDS without encephalitis(P¼ 0.04). Factor 2 was significantly different betweenseverely and mildly encephalitic animals (P¼ 0.01), butwas not significantly different between moderately andmildly encephalitic animals (P< 0.08). Loadings fromFactor 2 represent a linear combination of changes in bothprimarily neuronal (NAA/S, Glu/S) and primarily glial(Cr/S, MI/S) metabolites during SIV infection. Graphicalrepresentations of the mean values of these fourmetabolites for each cohort are shown in order to clarify
Figure 3. Factor 2 as a predictor of encephalitis severity. Facmajor metabolic changes in both neuronal (NAA/S, Glu/S) awith SIVE had significantly lower scores for Factor 2 thandistinguish animals with moderate to severe encephalitis funinfected controls (right). Error bars represent standard err
Copyright # 2008 John Wiley & Sons, Ltd.
the ways in which these metabolites are changing (Fig. 4).This figure illustrates that the changes in Factor 2 arisefrom the decreases in NAA/S and Glu/S and increases inCr/S and MI/S that occur with disease severity.
DISCUSSION
Currently, there are many ways to evaluate MRS data,including ratios with respect to Cr (13,21), H2O (some-times referred to as ‘absolute concentrations’) (7,22), orthe total area of the spectrum (19,20), as well as the use ofdifferent statistical analyses. Various methods have beentried in human and macaque studies, which have resultedin some apparent contradictions. It is unclear whetherthese occasional inconsistencies are the result ofdifferences in measurement or data analysis. Here, wepresent FA as an alternative means of examiningspectroscopy data in HIV/SIV studies and have obtainedresults that shed new light on some inconsistenciesreported from traditional univariate methods involvingratios with respect to Cr or H2O.
Application of FA
FA seeks to find the latent structure of patterns underlyingthe observable variables. In psychological studies thatinvolve surveys, FA may be used to identify the opinionsand attitudes (unobservable factors) that generate theanswers given in a questionnaire (observable variables).In our study, we seek relationships (unobservable factors)between metabolites that can explain the changes inindividual metabolite concentrations (observable vari-ables). The loading matrix extracts the factors from the
tor 2 represents a linear combination that summarizednd glial (Cr/S, MI/S) cells during SIV infection. Animalsthose without encephalitis (left). Factor 2 was able torom animals with mild or no encephalitis as well asor of the mean.
NMR Biomed. 2008; 21: 878–887DOI: 10.1002/nbm
Figure 4. Ratio of metabolites/total spectrum. Mean values and standard error of the mean are presented to demonstrateindividual metabolites across classifications of encephalitis severity. Cr/S appears to be increased in all animals infected withSIV and moribund with AIDS. Glu/S shows the opposite trend. For the severest disease classifications, MI/S increases whileNAA/S decreases. Cho/S does not differ significantly across the cohorts. FA captures these effects in combination, and ismore powerful than traditional univariate analyses, as revealed by post hoc ANOVA (Cr/S: P¼0.07; NAA/S: P¼0.0006;Glu/S: P¼0.05; MI/S: P¼ 0.05; Cho/S: P¼ 0.29) uncorrected for multiple comparisons.
CHANGES IN BRAIN METABOLISM WITH AIDS AND SIVE 883
original variables. Just as the answers to a variety ofquestions may all stem from a few basic beliefs held by anindividual, so the changes in these metabolite concen-trations may derive from a few core mechanisms orphysiological responses. The scoring matrix gives thereverse conversion, combining observable variables tocreate values for the unobservable factors. In the exampleof a survey, an individual’s answers are used to generate ascore for his or her opinions. In our study, each animal’smetabolite concentrations are converted into a score forthese physiological responses. Assuming that the factorscause the variable changes, by convention it is the loadingmatrix that is used for interpretation (Table 1).
Various types of FA (including principal componentsanalysis) have been applied in studies of psychologi-cal and psychiatric assessment (26–30), in measures ofanimal behavior (31,32), in face recognition and data-processingmodels (33,34), in analyses of microarrays anddrug libraries (35,36), as well as in clinical investigationsand meta-analyses to define disease profiles using all theavailable variables (37–40). Exploratory FA can createcomposite measures for multidimensional phenomena,but the resultant structure pattern and its interpretationrequire confirmation from further studies. The validity ofthe factors may depend on the consistency and robustnessof the procedure used, especially in deciding the numberof components to retain (25). To keep the proceduresimple, in this study we have followed a standard methodof performing FA: identifying the principal components,
Copyright # 2008 John Wiley & Sons, Ltd.
retaining those that met the Kaiser criterion, and applyinga varimax rotation. Beyond this traditional procedure,there are other methods of FA which are discussed indetail in the literature. These include various criteria forselecting the number of components to retain, such as thescree test, broken stick rule, and parallel analysis, as wellas several different rotation methods (25).
FAwas performed on the dataset as a whole, producingfactors that describe the variance across all 29 animals,without consideration of grouping. Only afterwards werethe factors evaluated to see if they correspond todifferences between cohorts. As this type of analysis isbased on the correlation matrix between the originalvariables, at minimum it requires more cases thanvariables. However, most practitioners prefer 3–5 timesas many cases as variables for reliability. As weperformed FA on nine variables (metabolite measure-ments) using 29 cases (animals), this can be consideredadequate in terms of the general standard.
Implications of Factor 1
Factor 1 represents the contrast of Cho/S with GABA/Sand NAAG/S. It distinguishes animals with high Cho/S,low GABA/S, and low NAAG/S from animals with lowCho/S, high GABA/S, and high NAAG/S. Animals withmoderate values of Factor 1 may have high values of allthree, low values of all three, or moderate levels of all
NMR Biomed. 2008; 21: 878–887DOI: 10.1002/nbm
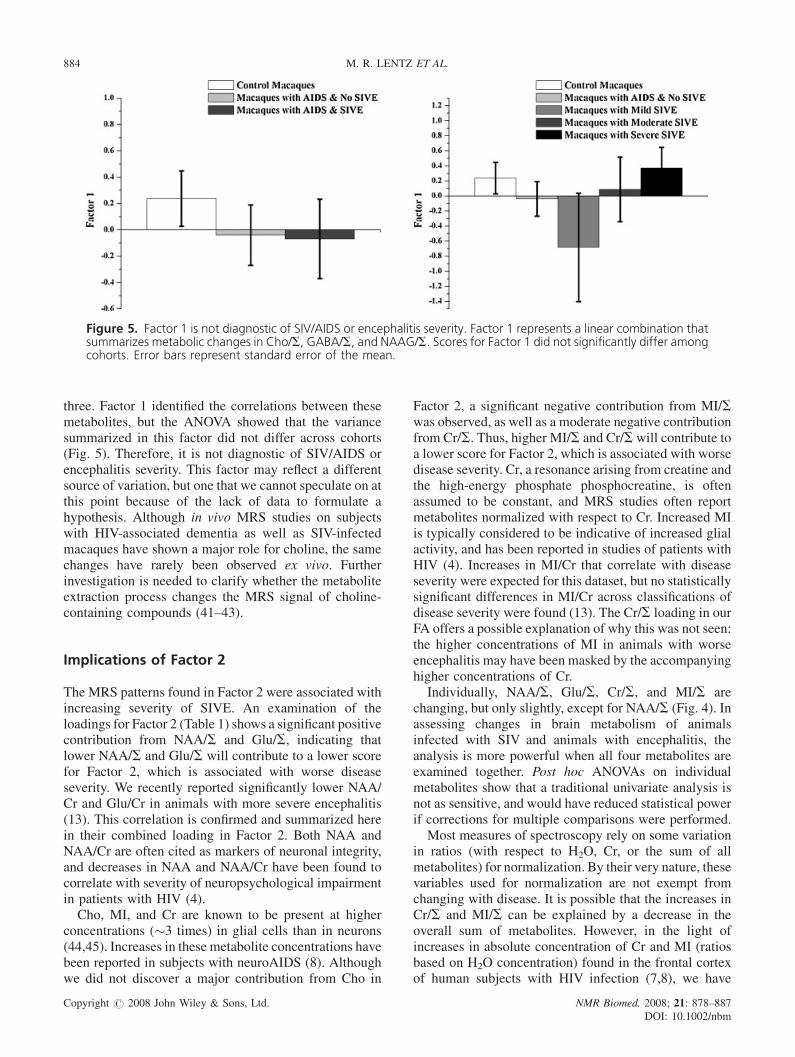
Figure 5. Factor 1 is not diagnostic of SIV/AIDS or encephalitis severity. Factor 1 represents a linear combination thatsummarizes metabolic changes in Cho/S, GABA/S, and NAAG/S. Scores for Factor 1 did not significantly differ amongcohorts. Error bars represent standard error of the mean.
884 M. R. LENTZ ET AL.
three. Factor 1 identified the correlations between thesemetabolites, but the ANOVA showed that the variancesummarized in this factor did not differ across cohorts(Fig. 5). Therefore, it is not diagnostic of SIV/AIDS orencephalitis severity. This factor may reflect a differentsource of variation, but one that we cannot speculate on atthis point because of the lack of data to formulate ahypothesis. Although in vivo MRS studies on subjectswith HIV-associated dementia as well as SIV-infectedmacaques have shown a major role for choline, the samechanges have rarely been observed ex vivo. Furtherinvestigation is needed to clarify whether the metaboliteextraction process changes the MRS signal of choline-containing compounds (41–43).
Implications of Factor 2
The MRS patterns found in Factor 2 were associated withincreasing severity of SIVE. An examination of theloadings for Factor 2 (Table 1) shows a significant positivecontribution from NAA/S and Glu/S, indicating thatlower NAA/S and Glu/S will contribute to a lower scorefor Factor 2, which is associated with worse diseaseseverity. We recently reported significantly lower NAA/Cr and Glu/Cr in animals with more severe encephalitis(13). This correlation is confirmed and summarized herein their combined loading in Factor 2. Both NAA andNAA/Cr are often cited as markers of neuronal integrity,and decreases in NAA and NAA/Cr have been found tocorrelate with severity of neuropsychological impairmentin patients with HIV (4).Cho, MI, and Cr are known to be present at higher
concentrations (�3 times) in glial cells than in neurons(44,45). Increases in these metabolite concentrations havebeen reported in subjects with neuroAIDS (8). Althoughwe did not discover a major contribution from Cho in
Copyright # 2008 John Wiley & Sons, Ltd. NMR Biomed. 2008; 21: 878–887DOI: 10.1002/nbm
Factor 2, a significant negative contribution from MI/Swas observed, as well as a moderate negative contributionfrom Cr/S. Thus, higher MI/S and Cr/S will contribute toa lower score for Factor 2, which is associated with worsedisease severity. Cr, a resonance arising from creatine andthe high-energy phosphate phosphocreatine, is oftenassumed to be constant, and MRS studies often reportmetabolites normalized with respect to Cr. Increased MIis typically considered to be indicative of increased glialactivity, and has been reported in studies of patients withHIV (4). Increases in MI/Cr that correlate with diseaseseverity were expected for this dataset, but no statisticallysignificant differences in MI/Cr across classifications ofdisease severity were found (13). The Cr/S loading in ourFA offers a possible explanation of why this was not seen:the higher concentrations of MI in animals with worseencephalitis may have been masked by the accompanyinghigher concentrations of Cr.
Individually, NAA/S, Glu/S, Cr/S, and MI/S arechanging, but only slightly, except for NAA/S (Fig. 4). Inassessing changes in brain metabolism of animalsinfected with SIV and animals with encephalitis, theanalysis is more powerful when all four metabolites areexamined together. Post hoc ANOVAs on individualmetabolites show that a traditional univariate analysis isnot as sensitive, and would have reduced statistical powerif corrections for multiple comparisons were performed.
Most measures of spectroscopy rely on some variationin ratios (with respect to H2O, Cr, or the sum of allmetabolites) for normalization. By their very nature, thesevariables used for normalization are not exempt fromchanging with disease. It is possible that the increases inCr/S and MI/S can be explained by a decrease in theoverall sum of metabolites. However, in the light ofincreases in absolute concentration of Cr and MI (ratiosbased on H2O concentration) found in the frontal cortexof human subjects with HIV infection (7,8), we have
CHANGES IN BRAIN METABOLISM WITH AIDS AND SIVE 885
interpreted these results on the basis of this precedent.The possibility of changes in Cr is often raised as a note ofcaution against the use of metabolite ratios in favor ofabsolute concentrations in MRS studies. Indeed, evenvariations across different anatomical regions must beconsidered. Although raised Cr concentrations have beenobserved in the frontal white and gray matter of patientswith HIV, decreases were found in the basal ganglia (8).However, the use of ratios with respect to Cr need not bediscarded altogether. We have previously reported thatNAA/Cr alone is sensitive in distinguishing betweenseverities of encephalitis (13). Our FA suggests that thecombination of lower NAA/S and higher Cr/S in thefrontal cortex in animals with more severe encephalitisactually allows NAA/Cr to be a more sensitive marker ofencephalitis. Therefore, although the quantification ofabsolute concentrations is important, the use of ratiossuch as NAA/Cr may still be beneficial in the examinationof human subjects.
Implications of Factor 3
Many in vivo MRS studies at 1.5 T have tried to quantifythe peaks lying between 2.0 and 2.8 ppm (sometimesreferred to as ‘Glx’) (8,19,22,46–50). Although Glu andGln are the largest contributors to this region, at lowerfield strengths Glx will also include resonances fromGABA, NAAG, aspartate, NAA, and succinate. Factor 3reflects changes occurring primarily in Glu/S, Gln/S,GABA/S, Gly/S, and Cr/S. Concentrations of thesemetabolites appear to differentiate between animals thathave SIV/AIDS and those that do not. Compared withcontrol animals, animals with AIDS exhibited a pattern ofhigher Cr/S and Gln/S, and lower Glu/S, GABA/S, andGly/S. The changes in Factor 3 show that in vivomeasurements of the Glx region must be carefullyconsidered. This region is very difficult to quantify in vivoat low field strengths, because of overlapping resonancesthat also extend into the base of the main NAA peak. Thedata suggest that potential variations in Glx couldinterfere with the accurate quantification of the NAAresonance at lower fields.
Taken together, these results suggest two distinctpatterns of injury in SIV/AIDS. The metabolic markers inFactor 3 indicate that a low level of neuronal injury isoccurring in all animals with SIV/AIDS whether or notmultinucleated giant cell formation is observed. Perhapsthe changes summarized in Factor 3 represent the damagecaused by the presence of long-lived cells that havealready established a viral reservoir in the brain at anearlier stage or a low-level steady-state influx ofactivated/infected monocytes (51–54). This steady insultwould contrast with the type represented by decreases inNAA, which has been reported to demonstrate not onlypermanent neuronal damage but also reversible injury(9,10,12). Patterns in Factor 2 – which correlate with
Copyright # 2008 John Wiley & Sons, Ltd.
encephalitis – may signify a more recent shift in viraldynamics. Possible explanations include the recrudes-cence or re-activation of infected long-lived cells (54),independent viral replication and evolution of existinggenetic variants in the central nervous system (55), and/ora higher rate of influx of activated/infected cells from theperiphery, especially among specific subsets of bloodmonocytes/macrophages (51). Such a shift in viralkinetics, immune-cell trafficking, and turnover wouldproduce more viral proteins and pro-inflammatory factorsas well as promote the formation of multinucleated giantcells.
In conclusion, the use of FA allowed the identificationof twometabolite patterns, one associated with SIV/AIDSand the other with severity of virus-induced encephalitis.These patterns would not have been observed usingtraditional analytical methods. This technique alsoallowed us to determine changes in metabolites thathad not been reported previously (MI/S and Cr/S) in thisSIV macaque model of neuroAIDS. Further work isneeded to clarify the immunological/virological basis ofthese metabolic patterns.
Acknowledgements
We thank Elizabeth Curran for pathology assistance, andacknowledge the contribution of tissues from Drs Desro-siers, Kaur, Lackner, Mansfield, Shannon, and Tzipori.
REFERENCES
1. Navia BA, Cho ES, Petito CK, Price RW. The AIDS dementiacomplex. II. Neuropathology. Ann. Neurol. 1986; 19: 525–535.
2. Price RW, Brew B, Sidtis J, Rosenblum M, Scheck AC, Cleary P.The brain in AIDS: central nervous system HIV-1 infection andAIDS dementia complex. Science 1988; 239: 586–592.
3. Kaul M, Zheng J, Okamoto S, Gendelman HE, Lipton SA. HIV-1infection and AIDS: consequences for the central nervous system.Cell. Death Differ. 2005; 12 Suppl 1: 878–892.
4. Avison MJ, Nath A, Berger JR. Understanding pathogenesis andtreatment of HIV dementia: a role for magnetic resonance? TrendsNeurosci. 2002; 25: 468–473.
5. Meyerhoff DJ, MacKay S, Bachman L, Poole N, Dillon WP,Weiner MW, Fein G. Reduced brain N-acetylaspartate suggestsneuronal loss in cognitively impaired human immunodeficiencyvirus-seropositive individuals: in vivo 1H magnetic resonancespectroscopic imaging. Neurology 1993; 43: 509–515.
6. Tracey I, Carr CA, Guimaraes AR, Worth JL, Navia BA, GonzalezRG. Brain choline-containing compounds are elevated in HIV-positive patients before the onset of AIDS dementia complex: Aproton magnetic resonance spectroscopic study. Neurology 1996;46: 783–788.
7. Chang L, Ernst T, Leonido-Yee M, Walot I, Singer E. Cerebralmetabolite abnormalities correlate with clinical severity of HIV-1cognitive motor complex. Neurology 1999; 52: 100–108.
8. Chang L, Ernst T, Witt MD, Ames N, Gaiefsky M, Miller E.Relationships among brain metabolites, cognitive function, andviral loads in antiretroviral-naive HIV patients. Neuroimage 2002;17: 1638–1648.
9. Greco JB,Westmoreland SV, Ratai EM, Lentz MR, Sakaie K, He J,Sehgal PK,Masliah E, Lackner AA, Gonzalez RG. In vivo 1HMRSof brain injury and repair during acute SIV infection in the
NMR Biomed. 2008; 21: 878–887DOI: 10.1002/nbm
886 M. R. LENTZ ET AL.
macaque model of neuroAIDS. Magn. Reson. Med. 2004; 51:1108–1114.
10. Lentz MR, Kim JP, Westmoreland SV, Greco JB, Fuller RA, RataiEM, He J, Sehgal PK, Halpern EF, Lackner AA, Masliah E,Gonzalez RG. Quantitative neuropathologic correlates of changesin ratio of N-acetylaspartate to creatine in macaque brain. Radi-ology 2005; 235: 461–468.
11. Kim JP, Lentz MR, Westmoreland SV, Greco JB, Ratai EM,Halpern E, Lackner AA, Masliah E, Gonzalez RG. Relationshipsbetween astrogliosis and 1H MR spectroscopic measures of braincholine/creatine and myo-inositol/creatine in a primate model.AJNR Am. J. Neuroradiol. 2005; 26: 752–759.
12. Williams K,Westmoreland S, Greco J, Ratai E, LentzM, KimWK,Fuller RA, Kim JP, Autissier P, Sehgal PK, Schinazi RF, Bischof-berger N, Piatak M, Lifson JD, Masliah E, Gonzalez RG. Magneticresonance spectroscopy reveals that activated monocytes contrib-ute to neuronal injury in SIV neuroAIDS. J. Clin. Invest. 2005;115: 2534–2545.
13. Lentz MR, Westmoreland SV, Lee V, Ratai EM, Halpern EF,Gonzalez RG. Metabolic markers of neuronal injury correlatewith SIV CNS disease severity and inoculum in the macaquemodel of neuroAIDS. Magn Reson Med. 2008; 59: 475–484.
14. Jordan KW, Cheng LL. NMR-based metabolomics approach totarget biomarkers for human prostate cancer. Expert Rev. Proteo-mics 2007; 4: 389–400.
15. Lindon JC, Holmes E, Nicholson JK. Metabonomics techniquesand applications to pharmaceutical research & development.Pharm. Res. 2006; 23: 1075–1088.
16. Gibbs A. Comparison of the specificity and sensitivity oftraditional methods for assessment of nephrotoxicity in the ratwith metabonomic and proteomic methodologies. J. Appl. Toxicol.2005; 25: 277–295.
17. Griffin JL.Metabolic profiles to define the genome: can we hear thephenotypes? Philos. Trans. R. Soc. Lond. B. Biol. Sci. 2004; 359:857–871.
18. Confort-Gouny S, Vion-Dury J, Nicoli F, Dano P, Gastaut JL,Cozzone PJ. Metabolic characterization of neurological diseasesby proton localized NMR spectroscopy of the human brain. C.R.Acad. Sci. III 1992; 315: 287–293.
19. Confort-Gouny S, Vion-Dury J, Nicoli F, Dano P, Donnet A,Grazziani N, Gastaut JL, Grisoli F, Cozzone PJ. A multiparametricdata analysis showing the potential of localized proton MR spec-troscopy of the brain in the metabolic characterization of neuro-logical diseases. J. Neurol. Sci. 1993; 118: 123–133.
20. Salvan AM, Lamoureux S, Michel G, Confort-Gouny S, CozzonePJ, Vion-Dury J. Localized proton magnetic resonance spec-troscopy of the brain in children infected with human immuno-deficiency virus with and without encephalopathy. Pediatr. Res.1998; 44: 755–762.
21. Yiannoutsos CT, Ernst T, Chang L, Lee PL, Richards T, Marra CM,Meyerhoff DJ, Jarvik JG, Kolson D, Schifitto G, Ellis RJ, Swin-dells S, Simpson DM, Miller EN, Gonzalez RG, Navia BA.Regional patterns of brain metabolites in AIDS dementia complex.Neuroimage 2004; 23: 928–935.
22. Chang L, Ernst T, St Hillaire C, Conant K. Antiretroviral treatmentalters relationship between MCP-1 and neurometabolites in HIVpatients. Antivir. Ther. 2004; 9: 431–440.
23. Cheng LL, Ma MJ, Becerra L, Ptak T, Tracey I, Lackner A,Gonzalez RG. Quantitative neuropathology by high resolutionmagic angle spinning proton magnetic resonance spectroscopy.Proc. Natl. Acad. Sci. U.S.A. 1997; 94: 6408–6413.
24. Weljie AM, Newton J, Mercier P, Carlson E, Slupsky CM. Targetedprofiling: quantitative analysis of 1H NMR metabolomics data.Anal. Chem. 2006; 78: 4430–4442.
25. Coste J, Bouee S, Ecosse E, Leplege A, Pouchot J. Methodologicalissues in determining the dimensionality of composite healthmeasures using principal component analysis: case illustrationand suggestions for practice. Qual Life Res. 2005; 14: 641–654.
26. Haley RW, Kurt TL, Hom J. Is there a Gulf War Syndrome?Searching for syndromes by factor analysis of symptoms. JAMA1997; 277: 215–222.
27. Baer L. Factor analysis of symptom subtypes of obsessive com-pulsive disorder and their relation to personality and tic disorders.J Clin Psychiatry 1994; 55 Suppl: 18–23.
Copyright # 2008 John Wiley & Sons, Ltd.
28. Brown TA, Cash TF, Mikulka PJ. Attitudinal body-image assess-ment: factor analysis of the Body-Self Relations Questionnaire.J Pers Assess. 1990; 55: 135–144.
29. Hudziak JJ, Heath AC, Madden PF, ReichW, Bucholz KK, SlutskeW, Bierut LJ, Neuman RJ, Todd RD. Latent class and factoranalysis of DSM-IV ADHD: a twin study of female adolescents.J Am Acad Child Adolesc Psychiatry 1998; 37: 848–857.
30. Cassidy F, Forest K, Murry E, Carroll BJ. A factor analysis of thesigns and symptoms of mania. Arch Gen Psychiatry 1998; 55:27–32.
31. Rodgers RJ, Johnson NJ. Factor analysis of spatiotemporal andethological measures in the murine elevated plus-maze test ofanxiety. Pharmacol Biochem Behav. 1995; 52: 297–303.
32. Natoli E, Say L, Cafazzo S, Bonanni R, SchmidM, Pontier D. Boldattitude makes male urban feral domestic cats more vulnerable tofeline immunodeficiency virus. Neurosci Biobehav Rev. 2005; 29:151–157.
33. Calder AJ, Young AW. Understanding the recognition of facialidentity and facial expression. Nat Rev Neurosci. 2005; 6:641–651.
34. Fiori S. Nonlinear complex-valued extensions of Hebbian learn-ing: an essay. Neural Comput. 2005; 17: 779–838.
35. Dennis JL, Oien KA. Hunting the primary: novel strategiesfor defining the origin of tumours. J Pathol. 2005; 205: 236–247.
36. Lloyd DG, Golfis G, Knox AJ, Fayne D, Meegan MJ, Oprea TI.Oncology exploration: charting cancer medicinal chemistry space.Drug Discov Today 2006; 11: 149–159.
37. Hanley AJ, Karter AJ, Festa A, D’Agostino R Jr, WagenknechtLE, Savage P, Tracy RP, Saad MF, Haffner S. Factor analysis ofmetabolic syndrome using directly measured insulin sensitivity:The Insulin Resistance Atherosclerosis Study. Diabetes 2002; 51:2642–2647.
38. Wegner RE, Jorres RA, Kirsten DK, Magnussen H. Factor analysisof exercise capacity, dyspnoea ratings and lung function in patientswith severe COPD. Eur Respir J. 1994; 7: 725–729.
39. Rosi E, Ronchi MC, Grazzini M, Duranti R, Scano G. Sputumanalysis, bronchial hyperresponsiveness, and airway function inasthma: results of a factor analysis. J Allergy Clin Immunol. 1999;103: 232–237.
40. Ford ES, Li C. Defining the metabolic syndrome in children andadolescents: will the real definition please stand up? J Pediatr.2008; 152: 160–164.
41. Ratai EM, Pilkenton S, Lentz MR, Greco JB, Fuller RA, Kim JP,He J, Cheng LL, Gonzalez RG. Comparisons of brain metabolitesobserved by HRMAS 1H NMR of intact tissue and solution1H NMR of tissue extracts in SIV-infected macaques. NMRBiomed. 2005; 18: 242–251.
42. Lehnhardt FG, Rohn G, Ernestus RI, Grune M, Hoehn M. 1H- and(31)P-MR spectroscopy of primary and recurrent human braintumors in vitro: malignancy-characteristic profiles of water solubleand lipophilic spectral components. NMR Biomed. 2001; 14:307–317.
43. Usenius JP, Vainio P, Hernesniemi J, Kauppinen RA. Choline-containing compounds in human astrocytomas studied by 1H NMRspectroscopy in vivo and in vitro. J Neurochem. 1994; 63:1538–1543.
44. Brand A, Richter-Landsberg C, Leibfritz D. Multinuclear NMRstudies on the energy metabolism of glial and neuronal cells. Dev.Neurosci. 1993; 15: 289–298.
45. Urenjak J, Williams SR, Gadian DG, Noble M. Proton nuclearmagnetic resonance spectroscopy unambiguously identifies differ-ent neural cell types. J. Neurosci. 1993; 13: 981–989.
46. Keller MA, Venkatraman TN, Thomas A, Deveikis A, LoPresti C,Hayes J, Berman N, Walot I, Padilla S, Johnston-Jones J, Ernst T,Chang L. Altered neurometabolite development in HIV-infectedchildren: correlation with neuropsychological tests. Neurology2004; 62: 1810–1817.
47. Marcus CD, Taylor-Robinson SD, Sargentoni J, Ainsworth JG,Frize G, Easterbrook PJ, Shaunak S, Bryant DJ. 1H MR spec-troscopy of the brain in HIV-1-seropositive subjects: evidence fordiffuse metabolic abnormalities. Metab. Brain Dis. 1998; 13:123–136.
48. Chang L, Ernst T, Tornatore C, Aronow H, Melchor R, Walot I,Singer E, Cornford M. Metabolite abnormalities in progressive
NMR Biomed. 2008; 21: 878–887DOI: 10.1002/nbm
CHANGES IN BRAIN METABOLISM WITH AIDS AND SIVE 887
multifocal leukoencephalopathy by proton magnetic resonancespectroscopy. Neurology 1997; 48: 836–845.
49. Jarvik JG, Lenkinski RE, Saykin AJ, Jaans A, Frank I. Protonspectroscopy in asymptomatic HIV-infected adults: initial resultsin a prospective cohort study. J. Acquir. Immune Defic. Syndr. Hum.Retrovirol. 1996; 13: 247–253.
50. Jarvik JG, Lenkinski RE, Grossman RI, Gomori JM, Schnall MD,Frank I. Proton MR spectroscopy of HIV-infected patients: charac-terization of abnormalities with imaging and clinical correlation.Radiology 1993; 186: 739–744.
51. KimWK, Corey S, Alvarez X,Williams K.Monocyte/macrophagetraffic in HIV and SIV encephalitis. J. Leukoc. Biol. 2003; 74:650–656.
52. Perelson AS, Essunger P, Cao Y, Vesanen M, Hurley A, Saksela K,Markowitz M, Ho DD. Decay characteristics of HIV-1-infected
Copyright # 2008 John Wiley & Sons, Ltd.
compartments during combination therapy. Nature 1997; 387:188–191.
53. Belmonte L, Bare P, de Bracco MM, Ruibal-Ares BH. Reservoirsof HIV replication after successful combined antiretroviral treat-ment. Curr. Med. Chem. 2003; 10: 303–312.
54. Clements JE, Babas T, Mankowski JL, Suryanarayana K,Piatak M Jr., Tarwater PM, Lifson JD, Zink MC. The centralnervous system as a reservoir for simian immunodeficiency virus(SIV): steady-state levels of SIV DNA in brain from acutethrough asymptomatic infection. J. Infect. Dis. 2002; 186:905–913.
55. Harrington PR, Connell MJ, Meeker RB, Johnson PR, SwanstromR. Dynamics of simian immunodeficiency virus populations inblood and cerebrospinal fluid over the full course of infection.J. Infect. Dis. 2007; 196: 1058–1067.
NMR Biomed. 2008; 21: 878–887DOI: 10.1002/nbm


![Paulina black macaques [recovered]](https://static.fdocuments.in/doc/165x107/5559dee9d8b42a39498b4992/paulina-black-macaques-recovered.jpg)