FACTBOOK - hagiwara.co.jp Liaison Office ... Super Capacitor (b) Connectors Photos provided by: (a)...
14
FACTBOOK 7467/TSE 1 st Section, NSE 1 st Section HAGIWARA ELECTRIC CO., LTD. For the six months of the fiscal year ending on March 31, 2017 Contents Corporate Profile 1-4 Consolidated Balance Sheet 5 Consolidated Statement of Income/ Information by Segment 6 Consolidated Statement of Cash Flows 7 Consolidated Profitability Indicators 8 Consolidated Profitability/Efficiency Indicators 9 Consolidated Efficiency/Stability Indicators 10 Stock Information 11-12
Transcript of FACTBOOK - hagiwara.co.jp Liaison Office ... Super Capacitor (b) Connectors Photos provided by: (a)...
FACTBOOK7467/TSE 1st Section, NSE 1st Section
HAGIWARA ELECTRIC CO., LTD. For the six months of the fiscal year
ending on March 31, 2017
Contents
Corporate Profile 1-4
Consolidated Balance Sheet 5
Consolidated Statement of Income/Information by Segment
6
Consolidated Statement of Cash Flows 7
Consolidated Profitability Indicators 8
Consolidated Profitability/Efficiency Indicators 9
Consolidated Efficiency/Stability Indicators 10
Stock Information 11-12
Copyright (c) HAGIWARA ELECTRIC CO., LTD. All Rights Reserved. 1
Corporate Profile
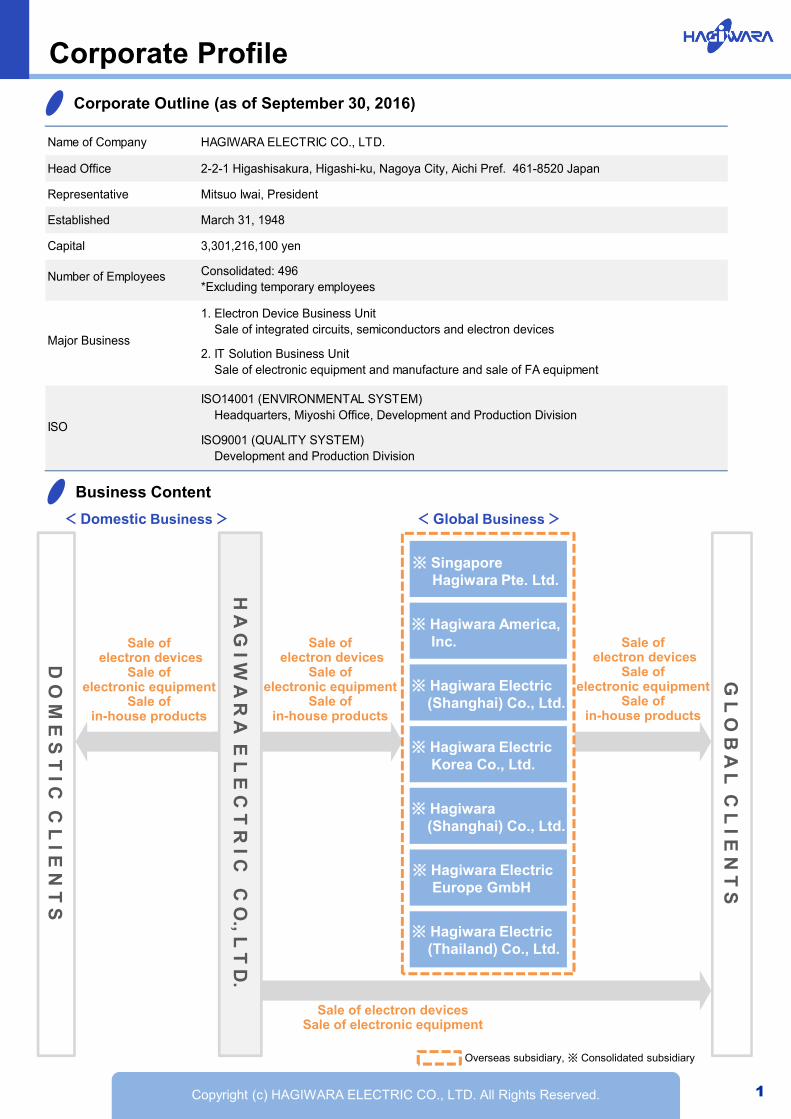
Corporate Outline (as of September 30, 2016)
Business Content
< Domestic Business >
Sale of electron devices
Sale of electronic equipment
Sale of in-house products
Sale of electron devices
Sale of electronic equipment
Sale of in-house products
< Global Business >
Sale of electron devices
Sale of electronic equipment
Sale of in-house products
H A
G I W
A R
A E
L E
C T
R I C
C O
., L T
D.
Overseas subsidiary, ※ Consolidated subsidiary
D O
M E
S T
I C C
L I E
N T
S
G L
O B
A L
C L
I E N
T S
※ Hagiwara ElectricEurope GmbH
※ Hagiwara Electric Korea Co., Ltd.
※ Hagiwara Electric(Shanghai) Co., Ltd.
※ Singapore Hagiwara Pte. Ltd.
※ Hagiwara America,Inc.
※ Hagiwara (Shanghai) Co., Ltd.
※ Hagiwara Electric (Thailand) Co., Ltd.
Sale of electron devicesSale of electronic equipment
Name of Company HAGIWARA ELECTRIC CO., LTD.
Head Office 2-2-1 Higashisakura, Higashi-ku, Nagoya City, Aichi Pref. 461-8520 Japan
Representative Mitsuo Iwai, President
Established March 31, 1948
Capital 3,301,216,100 yen
Number of Employees
1. Electron Device Business Unit Sale of integrated circuits, semiconductors and electron devices
ISO14001 (ENVIRONMENTAL SYSTEM) Headquarters, Miyoshi Office, Development and Production Division
ISOISO9001 (QUALITY SYSTEM) Development and Production Division
Consolidated: 496*Excluding temporary employees
Major Business2. IT Solution Business Unit Sale of electronic equipment and manufacture and sale of FA equipment
Copyright (c) HAGIWARA ELECTRIC CO., LTD. All Rights Reserved.
Aichi Pref.
Kyushu Office
Tokyo Branch Office
Nisshin Office
Headquarters and North Office
Aichi Pref.Miyoshi Office
JapanOverseas
Hagiwara Electric Europe GmbH
Hagiwara Electric (Shanghai) Co., Ltd.Hagiwara (Shanghai) Co., Ltd.
India Liaison Office (Singapore Hagiwara Pte. Ltd.)
Hagiwara Electric Korea Co., Ltd.
Hagiwara America, Inc.
Singapore Hagiwara Pte. Ltd.
Hagiwara Electric (Thailand) Co., Ltd.Kansai Branch Office
The US local subsidiary was established.The China (Shanghai) local subsidiary was established.
The Germany local subsidiary was established.The Data Center was opened.
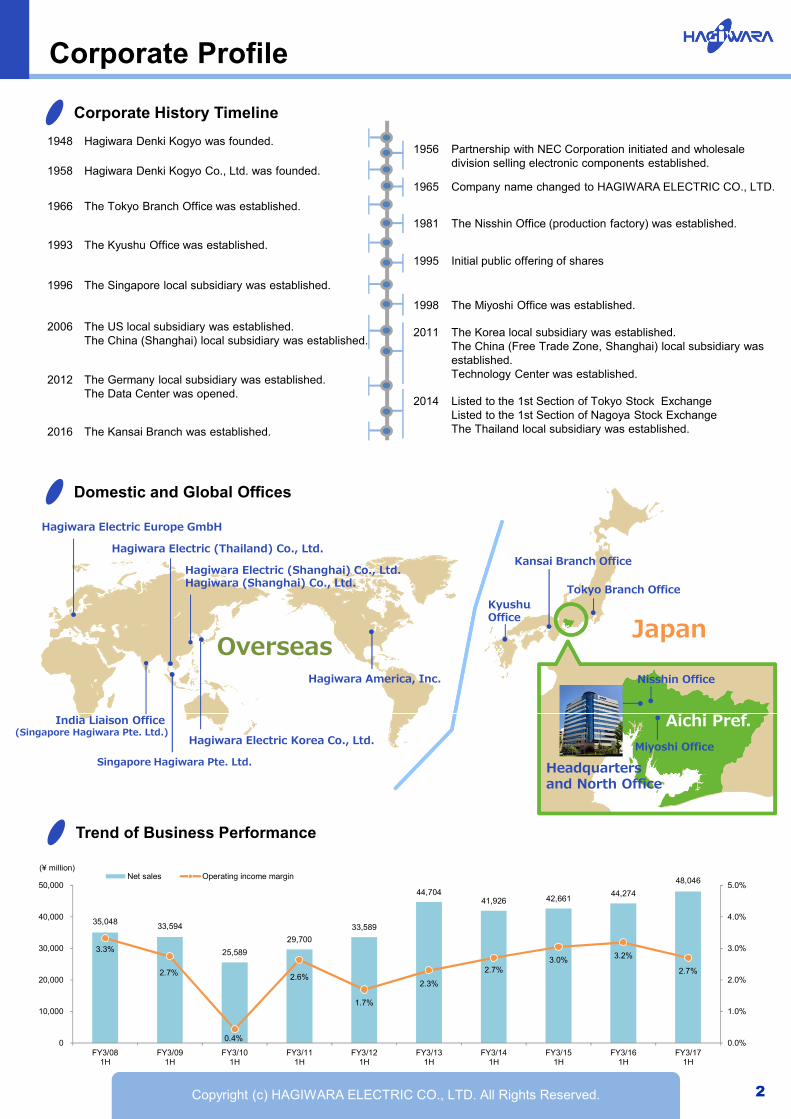
1948 Hagiwara Denki Kogyo was founded.
1958 Hagiwara Denki Kogyo Co., Ltd. was founded.
1966 The Tokyo Branch Office was established.
1993 The Kyushu Office was established.
1996 The Singapore local subsidiary was established.
2006
2012
1956 Partnership with NEC Corporation initiated and wholesale division selling electronic components established.
1965 Company name changed to HAGIWARA ELECTRIC CO., LTD.
1981 The Nisshin Office (production factory) was established.
1995 Initial public offering of shares
1998 The Miyoshi Office was established.
2011 The Korea local subsidiary was established.The China (Free Trade Zone, Shanghai) local subsidiary was established.Technology Center was established.
2014 Listed to the 1st Section of Tokyo Stock ExchangeListed to the 1st Section of Nagoya Stock ExchangeThe Thailand local subsidiary was established.2016 The Kansai Branch was established.
2
Corporate Profile
Corporate History Timeline
Domestic and Global Offices
Trend of Business Performance
35,048 33,594
25,589
29,700
33,589
44,704 41,926 42,661
44,274
48,046
3.3%
2.7%
0.4%
2.6%
1.7%
2.3%
2.7%3.0% 3.2%
2.7%
0.0%
1.0%
2.0%
3.0%
4.0%
5.0%
0
10,000
20,000
30,000
40,000
50,000
FY3/081H
FY3/091H
FY3/101H
FY3/111H
FY3/121H
FY3/131H
FY3/141H
FY3/151H
FY3/161H
FY3/171H
Net sales Operating income margin(¥ million)
Copyright (c) HAGIWARA ELECTRIC CO., LTD. All Rights Reserved. 3
Corporate Profile
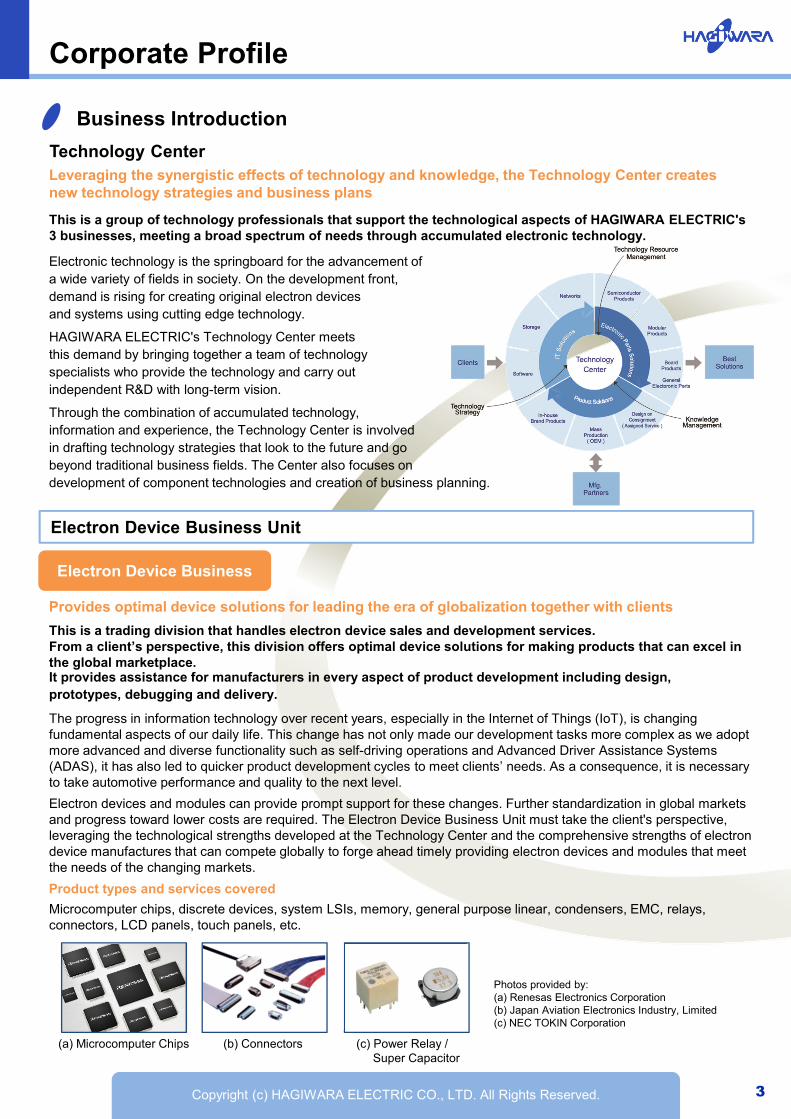
Technology CenterLeveraging the synergistic effects of technology and knowledge, the Technology Center creates new technology strategies and business plans
This is a group of technology professionals that support the technological aspects of HAGIWARA ELECTRIC's 3 businesses, meeting a broad spectrum of needs through accumulated electronic technology.
Electronic technology is the springboard for the advancement of a wide variety of fields in society. On the development front, demand is rising for creating original electron devices and systems using cutting edge technology.
HAGIWARA ELECTRIC's Technology Center meets this demand by bringing together a team of technology specialists who provide the technology and carry out independent R&D with long-term vision.
Through the combination of accumulated technology, information and experience, the Technology Center is involved in drafting technology strategies that look to the future and go beyond traditional business fields. The Center also focuses on development of component technologies and creation of business planning.
Electron Device Business Unit
Electron Device Business
Provides optimal device solutions for leading the era of globalization together with clients
This is a trading division that handles electron device sales and development services. From a client’s perspective, this division offers optimal device solutions for making products that can excel in the global marketplace.It provides assistance for manufacturers in every aspect of product development including design, prototypes, debugging and delivery.
The progress in information technology over recent years, especially in the Internet of Things (IoT), is changing fundamental aspects of our daily life. This change has not only made our development tasks more complex as we adopt more advanced and diverse functionality such as self-driving operations and Advanced Driver Assistance Systems (ADAS), it has also led to quicker product development cycles to meet clients’ needs. As a consequence, it is necessary to take automotive performance and quality to the next level.
Electron devices and modules can provide prompt support for these changes. Further standardization in global markets and progress toward lower costs are required. The Electron Device Business Unit must take the client's perspective, leveraging the technological strengths developed at the Technology Center and the comprehensive strengths of electron device manufactures that can compete globally to forge ahead timely providing electron devices and modules that meet the needs of the changing markets.
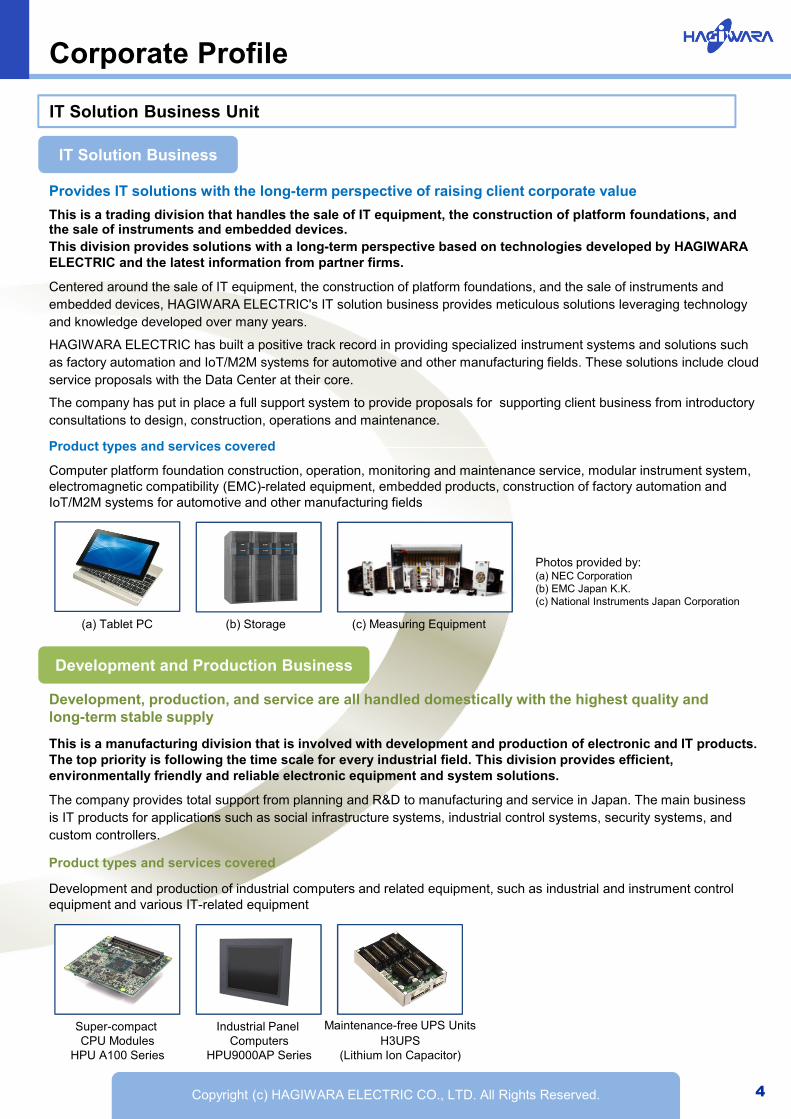
Product types and services covered
Microcomputer chips, discrete devices, system LSIs, memory, general purpose linear, condensers, EMC, relays, connectors, LCD panels, touch panels, etc.
(a) Microcomputer Chips (c) Power Relay / Super Capacitor
(b) Connectors
Photos provided by:(a) Renesas Electronics Corporation(b) Japan Aviation Electronics Industry, Limited(c) NEC TOKIN Corporation
Business Introduction
Copyright (c) HAGIWARA ELECTRIC CO., LTD. All Rights Reserved. 4
Corporate Profile
IT Solution Business Unit
IT Solution Business
Provides IT solutions with the long-term perspective of raising client corporate value
This is a trading division that handles the sale of IT equipment, the construction of platform foundations, and the sale of instruments and embedded devices.This division provides solutions with a long-term perspective based on technologies developed by HAGIWARA ELECTRIC and the latest information from partner firms.
Centered around the sale of IT equipment, the construction of platform foundations, and the sale of instruments and embedded devices, HAGIWARA ELECTRIC's IT solution business provides meticulous solutions leveraging technology and knowledge developed over many years.
HAGIWARA ELECTRIC has built a positive track record in providing specialized instrument systems and solutions such as factory automation and IoT/M2M systems for automotive and other manufacturing fields. These solutions include cloud service proposals with the Data Center at their core.
The company has put in place a full support system to provide proposals for supporting client business from introductory consultations to design, construction, operations and maintenance.
Product types and services covered
Computer platform foundation construction, operation, monitoring and maintenance service, modular instrument system, electromagnetic compatibility (EMC)-related equipment, embedded products, construction of factory automation and IoT/M2M systems for automotive and other manufacturing fields
Development and Production Business
Development, production, and service are all handled domestically with the highest quality and long-term stable supply
This is a manufacturing division that is involved with development and production of electronic and IT products. The top priority is following the time scale for every industrial field. This division provides efficient, environmentally friendly and reliable electronic equipment and system solutions.
The company provides total support from planning and R&D to manufacturing and service in Japan. The main business is IT products for applications such as social infrastructure systems, industrial control systems, security systems, and custom controllers.
Product types and services covered
Development and production of industrial computers and related equipment, such as industrial and instrument control equipment and various IT-related equipment
Super-compact CPU Modules
HPU A100 Series
Industrial Panel Computers
HPU9000AP Series
Maintenance-free UPS UnitsH3UPS
(Lithium Ion Capacitor)
(a) Tablet PC (b) Storage (c) Measuring Equipment
Photos provided by:(a) NEC Corporation(b) EMC Japan K.K.(c) National Instruments Japan Corporation
Copyright (c) HAGIWARA ELECTRIC CO., LTD. All Rights Reserved. 5
Consolidated Balance Sheet
(¥ million) FY3/131H End
FY3/141H End
FY3/151H End
FY3/161H End
FY3/171H End
Assets
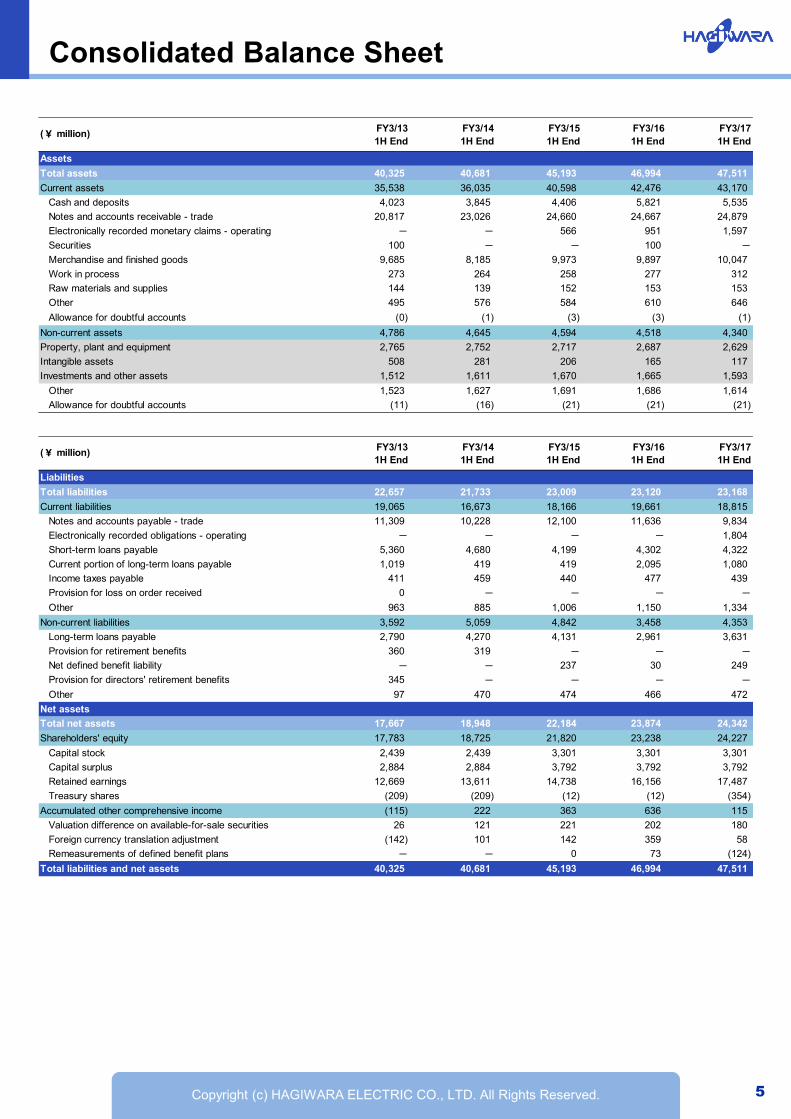
Total assets 40,325 40,681 45,193 46,994 47,511
Current assets 35,538 36,035 40,598 42,476 43,170
Cash and deposits 4,023 3,845 4,406 5,821 5,535
Notes and accounts receivable - trade 20,817 23,026 24,660 24,667 24,879
Electronically recorded monetary claims - operating - - 566 951 1,597
Securities 100 - - 100 -
Merchandise and finished goods 9,685 8,185 9,973 9,897 10,047
Work in process 273 264 258 277 312
Raw materials and supplies 144 139 152 153 153
Other 495 576 584 610 646
Allowance for doubtful accounts (0) (1) (3) (3) (1)
Non-current assets 4,786 4,645 4,594 4,518 4,340
Property, plant and equipment 2,765 2,752 2,717 2,687 2,629
Intangible assets 508 281 206 165 117
Investments and other assets 1,512 1,611 1,670 1,665 1,593
Other 1,523 1,627 1,691 1,686 1,614
Allowance for doubtful accounts (11) (16) (21) (21) (21)
(¥ million) FY3/131H End
FY3/141H End
FY3/151H End
FY3/161H End
FY3/171H End
Liabilities
Total liabilities 22,657 21,733 23,009 23,120 23,168
Current liabilities 19,065 16,673 18,166 19,661 18,815
Notes and accounts payable - trade 11,309 10,228 12,100 11,636 9,834
Electronically recorded obligations - operating - - - - 1,804
Short-term loans payable 5,360 4,680 4,199 4,302 4,322
Current portion of long-term loans payable 1,019 419 419 2,095 1,080
Income taxes payable 411 459 440 477 439
Provision for loss on order received 0 - - - -
Other 963 885 1,006 1,150 1,334
Non-current liabilities 3,592 5,059 4,842 3,458 4,353
Long-term loans payable 2,790 4,270 4,131 2,961 3,631
Provision for retirement benefits 360 319 - - -
Net defined benefit liability - - 237 30 249
Provision for directors' retirement benefits 345 - - - -
Other 97 470 474 466 472
Net assets
Total net assets 17,667 18,948 22,184 23,874 24,342
Shareholders' equity 17,783 18,725 21,820 23,238 24,227
Capital stock 2,439 2,439 3,301 3,301 3,301
Capital surplus 2,884 2,884 3,792 3,792 3,792
Retained earnings 12,669 13,611 14,738 16,156 17,487
Treasury shares (209) (209) (12) (12) (354)
Accumulated other comprehensive income (115) 222 363 636 115
Valuation difference on available-for-sale securities 26 121 221 202 180
Foreign currency translation adjustment (142) 101 142 359 58
Remeasurements of defined benefit plans - - 0 73 (124)
Total liabilities and net assets 40,325 40,681 45,193 46,994 47,511
Copyright (c) HAGIWARA ELECTRIC CO., LTD. All Rights Reserved. 6
Consolidated Statement of Income/Information by Segment
Consolidated Statement of Income
Information by Segment
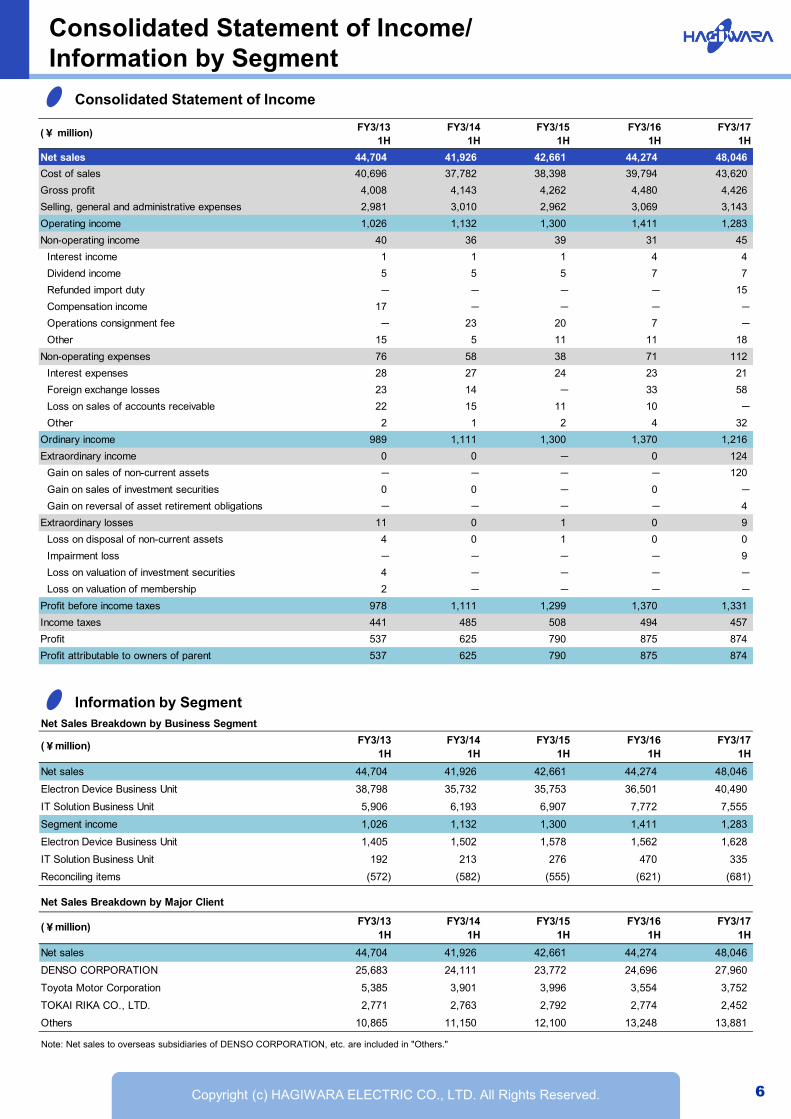
Note: Net sales to overseas subsidiaries of DENSO CORPORATION, etc. are included in "Others."
Net Sales Breakdown by Business Segment
(¥million) FY3/131H
FY3/141H
FY3/151H
FY3/161H
FY3/171H
Net sales 44,704 41,926 42,661 44,274 48,046
Electron Device Business Unit 38,798 35,732 35,753 36,501 40,490
IT Solution Business Unit 5,906 6,193 6,907 7,772 7,555
Segment income 1,026 1,132 1,300 1,411 1,283
Electron Device Business Unit 1,405 1,502 1,578 1,562 1,628
IT Solution Business Unit 192 213 276 470 335
Reconciling items (572) (582) (555) (621) (681)
Net Sales Breakdown by Major Client
(¥million) FY3/131H
FY3/141H
FY3/151H
FY3/161H
FY3/171H
Net sales 44,704 41,926 42,661 44,274 48,046
DENSO CORPORATION 25,683 24,111 23,772 24,696 27,960
Toyota Motor Corporation 5,385 3,901 3,996 3,554 3,752
TOKAI RIKA CO., LTD. 2,771 2,763 2,792 2,774 2,452
Others 10,865 11,150 12,100 13,248 13,881
(¥ million) FY3/131H
FY3/141H
FY3/151H
FY3/161H
FY3/171H
Net sales 44,704 41,926 42,661 44,274 48,046
Cost of sales 40,696 37,782 38,398 39,794 43,620
Gross profit 4,008 4,143 4,262 4,480 4,426
Selling, general and administrative expenses 2,981 3,010 2,962 3,069 3,143
Operating income 1,026 1,132 1,300 1,411 1,283
Non-operating income 40 36 39 31 45
Interest income 1 1 1 4 4
Dividend income 5 5 5 7 7
Refunded import duty - - - - 15
Compensation income 17 - - - -
Operations consignment fee - 23 20 7 -
Other 15 5 11 11 18
Non-operating expenses 76 58 38 71 112
Interest expenses 28 27 24 23 21
Foreign exchange losses 23 14 - 33 58
Loss on sales of accounts receivable 22 15 11 10 -
Other 2 1 2 4 32
Ordinary income 989 1,111 1,300 1,370 1,216
Extraordinary income 0 0 - 0 124
Gain on sales of non-current assets - - - - 120
Gain on sales of investment securities 0 0 - 0 -
Gain on reversal of asset retirement obligations - - - - 4
Extraordinary losses 11 0 1 0 9
Loss on disposal of non-current assets 4 0 1 0 0
Impairment loss - - - - 9
Loss on valuation of investment securities 4 - - - -
Loss on valuation of membership 2 - - - -
Profit before income taxes 978 1,111 1,299 1,370 1,331
Income taxes 441 485 508 494 457
Profit 537 625 790 875 874
Profit attributable to owners of parent 537 625 790 875 874
Copyright (c) HAGIWARA ELECTRIC CO., LTD. All Rights Reserved. 7
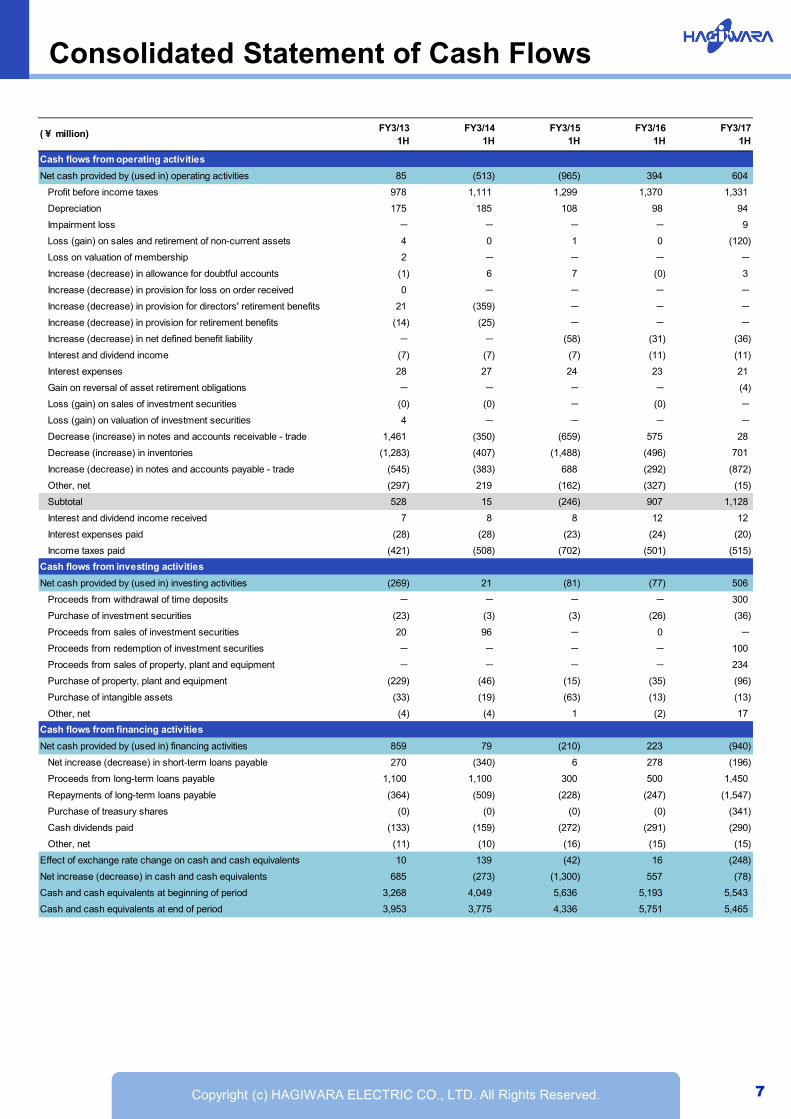
Consolidated Statement of Cash Flows
(¥ million)FY3/13
1HFY3/14
1HFY3/15
1HFY3/16
1HFY3/17
1H
Cash flows from operating activities
Net cash provided by (used in) operating activities 85 (513) (965) 394 604
Profit before income taxes 978 1,111 1,299 1,370 1,331
Depreciation 175 185 108 98 94
Impairment loss - - - - 9
Loss (gain) on sales and retirement of non-current assets 4 0 1 0 (120)
Loss on valuation of membership 2 - - - -
Increase (decrease) in allowance for doubtful accounts (1) 6 7 (0) 3
Increase (decrease) in provision for loss on order received 0 - - - -
Increase (decrease) in provision for directors' retirement benefits 21 (359) - - -
Increase (decrease) in provision for retirement benefits (14) (25) - - -
Increase (decrease) in net defined benefit liability - - (58) (31) (36)
Interest and dividend income (7) (7) (7) (11) (11)
Interest expenses 28 27 24 23 21
Gain on reversal of asset retirement obligations - - - - (4)
Loss (gain) on sales of investment securities (0) (0) - (0) -
Loss (gain) on valuation of investment securities 4 - - - -
Decrease (increase) in notes and accounts receivable - trade 1,461 (350) (659) 575 28
Decrease (increase) in inventories (1,283) (407) (1,488) (496) 701
Increase (decrease) in notes and accounts payable - trade (545) (383) 688 (292) (872)
Other, net (297) 219 (162) (327) (15)
Subtotal 528 15 (246) 907 1,128
Interest and dividend income received 7 8 8 12 12
Interest expenses paid (28) (28) (23) (24) (20)
Income taxes paid (421) (508) (702) (501) (515)
Cash flows from investing activities
Net cash provided by (used in) investing activities (269) 21 (81) (77) 506
Proceeds from withdrawal of time deposits - - - - 300
Purchase of investment securities (23) (3) (3) (26) (36)
Proceeds from sales of investment securities 20 96 - 0 -
Proceeds from redemption of investment securities - - - - 100
Proceeds from sales of property, plant and equipment - - - - 234
Purchase of property, plant and equipment (229) (46) (15) (35) (96)
Purchase of intangible assets (33) (19) (63) (13) (13)
Other, net (4) (4) 1 (2) 17
Cash flows from financing activities
Net cash provided by (used in) financing activities 859 79 (210) 223 (940)
Net increase (decrease) in short-term loans payable 270 (340) 6 278 (196)
Proceeds from long-term loans payable 1,100 1,100 300 500 1,450
Repayments of long-term loans payable (364) (509) (228) (247) (1,547)
Purchase of treasury shares (0) (0) (0) (0) (341)
Cash dividends paid (133) (159) (272) (291) (290)
Other, net (11) (10) (16) (15) (15)
Effect of exchange rate change on cash and cash equivalents 10 139 (42) 16 (248)
Net increase (decrease) in cash and cash equivalents 685 (273) (1,300) 557 (78)
Cash and cash equivalents at beginning of period 3,268 4,049 5,636 5,193 5,543
Cash and cash equivalents at end of period 3,953 3,775 4,336 5,751 5,465
Copyright (c) HAGIWARA ELECTRIC CO., LTD. All Rights Reserved. 8
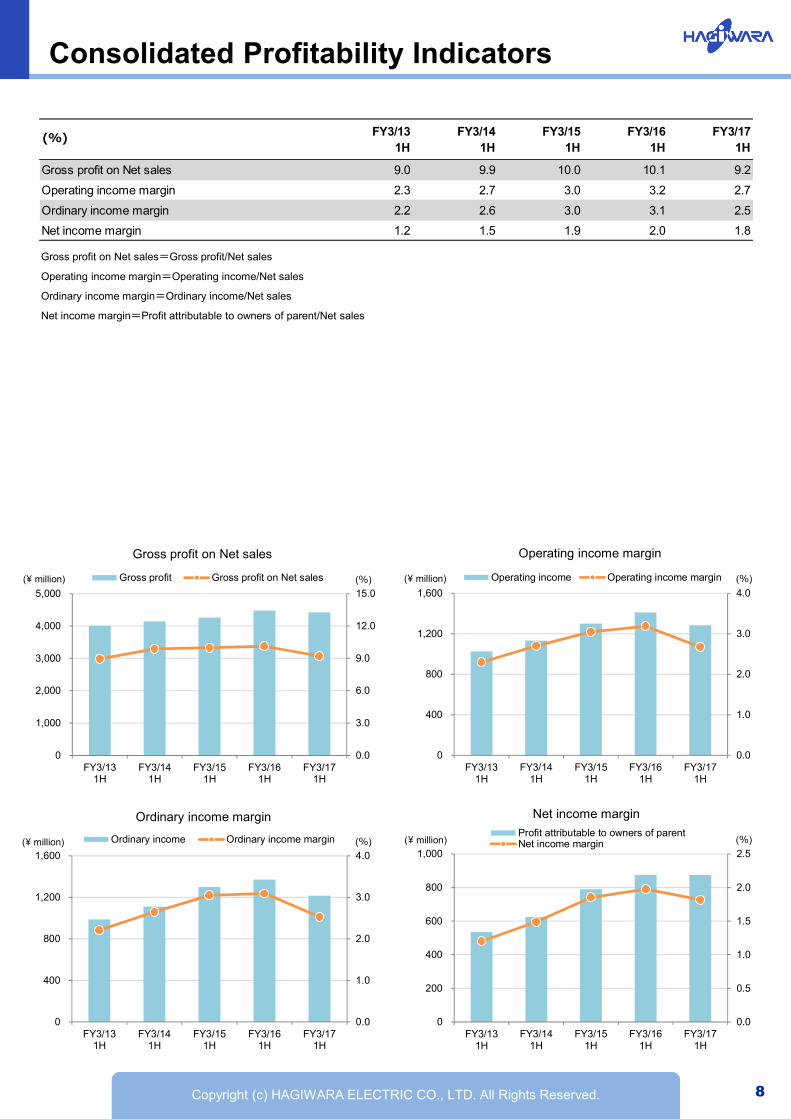
Consolidated Profitability Indicators
Gross profit on Net sales=Gross profit/Net sales
Operating income margin=Operating income/Net sales
Ordinary income margin=Ordinary income/Net sales
Net income margin=Profit attributable to owners of parent/Net sales
(%) FY3/131H
FY3/141H
FY3/151H
FY3/161H
FY3/171H
Gross profit on Net sales 9.0 9.9 10.0 10.1 9.2
Operating income margin 2.3 2.7 3.0 3.2 2.7
Ordinary income margin 2.2 2.6 3.0 3.1 2.5
Net income margin 1.2 1.5 1.9 2.0 1.8
0.0
3.0
6.0
9.0
12.0
15.0
0
1,000
2,000
3,000
4,000
5,000
FY3/131H
FY3/141H
FY3/151H
FY3/161H
FY3/171H
(¥ million)
Gross profit on Net sales
Gross profit Gross profit on Net sales (%)
0.0
1.0
2.0
3.0
4.0
0
400
800
1,200
1,600
FY3/131H
FY3/141H
FY3/151H
FY3/161H
FY3/171H
Operating income Operating income margin
Operating income margin
(¥ million) (%)
0.0
1.0
2.0
3.0
4.0
0
400
800
1,200
1,600
FY3/131H
FY3/141H
FY3/151H
FY3/161H
FY3/171H
Ordinary income Ordinary income margin
Ordinary income margin
(¥ million) (%)
0.0
0.5
1.0
1.5
2.0
2.5
0
200
400
600
800
1,000
FY3/131H
FY3/141H
FY3/151H
FY3/161H
FY3/171H
(¥ million)
Net income margin
Profit attributable to owners of parentNet income margin (%)
Copyright (c) HAGIWARA ELECTRIC CO., LTD. All Rights Reserved. 9
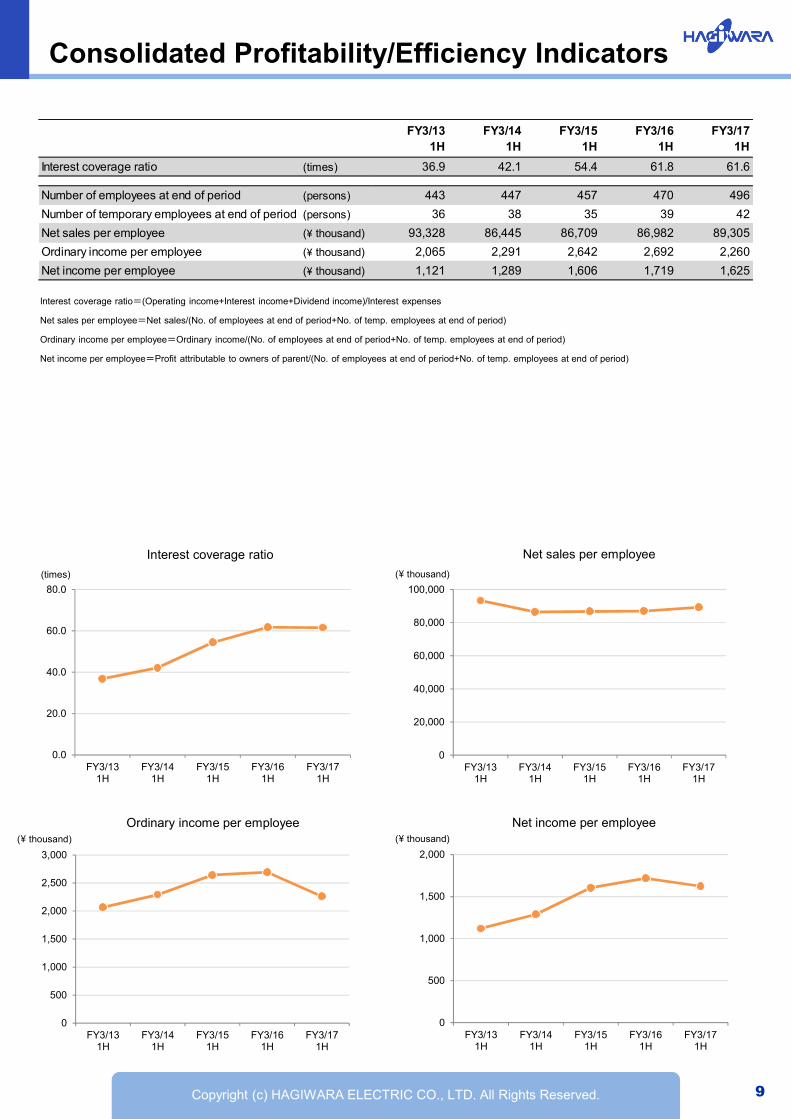
Consolidated Profitability/Efficiency Indicators
Interest coverage ratio=(Operating income+Interest income+Dividend income)/Interest expenses
Net sales per employee=Net sales/(No. of employees at end of period+No. of temp. employees at end of period)
Ordinary income per employee=Ordinary income/(No. of employees at end of period+No. of temp. employees at end of period)
Net income per employee=Profit attributable to owners of parent/(No. of employees at end of period+No. of temp. employees at end of period)
FY3/131H
FY3/141H
FY3/151H
FY3/161H
FY3/171H
Interest coverage ratio (times) 36.9 42.1 54.4 61.8 61.6
Number of employees at end of period (persons) 443 447 457 470 496
Number of temporary employees at end of period (persons) 36 38 35 39 42
Net sales per employee (\ thousand) 93,328 86,445 86,709 86,982 89,305
Ordinary income per employee (\ thousand) 2,065 2,291 2,642 2,692 2,260
Net income per employee (\ thousand) 1,121 1,289 1,606 1,719 1,625
0.0
20.0
40.0
60.0
80.0
FY3/131H
FY3/141H
FY3/151H
FY3/161H
FY3/171H
Interest coverage ratio
(times)
0
20,000
40,000
60,000
80,000
100,000
FY3/131H
FY3/141H
FY3/151H
FY3/161H
FY3/171H
Net sales per employee
(¥ thousand)
0
500
1,000
1,500
2,000
2,500
3,000
FY3/131H
FY3/141H
FY3/151H
FY3/161H
FY3/171H
Ordinary income per employee (¥ thousand)
0
500
1,000
1,500
2,000
FY3/131H
FY3/141H
FY3/151H
FY3/161H
FY3/171H
Net income per employee(¥ thousand)
Copyright (c) HAGIWARA ELECTRIC CO., LTD. All Rights Reserved. 10
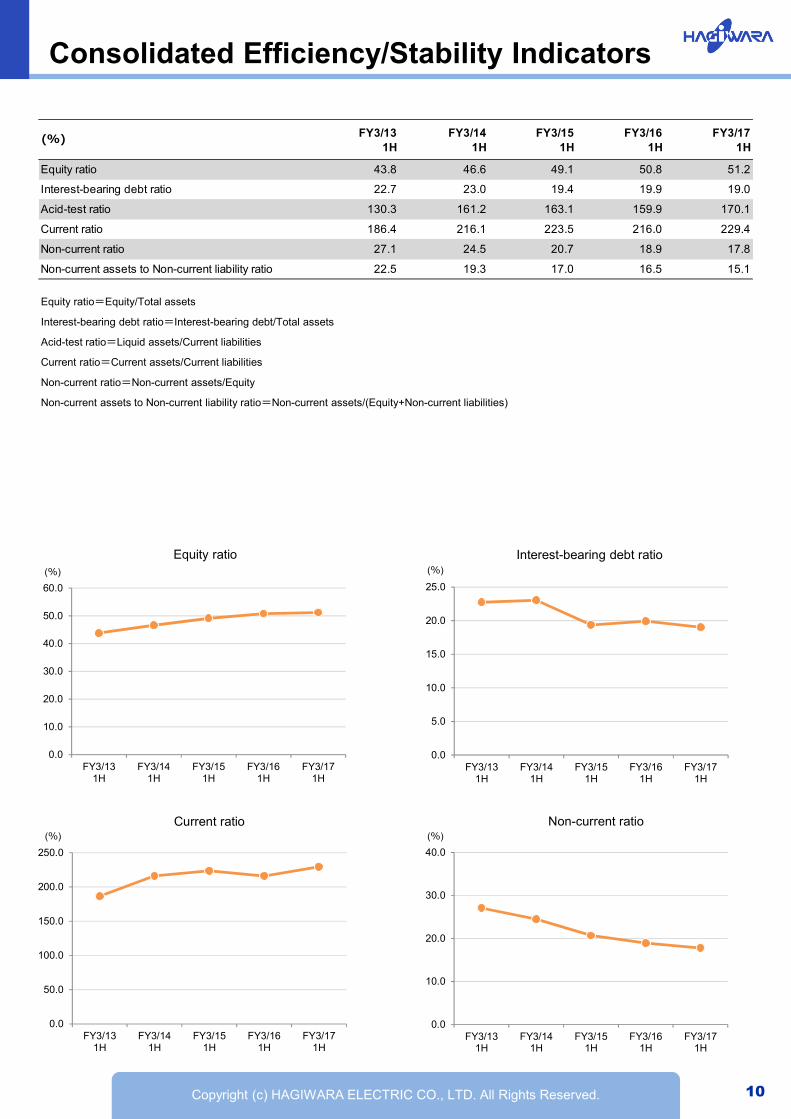
Consolidated Efficiency/Stability Indicators
Equity ratio=Equity/Total assets
Interest-bearing debt ratio=Interest-bearing debt/Total assets
Acid-test ratio=Liquid assets/Current liabilities
Current ratio=Current assets/Current liabilities
Non-current ratio=Non-current assets/Equity
Non-current assets to Non-current liability ratio=Non-current assets/(Equity+Non-current liabilities)
(%) FY3/131H
FY3/141H
FY3/151H
FY3/161H
FY3/171H
Equity ratio 43.8 46.6 49.1 50.8 51.2
Interest-bearing debt ratio 22.7 23.0 19.4 19.9 19.0
Acid-test ratio 130.3 161.2 163.1 159.9 170.1
Current ratio 186.4 216.1 223.5 216.0 229.4
Non-current ratio 27.1 24.5 20.7 18.9 17.8
Non-current assets to Non-current liability ratio 22.5 19.3 17.0 16.5 15.1
0.0
10.0
20.0
30.0
40.0
50.0
60.0
FY3/131H
FY3/141H
FY3/151H
FY3/161H
FY3/171H
Equity ratio(%)
0.0
5.0
10.0
15.0
20.0
25.0
FY3/131H
FY3/141H
FY3/151H
FY3/161H
FY3/171H
Interest-bearing debt ratio(%)
0.0
50.0
100.0
150.0
200.0
250.0
FY3/131H
FY3/141H
FY3/151H
FY3/161H
FY3/171H
Current ratio(%)
0.0
10.0
20.0
30.0
40.0
FY3/131H
FY3/141H
FY3/151H
FY3/161H
FY3/171H
Non-current ratio(%)
Copyright (c) HAGIWARA ELECTRIC CO., LTD. All Rights Reserved. 11
Stock Information
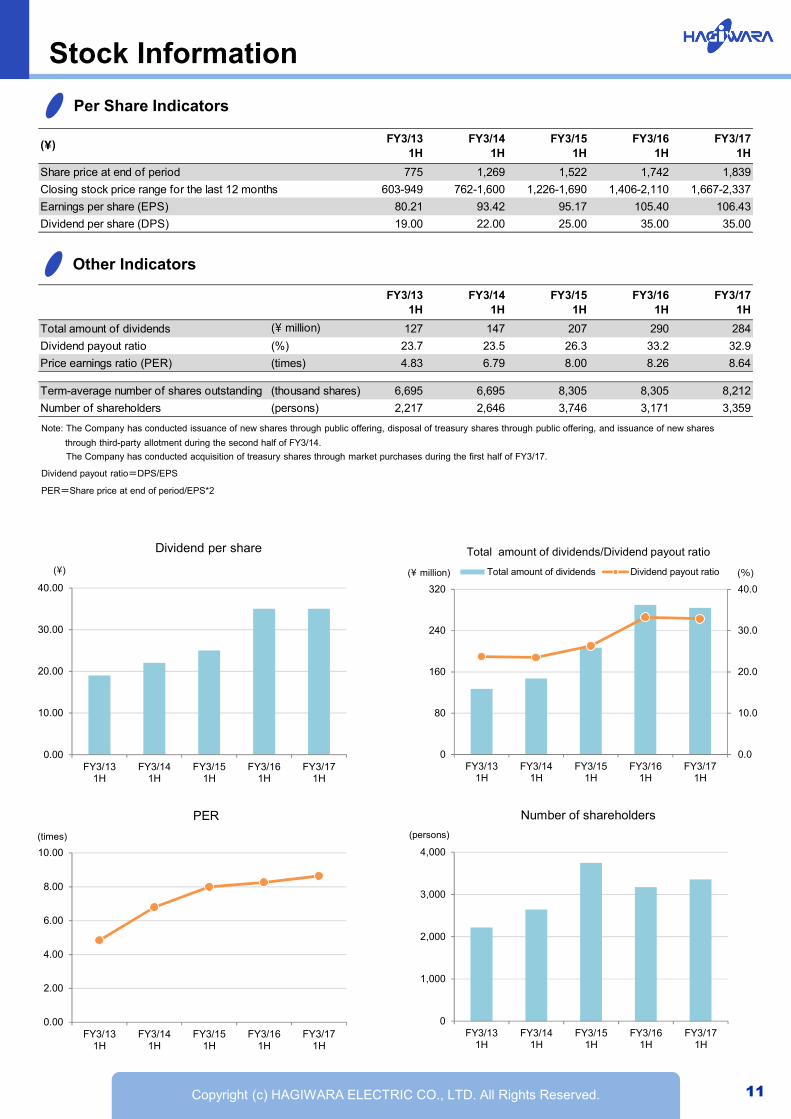
Per Share Indicators
Other Indicators
Note: The Company has conducted issuance of new shares through public offering, disposal of treasury shares through public offering, and issuance of new shares
through third-party allotment during the second half of FY3/14.
The Company has conducted acquisition of treasury shares through market purchases during the first half of FY3/17.
(\) FY3/131H
FY3/141H
FY3/151H
FY3/161H
FY3/171H
Share price at end of period 775 1,269 1,522 1,742 1,839
Closing stock price range for the last 12 months 603-949 762-1,600 1,226-1,690 1,406-2,110 1,667-2,337
Earnings per share (EPS) 80.21 93.42 95.17 105.40 106.43
Dividend per share (DPS) 19.00 22.00 25.00 35.00 35.00
FY3/131H
FY3/141H
FY3/151H
FY3/161H
FY3/171H
Total amount of dividends (\ million) 127 147 207 290 284
Dividend payout ratio (%) 23.7 23.5 26.3 33.2 32.9
Price earnings ratio (PER) (times) 4.83 6.79 8.00 8.26 8.64
Term-average number of shares outstanding (thousand shares) 6,695 6,695 8,305 8,305 8,212
Number of shareholders (persons) 2,217 2,646 3,746 3,171 3,359
0.00
10.00
20.00
30.00
40.00
FY3/131H
FY3/141H
FY3/151H
FY3/161H
FY3/171H
Dividend per share
(¥)
0.0
10.0
20.0
30.0
40.0
0
80
160
240
320
FY3/131H
FY3/141H
FY3/151H
FY3/161H
FY3/171H
Total amount of dividends Dividend payout ratio
Total amount of dividends/Dividend payout ratio
(¥ million) (%)
0.00
2.00
4.00
6.00
8.00
10.00
FY3/131H
FY3/141H
FY3/151H
FY3/161H
FY3/171H
PER
(times)
0
1,000
2,000
3,000
4,000
FY3/131H
FY3/141H
FY3/151H
FY3/161H
FY3/171H
Number of shareholders
(persons)
Dividend payout ratio=DPS/EPS
PER=Share price at end of period/EPS*2
Copyright (c) HAGIWARA ELECTRIC CO., LTD. All Rights Reserved.
0
500
1,000
1,500
2,000
2,500
9/2012 9/2013 9/2014 9/2015 9/2016
Monthly trading volume (thousand shares)
0
500
1,000
1,500
2,000
2,500
Share price (Month-end)
(¥)
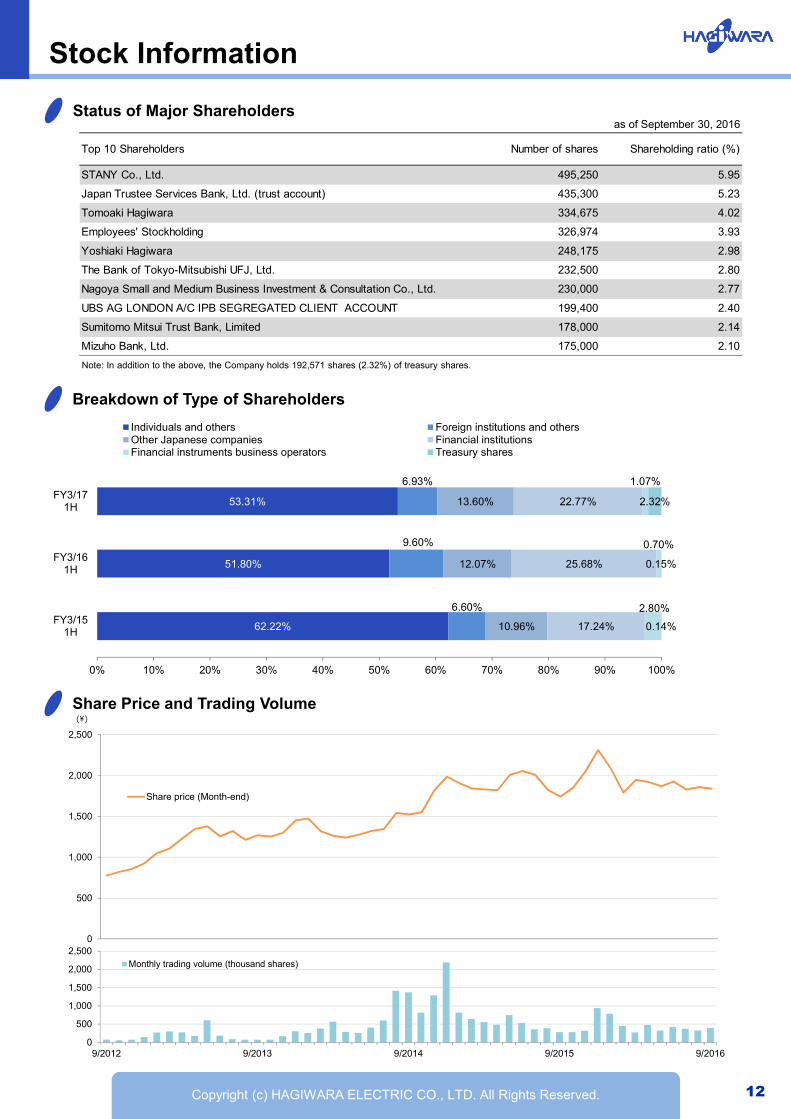
62.22%
51.80%
53.31%
6.60%
9.60%
6.93%
10.96%
12.07%
13.60%
17.24%
25.68%
22.77%
2.80%
0.70%
1.07%
0.14%
0.15%
2.32%
0% 10% 20% 30% 40% 50% 60% 70% 80% 90% 100%
FY3/151H
FY3/161H
FY3/171H
Individuals and others Foreign institutions and othersOther Japanese companies Financial institutionsFinancial instruments business operators Treasury shares
12
Stock Information
Status of Major Shareholders
Breakdown of Type of Shareholders
Share Price and Trading Volume
as of September 30, 2016
Note: In addition to the above, the Company holds 192,571 shares (2.32%) of treasury shares.
Top 10 Shareholders Number of shares Shareholding ratio (%)
STANY Co., Ltd. 495,250 5.95
Japan Trustee Services Bank, Ltd. (trust account) 435,300 5.23
Tomoaki Hagiwara 334,675 4.02
Employees' Stockholding 326,974 3.93
Yoshiaki Hagiwara 248,175 2.98
The Bank of Tokyo-Mitsubishi UFJ, Ltd. 232,500 2.80
Nagoya Small and Medium Business Investment & Consultation Co., Ltd. 230,000 2.77
UBS AG LONDON A/C IPB SEGREGATED CLIENT ACCOUNT 199,400 2.40
Sumitomo Mitsui Trust Bank, Limited 178,000 2.14
Mizuho Bank, Ltd. 175,000 2.10
Contact
HAGIWARA ELECTRIC CO., LTD.General Affairs Department Phone: +81-52-931-3511FAX: +81-52-931-9414E-mail: [email protected]
http://www.hagiwara.co.jp/english/