Factbook 2010 Q4 · SEB Fact Book Annual Accounts 2010 5 Group Executive Committee The President...
73
SEB Fact Book Annual Accounts 2010 N Fact Book Annual Accounts 2010 STOCKHOLM 4 FEBRUARY 2011
Transcript of Factbook 2010 Q4 · SEB Fact Book Annual Accounts 2010 5 Group Executive Committee The President...

= ==
SEB Fact Book Annual Accounts 2010 N
Fact Book Annual Accounts 2010 STOCKHOLM 4 FEBRUARY 2011

SEB Fact Book Annual Accounts 2010 2
Table of contents
Table of contents .......................................................................................................................................................................................................................................2 About SEB....................................................................................................................................................................................................................................................3 SEB history ..................................................................................................................................................................................................................................................3 Financial targets.........................................................................................................................................................................................................................................3 Organisation ...............................................................................................................................................................................................................................................4 Corporate Governance..............................................................................................................................................................................................................................6 Share and shareholders ............................................................................................................................................................................................................................ 7 Income statement......................................................................................................................................................................................................................................8 Balance sheet structure & funding........................................................................................................................................................................................................25 Capital adequacy and RWA ....................................................................................................................................................................................................................30 Volumes.....................................................................................................................................................................................................................................................33 Credit portfolio, loan portfolio impaired loans by industry and geography ...................................................................................................................................35 Asset quality..............................................................................................................................................................................................................................................39 Bond investment portfolio......................................................................................................................................................................................................................45 Divisional structure................................................................................................................................................................................................................................. 46 Merchant Banking....................................................................................................................................................................................................................................47 Retail Banking...........................................................................................................................................................................................................................................50 Wealth Management ...............................................................................................................................................................................................................................54 Life..............................................................................................................................................................................................................................................................56 Baltic ..........................................................................................................................................................................................................................................................65 Macro ........................................................................................................................................................................................................................................................ 69 Definitions.................................................................................................................................................................................................................................................73
Note: restated from Q1 2008 for German Retail divestment

SEB Fact Book Annual Accounts 2010 3
Short Long Short Long Short Long
P-1 Aaa A-1+ AAA F1+ AAAP-2 Aa1 A-1 AA+ F1 AA+P-3 Aa2 A-2 AA F2 AA
Aa3 A-3 AA- F3 AA-A1 A+ A+
A2 A AA3 A- A-Baa1 BBB+ BBB+Baa2 BBB BBBBaa3 BBB- BBB-
Moody's
Outlook Stable (June 2010)
Standard & Poor's
Outlook Stable (February 2010)
Fitch
Outlook Stable (June 2009)
About SEB Mission We help people and businesses thrive by providing quality advice and financial resources.
Vision To be the trusted partner for customers with aspirations.
Customers & Markets 2,500 large corporates and institutions, 400,000 SMEs and 4 million private customers bank with us. They are mainly located in eight markets around the Baltic Sea.
Brand promise Rewarding relationships.
Goal To be the relationship bank of the Nordics. Excel in universal banking in Sweden, Estonia, Latvia and Lithuania by providing a full range of
banking, wealth management and life insurance services to corporations, institutions and private individuals.
Expand in core areas of strength, merchant banking and wealth management, in the Nordic area and in Germany. In addition, selectively expand leading life insurance and card services in the Nordic area.
Support SEB’s customers internationally through its network of strategic locations in major global financial centres.
People 17,000 highly skilled people serving customers from locations in some 20 countries; covering different time zones, securing reach and local market knowledge.
Values Guided by our Code of Business Conduct and our core values: professionalism, commitment, mutual respect and continuity.
History Over 150 years of business, building trust and sharing knowledge. We have always acted responsibly in society promoting entrepreneurship, international outlook and long-term relationships.
SEB history 1856- Stockholms Enskilda Bank was founded
1914- Head offices at Kungsträdgårdsgatan
1938- Kreditbolaget renamed to Skandinaviska Banken
1972- Merger with Skandinaviska Banken
1990- Bank crises and e-banking revolution. Several acquisitions: Trygg Hansa, Baltic banks and asset managers
2000- A Northern European financial corporation with international operations
2010- Divestment of German Retail business
Financial targets Financial targets and outcome 2005 2006 2007 2008 2009 2010 Target
Return on equity (per cent) 15.8 20.8 19.3 13.1 1.2 6.8 Highest among its peers
Net profit (SEK m) 8,421 12,623 13,642 10,050 1,178 6,798 Sustainable profit growth
Tier I capital ratio (per cent) 1) 7.5 8.2 9.9 10.1 13.9 14.2 10 per cent over a business cycleDividend (per cent of earnings per share) 38 32 33 0 172 49* 40 per cent of net profit per share
over a business cycle1)
2005–2006 Basel I. 2007–2010 Basel II without transitional rules.
* Proposed to the AGM Rating=

SEB Fact Book Annual Accounts 2010 4
Organisation Board ofDirectors
Internal Audit
President and Chief Executive Officer
Human Resources
Chief Financial Officer
Group CreditsGroup Risk Control
Group Compliance
MerchantBanking
RetailBanking
WealthManagement
Life Baltic
Group Operations / Group IT / Group Staff
=
Board
The Board members are appointed by the shareholders at the AGM
for a term of office of one year, until the next AGM. The Board of
Directors consists of eleven members without any deputies, elected
by the AGM, and of two members and two deputies appointed by the
employees.
In order for the Board to form a quorum more than half of the
members must be present. The President, Annika Falkengren, is the
only Board member elected by the AGM who is equally an employee
of the Bank. All other Board members elected by the AGM are
considered to be independent in relation to the Bank and its
Management.
Marcus Wallenberg
Chairman
Jacob Wallenberg
Deputy Chairman
Tuve Johannesson
Deputy Chairman
Signhild
Arnegård Hansen
Urban Jansson
Chairman of the Risk
and Capital
Committee
Birgitta Kantola
Tomas Nicolin
Chairman of the
Remuneration and HR
Committee
Christine Novakovic
Jesper Ovesen
Carl Wilhelm Ros
Chairman of the Audit
and Compliance
Committee
Annika Falkengren
President & CEO
Göran Arrius
Appointed by the
employees
Göran Lilja
Appointed by the
employees
Cecilia Mårtensson
Appointed by the
employees
Pernilla Påhlman
Appointed by the
employees

SEB Fact Book Annual Accounts 2010 5
Group Executive Committee
The President has three different committees at her disposal; the
Group Executive Committee, the Group Credit Committee and the
Asset and Liability Committee. The President also consults with the
IT Committee and the New Product Approval Committee.
The GEC deals with, among other things, matters of common
concern to several divisions, strategic issues, business plans,
financial forecasts and reports. The members are presented below.
Annika Falkengren
President & CEO
Johan Andersson
CRO
Jan Erik Back
CFO
Magnus Carlsson
Merchant Banking
Viveka
Hirdman-Ryrberg
Communications
Martin Johansson
Baltic
Anders Johnsson
Wealth Management
Hans Larsson
Strategy
Bo Magnusson
Staff
Ulf Peterson
Human Resources
Jan Stjernström
Life
Mats Torstendahl
Retail Banking
Pia Warnerman
Operations & IT
Full-time equivalents, end of quarter
= Q1 Q2 Q3 Q4 Q1 Q2 Q3 Q4 Q1 Q2 Q3 Q42008 2008 2008 2008 2009 2009 2009 2009 2010 2010 2010 2010
Merchant Banking 2,742 2,760 2,719 2,698 2,697 2,650 2,582 2,539 2,529 2,530 2,571 2,591
Retail Banking 3,507 3,700 3,544 3,529 3,425 3,454 3,320 3,313 3,316 3,470 3,420 3,437
RB Sweden 2,723 2,865 2,728 2,710 2,621 2,642 2,515 2,512 2,531 2,674 2,610 2,663
RB Cards 784 835 816 819 804 812 805 801 785 796 810 774
Wealth Management 1,160 1,143 1,123 1,088 1,064 1,013 981 1,000 972 969 996 1,030
Life 1,222 1,235 1,250 1,226 1,206 1,196 1,184 1,173 1,175 1,173 1,200 1,226
Baltic 3,366 3,469 3,420 3,353 3,353 3,285 3,252 3,093 2,957 2,937 2,959 2,966
Baltic Estonia 986 1,022 983 973 950 958 974 933 915 909 905 893
Baltic Latvia 1,012 1,024 997 916 911 896 878 854 803 802 824 829
Baltic Lithuania 1,368 1,423 1,439 1,464 1,492 1,432 1,400 1,306 1,239 1,226 1,229 1,244
Operations & IT 3,725 3,845 3,864 3,860 3,777 3,762 3,688 3,655 3,626 3,613 3,612 3,640
Other 3,117 3,092 3,144 3,061 2,862 2,784 2,648 2,558 2,411 2,367 2,375 2,457
SEB Group
Continuing operations 18,839 19,244 19,064 18,815 18,385 18,143 17,655 17,331 16,986 17,059 17,133 17,347
Discontinued operations 2,371 2,401 2,364 2,316 2,272 2,286 2,257 2,231 2,046 2,032 2,017 1,873
SEB Group 21,210 21,645 21,428 21,131 20,656 20,430 19,912 19,562 19,032 19,091 19,150 19,220

SEB Fact Book Annual Accounts 2010 6
Corporate Governance
SEB follows the Swedish Code of Corporate Governance
(Bolagsstyrningskoden). The structure of responsibility distribution
and governance comprises: Annual General Meeting (AGM) Board of Directors President/Chief Executive Officer Divisions, business areas and business units
Staff and Support functions Internal Audit, Compliance and Risk Control.
The Board of Directors and the President perform their governing
and controlling roles through several policies and instructions, the
purpose of which is to clearly define the distribution of responsibility.
The Rules of Procedure for the Board of Directors, the Instruction
for the President and Chief Executive Officer, the Instruction for the
Activities, the Group’s Credit Instruction, Instruction for handling of
Conflicts of Interest, Ethics Policy, Risk Policy, Instruction for
procedures against Money Laundering and Financing of Terrorism,
Remuneration Policy, Code of Business Conduct and the Corporate
Sustainability Policy are of special importance.
Corporate Governance Structure
President and Chief Executive Officer
Risk & CapitalCommittee
Remuneration & HRCommittee
Audit & ComplianceCommittee
Group CreditCommittee
Group ExecutiveCommittee
Asset & LiabilityCommittee
Board of Directors
Appointed by
Informing
Chief RiskOfficer
SEB’s activities are managed, controlled and followed up in accordance with policies and instructions established by the Board and the President (CEO).
Reporting to
Head of GroupInternal Audit
Head of GroupCompliance
Head ofGroup Risk Control
Shareholder's Annual General Meeting
Group CreditOfficer
NominationCommittee
=

==
SEB Fact Book Annual Accounts 2010 7
Share and shareholders
The SEB share
Index
0
20
40
60
80
100
120
140
160
Jan-
06
Apr-
06
Jul-
06
Oct-
06
Jan-
07
Apr-
07
Jul-
07
Oct-
07
Jan-
08
Apr-
08
Jul-
08
Oct-
08
Jan-
09
Apr-
09
Jul-
09
Oct-
09
Jan-
10
Apr-
10
Jul-
10
Oct-
10
Jan-
11
OMXS 30 FTSE W.EUROPE BANKS SEB
==
SEB’s major shareholders Dividend development
Share of capital,
December 2010 per cent
Investor AB 20.8Trygg Foundation 8.1Alecta 7.0Swedbank/Robur Funds 3.6SHB 1.7AMF Insurance & Funds 1.6SHB Funds 1.6Wallenberg Foundations 1.5SEB Funds 1.4AFA Insurance 1.4
Foreign owners 21.3Source: Euroclear Sweden/SIS Ägarservice ====
0
2,000
4,000
6,000
8,000
10,000
12,000
14,000
16,000
2005 2006 2007 2008 2009 2010
Total dividend Net profit
DPS*, SEK 2.50 3.10 3.40 0 1.00 1.50 *Pay-out ratio 38% 32% 33% 0% 172% 49%*
* No. shares adjusted for rights issue
Dividend policy: 40% of net profit (Earnings per share) over the business cycle
SEK m
** Proposed to the AGM == =

SEB Fact Book Annual Accounts 2010 8
Income statement
SEB Group
Q4 Q3 Q4
SEK m 2010 2010 % 2,009 % 2010 2009 %Net interest income 4,526 4,180 8 3,332 36 16,010 18,046 -11
Net fee and commission income 3,906 3,387 15 3,587 9 14,160 13,285 7
Net financial income 512 727 -30 939 -45 3,166 4,488 -29
Net life insurance income 780 818 -5 932 -16 3,255 3,597 -10
Net other income 314 -230 430 -27 288 2,159 -87
Total operating income 10,038 8,882 13 9,220 9 36,879 41,575 -11
Staff costs -3,558 -3,392 5 -2,785 28 -14,004 -13,786 2
Other expenses -1,965 -1,679 17 -2,128 -8 -7,303 -6,740 8
Depreciation, amortisation and impairment of tangible and intangible assets -650 -405 60 -463 40 -1,880 -4,672 -60
Restructuring costs -9 -755 -99 -764Total operating expenses -6,182 -6,231 -1 -5,376 15 -23,951 -25,198 -5
Profit before credit losses 3,856 2,651 45 3,844 0 12,928 16,377 -21
Gains less losses on disposals of tangible and
intangible assets 21 -24 14 4Net credit losses 419 196 114 -3,064 -114 -1,837 -12,030 -85
Operating profit 4,296 2,847 51 756 11,105 4,351 155
Income tax expense -704 -765 -8 -333 111 -2,521 -2,482 2
Net profit from continuing operations 3,592 2,082 73 423 8,584 1,869
Discontinued operations -83 -1,486 -94 -139 -40 -1,786 -691 158
Net profit 3,509 596 284 6,798 1,178
Attributable to minority interests 6 15 -60 27 -78 53 64 -17
Attributable to equity holders 3,503 581 257 6,745 1,114
Continuing operations Basic earnings per share, SEK 1.64 0.94 0.18 3.88 0.95 Diluted earnings per share, SEK 1.62 0.94 0.18 3.87 0.94
Total operations Basic earnings per share, SEK 1.60 0.26 0.12 3.07 0.58 Diluted earnings per share, SEK 1.58 0.26 0.12 3.06 0.58
Jan - Dec
0
2,000
4,000
6,000
8,000
10,000
12,000
14,000
Q2-
05
Q4-
05
Q2-
06
Q4-
06
Q2-
07
Q4-
07
Q2-
08
Q4-
08
Q2-
09
Q4-
09
Q2-
10
Q4-
10
Excluding portfolios Income ExpensesOperating profit
0
1,000
2,000
3,000
4,000
5,000
6,000
Q2-
05
Q4-
05
Q2-
06
Q4-
06
Q2-
07
Q4-
07
Q2-
08
Q4-
08
Q2-
09
Q4-
09
Q2-
10
Q4-
10
Including:One-off charges of SEK 890m in Q4 2005 for premises
Sales of Baltic properties in Q4 2007 of SEK 785m
SEK 600m redundancies and SEK 780m VPC divest in Q4 2008
SEK 594m goodwill write-down for Ukraine in Q1 2009
SEK 2,394m goodwill write-down for Baltics and Russia in Q2 2009 and SEK 1,3bn capital gain on repurchased bonds
SEK 270m capital gain on repurchased bonds in Q4 2009
SEK 755m restructuring costs for German Retail divestment in Q3 2010
SEK m SEK m

SEB Fact Book Annual Accounts 2010 9
Key figures – SEB Group
Q4 Q3 Q4
2010 2010 2009 2010 2009
Continuing operations
Return on equity, continuing operations, % 14.62 8.48 1.60 8.65 1.89Basic earnings per share, continuing operations, SEK 1.64 0.94 0.18 3.88 0.95Diluted earnings per share, continuing operations, SEK 1.62 0.94 0.18 3.87 0.94Cost/income ratio, continuing operations 0.62 0.70 0.58 0.65 0.61Number of full time equivalents, continuing operations* 17.347 17.133 17.331 17.104 17.970
Loans to deposits ratio, excl repos and reclassified bonds, % 139 138 139 139 139
Total operations
Return on equity, % 14.28 2.38 1.04 6.84 1.17Return on total assets, % 0.63 0.10 0.05 0.30 0.05Return on risk-weighted assets, % 1.73 0.28 0.13 0.83 0.13
Basic earnings per share, SEK 1.60 0.26 0.12 3.07 0.58Weighted average number of shares, millions** 2.194 2.194 2.194 2.194 1.906
Diluted earnings per share, SEK 1.58 0.26 0.12 3.06 0.58Weighted average number of diluted shares, millions*** 2.212 2.207 2.201 2.202 1.911
Net worth per share, SEK 50.34 49.02 50.17 50.34 50.17Average equity, SEK, billion 98.4 98.4 99.3 98.9 95.4
Credit loss level, % -0.07 -0.02 0.93 0.14 0.92
Total reserve ratio individually assessed impaired loans, % 69.2 73.2 69.5 69.2 69.5Net level of impaired loans, % 0.62 0.62 0.72 0.62 0.72Gross level of impaired loans, % 1.26 1.29 1.39 1.26 1.39
Basel II (Legal reporting with transitional floor) :****Risk-weighted assets, SEK billion 800 797 795 800 795Core Tier 1 capital ratio, % 11.06 10.80 10.74 11.06 10.74Tier 1 capital ratio, % 12.89 12.65 12.78 12.89 12.78Total capital ratio, % 12.53 12.73 13.50 12.53 13.50
Basel II (without transitional floor):Risk-weighted assets, SEK billion 716 711 730 716 730Core Tier 1 capital ratio, % 12.36 12.11 11.69 12.36 11.69Tier 1 capital ratio, % 14.39 14.18 13.91 14.39 13.91Total capital ratio, % 14.00 14.27 14.69 14.00 14.69
Basel I:Risk-weighted assets, SEK billion 998 984 1 003 998 1 003Core Tier 1 capital ratio, % 8.86 8.75 8.51 8.86 8.51Tier 1 capital ratio, % 10.32 10.25 10.13 10.32 10.13Total capital ratio, % 10.04 10.31 10.70 10.04 10.70
Number of full time equivalents* 19.220 19.150 19.562 19.125 20.233
Assets under custody, SEK billion 5.072 4.879 4.853 5.072 4.853Assets under management, SEK billion 1.399 1.343 1.356 1.399 1.356
Discontinued operations
Basic earnings per share, discontinued operations, SEK -0.04 -0.68 -0.06 -0.81 -0.36Diluted earnings per share, discontinued operations, SEK -0.04 -0.67 -0.06 -0.81 -0.36
**** 80 per cent of RWA in Basel I
* Quarterly numbers are for last month of quarter. Accumulated numbers are average for the period.
Jan - Dec
** The number of issued shares was 2,194,171,802. SEB owned 810,155 Class A shares for the employee stock option programme at year
end 2009. During 2010 SEB has repurchased 600,000 shares and 1,142,795 have been sold as employee stock options have been
exercised. Thus, as at 31 December 2010 SEB owned 267,360 Class A-shares with a market value of SEK 15m.
*** Calculated dilution based on the estimated economic value of the long-term incentive programmes.
=

SEB Fact Book Annual Accounts 2010 10
Income statement
SEB Group
Total
SEK m
Q1
2009
Q2
2009
Q3
2009
Q4
2009
Q1
2010
Q2
2010
Q3
2010
Q4
2010
Full Year
2009
Full Year
2010
Net interest income 5,488 5,029 4,197 3,332 3,542 3,762 4,180 4,526 18,046 16,010
Net fee and commission income 2,944 3,491 3,263 3,587 3,194 3,673 3,387 3,906 13,285 14,160
Net financial income 1,133 1,471 945 939 950 977 727 512 4,488 3,166
Net life insurance income 862 946 857 932 879 778 818 780 3,597 3,255
Net other income 315 1,579 -165 430 170 34 -230 314 2,159 288Total operating income 10,742 12,516 9,097 9,220 8,735 9,224 8,882 10,038 41,575 36,879
Staff costs -3,920 -3,799 -3,282 -2,785 -3,438 -3,616 -3,392 -3,558 -13,786 -14,004
Other expenses -1,465 -1,612 -1,535 -2,128 -1,784 -1,875 -1,679 -1,965 -6,740 -7,303Depreciation, amortisation and impairment of
tangible and intangible assets -1,008 -2,826 -375 -463 -409 -416 -405 -650 -4,672 -1,880
Restructuring costs -755 -9 -764Total operating expenses -6,393 -8,237 -5,192 -5,376 -5,631 -5,907 -6,231 -6,182 -25,198 -23,951
Profit before credit losses 4,349 4,279 3,905 3,844 3,104 3,317 2,651 3,856 16,377 12,928
Gains less losses on disposals of tangible and intangible assets 2 23 3 -24 -4 -3 21 4 14
Net credit losses -2,321 -3,439 -3,206 -3,064 -1,813 -639 196 419 -12,030 -1,837Operating profit 2,030 863 702 756 1,287 2,675 2,847 4,296 4,351 11,105
Income tax expense -838 -865 -446 -333 -452 -600 -765 -704 -2,482 -2,521Net profit from continuing operations 1,192 -2 256 423 835 2,075 2,082 3,592 1,869 8,584
Discontinued operations -165 -168 -219 -139 -146 -71 -1,486 -83 -691 -1,786Net profit 1,027 -170 37 284 689 2,004 596 3,509 1,178 6,798
Attributable to minority interests 2 23 12 27 15 17 15 6 64 53Attributable to equity holders 1,025 -193 25 257 674 1,987 581 3,503 1,114 6,745 =
Share of profit before credit losses
Jan – Dec 2010
8%4%
4%4%
5%
11%
12%
52%
6%
53%
18%
13%
10%
Retail Banking
Wealth Management
Life
Merchant Banking
Geography – Adjusted for Other
Divisions – Adjusted for Other(1 Restructuring costs of SEK 755 m excluded(2 Write-down of IT systems of SEK 199m
SwedenLithuania
LatviaEstonia
Norway
Finland
Denmark
Baltic (2Germany (1
==
SEB Fact Book Annual Accounts 2010 11
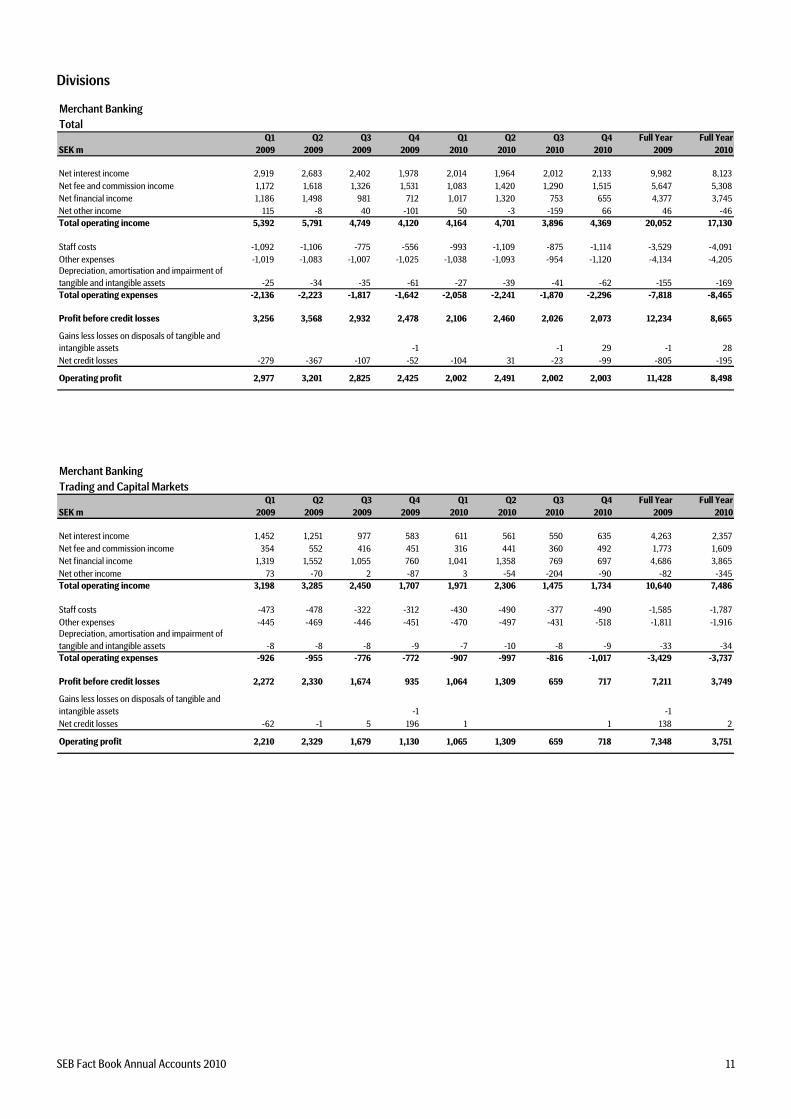
Divisions
Merchant Banking
Total
SEK m
Q1
2009
Q2
2009
Q3
2009
Q4
2009
Q1
2010
Q2
2010
Q3
2010
Q4
2010
Full Year
2009
Full Year
2010
Net interest income 2,919 2,683 2,402 1,978 2,014 1,964 2,012 2,133 9,982 8,123
Net fee and commission income 1,172 1,618 1,326 1,531 1,083 1,420 1,290 1,515 5,647 5,308
Net financial income 1,186 1,498 981 712 1,017 1,320 753 655 4,377 3,745
Net other income 115 -8 40 -101 50 -3 -159 66 46 -46Total operating income 5,392 5,791 4,749 4,120 4,164 4,701 3,896 4,369 20,052 17,130
Staff costs -1,092 -1,106 -775 -556 -993 -1,109 -875 -1,114 -3,529 -4,091
Other expenses -1,019 -1,083 -1,007 -1,025 -1,038 -1,093 -954 -1,120 -4,134 -4,205Depreciation, amortisation and impairment of tangible and intangible assets -25 -34 -35 -61 -27 -39 -41 -62 -155 -169Total operating expenses -2,136 -2,223 -1,817 -1,642 -2,058 -2,241 -1,870 -2,296 -7,818 -8,465
Profit before credit losses 3,256 3,568 2,932 2,478 2,106 2,460 2,026 2,073 12,234 8,665
Gains less losses on disposals of tangible and intangible assets -1 -1 29 -1 28
Net credit losses -279 -367 -107 -52 -104 31 -23 -99 -805 -195
Operating profit 2,977 3,201 2,825 2,425 2,002 2,491 2,002 2,003 11,428 8,498 ====Merchant Banking
Trading and Capital Markets
SEK m
Q1
2009
Q2
2009
Q3
2009
Q4
2009
Q1
2010
Q2
2010
Q3
2010
Q4
2010
Full Year
2009
Full Year
2010
Net interest income 1,452 1,251 977 583 611 561 550 635 4,263 2,357
Net fee and commission income 354 552 416 451 316 441 360 492 1,773 1,609
Net financial income 1,319 1,552 1,055 760 1,041 1,358 769 697 4,686 3,865
Net other income 73 -70 2 -87 3 -54 -204 -90 -82 -345Total operating income 3,198 3,285 2,450 1,707 1,971 2,306 1,475 1,734 10,640 7,486
Staff costs -473 -478 -322 -312 -430 -490 -377 -490 -1,585 -1,787
Other expenses -445 -469 -446 -451 -470 -497 -431 -518 -1,811 -1,916Depreciation, amortisation and impairment of tangible and intangible assets -8 -8 -8 -9 -7 -10 -8 -9 -33 -34Total operating expenses -926 -955 -776 -772 -907 -997 -816 -1,017 -3,429 -3,737
Profit before credit losses 2,272 2,330 1,674 935 1,064 1,309 659 717 7,211 3,749
Gains less losses on disposals of tangible and intangible assets -1 -1
Net credit losses -62 -1 5 196 1 1 138 2
Operating profit 2,210 2,329 1,679 1,130 1,065 1,309 659 718 7,348 3,751 =======

SEB Fact Book Annual Accounts 2010 12
Merchant Banking
Corporate Banking
SEK m
Q1
2009
Q2
2009
Q3
2009
Q4
2009
Q1
2010
Q2
2010
Q3
2010
Q4
2010
Full Year
2009
Full Year
2010
Net interest income 1,094 1,082 1,146 1,117 1,053 1,069 1,130 1,120 4,439 4,372
Net fee and commission income 397 624 456 647 371 550 561 676 2,124 2,158
Net financial income -140 -64 -86 -59 -35 -57 -27 -65 -349 -184
Net other income 24 49 30 -24 33 39 37 141 79 250Total operating income 1,375 1,691 1,546 1,681 1,422 1,601 1,701 1,872 6,293 6,596
Staff costs -436 -447 -299 -134 -401 -455 -348 -463 -1,316 -1,667
Other expenses -221 -239 -218 -250 -249 -252 -205 -198 -928 -904Depreciation, amortisation and impairment of tangible and intangible assets -12 -12 -12 -19 -17 -16 -16 -50 -55 -99Total operating expenses -669 -698 -529 -403 -667 -723 -569 -711 -2,299 -2,670
Profit before credit losses 706 993 1,017 1,278 755 878 1,132 1,161 3,994 3,926
Gains less losses on disposals of tangible and intangible assets -1 29 28
Net credit losses -167 -336 -109 -178 -98 44 -41 -97 -790 -192
Operating profit 539 657 908 1,100 657 922 1,090 1,093 3,204 3,762 ====Merchant Banking
Global Transaction Services
SEK m
Q1
2009
Q2
2009
Q3
2009
Q4
2009
Q1
2010
Q2
2010
Q3
2010
Q4
2010
Full Year
2009
Full Year
2010
Net interest income 373 350 279 278 350 334 331 378 1,280 1,393
Net fee and commission income 421 441 455 433 396 429 369 347 1,750 1,541
Net financial income 7 11 12 10 11 19 12 23 40 65
Net other income 19 12 7 10 14 12 8 15 48 49Total operating income 820 814 753 731 771 794 720 763 3,118 3,048
Staff costs -183 -180 -155 -110 -162 -164 -150 -161 -628 -637
Other expenses -354 -374 -343 -324 -319 -344 -319 -404 -1,395 -1,386Depreciation, amortisation and impairment of tangible and intangible assets -5 -15 -15 -31 -3 -13 -16 -3 -66 -35Total operating expenses -542 -569 -513 -465 -484 -521 -485 -568 -2,089 -2,058
Profit before credit losses 278 245 240 266 287 273 235 195 1,029 990
Gains less losses on disposals of tangible and intangible assets
Net credit losses -50 -30 -3 -70 -7 -13 18 -3 -153 -5
Operating profit 228 215 237 196 280 260 253 192 876 985 =

SEB Fact Book Annual Accounts 2010 13
Retail Banking
Total
SEK m
Q1
2009
Q2
2009
Q3
2009
Q4
2009
Q1
2010
Q2
2010
Q3
2010
Q4
2010
Full Year
2009
Full Year
2010
Net interest income 1,456 1,359 1,331 1,278 1,201 1,212 1,263 1,332 5,424 5,008
Net fee and commission income 790 812 790 862 789 829 774 849 3,254 3,241
Net financial income 72 79 57 84 65 76 58 74 292 273
Net other income 19 10 17 18 9 12 14 12 64 47Total operating income 2,337 2,260 2,195 2,242 2,064 2,129 2,109 2,267 9,034 8,569
Staff costs -675 -673 -623 -571 -654 -656 -683 -643 -2,542 -2,636
Other expenses -643 -714 -646 -665 -638 -734 -660 -789 -2,668 -2,821Depreciation, amortisation and impairment of tangible and intangible assets -20 -28 -23 -22 -21 -21 -21 -21 -93 -84Total operating expenses -1,338 -1,415 -1,292 -1,258 -1,313 -1,411 -1,364 -1,453 -5,303 -5,541
Profit before credit losses 999 845 903 984 751 718 745 814 3,731 3,028
Gains less losses on disposals of tangible and intangible assets -1 -1
Net credit losses -205 -214 -198 -223 -196 -147 -56 -144 -840 -543
Operating profit 794 631 705 761 555 571 688 670 2,891 2,484 ==Retail Banking
Retail Sweden
SEK m
Q1
2009
Q2
2009
Q3
2009
Q4
2009
Q1
2010
Q2
2010
Q3
2010
Q4
2010
Full Year
2009
Full Year
2010
Net interest income 1,235 1,109 1,068 1,017 948 963 1,019 1,095 4,429 4,025
Net fee and commission income 369 357 352 393 385 378 363 397 1,471 1,523Net financial income 72 80 57 84 65 76 58 74 293 273
Net other income 5 4 5 5 4 5 3 5 19 17Total operating income 1,681 1,550 1,482 1,499 1,402 1,422 1,443 1,571 6,212 5,838
Staff costs -488 -486 -442 -424 -458 -464 -488 -468 -1,840 -1,878
Other expenses -487 -548 -490 -526 -490 -546 -506 -624 -2,051 -2,166Depreciation, amortisation and impairment of tangible and intangible assets -9 -16 -12 -11 -11 -13 -11 -14 -48 -49Total operating expenses -984 -1,050 -944 -961 -959 -1,023 -1,005 -1,106 -3,939 -4,093
Profit before credit losses 697 500 538 538 443 399 438 465 2,273 1,745
Gains less losses on disposals of tangible and
intangible assets
Net credit losses -95 -90 -92 -118 -105 -63 -5 -71 -395 -244
Operating profit 602 410 446 420 338 336 433 394 1,878 1,501 ====

SEB Fact Book Annual Accounts 2010 14
Retail Banking
Cards
SEK m
Q1
2009
Q2
2009
Q3
2009
Q4
2009
Q1
2010
Q2
2010
Q3
2010
Q4
2010
Full Year
2009
Full Year
2010
Net interest income 220 250 263 261 253 249 244 236 994 982
Net fee and commission income 415 451 429 468 397 438 403 444 1,763 1,682
Net other income 21 11 18 20 15 16 18 22 70 71Total operating income 656 712 710 749 665 703 665 702 2,827 2,735
Staff costs -187 -187 -181 -148 -196 -192 -195 -175 -703 -758
Other expenses -157 -168 -151 -146 -152 -182 -154 -171 -622 -659Depreciation, amortisation and impairment of tangible and intangible assets -11 -12 -11 -11 -10 -9 -8 -8 -45 -35Total operating expenses -355 -367 -343 -305 -358 -383 -357 -354 -1,370 -1,452
Profit before credit losses 301 345 367 444 307 320 308 348 1,457 1,283
Gains less losses on disposals of tangible and
intangible assets -1 -1
Net credit losses -110 -124 -107 -104 -91 -84 -51 -73 -445 -299
Operating profit 191 221 260 340 216 236 256 275 1,012 983 = Wealth Management
Total
SEK m
Q1
2009
Q2
2009
Q3
2009
Q4
2009
Q1
2010
Q2
2010
Q3
2010
Q4
2010
Full Year
2009
Full Year
2010
Net interest income 190 159 133 116 111 120 118 136 598 485
Net fee and commission income 659 713 730 853 868 939 830 1,115 2,955 3,752
Net financial income 20 16 17 23 18 24 17 30 76 89
Net other income 1 12 1 3 47 7 4 17 58Total operating income 870 900 881 995 997 1,130 972 1,285 3,646 4,384
Staff costs -340 -337 -302 -250 -314 -344 -311 -350 -1,229 -1,319
Other expenses -286 -292 -272 -310 -302 -339 -320 -372 -1,160 -1,333Depreciation, amortisation and impairment of tangible and intangible assets -30 -33 -29 -24 -20 -21 -20 -23 -116 -84Total operating expenses -656 -662 -603 -584 -636 -704 -651 -745 -2,505 -2,736
Profit before credit losses 214 238 278 411 361 426 321 540 1,141 1,648
Gains less losses on disposals of tangible and intangible assets 29 1 -1 29
Net credit losses -8 -12 -8 -1 -2 -1 7 -28 3
Operating profit 206 255 279 402 360 424 320 547 1,142 1,651 ===

SEB Fact Book Annual Accounts 2010 15
Wealth Management
Institutional Clients
SEK m
Q1
2009
Q2
2009
Q3
2009
Q4
2009
Q1
2010
Q2
2010
Q3
2010
Q4
2010
Full Year
2009
Full Year
2010
Net interest income 23 11 13 13 8 13 12 14 60 47
Net fee and commission income 507 529 542 621 641 704 624 865 2,199 2,834
Net financial income 1 2 4 8 3 6 8 10 15 27
Net other income 4 2 3 -1 1 8 4 9 12Total operating income 531 546 561 645 651 724 652 893 2,283 2,920
Staff costs -228 -217 -178 -153 -225 -229 -199 -229 -776 -882
Other expenses -173 -186 -184 -201 -207 -227 -217 -265 -744 -916Depreciation, amortisation and impairment of tangible and intangible assets -23 -26 -23 -20 -14 -15 -15 -17 -92 -61Total operating expenses -424 -429 -385 -374 -446 -471 -431 -511 -1,612 -1,859
Profit before credit losses 107 117 176 271 205 253 221 382 671 1,061
Gains less losses on disposals of tangible and intangible assets 34 -1 33
Net credit losses
Operating profit 107 151 176 270 205 253 221 382 704 1,061 ===
Wealth Management
Private Banking
SEK m
Q1
2009
Q2
2009
Q3
2009
Q4
2009
Q1
2010
Q2
2010
Q3
2010
Q4
2010
Full Year
2009
Full Year
2010
Net interest income 167 148 121 103 102 108 106 122 539 438
Net fee and commission income 151 184 193 228 228 232 203 250 756 913
Net financial income 19 15 12 15 15 18 9 20 61 62
Net other income 1 7 2 2 46 10 48Total operating income 338 354 326 348 347 404 318 392 1,366 1,461
Staff costs -111 -121 -124 -96 -89 -115 -112 -121 -452 -437
Other expenses -113 -106 -93 -106 -96 -110 -100 -108 -418 -414Depreciation, amortisation and impairment of
tangible and intangible assets -7 -6 -6 -6 -6 -6 -6 -5 -25 -23Total operating expenses -231 -233 -223 -208 -191 -231 -218 -234 -895 -874
Profit before credit losses 107 121 103 140 156 173 100 158 471 587
Gains less losses on disposals of tangible and
intangible assets -5 -5
Net credit losses -8 -12 -8 -1 -2 -1 7 -28 3
Operating profit 99 104 103 132 155 171 99 165 438 590

SEB Fact Book Annual Accounts 2010 16
Life
Total
SEK m
Q1
2009
Q2
2009
Q3
2009
Q4
2009
Q1
2010
Q2
2010
Q3
2010
Q4
2010
Full Year
2009
Full Year
2010
Net interest income -10 -5 -2 -1 -2 -2 -2 -5 -18 -11
Net life insurance income 1,043 1,148 1,107 1,145 1,186 1,115 1,143 1,106 4,443 4,550Total operating income 1,033 1,143 1,105 1,144 1,184 1,113 1,141 1,101 4,425 4,539
Staff costs -274 -299 -271 -263 -282 -287 -276 -278 -1,107 -1,123
Other expenses -126 -146 -120 -144 -131 -135 -133 -125 -536 -524Depreciation, amortisation and impairment of
tangible and intangible assets -165 -177 -158 -167 -173 -172 -169 -176 -667 -690Total operating expenses -565 -622 -549 -574 -586 -594 -578 -579 -2,310 -2,337
Profit before credit losses 468 521 556 570 598 519 563 522 2,115 2,202
Operating profit * 468 521 556 570 598 519 563 522 2,115 2,202
Change in surplus values 111 395 224 170 229 191 400 345 900 1,165
Business result 579 916 780 740 827 710 963 867 3,015 3,367
* Consolidated in the Group accounts ==Baltic
Total
SEK m
Q1
2009
Q2
2009
Q3
2009
Q4
2009
Q1
2010
Q2
2010
Q3
2010
Q4
2010
Full Year
2009
Full Year
2010
Net interest income 778 751 628 522 490 456 442 481 2,679 1,869
Net fee and commission income 238 248 227 221 209 226 229 213 934 877
Net financial income 37 23 35 31 26 36 8 -7 126 63
Net other income 12 -8 -6 57 4 2 21 10 55 37Total operating income 1,065 1,014 884 831 729 720 700 697 3,794 2,846
Staff costs -220 -197 -176 -137 -179 -161 -155 -145 -730 -640
Other expenses -336 -345 -307 -464 -304 -285 -286 -283 -1,452 -1,158Depreciation, amortisation and impairment of tangible and intangible assets -25 -2,328 -15 -21 -20 -19 -18 -234 -2,389 -291Total operating expenses -581 -2,870 -498 -622 -503 -465 -459 -662 -4,571 -2,089
Profit before credit losses 484 -1,856 386 209 226 255 241 35 -777 757
Gains less losses on disposals of tangible and intangible assets 2 -6 3 -16 -1 -4 -17 -5
Net credit losses -1,702 -2,641 -2,642 -2,584 -1,431 -451 273 736 -9,569 -873
Operating profit -1,216 -4,503 -2,253 -2,391 -1,205 -197 514 767 -10,363 -121 ==
=

SEB Fact Book Annual Accounts 2010 17
Baltic
Baltic Estonia
SEK m
Q1
2009
Q2
2009
Q3
2009
Q4
2009
Q1
2010
Q2
2010
Q3
2010
Q4
2010
Full Year
2009
Full Year
2010
Net interest income 252 238 226 200 154 140 136 150 916 580
Net fee and commission income 78 83 79 75 72 73 70 66 315 281
Net financial income 9 -4 7 18 9 10 -4 -22 30 -7
Net other income 6 -12 -6 45 3 3 2 10 33 18Total operating income 345 305 306 338 238 226 204 204 1,294 872
Staff costs -61 -57 -56 -35 -64 -51 -50 -36 -209 -201
Other expenses -100 -90 -92 -210 -108 -87 -86 -67 -492 -348Depreciation, amortisation and impairment of tangible and intangible assets -5 -679 -2 -7 -4 -4 -3 -6 -693 -17Total operating expenses -166 -826 -150 -252 -176 -142 -139 -109 -1,394 -566
Profit before credit losses 179 -521 156 86 62 84 65 95 -100 306
Gains less losses on disposals of tangible and intangible assets 1 1
Net credit losses -232 -454 -212 -297 -151 -108 10 162 -1,195 -87
Operating profit -53 -975 -56 -211 -89 -24 75 258 -1,295 220 ====Baltic
Baltic Latvia
SEK m
Q1
2009
Q2
2009
Q3
2009
Q4
2009
Q1
2010
Q2
2010
Q3
2010
Q4
2010
Full Year
2009
Full Year
2010
Net interest income 242 256 212 140 151 148 138 144 850 581
Net fee and commission income 56 53 55 48 46 47 48 47 212 188
Net financial income 11 11 8 2 6 6 8 11 32 31
Net other income -1 -2 -5 6 2 1 1 -2 4Total operating income 308 318 270 196 205 202 195 202 1,092 804
Staff costs -62 -56 -49 -44 -48 -47 -46 -60 -211 -201
Other expenses -109 -102 -93 -101 -80 -68 -69 -99 -405 -316Depreciation, amortisation and impairment of tangible and intangible assets -10 -415 -8 -9 -8 -7 -8 -9 -442 -32Total operating expenses -181 -573 -150 -154 -136 -122 -123 -168 -1,058 -549
Profit before credit losses 127 -255 120 42 69 80 72 34 34 255
Gains less losses on disposals of tangible and intangible assets -1 -1 -5 -1 -6
Net credit losses -684 -917 -941 -586 -574 -170 109 275 -3,128 -360
Operating profit -557 -1,172 -821 -545 -505 -91 181 304 -3,095 -111 =

SEB Fact Book Annual Accounts 2010 18
Baltic
Baltic Lithuania
SEK m
Q1
2009
Q2
2009
Q3
2009
Q4
2009
Q1
2010
Q2
2010
Q3
2010
Q4
2010
Full Year
2009
Full Year
2010
Net interest income 283 257 190 184 185 169 167 188 914 709
Net fee and commission income 104 112 93 97 91 105 112 100 406 408Net financial income 17 16 19 12 11 20 4 4 64 39
Net other income 7 6 6 5 -1 -3 19 -1 24 14Total operating income 411 391 308 298 286 291 302 291 1,408 1,170
Staff costs -97 -84 -70 -60 -67 -63 -59 -49 -311 -238
Other expenses -126 -153 -123 -152 -116 -129 -132 -117 -554 -494Depreciation, amortisation and impairment of tangible and intangible assets -10 -1,234 -4 -6 -8 -8 -7 -219 -1,254 -242Total operating expenses -233 -1,471 -197 -218 -191 -200 -198 -385 -2,119 -974
Profit before credit losses 178 -1,080 111 80 95 91 104 -94 -711 196
Gains less losses on disposals of tangible and
intangible assets 2 -5 3 -16 -16
Net credit losses -786 -1,270 -1,489 -1,701 -706 -173 154 299 -5,246 -426
Operating profit -606 -2,355 -1,375 -1,637 -611 -82 258 205 -5,973 -230 Other and eliminations
Total
SEK m
Q1
2009
Q2
2009
Q3
2009
Q4
2009
Q1
2010
Q2
2010
Q3
2010
Q4
2010
Full Year
2009
Full Year
2010
Net interest income 155 82 -295 -561 -272 12 347 449 -619 536
Net fee and commission income 85 100 190 120 245 259 264 214 495 982
Net financial income -182 -145 -145 89 -176 -479 -109 -240 -383 -1,004
Net life insurance income -181 -202 -250 -213 -307 -337 -325 -326 -846 -1,295
Net other income 168 1,573 -217 453 107 -24 -113 222 1,977 192Total operating income 45 1,408 -717 -112 -403 -569 64 319 624 -589
Staff costs -1,319 -1,187 -1,135 -1,008 -1,016 -1,059 -1,092 -1,028 -4,649 -4,195
Other expenses 945 968 817 480 629 711 674 724 3,210 2,738Depreciation, amortisation and impairment of
tangible and intangible assets -743 -226 -115 -168 -148 -144 -136 -134 -1,252 -562Restructuring costs -755 -9 -764Total operating expenses -1,117 -445 -433 -696 -535 -492 -1,309 -447 -2,691 -2,783
Profit before credit losses -1,072 963 -1,150 -808 -938 -1,061 -1,245 -128 -2,067 -3,372
Gains less losses on disposals of tangible and
intangible assets -1 -6 -4 -2 2 -4 -7 -8
Net credit losses -127 -205 -259 -197 -81 -70 3 -81 -788 -229
Operating profit -1,199 758 -1,410 -1,011 -1,023 -1,133 -1,240 -213 -2,862 -3,609

SEB Fact Book Annual Accounts 2010 19
By geography
Sweden
SEK m
Q 1
2009
Q 2
2009
Q 3
2009
Q4
2009
Q1
2010
Q 2
2010
Q 3
2010
Q4
2010
Full year
2009
Full year
2010
Total operating income 5,674 7,539 4,992 4,891 4,823 5,191 4,933 5,671 23,096 20,618
Total operating expenses -4,412 -4,839 -3,015 -2,935 -3,484 -3,734 -3,409 -3,670 -15,201 -14,297
Profit before credit losses 1,262 2,700 1,977 1,956 1,339 1,457 1,524 2,001 7,895 6,321
Gains less losses on disposals of tangible and intangible assets
Net credit losses -285 -451 -139 -260 -192 -13 3 -126 -1,135 -328
Operating profit 977 2,249 1,838 1,696 1,147 1,444 1,527 1,875 6,760 5,993
Norway
SEK m
Q 1
2009
Q 2
2009
Q 3
2009
Q4
2009
Q1
2010
Q 2
2010
Q 3
2010
Q4
2010
Full year
2009
Full year
2010
Total operating income 937 966 896 850 726 721 649 749 3,649 2,845
Total operating expenses -306 -372 -393 -236 -335 -305 -301 -374 -1,307 -1,315
Profit before credit losses 631 594 503 614 391 416 348 375 2,342 1,530
Gains less losses on disposals of tangible and intangible assets
Net credit losses -72 -73 -44 -28 -51 -37 -24 -31 -217 -143
Operating profit 559 521 459 586 340 379 324 344 2,125 1,387
Denmark
SEK m
Q 1
2009
Q 2
2009
Q 3
2009
Q4
2009
Q1
2010
Q 2
2010
Q 3
2010
Q4
2010
Full year
2009
Full year
2010
Total operating income 801 798 752 785 724 842 731 723 3,136 3,020
Total operating expenses -399 -453 -368 -323 -380 -422 -364 -440 -1,543 -1,606
Profit before credit losses 402 345 384 462 344 420 367 283 1,593 1,414
Gains less losses on disposals of tangible and intangible assets
Net credit losses -45 -36 -30 -70 -26 -22 -31 -37 -181 -116
Operating profit 357 309 354 392 318 398 336 246 1,412 1,298
Finland
SEK m
Q 1
2009
Q 2
2009
Q 3
2009
Q4
2009
Q1
2010
Q 2
2010
Q 3
2010
Q4
2010
Full year
2009
Full year
2010
Total operating income 372 201 246 374 254 350 319 349 1,193 1,272
Total operating expenses -99 -159 -120 -196 -101 -158 -150 -183 -574 -592
Profit before credit losses 273 42 126 178 153 192 169 166 619 680
Gains less losses on disposals of tangible and
intangible assets -1 -1
Net credit losses -12 -5 -8 -2 -3 -10 -2 -27 -15
Operating profit 261 37 118 176 150 182 168 164 592 664
Germany*
SEK m
Q 1
2009
Q 2
2009
Q 3
2009
Q4
2009
Q1
2010
Q 2
2010
Q 3
2010
Q4
2010
Full year
2009
Full year
2010
Total operating income 793 899 692 735 669 787 742 760 3,119 2,958
Total operating expenses -520 -486 -493 -563 -475 -486 -1,236 -500 -2,062 -2,697
Profit before credit losses 273 413 199 172 194 301 -494 260 1,057 261
Gains less losses on disposals of tangible and intangible assets -1 -3 -2 29 -4 27
Net credit losses -36 -87 -93 -90 -41 -35 -24 -43 -306 -143
Operating profit 237 326 105 79 153 266 -520 246 747 145
*Excluding centralised Treasury operations
Restructuring costs amounted to EUR 80m in Q3 2010.
Goodwill impairments for holdings in the Baltic region, Russia and Ukraine affect operating expenses and profit by SEK 1.5bn in Q2 and 0.6bn in Q1 2009.

SEB Fact Book Annual Accounts 2010 20
Estonia
SEK m
Q 1
2009
Q 2
2009
Q 3
2009
Q4
2009
Q1
2010
Q 2
2010
Q 3
2010
Q4
2010
Full year
2009
Full year
2010
Total operating income 370 319 343 388 315 299 283 290 1,420 1,187
Total operating expenses -202 -439 -167 -267 -197 -157 -153 -125 -1,075 -632
Profit before credit losses 168 -120 176 121 118 142 130 165 345 555
Gains less losses on disposals of tangible and intangible assets -1 1 1 1
Net credit losses -232 -454 -212 -297 -151 -108 10 162 -1,195 -87
Operating profit -64 -575 -35 -176 -33 34 140 328 -850 469
Goodwill impairment affected operating expenses and profit by SEK 0.3bn in Q2 2009.
Latvia
SEK m
Q 1
2009
Q 2
2009
Q 3
2009
Q4
2009
Q1
2010
Q 2
2010
Q 3
2010
Q4
2010
Full year
2009
Full year
2010
Total operating income 467 453 436 313 297 236 260 273 1,669 1,066
Total operating expenses -209 -208 -168 -180 -141 -137 -140 -183 -765 -601
Profit before credit losses 258 245 268 133 156 99 120 90 904 465
Gains less losses on disposals of tangible and intangible assets -1 -1 -5 -1 -6
Net credit losses -684 -917 -941 -586 -574 -170 109 275 -3,128 -360
Operating profit -426 -673 -673 -453 -418 -72 229 360 -2,225 99
Lithuania
SEK m
Q 1
2009
Q 2
2009
Q 3
2009
Q4
2009
Q1
2010
Q 2
2010
Q 3
2010
Q4
2010
Full year
2009
Full year
2010
Total operating income 545 430 393 313 322 357 351 350 1,681 1,380
Total operating expenses -265 -839 -225 -292 -211 -224 -223 -408 -1,621 -1,066
Profit before credit losses 280 -409 168 21 111 133 128 -58 60 314
Gains less losses on disposals of tangible and
intangible assets 2 -5 2 -16 -17
Net credit losses -786 -1,270 -1,489 -1,705 -706 -173 154 299 -5,250 -426
Operating profit -504 -1,684 -1,319 -1,700 -595 -40 282 241 -5,207 -112
Goodwill impairment affected operating expenses and profit by SEK 0.6bn in Q2 2009.
Other countries and eliminations
SEK m
Q 1
2009
Q 2
2009
Q 3
2009
Q4
2009
Q1
2010
Q 2
2010
Q 3
2010
Q4
2010
Full year
2009
Full year
2010
Total operating income 783 911 347 571 605 441 614 873 2,612 2,533
Total operating expenses 19 -442 -243 -384 -307 -284 -255 -299 -1,050 -1,145
Profit before credit losses 802 469 104 187 298 157 359 574 1,562 1,388
Gains less losses on disposals of tangible and intangible assets 30 1 -5 -4 -2 3 -4 26 -7
Net credit losses -169 -146 -250 -26 -69 -71 -1 -78 -591 -219
Operating profit 633 353 -145 156 225 84 361 492 997 1,162
SEB Group Total
SEK m
Q 1
2009
Q 2
2009
Q 3
2009
Q4
2009
Q1
2010
Q 2
2010
Q 3
2010
Q4
2010
Full year
2009
Full year
2010
Total operating income 10,742 12,516 9,097 9,220 8,735 9,224 8,882 10,038 41,575 36,879
Total operating expenses -6,393 -8,237 -5,192 -5,376 -5,631 -5,907 -6,231 -6,182 -25,198 -23,951
Profit before credit losses 4,349 4,279 3,905 3,844 3,104 3,317 2,651 3,856 16,377 12,928
Gains less losses on disposals of tangible and
intangible assets 2 23 3 -24 -4 -3 21 4 14
Net credit losses -2,321 -3,439 -3,206 -3,064 -1,813 -639 196 419 -12,030 -1,837
Operating profit 2,030 863 702 756 1,287 2,675 2,847 4,296 4,351 11,105

SEB Fact Book Annual Accounts 2010 21
Net interest income
SEB Group, SEK m
Q1 Q2 Q3 Q4 Q1 Q2 Q3 Q4 Full year Full year
SEK m 2009 2009 2009 2009 2010 2010 2010 2010 2009 2010
Interest income 18,584 15,090 12,901 11,529 11,307 11,337 11,744 11,653 58,104 46,041
Interest expense -13,096 -10,061 -8,704 -8,197 -7,765 -7,575 -7,564 -7,127 -40,058 -30,031
Net interest income 5,488 5,029 4,197 3,332 3,542 3,762 4,180 4,526 18,046 16,010
NII specification and development
SEB Group, SEK m
Q1
2009
Q2
2009
Q3
2009
Q4
2009
Q1
2010
Q2
2010
Q3
2010
Q4
2010
Start 5,070 5,488 5,029 4,197 3,332 3,542 3,762 4,180Lending volume 77 5 -139 -74 -6 11 -41 73Lending margin 186 155 109 27 -44 5 71 -71Deposit volume 44 -23 -48 -10 -16 11 8 15Deposit margin -269 -102 -233 -136 -102 -46 46 95Funding & other 380 -495 -520 -673 377 238 333 234Sum 5,488 5,029 4,197 3,332 3,542 3,762 4,180 4,526
Restated for Retail Germany divestment. =
Net interest income analysis
SEB Group, SEK m
18,046
-427
-116
-1,362
-506
375
16,010
Jan-Dec 2009
Lending margin
Lending volume
Deposit margin
Deposit volume
Funding & other
Jan-Dec 2010 4,526
234
95
4,180
73
15
-71
Q3 2010
Lending margin
Lending volume
Deposit margin
Deposit volume
Funding & other
Q4 2010 4,526
3,332
-47
1,184
20
-8
45
Q4 2009
Lending margin
Lending volume
Deposit margin
Deposit volume
Funding & other
Q4 2010
Q4 2010 vs. Q4 2009Q4 2010 vs. Q3 2010Jan-Dec 2010 vs. Jan-Dec 2009
Net interest and Net fee and commission income
SEB Group, SEK m
0
1,000
2,000
3,000
4,000
5,000
6,000
Q1-
06
Q2-
06
Q3-
06
Q4-
06
Q1-
07
Q2-
07
Q3-
07
Q4-
07
Q1-
08
Q2-
08
Q3-
08
Q4-
08
Q1-
09
Q2-
09
Q3-
09
Q4-
09
Q1-
10
Q2-
10
Q3-
10
Q4-
10
Net interest income Net fee and commissions

SEB Fact Book Annual Accounts 2010 22
Net fee and commission income
SEB Group
SEK m
Q1
2009
Q2
2009
Q3
2009
Q4
2009
Q1
2010
Q2
2010
Q3
2010
Q4
2010
Full Year
2009
Full Year
2010
Issue of securities 35 168 99 199 45 124 20 168 501 357
Secondary market 491 639 525 519 426 419 374 546 2,174 1,765
Custody and mutual funds 1,289 1,380 1,427 1,560 1,667 1,805 1,675 1,920 5,656 7,067
Securities commissions 1,815 2,187 2,051 2,278 2,138 2,348 2,069 2,634 8,331 9,189
Payments 403 407 408 415 394 408 387 372 1,633 1,561
Card fees 1,027 1,074 1,034 1,068 989 1,038 1,021 944 4,203 3,992
Payment commissions 1,430 1,481 1,442 1,483 1,383 1,446 1,408 1,316 5,836 5,553
Advisory 118 160 157 215 64 96 185 137 650 482
Lending 335 351 356 351 336 448 440 462 1,393 1,686
Deposits 28 27 27 26 26 26 25 26 108 103
Guarantees 95 99 114 105 112 108 103 105 413 428
Derivatives 159 153 130 114 134 157 110 117 556 518
Other 170 176 161 201 148 207 179 178 708 712
Other commissions 905 966 945 1,012 820 1,042 1,042 1,025 3,828 3,929
Total commission income 4,150 4,634 4,438 4,773 4,341 4,836 4,519 4,975 17,995 18,671
Securities commissions -226 -183 -241 -194 -290 -297 -288 -341 -844 -1,216
Payment commissions -630 -594 -588 -601 -587 -609 -599 -450 -2,413 -2,245
Other commissions -350 -366 -346 -391 -270 -257 -245 -278 -1,453 -1,050
Commission expense -1,206 -1,143 -1,175 -1,186 -1,147 -1,163 -1,132 -1,069 -4,710 -4,511
Securities commissions 1,589 2,004 1,810 2,084 1,848 2,051 1,781 2,293 7,487 7,973
Payment commissions 800 887 854 882 796 837 809 866 3,423 3,308
Other commissions 555 600 599 621 550 785 797 747 2,375 2,879
Net fee and commission income 2,944 3,491 3,263 3,587 3,194 3,673 3,387 3,906 13,285 14,160
Net financial income
SEB Group
SEK m
Q1
2009
Q2
2009
Q3
2009
Q4
2009
Q1
2010
Q2
2010
Q3
2010
Q4
2010
Full Year
2009
Full Year
2010
Equity instruments and related derivatives 95 -166 -40 47 138 334 188 -31 -64 629
Debt instruments and related derivatives 58 568 -33 210 327 205 17 -70 803 479Currency related 1,041 1,127 1,059 684 495 506 500 605 3,911 2,106Other financial instruments 3 -2 -12 7 2 -14 20 4 -4 12
Impairments -64 -56 -29 -9 -12 -54 2 4 -158 -60
Net financial income 1,133 1,471 945 939 950 977 727 512 4,488 3,166 =Note that Net financial income does not reflect the full income from the Trading operations which distribution can be found on page 49.

SEB Fact Book Annual Accounts 2010 23
Fee and commission income
SEB Group
Gross quarterly development Q1 2006 – Q4 2010, SEK m
0
500
1,000
1,500
2,000
2,500
New issues & advisory Secondary market &derivatives
Custody & mutual funds Payments, cards, structuredlending, deposits, guarantees
and other
Deal driven
Securitiestransaction
driven
Value driven –performance
driven
*
* Q2 2006 adjusted for gross commission on security lending, SEK 200m
Impact from exchange rate fluctuations
SEK/EUR Period-End SEK/USD Period-End
SEK m Q4-10/Q4-09 Q4-10/Q3-10 YTD-10/YTD-09
Total income -483 -99 -1,538
Total expenses 291 59 983
Net credit losses -78 -8 142
Operating profit -272 -49 -415
SEK bn Dec-10/Dec-09
Loans to the public -75
Deposits from the public -53
RWA - Basel II -45
Total assets -154
5.50
6.00
6.50
7.00
7.50
8.00
8.50
9.00
9.50
Jan-09 Apr Jul Oct Jan-10 Apr Jul Oct Dec
8.00
8.50
9.00
9.50
10.00
10.50
11.00
11.50
12.00
Jan-09 Apr Jul Oct Jan-10 Apr Jul Oct Dec
Δ 2010 +6%Δ 2009 +7%Δ 2010 +12%Δ 2009 +6%
SEB Fact Book Annual Accounts 2010 24
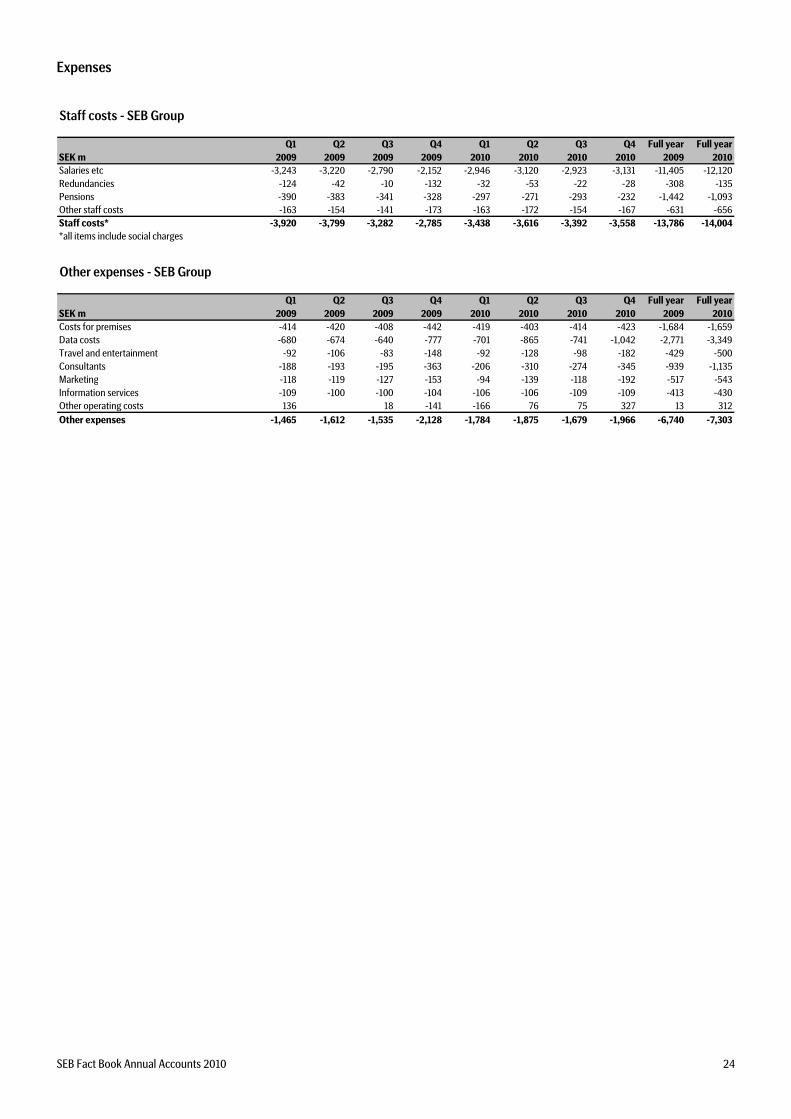
Expenses
=Staff costs - SEB Group
Q1 Q2 Q3 Q4 Q1 Q2 Q3 Q4 Full year Full year
SEK m 2009 2009 2009 2009 2010 2010 2010 2010 2009 2010
Salaries etc -3,243 -3,220 -2,790 -2,152 -2,946 -3,120 -2,923 -3,131 -11,405 -12,120Redundancies -124 -42 -10 -132 -32 -53 -22 -28 -308 -135Pensions -390 -383 -341 -328 -297 -271 -293 -232 -1,442 -1,093Other staff costs -163 -154 -141 -173 -163 -172 -154 -167 -631 -656Staff costs* -3,920 -3,799 -3,282 -2,785 -3,438 -3,616 -3,392 -3,558 -13,786 -14,004
*all items include social charges ==Other expenses - SEB Group
Q1 Q2 Q3 Q4 Q1 Q2 Q3 Q4 Full year Full year
SEK m 2009 2009 2009 2009 2010 2010 2010 2010 2009 2010
Costs for premises -414 -420 -408 -442 -419 -403 -414 -423 -1,684 -1,659Data costs -680 -674 -640 -777 -701 -865 -741 -1,042 -2,771 -3,349Travel and entertainment -92 -106 -83 -148 -92 -128 -98 -182 -429 -500Consultants -188 -193 -195 -363 -206 -310 -274 -345 -939 -1,135Marketing -118 -119 -127 -153 -94 -139 -118 -192 -517 -543Information services -109 -100 -100 -104 -106 -106 -109 -109 -413 -430Other operating costs 136 18 -141 -166 76 75 327 13 312
Other expenses -1,465 -1,612 -1,535 -2,128 -1,784 -1,875 -1,679 -1,966 -6,740 -7,303 =

SEB Fact Book Annual Accounts 2010 25
Balance sheet structure & funding
Activity based balance sheet
AssetsSEK m
Dec
2009
Dec
2010
Cash and cash balances with central banks 36,589 46,488
Lending 218,700 132,846
Repos 42,324 30,885
Reclassified bonds 70,436 40,457
Loans to credit institutions 331,460 204,188
Public 100,661 76,109
Private Individuals 460,204 388,263
Corporate 510,431 508,835
Repos 61,638 63,449
Reclassifed bonds 54,903 38,223
Loans to the public 1,187,837 1,074,879
Debt instruments 148,521 165,516
Equity instruments 39,403 56,275
Derivatives 147,462 131,058
Insurance assets 246,255 264,897
Financial assets at fair value 581,641 617,746
Debt instruments 85,538 64,135
Other 2,410 2,835
Available-for-sale financial assets 87,948 66,970
Assets held for sale* 596 74,951
Tangible and intangible assets 27,770 27,035
Other assets 54,386 67,564
Total assets 2,308,227 2,179,821
LiabilitiesSEK m
Dec
2009
Dec
2010
Central banks 122,413 31,714
Credit institutions 244,572 165,105
Repos 30,448 15,805
Deposits from credit institutions 397,433 212,624
Public 46,802 54,866
Private Individuals 214,819 175,933
Corporate 509,313 470,557
Repos 30,154 10,185
Deposits and borrowing from the public 801,088 711,541
Liabilities to policyholders 249,009 263,970
CP/CD 93,381 180,521
Long term debt 362,662 349,962
Debt securities 456,043 530,483
Debt instruments 47,002 44,798
Equity instruments 14,527 33,670
Derivatives 129,911 122,222
Financial liabilities at fair value 191,440 200,690
Liabilities held for sale* 165 48,339
Other liabilities 77,017 87,079
Subordinated liabilities 36,363 25,552
Total liabilities 2,208,558 2,080,278
Total equity 99,669 99,543
Total liabilities and equity 2,308,227 2,179,821
* German Retail Operations

SEB Fact Book Annual Accounts 2010 26
A strong balance sheet structure, December 2010 Funding structure by product
SEB Group, SEK 1,402bn, Dec 2010
Assets Equity & Liabilities
Funding <1 year
Funding, remaining maturity
>1 year
Cash & LendingFinancial Institutions
Deposits from the General Public
Corporate and Public
Lending
Net Bond portfolio
Equity
Liquid assets
Stable funding
Short-term funding
“Banking book”
Net other trading
Deposits from Financial Institutions
Retail LendingCorporate
deposits
30%
CPs/CDs
13%
Private Individual deposits
13%Financial Institution deposits
12%
Public entity deposits
4%
Central Bank deposits
2%
Mortgage Cov Bonds
SEB AB 14%
Mortgage Cov Bonds
SEB AG 2%
Subordinated debt
2%
Senior Debt
8%
=
Funding raised with original maturity > 1 year, SEK bn
Instrument
Full year
2008
Full year
2009
Q1
2010
Q2
2010
Q3
2010
Q4
2010
Full year
2010
Yankee CD 5.9 3.1 0.0 1.2 1.4 0.3 2.9
Senior unsecured SEB AG 2.0 5.2 0.1 0.0 0.0 0.3 0.4
Senior unsecured SEB AB 37.4 60.4 3.7 0.0 6.9 3.4 13.9
Structured bonds 13.4 8.3 1.1 1.8 0.3 0.0 3.2
Covered bonds SEB AG 29.7 24.4 3.7 0.2 6.8 0.0 10.7
Covered bonds SEB AB 72.9 25.7 0.0 22.9 16.6 31.5 71.0
Hybrid tier 1 4.7 3.3 0.0 0.0 0.0 0.0 0.0
Total 166.0 130.4 8.6 26.1 31.8 35.5 102.1 = ==
Net liquidity position
SEB’s matched funding horizonMonths
0
5
10
15
20
25
Q1
-08
Q2
-08
Q3
-08
Q4
-08
Q1
-09
Q2
-09
Q3
-09
Q4
-09
Q1
-10
Q2
-10
Q3
-10
Q4
-10=
Note this is a cash flow based model where assets and liabilities are mapped to contractual maturities. SEB will manage more than 18 months
without any new funding if the loans and liabilities mature without prolongation. Not ongoing business if funding is disturbed or lending increases.

SEB Fact Book Annual Accounts 2010 27
Long-term funding Maturity profile, Dec 2010
By product, SEK bn
0
10
20
30
40
50
60
70
80
90
100
<1Y 1-2Y 2-3Y 3-4Y 4-5Y 5-7Y 7-10Y >10Y
Mortgage pfandbriefe, SEB AG
Covered bonds SEK, SEB AB
Covered bonds non SEK, SEB AB
Senior unsecured
Subordinated debt
Product <1Y 1-2Y 2-3Y 3-4Y 4-5Y 5-7Y 7-10Y >10Y Total
Subordinated debt 2.4 4.5 0.0 2.7 8.1 4.5 0.0 1.2 23
Senior unsecured 39.5 25.5 7.9 22.8 8.8 7.3 5.1 2.1 119
Covered bonds non SEK, SEB AB 22.4 0.0 10.1 8.9 9.7 8.9 0.2 0.2 61
Covered bonds SEK, SEB AB 32.6 34.7 27.5 16.1 18.8 0.0 0.0 8.4 138
Mortgage pfandbriefe, SEB AG 1.4 4.4 3.3 1.1 1.9 3.9 9.8 5.8 32
Total 98 69 49 52 47 25 15 18 373
Long-term funding Maturity profile, Dec 2010
By currency, SEK bn
Currency <1Y 1-2Y 2-3Y 3-4Y 4-5Y 5-7Y 7-10Y >10Y Total
SEK 44.8 37.6 31.9 18.8 19.4 3.3 0.0 8.4 164
EUR 49.0 28.5 14.8 21.8 23.7 21.3 15.1 6.9 181
USD 0.0 0.0 0.2 2.7 2.8 0.0 0.0 1.2 7
GBP 2.1 0.0 0.0 7.8 0.0 0.0 0.0 0.0 10
JPY 0.4 0.0 0.0 0.0 0.8 0.0 0.0 1.2 2
CHF 1.1 0.0 0.0 0.0 0.0 0.0 0.0 0.0 1
NOK 0.4 2.9 1.8 0.6 0.7 0.0 0.0 0.0 6
LTL 0.5 0.1 0.2 0.0 0.0 0.0 0.0 0.0 1
Total 98 69 49 52 47 25 15 18 373
0
10
20
30
40
50
60
70
80
90
100
<1Y 1-2Y 2-3Y 3-4Y 4-5Y 5-7Y 7-10Y >10Y
SEK EUR USD GBP JPY CHF NOK

SEB Fact Book Annual Accounts 2010 28
Loan to deposit ratio excl repos and reclassified bonds
115%
120%
125%
130%
135%
140%
145%
150%
2002 2004 2006 2008 2010
139%
Total loans and deposits
SEK bn
Q1
2009
Q2
2009
Q3
2009
Q4
2009
Q1
2010
Q2
2010
Q3
2010
Q4
2010
Loans to the public 1,317 1,305 1,207 1,188 1,204 1,226 1,089 1,075
Less repos 74 96 68 62 103 133 89 63
Less reclassified bonds 70 67 58 55 48 46 41 38
Loans adjusted for repos and reclassified bonds 1,174 1,142 1,081 1,072 1,053 1,047 958 973
Deposits and borrow from the public 836 823 753 801 740 759 717 712
Less repos 13 26 22 30 21 22 24 10
Deposits adjusted for repos 822 798 731 771 719 737 693 701
Loan to deposit ratio excl reclassified bonds and repos 143% 143% 148% 139% 146% 142% 138% 139%

SEB Fact Book Annual Accounts 2010 29
SEB AB Covered bonds
Characteristics of the Cover Pool
December 2010
Loans originated by Skandinaviska Enskilda Banken AB (publ)
Pool type / Pool notional Dynamic / SEK 297bn
Type of loans 100% residential Swedish mortgages
Single family 62%
Tenant owned apartments 24%
Multi family 14%
Geographic loan distribution A concentration to urban areas
67% in the three largest cities
Substitute assets No substitute assets are included
Number of loans / Number of borrowers 511 K / 333 K
WA loan balance SEK 582 K
WA LTV 45%
LTV distribution 0 <=40% 47%
>40<=50% 14%
>50<=60% 12%
>60<=70% 11%
>70<=75% 17%
Interest rate type Floating rate 71%
Fixed reset <2yrs 17%
Fixed rate reset 2yrs <5yrs 10%
Fixed rate reset => 5yrs 1%
Payment frequency Monthly 83%
Quarterly 17%
Prior ranks No prior ranks 95%
Prior ranks of value
<25% of value 4%
>25%<50% of value 1%
Loans past due 60 days 0.0882%
Net credit losses ( = aggregated net of write-backs, write-offs and gross provisions) 0.0082%
Foreclosure 0.0151%
Characteristics of the Covered Bonds
Rating Aaa by Moody's
Notional amount outstanding SEK 207bn
Overcollateralization 43%
Currencies 71% SEK
29% non-SEK =

SEB Fact Book Annual Accounts 2010 30
Capital adequacy and RWA
Capital adequacy, SEB Group
7.58.2
9.9 10.1
13.9 14.2
8.4 8.6
11.712.2
13.814.7
12.812.6
11.510.8
Dec 2005 Dec 2006 Dec 2007 Dec 2008 Dec 2009 Dec 2010
Total capital ratio, %
Tier 1 capital ratio, %
Core Tier 1 (from 2007)
SEK bn
Capital base 76.3 84.9 93.0 104.7 107.3 99.1
Risk-w. Assets 704 741 737 818 730 716
Basel II
(without transition rules)
Target: A Tier 1 capital ratio of 10% over the business cycle
Note: In order to improve quality, capital management in 2010 has focused on shifting the capital base from Tier 2 to Tier 1. The end effect, when combined with certain deductions to be made from the total capital resources, is that Tier 1 capital becomes larger than the capital base.
SEB Group - Basel II without transitional rules
Risk-weighted assets
SEK bn
4
730
716
45
11 16
Dec 2009
Dec 2010
Migration
Market and OperationalRisk
FX effects
-15
-10
-5
0
5
10
15
20
25
Q1
2008
Q2
2008
Q3
2008
Q4
2008
Q1
2009
Q2
2009
Q3
2009
Q4
2009
Q1
2010
Q2
2010
Q3
2010
Q4
2010
Risk class migration, excl. defaultTo/from defaultTotal
SEB risk class migration, by quarterCorporate and inter-bank portfolios
SEK bn
Other
=RWA development
Q1 2009 Q2 2009 Q3 2009 Q4 2009 Q1 2010 Q2 2010 Q3 2010 Q4 2010
Start 818 831 790 747 730 723 714 711
Migration 18 8 5 4 3 1 1 -1
FX effects (credit risk) 10 -10 -29 5 -16 0 -24 -5
Market risk and operational risk -1 5 3 1 13 -11 8 1
Other -14 -44 -22 -27 -7 1 12 10
End 831 790 747 730 723 714 711 716
SEB Fact Book Annual Accounts 2010 31
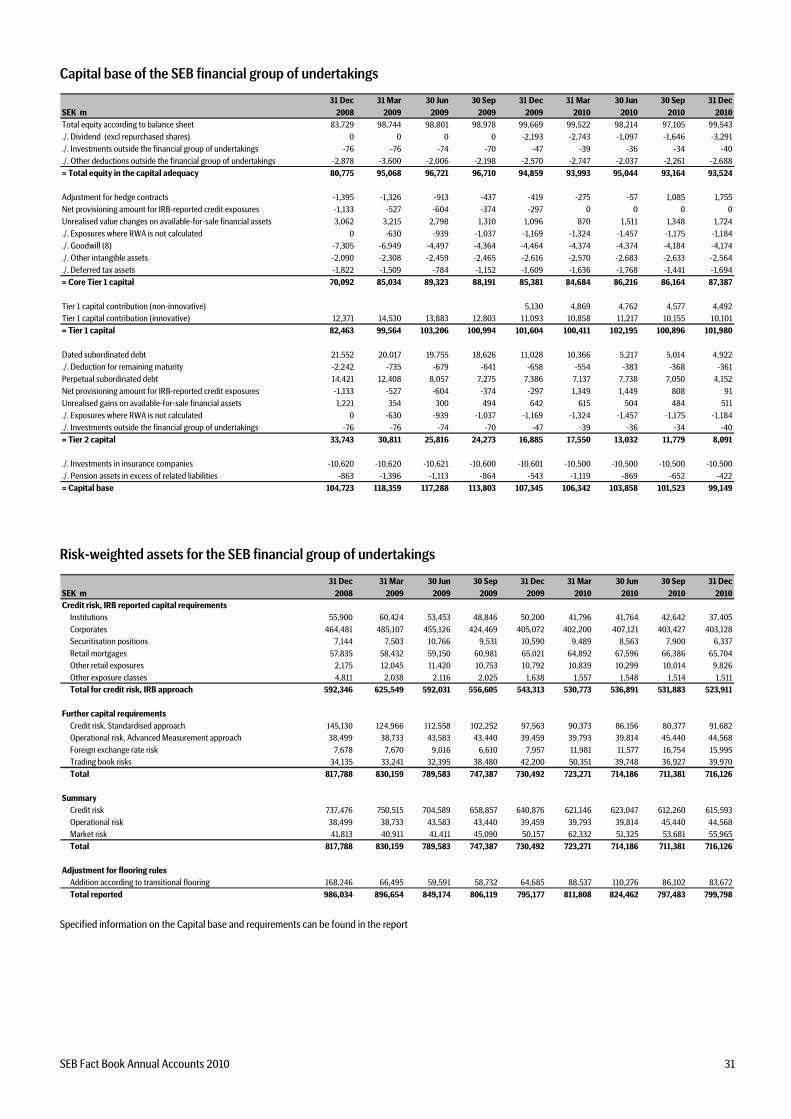
Capital base of the SEB financial group of undertakings
31 Dec 31 Mar 30 Jun 30 Sep 31 Dec 31 Mar 30 Jun 30 Sep 31 Dec
SEK m 2008 2009 2009 2009 2009 2010 2010 2010 2010
Total equity according to balance sheet 83,729 98,744 98,801 98,978 99,669 99,522 98,214 97,105 99,543
./. Dividend (excl repurchased shares) 0 0 0 0 -2,193 -2,743 -1,097 -1,646 -3,291
./. Investments outside the financial group of undertakings -76 -76 -74 -70 -47 -39 -36 -34 -40
./. Other deductions outside the financial group of undertakings -2,878 -3,600 -2,006 -2,198 -2,570 -2,747 -2,037 -2,261 -2,688
= Total equity in the capital adequacy 80,775 95,068 96,721 96,710 94,859 93,993 95,044 93,164 93,524
Adjustment for hedge contracts -1,395 -1,326 -913 -437 -419 -275 -57 1,085 1,755
Net provisioning amount for IRB-reported credit exposures -1,133 -527 -604 -374 -297 0 0 0 0
Unrealised value changes on available-for-sale financial assets 3,062 3,215 2,798 1,310 1,096 870 1,511 1,348 1,724
./. Exposures where RWA is not calculated 0 -630 -939 -1,037 -1,169 -1,324 -1,457 -1,175 -1,184
./. Goodwill (8) -7,305 -6,949 -4,497 -4,364 -4,464 -4,374 -4,374 -4,184 -4,174
./. Other intangible assets -2,090 -2,308 -2,459 -2,465 -2,616 -2,570 -2,683 -2,633 -2,564
./. Deferred tax assets -1,822 -1,509 -784 -1,152 -1,609 -1,636 -1,768 -1,441 -1,694
= Core Tier 1 capital 70,092 85,034 89,323 88,191 85,381 84,684 86,216 86,164 87,387
Tier 1 capital contribution (non-innovative) 5,130 4,869 4,762 4,577 4,492
Tier 1 capital contribution (innovative) 12,371 14,530 13,883 12,803 11,093 10,858 11,217 10,155 10,101
= Tier 1 capital 82,463 99,564 103,206 100,994 101,604 100,411 102,195 100,896 101,980
Dated subordinated debt 21,552 20,017 19,755 18,626 11,028 10,366 5,217 5,014 4,922
./. Deduction for remaining maturity -2,242 -735 -679 -641 -658 -554 -383 -368 -361
Perpetual subordinated debt 14,421 12,408 8,057 7,275 7,386 7,137 7,738 7,050 4,152
Net provisioning amount for IRB-reported credit exposures -1,133 -527 -604 -374 -297 1,349 1,449 808 91
Unrealised gains on available-for-sale financial assets 1,221 354 300 494 642 615 504 484 511
./. Exposures where RWA is not calculated 0 -630 -939 -1,037 -1,169 -1,324 -1,457 -1,175 -1,184
./. Investments outside the financial group of undertakings -76 -76 -74 -70 -47 -39 -36 -34 -40
= Tier 2 capital 33,743 30,811 25,816 24,273 16,885 17,550 13,032 11,779 8,091
./. Investments in insurance companies -10,620 -10,620 -10,621 -10,600 -10,601 -10,500 -10,500 -10,500 -10,500
./. Pension assets in excess of related liabilities -863 -1,396 -1,113 -864 -543 -1,119 -869 -652 -422
= Capital base 104,723 118,359 117,288 113,803 107,345 106,342 103,858 101,523 99,149
Risk-weighted assets for the SEB financial group of undertakings
31 Dec 31 Mar 30 Jun 30 Sep 31 Dec 31 Mar 30 Jun 30 Sep 31 Dec
SEK m 2008 2009 2009 2009 2009 2010 2010 2010 2010
Credit risk, IRB reported capital requirements
Institutions 55,900 60,424 53,453 48,846 50,200 41,796 41,764 42,642 37,405
Corporates 464,481 485,107 455,126 424,469 405,072 402,200 407,121 403,427 403,128
Securitisation positions 7,144 7,503 10,766 9,531 10,590 9,489 8,563 7,900 6,337
Retail mortgages 57,835 58,432 59,150 60,981 65,021 64,892 67,596 66,386 65,704
Other retail exposures 2,175 12,045 11,420 10,753 10,792 10,839 10,299 10,014 9,826
Other exposure classes 4,811 2,038 2,116 2,025 1,638 1,557 1,548 1,514 1,511
Total for credit risk, IRB approach 592,346 625,549 592,031 556,605 543,313 530,773 536,891 531,883 523,911
Further capital requirements
Credit risk, Standardised approach 145,130 124,966 112,558 102,252 97,563 90,373 86,156 80,377 91,682
Operational risk, Advanced Measurement approach 38,499 38,733 43,583 43,440 39,459 39,793 39,814 45,440 44,568
Foreign exchange rate risk 7,678 7,670 9,016 6,610 7,957 11,981 11,577 16,754 15,995
Trading book risks 34,135 33,241 32,395 38,480 42,200 50,351 39,748 36,927 39,970
Total 817,788 830,159 789,583 747,387 730,492 723,271 714,186 711,381 716,126
Summary
Credit risk 737,476 750,515 704,589 658,857 640,876 621,146 623,047 612,260 615,593
Operational risk 38,499 38,733 43,583 43,440 39,459 39,793 39,814 45,440 44,568
Market risk 41,813 40,911 41,411 45,090 50,157 62,332 51,325 53,681 55,965
Total 817,788 830,159 789,583 747,387 730,492 723,271 714,186 711,381 716,126
Adjustment for flooring rules
Addition according to transitional flooring 168,246 66,495 59,591 58,732 64,685 88,537 110,276 86,102 83,672
Total reported 986,034 896,654 849,174 806,119 795,177 811,808 824,462 797,483 799,798 Specified information on the Capital base and requirements can be found in the report

SEB Fact Book Annual Accounts 2010 32
Capital adequacy
31 Dec 31 Mar 30 Jun 30 Sep 31 Dec 31 Mar 30 Jun 30 Sep 31 Dec
SEK m 2008 2009 2009 2009 2009 2010 2010 2010 2010
Capital resources
Core Tier 1 capital 70,092 85,034 89,323 88,191 85,381 84,684 86,216 86,164 87,387
Tier 1 capital 82,463 99,564 103,206 100,994 101,604 100,411 102,195 100,896 101,980
Capital base 104,723 118,359 117,288 113,803 107,345 106,342 103,858 101,523 99,149
Capital adequacy without transitional floor (Basel II)
Capital requirement 65,423 66,413 63,167 59,791 58,439 57,862 57,135 56,911 716,126
Expressed as Risk-weighted assets 817,789 830,159 789,583 747,387 730,492 723,271 714,186 711,381 57,290
Core Tier 1 capital ratio 8.6% 10.2% 11.3% 11.8% 11.7% 11.7% 12.1% 12.1% 12.2%
Tier 1 capital ratio 10.1% 12.0% 13.1% 13.5% 13.9% 13.9% 14.3% 14.2% 14.2%
Total capital ratio 12.8% 14.3% 14.9% 15.2% 14.7% 14.7% 14.5% 14.3% 13.8%
Capital base in relation to capital requirement 1.60 1.78 1.86 1.90 1.84 1.84 1.82 1.78 1.73
Capital adequacy including transitional floor
Transition floor applied 90% 80% 80% 80% 80% 80% 80% 80% 80%
Capital requirement 78,883 71,732 67,934 64,490 63,614 64,945 65,957 63,799 799,798
Expressed as Risk-weighted assets 986,034 896,654 849,174 806,131 795,177 811,808 824,462 797,483 63,984
Core Tier 1 capital ratio 7.1% 9.5% 10.5% 10.9% 10.7% 10.4% 10.5% 10.8% 10.9%
Tier 1 capital ratio 8.4% 11.1% 12.2% 12.5% 12.8% 12.4% 12.4% 12.7% 12.8%
Total capital ratio 10.6% 13.2% 13.8% 14.1% 13.5% 13.1% 12.6% 12.7% 12.4%
Capital base in relation to capital requirement 1.33 1.65 1.73 1.76 1.69 1.64 1.57 1.59 1.55
Capital adequacy with risk weighting according to Basel I
Capital requirement 90,164 90,984 86,428 81,546 80,260 79,494 80,635 78,738 998,326
Expressed as Risk-weighted assets 1,127,054 1,137,300 1,080,347 1,019,329 1,003,250 993,680 1,007,939 984,225 79,866
Core Tier 1 capital ratio 6.2% 7.5% 8.3% 8.7% 8.5% 8.5% 8.6% 8.8% 8.8%
Tier 1 capital ratio 7.3% 8.8% 9.6% 9.9% 10.1% 10.1% 10.1% 10.3% 10.2%
Total capital ratio 9.3% 10.4% 10.9% 11.2% 10.7% 10.7% 10.3% 10.3% 9.9%
Capital base in relation to capital requirement 1.16 1.30 1.36 1.40 1.34 1.34 1.29 1.29 1.24
IRB reported credit exposures (less repos and securities lending)
31 Dec 31 Mar 30 Jun 30 Sep 31 Dec 31 Mar 30 Jun 30 Sep 31 Dec
Average risk weight 2008 2009 2009 2009 2009 2010 2010 2010 2010
Institutions 17.0% 17.3% 17.7% 17.6% 17.5% 17.0% 18.1% 17.8% 19.5%
Corporates 57.3% 59.3% 59.1% 59.1% 57.8% 58.5% 57.7% 59.1% 57.0%
Securitisation positions 10.6% 12.2% 19.3% 18.6% 22.6% 22.6% 22.5% 22.4% 20.6%
Retail mortgages 16.5% 16.3% 16.2% 16.7% 17.2% 16.8% 17.1% 17.2% 16.9%
Other retail exposures n/a 39.9% 38.7% 37.9% 38.5% 39.1% 38.6% 38.7% 38.2%
All outstanding Subordinated Debt and Hybrid Tier 1 issues
Issue date Ratings Format Coupon
Maturity
date First call date Step-up Currency Size (m)
Lower Tier II Issues
15-Sep-05 A2/A-/A 12NC7 mth € + 25 bps 28-Sep-17 28-Sep-12 3-mth €+ 175bps EUR 500
Upper Tier II Issues
17-Nov-06 Baa3/BBB-/A- PerpNC5 5.5000% Perpetual 28-Nov-11 3-mth £L+ 184bps GBP 200
25-Dec-97 Baa3/BBB-/A- PerpNC30 5.0000% Perpetual 28-Jan-28 6-mth ¥L+ 150bps JPY 15,000
26-Jun-95 Baa3/BBB-/A- PerpNC20 4.4000% Perpetual 14-Nov-15 6-mth ¥L+ 200bps JPY 10,000
Tier I Issues
19-Mar-04 Ba2/BBB-/A- PerpNC10 4.9580% Perpetual 25-Mar-14 3-mth $L+ 182bps USD 407
23-Mar-05 Ba2/BBB-/A- PerpNC10 5.4710% Perpetual 23-Mar-15 3-mth $L+ 154bps USD 423
1-Oct-09 Ba2/BBB-/A- PerpNC5 9.2500% Perpetual 31-Mar-15 EUR 500
17-Dec-07 Ba2/BBB-/A- PerpNC10 7.0922% Perpetual 21-Dec-17 3-mth € + 340 bps EUR 500

SEB Fact Book Annual Accounts 2010 33
Volumes
Balance sheet
31 Dec 31 Mar 30 Jun 30 Sep 31 Dec 31 Mar 30 Jun 30 Sep 31 Dec
SEK m 2008 2009 2009 2009 2009 2010 2010 2010 2010
Cash and cash balances with central banks 44,852 18,929 97,886 25,158 36,589 19,634 17,372 34,384 46,488
Loans to credit institutions 266,363 284,096 213,245 231,697 331,460 272,242 246,891 225,236 204,188
Loans to the public 1,296,777 1,317,189 1,304,683 1,206,833 1,187,837 1,203,833 1,226,476 1,088,736 1,074,879
Financial assets at fair value * 635,454 639,483 568,035 604,624 581,641 623,302 670,990 666,731 617,746
Available-for-sale financial assets * 163,115 105,011 98,014 88,138 87,948 70,954 65,988 66,937 66,970
Held-to-maturity investments * 1,997 1,236 1,845 1,793 1,332 1,303 1,500 1,461 1,451
Assets held for sale 79,280 74,951
Investments in associates 1,129 1,152 1,174 1,122 995 1,018 1,018 1,020 1,022
Tangible and intangible assets 29,511 29,965 27,900 27,432 27,770 27,206 27,565 26,998 27,035
Other assets 71,504 63,167 60,736 46,602 52,655 65,798 60,807 62,996 65,091
Total assets 2,510,702 2,460,228 2,373,518 2,233,399 2,308,227 2,285,290 2,318,607 2,253,779 2,179,821
Deposits from credit institutions 429,425 401,471 405,699 342,518 397,433 393,379 358,448 238,293 212,624
Deposits and borrowing from the public 841,034 835,603 823,359 752,966 801,088 739,907 759,347 717,005 711,541
Liabilities to policyholders 211,070 210,939 227,401 237,665 249,009 255,289 253,024 256,953 263,970
Debt securities 525,219 495,782 488,951 480,564 456,043 469,312 486,330 536,882 530,483
Financial liabilities at fair value 295,533 276,325 211,978 201,069 191,440 209,524 258,415 238,741 200,690
Liabilities held for sale 50,680 48,339
Other liabilities 71,565 89,051 72,220 76,855 75,149 80,747 70,867 86,732 85,665
Provisions 1,897 2,020 1,822 1,791 2,033 1,724 1,753 1,478 1,414
Subordinated liabilities 51,230 50,081 43,287 40,993 36,363 35,886 32,209 29,910 25,552
Total equity 83,729 98,956 98,801 98,978 99,669 99,522 98,214 97,105 99,543
Total liabilities and equity 2,510,702 2,460,228 2,373,518 2,233,399 2,308,227 2,285,290 2,318,607 2,253,779 2,179,821
* Of which bonds and other interest bearing
securities including derivatives. 628,675 567,980 474,129 496,467 457,209 463,267 469,235 485,206 416,864 =
Intangible assets
SEK m
Q1
2009
Q2
2009
Q3
2009
Q4
2009
Q1
2010
Q2
2010
Q3
2010
Q4
2010
Goodwill 13,333 10,882 10,729 10,829 10,723 10,717 10,515 10,491
Other intangibles 2,565 2,712 2,702 2,847 2,841 2,945 2,879 2,801
Deferred acquisition costs 3,415 3,434 3,422 3,501 3,556 3,583 3,580 3,631
Intangible assets 19,313 17,027 16,854 17,177 17,121 17,245 16,974 16,923
Assets under management
SEK bn
2008 2009 2010
Assets under management, start of period 1,370 1,201 1,356
Inflow 295 256 287
Outflow -261 -209 -232
Net inflow of which: 34 47 55
Sweden 25 30
Other Nordic 6 2
Germany 5 12
Baltic countries and Poland 3 1
Other and Eliminations 8 11
Acquisition/disposal net 17 -2 -1
Change in value -220 109 -11
Assets under management, end of period 1,201 1,356 1,399
Of which, not eliminated:
Retail Banking 74 86 91
Wealth Management 1,142 1,275 1,321
Life 346 449 461

SEB Fact Book Annual Accounts 2010 34
Lending to the public*
Q1 Q2 Q3** Q4** Q1** Q2** Q3** Q4** Q1** Q2** Q3** Q4** 2008 2008 2008 2008 2009 2009 2009 2009 2010 2010 2010 2010
Merchant Banking 526 531 606 645 662 627 565 547 557 543 530 519
Retail Banking 381 402 411 421 421 433 436 446 450 458 385 397
RB Sweden 286 303 307 309 313 323 331 342 352 360 369 380
RB Germany 81 82 87 95 91 93 88 87 82 81 - -
RB Cards 14 17 17 17 17 17 17 17 16 17 16 17
Wealth Management 31 29 28 28 29 30 28 27 29 29 29 31Life - - - - - - - - - - - -
Baltic 137 143 150 165 161 152 137 131 119 113 106 102
Baltic Estonia 42 43 44 48 47 45 42 41 37 36 33 33
Baltic Latvia 35 36 37 41 40 38 33 32 29 27 26 24
Baltic Lithuania 60 64 69 76 74 69 62 58 53 50 47 45
Other/Elim 24 27 31 38 44 63 41 37 49 83 39 26
SEB Group 1,099 1,132 1,226 1,297 1,317 1,305 1,207 1,188 1,204 1,226 1,089 1,075
* After credit loss reserves
** Including re-classified bonds =
Deposits from the public
Q1 Q2 Q3 Q4 Q1 Q2 Q3 Q4 Q1 Q2 Q3 Q4 2008 2008 2008 2008 2009 2009 2009 2009 2010 2010 2010 2010
Merchant Banking 409 392 426 433 411 407 342 377 360 355 372 365
Retail Banking 192 196 200 211 207 210 203 206 199 205 166 175
RB Sweden 145 149 151 153 151 155 154 158 154 161 166 175
RB Germany 47 47 49 58 56 55 49 48 45 44 - -
RB Cards - - - - - - - - - - - -
Wealth Management 54 56 52 48 53 54 51 47 50 55 50 47
Life - - - - - - - - - - - - Baltic 65 68 69 76 73 68 65 64 60 59 56 57
Baltic Estonia 20 22 22 25 24 23 21 21 20 20 19 20Baltic Latvia 17 18 17 19 18 16 14 14 14 14 13 12
Baltic Lithuania 28 28 30 32 31 29 30 29 26 25 24 25
Other/Elim 45 46 47 73 92 84 92 107 71 85 73 68
SEB Group 765 758 794 841 836 823 753 801 740 759 717 712
=

SEB Fact Book Annual Accounts 2010 35
Credit portfolio, loan portfolio impaired loans by industry and geography
Credit portfolio by industry and geography*
SEB Group, Dec 2010
SEK m Sweden Denmark Norway Finland Estonia Latvia Lithuania Germany Other Total
Banks 94,803 14,979 9,244 1,610 78 192 315 72,245 12,030 205,496
Finance and insurance 54,396 1,428 4,844 516 195 894 414 19,018 2,641 84,346
Wholesale and retail 31,983 796 897 194 2,155 3,168 7,338 12,288 2,678 61,497
Transportation 27,366 295 1,578 153 876 1,707 2,712 5,603 605 40,895
Shipping 31,209 200 778 121 545 194 255 14 4,383 37,699
Business and household services 80,894 853 5,569 489 2,123 1,554 2,190 26,396 1,392 121,460
Construction 11,326 108 590 255 945 1,377 1,228 3,291 478 19,598
Manufacturing 135,044 1,715 3,680 4,804 3,542 1,858 6,412 26,519 8,021 191,595
Agriculture, forestry and fishing 5,064 198 11 34 884 1,610 583 138 14 8,536
Mining and quarrying 12,662 2,295 287 27 116 112 454 472 16,425
Electricity, gas and water supply 26,948 190 1,456 3,548 1,756 1,142 2,021 9,393 143 46,597
Other 24,818 739 2,808 871 311 291 339 3,151 3,969 37,297
Corporates 441,710 6,522 24,506 11,272 13,359 13,911 23,604 106,265 24,796 665,945
Commercial 67,318 171 1,296 523 5,833 3,481 11,040 45,984 682 136,328
Multi-family 82,234 1 162 2,168 18 26,080 110,663
Property Management 149,552 172 1,458 523 5,833 5,649 11,058 72,064 682 246,991
Public Administration 17,107 58 178 926 1,864 133 2,265 52,827 99 75,457
Household mortgage 291,812 3,034 14,521 8,713 19,161 62,172 2,634 402,047
Other 40,035 5,462 27,212 1,300 2,872 2,868 1,872 21,588 3,554 106,763
Households 331,847 5,462 30,246 1,300 17,393 11,581 21,033 83,760 6,188 508,810
Credit portfolio 1,035,019 27,193 65,632 15,631 38,527 31,466 58,275 387,161 43,795 1,702,699
* The geographical distribution is based on where the loan is booked. Amounts before provisions for credit losses.
SEB Group, Dec 2009
SEK m Sweden Denmark Norway Finland Estonia Latvia Lithuania Germany Other Total
Banks 178,418 24,663 8,873 1,596 169 685 411 78,964 15,931 309,710
Finance and insurance 44,884 554 2,381 616 258 633 334 19,396 4,581 73,637
Wholesale and retail 31,563 1,668 1,741 215 3,135 4,975 9,482 13,962 4,532 71,273
Transportation 28,478 406 1,046 167 1,319 2,118 4,384 7,716 432 46,066
Shipping 29,178 302 1,515 135 923 236 292 37 4,515 37,133
Business and household services 82,473 650 3,407 196 2,498 1,820 2,973 17,560 1,044 112,621
Construction 9,473 79 411 427 1,392 1,814 1,970 4,381 238 20,185
Manufacturing 129,165 1,764 3,730 5,151 4,126 2,624 8,583 26,572 6,593 188,308
Agriculture, forestry and fishing 3,496 206 48 1,102 2,042 655 143 18 7,710
Mining and quarrying 12,696 2,323 346 93 123 112 387 12 16,092
Electricity, gas and water supply 28,878 207 1,112 4,950 2,947 1,064 2,467 7,722 119 49,466
Other 16,252 3,135 4,096 126 367 367 584 3,787 4,595 33,309
Corporates 416,536 8,971 21,810 12,329 18,160 17,816 31,836 101,663 26,679 655,800
Commercial 63,189 142 5,480 545 7,213 4,460 13,634 54,132 682 149,477
Multi-family 65,020 1 8 2,570 30 29,636 9 97,274
Property Management 128,209 143 5,488 545 7,213 7,030 13,664 83,768 691 246,751
Public Administration 23,254 105 272 660 2,238 287 2,445 65,378 64 94,703
Household mortgage 266,060 3,528 16,821 10,448 22,784 72,472 2,189 394,302
Other 40,198 5,951 29,771 1,541 3,652 3,586 2,517 24,973 2,974 115,163
Households 306,258 5,951 33,299 1,541 20,473 14,034 25,301 97,445 5,163 509,465
Credit portfolio 1,052,675 39,833 69,742 16,671 48,253 39,852 73,657 427,218 48,528 1,816,429
* The geographical distribution is based on where the loan is booked. Amounts before provisions for credit losses. =

SEB Fact Book Annual Accounts 2010 36
Loan portfolio by industry and geography*
SEB Group, Dec 2010
SEK m Sweden Denmark Norway Finland Estonia Latvia Lithuania Germany Other Total
Banks 45,262 8,372 2,198 581 75 155 214 57,968 8,466 123,291
Finance and insurance 21,487 325 1,857 72 45 212 121 12,373 2,321 38,813
Wholesale and retail 15,869 386 523 104 1,535 2,520 5,666 6,757 1,550 34,910
Transportation 21,004 124 1,144 7 756 1,570 2,376 1,650 556 29,187
Shipping 23,173 57 124 121 254 190 254 14 3,601 27,788
Business and household services 46,420 388 3,409 260 1,736 1,090 1,492 13,307 1,028 69,130
Construction 4,228 74 321 77 455 1,017 720 1,046 37 7,975
Manufacturing 47,278 707 887 4,109 2,556 1,598 4,440 6,506 4,033 72,114
Agriculture, forestry and fishing 3,134 49 1 34 818 1,490 545 102 5 6,178
Mining and quarrying 7,156 28 287 24 104 108 4 3 7,714
Electricity, gas and water supply 11,422 39 88 3,530 1,470 1,007 995 3,006 49 21,606
Other 19,947 714 2,508 807 295 287 320 2,818 3,395 31,091
Corporates 221,118 2,863 10,890 9,408 9,944 11,085 17,037 47,583 16,578 346,506
Commercial 56,752 160 841 515 5,721 3,402 10,819 42,010 682 120,902
Multi-family 72,275 1 154 2,049 17 23,697 98,193
Property Management 129,027 161 995 515 5,721 5,451 10,836 65,707 682 219,095
Public Administration 6,178 58 145 926 1,565 123 1,810 51,763 99 62,667
Household mortgage 271,997 3,034 14,486 8,713 18,944 58,146 2,634 377,954
Other 23,670 2,821 9,736 706 2,312 2,314 1,390 7,546 2,749 53,244
Households 295,667 2,821 12,770 706 16,798 11,027 20,334 65,692 5,383 431,198
Loan portfolio 697,252 14,275 26,998 12,136 34,103 27,841 50,231 288,713 31,208 1,182,757
Repos, credit institutions 30,885
Repos, general public 63,449
Debt instruments 91,333
Reserves -14,919
Retail, SEB AG gross -74,438
Total lending 1,279,067
* The geographical distribution is based on where the loan is booked.
SEB Group, Dec 2009
SEK m Sweden Denmark Norway Finland Estonia Latvia Lithuania Germany Other Total
Banks 118,428 20,797 1,464 422 163 655 241 60,762 11,409 214,341
Finance and insurance 20,303 249 622 109 53 628 42 12,973 4,043 39,022
Wholesale and retail 17,211 779 483 136 2,556 3,787 7,377 5,508 1,168 39,005
Transportation 22,153 153 621 2 1,171 1,867 3,929 1,393 379 31,668
Shipping 21,545 302 948 135 807 229 287 32 3,338 27,623
Business and household services 47,725 372 1,747 15 2,283 1,651 2,245 13,269 687 69,994
Construction 4,309 73 159 40 718 1,382 1,220 1,999 56 9,956
Manufacturing 52,461 946 1,096 3,819 3,070 2,204 6,931 9,250 2,273 82,050
Agriculture, forestry and fishing 2,613 36 38 1,053 1,924 619 98 9 6,390
Mining and quarrying 7,870 38 346 89 106 102 8 1 8,560
Electricity, gas and water supply 12,099 22 75 4,901 1,758 901 1,236 3,723 44 24,759
Other 12,785 760 3,984 79 355 362 565 3,866 3,713 26,469
Corporates 221,074 3,692 9,811 9,582 13,913 15,041 24,553 52,119 15,711 365,496
Commercial 55,130 142 3,142 535 7,033 4,388 13,131 47,530 681 131,712
Multi-family 57,756 1 2,421 25 26,755 9 86,967
Property Management 112,886 143 3,142 535 7,033 6,809 13,156 74,285 690 218,679
Public Administration 12,184 105 241 660 1,873 258 1,936 63,632 64 80,953
Household mortgage 247,378 3,528 16,803 10,443 22,383 67,264 2,189 369,988
Other 23,809 2,685 11,779 836 2,938 2,901 2,014 8,741 2,957 58,660
Households 271,187 2,685 15,307 836 19,741 13,344 24,397 76,005 5,146 428,648
Loan portfolio 735,759 27,422 29,965 12,035 42,723 36,107 64,283 326,803 33,020 1,308,117
Repos, credit institutions 42,324
Repos, general public 61,594
Debt instruments 125,339
Reserves -18,077
Total lending 1,519,297
* The geographical distribution is based on where the loan is booked. =

SEB Fact Book Annual Accounts 2010 37
Credit portfolio – corporates Credit portfolio – households
Geography based on SEB's operations
293345
490421 415 422 425 444
51
57
103
89 95 98 8892
69
83
95
68 60 56 54 51
50
50
53
49 51 52 515326 26 29 26
485
571
782
656 646 655 647 666
29
41
35
22
Dec
'06
Dec
'07
Dec
'08
Dec
'09
Mar
'10
Jun
'10
Sep
'10
Dec
'10
"Nordic" - Larger Germany - LargerBaltic "Nordic" - RetailOther
SEK bn
* Incl. other
SEK bn
371 383 388 389 394 394 401 400 402
115 120 118 115 115 113 113 109 107
486 503 506 503 510 507 514 509 509
Dec '08 Mar '09 Jun '09 Sep '09 Dec '09 Mar '10 Jun '10 Sep '10 Dec '10
Mortgage Other
236 272 279 289 293 297
79 73 68 66 64 62 55 50 47 4346 42924
8181807878
25 25 24 22 22 12 10 889
78
505254566068
375
104 98
359 370
92 90 86 84
352314372
Dec
'08
Dec
'09
Mar
'10
Jun
'10
Sep
'10
Dec
'10
Dec
'08
Dec
'09
Mar
'10
Jun
'10
Sep
'10
Dec
'10
Dec
'08
Dec
'09
Mar
'10
Jun
'10
Sep
'10
Dec
'10
Nordic* German Baltics
Mortgage Other
Credit portfolio by industry and geography*
SEB Group, Dec 2010
SEK m Sweden Denmark Norway Finland Estonia Latvia Lithuania Germany Other Total
Banks 92,222 15,222 10,239 2,592 78 192 315 72,245 12,391 205,496
Corporates 339,697 18,199 62,624 45,360 13,359 13,911 23,604 106,265 42,926 665,945
Property Management 134,845 885 7,319 8,060 5,833 5,649 11,058 72,064 1,278 246,991
Public Administration 16,841 58 444 926 1,864 133 2,265 52,827 99 75,457
Households 331,847 5,462 30,246 1,300 17,393 11,581 21,033 83,760 6,188 508,810
Credit portfolio 915,452 39,826 110,872 58,238 38,527 31,466 58,275 387,161 62,882 1,702,699
* Geography distribution is based on SEB's operations. Amounts before provisions for credit losses
SEB Group, Dec 2009
SEK m Sweden Denmark Norway Finland Estonia Latvia Lithuania Germany Other Total
Banks 174,521 25,286 10,424 3,319 169 685 411 78,964 15,931 309,710
Corporates 312,740 19,389 58,473 44,646 18,159 17,817 31,836 103,411 49,329 655,800
Property Management 113,670 143 12,567 7,898 7,213 7,030 13,664 83,768 798 246,751
Public Administration 23,254 105 272 660 2,238 287 2,445 65,378 64 94,703
Households 306,258 5,951 33,299 1,541 20,472 14,034 25,301 97,445 5,164 509,465
Credit portfolio 930,443 50,874 115,035 58,064 48,251 39,853 73,657 428,966 71,286 1,816,429
* Geography distribution is based on SEB's operations. Amounts before provisions for credit losses =

SEB Fact Book Annual Accounts 2010 38
Credit portfolio*
On & off balance, SEK bn
SEB Group
Dec
2006
Dec
2007
Dec
2008
Dec
2009
Dec
2010
Banks 169 248 286 310 206
Corporates 484 571 782 656 666Property Management 192 212 262 247 247Households 374 434 486 509 509Public Administration 97 88 119 94 75Total non-banks 1,147 1,305 1,649 1,506 1,422
Total 1,316 1,553 1,935 1,816 1,628
SEB Group
Dec
2006
Dec
2007
Dec
2008
Dec
2009
Dec
2010
Lending ** 937 1,112 1,362 1,308 1,183
Contingent Liabilities 324 365 442 406 430
Derivative Instruments 55 75 130 102 90
Credit Portfolio 1,316 1,552 1,934 1,816 1,703
* Before loan loss reserves, excluding repos & debt instruments =
Baltic geographies
Credit portfolio
Baltic countries, EUR bn Total exposure: EUR 14.6 bn (SEK 133.5 bn)
2.4 2.1 1.8 1.6 1.6 1.6 1.5 2.2 2.3 1.7 1.6 1.5 1.6 1.5
4.4 4.23.1 2.9 2.8 2.7 2.6
0.8 0.8 0.7 0.7 0.7 0.7 0.60.6 0.6
0.7 0.7 0.7 0.6 0.6
1.2 1.5
1.3 1.3 1.3 1.2 1.2
2.0 2.12.0 2.0 2.0 1.9 1.9 1.5 1.5
1.4 1.4 1.3 1.3 1.3
2.3 2.6
2.5 2.4 2.4 2.4 2.3
5.4 5.24.7 4.6 4.4 4.4 4.3 4.4 4.5
3.9 3.7 3.6 3.6 3.5
8.18.7
7.2 7.0 6.8 6.6 6.5
Dec
'07
Dec
'08
Dec
'09
Mar
'10
Jun
'10
Sep
'10
Dec
'10
Dec
'07
Dec
'08
Dec
'09
Mar
'10
Jun
'10
Sep
'10
Dec
'10
Dec
'07
Dec
'08
Dec
'09
Mar
'10
Jun
'10
Sep
'10
Dec
'10
Estonia Latvia Lithuania
Banks
Public Admin
Households
Property Mgmt
Corporates
19% -4% -9% -3% -3% -1% -3% 12% 4% -15% -6% -3% 1% -3% 29% 8% -17% -3% -2% -3% -1%=

==
SEB Fact Book January- September 2010 39
Asset quality
Rating of credit portfolio, Dec 2010
Risk Class
S&P AAA/A- BBB BB B+/B B-/D
Risk Class
S&P AAA/A- BBB BB B+/B B-/D
PD (%)
Household (EAD, IRB reported)
Total credit portfolio excl. Households* (%) Of which, Corporates* (%)
* Including repos
35%
20%
36%
5% 4%
'1 - 4 '5 - 7 '8 - 10 '11 - 12 '13 - 16
20%26%
7% 3%
44%
'1 - 4 '5 - 7 '8 - 10 '11 - 12 '13 - 16
8%3%
15%
46%
28%
0%
0< 0.2 0.2< 0.4 0.4< 1 1< 5 5< 50 50< 100
Credit loss level, % *
0.04 0.04 0.050.18 0.17 0.06
2005 2006 2007 2008 2009 2010
0.19 0.14 0.1 0.090.22 0.13
2005 2006 2007 2008 2009 2010
0.11 0.08 0.110.30
0.92
0.14
2005 2006 2007 2008 2009 2010
0.27 0.13 0.431.28
5.43
0.63
2005 2006 2007 2008 2009 2010
Germany
Nordics Baltics
SEB Group
* Total operations
SEB Group – net credit losses, SEK m
Net credit losses, quarterly
Q1
2009
Q2
2009
Q3
2009
Q4
2009
Q1
2010
Q2
2010
Q3
2010
Q4
2010
Full Year
2009
Full Year
2010
Net write-offs -178 -328 -570 -738 -275 -64 -132 -414 -1,814 -885
Net specific provisions -787 -1,269 -1,907 -2,455 -402 -588 10 64 -6,418 -916
Net collective provisions -1,356 -1,842 -729 129 -1,136 13 318 769 -3,798 -36 of which: Individually assessed loans -924 -1,293 -199 580 -738 214 407 782 -1,836 665 Portfolio assessed loans -432 -549 -530 -451 -398 -201 -89 -13 -1,962 -701
Net credit losses, continuing operations -2,321 -3,439 -3,206 -3,064 -1,813 -639 196 419 -12,030 -1,837

SEB Fact Book Annual Accounts 2010 40
Development of non-performing loans
SEK bn
Non-performing loans
0
2
4
6
8
10
12
14
16
18
20
Q1
'09
Q2 Q3 Q4 Q1
'10
Q2 Q3 Q4 Q1
'09
Q2 Q3 Q4 Q1
'10
Q2 Q3 Q4 Q1
'09
Q2 Q3 Q4 Q1
'10
Q2 Q3 Q4 Q1
'09
Q2 Q3 Q4 Q1
'10
Q2 Q3 Q4
Nordic Germany Baltics Ukraine & Russia
Individually assessed
Portfolio assessed
13.6% of lending
25.2% of lending
0.4% of lending
1.1% of lending
=
Non-performing loans & reserves
SEB Group, SEK bn
Dec
2008
Mar
2009
Jun
2009
Sep
2009
Dec
2009
Mar
2010
Jun
2010
Sep
2010
Dec
2010
Individually assessed loans
Impaired loans, gross 11.4 13.0 16.7 18.4 21.3 19.6 19.2 18.1 17.2Specific reserves 5.0 5.6 7.0 8.3 10.5 10.2 10.4 9.5 8.9Collective reserves 2.8 3.7 5.0 4.9 4.4 4.9 4.4 3.8 3.0Off Balance sheet reserves 0.3 0.4 0.3 0.3 0.5 0.5 0.5 0.5 0.5
Specific reserve ratio 44% 43% 42% 45% 49% 52% 54% 52% 52%
Total reserve ratio 69% 72% 72% 72% 70% 77% 77% 73% 69%
Portfolio assessed loans
Loans past due > 60 days 3.2 4.6 6.4 6.9 6.9 7.1 7.1 7.0 6.5Restructured loans 0.3 0.5 0.6 0.5 0.5Collective reserves 1.4 1.8 2.4 2.8 3.3 3.5 3.7 3.6 3.6
Reserve ratio 44% 41% 37% 40% 45% 46% 48% 48% 51%
Non-performing loans 14.6 17.5 23.1 25.3 28.6 27.2 26.9 25.6 24.3
Total reserves 9.5 11.5 14.6 16.4 18.6 19.1 19.0 17.4 16.0
NPL coverage ratio 65% 66% 63% 65% 65% 70% 71% 68% 66%
Non-performing loans / Lending 0.9% 1.1% 1.5% 1.7% 1.9% 1.8% 1.8% 1.8% 1.8% =
Seized assets - SEB Group
31 Dec 31 Mar 30 Jun 30 Sep 31 Dec 31 Mar 30 Jun 30 Sep 31 Dec
SEK m 2008 2009 2009 2009 2009 2010 2010 2010 2010
Properties, vehicles and equipment 106 311 621 428 217 239 241 582 647Shares 50 50 63 62 62 59 54 55 56
Total seized assets 156 361 684 490 279 298 295 637 703

SEB Fact Book Annual Accounts 2010 41
Impaired loans by industry and geography*
(Individually assessed loans)
SEB Group, Dec 2010
SEK m Sweden Denmark Norway Finland Estonia Latvia Lithuania Germany Other Total
Banks 339 4 1 344
Finance and insurance 1 3 4 2 21 31
Wholesale and retail 81 77 362 459 333 1 1,313
Transportation 20 3 16 128 507 7 35 716
Shipping 2 6 8
Business and household services 46 107 57 68 511 108 5 902
Construction 21 18 1 98 481 285 88 27 1,019
Manufacturing 86 7 12 242 361 154 631 255 209 1,957
Agriculture, forestry and fishing 26 6 75 20 21 148
Mining and quarrying 33 24 57
Electricity, gas and water supply 4 4
Other 152 23 23 15 30 55 717 1,015
Corporates 435 155 42 246 636 1,331 2,419 867 1,039 7,170
Commercial 128 586 1,369 3,836 1,864 7,783
Multi-family 70 305 325 700
Property Management 198 586 1,674 3,836 2,189 8,483
Public Administration
Household mortgage 9 10 113 431 563
Other 4 95 5 275 66 213 658
Households 9 4 105 5 275 113 497 213 1,221
Impaired loans 981 163 147 246 1,227 3,280 6,368 3,554 1,252 17,218
whereof Retail, SEB AG -578
Impaired loans excl Retail, SEB AG 16,640
* The geographical distribution is based on where the loan is booked. Amounts before provisions for credit losses.
SEB Group, Dec 2009
SEK m Sweden Denmark Norway Finland Estonia Latvia Lithuania Germany Other Total
Banks 339 2 1 342
Finance and insurance 2 3 5 1 28 39
Wholesale and retail 100 150 212 757 367 1,586
Transportation 43 54 123 1,074 3 1,297
Shipping 8 8
Business and household services 165 124 92 97 699 132 1,309
Construction 31 16 87 390 247 121 892
Manufacturing 176 369 322 808 415 431 2,521
Agriculture, forestry and fishing 30 29 95 42 1 197
Mining and quarrying 1 1 26 4 32
Electricity, gas and water supply 13 43 10 66
Other 189 22 163 1 96 420 891
Corporates 737 162 166 5 796 1,308 3,640 1,173 851 8,838
Commercial 113 1,119 1,743 4,746 2,530 9 10,260
Multi-family 48 369 450 867
Property Management 161 1,119 2,112 4,746 2,980 9 11,127
Public Administration
Household mortgage 12 41 649 702
Other 11 92 9 132 70 314
Households 12 11 133 9 132 70 649 1,016
Impaired loans 1,249 175 299 5 1,924 3,552 8,456 4,803 860 21,323
* The geographical distribution is based on where the loan is booked. Amounts before provisions for credit losses.

SEB Fact Book Annual Accounts 2010 42
Portfolio assessed loans*
Loans past due > 60 days
SEB Group, Dec 2010
SEK m Sweden Denmark Norway Finland Estonia Latvia Lithuania Germany Other Total
Corporates 24 13 68 5 245 255 191 5 806
Household mortgage 266 564 1,487 1,110 75 104 3,606
Other 590 299 383 65 112 355 177 141 2,122
Households 856 299 383 65 676 1,842 1,287 75 245 5,728
Past due > 60 days 880 312 451 70 921 2,097 1,478 75 250 6,534
whereof Retail, SEB AG -75
Past due > 60 days excl Retail, SEB AG 6,459
* The geographical distribution is based on where the loan is booked.
SEB Group, Dec 2009
SEK m Sweden Denmark Norway Finland Estonia Latvia Lithuania Germany Other Total
Corporates 30 12 91 4 210 268 268 177 1,060
Household mortgage 320 701 1,527 776 135 363 3,822
Other 528 343 398 96 129 387 174 2,055
Households 848 343 398 96 830 1,914 950 135 363 5,877
Past due > 60 days 878 355 489 100 1,040 2,182 1,218 135 540 6,937
* The geographical distribution is based on where the loan is booked. ==
Portfolio assessed loans*
Restructured loans
SEB Group, Dec 2010
SEK m Sweden Denmark Norway Finland Estonia Latvia Lithuania Germany Other Total
Corporates
Household mortgage 49 159 294 502
Other
Households 49 159 294 502
Restructured loans 49 159 294 502
* The geographical distribution is based on where the loan is booked.
SEB Group, Dec 2009
SEK m Sweden Denmark Norway Finland Estonia Latvia Lithuania Germany Other Total
Corporates
Household mortgage 19 122 170 311
Other 1 1
Households 19 123 170 312
Restructured loans 19 123 170 312
* The geographical distribution is based on where the loan is booked. ==
=

SEB Fact Book Annual Accounts 2010 43
Baltic geographies – asset quality
-1,000
-500
0
500
1,000
1,500
2,000
Estonia Latvia Lithuania
Net credit losses Q1 2008 – Q4 2010, SEK m
SEB Baltic – Net Credit Losses
SEK m Estonia Latvia Lithuania
Jan -Dec
2010
% of
Total
Net Write-offs -14 -10 -89 -113 13%
Net Specific Provisions -106 -182 -77 -365 42%
Net Collective Provisions 33 -168 -260 -395 45%
of which:
Individually assessed loans 190 124 80 394 -45%
Portfolio assessed loans -157 -292 -340 -789 90%
Net Credit Losses -87 -360 -426 -873 100% =
NPLs & reserves
Baltic geographies, Dec 2010, SEK m
By quarter
Dec
2008
Mar
2009
Jun
2009
Sep
2009
Dec
2009
Mar
2010
Jun
2010
Sep
2010
Dec
2010
Impaired loans, gross 3,603 5,152 8,056 10,671 13,932 13,050 12,743 11,880 10,875
Specific reserves 1,344 1,852 2,668 4,305 6,632 6,634 6,759 6,060 5,502
Collective reserves 805 1,560 2,799 3,060 2,467 2,913 2,741 2,254 1,670
Off balance sheet reserves 0 4 48 50 82 87 86 73
Specific reserve ratio 37% 36% 33% 40% 48% 51% 53% 51% 51%
Total reserve ratio 60% 66% 68% 69% 65% 73% 74% 70% 66%
Portfolio assessed loans
Loans past due > 60 days 1,896 2,939 4,351 4,366 4,440 4,649 4,705 4,735 4,495
Restructured loans 0 0 0 0 312 450 555 505 502
Collective reserves 955 1,343 1,793 1,857 2,267 2,507 2,640 2,690 2,727
Reserve ratio 50% 46% 41% 43% 48% 49% 50% 51% 55%
Non-performing loans 5,499 8,091 12,407 15,037 18,684 18,149 18,003 17,119 15,872
Total reserves 3,105 4,755 7,264 9,270 11,416 12,136 12,227 11,090 9,972
NPL coverage ratio 56% 59% 59% 62% 61% 67% 68% 65% 63% =
By country
Estonia Latvia Lithuania SEB Baltic Dec 2009
Individually assessed loans
Impaired loans, gross 1,227 3,279 6,369 10,875 13,932Specific reserves 811 1,612 3,079 5,502 6,632Collective reserves 247 510 913 1,670 2,467Off balance sheet reserves 2 40 31 73 50Specific reserve ratio 66% 49% 48% 51% 48%
Total reserve ratio 86% 65% 63% 66% 65%
Portfolio assessed loans
Loans past due > 60 days, gross 921 2,097 1,477 4,495 4,440Restructured loans 49 159 294 502 312Collective reserves 555 1,344 828 2,727 2,267Reserve ratio 57% 60% 47% 55% 48%
Non-performing loans 2,196 5,535 8,141 15,872 18,684
Total reserves 1,615 3,506 4,851 9,972 11,416
NPL coverage ratio 74% 63% 60% 63% 61% =

SEB Fact Book Annual Accounts 2010 44
Baltic lending to the public*
EUR bn
12.313.4 13.8 14.5 14.8 15.2 15.5 15.3 14.7 14.0 13.4 12.8 12.2 11.8 11.6 11.3
Q1
2007
Q2 Q3 Q4 Q1
2008
Q2 Q3 Q4 Q1
2009
Q2 Q3 Q4 Q1
2010
Q2 Q3 Q4
Lending to the public Credit loss reserves
* Excluding reclassified bonds
Lending to the public,SEK bn 115 124 127 137 138 144 151 167 161 152 137 131 119 113 106 102
12.413.5
13.9 14.614.9
15.415.7 15.6
15.114.7
14.313.9
13.4 13.1 12.8 12.4
Market risk
The Group’s risk taking in trading operations is primarily measured by
value at risk, VaR. The Group has chosen a level of 99 per cent
probability and a ten-day time-horizon for reporting. In the day-to-
day risk management of trading positions, SEB follows up limits with
a one-day time horizon. All risk exposures are well within the Board’s
decided limits.
The table below shows the VaR exposure by risk type. During 2010,
the Group’s Value at Risk in the trading operations averaged SEK
305m. The increase compared to 2009 is due to larger positions,
primarily in the liquidity portfolio that has been built up during 2010.
The average numbers are not fully comparable due to the change of
risk model during later half of 2009.
=Value at Risk (99 per cent, ten days)
SEKm Min Max 30 Dec 2010 Average 2010 Average 2009
Commodities 0 4 0 0 1
Credit spread 52 360 294 251 111
Equity 20 112 50 40 50
FX 12 136 36 44 60
Interest rate 53 257 67 100 152
Volatilities 14 35 21 24 -
Diversification - - -155 -155 -212
Total 133 483 313 305 162
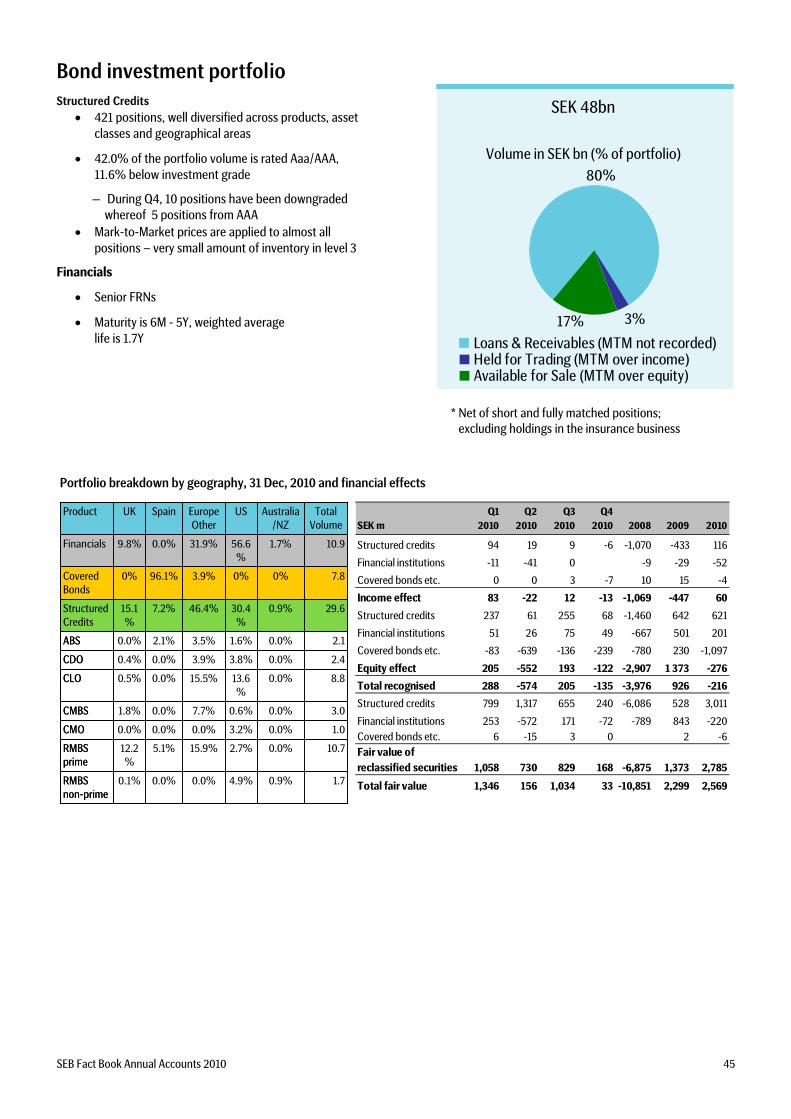
SEB Fact Book Annual Accounts 2010 45
Bond investment portfolio
Structured Credits
421 positions, well diversified across products, asset classes and geographical areas
42.0% of the portfolio volume is rated Aaa/AAA, 11.6% below investment grade
– During Q4, 10 positions have been downgraded whereof 5 positions from AAA
Mark-to-Market prices are applied to almost all positions – very small amount of inventory in level 3
Financials
Senior FRNs
Maturity is 6M - 5Y, weighted average life is 1.7Y
SEK 48bn
Volume in SEK bn (% of portfolio)
80%
17% 3%
Loans & Receivables (MTM not recorded) Held for Trading (MTM over income)Available for Sale (MTM over equity)
* Net of short and fully matched positions; excluding holdings in the insurance business
Portfolio breakdown by geography, 31 Dec, 2010 and financial effects
1.70.9%4.9%0.0%0.0%0.1%RMBS non-prime
10.70.0%2.7%15.9%5.1%12.2%
RMBS prime
1.00.0%3.2%0.0%0.0%0.0%CMO
3.00.0%0.6%7.7%0.0%1.8%CMBS
8.80.0%13.6%
15.5%0.0%0.5%CLO
2.40.0%3.8%3.9%0.0%0.4%CDO
2.10.0%1.6%3.5%2.1%0.0%ABS
29.60.9%30.4%
46.4%7.2%15.1%
Structured Credits
7.80%0%3.9%96.1%0%Covered Bonds
10.91.7%56.6%
31.9%0.0%9.8%Financials
Total Volume
Australia/NZ
USEurope Other
SpainUKProduct
1.70.9%4.9%0.0%0.0%0.1%RMBS non-prime
10.70.0%2.7%15.9%5.1%12.2%
RMBS prime
1.00.0%3.2%0.0%0.0%0.0%CMO
3.00.0%0.6%7.7%0.0%1.8%CMBS
8.80.0%13.6%
15.5%0.0%0.5%CLO
2.40.0%3.8%3.9%0.0%0.4%CDO
2.10.0%1.6%3.5%2.1%0.0%ABS
29.60.9%30.4%
46.4%7.2%15.1%
Structured Credits
7.80%0%3.9%96.1%0%Covered Bonds
10.91.7%56.6%
31.9%0.0%9.8%Financials
Total Volume
Australia/NZ
USEurope Other
SpainUKProduct Q1 Q2 Q3 Q4
SEK m 2010 2010 2010 2010 2008 2009 2010
Structured credits 94 19 9 -6 -1,070 -433 116
Financial institutions -11 -41 0 -9 -29 -52
Covered bonds etc. 0 0 3 -7 10 15 -4
Income effect 83 -22 12 -13 -1,069 -447 60
Structured credits 237 61 255 68 -1,460 642 621
Financial institutions 51 26 75 49 -667 501 201
Covered bonds etc. -83 -639 -136 -239 -780 230 -1,097
Equity effect 205 -552 193 -122 -2,907 1 373 -276
Total recognised 288 -574 205 -135 -3,976 926 -216
Structured credits 799 1,317 655 240 -6,086 528 3,011
Financial institutions 253 -572 171 -72 -789 843 -220
Covered bonds etc. 6 -15 3 0 2 -6
Fair value of
reclassified securities 1,058 730 829 168 -6,875 1,373 2,785
Total fair value 1,346 156 1,034 33 -10,851 2,299 2,569
=

SEB Fact Book Annual Accounts 2010 46
Divisional structure
Operating profit before credit loss provisions per division
Jan – Dec 2010 vs. Jan – Dec 2009
Business equity, SEK bn 28.2 9.7 5.3 6.0 11.8 ***Return on equity, % 21.7 18.9 22.5 32.3 NegCost / income ratio 0.49 0.65 0.62 0.51 0.73Tax Rate, % 28.0 26.0 28.0 12.0 10
-2,000
0
2,000
4,0006,000
8,000
10,000
12,000
14,000
Merchant Banking Retail Banking * Wealth Management Life Baltic
Jan-Dec 2009 Jan-Dec 2010
**
* Retail ex. Germany
** Where of Sweden 7.1bn and Cards 2.6bn
*** Where of Estonia 3.5bn, Latvia 4.3bn and Lithuania 4.0bn
Average shareholder's equity SEK 98.9bn =Continuing operations
RoE isolated per quarter, %
Q1
2009
Q2
2009
Q3
2009
Q4
2009
Q1
2010
Q2
2010
Q3
2010
Q4
2010
SEB Group 5.6 -0.1 1.0 1.6 3.3 8.4 8.5 14.6Merchant Banking 24.4 26.3 23.2 19.9 19.9 24.9 20.8 21.0Retail 21.8 17.3 19.3 20.9 17.2 17.1 20.9 20.3Wealth Management 10.8 13.4 14.6 21.1 20.1 23.5 17.6 29.8Life based on op profit 24.2 27.0 28.8 29.5 35.1 30.4 33.0 30.6Life based on business result 30.0 47.4 40.4 38.3 48.5 41.7 56.5 50.9Baltic neg neg neg neg neg neg 15.2 23.4
RoE accumulated in the period, %
Q1
2009
Q2
2009
Q3
2009
Q4
2009
Q1
2010
Q2
2010
Q3
2010
Q4
2010
SEB Group 5.6 2.5 2.0 1.9 3.3 5.8 6.7 8.7Merchant Banking 24.4 25.3 24.6 23.4 19.9 22.4 21.9 21.7Retail 21.8 19.5 19.5 19.8 17.2 17.1 18.4 18.9Wealth Management 10.8 12.1 12.9 14.9 20.1 21.5 20.2 22.5Life based on op profit 24.2 25.6 26.7 27.4 35.1 32.8 32.9 32.3Life based on business result 30.0 38.7 39.3 39.0 48.5 45.1 48.9 49.4Baltic neg neg neg neg neg neg neg neg =RWA per division, basel I
SEK m
Q1
2009
Q2
2009
Q3
2009
Q4
2009
Q1
2010
Q2
2010
Q3
2010
Q4
2010
SEB Group 1137.3 1080.3 1019.3 1003.3 993.7 1007.9 984.2 998.3Merchant Banking 620.5 578.1 534.7 517.6 508.3 519.5 496.9 504.2Retail 298.9 303.8 304.4 311.4 316.0 319.1 322.0 332.3Wealth Management 25.2 26.0 23.4 22.4 24.4 24.7 24.9 26.8Baltic 141.9 132.6 121.3 115.0 104.2 99.0 95.2 90.9Other 50.8 39.9 35.6 36.8 40.9 45.6 45.3 44.1
RWA per division, Basel II
SEK m
Q1
2009
Q2
2009
Q3
2009
Q4
2009
Q1
2010
Q2
2010
Q3
2010
Q4
2010
SEB Group 830.2 789.6 747.4 730.5 723.3 714.2 711.4 716.1
Merchant Banking 470.6 445.9 425.4 404.0 393.6 387.9 388.2 386.9
Retail 156.8 152.7 148.5 149.6 160.1 162.5 162.1 168.1
Wealth Management 42.2 34.5 30.4 31.4 31.3 31.8 31.4 32.7
Baltic 114.1 108.9 98.6 100.8 92.0 88.8 83.6 79.3
Other 46.5 47.7 44.5 44.7 46.3 43.1 46.1 49.1 =

SEB Fact Book Annual Accounts 2010 47
Merchant Banking
Q4 Q3 Q4
SEK m 2010 2010 % 2009 % 2010 2009 %
Net interest income 2,133 2,012 6 1,978 8 8,123 9,982 - 19
Net fee and commission income 1,515 1,290 17 1,531 -1 5,308 5,647 - 6
Net financial income 655 753 -13 712 -8 3,745 4,377 - 14
Total operating income 4,369 3,896 12 4,120 6 17,130 20,052 - 15
Total operating expenses -2,296 -1,870 23 -1,642 40 -8,465 -7,818 8
Profit before credit losses 2,073 2,026 2 2,478 -16 8,665 12,234 - 29
Net credit losses -99 -23 -52 90 -195 -805 - 76
Operating profit 2,003 2,002 0 2,425 -17 8,498 11,428 - 26
Cost/Income ratio 0.53 0.48 0.40 0.49 0.39Return on equity, % 21.0 20.8 19.9 21.7 23.4
Jan - Dec
=
43%
39%
18%
Income Operating profit
12%
44%
44%
Trading and Capital Markets
Trading and Capital Markets
Global Transaction Services
CorporateBanking
Global Transaction Services
CorporateBanking
Total = SEK 17,130m Total = SEK 8,498m
Income, Expenses and Operating profit, SEK m
0
1,000
2,000
3,000
4,000
5,000
6,000
7,000
Q2-07 Q4-07 Q2-08 Q4-08 Q2-09 Q4-09 Q2-10 Q4-10
Excl. MTM in investment portfolio Income Expenses
=
0
500
1,000
1,500
2,000
2,500
3,000
3,500
4,000
Q2-07 Q4-07 Q2-08 Q4-08 Q2-09 Q4-09 Q2-10 Q4-10
Operating profit Excl. MTM in investment portfolio
=

SEB Fact Book Annual Accounts 2010 48
Market leader in bonds and syndicated corporate loans
Source: Bloomberg
20.3%
17.0%
14.8%
14.8%
12.4%
SEB
Nordea
DnB NOR
Swedbank
Danske Markets 8.6%
9.8%
11.7%
15.0%
15.2%SEB
Nordea
DnB NOR
Credit Agricole
Danske Markets
Scandinavian Domestic BondsJan – Dec 2010
Nordic Syndicated Corporate Loans Bookrunner*Jan – Dec 2010
* Exclusion of shipping, fishing, aerospace and connected businesses
Source: Bloomberg =
Nordic leader in investment banking
Source: The Nordic Stock exchanges
4.7%
4.8%
6.3%
6.9%
9.0%
Nordnet
Carnegie
Credit Suisse
SHB
SEB
2,626
3,880
3,921
4,749
6,273
Nordea
Morgan Stanley
JP Morgan
SEB
Goldman Sachs
Nordic ECM transactions, by Bookrunner*Jan – Dec 2010 (EUR m)
Market shares Nordic and Baltic stock exchanges Jan – Dec 2010
* Rank based on IPOs or follow-ons, Nordic stock exchanges
Source: Dealogic
5 Deals
32 Deals
4 Deals
4 Deals
12 Deals
5 Deals
32 Deals
4 Deals
4 Deals
12 Deals
=
1,642
1,865
1,948
2,719
4,133
JP Morgan
Goldman Sachs
Citi
SEB
Morgan Stanley
Swedish M&A*Jan – Dec 2010 (EUR m)
* Rank based on completed deals. All Swedish involvement.
Source: Thomson Reuters
11 Deals
20 Deals
2 Deals
2 Deals
3 Deals
11 Deals
20 Deals
2 Deals
2 Deals
3 Deals

SEB Fact Book Annual Accounts 2010 49
Trading and Capital Markets income by main Corporate Banking product cluster, excl. investment portfolios Total operating income
39%36%38%
63%
41%38%33%28%26% 36% 44%
46%34% 38% 41% 36%
30%28%
29%
19%
45%44%
59%46%44%50% 46%
21%
24%
22% 30%30%
28%32%
29%
21%
6%3%11%15%22% 8%
12%
30%34%
34%22% 28%
3%4%
4%
6%
8%5%
7%8% 11%
6%
3% 8%
6%
7%
Q1 -
07
Q2 Q3 Q4 Q1 -
08
Q2 Q3 Q4 Q1 -
09
Q2 Q3 Q4 Q1 -
10
Q2 Q3 Q4
FXStructured Derivatives and other TCM
EquitiesCapital Markets
FXStructured Derivatives and other TCM
EquitiesCapital Markets
-2%
-3%
0
200
400
600
800
1,000
1,200
1,400
1,600
1,800
2,000
Q1
-07
Q2 Q3 Q4 Q1
-08
Q2Q3 Q4Q1
-09
Q2Q3 Q4 Q1
-10
Q2 Q3 Q4
SEK m
=Custody volume development
0
1,000
2,000
3,000
4,000
5,000
6,000
7,000
2004 2005 2006 2007 2008 2009 20100
30,000
60,000
90,000
120,000
150,000
180,000
210,000
Assets under custody, SEK bn No of transactions/day
NB: CCP (Central Counterparty Clearing House) introduced in autumn of 2009, affecting number of transactions going forward =Merchant Banking – rankings
SEB awarded best client relationship bank in SwedenDecember 2010
Ranked no. 1 arranger of Scandinavian Domestic BondsDecember 2010Bloomberg
SEB awarded best innovation by a bank for its cash flow hedging solutionDecember 2010FOW
SEB Enskilda ranked best stockbroker in the Nordic regionDecember 2010
SEB Enskilda - Financial Adviser of the year in the NordicsDecember 2010Financial Times & Mergermarket
The corporate bank of the yearSeptember 2010Finansbarometern
Best Research House in Sweden June 2010
Best FX Provider in the Nordic region as well as in Latvia and LithuaniaNovember 2010
SEB top ranked as lead arranger of corporate syndicated loans in SwedenNovember 2010
Best Bank for Scandinavian Currencies November 2010
Best bank in the Nordic and Baltic region for Real Estate products and servicesSeptember 2010Finansbarometern
SEB Enskilda voted best Danish equity research firm in DenmarkSeptember 2010
Best Investment Bank in FinlandJuly 2010
No.1 in Securities Lending - European Prime BrokerageAugust 2010
Best Brokerage Firm Nordic Countries by Extel SurveysJune 2010

==
SEB Fact book Annual Accounts 2010 50
Retail Banking Q4 Q3 Q4
SEK m 2010 2010 % 2009 % 2010 2009 %
Net interest income 1,332 1,263 5 1,278 4 5,008 5,424 -8
Net fee and commission income 849 774 10 862 -2 3,241 3,254 0
Net financial income 74 58 28 84 -12 273 292 -7
Total operating income 2,267 2,109 7 2,242 1 8,569 9,034 -5
Total operating expenses -1,453 -1,364 7 -1,258 16 -5,541 -5,303 4
Profit before credit losses 814 745 9 984 -17 3,028 3,731 -19
Net credit losses -144 -56 157 -223 -35 -543 -840 -35
Operating profit 670 688 -3 761 -12 2,484 2,891 -14
Cost/Income ratio 0.64 0.65 0.56 0.65 0.59Return on equity, % 20.3 20.9 20.9 18.9 19.8
Jan - Dec
=
68%
32%
SwedenCards
Income Operating profit
Total = SEK 8,569m Total = SEK 2,484m
58%
42%
SwedenCards
=
Income, Expenses and Operating profit, SEK m
Operating profit
0
500
1,000
1,500
2,000
Q2-
07
Q4-
07
Q2-
08
Q4-
08
Q2-
09
Q4-
09
Q2-
10
Q4-
10
0
500
1,000
1,500
2,000
2,500
3,000
3,500
Q2-
07
Q4-
07
Q2-
08
Q4-
08
Q2-
09
Q4-
09
Q2-
10
Q4-
10
Income Expenses
Restated for Retail Germany divestment from Q1 2008=

SEB Fact Book Annual Accounts 2010 51
Business volume development by area
SEK bn Q4 2010 change vs. Q4 2009 (local currency)
Retail Sweden
309
175
71
Mortgages
Other
lending
Deposits
50%
10%
24%
16%
Transaction account privateTransaction account corporate & publicSavings account privateSavings account corporate & public
Deposit breakdown, Percent of total depositsDec 2010
+12%
+7%
+11%
=
Net interest income and volumes
Retail Sweden
Mortgages
0
100
200
300
400
Q2 07 Q4 Q2 08 Q4 Q2 09 Q4 Q2 10 Q4
0.0
0.5
1.0
1.5
2.0
Other lending*
0
10
20
30
40
50
60
70
Q2 07 Q4 Q2 08 Q4 Q2 09 Q4 Q2 10 Q4
0.0
0.5
1.0
1.5
2.0
2.5
3.0
3.5
Deposits
0
40
80
120
160
200
Q2 07 Q4 Q2 08 Q4 Q2 09 Q4 Q2 10 Q4
0.0
0.5
1.0
1.5
2.0
2.5
Net Interest Income distribution
0
100
200
300
400
500
600
700
Mortgages Other lending Deposits
Q1 2007 – Q4 2010 Private Margins
Private Margins Private Margins
%
%%
* Excluding leasing
CorporateSEK bn
SEK bnSEK bn
SEK m
CorporateCorporate
==

SEB Fact Book Annual Accounts 2010 52
Swedish mortgages private market
Fixed / floating interest rates, market share, per cent
0%
20%
40%
60%
80%
100%
Q1
2007
Q2 Q3 Q4 Q1
2008
Q2 Q3 Q4 Q1
2009
Q2 Q3 Q4 Q1
2010
Q2 Q3 Q4
0%
5%
10%
15%
20%
25%Floating Fixed
SalesVolume
Note: Fixed as presented here include mortgages with interest rate fixed for 1 year or moreFloating as presented here include mortgages with interest rate fixed for 3 months or less =
Market share development
Sweden, per cent
CorporatePrivate
Mortgages*
0
5
10
15
20
Q2
06
Q4 Q2
07
Q4 Q2
08
Q4 Q2
09
Q4 Q2
10
Q4
Other lending
0
5
10
15
20
Q2
06
Q4 Q2
07
Q4 Q2
08
Q4 Q2
09
Q4 Q2
10
Q4
Deposits
0
5
10
15
20
25
30
Q2
06
Q4 Q2
07
Q4 Q2
08
Q4 Q2
09
Q4 Q2
10
Q4
Note: Other lending and deposits=SEB Parent Bank Sweden, i.e. not only Retail Sweden* New measurement method from Q4 2007. Lowers the volume market share with approximately 0.2 percentage points =

SEB Fact Book Annual Accounts 2010 53
Cards
Turnover cards
20
30
40
50
60
70
Q2
2005
Q4 Q2
2006
Q4 Q2
2007
Q4 Q2
2008
Q4 Q2
2009
Q4 Q2
2010
Q4
SEK bn Number of cards
2.6
2.8
3.0
3.2
3.4
Q2
2005
Q4 Q2
2006
Q4 Q2
2007
Q4 Q2
2008
Q4 Q2
2009
Q4 Q2
2010
Q4
Millions
= Note: Adjustment of inactive cards in Q4 2010
==
SEB Kort has the exclusive right to use the
Eurocard
brand in:
Sweden Norway Denmark Estonia Latvia Lithuania Switzerland Russia Ukraine Poland
Diners Club
brand in:
Sweden Norway Finland Denmark Estonia Latvia Lithuania Iceland
=

SEB Fact Book Annual Accounts 2010 54
Wealth Management Q4 Q3 Q4
SEK m 2010 2010 % 2009 % 2010 2009 %
Net interest income 136 118 15 116 17 485 598 -19
Net fee and commission income 1,115 830 34 853 31 3,752 2,955 27
Net financial income 30 17 76 23 30 89 76 17
Total operating income 1,285 972 32 995 29 4,384 3,646 20
Total operating expenses -745 -651 14 -584 28 -2,736 -2,505 9
Profit before credit losses 540 321 68 411 31 1,648 1,141 44
Net credit losses 7 -1 -8 -188 3 -28 -111
Operating profit 547 320 71 402 36 1,651 1,142 45
Cost/Income ratio 0.58 0.67 0.59 0.62 0.69Return on equity, % 29.8 17.6 21.1 22.5 14.9
Jan - Dec
==
67%
33%
Private BankingInstitutional Clients
Income
64%
36%
Operating profit
Private BankingInstitutional Clients
Total = SEK 4,384m Total = SEK 1,651m
=
Income, Expenses and Operating profit, SEK m
=
0
100
200
300
400
500
600
700
800
Q2-07 Q4-07 Q2-08 Q4-08 Q2-09 Q4-09 Q2-10 Q4-10
Operating profit
0
200
400
600
800
1,000
1,200
1,400
1,600
Q2-07 Q4-07 Q2-08 Q4-08 Q2-09 Q4-09 Q2-10 Q4-10
Income Expenses
=

SEB Fact Book Annual Accounts 2010 55
AuM per customer type, SEK bn
39% 38% 38% 39% 39% 40% 40% 40% 40% 41% 40% 39% 39% 39% 41% 41%
48% 48% 47% 47% 46% 46% 45% 45% 45% 44% 46% 48% 48% 46% 45% 44%
13%14% 15% 15% 15% 15% 15% 15% 15%
15% 14%13% 13% 15% 15%
15%
1,2661,320 1,300 1,285 1,256 1,217 1,181 1,142 1,128
1,201 1,2201,275 1,300 1,258 1,271
1,321
Q1-07 Q2-07 Q3-07 Q4-07 Q1-08 Q2-08 Q3-08 Q4-08 Q1-09 Q2-09 Q3-09 Q4-09 Q1-10 Q2-10 Q3-10 Q4-10
Mutual Funds Institutional Clients ex MF Private Clients ex MF
=Total Net Sales per quarter, SEK bn
The figures are not eliminated.
7.6
16.4 15.5
6.32.0
8.2 9.0
-2.04.2
9.9
-3.4
19.914.2
3.0 4.2
4.1
2.9 2.6
3.55.8
4.9 5.3
3.0
4.7
4.9
4.6
3.1
6.0
5.89.4
9.2
4.3
-5
0
5
10
15
20
25
Q1-07 Q2-07 Q3-07 Q4-07 Q1-08 Q2-08 Q3-08 Q4-08 Q1-09 Q2-09 Q3-09 Q4-09 Q1-10 Q2-10 Q3-10 Q4-10
Institutional Clients Private Banking
=Mutual funds per product type
Q1
2007
Q2
2007
Q3
2007
Q4
2007
Q1
2008
Q2
2008
Q3
2008
Q4
2008
Q1
2009
Q2
2009
Q3
2009
Q4
2009
Q1
2010
Q2
2010
Q3
2010
Q4
2010
Equity funds 46% 48% 45% 42% 36% 36% 32% 27% 28% 32% 34% 37% 38% 36% 37% 40%
Fixed income funds 23% 21% 23% 24% 25% 25% 26% 28% 29% 27% 26% 25% 25% 27% 27% 23%
Balanced funds 12% 13% 12% 12% 12% 12% 13% 14% 13% 14% 14% 14% 14% 15% 15% 16%
Alternative funds 19% 18% 20% 21% 28% 28% 29% 31% 30% 27% 26% 24% 23% 22% 22% 21% =
Activity level – Wealth
Source: Svensk Fondstatistik
Mutual Funds Net Sales SwedenCumulative Jan 2005 – Dec 2010, including PPMSEK m
Distribution per type of fundJan – Dec 2010
-40%
-20%
0%
20%
40%
60%
80%
100%
SEB Total
Equity funds Mixed fundsShort bond funds Long bond fundsAlternative funds
-40,000
-20,000
0
20,000
40,000
60,000
80,000
Jan 05 Jan 06 Jan 07 Jan 08 Jan 09 Jan 10
SEB
SHB
Robur
Nordea
=

SEB Fact Book Annual Accounts 2010 56
Life Q4 Q3 Q4
SEK m 2010 2010 % 2009 % 2010 2009 %
Total operating income 1,101 1,141 -4 1,144 -4 4,539 4,425 3
Total operating expenses -579 -578 0 -574 1 -2,337 -2,310 1
Operating profit 522 563 -7 570 -8 2,202 2,115 4
Change in surplus values, net 345 400 -14 170 103 1,165 900 29
Business result 867 963 -10 740 17 3,367 3,015 12
Cost/Income ratio 0.53 0.51 0.50 0.51 0.52Return on equity, % based on operating profit 30.6 33.0 29.5 32.3 27.4 based on business result 50.9 56.5 38.3 49.4 39.0
Jan - Dec
=
66%
25%
9%
Income Operating profit
Sweden
Denmark
International
8%
24%
68%
Sweden
Denmark
International
Sweden including central functions etc
Total = SEK 4,539m Total = SEK 2,202m
=
Income, Expenses and Operating profit, SEK m
0
200
400
600
800
1,000
1,200
Q4-07 Q2-08 Q4-08 Q2-09 Q4-09 Q2-10 Q4-10
Income Expenses Operating profit
0
100
200
300
400
500
600
Q4-07 Q2-08 Q4-08 Q2-09 Q4-09 Q2-10 Q4-10=

SEB Fact Book Annual Accounts 2010 57
Market position by profit area
Market shares, gross premium income, Unit-linked insurances, (%, Q3 2010)
25
15
12
17
23
0% 50% 100%
Lithuania
Latvia***
Estonia
Denmark**
Sweden*
SEB Market share Competitors
1
2
3
3
2
SEB
Rank
* Sweden based on new sales 12 months to September 2010** Denmark unit-linked insurance in competitive markets from June 2010
*** Latvia latest information from March 2010
Market shares Sweden, per cent
Premium income unit-linked, 12 months to September 2010 (September 2009)
SEB Trygg Liv 23.4% (26.1%)
Skandia 6.1% (15.4%)
LF 9.1% (11.2%)
Swedbank 5.6% (7.8%)
SHB 8.2% (4.2%)
Danica 2.4% (2.6%)
Folksam 21.1% (9.1%)
AMF 7.2% (1.7%)
Moderna 4.3% (6.8%)
Nordea 7.0% (8.3%)
SPP 5.2% (8.3%)
Other 0.4% (0.3%)
Source: Swedish insurance federation
* Markets share statistics published with 2-month lag
Sales volume weighted
Life Division total sales, SEK m
Jan – Dec Jan – Dec
2010 2009 Change
Unit linked 41,376 40,399 2%
Traditional andSickness/health 7,111 10,267 -31%
Total 48,487 50,666 -4%
Unit-linked sales, Sweden, SEK m
27,099
34,90031,600
26,68230,436
33,467 32,709
2004 2005 2006 2007 2008 2009 2010
34.6 32.4 29.1 22.5 24.3 26.7 23.4**
* Including Swedish customers of the Irish subsidiary
** September 2010 figures (latest)
Market share Sweden %
New business profit
Life (2006 only Swedish market), SEK m
Full year Full year Full year Full year Full year2006 2007 2008 2009 2010
New sales (single/10+regular) 3,345 3,689 3,858 4,026 3,964
Net present value 1,788 1,775 1,598 1,492 1,536
Acquisition cost -970 -901 -879 -916 -929
New business profit 818 874 719 576 607
Margin, % - 23.7 18.6 14.3 15,3
Swedish market 24.5 22.9 20.8 16.2 17,1

==
SEB Fact book Annual Accounts 2010 58
Details on Life
The division is responsible for SEB’s life insurance operations and is
one of the leading Nordic life insurance groups. The division is
organised in three business areas:
• SEB Trygg Liv (Sweden)
• SEB Pension (Denmark)
• SEB Life & Pension International
The operations comprise insurance products in the area of
investments and social security for private individuals and
companies. The division has 1.8 million customers and is active in
Sweden, Denmark, Finland, Ireland, Luxembourg, Estonia, Latvia,
Lithuania and Ukraine. The main part of the traditional life insurance
operations in Sweden is conducted through the mutually operated
insurance company Gamla Livförsäkringsaktiebolaget SEB Trygg Liv
and therefore not consolidated with the division’s result. Gamla Liv is
closed for new business. The traditional insurance business
conducted in Nya Livförsäkringsaktiebolaget SEB Trygg Liv (Nya Liv)
was merged with the unit-linked company
Fondförsäkringsaktiebolaget SEB Trygg Liv in October 2007. After
the merger, the result of this business – with respect to investment
income and insurance risk – is still allocated to the policyholders.
However, SEB Trygg Liv guarantees the contractual benefits to the
policyholders in this business.
Comments on 2010
Operating profit increased by 4 per cent to SEK 2,202m (2,115).
Excluding the effect of recovered guarantee provisions in Swedish
traditional insurance, profit rose by 16 per cent. Operating income
amounted to SEK 4,539m which was SEK 114m higher than last year.
Adjusted for guarantee recoveries, income increased by SEK 324m or
8 per cent. The unit-linked income rose by SEK 425m or 21 per cent.
The fund values as well as the relative share of equity related funds,
continued to increase. Income from other insurance, mainly
traditional insurance and risk products such as sickness and health
insurance, decreased by SEK 172m. Guarantee recoveries amounted
to SEK 76m (286). The remaining guarantee provisions amount to
SEK 29m in total. The provisions are related to previous
depreciations of investment assets in Swedish traditional insurance
and recoverable when future investment returns are adequate to
meet guaranteed bonus levels. Apart from guarantee recoveries
income from other insurance increased by SEK 38m and was mainly
related to risk insurance in the Swedish business. Other income
decreased by SEK 139m or 19 per cent mainly as a result of lower
return in investment portfolios for own account. Other items included
in other income, such as IPS - Individual Pension Savings and other
administrative fees, were stable. Total expenses increased by 1 per
cent to SEK 2,337m (2,310).
The effect of depreciated currencies in foreign subsidiaries,
affected income negatively by 4 per cent. Expenses were positively
affected by 4 per cent.
Operating profit in SEB Trygg Liv Sweden, including central
functions, increased by SEK 112m to SEK 1,505m. Recoveries in
guarantee commitments were SEK 210m lower than last year.
Excluding the recoveries operating profit was up by SEK 322m or 29
per cent due to higher unit-linked income and improvement within
sickness and health insurance. Expenses increased by 8 per cent.
Operating profit in SEB Pension Denmark decreased by SEK 53m to
SEK 521m. Currency translation effects contributed negatively by
SEK 59m. In local currency total income was unchanged and
expenses decreased by 1 per cent. Operating profit in SEB Life &
Pension International increased by SEK 28m to SEK 176m.
Total assets under management amounted to SEK 424bn (402).
The value of the unit-linked funds increased by 15 per cent to
SEK 179bn. 8 per cent was related to net inflow and 7 per cent to
appreciation of fund investments. Gamla Liv’s part of total assets
under management was SEK 159bn, other traditional insurance
accounted for 81bn and risk products for 5bn. In addition to this,
SEK 6bn was managed for the division’s own account.
Total sales weighted volume decreased by SEK 0.6bn or 1 per
cent in local currencies to 48.5bn. In Sweden sales decreased with 2
per cent to SEK 34.1bn, the corporate sales improved with SEK 1.4bn
or 8 per cent. The unit-linked product Portfolio Bond (depot
endowment insurance) increased by SEK 0.3bn. This product is
accounted for in the business area International, but is primarily sold
to Swedish customers. In Denmark, unit-linked sales increased by
SEK 1.6bn whereas sales of other products decreased by SEK 3.0bn.
Sales in the Baltic region and in Ukraine increased with 9 per cent to
SEK 1.3bn.
SEB Trygg Liv, Sweden
The Swedish operation is partly conducted according to a bank
assurance concept and partly through distribution via insurance
mediators and other external partners. The bank assurance concept
involves an integrated banking and insurance operation with
distribution through SEB’s branch offices and own sales personnel.
The purpose of the concept is to offer SEB’s customers a complete
range of products and services within the financial area. Pension
savings represent almost half of the Swedish households’ financial
assets. According to the SEB “Sparbarometer”, the share was 49 per
cent at 30 September 2010.
Market position
Sales focus is on unit-linked, which represents some 95 per cent of
total sales. SEB Trygg Liv is the market leader in Sweden within unit-
linked insurance. The market share for the twelve month period to
September 2010 was 23.4 per cent (26.1). The drop is due to the re-
election of occupational pension within the SAF-LO agreement where
SEB Trygg Liv doesn’t participate.
Significant occupational pension business
The corporate share is recoverering slightly after falling since the
beginning of 2008 due to the weak economic development during
the past years. During the 2010 the corporate share was 60 per cent
(54). For the twelve month period to September 2010, SEB Trygg
Liv’s market share in new sales unit-linked occupational pension was
17.9 per cent (18.2). SEB Trygg Liv also offers administration and
management of pension foundations.
Strong also in the private market
In the private market, SEB Trygg Liv has a strong position within new
business unit-linked endowment insurance, which has shown a
strong growth. The market share for the twelve month period to
September 2010 was 35.2 per cent (37.2). Sales of private pension

SEB Fact Book Annual Accounts 2010= 59
savings other than endowment insurance are relatively stable. SEB’s
sales in this area consist mainly of IPS - Individual Pension Savings
and “Enkla Pensionen”, a unit-linked product with a guarantee.
SEB Pension, Denmark
The traditional life insurance operation of SEB Pension Denmark is
carried out in a profit-sharing company and therefore included in the
division’s result. By hedging the investment portfolios, the market
and investment risks are managed in relation to guaranteed
commitments to policyholders. Variations in investment returns can
be absorbed largely by accumulated buffer funds, called “collective
bonus potential”.
At 31 December 2009, DKK 252m were placed in a “shadow
account”, according to Danish legislation regarding shareholder fee
available for distribution in profit-sharing traditional life insurance.
The amount is considered as restricted equity and not available for
dividend to the owners of the company. The company receive
interest income during the period when the amount is restricted in
the shadow account. The whole amount has been dissolved during
the current year.
SEB Pension’s products
SEB Pension sells savings, life, sickness and disability insurance to
private individuals and corporate clients through own sales
personnel, insurance mediators and Codan Forsikring.
Savings insurance is available both as unit-linked and traditional
insurance. In the Danish private market, unit-linked insurance
dominates whereas traditional insurance still accounts for the major
part of sales in the corporate market. Some collective agreements do
not allow sole unit-linked insurance solutions in occupational
pension plans.
The trend is that the market for non-traditional life insurance
such as unit-linked is expanding. The growth is mainly in the
corporate segment, sold mainly by insurance mediators.
Growing occupational pension market
Since year 2000, it is mainly the Danish occupational pension market
that grows, while the private market is relatively unchanged.
SEB Pension‘s development has been in line with the general
trend. Measured in terms of premium income, SEB Pension has a
total market share of 11 per cent. The market share in the unit-linked
segment is 17 per cent. Danica is the dominating company with a
market share of 27 and 46 per cent, respectively. All market share
figures are in the peer group / competitive market segment for the
first six months of 2010.
Distribution
Most insurance companies, including SEB Pension, have developed
specialised private pension sales units that primarily concentrate on
high-salary groups and customers with qualified advisory
requirements.
Insurance mediators and the insurance companies’ corporate
sales personnel are the two dominant sales channels in the
occupational pension market.
SEB Life & Pension International
SEB Life & Pension International includes subsidiaries in Ireland,
Estonia, Latvia, Lithuania, Ukraine and branch offices in Luxembourg
and Finland.
The operations of the Irish company SEB Life (Ireland) are
focused primarily on sales of Portfolio Bond (depot endowment
insurance). Sales are primarily concentrated on the Swedish market.
The branch office in Luxembourg focuses on sales via SEB Private
Banking to Swedes living abroad. Since 2008, the Finnish branch
office focuses on sales to the Finnish market.
The Baltic subsidiaries concentrate primarily on unit-linked
insurance, but offer traditional insurance and sickness/disability
insurance as well. More than 80 per cent of the sales volume is to
private individuals.
Risk
The supervisory authorities in Sweden and Denmark are using a
traffic light model for measuring insurance companies’ exposure to
various risks. The model estimates a capital buffer based on the fair
value of assets and liabilities using realistic assumptions. Thereafter
the companies are exposed to a number of fictitious stress scenarios
which is determined by the regulators. The scenarios give rise to an
overall capital requirement imposed on the companies.
If the estimated buffer is not sufficient the traffic light model
show a red light, causing regulators to execute a more thorough
review of both quantitative and qualitative nature. Both
Fondförsäkringaktiebolaget SEB Trygg Liv and SEB Pension have a
reassuring capital buffer as of 31 December 2010. The companies are
therefore in a green light.

SEB Fact Book Annual Accounts 2010= 60
Income statement
Q 1 Q 2 Q 3 Q 4 Q 1 Q 2 Q 3 Q 4 Full year Full yearSEKm 2009 2009 2009 2009 2010 2010 2010 2010 2009 2010
Income unit-linked 437 491 536 584 585 609 611 668 2,048 2,473
Income other insurance 1) 448 448 373 395 427 363 392 310 1,664 1,492
Other income 2) 148 204 196 165 172 141 138 123 713 574Total operating income 1,033 1,143 1,105 1,144 1,184 1,113 1,141 1,101 4,425 4,539
Operating expenses -627 -620 -550 -651 -652 -625 -577 -630 -2,448 -2,484Other expenses -1 -23 -3 0 -1 -1 -6 -5 -27 -13Change in deferred acquisition costs 63 21 4 77 67 32 5 56 165 160Total expenses -565 -622 -549 -574 -586 -594 -578 -579 -2,310 -2,337
Operating profit 468 521 556 570 598 519 563 522 2,115 2,202
Change in surplus value, net 111 395 224 170 229 191 400 345 900 1,165
Business result 579 916 780 740 827 710 963 867 3,015 3,367
Financial effects due to market fluctuations 3) -282 1,132 652 517 292 -538 138 662 2,019 554
Change in assumptions 3) -32 -253 35 -459 12 1 14 -379 -709 -352
Total result 265 1,795 1,467 798 1,131 173 1,115 1,150 4,325 3,569
Business equity 6,800 6,800 6,800 6,800 6,000 6,000 6,000 6,000 6,800 6,000
Return on business equity 4)
based on operating profit, % 24.2 27.0 28.8 29.5 35.1 30.4 33.0 30.6 27.4 32.3 based on business result, % 30.0 47.4 40.4 38.3 48.5 41.7 56.5 50.9 39.0 49.4Premium income, gross 7,919 7,347 6,588 8,751 8,527 7,491 6,698 7,752 30,605 30,468
Expense ratio, % 5) 7.9 8.4 8.3 7.4 7.6 8.3 8.6 8.1 8.0 8.2
Operating profit by business area
SEB Trygg Liv, Sweden 277 403 387 412 391 349 376 424 1,479 1,540SEB Pension, Denmark 180 147 120 127 151 158 151 61 574 521SEB Life & Pension, International 25 3 68 52 59 29 50 38 148 176Other including central functions etc -14 -32 -19 -21 -3 -17 -14 -1 -86 -35
468 521 556 570 598 519 563 522 2,115 2,2021) Effect of guarantee commitments in
traditional insurance in Sweden 106 103 34 43 24 -10 12 50 286 76 Reclassification compared to previous reporting 8 -59 -44 -12 -1072) Reclassification compared to previous reporting -8 59 44 12 1073) Effect on surplus values4) Annual basis after 12 per cent tax which reflects the divisions effective tax rate5) Operating expenses as percentage of premium income

SEB Fact Book Annual Accounts 2010= 61
Sales volume insurance (weighted)
==
Sales SPE
Life including the Baltics from 2006
0%
20%
40%
60%
80%
100%
2005 2006 2007 2008 2009 2010
IndividualCorporate
Note: SPE = Single premiums plus regular premiums times ten
0%
20%
40%
60%
80%
100%
2005 2006 2007 2008 2009 2010
Traditional and sickness/healthUnit-linked
Traditional vs. unit-linked Individual vs. corporate
=
Q 1 Q 2 Q 3 Q 4 Q 1 Q 2 Q 3 Q 4 Full year Full year
SEKm 2009 2009 2009 2009 2010 2010 2010 2010 2009 2010
Total 12,912 13,268 11,042 13,444 13,507 11,967 10,699 12,314 50,666 48,487
Traditional life and sickness/health insurance 2,663 2,771 2,507 2,326 1,871 1,754 1,548 1,938 10,267 7,111
Unit-linked insurance 10,249 10,497 8,535 11,118 11,636 10,213 9,151 10,376 40,399 41,376
Corporate paid 8,260 8,047 7,154 7,393 8,045 7,437 7,709 8,091 30,854 31,282
Corporate as per cent of total 64% 61% 65% 55% 60% 62% 72% 66% 61% 65%
SEB Trygg Liv Sweden 8,086 7,987 6,452 8,697 8,067 7,470 7,032 7,804 31,222 30,373
Traditional life and sickness/health insurance 401 280 252 407 341 356 322 403 1,340 1,422
Unit-linked insurance 7,685 7,707 6,200 8,290 7,726 7,114 6,710 7,401 29,882 28,951
Corporate paid 5,103 4,266 3,859 4,612 4,644 4,404 5,100 5,133 17,840 19,281
Corporate as per cent of total 63% 53% 60% 53% 58% 59% 73% 66% 57% 63%
SEB Pension Denmark 3,459 3,771 3,586 3,289 3,882 3,137 2,579 3,146 14,105 12,744
Traditional life and sickness insurance 2,080 2,245 2,087 1,677 1,399 1,228 1,126 1,338 8,089 5,091
Unit-linked insurance 1,379 1,526 1,499 1,612 2,483 1,909 1,453 1,808 6,016 7,653
Corporate paid 2,873 3,327 3,157 2,558 3,056 2,658 2,266 2,529 11,915 10,509
Corporate as per cent of total 83% 88% 88% 78% 79% 85% 88% 80% 84% 82%
SEB Life & Pension International 1,367 1,510 1,004 1,458 1,558 1,360 1,088 1,364 5,339 5,370
Traditional life and sickness insurance 182 246 168 242 131 170 100 197 838 598
Unit-linked insurance 1,185 1,264 836 1,216 1,427 1,190 988 1,167 4,501 4,772
Corporate paid 284 454 138 223 345 375 343 429 1,099 1,492
Corporate as per cent of total 21% 30% 14% 15% 22% 28% 32% 31% 21% 28%

SEB Fact Book Annual Accounts 2010= 62
Premium income and Assets under management
Q 1 Q 2 Q 3 Q 4 Q 1 Q 2 Q 3 Q 4 Full year Full year
SEKm 2009 2009 2009 2009 2010 2010 2010 2010 2009 2010
Premium income: Total 7,919 7,347 6,588 8,751 8,527 7,491 6,698 7,752 30,605 30,468
Traditional life and sickness/health insurance 2,309 1,975 1,905 2,913 1,993 1,662 1,332 1,959 9,102 6,946Unit-linked insurance 5,610 5,372 4,683 5,838 6,534 5,829 5,366 5,793 21,503 23,522
SEB Trygg Liv Sweden 4,508 4,179 3,938 4,670 4,808 4,137 3,882 4,290 17,295 17,117
Traditional life and sickness/health insurance 777 655 643 943 672 560 517 651 3,018 2,400Unit-linked insurance 3,731 3,524 3,295 3,727 4,136 3,577 3,365 3,639 14,277 14,717
SEB Pension Denmark 2,071 1,804 1,778 2,807 2,152 2,184 1,943 2,326 8,460 8,605
Traditional life and sickness/health insurance 1,436 1,220 1,167 1,859 1,235 1,004 738 1,199 5,682 4,176Unit-linked insurance 635 584 611 948 917 1,180 1,205 1,127 2,778 4,429
SEB Life & Pension International 1,340 1,364 872 1,274 1,567 1,170 873 1,136 4,850 4,746
Traditional life and sickness/health insurance 96 100 95 111 86 98 77 109 402 370Unit-linked insurance 1,244 1,264 777 1,163 1,481 1,072 796 1,027 4,448 4,376
Assets under management:* Total 347,000 371,800 392,100 401,700 410,700 405,300 413,600 424,100 401,700 424,100
Traditional life and sickness/health insurance 230,600 237,900 247,000 245,300 246,200 241,600 244,600 244,600 245,300 244,600Unit-linked insurance 116,400 133,900 145,100 156,400 164,500 163,700 169,000 179,500 156,400 179,500
SEB Trygg Liv Sweden 235,800 255,200 273,700 282,400 290,100 284,300 292,600 303,900 282,400 303,900
Traditional life and sickness/health insurance 145,000 151,300 161,500 162,100 164,300 160,300 164,800 168,100 162,100 168,100Unit-linked insurance 90,800 103,900 112,200 120,300 125,800 124,000 127,800 135,800 120,300 135,800
SEB Pension Denmark 94,000 96,300 96,100 95,000 94,500 94,300 93,700 91,400 95,000 91,400
Traditional life and sickness/health insurance 84,500 85,500 84,400 82,100 80,800 80,200 78,700 75,400 82,100 75,400Unit-linked insurance 9,500 10,800 11,700 12,900 13,700 14,100 15,000 16,000 12,900 16,000
SEB Life & Pension International 17,200 20,300 22,300 24,300 26,100 26,700 27,300 28,800 24,300 28,800
Traditional life and sickness/health insurance 1,100 1,100 1,100 1,100 1,100 1,100 1,100 1,100 1,100 1,100Unit-linked insurance 16,100 19,200 21,200 23,200 25,000 25,600 26,200 27,700 23,200 27,700
* rounded to whole 100 millions. From Q4 2009 investments for own account are excluded. Previously this was included in traditional insurance. By year-end 2009 this amount was 5,200 (Sweden 1,800, Denmark 2,800 and International 600).
SEK bn
368
311
395 408
354
402424
0
100
200
300
400
500
2004 2005 2006 2007 2008 2009 2010
Traditional and Risk Unit-linked
Assets under management, (net assets)
30
17
3129
26
3131
0
5
10
15
20
25
30
35
2004 2005 2006 2007 2008 2009 2010
Traditional and Risk Unit-linked
Premium income gross

SEB Fact Book Annual Accounts 2010= 63
Surplus value accounting Excluding traditional insurance in Denmark Traditional insurance
Denmark*
Q 4 Q 1 Q 2 Q 3 Q 4 Full year Full year Q 4 Q 1 Q 2 Q 3 Q 4 Full year
Full
year
SEKm 2009 2010 2010 2010 2010 2009 2010 2009 2010 2010 2010 2010 2009 2010
Surplus values, opening balance 13,423 13,656 14,363 14,006 14,540 11,549 13,656 1,335 1,272 1,190 1,178 1,158 1,111 1,272
Adjustment opening balance 1) 1 203 5 -65 208 -6 -6
Present value of new sales 2) 433 412 362 352 410 1,556 1,536 29 17 20 17 12 112 66
Return/realised value on policies from previous periods -86 -103 -115 -122 -130 -287 -470 -40 -34 -35 -37 -33 -150 -139
Actual outcome compared to assumptions 3) -100 -13 -24 175 121 -204 259 7 -16 4 -4 -30 205 -46Change in surplus values ongoing business, gross 247 296 223 405 401 1,065 1,325 -4 -33 -11 -24 -51 167 -119
Capitalisation of acquisition costs for the period -233 -231 -195 -165 -221 -776 -812
Amortisation of capitalised acquisition costs 156 164 163 160 166 611 653
Change in surplus values ongoing business, net 4)
170 229 191 400 346 900 1,166 -4 -33 -11 -24 -51 167 -119
Financial effects due to short term market fluctuations 5) 517 292 -538 138 662 2,019 554 -5 4 2 42 56 64 104
Change in assumptions 6) -459 12 1 14 -380 -709 -353 -65 12 31 10 24 5 77Total change in surplus values 228 533 -346 552 628 2,210 1,367 -74 -17 22 28 29 236 62
Exchange rate differences etc 4 -29 -11 -23 -14 -38 -77 11 -65 -28 -48 -23 -75 -164
Surplus values, closing balance 7)
13,656 14,363 14,006 14,540 15,154 13,656 15,154 1,272 1,190 1,178 1,158 1,164 1,272 1,164
Most important assumptions (Swedish customer base - which represent 96 per cent of the surplus value), per cent.
Discount rate 7.5 7.5Surrender of endowment insurance contracts:contracts signed within 1 year / 1-4 years / 5 years / 6 years / thereafter
1 / 8 /15 / 9 / 9
1 / 7 /15 / 12 / 8
Lapse rate of regular premiums, unit-linked 11 11Growth in fund units, gross before fees and taxes 5.5 5.5Inflation CPI / Inflation expenses 2 / 3 2 / 3Expected return on solvency margin 4 4Right to transfer policy, unit-linked 2 2Mortality The Group's experience
Sensitivity to changes in assumptions (total division).
Change in discount rate +1 per cent -1,493 -1,585 " -1 per cent 1,716 1,829Change in value growth +1 per cent 1,492 1,615of investment assets -1 per cent -1,329 -1,430
* Not included in the total figures for the division.
7) Estimated surplus value according to the above are not included in the SEB Group's consolidated accounts. The closing balance is shown after the deduction of capitalised acquisition costs (SEK 3,631m at December 31, 2010).
1) Effects from adjustments of the calculation method.2) Sales defined as new contracts and extra premiums in existing contracts.
3) The reported actual outcome of contracts signed can be placed in relation to the operative assumptions that were made. Thus, the value of the deviations can be estimated. The most important components
consist of extensions of contracts as well as cancellations. However, the actual income and administrative expenses are included in full in the operating result.4) Deferred acquisition costs are capitalised in the accounts and amortised according to plan. The reported change in surplus values i therefore adjusted by the net result of the capitalisation and amortisation during the period.5) Assumed unit growth is 5.5 per cent gross (before fees and taxes). Actual growth results in positive or negative financial effects.
6) The negative effect during Q4 2009 was mainly due to assumed higher frequency of transfer of policies. Assumed lower administration costs per policy had a positive effect.
Surplus values
Surplus values are the present values of future profits from written
insurance policies. They are calculated to better evaluate the
profitability of a life insurance business since an insurance policy
often has a long duration. Income accrues regularly throughout the
duration of the policy. Costs, on the other hand, mainly arise at the
point of sale, which leads to an imbalance between income and costs
at the time when a policy is signed.
The reporting is according to international practice and is reviewed
by an external party annually. Surplus values are not consolidated in
the SEB Group accounts.
Surplus values relating to the traditional business in Denmark are not
included in the total surplus values for the division. Profit distribution
between shareholders and policyholders in this business is defined
by the so-called contribution principle. Surplus values are therefore
the net present value of future profits allocated to the shareholders.
As for unit-linked, the calculations are based on different
assumptions, which are adjusted as required to correspond to the
long-term actual development.
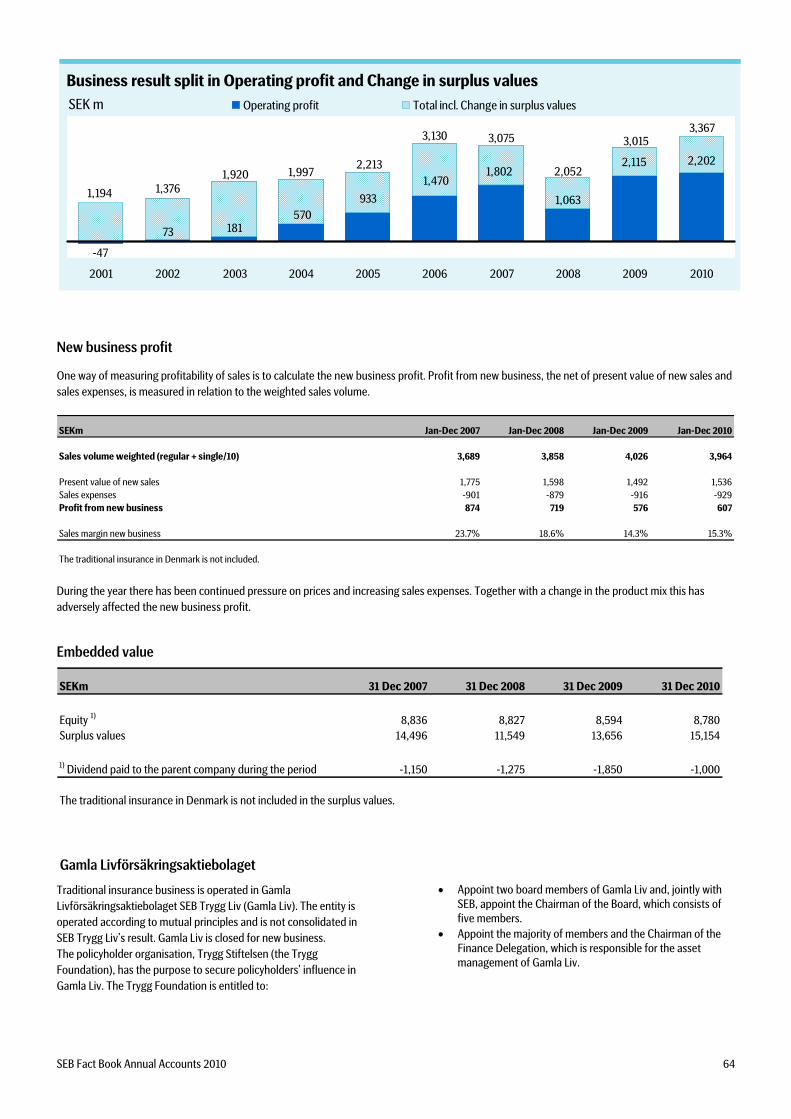
SEB Fact Book Annual Accounts 2010= 64
2,052
3,3673,0753,130
2,2131,9971,920
1,3761,194
3,015
-47
73 181570
933
1,4701,802
1,063
2,115 2,202
2001 2002 2003 2004 2005 2006 2007 2008 2009 2010
Operating profit Total incl. Change in surplus valuesSEK m
Business result split in Operating profit and Change in surplus values
New business profit
One way of measuring profitability of sales is to calculate the new business profit. Profit from new business, the net of present value of new sales and
sales expenses, is measured in relation to the weighted sales volume.
SEKm Jan-Dec 2007 Jan-Dec 2008 Jan-Dec 2009 Jan-Dec 2010
Sales volume weighted (regular + single/10) 3,689 3,858 4,026 3,964
Present value of new sales 1,775 1,598 1,492 1,536Sales expenses -901 -879 -916 -929Profit from new business 874 719 576 607
Sales margin new business 23.7% 18.6% 14.3% 15.3%
The traditional insurance in Denmark is not included.
During the year there has been continued pressure on prices and increasing sales expenses. Together with a change in the product mix this has
adversely affected the new business profit.
Embedded value
SEKm 31 Dec 2007 31 Dec 2008 31 Dec 2009 31 Dec 2010
Equity 1) 8,836 8,827 8,594 8,780Surplus values 14,496 11,549 13,656 15,154
1) Dividend paid to the parent company during the period -1,150 -1,275 -1,850 -1,000
The traditional insurance in Denmark is not included in the surplus values.
Gamla Livförsäkringsaktiebolaget
Traditional insurance business is operated in Gamla
Livförsäkringsaktiebolaget SEB Trygg Liv (Gamla Liv). The entity is
operated according to mutual principles and is not consolidated in
SEB Trygg Liv’s result. Gamla Liv is closed for new business.
The policyholder organisation, Trygg Stiftelsen (the Trygg
Foundation), has the purpose to secure policyholders’ influence in
Gamla Liv. The Trygg Foundation is entitled to:
Appoint two board members of Gamla Liv and, jointly with SEB, appoint the Chairman of the Board, which consists of five members.
Appoint the majority of members and the Chairman of the Finance Delegation, which is responsible for the asset management of Gamla Liv.

=
SEB Fact Book Annual Accounts 2010 65
Baltic Q4 Q3 Q4
SEK m 2010 2010 % 2009 % 2010 2009 %
Net interest income 481 442 9 522 -8 1,869 2,679 -30
Net fee and commission income 213 229 -7 221 -4 877 934 -6
Net financial income -7 8 -188 31 -123 63 126 -50
Total operating income 697 700 0 831 -16 2,846 3,794 -25
Total operating expenses -662 * -459 44 -622 6 -2,089 -4,571 -54
Profit before credit losses 35 241 -85 209 -83 757 -777 -197
Net credit losses 736 273 170 -2,584 -128 -873 -9,569 -91
Operating profit 767 514 49 -2,391 -132 -121 -10,363 -99
Cost/Income ratio 0.95 0.66 0.75 0.73 1.20Return on equity, % 23.4 15.2 negative negative negative
* Including SEK 199m Core banking system impairment in Lithuania Q4 2010
Goodwill writedown SEK 2,299m in 2009
Jan - Dec
==
31%
28%
41%
Latvia
Estonia
Lithuania
Income Profit before credit losses
Total = SEK 757 m
SEK m
Total = SEK 2,846 m
306
255
196
Estonia
Latvia
Lithuania
=
Income, Expenses and Operating profit, SEK m
Operating profit
-2,500
-1,500
-500
500
1,500
Q2-07 Q4-07 Q2-08 Q4-08 Q2-09 Q4-09 Q2-10 Q4-100
200
400
600
800
1,000
1,200
1,400
1,600
Q2-07 Q4-07 Q2-08 Q4-08 Q2-09 Q4-09 Q2-10 Q4-10
Income Expenses
* Adjusted for goodwill write-down in Q2 2009
*
*
==

SEB Fact Book Annual Accounts 2010= 66
Business volume development by area
SEK bn
Q4 2010 change vs. Q4 2009 (local currency)
27
16
19
18
8
13
Lithuania
Latvia
Estonia
Mortgages Other lending
25
12
20
Deposits
(-2%)
(-7%)
(-5%)
(-13%)
(-17%)
(-16%)
(+5%)
(+2%)
(+1%)
Transaction account private Transaction account corporate & public
Savings account private Savings account corporate & public
Deposit breakdown, Percent of total deposits, Dec 2010
Estonia Latvia Lithuania
18%24%
48%
10%
18%
13%
41%
28% 28%
4%
39%
29%
=
Baltic Lending market shares
Per cent, Q1 2006 – Q4 2010
EstoniaSEB Swedbank DnB NOR Nordea Sampo/Danske Bank
Estonia
0%
10%
20%
30%
40%
50%
Q2
06
Q4 Q2
07
Q4 Q2
08
Q4 Q2
09
Q4 Q2
10
Q4
Latvia
0%
10%
20%
30%
40%
50%
Q2
06
Q4 Q2
07
Q4 Q2
08
Q4 Q2
09
Q4 Q2
10
Q4
Lithuania
0%
10%
20%
30%
40%
50%
Q2
06
Q4 Q2
07
Q4 Q2
08
Q4 Q2
09
Q4 Q2
10
Q4
Source: Bank of Estonia, Association of Latvian Banks, Association of Lithuanian Banks, SEB Group =

SEB Fact Book Annual Accounts 2010= 67
Net interest income and volumes
Baltic Estonia, EEK
Mortgages
0
10
20
30
40
50
Q1
07
Q2 Q3 Q4 Q1
08
Q2 Q3 Q4 Q1
09
Q2 Q3 Q4 Q1
10
Q2 Q3 Q4
0.0
0.5
1.0
1.5
2.0
Other lending
0
10
20
30
40
50
Q1
07
Q2 Q3 Q4 Q1
08
Q2 Q3 Q4 Q1
09
Q2 Q3 Q4 Q1
10
Q2 Q3 Q4
0.0
0.5
1.0
1.5
2.0
Deposits
0
10
20
30
40
50
Q1
07
Q2 Q3 Q4 Q1
08
Q2 Q3 Q4 Q1
09
Q2 Q3 Q4 Q1
10
Q2 Q3 Q4
0.0
0.5
1.0
1.5
2.0
Net Interest Income distribution
0
20
40
60
80
100
120
140
160
Mortgages Other lending Deposits
Outstanding volume Margin%
Outstanding volume Margin%
Outstanding volume Margin%
EEK m EEK bn
EEK bn EEK bn
Q1 2007 – Q4 2010
Baltic Latvia, LVL
Mortgages
0.0
0.5
1.0
1.5
2.0
Q1
07
Q2 Q3 Q4 Q1
08
Q2 Q3 Q4 Q1
09
Q2 Q3 Q4 Q1
10
Q2 Q3 Q4
0.0
0.5
1.0
1.5
2.0
Other lending
0.0
0.5
1.0
1.5
2.0
Q1
07
Q2 Q3 Q4 Q1
08
Q2 Q3 Q4 Q1
09
Q2 Q3 Q4 Q1
10
Q2 Q3 Q4
0.0
0.5
1.0
1.5
2.0
2.5
Deposits
0.0
0.5
1.0
1.5
2.0
Q1
07
Q2 Q3 Q4 Q1
08
Q2 Q3 Q4 Q1
09
Q2 Q3 Q4 Q1
10
Q2 Q3 Q4
0.0
1.0
2.0
3.0
4.0
Net Interest Income distribution
0
2
4
6
8
10
12
14
Mortgages Other lending Deposits
Outstanding volume Margin%
Outstanding volume Margin%
Outstanding volume Margin%
LVL bn
LVL bn LVL bn
Q1 2007 – Q4 2010
LVL m

SEB Fact Book Annual Accounts 2010= 68
Baltic Lithuania, LTL
Mortgages
0
5
10
15
20
25
Q1
07
Q2 Q3 Q4 Q1
08
Q2 Q3 Q4 Q1
09
Q2 Q3 Q4 Q1
10
Q2 Q3 Q4
0.0
0.5
1.0
1.5
2.0
2.5
Other lending
0
5
10
15
20
25
Q1
07
Q2 Q3 Q4 Q1
08
Q2 Q3 Q4 Q1
09
Q2 Q3 Q4 Q1
10
Q2 Q3 Q4
0.0
0.5
1.0
1.5
2.0
2.5
Deposits
0
5
10
15
20
25
Q1
07
Q2 Q3 Q4 Q1
08
Q2 Q3 Q4 Q1
09
Q2 Q3 Q4 Q1
10
Q2 Q3 Q4
0.0
0.5
1.0
1.5
2.0
2.5
Net Interest Income distribution
0
20
40
60
80
100
Mortgages Other lending Deposits
Outstanding volume Margin%
Outstanding volume Margin%
Outstanding volume Margin%
LTL bn
LTL bn LTL bn
Q1 2007 – Q4 2010LTL m
Real Estate holding companies
Baltic countries
SEK m
2008
Q4
2009
Q1
2009
Q2
2009
Q3
2009
Q4
2010
Q1
2010
Q2
2010
Q3
2010
Q4
Seized assets 0 0 0 0 50 50 158 293 399
Baltic division vs. geography*
0
200
400
600
800
1,000
1,200
Q3 2010 Q4 2010
Operating profit, division Operating profit, country
Operating income, division Operating income, country
SEK m
The division encompasses the retail and all lending operations in Estonia, Latvia and Lithuania. In the Fact Book on
page 20, the full Baltic geographical segmentation is reported including the operations in Merchant Banking,
Wealth Management and Life.
C/I ratio
Division 0.66 0.66Country 0.58 0.57
* Excluding SEK 199m Core banking system impairment in Lithuania Q4 2010

SEB Fact Book Annual Accounts 2010= 69
Macro Nordic Countries GDP, year-on-year % change
Nordic Countries unemployment, % of labour force
Nordic countries export, year-on-year % change
Nordic countries key interest rates
Baltic countries GDP, year-on-year % change
Baltic countries unemployment, % of labour force
Baltic countries Retail sales, year-on year % change
Baltic countries export, year-on-year % change
-25
-20
-15
-10
-5
0
5
10
15
-00 -01 -02 -03 -04 -05 -06 -07 -08 -09 -10
Estonia Latvia Lithuania
0
5
10
15
20
25
-00 -01 -02 -03 -04 -05 -06 -07 -08 -09 -10
Estonia Latvia Lithuania
-60
-40
-20
0
20
40
60
80
-00 -01 -02 -03 -04 -05 -06 -07 -08 -09 -10
Estonia Latvia Lithuania
-10
-5
0
5
10
15
20
25
-00 -01 -02 -03 -04 -05 -06 -07 -08 -09 -10
Finland Sweden Denmark Norway
0
2
4
6
8
10
12
-00 -01 -02 -03 -04 -05 -06 -07 -08 -09 -10
Finland Sweden Denmark Norway
-60
-40
-20
0
20
40
60
80
100
-00 -01 -02 -03 -04 -05 -06 -07 -08 -09 -10
Finland Sweden Denmark Norway
0
2
4
6
8
10
-00 -01 -02 -03 -04 -05 -06 -07 -08 -09 -10
Riksbank Sweden Norges Bank
-40
-30
-20
-10
0
10
20
30
-00 -01 -02 -03 -04 -05 -06 -07 -08 -09 -10
Estonia Latvia Lithuania

SEB Fact Book Annual Accounts 2010= 70
Swedish housing market
House prices
Residential investments
Number of housing starts
Interest rate payments share of income
Labour market situation==
Household savings ratio=
Household debt as share of GDP
0
50
100
150
200
250
300
350
400
-92 -93 -94 -95 -96 -97 -98 -99 -00 -01 -02 -03 -04 -05 -06 -07 -08 -09 -10
Germany Denmark Spain FinlandUK Netherlands Norway SwedenUnited States France
Index
0
1
2
3
4
5
6
7
8
9
10
-93 -94 -95 -96 -97 -98 -99 -00 -01 -02 -03 -04 -05 -06 -07 -08 -09 -10
Germany Denmark Spain Finland
UK Norway Sweden France
% of GDP
0.0
0.2
0.4
0.6
0.8
1.0
1.2
1.4
1.6
1.8
2.0
-92 -93 -94 -95 -96 -97 -98 -99 -00 -01 -02 -03 -04 -05 -06 -07 -08
Sweden Norway DenmarkUK United States Spain
No of housing starts compared to population, %
0
20
40
60
80
100
120
140
160
180
200
220
240
1981 1984 1987 1990 1993 1996 1999 2002 2005 2008 2011
0
1
2
3
4
5
6
7
8
9
10
11
12Debt Interest rate expenditure after tax
4,100
4,200
4,300
4,400
4,500
4,600
4,700
-05 -06 -07 -08 -09 -10 -11 -120
1
2
3
4
5
6
7
8
9
10Employment Unemployment
-10
-5
0
5
10
15
20
-90 -91 -92 -93 -94 -95 -96 -97 -98 -99 -00 -01 -02 -03 -04 -05 -06 -07 -08 -09 -10 -11
Germany Denmark Spain Finland UK
Netherlands Norway Sweden France
Savings ratio
0
20
40
60
80
100
120
140
160
-90 -91 -92 -93 -94 -95 -96 -97 -98 -99 -00 -01 -02 -03 -04 -05 -06 -07 -08 -09
Germany Denmark Spain Finland
France Netherlands Sweden UK
% of GDP

SEB Fact Book Annual Accounts 2010= 71
Macro forecasts per country
2009 2010F 2011F 2012F 2009 2010F 2011F 2012F
Denmark* -4.7 2.2 2.2 2.1 1.1 2.2 2.1 2.1
Finland* -8.1 2.7 3.0 2.8 1.6 1.5 2.1 2.0
Norway -1.4 0.5 2.3 2.2 2.1 2.4 1.4 2.2
Sweden -5.1 5.0 3.5 2.5 -0.3 1.2 2.0 2.1
Germany* -4.7 3.6 2.5 1.8 0.2 1.1 1.4 1.5
Euro zone* -4.1 1.6 1.7 1.5 0.3 1.5 1.3 1.4
Estonia* -13.9 2.5 4.0 4.0 0.2 2.7 3.0 4.0
Latvia* -18.0 -0.3 4.0 5.0 3.3 -1.2 1.3 1.5
Lithuania* -14.7 1.0 4.0 4.5 4.2 1.0 2.0 3.0
Russia -7.9 3.7 4.3 5.0 11.7 6.8 7.5 7.4
Ukraine -15.1 5.2 4.4 4.2 15.9 9.5 10.9 10.1
Sources: National statistical agencies, SEB Economic Research
* Harmonised consumer price index
GDP (%) Inflation (%)
=
SEB Fact Book Annual Accounts 2010= 72
=Ulf Grunnesjö
Head of
Investor Relations
Phone: +46 8 763 8501
Mobile: +46 70 763 8501
Email:
=Thomas Bengtson
Debt Investor Relations and
Treasury Officer
Phone: +46 8-763 8150
Mobile: +46 70-763 8150
Email:
Per Andersson
Investor Relations Officer Phone: +46 8 763 8171
Mobile: +46 70 667 7481
Email:
Viveka Hirdman–Ryrberg
Head of Communications
Phone: +46 8 22 19 00
Mobile: +46 70 550 35 00
Email:
viveka.hirdman-
Ola Kallemur
Head of Media Relations
Phone: +46 8 763 9947
Mobile: +46 763 975466
Email:
Financial calendar
Date Event 17 January – 3 February Silent period 4 February Annual Accounts for 2010 8 February Nordic Outlook 3 March Annual Report on www.sebgroup.com 23 March Eastern European Outlook 24 March Annual General Meeting 25 March The share is traded ex dividend 29 March Proposed record date for dividend 11 April – 2 May Silent period 3 May Interim Report January-March 2011 17 May Nordic Outlook 4 July – 13 July Silent period 14 July Interim Report January-June 2011 30 August Nordic Outlook 10 October – 26 October Silent period 27 October Interim Report January-September 2011 22 November Nordic Outlook

SEB Fact Book Annual Accounts 2010= 73
Definitions Return on equity Net profit attributable to equity holders for the year as a percentage of average shareholders equity. Return on business equity Operating profit reduced by a standard tax rate per division, as a percentage of business equity. Return on total assets Net profit as a percentage of average assets. Return on risk-weighted assets Net profit as a percentage of average risk-weighted assets. Cost/Income-ratio Total operating expenses as a percentage of total operating income. Basic earnings per share Net profit attributable to equity holders for the year as a percentage of the average number of shares. Diluted earnings per share Net profit attributable to equity holders for the year as a percentage of the average diluted number of shares. Adjusted shareholders’ equity per share Shareholders’ equity plus the equity portion of any surplus values in the holdings of interest-bearing securities and surplus value in life insurance operations as a percentage of the number of shares at year-end. Net worth per share Shareholders’ equity plus the equity portion of any surplus values in the holdings of interest-bearing securities and surplus value in life insurance operations as a percentage of the number of shares. Risk-weighted assets Total assets and off balance sheet items, weighted in accordance with capital adequacy regulation for credit risk. It is customary to also express regulatory capital requirements for market and operational risk as risk-weighted assets, yielding a total RWA number for these three risk categories. Defined only for the Financial Group of Undertakings which excludes insurance entities. Tier 1 capital Shareholders’ equity excluding proposed dividend, deferred tax assets, intangible assets (e.g. bank-related goodwill) and certain other adjustments. Tier 1 capital can also include qualifying forms of subordinated loans (Tier 1 capital contribution) Tier 2 capital Mainly subordinated loans not qualifying as Tier 1 capital contribution. Dated loans give a maturity-dependent reduction, and some further adjustments are made. Capital base The sum of Tier 1 and Tier 2 capital. Deductions should be made for investments in insurance companies and pension surplus values.
Tier 1 capital ratio Tier 1 capital as a percentage of risk-weighted assets. Total capital ratio The capital base as a percentage of risk-weighted assets. Credit loss level Net credit losses as a percentage of the opening balance of loans to the public, loans to credit institutions and loan guarantees less specific, collective and off balance sheet reserves. Gross level of impaired loans Individually assessed impaired loans, gross, as a percentage of loans to the public and loans to credit institutions before reduction of reserves. Net level of impaired loans Individually assessed impaired loans, net (less specific reserves) as a percentage of net loans to the public and loans to credit institutions less specific reserves and collective reserves. Specific reserve ratio for individually assessed impaired loans Specific reserves as a percentage of individually assessed impaired loans. Total reserve ratio for individually assessed impaired loans Total reserves (specific reserves and collective reserves for individually assessed loans) as a percentage of individually assessed impaired loans. Reserve ratio for portfolio assessed loans Collective reserves for portfolio assessed loans as a percentage of portfolio assessed loans past due more than 60 days or restructured. Non-Performing-Loans Loans deemed to cause probable credit losses including individually assessed impaired loans, portfolio assessed loans past due more than 60 days and restructured portfolio assessed loans. NPL coverage ratio Total reserves (specific, collective and off balance sheet reserves) as a percentage of Non-performing loans. NPL % of lending Non-performing loans as a percentage of loans to the public and loans to credit institutions before reduction of reserves.
Credit portfolio
Total credit exposure comprises the Group's credit portfolio (loans,
leasing agreements, contingent liabilities and counterparty risks
arising from derivatives contracts), repos and debt instruments.
Exposures are presented before reserves. Derivatives and repos are
reported after netting agreements but before collateral
arrangements and includes add-ons for potential future exposure.
Debt instruments comprise all interest-bearing instruments held for
investment, treasury and client trading purposes, and includes
instruments reclassified as Loans & Receivables. Debt instruments
in the insurance division are excluded.