Fact Book - Duquesne University · Angela Chirumbolo, Senior Research Analyst Kori Szelong,...
26
Clayton Elwood, Research Analyst Matt North, Director, Institutional Research and Planning Email: [email protected] The following is a preview of what will be provided in the complete edition of the Duquesne University Fact Book, available August 2014. We hope the preview will assist you with commonly used facts. Should you need additional information, please contact us at the number below. http://www.duq.edu/about/departments-and-offices/management-and-business/planning-budgeting-and-institutional-research Angela Chirumbolo, Senior Research Analyst Kori Szelong, Research Analyst, Editor 2014 Duquesne University Fact Book Office of Institutional Research and Planning 305 Administration Building 600 Forbes Ave. Pittsburgh, PA 15282 Tel: 412-396-4400 Fact Book 2014 Preview Duquesne University
Transcript of Fact Book - Duquesne University · Angela Chirumbolo, Senior Research Analyst Kori Szelong,...

Clayton Elwood, Research Analyst
Matt North, Director, Institutional Research and Planning
Email: [email protected]
The following is a preview of what will be provided in the complete edition of the Duquesne University Fact Book, available August 2014. We hope the preview will
assist you with commonly used facts. Should you need additional information, please contact us at the number below.
http://www.duq.edu/about/departments-and-offices/management-and-business/planning-budgeting-and-institutional-research
Angela Chirumbolo, Senior Research AnalystKori Szelong, Research Analyst, Editor 2014 Duquesne University Fact Book
Office of Institutional Research and Planning305 Administration Building
600 Forbes Ave.Pittsburgh, PA 15282
Tel: 412-396-4400
Fact Book
2014 Preview
Duquesne University
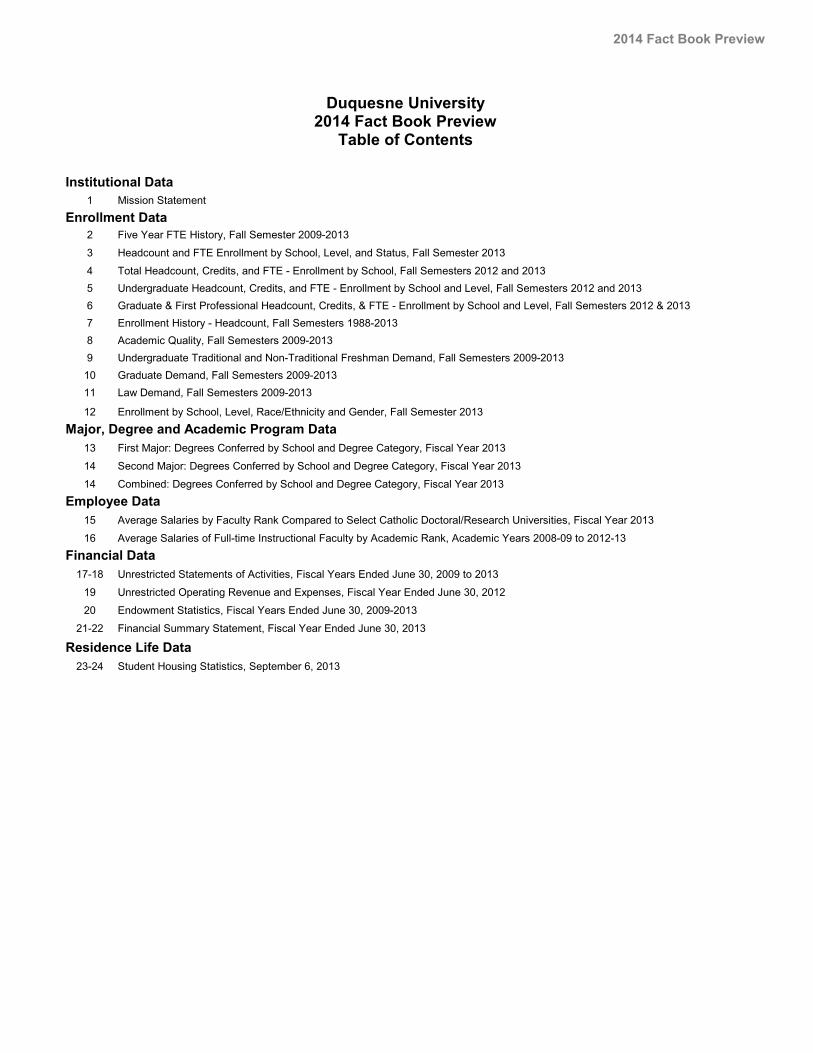
1 Mission Statement
Enrollment Data2 Five Year FTE History, Fall Semester 2009-2013
3 Headcount and FTE Enrollment by School, Level, and Status, Fall Semester 2013
4 Total Headcount, Credits, and FTE - Enrollment by School, Fall Semesters 2012 and 20135 Undergraduate Headcount, Credits, and FTE - Enrollment by School and Level, Fall Semesters 2012 and 20136 Graduate & First Professional Headcount, Credits, & FTE - Enrollment by School and Level, Fall Semesters 2012 & 20137 Enrollment History - Headcount, Fall Semesters 1988-20138 Academic Quality, Fall Semesters 2009-20139 Undergraduate Traditional and Non-Traditional Freshman Demand, Fall Semesters 2009-2013
10 Graduate Demand, Fall Semesters 2009-201311 Law Demand, Fall Semesters 2009-2013
12 Enrollment by School, Level, Race/Ethnicity and Gender, Fall Semester 2013
Major, Degree and Academic Program Data13 First Major: Degrees Conferred by School and Degree Category, Fiscal Year 2013
14 Second Major: Degrees Conferred by School and Degree Category, Fiscal Year 2013
14 Combined: Degrees Conferred by School and Degree Category, Fiscal Year 2013
Employee Data15 Average Salaries by Faculty Rank Compared to Select Catholic Doctoral/Research Universities, Fiscal Year 2013
16 Average Salaries of Full-time Instructional Faculty by Academic Rank, Academic Years 2008-09 to 2012-13
Financial Data17-18 Unrestricted Statements of Activities, Fiscal Years Ended June 30, 2009 to 2013
19 Unrestricted Operating Revenue and Expenses, Fiscal Year Ended June 30, 2012
20 Endowment Statistics, Fiscal Years Ended June 30, 2009-2013
21-22 Financial Summary Statement, Fiscal Year Ended June 30, 2013
Residence Life Data23-24 Student Housing Statistics, September 6, 2013
Duquesne University2014 Fact Book Preview
Table of Contents
Institutional Data
2014 Fact Book Preview

professional education, through profound concern for moral
Duquesne University of the Holy Spirit
Mission Statement
"Duquesne University of the Holy Spirit is a Catholic Universityfounded by members of the Congregation of the Holy Spirit,
the Spiritans, and sustained through a partnership of laityand religious. Duquesne serves God by serving students -
through a commitment to excellence in liberal and
and spiritual values, through the maintenance of anecumenical atmosphere open to diversity, and through
service to the Church, the community, the nation and the world."
2014 Fact Book Preview
1

SCHOOL 2009 2010 2011 2012 2013 5 YearPercent Δ
1 YearPercent Δ
Business 1,487 1,439 1,459 1,524 1,591 7.0% 4.4%Education 813 815 719 779 795 (2.2%) 2.1%Health Sciences 908 975 1,037 1,038 1,084 19.3% 4.4%Law 699 687 640 557 491 (29.7%) (11.8%)Leadership & Prof. Advancement 408 380 383 364 294 (27.9%) (19.2%)Liberal Arts 1,885 1,867 1,762 1,683 1,611 (14.5%) (4.3%)Music 342 343 327 310 333 (2.7%) 7.1%Natural & Env. Sciences 513 534 552 599 615 19.8% 2.7%Nursing 579 595 597 641 753 30.1% 17.4%Pharmacy 1,533 1,556 1,551 1,533 1,516 (1.1%) (1.1%)Spiritan 106 103 83 87 79 (25.5%) (9.3%)High School 2 3 2 1 1 (37.5%) 0.0%Other Units Not Included1 10 7 6 7 8 (13.5%) 17.4%TOTAL ENROLLMENT 9,283 9,303 9,119 9,123 9,171 (1.2%) 0.5%
1 Other units not included in governmental reporting: Cross-Registered, Visiting, Personal Goals, English as a Second Language, and Forensic Science and Law Certificates.
Note: 2009-2012 Values have been adjusted to match the current rounding methodology.Note: Total Credits and FTE totals may contain decimals not displayed.
Duquesne UniversityTotal Full-Time Equivalent Enrollment (FTE) by School
Fall 2009 - 2013
2014 Fact Book Preview
2
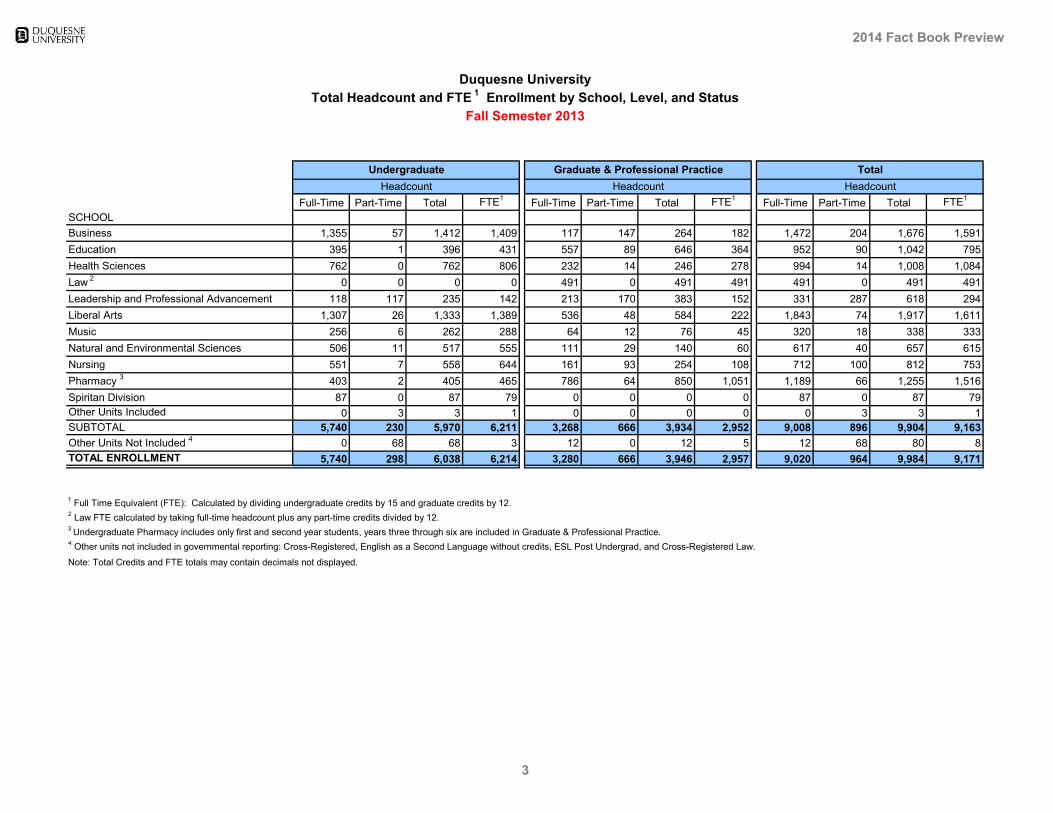
Full-Time Part-Time Total FTE1 Full-Time Part-Time Total FTE1 Full-Time Part-Time Total FTE1
SCHOOLBusiness 1,355 57 1,412 1,409 117 147 264 182 1,472 204 1,676 1,591Education 395 1 396 431 557 89 646 364 952 90 1,042 795Health Sciences 762 0 762 806 232 14 246 278 994 14 1,008 1,084Law 2 0 0 0 0 491 0 491 491 491 0 491 491Leadership and Professional Advancement 118 117 235 142 213 170 383 152 331 287 618 294Liberal Arts 1,307 26 1,333 1,389 536 48 584 222 1,843 74 1,917 1,611Music 256 6 262 288 64 12 76 45 320 18 338 333Natural and Environmental Sciences 506 11 517 555 111 29 140 60 617 40 657 615Nursing 551 7 558 644 161 93 254 108 712 100 812 753Pharmacy 3 403 2 405 465 786 64 850 1,051 1,189 66 1,255 1,516Spiritan Division 87 0 87 79 0 0 0 0 87 0 87 79Other Units Included 0 3 3 1 0 0 0 0 0 3 3 1SUBTOTAL 5,740 230 5,970 6,211 3,268 666 3,934 2,952 9,008 896 9,904 9,163Other Units Not Included 4 0 68 68 3 12 0 12 5 12 68 80 8TOTAL ENROLLMENT 5,740 298 6,038 6,214 3,280 666 3,946 2,957 9,020 964 9,984 9,171
1 Full Time Equivalent (FTE): Calculated by dividing undergraduate credits by 15 and graduate credits by 12.2 Law FTE calculated by taking full-time headcount plus any part-time credits divided by 12.3 Undergraduate Pharmacy includes only first and second year students, years three through six are included in Graduate & Professional Practice.4 Other units not included in governmental reporting: Cross-Registered, English as a Second Language without credits, ESL Post Undergrad, and Cross-Registered Law.
Note: Total Credits and FTE totals may contain decimals not displayed.
Headcount Headcount Headcount
Duquesne UniversityTotal Headcount and FTE 1 Enrollment by School, Level, and Status
Fall Semester 2013
Undergraduate Graduate & Professional Practice Total
2014 Fact Book Preview
3

2012 2013 Increase/ Percent 2012 2013 Increase/ Percent 2012 2013 Increase/ PercentHeadcount Headcount Decrease Change Credits Credits Decrease Change FTE1,5 FTE1 Decrease Change
SCHOOLBusiness 1,613 1,676 63 3.9% 22,365 23,315 950 4.2% 1,524 1,591 67 4.4%Education 1,064 1,042 (22) -2.1% 10,584 10,834 250 2.4% 779 795 17 2.1%Health Sciences 972 1,008 36 3.7% 14,766 15,430 664 4.5% 1,038 1,084 46 4.4%Law 2,3 557 491 (66) -11.8% 5,247 6,667 1,420 27.1% 557 491 (65) -11.8%Leadership & Professional Advancement 730 618 (112) -15.3% 4,892 3,953 (939) -19.2% 364 294 (70) -19.2%Liberal Arts 1,994 1,917 (77) -3.9% 24,514 23,502 (1,012) -4.1% 1,683 1,611 (72) -4.3%Music 330 338 8 2.4% 4,514 4,854 340 7.5% 310 333 22 7.1%Natural & Environmental Sciences 643 657 14 2.2% 8,790 9,044 254 2.9% 599 615 16 2.7%Nursing 708 812 104 14.7% 9,310 10,967 1,657 17.8% 641 753 112 17.4%Pharmacy 1,245 1,255 10 0.8% 19,710 19,591 (119) -0.6% 1,533 1,516 (17) -1.1%Spiritan Division 97 87 (10) -10.3% 1,305 1,184 (121) -9.3% 87 79 (8) -9.3%Other Units Included 3 3 0 0.0% 15 15 0 0.0% 1 1 0 0.0%SUBTOTAL 9,956 9,904 -52 -0.5% 126,012 129,355 3,344 2.7% 9,116 9,163 47 0.5%Other Units Not Included 4 89 80 (9) -10.1% 103 107 4 3.9% 7 8 1 14.6%TOTAL ENROLLMENT 10,045 9,984 (61) -0.6% 126,115 129,462 3,348 2.7% 9,123 9,171 48 0.5%
1 Full Time Equivalent (FTE): Calculated by dividing undergraduate credits by 15 and graduate credits by 12.2 Law FTE calculated by taking full-time headcount plus any part-time credits divided by 12.3 Due to a change in course structure, select law school credits have shifted to the fall term.4 Other units not included in governmental reporting: Cross-Registered, English as a Second Language without credits, ESL Post Undergrad, and Cross-Registered Law.5 Fall 2012 FTE values have been adjusted to match the current rounding methodology.
Note: Total Credits and FTE totals may contain decimals not displayed.
Duquesne UniversityTotal Headcount, Credits, and FTE 1 - Enrollment by School
Fall Semesters 2012 and 2013
2014 Fact Book Preview
4

2012 2013 Increase/ Percent 2012 2013 Increase/ Percent 2012 2013 Increase/ PercentHeadcount Headcount Decrease Change Credits Credits Decrease Change FTE1,4 FTE1 Decrease Change
SCHOOLBusiness 1,341 1,412 71 5.3% 20,380 21,136 756 3.7% 1,359 1,409 50 3.7%Education 384 396 12 3.1% 6,204 6,462 258 4.2% 414 431 17 4.2%Health Sciences 734 762 28 3.8% 11,521 12,096 575 5.0% 768 806 38 5.0%Law 0 0 0 - 0 0 0 - 0 0 0 -Leadership & Professional Advancement 279 235 (44) -15.8% 2,645 2,135 (510) -19.3% 176 142 (34) -19.3%Liberal Arts 1,397 1,333 (64) -4.6% 21,598 20,839 (759) -3.5% 1,440 1,389 (51) -3.5%Music 245 262 17 6.9% 3,940 4,318 378 9.6% 263 288 25 9.6%Natural & Environmental Sciences 498 517 19 3.8% 8,027 8,324 297 3.7% 535 555 20 3.7%Nursing 471 558 87 18.5% 8,083 9,667 1,584 19.6% 539 644 106 19.6%Pharmacy 2 383 405 22 5.7% 6,572 6,982 410 6.2% 438 465 27 6.2%Spiritan Division 97 87 (10) -10.3% 1,305 1,184 (121) -9.3% 87 79 (8) -9.3%Other Units Included 3 3 0 0.0% 15 15 0 0.0% 1 1 0 0.0%SUBTOTAL 5,832 5,970 138 2.4% 90,290 93,158 2,868 3.2% 6,019 6,211 191 3.2%Other Units Not Included 3 85 68 (17) -20.0% 77 47 (30) -39.0% 5 3 (2) -39.0%TOTAL ENROLLMENT 5,917 6,038 121 2.0% 90,367 93,205 2,838 3.1% 6,024 6,214 189 3.1%
1 Full Time Equivalent (FTE): Calculated by dividing undergraduate credits by 15.2 Undergraduate Pharmacy includes only first and second year students, years three through six are included in Graduate & Professional Practice.3 Other units not included in governmental reporting: Cross-Registered, English as a Second Language without credits.4 Fall 2012 FTE values have been adjusted to match the current rounding methodology.
Note: Total Credits and FTE totals may contain decimals not displayed.
Duquesne UniversityHeadcount, Credits, and FTE 1 - Enrollment by School and Level
Fall Semesters 2012 and 2013
Undergraduate
2014 Fact Book Preview
5

2012 2013 Increase/ Percent 2012 2013 Increase/ Percent 2012 2013 Increase/ PercentHeadcount Headcount Decrease Change Credits Credits Decrease Change FTE1,6 FTE1 Decrease Change
SCHOOLBusiness 272 264 (8) -2.9% 1,985 2,179 194 9.7% 165 182 16 9.7%Education 680 646 (34) -5.0% 4,380 4,372 (8) -0.2% 365 364 (1) -0.2%Health Sciences 238 246 8 3.4% 3,245 3,334 89 2.7% 270 278 7 2.7%Law 2,3 557 491 (66) -11.8% 5,247 6,667 1,420 27.1% 557 491 (66) -11.8%Leadership & Professional Advancement 451 383 (68) -15.1% 2,247 1,818 (429) -19.1% 187 152 (36) -19.1%Liberal Arts 597 584 (13) -2.2% 2,916 2,663 (253) -8.7% 243 222 (21) -8.7%Music 85 76 (9) -10.6% 574 536 (38) -6.6% 48 45 (3) -6.6%Natural & Environmental Sciences 145 140 (5) -3.4% 763 720 (43) -5.6% 64 60 (4) -5.6%Nursing 237 254 17 7.2% 1,227 1,300 73 5.9% 102 108 6 5.9%Pharmacy 4 862 850 (12) -1.4% 13,138 12,609 (529) -4.0% 1,095 1,051 (44) -4.0%Other Units Included 0 0 0 - 0 0 0 - 0 0 0 -SUBTOTAL 4,124 3,934 (190) -4.6% 35,722 36,197 476 1.3% 3,097 2,952 (144) -4.7%Other Units Not Included5 4 12 8 200% 26 60 34 131% 2 5 3 131%TOTAL ENROLLMENT 4,128 3,946 (182) -4.4% 35,748 36,257 510 1.4% 3,099 2,957 (142) -4.6%
1 Full Time Equivalent (FTE): Calculated by dividing graduate credits by 12.2 Law FTE calculated by taking full-time headcount plus any part-time credits divided by 12.3 Due to a change in course structure, select law school credits have shifted to the fall term.4 Undergraduate Pharmacy includes only first and second year students, years three through six are included in Graduate & Professional Practice.5 Other units not included in governmental reporting: ESL Post Undergrad, Cross-Registered Law.6 Fall 2012 FTE values have been adjusted to match the current rounding methodology.
Note: Total Credits and FTE totals may contain decimals not displayed.
Duquesne UniversityHeadcount, Credits, and FTE 1 - Enrollment by School and Level
Fall Semesters 2012 and 2013
Graduate & Professional Practice
2014 Fact Book Preview
6
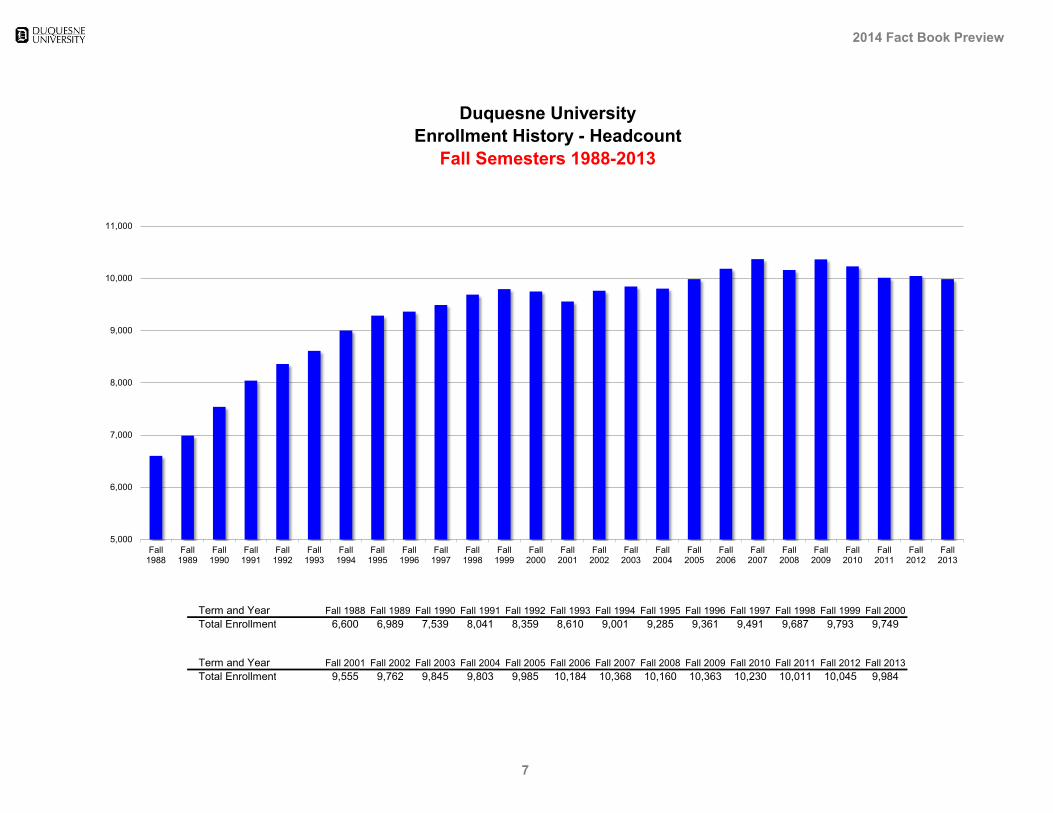
Term and Year Fall 1988 Fall 1989 Fall 1990 Fall 1991 Fall 1992 Fall 1993 Fall 1994 Fall 1995 Fall 1996 Fall 1997 Fall 1998 Fall 1999 Fall 2000 Total Enrollment 6,600 6,989 7,539 8,041 8,359 8,610 9,001 9,285 9,361 9,491 9,687 9,793 9,749
Term and Year Fall 2001 Fall 2002 Fall 2003 Fall 2004 Fall 2005 Fall 2006 Fall 2007 Fall 2008 Fall 2009 Fall 2010 Fall 2011 Fall 2012 Fall 2013 Total Enrollment 9,555 9,762 9,845 9,803 9,985 10,184 10,368 10,160 10,363 10,230 10,011 10,045 9,984
Duquesne UniversityEnrollment History - Headcount
Fall Semesters 1988-2013
5,000
6,000
7,000
8,000
9,000
10,000
11,000
Fall1988
Fall1989
Fall1990
Fall1991
Fall1992
Fall1993
Fall1994
Fall1995
Fall1996
Fall1997
Fall1998
Fall1999
Fall2000
Fall2001
Fall2002
Fall2003
Fall2004
Fall2005
Fall2006
Fall2007
Fall2008
Fall2009
Fall2010
Fall2011
Fall2012
Fall2013
2014 Fact Book Preview
7
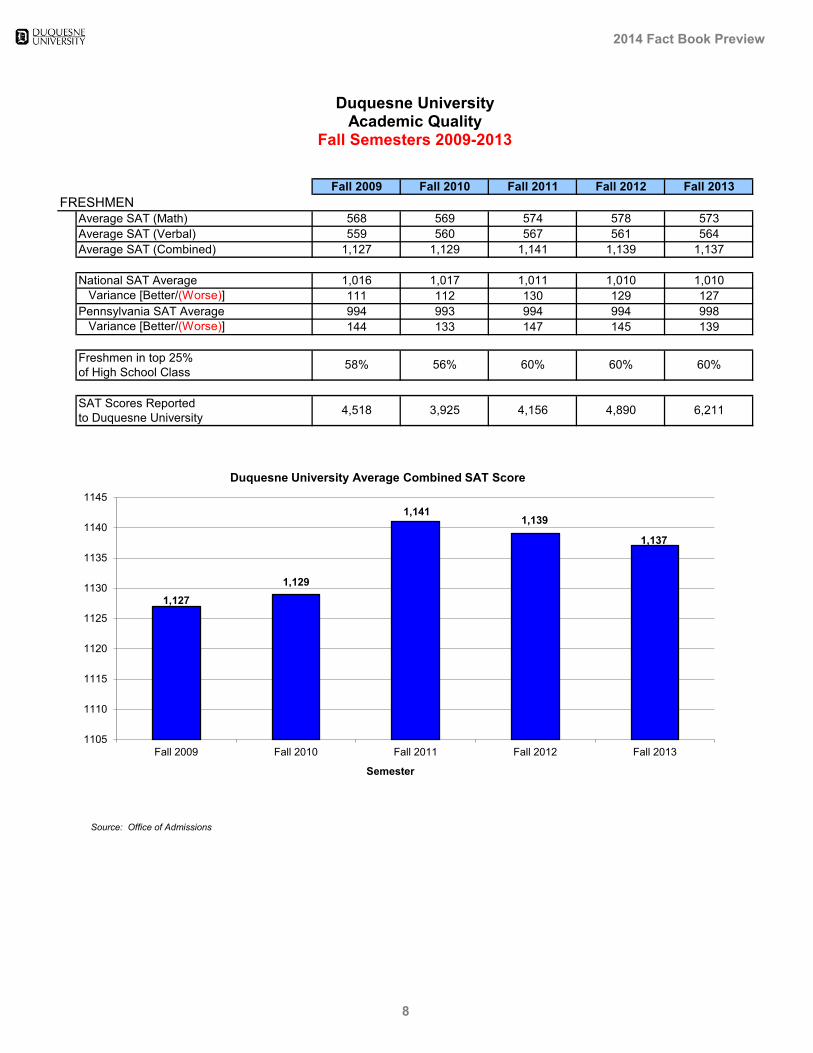
Fall 2009 Fall 2010 Fall 2011 Fall 2012 Fall 2013FRESHMEN
Average SAT (Math) 568 569 574 578 573Average SAT (Verbal) 559 560 567 561 564Average SAT (Combined) 1,127 1,129 1,141 1,139 1,137
National SAT Average 1,016 1,017 1,011 1,010 1,010 Variance [Better/(Worse)] 111 112 130 129 127Pennsylvania SAT Average 994 993 994 994 998 Variance [Better/(Worse)] 144 133 147 145 139
Freshmen in top 25% of High School Class
SAT Scores Reportedto Duquesne University
Source: Office of Admissions
Duquesne UniversityAcademic Quality
Fall Semesters 2009-2013
58% 56% 60% 60% 60%
4,518 3,925 4,156 4,890 6,211
1,127 1,129
1,141 1,139
1,137
1105
1110
1115
1120
1125
1130
1135
1140
1145
Fall 2009 Fall 2010 Fall 2011 Fall 2012 Fall 2013
Semester
Duquesne University Average Combined SAT Score
2014 Fact Book Preview
8

Fall 2009 Fall 2010 Fall 2011 Fall 2012 Fall 2013
FIRST-TIME, FIRST-YEAR FRESHMEN (FULL & PART-TIME)Applications 7,854 7,499 7,193 7,351 7,381Completed Applications 6,641 6,520 6,550 6,665 6,807Acceptances 5,067 5,007 4,600 4,981 5,045Enrollment 1,443 1,433 1,360 1,530 1,553Acceptance Rate 65% 67% 64% 68% 68%Matriculation Rate 28% 29% 30% 31% 31%
Note: Figures are based on unique student headcount. Source: Enrollment Management Group
Duquesne UniversityUndergraduate Traditional and Non-Traditional Freshman Demand
Fall Semesters 2009-2013
7,854 7,499
7,193 7,351 7,381
6,641 6,520 6,550 6,665 6,807
5,067 5,007 4,600
4,981 5,045
1,443 1,433 1,360 1,530 1,553
0
1,000
2,000
3,000
4,000
5,000
6,000
7,000
8,000
9,000
Fall 2009 Fall 2010 Fall 2011 Fall 2012 Fall 2013
Applications, Acceptances, and Enrollment
Applications Completed Applications Acceptances Enrollment
2014 Fact Book Preview
9
Fall 2009 Fall 2010 Fall 2011 Fall 2012 Fall 2013
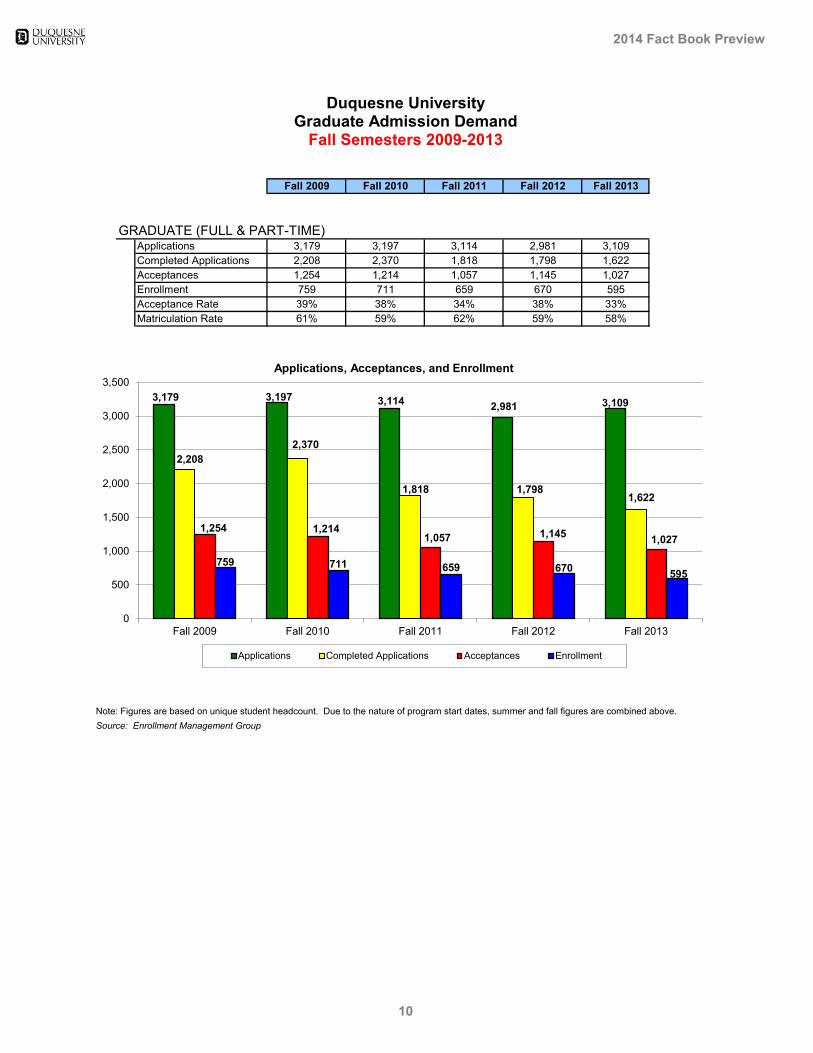
GRADUATE (FULL & PART-TIME)Applications 3,179 3,197 3,114 2,981 3,109Completed Applications 2,208 2,370 1,818 1,798 1,622Acceptances 1,254 1,214 1,057 1,145 1,027Enrollment 759 711 659 670 595Acceptance Rate 39% 38% 34% 38% 33%Matriculation Rate 61% 59% 62% 59% 58%
Note: Figures are based on unique student headcount. Due to the nature of program start dates, summer and fall figures are combined above.Source: Enrollment Management Group
Duquesne UniversityGraduate Admission Demand
Fall Semesters 2009-2013
3,179 3,197 3,114 2,981 3,109
2,208 2,370
1,818 1,798 1,622
1,254 1,214 1,057 1,145 1,027
759 711 659 670 595
0
500
1,000
1,500
2,000
2,500
3,000
3,500
Fall 2009 Fall 2010 Fall 2011 Fall 2012 Fall 2013
Applications, Acceptances, and Enrollment
Applications Completed Applications Acceptances Enrollment
2014 Fact Book Preview
10
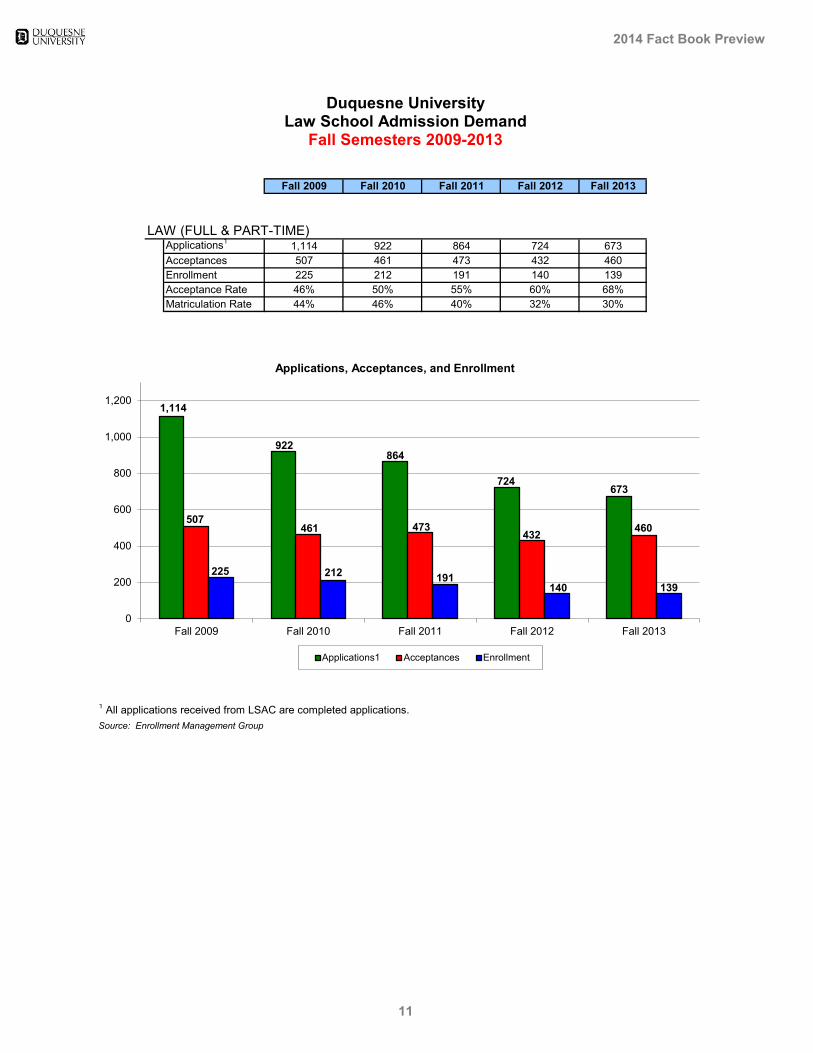
Fall 2009 Fall 2010 Fall 2011 Fall 2012 Fall 2013
LAW (FULL & PART-TIME)Applications1 1,114 922 864 724 673Acceptances 507 461 473 432 460Enrollment 225 212 191 140 139Acceptance Rate 46% 50% 55% 60% 68%Matriculation Rate 44% 46% 40% 32% 30%
1 All applications received from LSAC are completed applications.Source: Enrollment Management Group
Duquesne UniversityLaw School Admission Demand
Fall Semesters 2009-2013
1,114
922 864
724 673
507 461 473
432 460
225 212 191 140 139
0
200
400
600
800
1,000
1,200
Fall 2009 Fall 2010 Fall 2011 Fall 2012 Fall 2013
Applications, Acceptances, and Enrollment
Applications1 Acceptances Enrollment
2014 Fact Book Preview
11

Non-R Non-Re Y Y Black Black WhiteWhiteAmeric Americ Asian Asian Native H Native Hawaiian or Oth Non-Re Non-Resident AlienM F M F M F M F M F M F M F M F M F M F
Male Female Male Female Male Female Male Female Male Female Male Female Male Female Male Female Male Female Male FemaleSCHOOLBUBusinessBU Undergraduate 85 56 14 9 35 20 733 397 0 1 12 10 0 0 15 12 12 1 906 506BU Graduate 21 32 5 1 6 1 113 76 0 0 0 1 0 0 0 0 6 2 151 113EDEducation ED Undergraduate 1 1 3 4 2 3 67 302 0 0 0 4 0 0 2 4 0 3 75 321ED Graduate 17 42 3 15 18 47 107 351 0 1 3 5 0 0 6 7 11 13 165 481HSHealth SciencesHS Undergraduate 7 3 5 16 3 4 138 555 1 0 1 12 0 1 1 10 3 2 159 603HS Graduate 1 6 0 1 1 1 54 152 0 0 2 5 0 0 0 2 7 14 65 181LALawLA Graduate/First Professional 0 4 6 5 5 1 240 203 0 2 3 6 0 0 4 4 4 4 262 229SLLeadership and Professional AdvancementSL Undergraduate 3 5 9 1 9 12 94 76 1 0 0 2 0 0 1 4 12 6 129 106SL Graduate 4 5 6 3 24 35 139 129 1 1 4 3 1 0 5 6 7 10 191 192ARLiberal ArtsAR Undergraduate 22 25 22 28 52 43 446 612 2 2 9 12 2 1 12 26 9 8 576 757AR Graduate 46 39 6 6 14 10 198 211 1 0 2 8 0 0 2 1 24 16 293 291MUMusicMU Undergraduate 0 3 4 5 6 3 128 98 0 0 1 2 1 0 3 5 2 1 145 117MU Graduate 8 11 3 0 0 0 28 18 0 0 1 0 0 0 1 0 4 2 45 31NENatural and Environmental SciencesNE Undergraduate 7 10 9 14 5 14 173 242 0 0 10 16 0 1 5 8 2 1 211 306NE Graduate 15 15 0 3 2 1 44 49 0 0 3 2 0 0 0 1 5 0 69 71NUNursingNU Undergraduate 0 3 0 7 4 17 47 455 0 1 1 7 0 0 0 12 1 3 53 505NU Graduate 0 2 2 9 2 17 7 193 0 1 2 3 0 0 0 6 1 9 14 240PHPharmacyPH Undergraduate 1 5 2 3 2 4 144 226 0 0 4 9 0 0 2 2 0 1 155 250PH Graduate/First Professional 30 31 3 6 8 13 271 428 0 1 13 22 0 0 1 4 11 8 337 513
Spiritan DivisionSP Undergraduate 0 0 3 3 10 2 39 23 0 0 0 0 0 0 1 4 2 0 55 32
Other Undergraduate 31 21 0 1 0 2 4 1 0 0 0 0 0 0 0 0 4 7 39 32 Graduate 5 6 0 0 0 0 0 0 0 0 1 0 0 0 0 0 0 0 6 6
UNIVERSITY Undergraduate 157 132 71 91 128 124 2,013 2,987 4 4 38 74 3 3 42 87 47 33 2,503 3,535 Graduate/First Professional 147 193 34 49 80 126 1,201 1,810 2 6 34 55 1 0 19 31 80 78 1,598 2,348
UNIVERSITY TOTAL 304 325 105 140 208 250 3,214 4,797 6 10 72 129 4 3 61 118 127 111 4,101 5,883
1 Race and ethnic categories reported follow the US Department of Education Standards for Maintaining, Collecting and Presenting Federal Data on Race and Ethnicity . Categories may differ when comparing to prior University Fact Books. Source: Institutional Research and Planning, based on IPEDS Enrollment Report
Aliens Hispanic/Latino African American White
Duquesne UniversityEnrollment by School, Level, Race/Ethnicity and Gender
Fall Semester 2013
Non-Hispanic/LatinoNonresident Black or American Indian
or Alaska Native racesAsian other Pacific Islander ethnicity unknown TotalNative Hawaiian or Two or more Race and/or
2014 Fact Book Preview
12

Bachelor's Master's Doctoral & Professional Practice Certificates Total
SCHOOLBusiness 286 131 0 0 417Education 94 222 36 1 353Health Sciences 162 119 28 13 322Law 0 2 205 0 207Leadership and Professional Advancement 80 143 0 1 224Liberal Arts 394 218 34 1 647Music 49 29 0 7 85Natural and Environmental Sciences 108 40 10 3 161Nursing 122 26 26 1 175Pharmacy 8 5 212 0 225
UNIVERSITY TOTAL 1,303 935 551 27 2,816
Source: IPEDS Post Secondary Completions Report and the Office of Institutional Research and Planning
Duquesne UniversityFirst Major: Degrees Conferred by School and Degree Category
Fiscal Year 2013
Bachelor's 1,303
Master's 935
Doctoral & Professional Practice
551
Certificates 27
Fiscal Year 2013 First Major Degrees Conferred
2014 Fact Book Preview
13
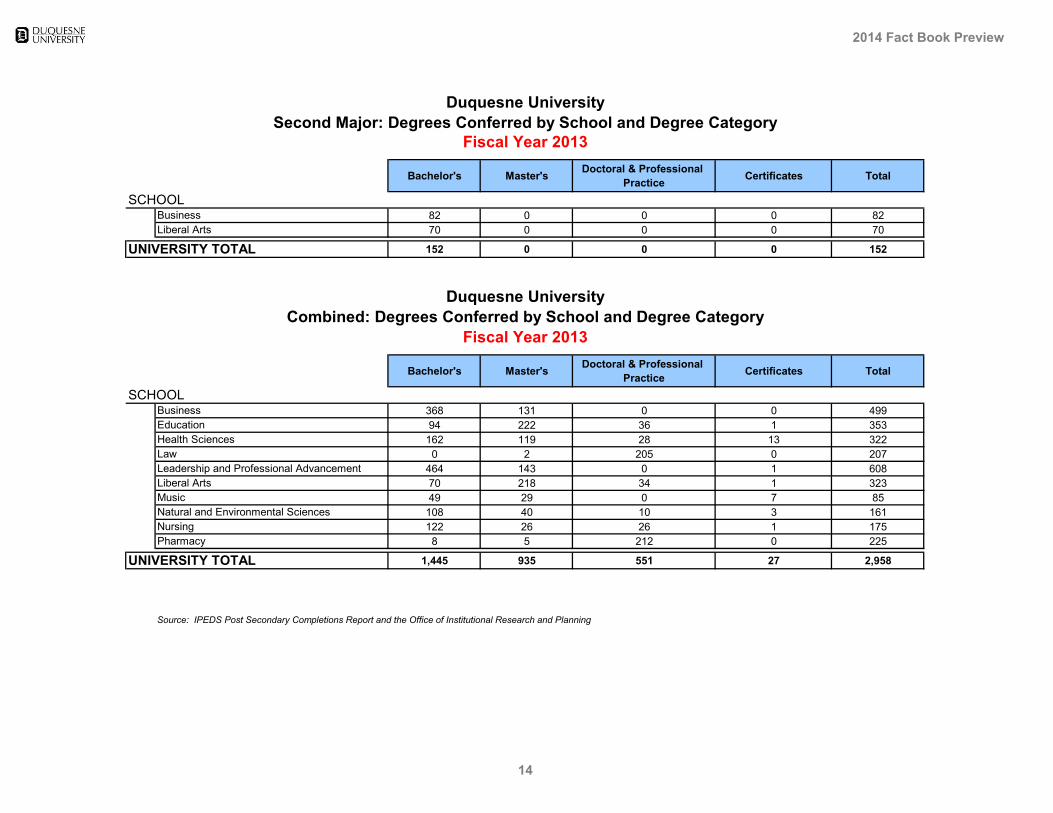
Duquesne UniversitySecond Major: Degrees Conferred by School and Degree Category
Fiscal Year 2013
Bachelor's Master's Doctoral & Professional Practice Certificates Total
SCHOOLBusiness 82 0 0 0 82Liberal Arts 70 0 0 0 70
UNIVERSITY TOTAL 152 0 0 0 152
Duquesne UniversityCombined: Degrees Conferred by School and Degree Category
Fiscal Year 2013
Bachelor's Master's Doctoral & Professional Practice Certificates Total
SCHOOL Business 368 131 0 0 499Education 94 222 36 1 353Health Sciences 162 119 28 13 322Law 0 2 205 0 207Leadership and Professional Advancement 464 143 0 1 608Liberal Arts 70 218 34 1 323Music 49 29 0 7 85Natural and Environmental Sciences 108 40 10 3 161Nursing 122 26 26 1 175Pharmacy 8 5 212 0 225
UNIVERSITY TOTAL 1,445 935 551 27 2,958
Source: IPEDS Post Secondary Completions Report and the Office of Institutional Research and Planning
2014 Fact Book Preview
14

Duquesne UniversityAverage Salaries by Faculty Rank
Compared to Select Catholic Doctoral/Research Universities as per the (Basic) Carnegie ClassificationFiscal Year 2013
Cost of
Professor Associate Assistant Living Diff Rank Professor Rank Associate Rank Assistant
Research Universities - Very High Research Activity
Georgetown University $173.6 $109.4 $96.0 35% 3 $113.4 9 $71.5 7 $62.7
University of Notre Dame $153.0 $98.6 $91.0 -4% 1 $158.9 1 $102.4 1 $94.5
Research Universities - High Research Activity
Boston College $159.2 $103.4 $88.3 32% 7 $107.5 10 $69.8 9 $59.6
Catholic University of America $116.5 $81.9 $69.2 35% 14 $76.1 14 $53.5 14 $45.2
Duquesne University $114.5 $82.8 $68.4 2 $114.5 2 $82.8 4 $68.4
Fordham University $149.8 $106.6 $93.9 58% 16 $62.8 16 $44.7 15 $39.4
Loyola University of Chicago $132.3 $90.0 $75.0 19% 8 $106.8 8 $72.6 8 $60.5
Saint Louis University $106.9 $77.2 $66.4 -3% 5 $110.4 4 $79.7 3 $68.6
University of Dayton $110.2 $79.8 $69.8 -1% 4 $111.7 3 $80.9 2 $70.8
Doctoral/Research Universities
DePaul University $129.2 $92.8 $73.4 19% 9 $104.3 6 $74.9 10 $59.2
Marquette University $115.9 $83.3 $72.4 6% 6 $108.6 5 $78.1 5 $67.9
Seton Hall University 1 $119.5 $83.9 $67.0 27% 12 $87.1 13 $61.2 13 $48.8
St. John's University $150.8 $106.9 $88.0 58% 15 $63.3 15 $44.8 16 $36.9
University of San Diego $126.8 $90.4 $82.2 28% 11 $90.9 11 $64.8 11 $58.9
University of San Francisco $143.3 $106.4 $88.1 42% 13 $82.9 12 $61.6 12 $51.0
University of St. Thomas $111.7 $83.9 $76.7 13% 10 $97.7 7 $73.4 6 $67.1
Note: Cost of living adjustment was derived by utilizing Bankrate's "Cost of Living Comparison Calculator" on April 10, 2013. Bankrate's calculator utilizes data from the Cost of Living Index (COLI) which is considered
a reliable source of city-to-city comparisons of key consumer costs. COLI data is recognized by the U.S. Census Bureau, US Bureau of Labor Statistics, and the President's Council of Economic Advisors. 1 2011-2012 data as school did not particpate in 2012-2013 AAUP survey.
Sources : AAUP Faculty Salary Survey; Carnegie Foundation for the Advancement of Teaching; Office of Planning, Budgeting, and Institutional Research
Salaries Reported by AAUP Equivalent Income in Pittsburgh
2014 Fact Book Preview
15

Academic Year Professor Associate Professor Assistant Professor Instructor
2012-2013 $114.5 $82.8 $68.4 $53.12011-2012 $111.0 $82.3 $66.7 $52.72010-2011 $108.8 $81.4 $65.3 $53.02009-2010 $108.1 $79.8 $63.1 $51.72008-2009 $104.9 $79.2 $61.8 $49.5
Note: All salaries are converted to a nine-month equivalent salary.
Source: Duquesne University Office of Human Resource Management for the 2012-2013 American Association of University Professors (AAUP) Survey
Duquesne UniversityAverage Salaries of Full-time Instructional Faculty by Academic Rank (in thousands)
Academic Years 2008-2009 to 2012-2013
$0
$20,000
$40,000
$60,000
$80,000
$100,000
$120,000
$140,000
2008-2009 2009-2010 2010-2011 2011-2012 2012-2013
Professor Associate Professor Assistant Professor Instructor
Avg Salary
2014 Fact Book Preview
16

2009 2010 2011 2012 2013OPERATING REVENUES:Gross tuition and fee revenue $233,655 $248,690 $256,487 $263,725 $277,341Less financial aid 60,177 65,652 71,646 77,552 85,920Net tuition and fee revenue 173,478 183,038 184,841 186,173 191,421Grants and contracts 4,533 4,691 4,519 3,875 3,569Gifts and pledges 1,289 1,203 350 1,313 230Auxiliary enterprises 1 35,121 36,690 38,182 39,365 43,988Endowment income distributed for operations 1,606 1,165 1,326 2,958 2,712Income (loss) on operating investments (4,411) 4,043 5,673 501 3,711Other 3,486 3,771 3,638 6,032 7,885Net assets released from restrictions 2 21,089 18,278 21,268 21,629 16,602
Total operating revenues $236,191 $252,879 $259,797 $261,846 $270,118
OPERATING EXPENSES:Instructional $103,858 $105,413 $104,536 $109,508 $109,178Institutional support 37,758 38,703 39,235 41,087 40,194Auxiliary enterprises 1 31,390 32,158 33,565 34,831 36,098Academic support 33,514 34,684 35,498 39,618 41,488Student services 11,770 12,305 12,266 13,732 13,756Public service 9,807 7,501 6,638 7,330 9,056Research 7,839 8,666 8,985 7,923 7,110
Total operating expenses $235,936 $239,430 $240,723 $254,029 $256,880
EXCESS OF OPERATING REVENUES OVER EXPENSES $255 $13,449 $19,074 $7,817 $13,238Operating Margin 0.1% 5.3% 7.3% 3.0% 4.9%
1 Primarily room, board, and parking.2 Primarily donor restricted gifts, sponsored research, and donor restricted endowments distributed for operations.
Source: Independent Auditors' Report, Years Ended June 30, 2009 to 2013
Duquesne UniversityUnrestricted Statements of Activities
For The Fiscal Years Ended June 30, 2009 to 2013(in thousands)
2014 Fact Book Preview
17
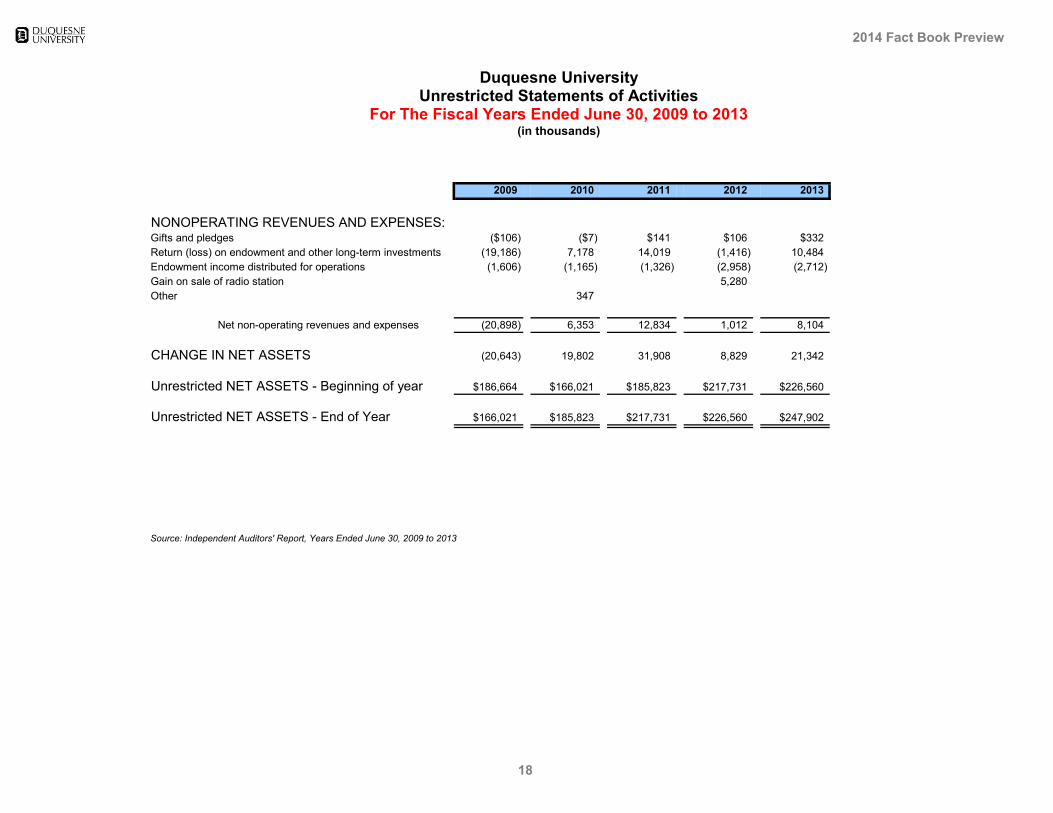
2009 2010 2011 2012 2013
NONOPERATING REVENUES AND EXPENSES:Gifts and pledges ($106) ($7) $141 $106 $332Return (loss) on endowment and other long-term investments (19,186) 7,178 14,019 (1,416) 10,484Endowment income distributed for operations (1,606) (1,165) (1,326) (2,958) (2,712)Gain on sale of radio station 5,280Other 347
Net non-operating revenues and expenses (20,898) 6,353 12,834 1,012 8,104
CHANGE IN NET ASSETS (20,643) 19,802 31,908 8,829 21,342
Unrestricted NET ASSETS - Beginning of year $186,664 $166,021 $185,823 $217,731 $226,560
Unrestricted NET ASSETS - End of Year $166,021 $185,823 $217,731 $226,560 $247,902
Source: Independent Auditors' Report, Years Ended June 30, 2009 to 2013
Duquesne UniversityUnrestricted Statements of Activities
For The Fiscal Years Ended June 30, 2009 to 2013(in thousands)
2014 Fact Book Preview
18
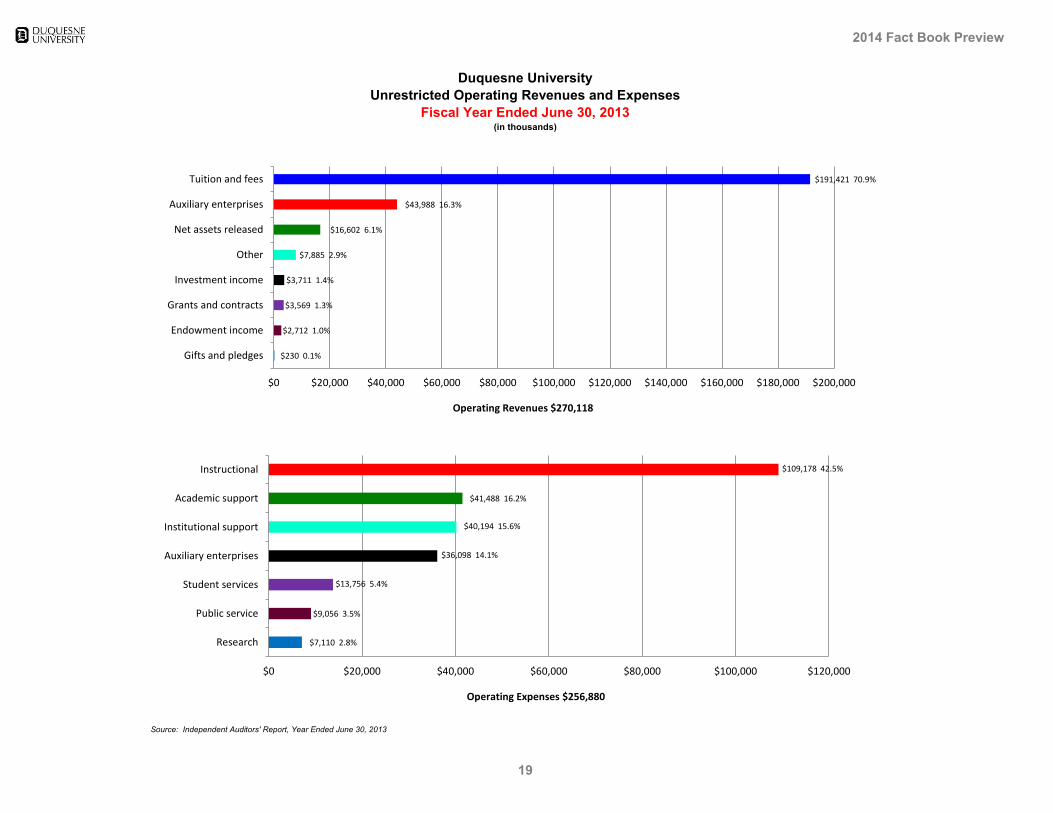
Duquesne UniversityUnrestricted Operating Revenues and Expenses
Fiscal Year Ended June 30, 2013(in thousands)
Source: Independent Auditors' Report, Year Ended June 30, 2013
$230 0.1%
$2,712 1.0%
$3,569 1.3%
$3,711 1.4%
$7,885 2.9%
$16,602 6.1%
$43,988 16.3%
$191,421 70.9%
$0 $20,000 $40,000 $60,000 $80,000 $100,000 $120,000 $140,000 $160,000 $180,000 $200,000
Gifts and pledges
Endowment income
Grants and contracts
Investment income
Other
Net assets released
Auxiliary enterprises
Tuition and fees
Operating Revenues $270,118
$7,110 2.8%
$9,056 3.5%
$13,756 5.4%
$36,098 14.1%
$40,194 15.6%
$41,488 16.2%
$109,178 42.5%
$0 $20,000 $40,000 $60,000 $80,000 $100,000 $120,000
Research
Public service
Student services
Auxiliary enterprises
Institutional support
Academic support
Instructional
Operating Expenses $256,880
2014 Fact Book Preview
19

Duquesne UniversityEndowment Statistics
Fiscal Years 2009 to 2013
2009 2010 2011 2012 2013
Market Value 1 (in thousands) $121,049 $140,824 $171,119 $177,211 $203,869Endowment/FTE Student $13,359 $15,170 $18,394 $19,433 $22,347Endowment Spending Rate 5.5% 5.3% 5.3% 5.3% 5.0%Endowment Income Distributed (in thousands) $6,006 $4,513 $5,673 $7,471 $6,894Endowment (1 year) Rate of Return -23.6% 13.6% 25.2% -1.6% 13.0%
1 Composite with True Endowment and Quasi Endowment.
Sources: NACUBO Endowment Study; FEG Endowment Reports; University Census Reports; Independent Auditors' Reports
2014 Fact Book Preview
20
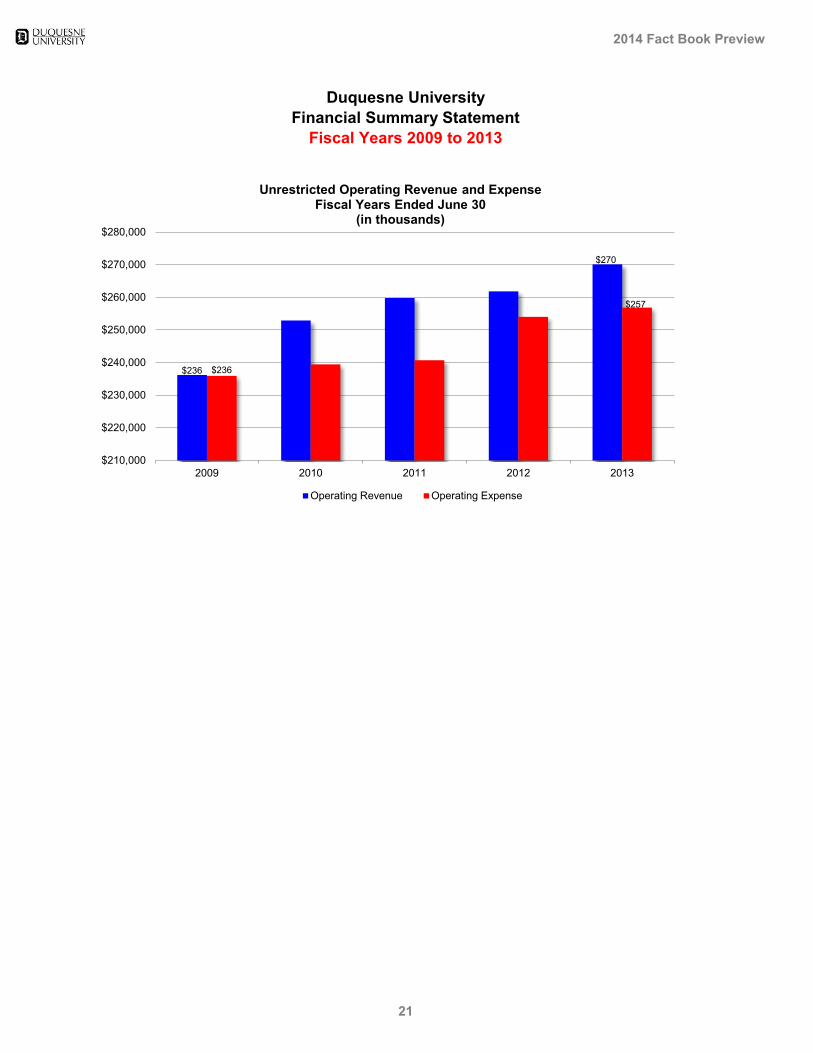
Duquesne UniversityFinancial Summary Statement
Fiscal Years 2009 to 2013
$236
$270
$236
$257
$210,000
$220,000
$230,000
$240,000
$250,000
$260,000
$270,000
$280,000
2009 2010 2011 2012 2013
Unrestricted Operating Revenue and Expense Fiscal Years Ended June 30
(in thousands)
Operating Revenue Operating Expense
2014 Fact Book Preview
21
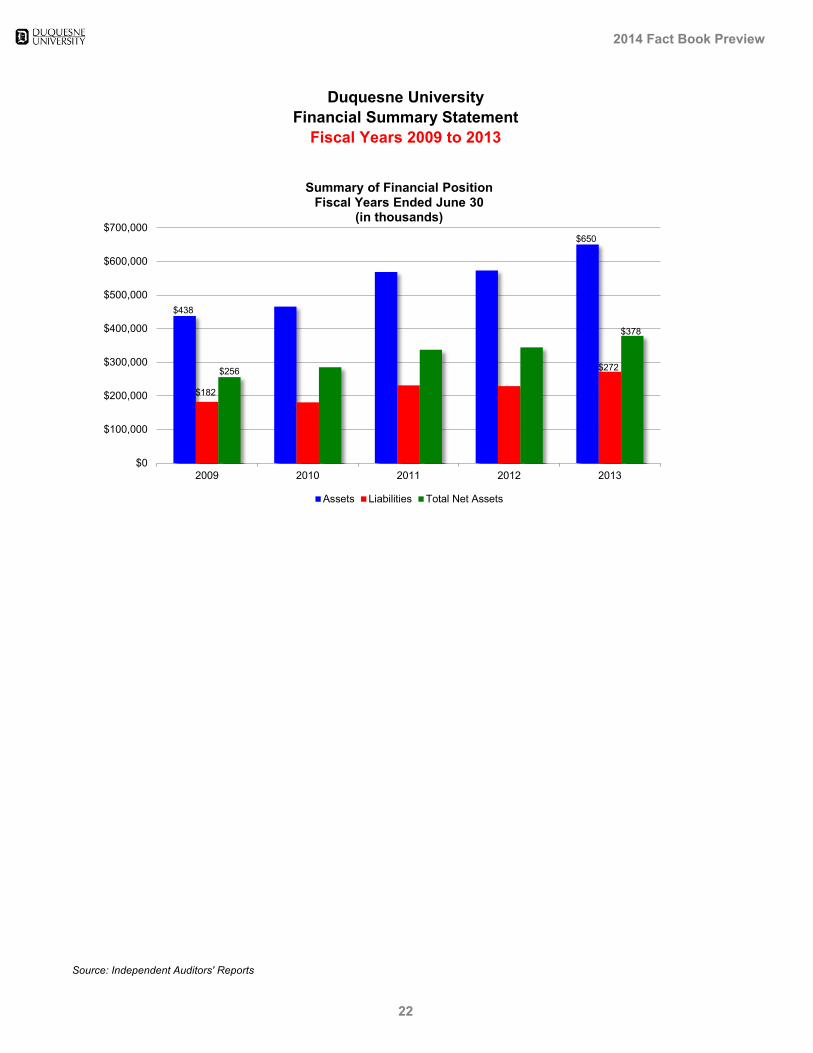
Source: Independent Auditors' Reports
Duquesne UniversityFinancial Summary Statement
Fiscal Years 2009 to 2013
$438
$650
$182
$272 $256
$378
$0
$100,000
$200,000
$300,000
$400,000
$500,000
$600,000
$700,000
2009 2010 2011 2012 2013
Summary of Financial Position Fiscal Years Ended June 30
(in thousands)
Assets Liabilities Total Net Assets
2014 Fact Book Preview
22

Duquesne UniversityStudent Housing Statistics
September 6, 2013
Ass
umption
Bro
ttier
1
Des
Places
Sain
t Ann
Sain
t Mart
in T
owers
Vick
roy
Temporar
y Housin
g 2
Total
Studio N/A 184 N/A N/A N/A N/A N/A N/A 1841 Bdrm N/A 193 N/A N/A N/A N/A N/A N/A 193Single 22 N/A 11 27 52 31 13 N/A 1562 Bdrm N/A 288 N/A N/A N/A N/A N/A N/A 288Double 192 N/A 368 354 430 1,096 190 N/A 2,630Triple 3 N/A 0 27 3 36 0 N/A 69Modified Triple 2 66 N/A 39 189 0 0 120 N/A 414Quad 2 4 N/A 0 44 0 0 0 N/A 48Temporary housing 2 8 N/A N/A N/A N/A N/A N/A 10 18
Total 295 665 418 641 485 1,163 323 10 4,000
Studio N/A 184 N/A N/A N/A N/A N/A N/A 1841 Bdrm N/A 193 N/A N/A N/A N/A N/A N/A 193Single 22 N/A 11 27 52 31 13 N/A 1562 Bdrm N/A 288 N/A N/A N/A N/A N/A N/A 288Double 188 N/A 367 352 428 1,087 188 N/A 2,610Triple 3 N/A N/A 30 3 35 N/A N/A 71Modified Triple 2 64 N/A 38 174 N/A N/A 118 N/A 394Quad 2 4 N/A N/A 44 N/A N/A N/A N/A 48Temporary housing 2 8 N/A N/A N/A N/A N/A N/A 9 17
Total 289 665 416 627 483 1,153 319 9 3,961
Occupancy Rates 98.0% 100% 99.5% 97.8% 99.6% 99.1% 98.8% 90.0% 99.0%
Freshman 181 0 0 613 470 203 0 8 1,475Sophomore 86 0 93 0 2 847 259 1 1,288Junior 15 204 259 7 4 72 46 0 607Senior 5 345 47 6 6 26 13 0 4485th year 1 37 3 1 0 1 1 0 446th year 0 18 0 0 0 0 0 0 18Graduate 1 46 14 0 1 4 0 0 66Law 0 14 0 0 0 0 0 0 14Other 0 1 0 0 0 0 0 0 1
Total 3 289 665 416 627 483 1,153 319 9 3,961
1 Brottier is an apartment-style residence hall, therefore bed count is actual capacity count.
Source: Office of Residence Life; Office of Institutional Research and Planning
Beds Available
byType/
Capacity
BedsOccupied
byType
2 Due to increased demand, modified triple and quad housing was created in Assumption Hall, St. Ann Hall, Des Places Hall, and Vickroy Hall. Additional Temporary housing was used in Assumption Hall and the Muldoon Building. These changes created an additional 218 beds to reach the available capacity of 4,000. 3 Headcount by classification is from student's self-reported, signed Verified Floor Rosters. This may not be consistent with headcount by classification based on earned credits reported in sections of the University Fact Book.
2014 Fact Book Preview
23

Duquesne UniversityFive Year Occupancy History
Fall Terms, 2009 - 2013
2009 2010 2011 2012 2013Total Occupancy 3,435 3,482 3,494 3,774 3,961
Source: Office of Residence Life; Office of Institutional Research and Planning
3,435 3,482 3,494
3,774
3,961
3,000
3,250
3,500
3,750
4,000
2009 2010 2011 2012 2013
Total Occupancy
2014 Fact Book Preview
24