Fact Book 2019-2020 - Northern Arizona University
92
(SQL - academic level, degree) Fact Book 2019-2020 Office of Institutional Research and Analysis PO BOX 4132. Flagstaff AZ 86011. 928-523-5804. nau.edu/Institutional-Research NAU is an Equal Opportunity/Affirmative Action Institution
Transcript of Fact Book 2019-2020 - Northern Arizona University

(SQL - academic level, degree)
Fact Book 2019-2020
Office of Institutional Research and AnalysisPO BOX 4132. Flagstaff AZ 86011. 928-523-5804. nau.edu/Institutional-Research
NAU is an Equal Opportunity/Affirmative Action Institution

MISSION
VALUES
(SQL - academic level, degree)
Summary
Our academic programs, research, public service, and creative endeavors enrich lives and create opportunities in Arizona and beyond. We develop solutions to challenges and drive innovation in a supportive, inclusive, and diverse environment.
STRATEGIC GOALS
INTEGRITY: We operate with fairness, honesty, and the highest ethical standards.DIVERSITY: We strengthen our community through diversity of cultures, experiences, and perspectives.SERVICE: We partner with our communities, in the spirit of collaboration, to provide services and expertise to support Arizona, the nation, and the world.DISCOVERY: We engage in innovation to create, share, and apply new knowledge, scholarship, and artistry.EXCELLENCE: We commit to the highest quality in all endeavors.
STEWARDSHIP: Ensure long term viability of the university
STUDENT CENTERED: We place student success at the center of our academic and service planning, policies, and programs.
STUDENT SUCCESS AND ACCESS: Educate students to serve, lead, and achieveRESEARCH AND DISCOVERY: Expand the boundaries of knowledge and creativityCOMMITMENT TO NATIVE AMERICANS: Become the nation’s leading university serving Native AmericansENGAGEMENT: Strengthen university, community, regional, national, and global ties for the mutually beneficial exchange of knowledge and resources
Fact Book 2019-2020 Summary 1

OVERVIEW
Summary
Founded in 1899, Northern Arizona University is a vibrant community committed to teaching as learning, research as innovation, and service as shared leadership. Northern Arizona University along with the University of Arizona and Arizona State University are governed by the constitutionally authorized Arizona Board of Regents and together constitute the Arizona University System. Northern Arizona University is a high research university with its main campus located on a 829-acre site in Flagstaff, Arizona. NAU Statewide sites are located throughout the state and online.
Flagstaff is a growing city of an estimated 75,038 residents (U.S. Census Bureau, 2019), located on the Colorado Plateau at an elevation of 7,000 feet. Immediately north of the campus are the 12,633 foot-high San Francisco Peaks, which feature a major winter sports center. The university is at the junction of two interstate highways, I-40 and I-17, less than a three-hour drive from Phoenix and about five hours from Tucson; Albuquerque, New Mexico; and Las Vegas, Nevada. Flagstaff is served by the Amtrak transcontinental mainline, one major bus line, and a regional airline. In addition, Flagstaff is the home of such renowned scientific institutions as Lowell Observatory, the U.S. Naval Observatory's Flagstaff station, the U.S. Geological Survey's Branch of Astrogeology, and the Museum of Northern Arizona. These institutions are active participants in the university's educational and research programs. The university campus is surrounded by an environment of mountains, canyons, forests, deserts, lakes, and streams. Two major national parks, including the Grand Canyon, and six national monuments surround the Flagstaff area.
Northern Arizona University is dedicated to providing an outstanding undergraduate residential education strengthened by research, graduate and professional programs, and sophisticated methods of distance delivery. NAU has achieved national distinction as a leader in a number of areas, including environmental sustainability, innovative educational approaches, allied health professional education, and Native American educational partnerships. The university is also committed to student success, offering a number of academic planning tools to help students finish in four years and a guaranteed tuition program that ensures students pay the same tuition over four years.
Northern Arizona University also partners with a variety of Arizona community colleges in an initiative called 2NAU to make it easier for students to complete their bachelor's degree. Students can be admitted to NAU while completing their associate's degree at their local community college. The Arizona community college partners for 2019-20 include Arizona Western College, Central Arizona College, Chandler-Gilbert Community College, Cochise College, Coconino Community College, Dine College, Eastern Arizona College, Estrella Mountain Community College, Gateway Community College, Glendale Community College, Mesa Community College, Mohave Community College, Northland Pioneer College, Paradise Valley Community College, Phoenix College, Pima Community College, Rio Salado College, Scottsdale Community College, South Mountain Community College, Tohono O'odham Community College, and Yavapai College.
NAU provides a Personalized Learning program which offers self-paced, competency-based, direct-assessment programs of study in five Bachelor's degrees (Management, RN to BSN, Small Business Administration, Computer Information Technology, and Liberal Arts) and five Minors (Management, Small Business Administration, Computer Information Technology, Liberal Arts, and Human Resources). Additionally two master's programs are available in MS in Nursing and M in Computer Information Technology.
Fact Book 2019-2020 Summary 2

THE STUDENTS
Summary
Provost Office
The W.A. Franke College of Business
College of Social and Behavioral Sciences
Graduate College
Online, Statewide, and Education Innovation
THE ORGANIZATIONNorthern Arizona University is comprised of 10 academic colleges/divisions and offers 94 Baccalaureate, 62 Master, and 17 Doctoral Degrees. In 2019-2020, degree programs were organized into the colleges/divisions listed below:
College of Arts and Letters
College of Education
College of Engineering, Informatics, and Applied Sciences
College of Health and Human Services
College of the Environment, Forestry, and Natural Sciences
In Fall 2019, Northern Arizona University enrolled 30,736 students, with 22,791 located on the Flagstaff Campus in Arizona, and the remaining 7,945 students enrolled at 21 other instructional sites throughout the state and online. There were 23,903 full-time students and 6,833 part-time students enrolled which translated into 29,175 full-time equivalent (FTE) students.
The university's enrollment for Fall 2019 consisted of 19,199 females and 11,537 males. Of these students, the majority (65%) were Arizona residents while 35% were from out-of-state, which includes 1,280 students from foreign countries. Undergraduate students made up 86% of the total student population. Another 4,223 students were enrolled in graduate programs.
Fact Book 2019-2020 Summary 3
Based on IPEDS ethnicity counts, the largest ethnic minority in the student population is Hispanic with 7,395 students, or 24% of the total enrollment. There were 1,660 students (5%) of the total enrollment who declared two or more races. Native American students attending NAU in Fall 2019 were affiliated with 113 separate tribes, the largest tribe being Navajo (Diné).

THE FACULTY
THE BUDGET
Summary
Just over half of the state operating budget, or $132,337,711 was designated for Instruction. The second largest program, Institutional Support, was budgeted to receive $39,598,118. The remaining state operating funds were budgeted such that Operation and Maintenance of Plant $32,694,559, Academic Support was estimated to receive $32,061,726, Student Services $23,264,860, Organized Research $5,236,032, and Public Service $5,212,394.
The fiscal year 2020 state budget expenditure authority totals $270,405,400. Less than half of the budget, $114,250,900 came from general fund state appropriations. State tuition and fees and miscellaneous revenue accounted for $156,154,500 of the budget.
FINANCE, INSTITUTIONAL PLANNING AND ANALYSIS
For the 2019-2020 academic year, Northern Arizona University employed 1,151 full-time instructional faculty members. Tenured faculty made up 47% of the full-time instructional faculty. The number of full-time, ranked, instructional faculty included 16 Regents’ Professors, 275 Professors, 205 Associate Professors, 288 Assistant Professors, 317 Lecturers, and 50 Instructors. For Fall 2019, Northern Arizona University employed 607 part-time instructors with the majority through NAU Statewide locations scattered throughout the state and online.
The Finance, Institutional Planning and Analysis (FIPA) division is comprised of the Comptroller, Data Governance, Institutional Research and Analysis (IRA), Internal Audit, Strategic Planning, and the University Budget Office (UBO). FIPA supports the university’s vision of excellence, access, and impact of effectively leading and managing its financial and business operations and developing NAU’s resources. FIPA departments are committed to supporting all university entities by providing quality financial, accounts, data and administrative services.
Fact Book 2019-2020 Summary 4

Fall Semester
1899 23 1950 677 1995 20,131 2001 19,728 2007 21,352 2013 26,606 1900 36 1960 2,069 1996 19,605 2002 19,907 2008 22,507 2014 27,715 1910 92 1970 8,160 1997 19,618 2003 19,198 2009 23,600 2015 29,031 1920 102 1980 11,601 1998 19,940 2004 19,426 2010 25,204 2016 30,368 1930 476 1990 16,994 1999 19,981 2005 19,069 2011 25,364 2017 31,057 1940 535 1991 17,698 2000 19,964 2006 20,562 2012 26,002 2018 31,073
2019 30,736
SOURCE: Official 21st Day Census-All Enrolled Students, NAU Office of Institutional Research and Analysis, NAU Cline Library Special Collections and Archives
Student Headcount History
YEAR YEARHEADCOUNT YEAR HEADCOUNT YEAR HEADCOUNT HEADCOUNT
Fact Book 2019-2020
YEAR HEADCOUNT HEADCOUNTYEAR
Historical and Organizational A1
19,964 19,728 19,907 19,198 19,426 19,06920,562 21,352
22,50723,600
25,204 25,364 26,002 26,60627,715
29,03130,368 31,057 31,073 30,736
2000 2001 2002 2003 2004 2005 2006 2007 2008 2009 2010 2011 2012 2013 2014 2015 2016 2017 2018 2019
Fall Semester Headcount 20-Year Trend

Fall Semester
2014 - Rita H. Cheng, B.S., M.B.A., Ph.D.
2001 - 2014 John D. Haeger, B.S., M.S., Ph.D.
2001 - 2001 Owen F. Cargol, B.S., M.Ed., Ed.D.
1994 - 2001 Clara M. Lovett, B.A., M.A., Ph.D.
1993 - 1994 Patsy B. Reed, B.S., M.S., Ph.D. (Interim)
1979 - 1993 Eugene M. Hughes, B.S., M.S., Ph.D. DATE INSTITUTIONAL NAMES
1957 - 1979 J. Lawrence Walkup, B.S., B.A., M.Ed., Ed.D. 1966 Northern Arizona University
1947 - 1957 Lacey A. Eastburn, B.S.Ed., B.A., M.A., LL.D., Ed.D. 1945 Arizona State College at Flagstaff
1945 - 1947 Tom O. Bellwood, A.B., A.M., LL.D., Ed.D. 1929 Arizona State Teachers College at Flagstaff
1933 - 1944 Thomas J. Tormey, B.S., Ph.D. 1925 Northern Arizona State Teachers College
1926 - 1933 Grady Gammage, A.B., A.M., LL.D. 1899 Northern Arizona Normal School
1925 - 1926 Fasset A. Cotton, A.B., Ph.B., LL.D.
1920 - 1925 Lynn B. McMullen, B.S., A.M.
1919 - 1920 John O. Creager, A.B., A.M.
1918 - 1919 Guy E. Cornelius, B.Pd., Sc.B.
1909 - 1918 Rudolph H.H. Blome, B.S., Ph.D.
1899 - 1909 Almon N. Taylor, B.L., Ph.D.
SOURCE: NAU Office of Institutional Research and Analysis, Cline Library Special Collections and Archives
Presidents and Institutional Names
YEAR PRESIDENT
Fact Book 2019-2020 Historical and Organizational A2
President Rita Hartung Cheng

Fall SemesterAlabama The University of Alabama* Maryland Morgan State University North Dakota North Dakota State University-Main Campus
University of Alabama in Huntsville University of Maryland Eastern Shore University of North DakotaUniversity of South Alabama University of Maryland-Baltimore County
Ohio Bowling Green State University-Main Campus*Alaska University of Alaska Fairbanks Massachusetts University of Massachusetts-Boston Cleveland State University
University of Massachusetts-Dartmouth Kent State University at KentArizona Arizona State University-Downtown Phoenix University of Massachusetts-Lowell Miami University-Oxford
Arizona State University-Skysong Ohio University-Main Campus*Northern Arizona University Maine University of Maine* University of Akron-Main Campus*
University of ToledoArkansas Arkansas State University-Main Campus Michigan Central Michigan University Wright State University-Main Campus
University of Arkansas at Little Rock Eastern Michigan UniversityMichigan Technological University Oregon Portland State University
California San Diego State University Oakland UniversityUniversity of California-Merced Western Michigan University* Puerto Rico University of Puerto Rico-Rio Piedras Campus
Colorado University of Colorado Colorado Springs Mississippi Jackson State University Rhode Island University of Rhode Island
Delaware Delaware State University Missouri Missouri University of Science and Technology South Dakota South Dakota State UniversityUniversity of Missouri-Kansas City University of South Dakota
Florida Florida Agricultural and Mechanical University University of Missouri-St LouisFlorida Atlantic University Tennessee East Tennessee State University
Montana The University of Montana Tennessee State UniversityGeorgia Georgia Southern University Tennessee Technological University
Georgia State University* Nevada University of Nevada-Las Vegas* University of MemphisKennesaw State University
Nebraska University of Nebraska at Omaha Texas Texas A & M University-Corpus ChristiIdaho Boise State University Texas A & M University-Kingsville
Idaho State University New Jersey Montclair State University Texas Southern UniversityUniversity of Idaho Rowan University Texas State University
Rutgers University-Camden The University of Texas at San AntonioIllinois Illinois State University Rutgers University-Newark The University of Texas Rio Grande Valley
Northern Illinois University*Southern Illinois University Carbondale* New Mexico New Mexico State University-Main Campus Utah Utah State University
Indiana Ball State University New York CUNY City College Vermont University of VermontIndiana University-Purdue University-Indianapolis SUNY College of Environmental Science and Forestry
Virginia College of William and Mary Kansas Wichita State University* North Carolina East Carolina University George Mason University*
North Carolina A & T State University Old Dominion University*Louisiana Louisiana Tech University University of North Carolina at Charlotte
University of Louisiana at Lafayette University of North Carolina at Greensboro* West Virginia Marshall UniversityUniversity of New Orleans University of North Carolina Wilmington
Wyoming University of Wyoming
Fact Book 2019-2020 Historical and Organizational A3
Public High Research Universities
*NAU ABOR-approved Peer Institutions including The University of Alabama, Georgia State University, George Mason University, and University of Nevada-Las Vegas which are not Carnegie PeersNOTE: Doctoral Universities. Includes institutions that awarded at least 20 research/scholarship doctoral degrees during the update year and also institutions with below 20 research/scholarship doctoral degrees that awarded at least 30 professional practice doctoral degrees in at least 2 programs. Excludes Special Focus Institutions and Tribal Colleges.SOURCE: Carnegie Classification 2018: Doctoral Universities – High research activity - Public

Fall Semester
Alabama 228 Maine 194Alaska 1,068 Maryland 567Arizona 104,026 Massachusetts 542
Apache County 1,557 Michigan 829 Cochise County 1,183 Minnesota 912
Arizona 62% Oregon 2% Coconino County 14,027 Mississippi 102California 9% New Mexico 1% Gila County 854 Missouri 635Colorado 4% Nevada 1% Graham County 773 Montana 693Texas 2% Florida 1% Greenlee County 106 Nebraska 286Washington 2% Utah 1% La Paz County 156 Nevada 2,312
Maricopa County 55,358 New Hampshire 211 Mohave County 2,141 New Jersey 406 Navajo County 2,640 New Mexico 2,501 Pima County 11,863 New York 1,095 Pinal County 2,921 North Carolina 983 Santa Cruz County 510 North Dakota 168 Yavapai County 5,706 Ohio 795 Yuma County 4,231 Oklahoma 435
Arkansas 273 Oregon 2,779California 15,082 Pennsylvania 757Colorado 5,933 Rhode Island 83Connecticut 334 South Carolina 325Delaware 59 South Dakota 201District of Columbia 122 Tennessee 602Florida 1,511 Texas 3,742Georgia 748 Utah 1,471Hawaii 716 Vermont 162Idaho 1,247 Virginia 1,260Illinois 1,383 Washington 3,662
(SQL - academic level, degree) Indiana 454 West Virginia 68Iowa 418 Wisconsin 706Kansas 431 Wyoming 405Kentucky 238 Non-US Sites* 3,386Louisiana 224
SOURCE: NAU Alumni Office–Addressable alumni as of 11/5/2019 TOTAL 167,770
Living Alumni Distribution
Total Current Arizona Alumni STATE Alumni STATE Alumni104,026
Total Current United States Alumni164,384
TOP TEN STATES
*includes international alums
Fact Book 2019-2020 Historical and Organizational A4
3,662
2,779
2,312
15,082
1,4715,933
104,026 2,501
3,742
1,511

Year YearAppointed Appointed
Julie Baldwin, Ph.D Health Sciences 2019 Jill Dubisch, Ph.D Anthropology 1998
Peter Fulé Forestry 2019 Michael Eastman, Ph.D. Chemistry 1998
Andrew Richardson Informatics, Computing and Cyber Systems 2019 Donald V. Bendel, Ph.D. Fine Arts 1997
Nancy Johnson, Ph.D Biological Sciences 2017 Curtis M. Hinsley, Jr., Ph.D. History 1997
Bruce Hungate, Ph.D Biological Sciences 2015 Graydon L. Berlin, Ph.D. Geography and Public Planning 1996
Paul Beier, Ph.D Forestry 2013 Dean W. Blinn, Ph.D. Biological Sciences 1996
Edith Copley, Ph.D Music 2013 William W. Covington, Ph.D. Forestry 1995
Darrell Kaufman, Ph.D Geology / Environmental Science 2013 Robert T. Trotter, II, Ph.D. Anthropology 1995
William Grabe, Ph.D English 2009 Thomas G. Whitham, Ph.D. Biological Sciences 1995
Lee Drickamer, Ph.D Biological Sciences 2004 Dickson A. Mungazi, Ph.D. Education 1994
Raymond Michalowski, Ph.D Criminal Justice 2004 Peter W. Price, Ph.D. Biological Sciences 1994
Kiisa Nishikawa, Ph.D Biological Sciences 2003 Gina P. Cantoni, Ph.D. Bilingual/Multicultural Education 1991
Jim Simmerman, MFA English 2003 H. Lloyd Mogensen, Ph.D. Biological Sciences 1991
Paul Keim, Ph.D Biological Sciences 2002 James D. Sexton, Ph.D. Anthropology 1991
Thomas McPoil, Ph.D Physical Therapy 2001 Monte M. Poen, Ph.D. History 1990
Zachary Smith, Ph.D Political Science 2001 Stanley Beus, Ph.D Geology 1989
Karen Van Winkle-Swift, Ph.D Biological Sciences 2001 Lawrence M. Perko, Ph.D. Mathematics 1989
Douglas Biber, Ph.D English 2000 Russell P. Balda, Ph.D. Biological Sciences 1988
Stan L. Lindstedt, Ph.D. Biological Sciences 1999 J. Dale Nations, Ph.D. Geology 1988
Michael R. Wagner, Ph.D. Forestry 1999 William J. Roosen, Ph.D History 1988SOURCE: Office of the Provost
Regents' Professors
"The title, 'Regents' Professor' is reserved for faculty members with exceptional achievements that have brought them national or international distinction. The title serves as recognition of the highest merit and unusual contributions to the quality of the individual's university."
Arizona Board of Regents Policy Manual 6-208
Name Discipline Name Discipline
Fact Book 2019-2020 Historical and Organizational A5

8/22/2019-9/7/2019 Welcome Week 1/13/2020 Spring Semester Begins8/26/2019 Fall Semester Begins 1/20/2020 Martin Luther King, Jr. Day (University Closed)9/2/2019 Labor Day (University Closed) 3/16/2020-3/20/2020 Spring Break (No Classes)10/4/2019-10/6/2019 Family Weekend 5/1/2020 Last Day of Instruction10/21/2019-10/27/2019 Homecoming Week 5/4/2020-5/7/2020 Finals Week11/11/2019 Veteran's Day (University Closed) 5/8/20202-5/9/2020 Spring Commencement 11/28/2019-11/29/2019 Thanksgiving Break (University Closed)12/6/2019 Last Day of Instruction12/9/2019-12/12/2019 Finals Week12/13/2019 Fall Commencement
5/11/2020-5/29/2020 Three-week Session 5/11/2020-8/4/2020 Twelve-week Session 5/25/2020 Memorial Day (University Closed)
12/16/2019 Winter Session Instruction Begins 6/1/2020-6/30/2020 1st Five-week Session 12/25/2019-12/26/2019 Winter Closure (University Closed) 6/1/2020-8/4/2020 Ten-week Session 1/10/2020 Last Day of Instruction 7/3/2020 Independence Day (University Closed)
7/6/2020-8/4/2020 2nd Five-week Session
FoundedJ. Lawrence Walkup Sky Dome 1977, the second largest clear-span timber dome in the world
Largest Building Walkup Sky Dome, 268,000 gross square feetOldest Building 1894, Old Main has housed offices, classrooms, laboratories, and served for a time as a dormitory
Local Attractions Grand Canyon National Park, Sedona, Oak Creek Canyon, Lake Mary, San Francisco PeaksLocation 145 miles north of Phoenix at the junction of I-17 and I-40Elevation 7,000 feet
Mascot Louie the Lumberjack
Calendar and Campus Facts
FALL SEMESTER 2019
WINTER SESSION 2019
SPRING SEMESTER 2020
1899, Northern Arizona Normal School
SUMMER SESSIONS 2020
Fact Book 2019-2020 Historical and Organizational A6

23A 3-C Academic Annex 1 2-B Gammage 95 6-B,C Pine Ridge Village
26 3-B Adel Mathematics 43 4-C Gateway Student Success Ctr 92 3-A Ponderosa
46 4-B Allen Hall 12 2-B Geology 57 2-C Printing Svcs
49 5-C Anthropology Laboratory 13 2-B Geology Annex 3A 2-B Prochnow Auditorium
56 4-B Applied Research & Development 31 3-C Gillenwater Hall 65 6-B Raul H. Castro SBS
86 3-C Aquatic & Tennis Complex 79 7-C Greenhouse Complex 39 3-B Raymond Hall
37A 3-B Ardrey Auditorium 25 3-C Health & Learning Ctr 48 4-B Reilly Hall
11 2-B Ashurst Hall 66 7-B Health Professions 74 7-B Renewable Energy Test Facility
47 5-C Atmos. Obs./Lutz Telescope 58 1-C High Country Conf Ctr 98F 6-D Residence Life Warehouse
76 7-C Aviation Cognition Laboratory 59 4-C Hilltop Townhomes 15 2-B Riles
23 3-C Babbitt Academic Annex 82B 7-B Hogan 68 7-B Rolle Activity Ctr
51 6-B Babbitt Administrative Ctr 41 4-B Honors Living & Learning Community 13A 2-B Roseberry Apartments
7A 2-C Beaver Street House 32 3-C Hospitality Resource & Rsrch Ctr 47A 5-C ROTC
52 5-B Bilby Research Ctr 33A 3-C Hughes Hotel & Rest Mgmt. 96B 3-C San Francisco Prkg Structure
21 2-C Biological Sciences 96 7-A Huffer Lane Facility 90 4-A Sch of Informatics, Comp, & Cyber Sys
21B 2-C Biological Sciences Annex 7B 1-C Humphreys Office Building 36 2-C Science and Health Building18A 2-C Biology Greenhouse 54B 4-B Information Systems Annex 20 2-C Science Annex
2 2-B Blome 54 4-B Information Technology Svcs 17 2-C Science Lab Facility
35 3-C Bookstore/Postal Svcs 27A 3-A Institute for Human Development 84 7-C Sculpture Studio
8 2-C Bury 50A 5-B International Pavillion 42 4-C Sechrist Hall
6 2-C Campbell Hall 83 7-D KNAU 70 6-A Soc & Behavioral Sci West
50 4-B Campus Heights Apartments 96A 4-B Knoles Prkg Structure 93 2-C South Beaver Sch
77A 7-D Capital Assets & Svcs Annex 61 6-B Learning Resource Ctr 63 14-E South Dining
97 7-C CECMEE Field Station 18 2-C Liberal Arts 67 7-B South Heating & Cooling Plant
91 2-C Centennial 62 6-C McConnell Hall 71 8-B South Village
80 7-D Ceramics Complex 40 3-B McDonald Hall 82 7-B Southwest Forest Sci Cmplx
28 3-B Cline Library 50B 4-B McKay Village 60 3-C Student & Academic Svcs
16 2-B Communication 4 2-C Morton Hall 9 2-B Taylor Hall
98B 7-D Contracting & Purchasing Svcs 83 7-D Mountain Campus Transit 75 6-B The Suites
38 3-B Cowden Learning Community 55 3-D Mountain View Hall 44 4-B Tinsley Hall
58A 1-B Drury Inn & Suites 14 2-B Native American Cultural Ctr 16A 2-B University Marketing & Operations
64 6-B du Bois South Union 5 2-C North Hall 98A 6-D University Police
27 2-B Eastburn Education Ctr 24 2-B North Heating & Cooling Plant 30 3-B University Union
98C 6-D Engineering Research 3 2-B North Union 81 6-B WA Franke College of Business
69 7-B Envir, Foresty & Natural Sci 72 7-B Nursing 73 6-C Walkup Skydome
29 4-B Ernest Calderón Learning Ctr 10 2-B Old Main 88 2-C Wettaw
98D 7-D Extrended Campus Ops Ctr 37 3-B Performing & Fine Arts 45 4-B Wilson Hall
77 7-C Facility Svcs/Property Admin 22 3-C Peterson
53 5-B Gabaldon Hall 19 2-C Physical Sciences
SOURCE:Parking Services, only locations listed on the Parking Map were included here
Fact Book 2019-2020 Historical and Organizational A7
Campus MapSEC NAMEBLDG SEC NAME BLDG SEC NAME BLDG

Chief Executive Officer: Dr. Rita Cheng, PresidentName change notes: Arizona State College to Northern Arizona University (1966)
HLC Institution: ID: 1010 Current Accreditation Status: Accredited Accreditation Date(s): (1930- .)Participation Notes: Northern Arizona University-Yuma: Participating in the Academy for Assessment of Student
Learning.Year of Last PEAQ Comprehensive Evaluation: 2017-2018Year of Next PEAQ Comprehensive Evaluation: 2027-2028
Last Action: 2/13/2018 Legal Status: Public Degrees Awarded: Bachelor's, Master's, Doctoral
. Accreditation Board for Engineering and Technology (ABET) - Computing Accreditation Commission . Commission on Collegiate Nursing Education (CCNE)
. Accreditation Board for Engineering and Technology (ABET) - Engineering Accreditation Commission . Commission on Dental Accreditation (CODA)
. Accreditation Commission for Programs in Hospitality Administration (ACPHA) . Council for Accreditation of Counseling and Related Educational Programs (CACREP)
. Accreditation Council for Business Schools and Programs (ACBSP) - NAU Yuma . Council for Interior Design Accreditation (CIDA)
. Accreditation Council for Education in Nutrition and Dietetics (ACEND) . Council for the Accreditation of Educator Preparation (CAEP)
. Accreditation Council for Occupational Therapy Education (ACOTE) . Council on Academic Accreditation in Audiology and Speech-Language Pathology (CAA)
. Accreditation Review Commission on Education for the Physician Assistant (ARC-PA) . Council on Accreditation of Parks, Recreation, Tourism and Related Professions (COAPRT)
. American Council for Construction Education (ACCE) . Council on Social Work Education (CSWE)
. American Speech-Language-Hearing Association (ASHA) . Educational Leadership Consituent Council (ELCC)
. Association for Childhood Education International (ACEI) . International Literacy Association (ILA)
. Association to Advance Collegiate Schools of Business (AACSB International) - The W.A. Franke College of Business
. International Society for Technology in Education (ISTE)
. Commission on Accreditation in Physical Therapy Education (CAPTE) . National Association of Schools of Music (NASM)
. Commission on Accreditation of Allied Health Education Programs (CAAHEP) . Society of American Foresters (SAF)
. Commission on Accreditation of Athletic Training Education (CAATE) . Society of Health and Physical Educators (SHAPE)
SOURCE: https://www.hlcommission.org/, accreditation and association websites
Fact Book 2019-2020 Historical and Organizational A8
Accreditations
Northern Arizona University is accredited by the Higher Learning Commission (HLC) to award bachelor, master and doctoral degrees. More information can be found at http://www.hlcommission.org. NAU’s original institutional accreditation was granted in 1930 and is up for renewal in 2027. In addition, some programs are accredited by specialized agencies as listed below.
STATEMENT OF AFFILIATION STATUS
PROGRAM ACCREDITATIONS

CIRP: Cooperative Institutional Research Survey, New Freshmen Report
FSSE: Faculty Survey of Student Engagement
Graduating Senior Survey
NSSE: National Survey of Student Engagement Report
Sophomore Survey Report
SOURCE: NAU Office of Institutional Research and Analysis
Please refer to the Institutional Research and Analysis website (nau.edu/Institutional-Research/Surveys/) for yearly survey reports
The Cooperative Institutional Research Program (CIRP) survey is a national study of the American Higher Education System sponsored by the American Council on Education and administered by the Higher Education Research Institute at the University of California-Los Angeles. This survey is designed to assess the demographic characteristics, past experiences, current opinions, as well as the aspirations of new incoming freshmen.
The Faculty Survey of Student Engagement (FSSE) was constructed to parallel the National Survey of Student Engagement (NSSE). The faculty version focuses on faculty perceptions of how often their students engage in different activities, the importance faculty place on various areas of learning and development, the types of interactions faculty have with students, and how faculty members organize class time. The pilot test of the FSSE was administered electronically as a web-only survey in spring 2003.
This survey assesses graduating senior student satisfaction and opinions about their experience at the university. Student satisfaction is measured in several areas: general academics, major department, faculty, skills development, advising, and experiences outside the classroom.
Institutional Surveys and Reports
This survey assesses sophomore student satisfaction and opinions about their experiences at the university. This survey is designed to assess the demographic characteristics, college related goals, hours per week spent working, frequency of classroom activities, importance of the instructors, satisfaction with service offices, as well as NAU's contribution to the personal growth of the university sophomore student.
Fact Book 2019-2020 Historical and Organizational A9
This survey focuses on assessing student engagement, of freshmen compared to seniors, in the areas of academic challenge, active and collaborative learning, student-faculty interaction, enriching educational experiences, and the supportive campus environment at the Northern Arizona University. This is a national survey with comparative data from other four-year colleges or universities.

Fall 2019
Undergraduate 26,513 86% Undergraduate Students American Indian/Alaska Native 878 3%Graduate 4,223 14% Full-time 21,731 82% Asian 669 2%Total 30,736 100% Part-time 4,782 18% Black/African American 1,019 3%
Total 26,513 100% Hispanic/Latino 7,395 24%Graduate Students Native Hawaiian/Other Pacific Islander 86 <1%
Full-time 2,172 51% Non-resident Alien (International) 1,280 4%Undergraduate Students Part-time 2,051 49% Not Specified 807 3%
Men 10,210 39% Total 4,223 100% Two or More Races 1,660 5%Women 16,303 61% White 16,942 55%
Total 26,513 100% Total 30,736 100%Graduate Students
Men 1,327 31% Resident 20,115 65%Women 2,896 69% Nonresident 10,621 35%
Total 4,223 100% Total 30,736 100%
First-time Freshmen* 5,455 70%New Transfers* 2,339 30%Total 7,794 100%
Flagstaff Mountain** 22,791 74%
Community Campuses 1,778 6%
Online 5,651 18%
Yuma 516 2%Total 30,736 100% (SQL - academic level, degree)
*Based on Revised CO2 Cohort** Includes the Phoenix Biomedical CampusDue to rounding, percentages may not equal 100.SOURCE: Official 21st Day Census– All Enrolled Students, NAU Office of Institutional Research and Analysis
Headcount %
Fast Facts
STUDENT LEVEL Headcount % FULL-TIME/PART-TIME Headcount % IPEDS ETHNICITY/RACE
Fast Facts B1
RESIDENCY Headcount %
GENDER Headcount %
NEW UNDERGRADUATES Headcount %
CAMPUS Headcount %
Fact Book 2019-2020
American Indian/Alaska Native
3%Asian
2%Black/African
American3%
Hispanic/Latino24% Native
Hawaiian/Other Pacific Islander
<1%
Non-resident Alien (International)
4%
Not Specified3%
Two or More Races5%
White55%
IPEDS ETHNICITY/RACEFALL 2019

Fall 2019
Undergraduate 22 20 Faculty 1,175
Graduate 33 30 Other employees 2,009
First-time Freshman 18 18 Total 3,184
Capacity 8,064 2-9 10-19 20-29 30-39 40-49 50-99 100+ Lower-division 213,024 14,202
Occupancy 7,766 Upper-division 135,878 11,323
Singles units 1% Graduate 36,501 3,650
Doubles units 48% Total 385,403 29,175
Triples/suites 27%
Apartments 24%
Biomedical Sciences (BS) 1,229 5%Criminology and Criminal Justice (BS) 1,102 4%Nursing (BSN) 1,098 4%Elementary Education (BSED) 887 3%Biology (BS) 864 3%
Physical Therapy - Entry Level (DPT) 291 7%Educational Leadership - Principal K-12 (MED) 262 6%Organizational Leadership (M) 199 5%Educational Leadership - Comm College/Higher Ed (MED) 176 4%Educational Leadership (EED) 170 4%
*American Campus Communities’ Hilltop Townhomes, Skyview, and The Suites are not included in these data. Due to rounding, percentages may not equal 100.SOURCE: Official 21st Day Census–All Enrolled Students, NAU Office of Institutional Research and Analysis
Fast Facts (continued)
AGE Average Median FULL-TIME FACULTY/STAFFSTATE BUDGET
FY 2020 Expenditure Authority
ON-CAMPUS HOUSING*
$270,405,400
Headcount
HeadcountTOP 5 GRADUATE ACADEMIC PLANS
%
%
TOP 5 UNDERGRADUATE ACADEMIC PLANS(does not include Post-Baccalaureate Students)
4% 30%
LOWER DIVISION MAIN CLASS SIZE DISTRIBUTION
20% 14% 9%
Fact Book 2019-2020 Fast Facts B2
CLASS LEVEL SCH FTE
17% 7%
Lower-division 49%
Upper-division39%
Graduate12%
Class Level FTEFall 2019

Bowling Green State University - Main Campus 17,540 14,858 2,682 2,817 893 91 17% 74% 15%
George Mason University 37,316 26,192 11,124 5,545 2,894 435 51% 57% 18%
Georgia State University 34,316 27,231 7,085 4,972 2,100 485 73% 61% 17%
Kent State University - Main Campus 28,122 22,557 5,565 5,589 1,636 275 18% 66% 15%
Northern Arizona University 31,066 27,072 3,994 6,042 1,198 174 38% 70% 21%
Northern Illinois University 17,169 12,788 4,381 3,446 1,399 236 45% 65% 12%
Ohio University - Main Campus 28,480 22,309 6,171 7,030 1,868 375 14% 60% 17%
Old Dominion University 24,176 19,372 4,804 3,934 994 231 52% 62% 9%
Southern Illinois University - Carbondale 12,817 9,552 3,265 3,254 880 348 30% 63% 15%
The University of Alabama 38,390 33,028 5,362 6,750 1,681 428 20% 77% 36%
University of Akron - Main Campus 18,731 15,634 3,097 2,887 896 287 22% 66% 16%
University of Maine 11,404 9,365 2,039 1,760 375 55 11% 72% 18%
University of Nevada - Las Vegas 30,457 25,282 5,175 4,163 1,054 333 66% 62% 22%
University of North Carolina - Greensboro 20,106 16,641 3,465 3,262 812 164 50% 71% 14%
Western Michigan University 22,562 17,760 4,802 3,763 1,279 130 25% 66% 10%
Wichita State University 15,778 13,006 2,772 2,198 719 121 30% 56% 19%
* Based on US News Fall 2018 Data
Fact Book 2019-2020 Fast Facts B3
Enrollment Graduate
UG % Diversity
Approved Arizona Board of Regents Peer Institutions for NAU
SCHOOL Enrollment Total
Enrollment Undergraduate
Bachelor's Awards
Master's Awards
Doctorates Awards
UG % Full-time
High School Top Ten %*
NOTE: IPEDS College Navigator Fall 2018 enrollment and IPEDS Data Center 2017/18 (first major) awards data. UG % Diversity is based on IPEDS ethncity/race of American Indian/Alaska Native, Asian, Black or African American, Hispanic, Native Hawaiian/Other Pacific Islander, and Two or More races/ethnicities.

Program Bachelor Master Doctor Program Bachelor Master Doctor Program Bachelor Master DoctorAccountancy BSACCY Electrical Engineering BS MS Marketing BSBA
Anthropology BA Elementary Education BSED MED Mathematics BS MS
Anthropology - Applied MA Elementary Education - Certification MED Mathematics Education MS
Anthropology - Research MA Elementary Education Yuma BSED Mechanical Engineering BS MS PHD
Applied Computer Science BS Engineering - Civil Engineering MENG Microbiology BS
Applied Criminology MS Engineering - Computer Science and Engineering MENG Modern Languages BA
Applied Geospatial Sciences MS Engineering - Electrical Engineering MENG Music BA MM
Applied Indigenous Studies BA, BS Engineering - Environmental Engineering MENG Music Performance BMUS
Applied Linguistics PHD Engineering - Mechanical Engineering MENG Music Secondary Education BMED
Applied Physics MS English BA Nursing BSN
Applied Physics and Materials Science PHD English - Literature MA Nursing - Accelerated Option BSN
Applied Science - Administration BAS English - Professional Writing MA Nursing - Family Nurse Practitioner MS
Applied Science - Early Childhood BAS English - Rhetoric, Writing, and Digital Media Studies MA Nursing - Generalist MS
Applied Science - Emergency Management BAS English - Secondary Education MA Nursing - Option for Registered Nurses BSN
Applied Science - Industrial Technology Management BAS Environmental and Sustainability Studies BA, BS Nursing Practice DNP
Applied Science - Justice Studies BAS Environmental Engineering BS MS Occupational Therapy OTD
Applied Science - Logistics and Supply Chain Management BAS Environmental Sciences BS Organizational Leadership M
Applied Science - Public Administration BAS Environmental Sciences and Policy MS Parks and Recreation Management BS MS
Applied Science - Technology Management BAS ESL and Bilingual Education - Bilingual MED Philosophy BA
Applied Sociology MA ESL and Bilingual Education - ESL MED Philosophy, Politics and Law BA
Art Education BSED Exercise Science BS Photography BS
Astronomy BS Finance BSBA Physical Therapy - Entry Level DPT
Astronomy and Planetary Science PHD Forest Science PHD Physician Assistant Studies MPAS
Athletic Training MS Forestry BSF MF, MSF Physics BS
Bioengineering PHD Geographic Science and Community Planning BS Physics and Astronomy BS
Biological and Natural Resource Sciences BS Geology BS MS Political Science BA, BS MA PHD
Biology BS MS PHD Global Business Administration MGBA Psychological Sciences BS MA
Biomedical Science BS Health Sciences - Allied Health BS Psychology BS
Building Science MS Health Sciences - Diagnostic Medical Imaging and Therapy BS Public Administration B MPA
Business Administration BBA MBA Health Sciences - Fitness Wellness BS Public Health MPH
Business Economics BSBA Health Sciences - Medical Assisting BS School Psychology EDS
Career and Technical Education MED Health Sciences - Nutrition and Foods BS Science Teaching MA
Career and Technical Education 90-30 BSED Health Sciences - Paramedic Care BS Secondary Education - Biology BSED
Chemistry BS MS Health Sciences - Physical Education BSED Secondary Education - Biology Yuma BSED
Civil Engineering BS MS Health Sciences - Physical Therapist Assisting BS Secondary Education - Certification MED
Climate Science and Solutions MS Health Sciences - Public Health BS Secondary Education - Chemistry BSED
Clinical Mental Health Counseling MA Health Sciences - Respiratory Care BS Secondary Education - Continuing Professional MED
Clinical Speech - Language Pathology MS Health Sciences - Surgical Technology BS Secondary Education - Earth Science BSED
Combined Counseling/School Psychology PHD History BA, BS MA Secondary Education - English BSED
Communication MA Hotel and Restaurant Management BS Secondary Education - General Science BSED
Communication Sciences and Disorders BS Human Relations MED Secondary Education - History and Social Studies BSED
Communication Studies BA, BS Indian Country Criminal Justice BS Secondary Education - Mathematics BSED
Comparative Cultural Studies BA Informatics BS MS Secondary Education - Physical Science Yuma BSED
Computer Engineering BS Informatics and Computing PHD Secondary Education - Physics BSED
Computer Information Technology BA, BS M Information Systems BSBA Secondary Education - Spanish BSED
Computer Science BSCS MS Interdisciplinary Health PHD Small Business Administration BA, BS
Construction Management BS Interdisciplinary Studies - Administration B Social Work BASW, BSW MSW
Counseling - School Counseling MED Interdisciplinary Studies - Applied Human Behavior 90-30 B Social Work - Advanced Standing MSW
Counseling - Student Affairs MED Interdisciplinary Studies - Early Childhood B Sociology B, BS
Creative Media and Film BS Interdisciplinary Studies - Emergency Management 90-30 B Spanish BA MAT
Creative Writing MFA Interdisciplinary Studies - Humanities 90-30 B Spanish Education MAT
Criminology and Criminal Justice BS Interdisciplinary Studies - Industrial Leadership 90-30 B Special and Elementary Education BSED
Curriculum and Instruction PHD Interdisciplinary Studies - Justice Studies 90-30 B Special Education MED
Data Science BS Interdisciplinary Studies - Learning and Pedagogy B Special Education - Early Childhood Special Ed with Cert MED
Dental Hygiene BSDH Interdisciplinary Studies - Public Administration 90-30 B Special Education - Mild/Moderate Disabilities Certified MED
Dental Hygiene - Degree Completion Program BSDH Interdisciplinary Studies - Strategic Leadership 90-30 B Statistics MS
Early Childhood Education MED Interdisciplinary Studies - Technology Management 90-30 B Strategic Communication BS
Early Childhood Education & Early Childhood Special Education BSED Interior Design BS Studio Art BFA
Earth Sciences and Environmental Sustainability PHD International Affairs BA Sustainable Communities MA
Educational Foundations MED International Education Leadership MED Teaching English as a Second Language MA
Educational Leadership EDD Journalism BSJOUR Teaching Science with Certification MAT
Educational Leadership - Cmty College/Higher Ed MED Journalism and Political Science BS Theatre BA, BS
Educational Leadership - Instr Ldrshp K-12 School Ldrshp MED Justice Studies B University Studies BUS
Educational Leadership - Principal K-12 MED Liberal Arts BA, BS Visual Communication BFA
Educational Technology MED Management BA, BS, BSBA Women's and Gender Studies BS
SOURCE: NAU Office of Institutional Research and Analysis
Programs Offered
Fact Book 2019-2020 Fast Facts B4

Entering Fall
First-time Full-time Freshmen
One-year Retention Rate
Four-year Graduation Rate
Five-year Graduation Rate
Six-year Graduation Rate
2010 3,739 72.8% 36.6% 50.4% 53.3%2011 3,194 76.1% 40.3% 52.7% 55.3%2012 4,086 71.8% 37.2% 49.4% 52.4%2013 4,338 73.6% 41.1% 53.6% 56.6%2014 4,380 74.4% 42.4% 54.5%2015 4,660 75.5% 45.1%2016 5,006 75.8%2017 5,258 73.5%2018 5,047 77.5%2019 4,772
(SQL - academic level, degree)
SOURCE: NAU Office of Institutional Research and Analysis
Retention and Graduation Rates
Fact Book 2019-2020 Fast Facts B5
77.5%
45.1%
54.5%56.6%
2 0 1 0 2 0 1 1 2 0 1 2 2 0 1 3 2 0 1 4 2 0 1 5 2 0 1 6 2 0 1 7 2 0 1 8
RETENTION AND GRADUATION RATESFIRST-TIME FULL-TIME FRESHMAN COHORTS
One-year Retention Rate Four-year Graduation Rate Five-year Graduation Rate Six-year Graduation Rate

Fall 2019
High School Concurrent 3 <1% Masters* 3,213 76% American Indian/Alaska Native 878 3%Freshmen 6,855 26% Doctorates 958 23% Asian 669 2%Sophomores 5,105 19% Non-degree 52 1% Black/African American 1,019 3%Juniors 6,254 24% Total 4,223 100% Hispanic/Latino 7,395 24%Seniors 7,535 28% Native Hawaiian/Other Pacific Islander 86 <1%Non-degree 375 1% Non- Non-resident Alien (International) 1,280 4%Post Baccalaureate 386 1% resident Not Specified 807 3%Total 26,513 100% Full-time 1,270 902 Two or More Races 1,660 5%
Part-time 1,587 464 White 16,942 55% Non- Total 2,857 1,366 Total 30,736 100%resident
Full-time 14,258 7,473Part-time 3,000 1,782Total 17,258 9,255 Masters* 33 30 American Indian/Alaska Native 1,605 5%
Doctorates 32 28 Asian 1,727 6%Black/African American 1,888 6%Hispanic/Latino 7,408 24%
Freshmen 19 18 Native Hawaiian/Other Pac Islander 546 2%Sophomores 20 19 Not Specified 1,901 6%Juniors 23 21 White 21,992 72%Seniors 26 22
(SQL - academic level, degree)
*Includes Master’s Certificate students and Master's Preparation students
Due to rounding, percentages may not equal 100SOURCE: Official 21st Day Census– All Enrolled Students
Student Characteristics C1
Median ALL DECLARED ETHNICITY/RACE VALUES** Count %
All Declared Ethnicity/Race values are duplicated and represent one or more values per student
IPEDS Ethnicity/Race are unduplicated and represent one value per student
IPEDS ETHNICITY/RACE Headcount %
Student Demographics
UNDERGRADUATE STUDENTS Headcount % GRADUATE
STUDENTS Headcount
UNDERGRADUATE AGE Average Median
Fact Book 2019-2020
%
UNDERGRADUATE RESIDENCY Resident
GRADUATE RESIDENCY Resident
GRADUATE AGE Average
**Students may declare more than one ethnicity/race category. These counts are not to be used for federal IPEDS reporting, but to more accurately reflect student populations. Percentages will not sum to 100% due to total student headcount being used as the denominator.
High School Concurrent
<1%
Freshmen26%
Sophomores19%
Juniors24%
Seniors28%
Non-degree1%
Post Baccalaureate1%
Undergraduate BreakdownFall 2019

Fall Fall Fall Fall Fall Fall Fall Fall Fall Fall2010 2011 2012 2013 2014 2015 2016 2017 2018 2019
Resident 2,643 2,444 2,558 2,798 3,010 3,261 3,507 3,858 3,758 3,392Non-resident 1,415 1,374 1,633 1,919 1,876 1,953 2,095 2,036 2,109 2,063Total 4,058 3,818 4,191 4,717 4,886 5,214 5,602 5,894 5,867 5,455
Fall 2010
Fall 2011
Fall 2012
Fall 2013
Fall 2014
Fall 2015
Fall 2016
Fall 2017
Fall 2018
Fall 2019
SAT 1062 1065 1056 1047 1045 1037 1045 1124 1138 1136ACT 23 23 23 23 23 23 23 22 22 22High School GPA 3.4 3.5 3.5 3.4 3.5 3.5 3.6 3.6 3.6 3.6
2008 17% 32% 48% California 896 16% Nursing 8%2009 16% 35% 47% Colorado 156 3% Biomedical Science 6%2010 16% 37% 46% New Mexico 125 2% Business Preparation 6%2011 16% 35% 47% Nevada 117 2% Criminology & Criminal Justice 5%2012 16% 34% 48% Hawaii 103 2% Biology 5%2013 19% 33% 46% Washington 72 1% Exploratory 5%2014 16% 32% 51% Oregon 57 1% Exercise Science 4%2015 14% 30% 55% Texas 57 1%2016 12% 29% 57% Alaska 49 1%2017 12% 28% 58% Idaho 28 1%2018 11% 25% 63% Fall 2018 to 20192019 10% 24% 65% First-time Full-time Freshmen 78%
(SQL - academic level, degree) Fall 2013 First-time, Full-time Freshman CohortAs of 5/28/2020 Four Years 41%Effective 2014-2015 edition Fact Book, deceased students have been removed from cohort counts Six Years 57%Effective 2017-2018, high school GPA ranges and methodology updated retroactively to align with the Common Data Set (CDS)Note: SAT was rescaled in March 2016. Per national norms, scores are reported using the old scales through 2016-2017. Scores are reported using the new scales 2017-2018 and later.SOURCE: NAU Office of Institutional Research and Analysis Revised Cohort (CO2) Files
Fact Book 2019-2020 Student Characteristics C2
First-time Freshman Profile
FRESHMAN ENROLLMENT BY RESIDENCY
RETENTION RATE
GRADUATION RATE
AVERAGE TEST SCORES AND HIGH SCHOOL GPA
HIGH SCHOOL GPA 2.5 - 2.99 3.0 - 3.49 ≥ 3.5 TOP TEN STATES Headcount % %TOP MAJORS

Fall Fall Fall Fall Fall Fall Fall Fall Fall Fall2010 2011 2012 2013 2014 2015 2016 2017 2018 2019
Lower-division Transfer 776 746 709 717 814 894 876 831 710 608Upper-division Transfer 1,531 1,554 1,655 1,757 1,967 2,129 2,015 1,858 1,695 1,731Total 2,307 2,300 2,364 2,474 2,781 3,023 2,891 2,689 2,405 2,339
Fall Fall Fall Fall Fall Fall Fall Fall Fall Fall2010 2011 2012 2013 2014 2015 2016 2017 2018 2019
Arizona Community Colleges 1,465 1,463 1,462 1,382 1,339 1,377 1,019 1,809 1,665 1,644Arizona State University 58 62 57 59 52 41 17 44 40 32University of Arizona 50 39 49 27 37 26 8 28 23 23Other Institutions 734 736 798 1,007 1,354 1,583 1,848 811 677 640Total 2,307 2,300 2,366 2,475 2,782 3,027 2,892 2,692 2,405 2,339
Fall 2018 Full-time Transfer Cohort to Fall 2019Lower-division Transfer Students 73%Upper-division Transfer Students 67%
Fall 2013 Full-time Transfer CohortLower-division Transfer Students 64%Upper-division Transfer Students 78%
(SQL - academic level, degree)
As of 5/28/2020Effective 2014-2015 edition Fact Book, deceased students have been removed from cohort countsBeginning Fall 2017, new source data was utilized to provide a more accurate reflection of the institutions most recently attended.SOURCE: NAU Office of Institutional Research and Analysis Revised Cohort (CO2) Files
SIX-YEAR GRADUATION RATE
New Transfer Student Profile
ENROLLMENT BY LEVEL
LAST INSTITUTION ATTENDED
RETENTION RATE
Fact Book 2019-2020 Student Characteristics C3
Lower-division Transfer
26%Upper-division Transfer
74%
New Transfer Students Fall 2019
Arizona Community
Colleges70%Arizona State
University2%
University of Arizona
<1%
Other Institutions
27%
New Transfer StudentsLast Institution Attended
Fall 2019

FLAGSTAFF MOUNTAIN Fall Fall Fall Fall Fall Fall Fall Fall Fall FallEnrollment by Transfer Cohort 2010 2011 2012 2013 2014 2015 2016 2017 2018 2019
Lower-division Transfer 598 535 504 543 536 574 534 551 464 399Upper-division Transfer 542 503 503 520 506 559 518 500 441 417Total 1,140 1,038 1,007 1,063 1,042 1,133 1,052 1,051 905 816
FLAGSTAFF MOUNTAIN FLAGSTAFF MOUNTAIN FLAGSTAFF MOUNTAINSix-year Graduation Rate
Fall 2018 Full-time Transfer Cohort to Fall 2019 Fall 2013 Full-time Transfer CohortLower-division Full-time Transfer Students 75% Lower-division Full-time Transfer Students 64%Upper-division Full-time Transfer Students 73% Upper-division Full-time Transfer Students 77%
STATEWIDE CAMPUSES & ONLINE Fall Fall Fall Fall Fall Fall Fall Fall Fall FallEnrollment by Transfer Cohort 2010 2011 2012 2013 2014 2015 2016 2017 2018 2019
Lower-division Transfer 178 211 205 174 278 320 342 280 246 209Upper-division Transfer 989 1,051 1,152 1,237 1,461 1,570 1,497 1,358 1,254 1,314Total 1,167 1,262 1,357 1,411 1,739 1,890 1,839 1,638 1,500 1,523
STATEWIDE CAMPUSES & ONLINE STATEWIDE CAMPUSES & ONLINERetention Rate Six-year Graduation Rate
Fall 2018 Full-time Transfer Cohort to Fall 2019 Fall 2013 Full-time Transfer CohortLower-division Transfer Students 66% Lower-division Transfer Students 64%Upper-division Transfer Students 64% Upper-division Transfer Students 78%
(SQL - academic level, degree)
As of 5/28/2020Effective 2014-2015 edition Fact Book, deceased students have been removed from cohort countsSOURCE: NAU Office of Institutional Research and Analysis
New Transfer Student Campus Profile
Retention Rate
Student Characteristics C4Fact Book 2019-2020

Fall 2019
Alabama 8 Montana 56 Arizona 66% Hawaii 1%Alaska 202 Nebraska 21 California 14% Washington 1%Arizona 20,271 Nevada 378 Colorado 2% Texas 1%Arkansas 9 New Hampshire 13 New Mexico 1% Oregon 1%California 4,446 New Jersey 40 Nevada 1% Alaska 1%Colorado 567 New Mexico 405Connecticut 19 New York 48Delaware 1 North Carolina 49District of Columbia 3 North Dakota 15Florida 68 Ohio 65Georgia 53 Oklahoma 24Hawaii 326 Oregon 224Idaho 102 Pennsylvania 54Illinois 156 Rhode Island 6Indiana 26 South Carolina 19Iowa 19 South Dakota 24Kansas 41 Tennessee 31Kentucky 15 Texas 289Louisiana 22 Utah 118Maine 11 Vermont 5Maryland 48 Virginia 44Massachusetts 25 Washington 305Michigan 49 West Virginia 2Minnesota 56 Wisconsin 59Mississippi 11 Wyoming 35Missouri 34 Unknown or Foreign 1,819
Total 30,736 (SQL - academic level, degree)
SOURCE: Official 21st Day Census – All Enrolled Students (based on U.S. Citizenship, First Known Home State)
STATE TOP TEN STATES
Students by State
STATE Headcount Headcount
Student Characteristics C5Fact Book 2019-2020
202
305
224
4,446
378
20,271
567
405
289
326

Fall 2019
Maricopa 12,259 60%Pima 2,205 11%Coconino 1,539 8%Yuma 861 4%Pinal 761 4%Yavapai 756 4%Mohave 549 3%Navajo 424 2%Apache 262 1%Cochise 244 1%Gila 98 <1%Santa Cruz 87 <1%Graham 56 <1%La Paz 31 <1%Greenlee 19 <1%Not Specified 120 1%Total 20,271 100%
(SQL - academic level, degree)
Note: Will not match residency numbers SOURCE: Official 21st Day Census– All Enrolled Students (based on U.S. Citizenship, First Known Home State and First Known Home County)
Arizona Students by County
ARIZONA COUNTY Headcount %
Student Characteristics C6Fact Book 2019-2020
11,707 12,236 12,679 12,439 12,259
1,523 1,426 1,660 1,628 1,539
2,137 2,207 2,369 2,305 2,205
2 0 1 5 2 0 1 6 2 0 1 7 2 0 1 8 2 0 1 9
TOP THREE ARIZONA COUNTIES FALL SEMESTER TREND
Maricopa Coconino Pima
549
1,539
424
262
861
3112,259
756
2,205 24487
56
9819
761

Fall 2019
Acoma Pueblo 4 Creek Indians - Poarch Band 1 Nome Eskimo Community 1 Sioux - Yankton Tribe of SD 2
Apache - Fort Sill 1 Creek Ntn - Muscogee / Muckleshoot 5 Odawa - Little Traverse Bay Bands 1 Sioux Flandreau Santee Tribe 1
Apache - Mescalero Tribe of NM 4 Crow Tribe of MT 2 Ohkay Owingeh (formerly Pueblo of San Juan) 1 St Paul Island 1
Apache - White Mountain of Fort Apache Res., AZ 25 Delaware Nation 3 Osage Tribe 5 Sun'aq Tribe of Kodiak 1
Apache Jicarilla Ntn NM 4 Fort Berthold - Three Affiliated Tribes 3 Ottawa & Chippewa - Grand Traverse Band 1 Swinomish Indians 1
Apache Tribe of Oklahoma 1 Fort Mojave Tribe 1 Pascua Yaqui Tribe 21 Taos Pueblo 1
Apache Tribe of the San Carlos Reservation, Arizona 18 Galena Village (aka Louden Village) 1 PEORIA - OK 1 Tohono O'Odham Nation 23
Apache Yavapai 2 Gila River Reservation 9 Pomo - Big Valley Band 1 Umatilla - Confederated Tribes 1
Arapahoe Tribe of the Wind River Res 2 Grand Ronde Community - Confederated Tribes 1 Potawatomi Citizen Nation of OK 3 Ute Mountain Tribe of CO, NM & UT 2
Assiniboine and Sioux Tribes, Fort Peck Res., MT 2 Havasupai 5 Pottawatomi - Match-e-be-nash-she-wish Band 1 White Mountain (Native Village of), AK 1
Blackfeet Tribe 12 Hopi Tribe 31 Qawalangin Tribe of UnAK 1 Winnebago Tribe 1
Cahuilla Indians (Agua Calienta Band) 1 Hualapai 4 Quechan Tribe 7 Wyandotte Nation 1
Cahuilla Mission - Morongo Band 3 Inupiat Community of the Arctic Slope 1 Round Valley Indian Tribes 2 Yakama - Confederated Tribes & Bands, WA 1
Central Council of the Tlingit & Haida Indian Tribe 1 Iowa Tribe of Kansas and Nebraska 2 Salish & Kootenai of Flathead Res 2 Yavapai - Prescott Tribe of AZ 1
Chemehuevi Tribe 4 Jemez (Pueblo of) NM 1 Salt River Pima Maricopa Indian Community 9 Yavapai Nation - Fort McDowell, AZ 1
Cherokee - Eastern Band of NC 10 Kalispel Indian Community 1 Samish Indian Tribe 1 Ysleta Del Sur Pueblo 1
Cherokee - United Keetowah Band OK 2 Ketchikan Indian Corporation 3 San Felipe Pueblo 2 Zuni 9
Cherokee Nation, OK 53 Keweenaw Bay Indian Community 1 Santa Domingo Pueblo 3 Unknown 599
Chickawaw OK 17 Kickapoo Traditional Tribe - TX 1 Seminole Nation OK 1
Chippewa - Lake Superior Tribe of Bad River Res. 1 Kiowa Tribes 1 Seminole Tribe FL 1 Total 1605
Chippewa - Turtle Mountain Band 2 Klamath Tribes 1 Seneca-Cayuga Tribe 2 Official Census Count 878
Chippewa MN - 6 Component Reservations 2 Kumeyaay - Ewiiaapaayp Band 2 Serrano Mission Indians - San Manual Band 1 Unique Tribal Count 113
Chippewa Sault Ste. Marie 3 Laguna Pueblo 11 Shawnee - Absentee Tribe of OK 1
Chippewa-Cree of Rocky Boy's Reservation 2 Luiseno Mission - Pechanga Band 1 Shawnee - Eastern Tribe, OK 1
Choctaw Tribe of Oklahoma 22 Lummi Tribe 1 Shoshone - Wind River Res., WY 1
Choctaw Tribes of MS 6 Makah Tribe 1 Sioux - Shakopee Mdewakanton Community 1 Navajo Tribe 34%
Chukchansi - Picayune Rancheria 1 Me-Wuk - Tuolumne Band 3 Sioux - Cheyenne River Tribe, SD 1 Cherokee Nation, OK 3%
Colorado River Indian 4 Miccosukee Tribe 1 Sioux - Lower Brule Tribe 1 Hopi Tribe 2%
Colville Confederated Tribes 1 Micmac - Aroostook Band 1 Sioux - Lower Indian Community 1 Apache - White Mountain of Fort Apache Res., AZ 2%
Comanche Tribes 5 Mohawk - Saint Regis Tribe 2 Sioux - Oglala Tribe of Pine Ridge Res. SD 4 Tohono O'Odham Nation 1%
Coushatta Tribe of Louisiana 1 Mono Indians - Big Sandy Rancheria 1 Sioux - Rosebud Tribe of SD 4
Cowlitz Tribe 2 Navajo Tribe 552 Sioux - Standing Rock 2
Student Characteristics C7Fact Book 2019-2020
TRIBE Headcount
TOP FIVE TRIBAL AFFILIATIONS
Native American Students
TRIBE Headcount Headcount TRIBE TRIBE Headcount
*Data are based on any student who has self identified with a racial background of American Indian/Alaskan Native and/or a tribal affiliation. Total headcount numbers are duplicated because students can now indicate more than one ethnicity/race per federal regulations. In addition, students can also indicate more than one tribal affiliation.
SOURCE: Official 21st Day Census– All Enrolled Students (based on IPEDS Ethnicity and Tribal Affiliation)

Fall 2019
Afghanistan 1 Georgia 1 Pakistan 3 China 47%Algeria 1 Germany 31 Palestinian Territory, Occupie 3 Kuwait 9%Argentina 2 Ghana 27 Peru 5 Saudi Arabia 8%Australia 12 Hong Kong 4 Poland 2 United Kingdom 4%Austria 2 India 31 Qatar 6 Germany 2%Bahrain 2 Indonesia 1 Romania 2 India 2%Bangladesh 4 Iran (Islamic Republic Of) 18 Russian Federation 5 Ghana 2%Belarus 1 Italy 2 Saudi Arabia 99 Netherlands 2%Belgium 1 Japan 14 Singapore 1 Korea, Republic o 2%Belize 1 Jordan 1 South Africa 1 Spain 1%Brazil 8 Kenya 1 Spain 19 Vietnam 1%Bulgaria 2 Korea, Republic of 21 Sri Lanka 15Canada 8 Kuwait 114 Sweden 7Chile 1 Latvia 1 Switzerland 1China 602 Lebanon 2 Taiwan, Province of China 1Colombia 5 Malawi 6 Tanzania, United Republic of 1Cote D'Ivoire 1 Malaysia 3 Trinidad and Tobago 1Cyprus 2 Mexico 8 Turkey 2Czech Republic 3 Morocco 2 Ukraine 1Denmark 4 Myanmar 1 United Arab Emirates 1Ecuador 13 Nepal 13 United Kingdom 46Egypt 1 Netherlands 26 Uzbekistan 1El Salvador 1 New Zealand 4 Venezuela, Bolivarian Republic 1Ethiopia 1 Nicaragua 1 Viet Nam 19Fiji 1 Nigeria 6 Zambia 1France 15 Norway 2
Total 1,280Country Count 77
SOURCE: Official 21st Day Census– All Enrolled Students (based on Country of Citizenship)
Fact Book 2019-2020
International Students by Country
COUNTRY Headcount COUNTRY Headcount COUNTRY Headcount TOP FOREIGN COUNTRIES
Student Characteristics C8

Fiscal Year 2019
Male Female Total Male Female Total Male Female Total American Indian/Alaska Native 28 73 101 10 30 40 1 1 2Asian 47 93 140 8 14 22 1 3 4Black/African American 70 108 178 19 36 55 2 2 4Hispanic/Latino 489 1,010 1,499 50 160 210 3 19 22Native Hawaiian/Other Pac Islander 1 6 7 0 3 3 0 0 0Non-resident Alien (International) 137 25 162 21 22 43 2 2 4Not Specified 87 71 158 12 19 31 3 3 6Two or More Races 117 210 327 10 31 41 2 8 10White 1,312 2,239 3,551 223 580 803 48 94 142Total 2,288 3,835 6,123 353 895 1,248 62 132 194
Male Female Total Male Female Total Male Female Total American Indian/Alaska Native 10 2 12 2 1 3 51 107 158Asian 6 6 12 1 2 3 63 118 181Black/African American 1 8 9 1 4 5 93 158 251Hispanic/Latino 34 93 127 4 20 24 580 1,302 1,882Native Hawaiian/Other Pac Islander 0 0 0 0 0 0 1 9 10Non-resident Alien (International) 5 1 6 1 2 3 166 52 218Not Specified 3 5 8 1 1 2 106 99 205Two or More Races 15 21 36 1 3 4 145 273 418White 128 208 336 18 67 85 1,729 3,188 4,917Total 202 344 546 29 100 129 2,934 5,306 8,240
(SQL - academic level, degree)
Effective 2017-2018 edition Fact Book, changed source of degrees awarded from dynamic data to IPEDS Completions SOURCE: NAU Office of Institutional Research and Analysis
GRADUATE CERTIFICATES AWARDS TOTALSIPEDS ETHNICITY/RACE UNDERGRADUATE CERTIFICATES
Fact Book 2019-2020 Student Characteristics C9
Degrees Awarded by IPEDS Ethnicity/Race and Gender
IPEDS ETHNICITY/RACE BACHELORS MASTERS DOCTORATES

Fiscal Year 2019Undergraduate Graduate
Certificates Bachelors Certificates Masters Doctorates TotalCollege of Arts & Letters 59 433 12 103 2 609 College of Education 53 493 86 605 44 1,281 College of Engineering, Informatics, and Applied Sciences 1 509 - 36 - 546 College of Health & Human Services 81 946 7 186 126 1,346 College of Social & Behavioral Sciences 5 1,250 16 83 3 1,357 College of the Environment, Forestry, and Natural Sciences 81 811 3 97 19 1,011 Online, Statewide, and Education Innovation 34 469 1 98 - 602 Provost Office 1 377 - 3 - 381 The W.A. Franke College of Business 231 835 4 37 - 1,107 Total 546 6,123 129 1,248 194 8,240
NOTE: Multiple degrees included in countsEffective 2017-2018 edition Fact Book, changed source of degrees awarded from dynamic data to IPEDS Completions SOURCE: NAU Office of Institutional Research and Analysis
Degrees Awarded by College
COLLEGE
Fact Book 2019-2020 Student Characteristics C10
59 53 1
81 5
81 34 1
231
433 493 509
946
1,250
811
469 377
835
12 86
- 7 16 3 1 - 4 103
605
36
186 83 97 98
3 37 2 44 -
126
3 19 - - -
College of Arts &Letters
College of Education College ofEngineering,
Informatics, andApplied Sciences
College of Health &Human Services
College of Social &Behavioral Sciences
College of theEnvironment,
Forestry, and NaturalSciences
Online, Statewide,and Education
Innovation
Provost Office The W.A. FrankeCollege of Business
Awards By College Fiscal Year 2019
Undergraduate Certificates Bachelors Graduate Certificates Masters Doctorates

Fall 2015 Fall 2016 Fall 2017 Fall 2018 Fall 2019GPA GPA GPA GPA GPA
High School Concurrent 4.00 4.00 4.00 4.00 4.00Freshman 2.84 2.81 2.80 2.89 2.87Sophomore 3.05 3.06 3.08 3.09 3.14Junior 3.13 3.11 3.14 3.18 3.19Senior 3.21 3.21 3.22 3.25 3.27Non-degree Undergraduate 3.13 3.25 3.32 3.41 3.23Post Baccalaureate 3.61 3.64 3.65 3.62 3.62Undergraduate Average 3.13 3.12 3.14 3.17 3.19
Fall 2015 Fall 2016 Fall 2017 Fall 2018 Fall 2019GPA GPA GPA GPA GPA
Graduate 3.75 3.76 3.77 3.77 3.77Non-degree Graduate 3.80 3.80 3.64 3.69 3.65Graduate Average 3.75 3.76 3.77 3.77 3.77
SOURCE: NAU Office of Institutional Research and Analysis
ACADEMIC LEVEL
ACADEMIC LEVEL
Cumulative GPA by Academic Level
Student Characteristics C11Fact Book 2019-2020

Fall 2019
Female 16,303 61% American Indian/Alaska Native 697 3% Full-time 21,731 82%Male 10,210 39% Asian 567 2% Part-time 4,782 18%Total 26,513 100% Black/African American 837 3% Total 26,513 100%
Hispanic/Latino 6,625 25%Native Hawaiian/Other Pacific Islander 76 <1%Non-resident Alien (International) 1,079 4%
Under 21 14,346 54% Not Specified 738 3% Resident 17,258 65%21-29 9,371 35% Two or More Races 1,498 6% Non-resident 9,255 35%30-60 2,752 10% White 14,396 54% Total 26,513 100%Over 60 44 <1% Total 26,513 100%Total 26,513 100%
High School Concurrent 3 <1% College of Arts & Letters 1,934 7%Freshmen 6,855 26% College of Education 1,563 6%Sophomores 5,105 19% College of Engineering, Informatics, and Applied Sciences 2,660 10%Juniors 6,254 24% College of Health & Human Services 3,903 15%Seniors 7,535 28% College of Social & Behavioral Sciences 5,891 22%Post Baccalaureate 386 1% College of the Environment, Forestry, and Natural Sciences 4,412 17%Non-degree Undergraduate 375 1% Online, Statewide, and Education Innovation 1,266 5%Total 26,513 100% Provost Office 1,535 6%
The W.A. Franke College of Business 3,349 13%Total 26,513 100%
(SQL - academic level, degree)
Due to rounding, percentages may not equal 100.SOURCE: NAU Office of Institutional Research and Analysis
Student Characteristics C12Fact Book 2019-2020
Undergraduate Profile
STUDENT CHARACTERISTICS
Gender Headcount % IPEDS Ethnicity/Race Headcount % Full-time/Part-time Headcount %
%
%
STUDENT ENROLLMENT
By Academic Level Headcount % By College Headcount
Age Headcount % Residency Headcount

Fall 2019
Female 2,896 69% American Indian/Alaska Native 181 4% Full-time 2,172 51%Male 1,327 31% Asian 102 2% Part-time 2,051 49%Total 4,223 100% Black/African American 182 4% Total 4,223 100%
Hispanic/Latino 770 18%Native Hawaiian/Other Pac Islander 10 <1%Non-resident Alien (International) 201 5%
Under 21 7 <1% Not Specified 69 2% Resident 2,857 68%21-29 2,082 49% Two or More Races 162 4% Non-resident 1,366 32%30-60 2,086 49% White 2,546 60% Total 4,223 100%Over 60 48 1% Total 4,223 100%Total 4,223 100%
Masters* 3,212 76% College of Arts & Letters 270 6%Doctorates 958 23% College of Education 1,733 41%Non-degree Graduate 53 1% College of Engineering, Informatics, and Applied Sciences 154 4%Total 4,223 100% College of Health & Human Services 935 22%
College of Social & Behavioral Sciences 390 9%College of the Environment, Forestry, and Natural Sciences 389 9%Graduate College 52 1%Online, Statewide, and Education Innovation 256 6%Provost Office 2 <1%The W.A. Franke College of Business 42 1%Total 4,223 100%
*Includes Master’s Certificate students and Master's Preparation studentsDue to rounding, percentages may not equal 100.SOURCE: NAU Office of Institutional Research and Analysis
%
STUDENT ENROLLMENT
By Academic Level Headcount %
Headcount
By College Headcount %
Student Characteristics C13Fact Book 2019-2020
Graduate Profile
STUDENT CHARACTERISTICS
Gender Headcount
Age Headcount %
% IPEDS Ethnicity/Race Headcount % Full-time/Part-time Headcount %
Residency

Fall 2019
College of Arts & Letters 1,934 270 2,204
College of Education 1,563 1,733 3,296
College of Engineering, Informatics, and Applied Sciences 2,660 154 2,814
College of Health & Human Services 3,903 935 4,838
College of Social & Behavioral Sciences 5,891 390 6,281
College of the Environment, Forestry, and Natural Sciences 4,412 389 4,801
Graduate College 52 52
Online, Statewide, and Education Innovation 1,266 256 1,522
Provost Office 1,535 2 1,537
The W.A. Franke College of Business 3,349 42 3,391
Total 26,513 4,223 30,736
College of Arts & Letters 3,531 224 3,755
College of Education 1,380 1,190 2,570
College of Engineering, Informatics, and Applied Sciences 1,803 146 1,949
College of Health & Human Services 2,212 1,197 3,408
College of Social & Behavioral Sciences 6,169 347 6,516
College of the Environment, Forestry, and Natural Sciences 5,248 359 5,607
Online, Statewide, and Education Innovation 1,116 131 1,247
Provost Office 1,437 1 1,438
The W.A. Franke College of Business 2,629 57 2,686
Total 25,525 3,650 29,175
FTE for Online (Web) Classes are Redistributed by Student Campus. Totals may be off due to rounding.SOURCE: NAU Office of Institutional Research and Analysis
Enrollment D1
Enrollment and Full-Time Equivalent (FTE) by College
FULL-TIME EQUIVALENT (FTE)BY COLLEGE Undergraduate Graduate Total
HEADCOUNTBY COLLEGE Undergraduate Graduate Total
Fact Book 2019-2020
3,755
2,570
1,949
3,408
6,516
5,607
1,247
1,438
2,686
College of Arts & Letters
College of Education
College of Engineering, Informatics, andApplied Sciences
College of Health & Human Services
College of Social & Behavioral Sciences
College of the Environment, Forestry, andNatural Sciences
Online, Statewide, and EducationInnovation
Provost Office
The W.A. Franke College of Business
FTE by College Fall 2019
Undergraduate Graduate

Fall 2019
College of Arts & Letters 36,574 13,109 49,683 2,239 51,922
College of Education 2,343 14,687 17,030 11,899 28,929
College of Engineering, Informatics, and Applied Sciences 15,682 9,089 24,771 1,458 26,229
College of Health & Human Services 9,256 19,136 28,392 11,965 40,357
College of Social & Behavioral Sciences 58,819 26,972 85,791 3,468 89,259
College of the Environment, Forestry, and Natural Sciences 61,699 13,622 75,321 3,586 78,907
Online, Statewide, and Education Innovation 3,633 10,485 14,117 1,311 15,428
Provost Office 9,758 9,439 19,197 9 19,206
The W.A. Franke College of Business 15,261 19,339 34,600 566 35,166
Total 213,024 135,878 348,902 36,501 385,403
Totals may be off due to rounding.STUDENT CREDIT HOURS (SCH) SOURCE: Arizona Board of Regents Official Student Credit Hours, NAU Office of Institutional Research and Analysis
Fact Book 2019-2020 Enrollment D2
Total
Student Credit Hours (SCH) by College
STUDENT CREDIT HOURS (SCH) BY COLLEGE Lower Division
Upper Division Undergraduate Graduate
51,922
28,929 26,229
40,357
89,259
78,907
15,428 19,206
35,166
College of Arts & Letters College of Education College of Engineering,Informatics, and Applied
Sciences
College of Health &Human Services
College of Social &Behavioral Sciences
College of theEnvironment, Forestry,and Natural Sciences
Online, Statewide, andEducation Innovation
Provost Office The W.A. Franke Collegeof Business
Student Credit Hours (SCH) by CollegeFall 2019

HEADCOUNT BY CAREER
Fall Semester Undergraduates Graduates Total2019 26,513 4,223 30,736
2018 27,078 3,995 31,073
2017 27,086 3,971 31,057
2016 26,506 3,862 30,368
2015 25,120 3,911 29,031
2014 23,845 3,870 27,715
2013 22,670 3,936 26,606
2012 21,774 4,228 26,002
2011 20,750 4,614 25,364
2010 20,194 5,010 25,204
Fall Semester Lower Division
Upper Division Graduate Total
2019 213,024 135,878 36,501 385,403
2018 219,076 136,897 33,704 389,677
2017 222,996 136,297 32,991 392,283
2016 215,100 135,267 30,979 381,346
2015 203,713 128,302 31,017 363,032
2014 195,172 119,157 29,926 344,255
2013 185,315 114,586 29,124 329,025
2012 174,918 113,429 30,947 319,294
2011 163,329 105,689 32,675 301,693 2010 160,834 101,820 35,382 298,036
Totals may be off due to rounding.HEADCOUNT SOURCE: All Enrolled Student Headcount, NAU Office of Institutional Research and AnalysisSTUDENT CREDIT HOURS (SCH) SOURCE: Arizona Board of Regents Official Student Credit Hours, NAU Office of Institutional Research and Analysis
Fall Semester Enrollment and SCH Trend
Fact Book 2019-2020 Enrollment D3
STUDENT CREDIT HOURS (SCH) BY CAREER
30,736 31,073 31,057 30,368 29,031 27,715 26,606 26,002 25,364 25,204
2019201820172016201520142013201220112010
Headcount TrendFall Semester
Undergraduates Graduates
385,403 389,677 392,283 381,346 363,032
344,255 329,025 319,294 301,693 298,036
2019201820172016201520142013201220112010
SCH TrendFall Semester
LowerDivision
UpperDivision
Graduate

Fall 2019
Men Women Total
College of Arts & Letters 615 1,319 1,934
College of Education 141 1,422 1,563
College of Engineering, Informatics, and Applied Sciences 2,133 527 2,660
College of Health & Human Services 645 3,258 3,903
College of Social & Behavioral Sciences 1,955 3,936 5,891
College of the Environment, Forestry, and Natural Sciences 1,521 2,891 4,412
Online, Statewide, and Education Innovation 561 705 1,266
Provost Office 768 767 1,535
The W.A. Franke College of Business 1,871 1,478 3,349
Total 10,210 16,303 26,513
Men Women Total
College of Arts & Letters 90 180 270
College of Education 421 1,312 1,733
College of Engineering, Informatics, and Applied Sciences 118 36 154
College of Health & Human Services 218 717 935
College of Social & Behavioral Sciences 133 257 390
College of the Environment, Forestry, and Natural Sciences 172 217 389
Graduate College 13 39 52
Online, Statewide, and Education Innovation 141 115 256
Provost Office - 2 2
The W.A. Franke College of Business 21 21 42
Total 1,327 2,896 4,223
SOURCE: NAU Office of Institutional Research and Analysis
Enrollment by College and Gender
Undergraduate By College
Graduate by College
Fact Book 2019-2020 Enrollment D4
1,934
1,563
2,660
3,903
5,891
4,412
1,266
1,535
3,349
College of Arts & Letters
College of Education
College of Engineering, Informatics, and AppliedSciences
College of Health & Human Services
College of Social & Behavioral Sciences
College of the Environment, Forestry, and NaturalSciences
Online, Statewide, and Education Innovation
Provost Office
The W.A. Franke College of Business
Undergraduate Headcount Fall 2019
Men Women
270
1,733
154
935
390
389
52
256
2
42
College of Arts & Letters
College of Education
College of Engineering, Informatics, and AppliedSciences
College of Health & Human Services
College of Social & Behavioral Sciences
College of the Environment, Forestry, and NaturalSciences
Graduate College
Online, Statewide, and Education Innovation
Provost Office
The W.A. Franke College of Business
Graduate Headcount Fall 2019
Men Women

Fall 2019
College of Arts & Letters 31 34 35 447 3 270 28 117 1,239 2,204 College of Education 166 58 154 766 9 23 37 124 1,959 3,296 College of Engineering, Informatics, and Applied Sciences 85 65 56 529 11 428 63 162 1,415 2,814 College of Health & Human Services 159 176 151 1,287 17 16 139 233 2,660 4,838 College of Social & Behavioral Sciences 164 100 251 1,622 17 163 85 408 3,471 6,281 College of the Environment, Forestry, and Natural Sciences 130 114 112 1,167 9 96 49 298 2,826 4,801 Graduate College 7 2 1 7 - - 2 4 29 52 Online, Statewide, and Education Innovation 31 23 117 430 3 - 32 54 832 1,522 Provost Office 46 28 46 432 3 5 307 60 610 1,537 The W.A. Franke College of Business 59 69 96 708 14 279 65 200 1,901 3,391 Total 878 669 1,019 7,395 86 1,280 807 1,660 16,942 30,736
Undergraduate 697 567 837 6,625 76 1,079 738 1,498 14,396 26,513
Graduate 181 102 182 770 10 201 69 162 2,546 4,223
Total 878 669 1,019 7,395 86 1,280 807 1,660 16,942 30,736
SOURCE: NAU Office of Institutional Research and Analysis
Enrollment by College and IPEDS Ethnicity/Race
IPEDS ETHNICITY/RACE BY COLLEGEAmerican
Indian/Alaska Native
Asian Black/ African American
Hispanic/Latino
Native Hawaiian/Other Pacific
Islander
Non-resident Alien
(International)Not Specified Two or More
Races White Total
Fact Book 2019-2020 Enrollment D5
IPEDS ETHNICITY/RACE BY CAREERAmerican
Indian/Alaska Native
Asian Black/ African American
Hispanic/Latino
Two or More Races White Total
Native Hawaiian/Other Pacific
Islander
Non-resident Alien
(International)Not Specified
878 669 1,019
7,395
86 1,280 807
1,660
16,942
American Indian/Alaska Native
Asian Black/ African American Hispanic/Latino
Native Hawaiian/Other Pacific Islander
Non-resident Alien(International)
Not Specified Two or More Races White
IPEDS Ethnicity/Race Headcount by CareerFall 2019
Undergraduate Graduate

Fall 2019
College of Arts & Letters 29 30 30 400 3 242 21 103 1,076 1,934
College of Education 53 26 40 404 1 8 10 69 952 1,563
College of Engineering, Informatics, and Applied Sciences 83 65 56 521 11 345 60 155 1,364 2,660
College of Health & Human Services 138 126 129 1,122 16 13 123 184 2,052 3,903
College of Social & Behavioral Sciences 146 95 236 1,560 17 135 82 395 3,225 5,891
College of the Environment, Forestry, and Natural Sciences 119 109 108 1,122 9 58 44 292 2,551 4,412
Online, Statewide, and Education Innovation 25 20 96 363 2 - 26 44 690 1,266
Provost Office 46 28 46 430 3 5 307 60 610 1,535
The W.A. Franke College of Business 58 68 96 703 14 273 65 196 1,876 3,349
Total 697 567 837 6,625 76 1,079 738 1,498 14,396 26,513
College of Arts & Letters 2 4 5 47 - 28 7 14 163 270
College of Education 113 32 114 362 8 15 27 55 1,007 1,733
College of Engineering, Informatics, and Applied Sciences 2 - - 8 - 83 3 7 51 154
College of Health & Human Services 21 50 22 165 1 3 16 49 608 935
College of Social & Behavioral Sciences 18 5 15 62 - 28 3 13 246 390
College of the Environment, Forestry, and Natural Sciences 11 5 4 45 - 38 5 6 275 389
Graduate College 7 2 1 7 - - 2 4 29 52
Online, Statewide, and Education Innovation 6 3 21 67 1 - 6 10 142 256
Provost Office - - - 2 - - - - - 2
The W.A. Franke College of Business 1 1 - 5 - 6 - 4 25 42
Total 181 102 182 770 10 201 69 162 2,546 4,223
SOURCE: NAU Office of Institutional Research and Analysis
Enrollment by Student Career, College and IPEDS Ethnicity/Race
UNDERGRADUATE IPEDS ETHNICITY/RACE BY COLLEGE
American Indian/
Alaska NativeAsian Black/ African
AmericanHispanic/
Latino
Native Hawaiian/Other Pacific
Islander
Non-resident Alien
(International)Not Specified Two or More
Races White Total
Fact Book 2019-2020 Enrollment D6
Hispanic/Latino
Two or More Races White Total
Native Hawaiian/Other Pacific
Islander
Non-resident Alien
(International)Not SpecifiedGRADUATE
IPEDS ETHNICITY/RACE BY COLLEGE
American Indian/
Alaska NativeAsian Black/ African
American

Fall 2019
College of Arts & Letters - 561 437 393 530 6 7 1,934
College of Education - 251 263 427 620 2 - 1,563
College of Engineering, Informatics, and Applied Sciences - 749 556 527 815 13 - 2,660
College of Health & Human Services - 879 601 893 1,261 269 - 3,903
College of Social & Behavioral Sciences - 1,563 1,354 1,551 1,401 22 - 5,891
College of the Environment, Forestry, and Natural Sciences - 1,378 999 941 1,070 24 - 4,412
Online, Statewide, and Education Innovation - 90 134 440 582 20 - 1,266
Provost Office 3 309 75 307 457 15 369 1,535
The W.A. Franke College of Business - 1,075 686 775 799 14 - 3,349
Total 3 6,855 5,105 6,254 7,535 385 376 26,513
College of Arts & Letters - 11 230 29 270
College of Education 1 108 1,367 257 1,733
College of Engineering, Informatics, and Applied Sciences - - 85 69 154
College of Health & Human Services - 7 492 436 935
College of Social & Behavioral Sciences - 40 310 40 390
College of the Environment, Forestry, and Natural Sciences - 3 259 127 389
Graduate College 51 1 - - 52
Online, Statewide, and Education Innovation - 10 246 - 256
Provost Office - - 2 - 2
The W.A. Franke College of Business - - 42 - 42
Total 52 180 3,033 958 4,223 * Includes Master's Certificate students and Master's Preparation students.SOURCE: NAU Office of Institutional Research and Analysis
GRADUATEBY COLLEGE Non-degree Master's
Certificates* Master's Doctoral
Fact Book 2019-2020 Enrollment D7
Enrollment by Student Career, College and Academic Level
UNDERGRADUATEBY COLLEGE
High School Concurrent Freshmen Sophomores Juniors Seniors Post
Baccalaureates Non-degree Total
Total

Summer 2019FULL-TIME EQUIVALENT (FTE)BY COLLEGE Total
College of Arts & Letters 262
College of Education 696
College of Engineering, Informatics, and Applied Sciences 189
College of Health & Human Services 1,272
College of Social & Behavioral Sciences 738
College of the Environment, Forestry, and Natural Sciences 265
Graduate College <1
Online, Statewide, and Education Innovation 147
Provost Office 229
The W.A. Franke College of Business 346
Total 4,143
STUDENT CREDIT HOURS (SCH)BY COLLEGE Total
College of Arts & Letters 3,461
College of Education 7,167
College of Engineering, Informatics, and Applied Sciences 2,467
College of Health & Human Services 13,979
College of Social & Behavioral Sciences 9,850
College of the Environment, Forestry, and Natural Sciences 3,636
Graduate College 1
Online, Statewide, and Education Innovation 1,710
Provost Office 3,083
The W.A. Franke College of Business 4,370 Total 49,724
Totals may be off due to rounding.STUDENT CREDIT HOURS (SCH) SOURCE: Arizona Board of Regents Official Student Credit Hours, NAU Office of Institutional Research and Analysis
Summer Session FTE and SCH
Fact Book 2019-2020 Enrollment D8
262
696
189
1,272
738
265
-
147
229
346
College of Arts & Letters
College of Education
College of Engineering, Informatics, and AppliedSciences
College of Health & Human Services
College of Social & Behavioral Sciences
College of the Environment, Forestry, and NaturalSciences
Graduate College
Online, Statewide, and Education Innovation
Provost Office
The W.A. Franke College of Business
FTE by College Summer Session 2019
3,461
7,167
2,467
13,979
9,850
3,636
1
1,710
3,083
4,370
College of Arts & Letters
College of Education
College of Engineering, Informatics, and AppliedSciences
College of Health & Human Services
College of Social & Behavioral Sciences
College of the Environment, Forestry, and NaturalSciences
Graduate College
Online, Statewide, and Education Innovation
Provost Office
The W.A. Franke College of Business
SCH By CollegeSummer Session 2019

FALL SEMESTER SPRING SEMESTER
2019 23,903 6,833 30,736 29,175 2020 22,140 5,858 27,998 26,932
2018 23,853 7,220 31,073 29,384 2019 22,355 6,147 28,502 27,205
2017 23,899 7,158 31,057 29,524 2018 22,051 6,332 28,383 27,053
2016 23,346 7,022 30,368 28,710 2017 21,873 6,410 28,283 26,512
2015 22,220 6,811 29,031 27,374 2016 20,996 6,110 27,106 25,695
2014 21,173 6,542 27,715 25,934 2015 19,854 5,736 25,590 24,153
2013 20,538 6,068 26,606 24,816 2014 19,035 5,372 24,407 23,078
2012 20,293 5,709 26,002 24,208 2013 18,777 5,262 24,039 22,568
2011 19,639 5,725 25,364 22,964 2012 18,299 5,472 23,771 21,855
2010 19,190 6,014 25,204 22,746 2011 17,720 5,689 23,409 21,297
2009 17,477 6,123 23,600 20,980 2010 16,515 5,906 22,421 20,068
2008 15,947 6,560 22,507 19,537 2009 15,090 6,323 21,413 18,695
2007 14,867 6,485 21,352 18,281 2008 13,877 6,347 20,224 17,372
2006 14,011 6,551 20,562 17,489 2007 12,880 6,215 19,095 16,300
2005 13,338 5,731 19,069 16,628 2006 12,363 5,739 18,102 15,819
2004 13,445 5,981 19,426 16,794 2005 12,467 5,958 18,425 15,987
2003 12,931 6,268 19,199 16,389 2004 12,252 6,046 18,298 15,821
2002 13,246 6,661 19,907 17,189 2003 12,290 6,425 18,715 16,289
2001 13,217 6,511 19,728 17,057 2002 12,250 6,553 18,803 16,224
2000 13,233 6,731 19,964 17,107 2001 12,277 6,395 18,672 16,214
1999 13,330 6,651 19,981 17,294 2000 12,488 6,365 18,853 16,382
1998 13,442 6,498 19,940 17,484 1999 12,455 6,219 18,674 16,396
1997 13,369 6,249 19,618 17,183 1998 12,655 5,730 18,385 16,396
1996 13,539 6,066 19,605 17,193 1997 12,603 5,814 18,417 16,208
1995 13,469 6,662 20,131 17,591 1996 11,978 7,103 19,081 16,663
SOURCE: NAU Office of Institutional Research and Analysis
Semester Enrollment and FTE Trends
Year Part-time Headcount FTE Full-time Part-time Headcount FTEFull-time Year
Fact Book 2019-2020 Enrollment D9

FALL SEMESTER SPRING SEMESTER
2019 30,736 2020 27,998 2018 31,073 2019 28,502 2017 31,057 2018 28,383 2016 30,368 2017 28,283 2015 29,031 2016 27,106 2014 27,715 2015 25,590 2013 26,606 2014 24,407 2012 26,002 2013 24,039 2011 25,364 2012 23,771 2010 25,204 2011 23,409
SOURCE: NAU Office of Institutional Research and Analysis
Enrollment D10
Semester Enrollment Trend
Year HeadcountYear Headcount
Fact Book 2019-2020
30,73631,07331,05730,36829,03127,71526,60626,00225,36425,204
27,998 28,502 28,383 28,283 27,106 25,590 24,407 24,039 23,771 23,409
2019/20202018/20192017/20182016/20172015/20162014/20152013/20142012/20132011/20122010/2011
Semester Enrollment TrendFALL SEMESTER Headcount SPRING SEMESTER Headcount

FALL SEMESTER SPRING SEMESTER
2019 20,744 2,047 22,791 23,698 2020 19,397 1,415 20,812 22,140 2018 20,933 2,207 23,140 24,034 2019 19,641 1,533 21,174 22,411 2017 20,884 1,856 22,740 23,818 2018 19,443 1,464 20,907 22,182 2016 20,254 1,880 22,134 23,130 2017 19,104 1,468 20,572 21,661 2015 19,138 1,969 21,107 21,826 2016 18,113 1,581 19,694 20,671 2014 18,259 1,875 20,134 20,892 2015 17,133 1,579 18,712 19,482 2013 17,579 1,741 19,320 20,052 2014 16,346 1,417 17,763 18,650 2012 16,927 1,414 18,341 19,036 2013 15,595 1,372 16,967 17,726 2011 16,275 1,486 17,761 17,828 2012 15,007 1,505 16,512 16,906 2010 15,976 1,553 17,529 17,586 2011 14,522 1,594 16,116 16,367
(SQL - academic level, degree)
FTE for Online (Web) Classes are Redistributed by Student Campus.Campus numbers include the Phoenix Biomedical CampusSOURCE: NAU Office of Institutional Research and Analysis
Flagstaff Mountain Campus Semester Enrollment and FTE Trend
Flagstaff Mountain Campus E1Fact Book 2019-2020
Full-time Part-time Headcount FTEHeadcount FTE YearYear Full-time Part-time
23,698 24,034 23,818 23,130 21,826 20,892 20,052 19,036 17,828 17,586 22,140 22,411 22,182 21,661 20,671 19,482 18,650 17,726 16,906 16,367
2019/20202018/20192017/20182016/20172015/20162014/20152013/20142012/20132011/20122010/2011
Flagstaff Mountain Campus FTE Trend
Fall Semester Spring Semster

FALL SEMESTER
2019 20,857 -2% 1,934 3% 22,791 -2%2018 21,254 1% 1,886 8% 23,140 2%2017 20,994 3% 1,746 -3% 22,740 3%2016 20,327 5% 1,807 2% 22,134 5%2015 19,335 4% 1,772 10% 21,107 5%2014 18,524 4% 1,610 6% 20,134 4%2013 17,808 6% 1,512 <1% 19,320 5%2012 16,831 4% 1,510 -1% 18,341 3%2011 16,238 2% 1,523 -5% 17,761 1%2010 15,931 11% 1,598 -4% 17,529 9%
(SQL - academic level, degree)
Campus numbers include the Phoenix Biomedical CampusSOURCE: NAU Office of Institutional Research and Analysis
Flagstaff Mountain Campus Enrollment by Student Career Trend
Year Undergraduate Students % Change Graduate
Students % Change Total Headcount % Change
Flagstaff Mountain Campus E2Fact Book 2019-2020
20,857 21,254 20,994 20,327 19,335 18,524 17,808
16,831 16,238 15,931
1,934 1,886 1,746 1,807 1,772 1,610 1,512 1,510 1,523 1,598
2019201820172016201520142013201220112010
Flagstaff Mountain Campus Headcount Trend by Career
Fall SemesterUndergraduate Students Graduate Students

FALL SEMESTER
Headcount % Headcount % Headcount % Headcount % Headcount %2019 628 3% 497 2% 600 3% 5,245 23% 63 <1%2018 604 3% 474 2% 651 3% 5,159 22% 46 <1%2017 592 3% 452 2% 629 3% 4,845 21% 56 <1%2016 581 3% 426 2% 602 3% 4,473 20% 58 <1%2015 612 3% 383 2% 596 3% 4,038 19% 54 <1%2014 581 3% 336 2% 567 3% 3,619 18% 47 <1%2013 630 3% 301 2% 537 3% 3,254 17% 60 <1%2012 677 4% 263 1% 530 3% 2,845 16% 49 <1%2011 754 4% 312 2% 562 3% 2,422 14% 69 <1%2010 873 5% 336 2% 550 3% 2,180 12% 92 1%
FALL SEMESTER
Headcount % Headcount % Headcount % Headcount %2019 1,273 6% 277 1% 1,384 6% 12,824 56% 22,791 2018 1,395 6% 257 1% 1,403 6% 13,151 57% 23,140 2017 1,334 6% 203 1% 1,394 6% 13,235 58% 22,740 2016 1,290 6% 187 1% 1,340 6% 13,177 60% 22,134 2015 1,237 6% 147 1% 1,224 6% 12,816 61% 21,107 2014 1,242 6% 123 1% 1,113 6% 12,506 62% 20,134 2013 1,076 6% 128 1% 989 5% 12,345 64% 19,320 2012 985 5% 126 1% 823 4% 12,043 66% 18,341 2011 906 5% 145 1% 601 3% 11,990 68% 17,761 2010 858 5% 179 1% 419 2% 12,042 69% 17,529
Due to rounding, percentages may not equal 100.Campus numbers include the Phoenix Biomedical CampusSOURCE: NAU Office of Institutional Research and Analysis
Flagstaff Mountain Campus Enrollment by IPEDS Ethnicity/Race Trend
Hispanic/Latino Native Hawaiian/Other Pacific Islander
Not Specified Two or More Races White
YearAmerican Indian/
Alaska Native Asian Black/African American
Fact Book 2019-2020
Total HeadcountYearNon-resident Alien
(International)
Flagstaff Mountain Campus E3

Fall 2019Lower Upper
Division DivisionCollege of Arts & Letters 36,083 12,057 48,140 1,618 49,758 College of Education 2,169 7,751 9,920 2,836 12,756 College of Engineering, Informatics, and Applied Sciences 15,383 9,089 24,472 1,383 25,855 College of Health & Human Services 8,035 9,317 17,352 10,565 27,917 College of Social & Behavioral Sciences 55,772 22,356 78,128 1,973 80,101 College of the Environment, Forestry, and Natural Sciences 61,046 13,530 74,576 3,346 77,922 Online, Statewide, and Education Innovation 948 1,206 2,154 9 2,163 Provost Office 8,836 921 9,757 - 9,757 The W.A. Franke College of Business 15,053 18,730 33,783 566 34,349 Total 203,325 94,957 298,282 22,296 320,578
SCH for Online (Web) Classes are Redistributed by Student Campus.Campus numbers include the Phoenix Biomedical CampusTotals may be off due to rounding.SOURCE: Official Student Credit Hours, NAU Office of Institutional Research & Analysis
Flagstaff Mountain Campus SCH by College
COLLEGE Undergraduate Graduate Total
Fact Book 2019-2020 Flagstaff Mountain Campus E4
49,758
12,756
25,855 27,917
80,101 77,922
2,163 9,757
34,349
College of Arts & Letters College of Education College of Engineering,Informatics, and Applied
Sciences
College of Health &Human Services
College of Social &Behavioral Sciences
College of theEnvironment, Forestry,and Natural Sciences
Online, Statewide, andEducation Innovation
Provost Office The W.A. Franke Collegeof Business
Flagstaff Mountain CampusStudent Credit Hours (SCH) by College
Fall 2019

FALL SEMESTER
2019Undergraduate 8,489 12,368 19,092 1,765 20,857 298,282 21,468 Graduate 717 1,217 1,652 282 1,934 22,296 2,230 Total 9,206 13,585 20,744 2,047 22,791 320,578 23,698
2018Undergraduate 8,790 12,464 19,356 1,898 21,254 304,393 21,887 Graduate 702 1,184 1,577 309 1,886 21,468 2,147 Total 9,492 13,648 20,933 2,207 23,140 325,861 24,034
2017Undergraduate 8,996 11,998 19,403 1,591 20,994 304,129 21,823 Graduate 629 1,117 1,481 265 1,746 19,956 1,996 Total 9,625 13,115 20,884 1,856 22,740 324,085 23,818
2016Undergraduate 8,909 11,418 18,828 1,499 20,327 294,807 21,179 Graduate 628 1,179 1,426 381 1,807 19,511 1,951 Total 9,537 12,597 20,254 1,880 22,134 314,318 23,130
2015Undergraduate 8,466 10,869 17,773 1,562 19,335 278,182 19,970 Graduate 657 1,115 1,365 407 1,772 18,560 1,856 Total 9,123 11,984 19,138 1,969 21,107 296,742 21,826
2014Undergraduate 8,403 10,121 16,965 1,559 18,524 266,848 19,144 Graduate 662 948 1,294 316 1,610 17,479 1,748 Total 9,065 11,069 18,259 1,875 20,134 284,327 20,892
2013Undergraduate 8,065 9,743 16,391 1,417 17,808 257,291 18,484 Graduate 626 886 1,188 324 1,512 15,683 1,568 Total 8,691 10,629 17,579 1,741 19,320 272,974 20,052
2012Undergraduate 7,668 9,163 15,770 1,061 16,831 243,340 17,505 Graduate 595 915 1,157 353 1,510 15,315 1,532 Total 8,263 10,078 16,927 1,414 18,341 258,655 19,036
2011Undergraduate 7,303 8,935 15,119 1,119 16,238 227,596 16,375 Graduate 615 908 1,156 367 1,523 14,535 1,454 Total 7,918 9,843 16,275 1,486 17,761 242,131 17,828
2010Undergraduate 7,131 8,800 14,786 1,145 15,931 223,449 16,058 Graduate 622 976 1,190 408 1,598 15,284 1,528 Total 7,753 9,776 15,976 1,553 17,529 238,733 17,586
Totals may be off due to rounding.Campus numbers include the Phoenix Biomedical CampusHEADCOUNT SOURCE: All Enrolled Student Headcount, NAU Office of Institutional Research and AnalysisSCH AND FTE SOURCE: Official Student Credit Hours, NAU Office of Institutional Research & Analysis
Fact Book 2019-2020 Flagstaff Mountain Campus E5
TOTAL SCH FTE
Flagstaff Mountain Campus Enrollment Trend
Year Male Female Full-time Part-time
ALL ENROLLED HEADCOUNT OFFICIAL SCH & FTE

Fall 2019
High School Concurrent 3 <1% College of Arts & Letters 1,972 9%Freshmen 6,580 29% College of Education 1,162 5%Sophomores 4,656 20% College of Engineering, Informatics, and Applied Sciences 2,814 12%Juniors 4,486 20% College of Health & Human Services 2,920 13%Seniors 4,937 22% College of Social & Behavioral Sciences 5,478 24%Post Baccalaureates 130 1% College of the Environment, Forestry, and Natural Sciences 4,746 21%Non-degree Undergraduates 65 <1% Graduate College 26 <1%Graduates 1,909 8% Provost Office 369 2%Non-degree Graduates 25 <1% The W.A. Franke College of Business 3,304 14%Total 22,791 100% Total 22,791 100%
Female 13,585 60% Full-time 20,744 91%Male 9,206 40% Part-time 2,047 9%Total 22,791 100% Total 22,791 100%
American Indian/Alaska Native 628 3% Resident 14,231 62%Asian 497 2% Non-resident 8,560 38%Black/African American 600 3% Total 22,791 100%Hispanic/Latino 5,245 23%Native Hawaiian/Other Pacific Islander 63 <1%Non-resident Alien (International) 1,273 6%Not Specified 277 1% Under 21 13,775 60%Two or More Races 1,384 6% 21-29 8,087 35%White 12,824 56% 30-59 897 4%Total 22,791 100% 60 or over 32 <1%
Total 22,791 100%Due to rounding, percentages may not equal 100.Campus numbers include the Phoenix Biomedical CampusSOURCE: NAU Office of Institutional Research and Analysis
Flagstaff Mountain Campus Student Profile
Headcount %
STUDENT CHARACTERISTICS
By College
STUDENT ENROLLMENT
By Academic Level Headcount %
%
Residency Headcount %
Gender Headcount %
IPEDS Ethnicity/Race Headcount %
Full-time/Part-time Headcount
Fact Book 2019-2020
Age Headcount %
Flagstaff Mountain Campus E6

FALL SEMESTER SPRING SEMESTER
2019 1,129 649 1,778 1,569 2020 1,027 539 1,566 1,319 2018 1,129 664 1,793 1,604 2019 1,026 650 1,676 1,374 2017 1,183 777 1,960 1,756 2018 1,105 684 1,789 1,451 2016 1,267 792 2,059 1,859 2017 1,115 785 1,900 1,601 2015 1,322 916 2,238 1,976 2016 1,221 780 2,001 1,688 2014 1,449 1,164 2,613 2,135 2015 1,257 889 2,146 1,828 2013 1,646 1,277 2,923 2,350 2014 1,443 1,044 2,487 2,034 2012 1,836 1,475 3,311 2,653 2013 1,725 1,320 3,045 2,409 2011 1,923 1,747 3,670 2,820 2012 1,890 1,474 3,364 2,649 2010 1,985 2,048 4,033 3,036 2011 1,904 1,847 3,751 2,826
(SQL - academic level, degree)
Statewide includes statewide sites except Yuma and Phoenix Biomedical.SOURCE: NAU Office of Institutional Research and Analysis
Fact Book 2019-2020 Statewide F1
Full-time Part-time Headcount FTEHeadcount FTE YearYear Full-time Part-time
Statewide Semester Enrollment and FTE Trend
1,569 1,604 1,756 1,859 1,976
2,135 2,350
2,653 2,820
3,036
1,319 1,374 1,451 1,601 1,688 1,828 2,034
2,409 2,649
2,826
2019/20202018/20192017/20182016/20172015/20162014/20152013/20142012/20132011/20122010/2011
StatewideFTE Trend
Fall Semester Spring Semester

FALL SEMESTER
2019 1,128 -9% 650 16% 1,778 -1%2018 1,234 -6% 559 -14% 1,793 -9%2017 1,313 -9% 647 4% 1,960 -5%2016 1,437 -7% 622 -10% 2,059 -8%2015 1,544 -11% 694 -21% 2,238 -14%2014 1,740 -8% 873 -15% 2,613 -11%2013 1,890 -8% 1,033 -18% 2,923 -12%2012 2,046 4% 1,265 -26% 3,311 -10%2011 1,964 <1% 1,706 -18% 3,670 -9%2010 1,965 5% 2,068 -12% 4,033 -5%
(SQL - academic level, degree)
Statewide includes statewide sites except Yuma and Phoenix Biomedical.SOURCE: NAU Office of Institutional Research and Analysis
Fact Book 2019-2020 Statewide F2
Total Headcount % Change
Statewide Enrollment by Student Career Trend
Year Undergraduate Students % Change Graduate
Students % Change
1,128 1,234 1,313
1,437 1,544
1,740 1,890
2,046
1,964
1,965
650 559 647 622 694
873 1,033
1,265
1,706 2,068
2019201820172016201520142013201220112010
StatewideHeadcount Trend by Career
Fall SemesterUndergraduate Students Graduate Students

FALL SEMESTER
Headcount % Headcount % Headcount % Headcount % Headcount %2019 61 3% 25 1% 93 5% 535 30% 4 <1%2018 65 4% 29 2% 73 4% 507 28% 5 <1%2017 63 3% 38 2% 61 3% 578 29% 5 <1%2016 37 2% 32 2% 81 4% 591 29% 5 <1%2015 44 2% 32 1% 95 4% 583 26% 2 <1%2014 72 3% 39 1% 114 4% 603 23% 3 <1%2013 79 3% 52 2% 128 4% 634 22% 7 <1%2012 130 4% 53 2% 146 4% 715 22% 10 <1%2011 174 5% 59 2% 147 4% 775 21% 9 <1%2010 201 5% 75 2% 149 4% 784 19% 8 <1%
FALL SEMESTER
Headcount % Headcount % Headcount % Headcount %2019 1 <1% 24 1% 67 4% 968 54% 1,778 2018 - 0% 35 2% 59 3% 1,020 57% 1,793 2017 1 <1% 31 2% 64 3% 1,119 57% 1,960 2016 - 0% 27 1% 59 3% 1,227 60% 2,059 2015 - 0% 17 1% 58 3% 1,407 63% 2,238 2014 1 <1% 31 1% 81 3% 1,669 64% 2,613 2013 1 <1% 34 1% 70 2% 1,918 66% 2,923 2012 - 0% 38 1% 91 3% 2,128 64% 3,311 2011 - 0% 55 1% 83 2% 2,368 65% 3,670 2010 2 <1% 69 2% 60 1% 2,685 67% 4,033
Due to rounding, percentages may not equal 100.Statewide includes statewide sites except Yuma and Phoenix Biomedical.SOURCE: NAU Office of Institutional Research and Analysis
White
Fact Book 2019-2020 Statewide F3
Total HeadcountYearNon-resident Alien
(International) Not Specified Two or More Races
Statewide Enrollment by IPEDS Ethnicity/Race Trend
YearAmerican Indian/
Alaska Native Asian Black/African American Hispanic/Latino Native Hawaiian/Other Pacific Islander

Fall 2019Lower Upper
Division DivisionCollege of Arts & Letters 52 386 438 - 438 College of Education 33 5,704 5,737 3,570 9,307 College of Engineering, Informatics, and Applied Sciences - - - 6 6 College of Health & Human Services 205 1,781 1,986 - 1,986 College of Social & Behavioral Sciences 316 436 752 6 758 College of the Environment, Forestry, and Natural Sciences 92 9 101 - 101 Online, Statewide, and Education Innovation 27 3,195 3,222 345 3,567 Provost Office 33 1,608 1,641 - 1,641 The W.A. Franke College of Business 55 342 397 - 397 Total 813 13,461 14,274 3,927 18,201
SCH for Online (Web) Classes are Redistributed by Student Campus.Campus numbers include the Phoenix Biomedical CampusTotals may be off due to rounding.SOURCE: Official Student Credit Hours, NAU Office of Institutional Research & Analysis
Statewide SCH by College
COLLEGE Undergraduate Graduate Total
Fact Book 2019-2020 Statewide F4
438
9,307
6
1,986
758 101
3,567
1,641
397
College of Arts &Letters
College of Education College of Engineering,Informatics, andApplied Sciences
College of Health &Human Services
College of Social &Behavioral Sciences
College of theEnvironment, Forestry,and Natural Sciences
Online, Statewide, andEducation Innovation
Provost Office The W.A. FrankeCollege of Business
StatewideStudent Credit Hours (SCH) by College
Fall 2019

FALL SEMESTER
2019Undergraduate 267 861 965 163 1,128 14,274 1,176 Graduate 202 448 164 486 650 3,927 393 Total 469 1,309 1,129 649 1,778 18,201 1,569
2018Undergraduate 319 915 1,006 228 1,234 15,485 1,272 Graduate 172 387 123 436 559 3,318 332 Total 491 1,302 1,129 664 1,793 18,803 1,604
2017Undergraduate 365 948 1,029 284 1,313 16,713 1,363 Graduate 215 432 154 493 647 3,934 393 Total 580 1,380 1,183 777 1,960 20,647 1,756
2016Undergraduate 389 1,048 1,117 320 1,437 18,244 1,485 Graduate 215 407 150 472 622 3,746 375 Total 604 1,455 1,267 792 2,059 21,990 1,859
2015Undergraduate 475 1,069 1,131 413 1,544 19,044 1,547Graduate 240 454 191 503 694 4,287 429Total 715 1,523 1,322 916 2,238 23,331 1,976
2014Undergraduate 572 1,168 1,241 499 1,740 19,777 1,603Graduate 301 572 208 665 873 5,319 532Total 873 1,740 1,449 1,164 2,613 25,096 2,135
2013Undergraduate 641 1,249 1,372 518 1,890 21,064 1,706Graduate 320 713 274 759 1,033 6,439 644Total 961 1,962 1,646 1,277 2,923 27,503 2,350
2012Undergraduate 724 1,322 1,462 584 2,046 22,679 1,835Graduate 368 897 374 891 1,265 8,181 818Total 1,092 2,219 1,836 1,475 3,311 30,860 2,653
2011Undergraduate 647 1,317 1,412 552 1,964 21,022 1,706Graduate 493 1,213 511 1,195 1,706 11,142 1,114Total 1,140 2,530 1,923 1,747 3,670 32,164 2,820
2010Undergraduate 618 1,347 1,391 574 1,965 20,959 1,705Graduate 539 1,529 594 1,474 2,068 13,313 1,331Total 1,157 2,876 1,985 2,048 4,033 34,272 3,036
Totals may be off due to rounding.Campus numbers include the Phoenix Biomedical CampusHEADCOUNT SOURCE: All Enrolled Student Headcount, NAU Office of Institutional Research and AnalysisSCH AND FTE SOURCE: Official Student Credit Hours, NAU Office of Institutional Research & Analysis
Fact Book 2019-2020 Statewide F5
OFFICIAL SCH & FTEALL ENROLLED HEADCOUNT
Statewide Enrollment Trend
Year Male Female Full-time Part-time TOTAL SCH FTE

Fall 2019
High School Concurrent - - College of Arts & Letters 44 2%Freshmen 17 1% College of Education 1,080 61%Sophomores 64 4% College of Health & Human Services 91 5%Juniors 391 22% College of Social & Behavioral Sciences 36 2%Seniors 641 36% College of the Environment, Forestry, & Natural Sciences 1 <1%Post Baccalaureates 13 1% Graduate College 6 <1%Non-degree Undergraduates 2 <1% Online, Statewide, and Education Innovation 358 20%Graduates 644 36% Provost Office 130 7%Non-degree Graduates 6 <1% The W.A. Franke College of Business 32 2%Total 1,778 100% Total 1,778 100%
Female 1,309 74% Full-time 1,129 63%Male 469 26% Part-time 649 37%Total 1,778 100% Total 1,778 100%
American Indian/Alaska Native 61 3% Resident 1,725 97%Asian 25 1% Non-resident 53 3%Black/African American 93 5% Total 1,778 100%Hispanic/Latino 535 30%Native Hawaiian/Other Pacific Islander 4 <1%Non-resident Alien (International) 1 <1%Not Specified 24 1% Under 21 78 4%Two or More Races 67 4% 21-29 810 46%White 968 54% 30-59 874 49%Total 1,778 100% 60 or over 16 1%
Total 1,778 100%Due to rounding, percentages may not equal 100.Statewide includes statewide sites except Yuma and Phoenix Biomedical.SOURCE: NAU Office of Institutional Research and Analysis
Fact Book 2019-2020 Statewide F6
Statewide Student Profile
STUDENT ENROLLMENT
By Academic Level Headcount % By College Headcount %
STUDENT CHARACTERISTICS
Gender Headcount %
IPEDS Ethnicity/Race Headcount % Residency Headcount
Age Headcount %
Headcount %
%
Full-time/Part-time

Fall 2019Online In-Person Total Online In-Person Total Online In-Person Total
MOUNTAIN 29,752 268,530 298,282 1,573 20,723 22,296 31,325 289,253 320,578Flagstaff Mountain Campus 29,752 268,530 298,282 1,489 13,972 15,461 31,241 282,502 313,743Phoenix Biomedical 0 0 0 84 6,751 6,835 84 6,751 6,835
ONLINE 30,511 0 30,511 9,938 0 9,938 40,449 0 40,449Online 24,016 0 24,016 9,504 0 9,504 33,520 0 33,520Personalized Learning 6,495 0 6,495 434 0 434 6,929 0 6,929
STATEWIDE CAMPUSES 4,404 9,870 14,274 1,401 2,526 3,927 5,805 12,396 18,201Rural
Central Arizona College 237 104 341 3 0 3 240 104 344Eastern Arizona College 168 16 184 0 0 0 168 16 184Mohave Cmty Coll 57 162 219 0 0 0 57 162 219NAU - Yavapai 140 231 371 3 30 33 143 261 404Navajo-Hopi 0 120 120 0 0 0 0 120 120Northland Pioneer College 59 226 285 0 0 0 59 226 285Yavapai College 45 174 219 0 0 0 45 174 219
UrbanChandler-Gilbert Cmty Coll 838 1,686 2,524 0 0 0 838 1,686 2,524Estrella Mountain Cmty Coll 297 486 783 33 0 33 330 486 816Glendale Cmty Coll 317 1,264 1,581 0 0 0 317 1,264 1,581Mesa Cmty Coll 152 1,027 1,179 3 0 3 155 1,027 1,182NAU - East Valley 45 0 45 753 658 1,411 798 658 1,456NAU - North Valley 228 1,072 1,300 446 1,389 1,835 674 2,461 3,135Paradise Valley Cmty Coll 510 564 1,074 0 0 0 510 564 1,074Phoenix College 150 684 834 0 0 0 150 684 834Pima Cmty Coll, Community 0 0 0 0 0 0 0 0 0Pima Cmty Coll, Desert Vista 0 0 0 0 0 0 0 0 0Pima Cmty Coll, Downtown 236 413 649 3 75 78 239 488 727Pima Cmty Coll, West 495 943 1,438 157 374 531 652 1,317 1,969Scottsdale Cmty Coll 343 338 681 0 0 0 343 338 681South Mountain Cmty Coll 87 360 447 0 0 0 87 360 447
YUMA 2,010 3,825 5,835 77 263 340 2,087 4,088 6,175ONLINE + CC + YUMA TOTAL 36,925 13,695 50,620 11,416 2,789 14,205 48,341 16,484 64,825GRAND TOTAL 66,677 282,225 348,902 12,989 23,512 36,501 79,666 305,737 385,403
Statewide includes statewide sites except Yuma and Phoenix Biomedical.HEADCOUNT SOURCE: All Enrolled Student Headcount, NAU Office of Institutional Research and AnalysisSTUDENT CREDIT HOURS (SCH) SOURCE: Arizona Board of Regents Official Student Credit Hours, NAU Office of Institutional Research and Analysis
Statewide F7Fact Book 2019-2020
Statewide Student Profile
UNDERGRADUATE GRADUATE TOTALSCH SCH SCH
27
195
21
78
127
78
16
298
345
36
0
21
86
68
0
0
69
183
72
40
18
0 50 100 150 200 250 300 350 400
Central Arizona College
Chandler-Gilbert Cmty Coll
Eastern Arizona College
Estrella Mountain Cmty Coll
Glendale Cmty Coll
Mesa Cmty Coll
Mohave Cmty Coll
NAU - East Valley
NAU - North Valley
NAU - Yavapai
Navajo-Hopi
Northland Pioneer College
Paradise Valley Cmty Coll
Phoenix College
Pima Cmty Coll, Community
Pima Cmty Coll, Desert Vista
Pima Cmty Coll, Downtown
Pima Cmty Coll, West
Scottsdale Cmty Coll
South Mountain Cmty Coll
Yavapai College
Fall 2019 Statewide Headcount
Undergraduate Graduate

FALL SEMESTER SPRING SEMESTER
2019 396 120 516 508 2020 364 118 482 4852018 357 143 500 479 2019 360 133 493 4802017 335 176 511 466 2018 317 157 474 4522016 336 195 531 480 2017 332 163 495 4592015 328 192 520 476 2016 335 166 501 4802014 319 210 529 447 2015 316 188 504 4492013 315 226 541 436 2014 294 188 482 4282012 328 263 591 460 2013 313 182 495 4442011 360 280 640 527 2012 327 286 613 5032010 352 334 686 572 2011 344 317 661 520
(SQL - academic level, degree)
SOURCE: NAU Office of Institutional Research and Analysis
Yuma G1
FTEYear Full-time Part-time Headcount FTE Year Full-time Part-time Headcount
Fact Book 2019-2020
Yuma Semester Enrollment and FTE Trend
508479466480476447436460527
520485480452459480
449428444503
572
2019/20202018/20192017/20182016/20172015/20162014/20152013/20142012/20132011/20122010/2011
Yuma FTE Trend
Fall Semester Spring Semester

FALL SEMESTER
2019 473 -2% 43 139% 516 3%2018 482 1% 18 -50% 500 -2%2017 475 <1% 36 -37% 511 -4%2016 474 7% 57 -28% 531 2%2015 441 1% 79 -16% 520 -2%2014 435 -3% 94 1% 529 -2%2013 448 -8% 93 -12% 541 -8%2012 485 -8% 106 -5% 591 -8%2011 529 <-1% 111 -28% 640 -7%2010 531 4% 155 -7% 686 1%
(SQL - academic level, degree)
SOURCE: NAU Office of Institutional Research and Analysis
Yuma Enrollment by Student Career Trend
Fact Book 2019-2020 Yuma G2
Total Headcount % ChangeYear Undergraduate
Students % Change Graduate Students % Change
473 482 475 474 441 435 448
485 529 531
43 18 36 57 79 94 93 106 111
155
2019201820172016201520142013201220112010
Yuma Headcount Trend by Career
Fall SemesterUndergraduate Students Graduate Students

FALL SEMESTER
Headcount % Headcount % Headcount % Headcount % Headcount %2019 8 2% 4 1% 7 1% 380 74% 3 1%2018 4 1% 2 <1% 6 1% 364 73% 2 <1%2017 1 <1% 1 <1% 9 2% 386 76% - 0%2016 3 1% 6 1% 9 2% 396 75% 1 <1%2015 2 <1% 8 2% 10 2% 370 71% 1 <1%2014 4 1% 5 1% 14 3% 359 68% - 0%2013 4 1% 4 1% 15 3% 365 67% - 0%2012 6 1% 4 1% 10 2% 402 68% - 0%2011 17 3% 4 1% 9 1% 438 68% 1 <1%2010 21 3% 6 1% 9 1% 448 65% 3 <1%
FALL SEMESTER
Headcount % Headcount % Headcount % Headcount %2019 3 1% 1 <1% 12 2% 98 19%2018 3 1% 5 1% 8 2% 106 21%2017 2 <1% 6 1% 6 1% 100 20%2016 1 <1% 4 1% 8 2% 103 19%2015 1 <1% 1 <1% 8 2% 119 23%2014 - 0% 1 <1% 6 1% 140 26%2013 - 0% 2 <1% 7 1% 144 27%2012 - 0% 2 <1% 14 2% 153 26%2011 1 <1% 4 1% 9 1% 157 25%2010 1 <1% 7 1% 7 1% 184 27%
Due to rounding, percentages may not equal 100.SOURCE: NAU Office of Institutional Research and Analysis
Yuma Enrollment by IPEDS Ethnicity/Race Trend
Hispanic/Latino Native Hawaiian/Other Pacific Islander
Non-resident Alien (International) Not Specified Two or More Races White
YearAmerican Indian/
Alaska Native Asian Black/African American
516
Fact Book 2019-2020 Yuma G3
Total Headcount
500
640686
511531520529541591
Year

Fall 2019Lower Upper
Division DivisionCollege of Arts & Letters 14 93 107 - 107 College of Education 33 377 410 331 741 College of Engineering, Informatics, and Applied Sciences - - - - - College of Health & Human Services 158 1,311 1,469 - 1,469 College of Social & Behavioral Sciences 306 372 678 - 678 College of the Environment, Forestry, and Natural Sciences 44 9 53 - 53 Online, Statewide, and Education Innovation 54 453 507 - 507 Provost Office 93 2,514 2,607 9 2,616 The W. A. Franke College of Business 4 - 4 - 4 Total 706 5,129 5,835 340 6,175
SCH for Online (Web) Classes are Redistributed by Student Campus.Campus numbers include the Phoenix Biomedical CampusTotals may be off due to rounding.SOURCE: Official Student Credit Hours, NAU Office of Institutional Research & Analysis
Yuma SCH by College
COLLEGE Undergraduate Graduate Total
Fact Book 2019-2020 Yuma G4
107
741
-
1,469
678
53
507
2,616
4
College of Arts &Letters
College of Education College ofEngineering,
Informatics, andApplied Sciences
College of Health &Human Services
College of Social &Behavioral Sciences
College of theEnvironment,Forestry, and
Natural Sciences
Online, Statewide,and Education
Innovation
Provost Office The W. A. FrankeCollege of Business
Yuma Student Credit Hours (SCH) by College
Fall 2019

FALL SEMESTER
2019Undergraduate 123 350 375 98 473 5,835 474 Graduate 10 33 21 22 43 340 34 Total 133 383 396 120 516 6,175 508
2018Undergraduate 121 361 350 132 482 5,665 462 Graduate 5 13 7 11 18 171 17 Total 126 374 357 143 500 5,836 479
2017Undergraduate 112 363 325 150 475 5,489 445 Graduate 12 24 10 26 36 205 21 Total 124 387 335 176 511 5,694 466
2016Undergraduate 126 348 313 161 474 5,389 438 Graduate 18 39 23 34 57 425 43 Total 144 387 336 195 531 5,814 480
2015Undergraduate 159 282 292 149 441 5,098 415 Graduate 21 58 36 43 79 613 61 Total 180 340 328 192 520 5,711 476
2014Undergraduate 156 279 269 166 435 4,756 383 Graduate 18 76 50 44 94 647 65 Total 174 355 319 210 529 5,403 447
2013Undergraduate 142 306 286 162 448 4,699 375 Graduate 25 68 29 64 93 612 61 Total 167 374 315 226 541 5,311 436
2012Undergraduate 138 347 301 184 485 5,032 403 Graduate 24 82 27 79 106 569 57 Total 162 429 328 263 591 5,601 460
2011Undergraduate 135 394 307 222 529 5,602 448 Graduate 28 83 53 58 111 786 79 Total 163 477 360 280 640 6,388 527
2010Undergraduate 136 395 291 240 531 5,655 458 Graduate 31 124 61 94 155 1,141 114 Total 167 519 352 334 686 6,796 572
Totals may be off due to rounding.Campus numbers include the Phoenix Biomedical CampusHEADCOUNT SOURCE: All Enrolled Student Headcount, NAU Office of Institutional Research and AnalysisSCH AND FTE SOURCE: Official Student Credit Hours, NAU Office of Institutional Research & Analysis
TOTAL SCH FTE
Yuma Enrollment Trend
Year Male Female Full-time Part-time
Fact Book 2019-2020 Yuma G5
ALL ENROLLED HEADCOUNT OFFICIAL SCH & FTE

Fall 2019
High School Concurrent - - College of Arts & Letters 9 2%Freshmen 7 1% College of Education 72 14%Sophomores 40 8% College of Health & Human Services 101 20%Juniors 181 35% College of Social & Behavioral Sciences 41 8%Seniors 235 46% College of the Environment, Forestry, and Natural Sciences 2 <1%Post Baccalaureates 9 2% Graduate College - - Non-degree Undergraduates 1 <1% Online, Statewide, and Education Innovation 45 9%Graduates 43 8% Provost Office 246 48%Non-degree Graduates - - Total 516 100%Total 516 100%
Female 383 74% Full-time 396 77%Male 133 26% Part-time 120 23%Total 516 100% Total 516 100%
American Indian/Alaska Native 8 2% Resident 442 86%Asian 4 1% Non-resident 74 14%Black/African American 7 1% Total 516 100%Hispanic/Latino 380 74%Native Hawaiian/Other Pacific Islander 3 1%Non-resident Alien (International) 3 1%Not Specified 1 <1% Under 21 49 9%Two or More Races 12 2% 21-29 333 65%White 98 19% 30-59 129 25%Total 516 100% 60 or over 5 1%
Total 516 100%Due to rounding, percentages may not equal 100.SOURCE: NAU Office of Institutional Research and Analysis
Yuma Student Profile
Headcount %
STUDENT CHARACTERISTICS
By College
STUDENT ENROLLMENT
By Academic Level Headcount %
%
Residency Headcount %
Gender Headcount %
IPEDS Ethnicity/Race Headcount %
Full-time/Part-time Headcount
Fact Book 2019-2020 Yuma G6
Age Headcount %

FALL SEMESTER SPRING SEMESTER
2019 1,634 4,017 5,651 3,400 2020 1,352 3,786 5,138 2,9882018 1,434 4,206 5,640 3,267 2019 1,328 3,831 5,159 2,9392017 1,497 4,349 5,846 3,483 2018 1,186 4,027 5,213 2,9672016 1,489 4,155 5,644 3,240 2017 1,322 3,994 5,316 2,7922015 1,432 3,734 5,166 3,097 2016 1,327 3,583 4,910 2,8562014 1,146 3,293 4,439 2,460 2015 1,148 3,080 4,228 2,3952013 998 2,824 3,822 1,978 2014 952 2,723 3,675 1,9672012 1,202 2,557 3,759 2,060 2013 1,144 2,388 3,532 1,9892011 1,081 2,212 3,293 1,789 2012 1,075 2,207 3,282 1,7972010 877 2,079 2,956 1,551 2011 950 1,931 2,881 1,585
(SQL - academic level, degree)
FTE for Online (Web) Classes are Redistributed by Student Campus.SOURCE: NAU Office of Institutional Research and Analysis
FTEYear Full-time Part-time Headcount FTE Year Full-time Part-time Headcount
Fact Book 2019-2020 Online H1
Online Semester Enrollment and FTE Trend
3,4003,2673,483
3,2403,097
2,460
1,9782,0601,789
1,585
2,9882,9392,9672,7922,856
2,3951,9671,989
1,7971,551
2019/20202018/20192017/20182016/20172015/20162014/20152013/20142012/20132011/20122010/2011
Online FTE Trend
Fall Semester Spring Semester

FALL SEMESTER
2019 4,055 -1% 1,596 4% 5,651 <1%2018 4,108 -5% 1,532 -1% 5,640 -4%2017 4,304 1% 1,542 12% 5,846 4%2016 4,268 12% 1,376 1% 5,644 9%2015 3,800 21% 1,366 6% 5,166 16%2014 3,146 25% 1,293 <-1% 4,439 16%2013 2,524 5% 1,298 -4% 3,822 2%2012 2,412 19% 1,347 6% 3,759 14%2011 2,019 14% 1,274 7% 3,293 11%2010 1,767 14% 1,189 7% 2,956 11%
(SQL - academic level, degree)
SOURCE: NAU Office of Institutional Research and Analysis
Fact Book 2019-2020 Online H2
Total Headcount % ChangeYear Undergraduate
Students % Change Graduate Students % Change
Online Enrollment by Student Career Trend
4,055 4,108 4,304 4,268 3,800
3,146
2,524 2,412 2,019
1,767
1,596 1,532 1,542 1,376 1,366 1,293 1,298 1,347 1,274 1,189
2019201820172016201520142013201220112010
Online Headcount Trend by Career
Fall SemesterUndergraduate Students Graduate Students

FALL SEMESTER
Headcount % Headcount % Headcount % Headcount % Headcount %2019 181 3% 143 3% 319 6% 1,235 22% 16 <1%2018 176 3% 124 2% 340 6% 1,206 21% 21 <1%2017 183 3% 121 2% 368 6% 1,293 22% 17 <1%2016 204 4% 118 2% 315 6% 1,175 21% 15 <1%2015 209 4% 103 2% 245 5% 1,032 20% 16 <1%2014 181 4% 88 2% 193 4% 788 18% 12 <1%2013 158 4% 74 2% 159 4% 646 17% 14 <1%2012 172 5% 66 2% 145 4% 613 16% 13 <1%2011 132 4% 58 2% 124 4% 504 15% 8 <1%2010 119 4% 51 2% 115 4% 431 15% 6 <1%
FALL SEMESTER
Headcount % Headcount % Headcount % Headcount %2019 3 <1% 505 9% 197 3% 3,052 54%2018 5 <1% 398 7% 195 3% 3,175 56%2017 3 <1% 137 2% 221 4% 3,503 60%2016 - 0% 124 2% 218 4% 3,475 62%2015 1 <1% 77 1% 180 3% 3,303 64%2014 3 <1% 63 1% 137 3% 2,974 67%2013 3 <1% 52 1% 100 3% 2,616 68%2012 4 <1% 52 1% 101 3% 2,593 69%2011 4 <1% 59 2% 71 2% 2,333 71%2010 5 <1% 65 2% 45 2% 2,119 72%
Due to rounding, percentages may not equal 100.SOURCE: NAU Office of Institutional Research and Analysis
5,651
Fact Book 2019-2020 Online H3
Total Headcount
5,640
3,2932,956
5,8465,6445,1664,4393,8223,759
Year
Online Enrollment by IPEDS Ethnicity/Race Trend
Hispanic/Latino Native Hawaiian/Other Pacific Islander
Non-resident Alien (International) Not Specified Two or More Races White
YearAmerican Indian/
Alaska Native Asian Black/African American

Fall 2019Lower Upper
Division DivisionCollege of Arts & Letters 425 573 998 621 1,619 College of Education 108 855 963 5,162 6,125 College of Engineering, Informatics, and Applied Sciences 299 - 299 69 368 College of Health & Human Services 858 6,727 7,585 1,400 8,985 College of Social & Behavioral Sciences 2,425 3,808 6,233 1,489 7,722 College of the Environment, Forestry, and Natural Sciences 517 74 591 240 831 Online, Statewide, and Education Innovation 2,604 5,631 8,235 957 9,192 Provost Office 796 4,396 5,192 - 5,192 The W.A. Franke College of Business 149 267 416 - 416 Total 8,181 22,331 30,512 9,938 40,450
SCH for Online (Web) Classes are Redistributed by Student Campus.Campus numbers include the Phoenix Biomedical CampusTotals may be off due to rounding.SOURCE: Official Student Credit Hours, NAU Office of Institutional Research & Analysis
Online SCH by College
COLLEGE Undergraduate Graduate Total
Fact Book 2019-2020 Online H4
1,619
6,125
368
8,985
7,722
831
9,192
5,192
416
College of Arts &Letters
College of Education College of Engineering,Informatics, andApplied Sciences
College of Health &Human Services
College of Social &Behavioral Sciences
College of theEnvironment, Forestry,and Natural Sciences
Online, Statewide, andEducation Innovation
Provost Office The W.A. FrankeCollege of Business
OnlineStudent Credit Hours (SCH) by College
Fall 2019

FALL SEMESTER
2019Undergraduate 1,331 2,724 1,299 2,756 4,055 30,511 2,406 Graduate 398 1,198 335 1,261 1,596 9,938 994 Total 1,729 3,922 1,634 4,017 5,651 40,449 3,400
2018Undergraduate 1,359 2,749 1,179 2,929 4,108 30,427 2,393 Graduate 346 1,186 255 1,277 1,532 8,747 875 Total 1,705 3,935 1,434 4,206 5,640 39,174 3,268
2017Undergraduate 1,373 2,931 1,233 3,071 4,304 32,961 2,594 Graduate 362 1,180 264 1,278 1,542 8,896 890 Total 1,735 4,111 1,497 4,349 5,846 41,857 3,483
2016Undergraduate 1,383 2,885 1,236 3,032 4,268 31,927 2,510 Graduate 348 1,028 253 1,123 1,376 7,297 730 Total 1,731 3,913 1,489 4,155 5,644 39,224 3,240
2015Undergraduate 1,232 2,568 1,161 2,639 3,800 29,691 2,341 Graduate 372 994 271 1,095 1,366 7,557 756 Total 1,604 3,562 1,432 3,734 5,166 37,248 3,097
2014Undergraduate 924 2,222 886 2,260 3,146 22,949 1,812 Graduate 357 936 260 1,033 1,293 6,481 648 Total 1,281 3,158 1,146 3,293 4,439 29,430 2,460
2013Undergraduate 648 1,876 720 1,804 2,524 16,848 1,339 Graduate 335 963 278 1,020 1,298 6,390 639 Total 983 2,839 998 2,824 3,822 23,238 1,978
2012Undergraduate 671 1,741 853 1,559 2,412 17,296 1,371 Graduate 346 1,001 349 998 1,347 6,882 688 Total 1,017 2,742 1,202 2,557 3,759 24,178 2,060
2011Undergraduate 606 1,413 772 1,247 2,019 14,798 1,167 Graduate 338 936 309 965 1,274 6,212 621 Total 944 2,349 1,081 2,212 3,293 21,010 1,789
2010Undergraduate 530 1,237 613 1,154 1,767 12,591 987 Graduate 299 890 264 925 1,189 5,644 564 Total 829 2,127 877 2,079 2,956 18,235 1,551
Totals may be off due to rounding.Campus numbers include the Phoenix Biomedical CampusHEADCOUNT SOURCE: All Enrolled Student Headcount, NAU Office of Institutional Research and AnalysisSCH AND FTE SOURCE: Official Student Credit Hours, NAU Office of Institutional Research & Analysis
Online Enrollment Trend
Year Male Female Full-time Part-time
ALL ENROLLED HEADCOUNT OFFICIAL SCH & FTE
Online H5Fact Book 2019-2020
TOTAL SCH FTE

Fall 2019
High School Concurrent - - College of Arts & Letters 179 3%Freshmen 251 4% College of Education 982 17%Sophomores 345 6% College of Engineering, Informatics, and Applied Sciences - - Juniors 1,196 21% College of Health & Human Services 1,726 31%Seniors 1,722 30% College of Social & Behavioral Sciences 726 13%Post Baccalaureates 234 4% College of the Environment, Forestry, and Natural Sciences 52 1%Non-degree Undergraduates 307 5% Graduate College 20 <1%Graduates 1,575 28% Online, Statewide, and Education Innovation 1,119 20%Non-degree Graduates 21 <1% Provost Office 792 14%Total 5,651 100% The W. A. Franke College of Business 55 1%
Total 5,651 100%
Female 3,922 69% Full-time 1,634 29%Male 1,729 31% Part-time 4,017 71%Total 5,651 100% Total 5,651 100%
American Indian/Alaska Native 181 3% Resident 3,717 66%Asian 143 3% Non-resident 1,934 34%Black/African American 319 6% Total 5,651 100%Hispanic/Latino 1,235 22%Native Hawaiian/Other Pacific Islander 16 <1%Non-resident Alien (International) 3 <1%Not Specified 505 9% Under 21 451 8%Two or More Races 197 3% 21-29 2,223 39%White 3,052 54% 30-59 2,920 52%Total 5,651 100% 60 or over 57 1%
Total 5,651 100%Due to rounding, percentages may not equal 100.SOURCE: NAU Office of Institutional Research and Analysis
Online H6Fact Book 2019-2020
Age Headcount %
IPEDS Ethnicity/Race Headcount %
Full-time/Part-time Headcount %
Residency Headcount %
Gender Headcount %
STUDENT ENROLLMENT
By Academic Level Headcount %
Online Student Profile
Headcount %
STUDENT CHARACTERISTICS
By College

State Appropriation $114,250,900 42%
Miscellaneous and Other Receipts $925,000 < 1%
Balance Forward $0 0%
Summer Sessions $2,200,000 1%
Tuition Revenue $153,029,500 57%
Total $270,405,400 100%
Instruction $132,337,711 49%
Organized Research $5,236,032 2%
Public Service $5,212,394 2%
Academic Support $32,061,726 12%
Student Services Administration $23,264,860 9%
Institutional Support $39,598,118 15%
Operation and Maintenance of Plant $32,694,559 12%
Total $270,405,400 100%
Due to rounding, percentages may not equal 100.SOURCE: University Budget Office, State Operating Budget
Fact Book 2019-2020 Finances I1
State Operating Budget Sources and Uses by Program
STATE FUNDS BUDGETED
PROGRAM Uses by Program FY 2020 %
%Sources FY 2020

2019/20 $114,250,900 4.7% 42.3% $3,9162018/19 $109,095,700 3.3% 40.4% $3,7132017/18 $105,612,800 2.2% 40.2% $3,5772016/17 $103,317,000 4.4% 41.2% $3,5992015/16 $99,007,600 -14.9% 40.5% $3,6172014/15 $116,371,200 5.5% 46.7% $4,4872013/14 $110,335,000 4.1% 47.8% $4,4462012/13 $105,942,400 4.0% 49.7% $4,3762011/12 $101,861,800 -23.5% 51.0% $4,4362010/11 $133,118,100 -0.5% 62.0% $5,8522009/10 $133,776,500 -17.2% 64.1% $6,3452008/09 $161,560,900 0.4% 75.4% $8,2692007/08 $160,868,800 18.3% 77.1% $8,8002006/07 $135,949,400 11.1% 76.1% $7,7732005/06 $122,336,800 4.2% 75.6% $7,3572004/05 $117,440,500 5.4% 76.7% $6,9932003/04 $111,437,300 0.4% 76.8% $6,8002002/03 $110,980,300 -0.9% 77.7% $6,4562001/02 $111,974,900 -0.4% 75.2% $6,5652000/01 $112,419,800 3.7% 81.9% $6,572
SOURCE: University Budget Office, State Operating Budget
Finances I2Fact Book 2019-2020
State General Fund Appropriations History
Year Initial General Fund Appropriation
% Change
Appropriation as % of Operating Budget
Appropriation per Fall FTE Student

2019/20* $270,405,400 0.1% $270,405,400 0.1% 29,175 $9,268 0.8%2018/19 $270,054,600 2.7% $270,054,600 2.7% 29,384 $9,191 3.2%2017/18 $263,043,900 5.0% $263,043,900 5.0% 29,524 $8,910 2.1%2016/17 $250,600,300 2.6% $250,600,300 2.6% 28,710 $8,729 -2.2%2015/16 $244,294,200 -2.0% $244,294,200 -2.0% 27,375 $8,924 -7.1%2014/15 $249,228,700 8.1% $249,228,700 8.1% 25,934 $9,610 3.4%2013/14 $230,616,100 8.1% $230,616,100 8.1% 24,816 $9,293 5.5%2012/13 $213,351,500 6.9% $213,331,900 3.6% 24,208 $8,812 -1.8%2011/12 $199,600,700 -7.0% $205,990,800 -4.0% 22,964 $8,970 -4.9%2010/11 $214,628,200 3.3% $214,628,200 3.9% 22,746 $9,436 -4.1%2009/10 $207,711,700 -3.0% $206,489,700 7.1% 20,980 $9,842 -0.3%2008/09 $214,181,400 2.6% $192,876,500 -7.0% 19,537 $9,872 -12.9%2007/08 $208,692,000 16.8% $207,288,300 16.7% 18,281 $11,339 11.6%2006/07 $178,656,200 10.4% $177,662,700 7.9% 17,489 $10,159 2.6%2005/06 $161,880,700 5.6% $164,641,700 7.7% 16,628 $9,901 8.8%2004/05 $153,301,900 5.6% $152,817,600 5.3% 16,794 $9,100 2.8%2003/04 $145,125,000 1.6% $145,120,100 6.3% 16,389 $8,855 11.5%2002/03 $142,880,400 -4.1% $136,539,300 -3.0% 17,189 $7,943 -3.8%2001/02 $148,986,300 5.3% $140,802,600 0.4% 17,057 $8,255 0.7%2000/01 $141,527,500 3.1% $140,296,000 4.0% 17,107 $8,201 5.1%
*Actual Expenditures are estimated for current yearSOURCE: University Budget Office, State Operating Budget
Fact Book 2019-2020
% Change
State Operating Budget History
Year Initial Operating Budget
% Change Actual Expenditures Enrollment
Fall FTE StudentExpenditure
per FTE%
Change
Finances I3

2019/20* $132,337,711 -1.6% $132,337,711 -1.4% 29,175 $4,536 -0.9%2018/19 $134,514,903 0.9% $134,193,923 0.9% 29,384 $4,578 1.3%2017/18 $133,360,085 2.3% $134,946,500 2.3% 29,524 $4,517 -0.6%2016/17 $130,401,139 6.8% $128,185,500 6.8% 28,710 $4,542 1.9%2015/16 $122,074,317 0.3% $122,888,300 0.3% 27,375 $4,459 -5.0%2014/15 $121,756,510 3.5% $127,658,200 3.1% 25,934 $4,695 -1.3%2013/14 $117,655,800 6.0% $118,056,700 5.5% 24,816 $4,757 3.0%2012/13 $111,045,754 0.4% $111,853,300 1.5% 24,208 $4,620 -3.7%2011/12 $110,588,914 -5.7% $110,166,500 -6.8% 22,964 $4,797 -7.7%2010/11 $117,286,952 4.4% $118,227,100 7.6% 22,746 $5,198 -0.8%2009/10 $112,295,533 -3.2% $109,912,500 4.5% 20,980 $5,239 -2.7%2008/09 $115,972,635 -0.9% $105,145,200 -6.8% 19,537 $5,382 -12.8%2007/08 $116,995,682 18.7% $112,788,100 14.5% 18,281 $6,170 9.6%2006/07 $98,542,000 9.3% $98,480,400 7.9% 17,489 $5,631 2.6%2005/06 $90,121,100 6.8% $91,237,400 9.2% 16,628 $5,487 10.2%2004/05 $84,356,500 6.5% $83,586,300 7.5% 16,794 $4,977 4.9%2003/04 $79,218,600 2.3% $77,756,700 4.2% 16,389 $4,744 9.3%2002/03 $77,405,600 2.6% $74,607,500 2.0% 17,189 $4,340 1.2%2001/02 $75,426,700 1.8% $73,135,500 -1.5% 17,057 $4,288 -1.2%2000/01 $74,093,900 1.3% $74,266,400 2.7% 17,107 $4,341 3.8%
*Actual Expenditures are estimated for current yearSOURCE: University Budget Office, State Operating Budget
Fact Book 2019-2020 Finances I4
Enrollment Fall FTE Students
Instructional Budget History
Year Original Instructional Budget
% Change
Actual Expenditures
% Change
Expenditure per FTE
% Change

Amount %
FTE Positions 2,169 2,317 2,317 2,503 2,467 186 8%Personal Services $155,354,000 $158,155,500 $160,266,919 $172,084,300 $177,051,790 $11,817,381 7%Employee Related Expenses $49,107,700 $50,140,500 $51,104,929 $57,506,400 $55,166,001 $6,401,471 13%Professional & Outside Services $14,753,400 $15,129,100 $13,529,306 $10,386,700 $10,770,388 -$3,142,606 -23%Travel $901,100 $868,500 $789,824 $763,600 $739,440 -$26,224 -3%Other Operating Expenditures $24,465,500 $33,194,400 $33,327,530 $40,919,200 $38,821,161 $7,591,670 23%Library Acquisitions/Equipment $2,942,800 $2,530,400 $7,964,692 $3,781,000 $16,785,220 -$4,183,692 -53%NAU Yuma $3,075,800 $3,025,500 $3,071,400 $3,071,400 $3,071,400 $0 <1%Transfer Out* $3,000,000 $3,000,000 $3,000,000 $0 $3,000,000 -$3,000,000 -100%Total $253,600,300 $266,043,900 $273,054,600 $288,512,600 $305,405,400 $15,458,000 6%
Amount %
Instruction $128,185,500 $134,946,500 $134,193,923 $152,175,300 $152,436,083 $17,981,377 13%Organized Research $5,228,700 $6,705,200 $9,054,524 $4,477,500 $7,736,032 -$4,577,024 -51%Public Service $4,411,500 $4,636,200 $5,755,213 $5,240,900 $5,712,394 -$514,313 -9%Academic Support $28,668,300 $28,510,000 $29,166,147 $30,896,200 $46,101,171 $1,730,053 6%Student Services Administration $22,465,100 $23,186,400 $23,243,972 $24,009,200 $23,055,643 $765,228 3%Institutional Support $61,565,400 $65,034,100 $68,569,421 $68,642,100 $67,292,677 $72,679 <1%NAU Yuma $3,075,800 $3,025,500 $3,071,400 $3,071,400 $3,071,400 $0 0%Total $253,600,300 $266,043,900 $273,054,600 $288,512,600 $305,405,400 $15,458,000 6%
* Reflects $3,000,000 appropriation transferred to TGENSOURCE: University Budget Office, State Budget Request
State Operating Budget Request Summary
FY 2019 Actual to FY 2020 Request
PROGRAM FY 2017 Actual
FY 2018Actual
FY 2019 Actual
FY 2020 Request
FY 2019 Actual to FY 2020 Request
FY 2021 Request
FY 2021 Request
EXPENDITURES FY 2017 Actual
FY 2018Actual
Fact Book 2019-2020 Finances I5
FY 2019 Actual
FY 2020 Request

Natural Gas 2019/20 4,176,451 /Therm** $1,588,106 $0.382018/19 4,313,746 $1,753,636 $0.412017/18 3,714,891 $1,967,117 $0.532016/17 3,760,550 $2,113,529 $0.542015/16 3,778,024 $2,045,906 $0.54 2014/15 3,449,335 $2,543,049 $0.74 2013/14 3,548,932 $2,775,864 $0.782012/13 3,868,485 $3,167,125 $0.822011/12 3,814,400 $2,960,502 $0.782010/11 3,712,709 $2,940,920 $0.79
Electricity 2019/20 67,707,198 /KWH $4,644,214 $0.072018/19 68,904,921 $4,759,700 $0.072017/18 66,427,336 $5,351,026 $0.082016/17 66,735,634 $5,685,398 $0.092015/16 66,454,006 $5,629,335 $0.08 2014/15 64,085,829 $5,263,428 $0.08 2013/14 62,777,028 $5,571,836 $0.092012/13 64,798,541 $5,227,840 $0.082011/12 63,513,607 $4,979,753 $0.082010/11 56,781,528 $4,489,807 $0.08
Water 2019/20 195,146,298 /Gallons $1,097,735 $0.0062018/19 167,220,620 $893,294 $0.0052017/18 162,360,630 $847,563 $0.0052016/17 169,774,748 $870,176 $0.0052015/16 190,142,191 $936,101 $0.005 2014/15 166,812,980 $805,591 $0.0052013/14 182,045,145 $810,188 $0.0042012/13 186,726,885 $747,124 $0.0042011/12 203,412,878 $789,129 $0.0042010/11 211,478,743 $720,559 $0.003
**Starting in 2014 natural gas unit of measure was restated from MCF to Therms.NOTE: KWH means kilowatt-hour of electricity.SOURCE: Facility ServicesFact Book 2019-2020 Finances I6
Utilities Usage and Cost History
UTILITY TYPE Year Total Usage
Unit Measure
TotalCost
Cost Per Unit

Federal Grants and Contracts* $75,202,236 $81,341,718 $84,388,875 $91,260,337 $98,214,435
State Grants and Contracts $3,463,904 $3,609,400 $6,674,855 $6,062,320 $5,429,051
Local Grants and Contracts $3,279,496 $3,963,138 $3,270,665 $4,106,912 $4,827,240
Private Gifts, Grants and Contracts $15,825,477 $16,530,444 $18,422,781 $18,586,878 $18,297,433
Total $97,771,114 $105,444,700 $112,757,176 $120,016,447 $126,768,159
Instruction $11,993,991 $13,562,824 $11,277,059 $8,986,919 $8,285,549
Research $21,146,330 $23,860,382 $28,527,295 $33,238,593 $36,767,677
Public Service $14,998,134 $16,210,381 $15,259,939 $18,140,879 $17,770,503
Academic Support $396,112 $529,203 $754,591 $410,315 $1,067,670
Student Services $1,871,524 $1,934,023 $1,994,611 $2,150,049 $2,457,498
Institutional Support $122,719 $125,001 $67,580 $103,765 $44,151
Subtotal $50,528,810 $56,221,815 $57,881,076 $63,030,520 $66,393,048Scholarships, Fellowships and Pell Grants $46,959,188 $50,023,634 $50,456,770 $53,889,024 $55,973,303
Total $97,487,998 $106,245,449 $108,337,846 $116,919,544 $122,366,351
*Includes federal student financial aid.Note: As of 2018-2019 Fact Book restricted funds have been restated to align with the Comprehensive Annual Financial Review (CAFR).SOURCE: Comptrollers Office, Financial Accounting Services
Grants, Contracts and Gifts
RESTRICTED FUNDS SOURCES FY 15 FY 16 FY 18 FY 19FY 17
Fact Book 2019-2020 Finances I7
FY 17 FY 18 FY 19RESTRICTED FUNDS USES FY 15 FY 16

Fiscal Year 2019
Academic UnitsCollege of Arts & Letters 8 $79,578College of Business, The W.A. Franke 4 $311,859College of Education 10 $4,361,448College of Engineering, Informatics, and Applied Sciences 61 $6,817,903College of Environment, Forestry, and Natural Sciences 145 $17,389,602College of Health & Human Services 36 $9,181,538College of Social & Behavioral Sciences 46 $13,921,263NAU Yuma 0 $0Subtotal 310 $52,063,191
Administrative UnitsCline Library 1 $5,000Office of Communications & Media (KNAU) 1 $244,385Office of the Provost 0 $0University Police 3 $51,561Vice President for Enrollment Management & Student Affairs 7 $2,172,569Vice President for Native American Initiatives 10 $3,012,141Vice President for Research 26 $7,833,246Vice Provost for International Education 1 $25,000Vice Provost for Teaching, Learning Design, & Assessment 2 $11,900Subtotal 51 $13,355,802
Grand Total 361 $65,418,993
SOURCE: Office of the Vice President for Research
Fact Book 2019-2020 Finances I8
Research and Other Sponsored Projects Awards
GRANT AWARDS Number of Awards Value of Awards
NOTE: The "Number of Awards" reflects the number of unique awards that have both an "award date" within the specified fiscal year and a "project start date" that is equal to or later than the first day of the specified fiscal year and have had funding distributed within the fiscal year. The "Value of Awards" refers to awards which have had funding distributed within the specified fiscal year and includes award modifications within the specified fiscal year.
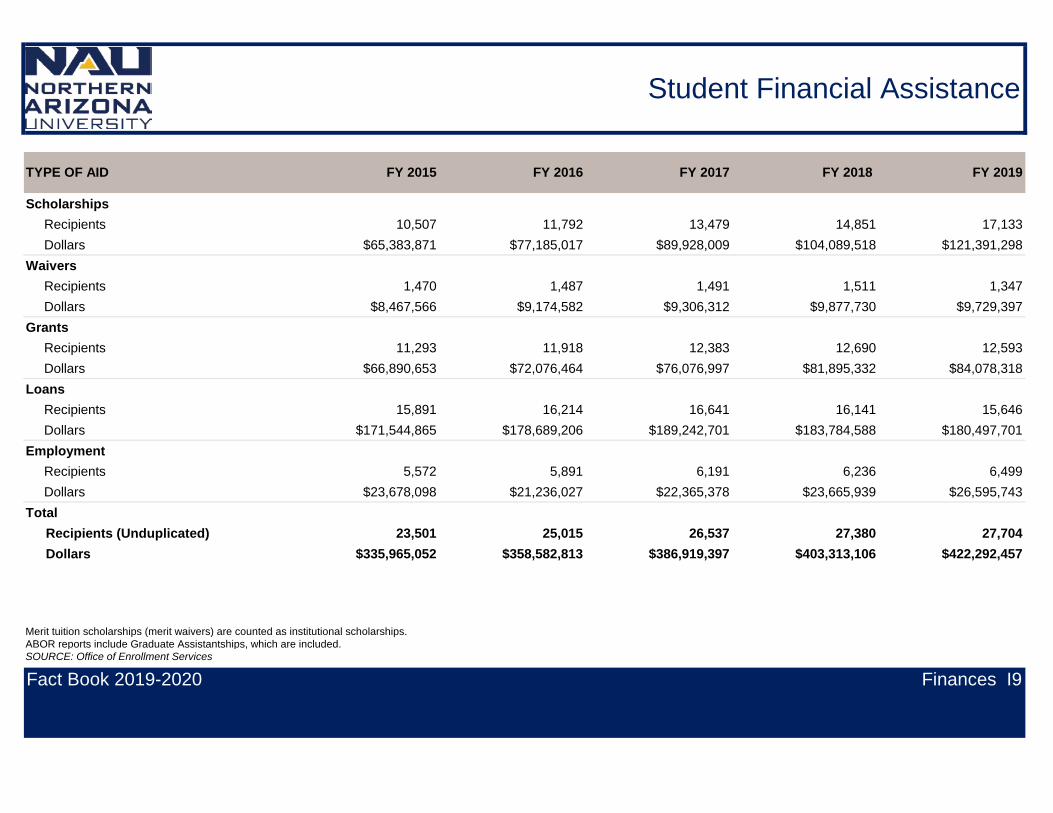
Scholarships Recipients 10,507 11,792 13,479 14,851 17,133 Dollars $65,383,871 $77,185,017 $89,928,009 $104,089,518 $121,391,298Waivers Recipients 1,470 1,487 1,491 1,511 1,347 Dollars $8,467,566 $9,174,582 $9,306,312 $9,877,730 $9,729,397Grants Recipients 11,293 11,918 12,383 12,690 12,593 Dollars $66,890,653 $72,076,464 $76,076,997 $81,895,332 $84,078,318Loans Recipients 15,891 16,214 16,641 16,141 15,646 Dollars $171,544,865 $178,689,206 $189,242,701 $183,784,588 $180,497,701Employment Recipients 5,572 5,891 6,191 6,236 6,499 Dollars $23,678,098 $21,236,027 $22,365,378 $23,665,939 $26,595,743Total
Recipients (Unduplicated) 23,501 25,015 26,537 27,380 27,704Dollars $335,965,052 $358,582,813 $386,919,397 $403,313,106 $422,292,457
Merit tuition scholarships (merit waivers) are counted as institutional scholarships.ABOR reports include Graduate Assistantships, which are included.SOURCE: Office of Enrollment Services
Fact Book 2019-2020 Finances I9
Student Financial Assistance
TYPE OF AID FY 2015 FY 2016 FY 2018 FY 2019FY 2017

Tuition* $10,650 $10,650 $10,650Fees and Surcharges $1,246 $1,246 $1,246Books/Supplies $1,000 $1,000 $1,000Room $5,696 $7,314 $1,906Board $4,838 $3,332 $2,304Transportation $2,520 $2,520 $2,520Personal $2,200 $2,200 $2,200Total $28,150 $28,262 $21,826
Tuition* $25,270 $25,270Fees and Surcharges $1,246 $1,246Books/Supplies $1,000 $1,000Room $5,696 $7,314Board $4,838 $3,332Transportation $2,520 $2,520Personal $2,200 $2,200Total $42,770 $42,882
Costs based on full-time academic status, fall and spring semesters.SOURCE: Office of Financial Aid
Undergraduate Cost of Attendance
ACADEMIC YEAR RESIDENT COSTS
OnCampus
Off Campus Commuter
Fact Book 2019-2020 Finances I10
On Campus
Off Campus
ACADEMIC YEAR NONRESIDENT COSTS
*Based on Guaranteed Pledge Tuition - New freshmen and transfer students who enroll at the Flagstaff campus for Fall 2019 will pay the same tuition rate for four consecutive years. Other rates exist for students at Statewide sites, including online options.

UNDERGRADUATE
Fiscal Year Ended June 30: 2015 2016 2017 2018 2019
Northern Arizona UniversityNAU Arizona Resident Undergraduate Tuition* $9,989 $10,358 $10,764 $11,059 $11,564NAU ABOR Peers Average Resident Undergraduate Tuition** $12,122 $12,670 $12,228 $13,103 $12,994NAU Non-resident Undergraduate Tuition* $22,509 $23,348 $24,144 $24,841 $25,828NAU ABOR Peers Average Non-resident Undergraduate Tuition** $23,060 $23,816 $23,785 $22,682 $22,269
Arizona State UniversityASU Arizona Resident Undergraduate Tuition $10,127 $10,478 $10,640 $10,792 $10,822ASU ABOR Peers Average Resident Undergraduate Tuition $11,871 $12,005 $12,166 $12,481 $12,671ASU Non-resident Undergraduate Tuition $24,503 $25,458 $26,470 $27,372 $28,336ASU ABOR Peers Average Non-resident Undergraduate Tuition $30,003 $31,061 $32,159 $33,421 $34,527
University of ArizonaUA Arizona Resident Undergraduate Tuition* $10,957 $11,424 $11,789 $12,248 $12,467UA ABOR Peers Average Resident Undergraduate Tuition $11,289 $11,454 $11,613 $11,904 $12,034UA Non-resident Undergraduate Tuition* $29,421 $32,652 $34,987 $35,678 $36,366UA ABOR Peers Average Non-resident Undergraduate Tuition $30,159 $31,480 $32,728 $34,457 $35,452
GRADUATE
Fiscal Year Ended June 30: 2015 2016 2017 2018 2019
Northern Arizona UniversityNAU Arizona Resident Graduate Tuition $9,165 $9,606 $9,990 $10,261 $10,970NAU Non-resident Graduate Tuition $20,249 $21,244 $21,976 $22,609 $24,056
Arizona State UniversityASU Arizona Resident Graduate Tuition $11,303 $11,624 $11,776 $11,938 $12,134ASU Non-resident Graduate Tuition $26,736 $27,780 $28,882 $29,874 $30,926
University of ArizonaUA Arizona Resident Graduate Tuition $11,723 $12,062 $12,397 $12,812 $13,044UA Non-resident Graduate Tuition $28,705 $30,384 $32,149 $32,762 $33,393
NOTE: Required fees are included in tuition rates. *Tuition rate based on Guaranteed Pledge Tuition, fall and spring semesters.**NAU ABOR Peers average includes only those peer institutions that also offer Guaranteed Pledge Tuition SOURCE: Comprehensive Annual Financial Report (CAFR)
Arizona Universities Average Tuition
Fact Book 2019-2020 Finances I11

Rate % Change Rate % Change Rate % Change Rate % ChangeAllen $5,128 4% $5,408 5% $5,576 3% $5,696 2% 450Calderon Learning Community (Aspen Crossing) $5,216 4% $5,576 6% $5,752 3% $5,896 3% 367Campbell $5,128 4% $5,408 5% $5,576 3% $5,696 2% 47Campus Heights
1 bed, 1 bath, shared room $5,512 4% $5,832 5% $6,016 3% $6,152 2% 562 bed, private room (smaller) $5,616 4% $5,952 6% $6,136 3% $6,272 2% 522 bed, private room (larger) 2 bed, shared bedroom $5,384 4% $5,720 6% $5,896 3% $6,024 2% 101
Cowden $5,128 4% $5,408 5% $5,576 3% $5,696 2% 415Gabaldon $5,192 4% $5,528 6% $5,696 3% $5,840 3% 597Gillenwater $5,256 4% $5,576 6% $5,752 3% $5,880 2% 120Honors College Semi-suite, shared room $6,670 - $6,870 3% 516 Semi-suite, single room $7,350 - $7,571 3% 118McConnell $5,128 4% $5,408 5% $5,576 3% $5,696 2% 776McDonald $5,104 4% $5,424 6% $5,592 3% $5,712 2% 118McKay Village
2 bed, 2 bath $5,392 4% $5,720 6% $5,896 3% $6,024 2% 1444 bed, 2 bath $5,832 4% $6,184 6% $6,376 3% $6,520 2% 1443 bed, 1 bath $6,096 4% $6,464 6% $6,664 3% $6,808 2% 1082 bed, 1 bath $6,536 4% $6,920 6% $7,136 3% $7,296 2% 48
Mountain View $4,952 4% $5,296 6% $5,464 3% $5,616 3% 580Morton $5,128 4% $5,408 5% $5,408 0% $5,696 5% 72Pine Ridge $5,832 4% $6,184 6% $6,376 3% $6,520 2% 336Raymond $5,104 4% $5,424 6% $5,592 3% $5,712 2% 206Reilly $5,128 4% $5,408 5% $5,576 3% $5,696 2% 580Roseberry $5,032 4% $5,360 6% $5,528 3% $5,648 2% 153Sechrist $5,128 4% $5,408 5% $5,576 3% $5,696 2% 592South Village Apartments
2 bed, large single room $5,632 4% $5,960 6% $6,144 3% $6,280 2% 592 bed, large shared bedroom $5,400 4% $5,704 5% $5,880 3% $6,008 2% 482 bed, single room $5,472 4% $5,792 6% $5,976 3% $6,104 2% 1142 bed, shared bedroom $5,176 4% $5,480 6% $5,648 3% $5,776 2% 145
Taylor $5,128 4% $5,408 5% $5,576 3% $5,696 2% 142Tinsley $5,128 4% $5,408 5% $5,576 3% $5,696 2% 418Wilson $5,128 4% $5,408 5% $5,576 3% $5,696 2% 428Total Capacity 8,050
South Village ApartmentsTwo Bedroom $864 4% $915 6% $943 3% $965 2% 9Large Two Bedroom $955 4% $1,011 6% $1,042 3% $1,066 2% 5
Total Capacity 14
All capacity totals include Resident Assistant spaces.
Campus Heights houses 3 students in each 2-bedroom apartments with one student in a private room, and two students in a shared bedroomSOURCE: Office of Residence Life
Fact Book 2019-2020 Finances I12
FAMILY STUDENTSRESIDENCE COMMUNITY
2016/17 2017/18 2018/19 2019/202019/20 CapacityMonthly Rate % Change Monthly Rate % Change Monthly Rate % Change Monthly Rate
Student Housing
SINGLE STUDENTSRESIDENCE HALL
2016/17 2017/18 2018/19 2019/20 2019/20 Capacity
% Change

Fall 2019
Archivists, Curators, and Museum Technicians 0 0 0 0 0 0 0 0 5 5
Business and Financial Operations Occupations 37 5 6 57 1 2 7 18 344 477
Community, Social Service, Legal, Arts, Design, Entertainment, Sports, and Media Occupations 12 9 9 26 3 1 6 8 176 250
Computer, Engineering, and Science Occupations 18 6 3 26 2 17 7 15 302 396
Graduate Assistants 17 10 8 80 0 140 5 20 400 680
Healthcare Practitioners and Technical Occupations 1 0 0 1 0 0 0 2 26 30
Librarians and Student and Academic Affairs and other Education Services Occupations 3 0 0 1 0 0 2 0 30 36
Management Occupations 5 4 5 3 0 0 5 2 102 126
Natural Resources, Construction, and Maintenance Occupations 5 1 1 20 0 0 0 0 50 77
Office and Administrative Support Occupations 14 3 2 33 2 0 3 6 142 205
Postsecondary Teachers 33 74 29 128 5 35 52 30 1,396 1,782
Production, Transportation, and Material Moving Occupations 5 0 1 6 0 0 0 1 27 40
Service Occupations 56 4 5 46 0 3 11 1 87 213
Student and Academic Affairs and Other Education Services Occupations 11 5 7 34 0 2 5 4 181 249
Temporary 30 8 9 32 0 5 6 13 209 312
Total 247 129 85 493 13 205 109 120 3,477 4,878
SOURCE: IPEDS HR Data, NAU Office of Institutional Research and Analysis
Employees J1
Employees By IPEDS Ethnicity/Race and Job Category
IPEDS ETHNICITY/RACE BY JOB CATEGORY
American Indian/ Alaska Native Asian
Black/African
American
Hispanic/Latino
Native Hawaiian/Other Pacific
Islander
Non-Resident Alien/
International
Not Specified
Two or More Races White TOTAL
NOTE: Temporary hires are not counted in the IPEDS HR data, but are reflected in this report.
Fact Book 2019-2020

REGULAR FULL-TIME FALL 2019 Female Male Total REGULAR PART-TIME FALL 2019 Female Male Total
Archivists, Curators, and Museum Technicians 2 3 5 Business and Financial Operations Occupations 18 6 24
Business and Financial Operations Occupations 320 133 453 Community, Social Service, Legal, Arts, Design, Entertainment, Sports, and Media Occupations 3 1 4
Community, Social Service, Legal, Arts, Design, Entertainment, Sports, and Media Occupations 153 93 246 Computer, Engineering, and Science Occupations 8 7 15
Computer, Engineering, and Science Occupations 138 243 381 Healthcare Practitioners and Technical Occupations 9 1 10
Healthcare Practitioners and Technical Occupations 16 4 20 Librarians and Student and Academic Affairs and other Education Services Occupations 1 1 2
Librarians and Student and Academic Affairs and other Education Services Occupations 22 12 34 Management Occupations 4 0 4
Management Occupations 72 50 122 Natural Resources, Construction, and Maintenance Occupations 0 0 0
Natural Resources, Construction, and Maintenance Occupations 1 76 77 Office and Administrative Support Occupations 12 0 12
Office and Administrative Support Occupations 158 35 193 Production, Transportation, and Material Moving Occupations 2 11 13
Postsecondary Teachers 608 567 1,175 Service Occupations 1 1 2Production, Transportation, and Material Moving Occupations 3 24 27 Student and Academic Affairs and Other Education
Services Occupations 4 5 9
Service Occupations 109 102 211 Total 62 33 95Student and Academic Affairs and Other Education Services Occupations 175 65 240
Total 1,777 1,407 3,184 TEMPORARY PART-TIME FALL 2019 Female Male Total
Graduate Assistants 381 299 680
Postsecondary Teachers 398 209 607
Temporary 203 109 312
Total 982 617 1,599NOTE:Temporary hires are not counted in the IPEDS HR data, but are reflected in this report.
SOURCE: IPEDS HR Data, NAU Office of Institutional Research and Analysis
Employees By Job Category and Gender
Fact Book 2019-2020 Employees J2

College of Arts & Letters 195 198 216 226 222 219 221 223 219
College of Education 96 101 109 113 103 108 105 102 100
College of Engineering, Informatics, and Applied Sciences 42 47 48 57 66 74 85 90 106
College of the Environment, Forestry, and Natural Sciences 168 172 175 186 192 204 219 225 217
College of Health & Human Services 93 98 98 116 120 124 137 149 152
College of Social & Behavioral Sciences 157 161 189 204 205 209 231 235 235
Online, Statewide, and Education Innovation 1 5 6 10 15 15 15 24 22
Provost Office Studies 39 44 53 61 59 55 49 48 45
The W.A. Franke College of Business 72 74 78 82 86 86 88 84 79
Other 1 0 1 0 0 0 1 0 0
Total 864 900 973 1,055 1,068 1,094 1,151 1,180 1,175
(SQL - academic level, degree)
NOTE: The Graduate College is an academic administrative and student service unit. Faculty teaching graduate courses are typically affiliated with their discipline in one of NAU’s other academic colleges.NOTE: In Fall 2017 Extended Campuses was reorganized into Online, Statewide and Education Innovation
NOTE: Instruction/research staff employed full-time with regular assignment as instruction, including those with release time for research.SOURCE: IPEDS HR Data, NAU Office of Institutional Research and Analysis
Full-time Faculty by College
FACULTYBY COLLEGE Fall 2012 Fall 2013 Fall 2014 Fall 2016 Fall 2018 Fall 2019Fall 2011 Fall 2015 Fall 2017
Fact Book 2019-2020 Employees J3
219
100 106
217
152
235
22 45
79
0
College of Arts & Letters College of Education College of Engineering,Informatics, and Applied
Sciences
College of theEnvironment, Forestry,and Natural Sciences
College of Health &Human Services
College of Social &Behavioral Sciences
Online, Statewide, andEducation Innovation
Provost Office Studies The W.A. Franke Collegeof Business
Other
Full-time Faculty by College Fall 2019

Regents' Professor 15 12 14 14 11 11 12 14 13 16 Tenured 411 35%
Professor 233 246 249 255 267 274 281 290 282 276 Tenure Track 134 11%
Associate Professor 189 192 206 214 224 213 205 220 214 207 Non-tenured 630 54%
Assistant Professor 198 190 188 189 213 223 246 264 292 309 Total 1,175 100%
Instructor 78 91 84 87 91 85 71 77 68 50
Lecturer 123 133 159 214 249 262 279 286 311 317
Total 836 864 900 973 1,055 1,068 1,094 1,151 1,180 1,175
(SQL - academic level, degree)
Totals may be off due to rounding.NOTE: Instruction/research staff employed full-time with regular assignment as instruction, including those with release time for research.SOURCE: IPEDS HR Data, NAU Office of Institutional Research and Analysis
Full-time Faculty by Rank and Tenure
Fall 2010
Fall 2011
Fall 2013
FACULTY RANK
Fall 2012
Fact Book 2019-2020 Employees J4
Fall2018
Fall2019 %FULL-TIME
INSTRUCTIONAL FACULTYFall
2019Fall
2017Fall
2014Fall
2015Fall
2016
Tenured35%
Tenure Track11%
Non-tenured54%
Full-time Faculty Tenure StatusFall 2019
16
276
207
309
50
317
Regents' Professor Professor Associate Professor Assistant Professor Instructor Lecturer
Faculty Rank Fall 2019

Regents' Professor $112,089 $127,944 $126,145 $128,400 $137,887 $143,215 $141,434 $144,305 $147,414 $154,544
Professor $91,158 $95,428 $98,142 $99,216 $103,069 $102,808 $102,071 $104,562 $105,012 $106,165
Associate Professor $67,676 $69,286 $71,839 $73,058 $74,839 $75,621 $75,982 $78,330 $77,041 $79,105
Assistant Professor $57,933 $58,946 $59,414 $61,098 $62,579 $62,581 $64,103 $66,073 $67,233 $69,188
Lecturer $51,756 $51,648 $52,313 $52,157 $52,895 $53,125 $52,421 $54,095 $54,414 $55,915
Instructor $38,684 $39,010 $39,348 $40,616 $40,247 $40,930 $40,318 $39,970 $41,138 $40,355
Weighted Average $74,303 $77,364 $79,410 $80,773 $82,699 $82,951 $82,963 $85,050 $84,455 $86,050
(SQL - academic level, degree)
NOTE: Weighted average by proportion of Regents’ Professors, Professors, and Assistant Professors. Instruction/research staff employed full-time with regular assignment as instruction, including those with release time for research.
SOURCE: IPEDS HR Data, Office of Institutional Research and Analysis
Full-time Faculty Average Salaries by Rank
FACULTY RANK Fall 2010 Fall 2011 Fall 2013 Fall 2014 Fall 2015 Fall 2017 Fall 2018 Fall 2019Fall 2012 Fall 2016
Fact Book 2019-2020 Employees J5
$154,544
$106,165
$79,105$69,188
$55,915$40,355
Regents' Professor Professor Associate Professor Assistant Professor Lecturer Instructor
Full-time Faculty Average SalariesFall 2019

Fall 2010 Fall 2011 Fall 2012 Fall 2013 Fall 2014 Fall 2015 Fall 2016 Fall 2017 Fall 2018 Fall 2019
FTE Students 22,746 22,964 24,208 24,816 25,934 27,374 28,710 29,523 29,383 29,175
Full-time Faculty 836 864 900 973 1,055 1,068 1,094 1,151 1,180 1,175
FTE Students to Full-time Faculty 27 27 27 26 25 26 26 26 25 25
SOURCE: NAU Office of Institutional Research and Analysis
FTE Students to Full-time Faculty Ratio
Fact Book 2019-2020 Employees J6
27 27 27
26
25
26 26 26
25 25
Fall 2010 Fall 2011 Fall 2012 Fall 2013 Fall 2014 Fall 2015 Fall 2016 Fall 2017 Fall 2018 Fall 2019
Full-time Equivalent Students to Full-time FacultyTen-year Trend

Fiscal Year 2020
YearBuilt Building Building Name
Gross Square
Feet
Net UsableSquare
Footage
YearBuilt Building Building Name
Gross Square
Feet
Net Usable Square
Footage
1962 26 Adel Mathematics 43,488 39,893 1988 66 Health Professions 59,826 51,809
2007 49 Anthropology Laboratory 3,400 3,010 1966 32 Hospitality Resource and Research Center 2,762 2,492
1972 56 Applied Research and Development 60,500 45,340 1963 33 HRM/Eugene M. Hughes Building 31,512 27,682
1953 37A Ardrey Auditorium 37,635 33,346 1978 27A Institute for Human Development 12,642 11,543
1988 47 Atmospheric Research Observatory/Lutz Telescope 2,175 1,563 1969 18 Liberal Arts 58,433 51,744
1958 76 Avian Cognition Laboratory 5,402 4,766 1960 72 Nursing 19,696 18,046
1981 23 Babbitt Academic Annex 39,033 34,548 1968 Renovated 2014
37 Performing and Fine Arts 127,982 114,510
1967 52 Bilby Research Center 19,174 17,338 1970 19 Physical Sciences 51,318 43,137
1989 21 Biological Sciences 86,964 77,797 1972 92 Ponderosa 10,464 9,250
1971 21B Biological Sciences Annex 8,551 7,629 2007 74 Renewable Energy Test Facility 622 480
1989 18A Biology Greenhouse 4,004 3,148 2012 90 School of Informatics, Computing, and Cyber Systems 46,565 41,227
1998 97 CECMEE Field Station (Formerly Waste Water Training Facility) 1,547 1,420 2015 36 Science and Health Building 140,430 128,059
1968 80 Ceramics Complex 9,009 8,264 1960 20 Science Annex (Formerly Chemistry) 73,168 68,534
2014 80B Ceramics Mixing Building 1,262 1,144 1994 17 Science Lab Facility 107,358 90,487
1958 Renovated 2004
16 Communications 94,365 85,885 1977 84 Sculpture Studio 4,200 4,102
1972 27 Eastburn Education 78,047 69,646 1972 99 Seismic Observatory 372 315
2009 Renovated 2005
69 Engineering and Technology 89,460 80,796 1992 70 Social and Behavioral Sciences West 71,312 64,485
1948 98C Engineering Research 9,665 8,758 1935 93 South Beaver School 30,721 27,397
1977 98D Extended Campus Operation Center (Formerly Anthropology) 9,624 8,717 2003 82 Southwest Forest Science Complex 72,137 58,692
1989 12 Geology 22,559 19,614 2003 65 The Raul H. Castro Social and Behavioral Sciences Bldg 63,321 54,578
1970 13 Geology Annex 7,904 7,007 2005 81 The W.A. Franke College of Business 120,308 100,048
1974 79 Greenhouse Complex 17,009 15,061 2000 88 Wettaw 80,221 73,960
44 Buildings 1,836,147 1,617,267
NOTE: Square footage was calculated using the Postsecondary Education Facilities Inventory and Classification Manual (FICM): 2006 Edition SOURCE: Facility Services
Fact Book 2019-2020 Facilities K1
Flagstaff Campus Academic Buildings

Fiscal Year 2020
SINGLE HOUSING
1967 46 Allen Hall 90,315 85,1012009 29 Ernest Calderon Learning Community 108,808 89,4681916 6 Campbell Hall 17,186 14,3791964 38 Cowden Learning Community 87,049 78,8621940 89 Fountaine Residence 1,638 1,4281984 53 Gabaldon Hall 129,096 113,9561960 31 Gillenwater Hall 46,775 40,9141971 62 McConnell Hall 160,132 145,0801962 40 McDonald Hall 33,402 28,9842006 50B McKay Village 161,897 152,3691914 4 Morton Hall 22,534 19,6071990 55 Mountain View Hall 148,867 130,1911935 5 North Hall* 22,724 19,8112002 95 Pine Ridge Village 124,094 97,6631962 39 Raymond Hall 61,467 54,0211969 48 Reilly Hall 114,512 102,7981962 13A Roseberry Apartments 34,558 30,4511966 42 Sechrist Hall 121,754 107,9141905 9 Taylor Hall 31,603 27,2391964 44 Tinsley Hall 89,475 77,8961965 45 Wilson Hall 89,825 79,070
21 Buildings 1,697,711 1,497,2022012 75 The Suites (NAU ground lease - buildings owned by American Campus Communities)2012 59 Hilltop Townhomes (NAU ground lease - buildings owned by American Campus Communities)2017 87 Skyview (NAU ground lease-buildings owned by American Campus Communities)2018 41 Honors Living and Learning Community (Opened Fall 2018)
FAMILY HOUSING
1963 50 Campus Heights Apartments 56,541 43,553
1972 71 South Family Apartments 102,371 89,4872 Buildings 158,912 133,040
NOTE: Square footage was calculated using the Postsecondary Education Facilities Inventory and Classification Manual (FICM): 2006 Edition
SOURCE: Facility Services
Flagstaff Campus Residential Buildings
YearBuilt Building Building Name Gross
Square FeetNet Usable
Square Footage
Year Built Building Building Name Gross Square Feet Net UsableSquare Footage
Fact Book 2019-2020 Facilities K2

Fiscal Year 2020
1997 23A Academic Annex 3,600 3,357 1970 61 Learning Resource Center 19,648 16,101
2016 86 Aquatic and Tennis Complex 123,341 115,877 2013 96C Flagstaff View Parking Structure 82,800 81,485
1918 11 Ashurst* 18,390 15,536 2011 14 Native American Cultural Center 12,849 12,137
1976 51 Babbitt Administrative Center 29,423 25,560 1949 24 North Heating and Cooling Plant 46,811 46,273
1945 7A Beaver Street House 1,714 1,372 1952 3 North Union 1899/Prochnow 49,454 47,797
1919 2 Blome* 18,817 16,589 1894 10 Old Main* 31,259 23,745
1967 35 Bookstore 47,804 39,345 1958 22 Peterson 39,439 34,389
1908 8 Bury 17,470 14,291 1991 57 Printing Services 5,111 4,888
1999 91 Centennial 10,997 9,846 2003 98B Purchasing Services 9,624 8,832
2013 78 Chemical Storage 1,788 1,627 1926 15 Riles 28,211 22,979
1965 28 Cline Library 211,312 185,273 2009 98F RLSS Warehouse 17,203 16,406
1971 64 du Bois Center 92,946 84,001 1972 68 Rolle Activity Center 47,697 44,184
1988 77 Facility Services 127,981 121,947 1973 47A ROTC/Property Administration 25,182 23,929
1989 77A Facility Services Annex 8,970 8,482 2012 96B San Francisco Parking Structure 474,120 465,000
1930 1 Gammage* 43,684 38,472 1970 63 South Heating and Cooling Plant 16,168 15,491
1967 43 Gateway Student Success Center 16,662 15,923 1970 85 South Recreation Complex 4,389 4,037
2011 25 Health and Learning Center 283,009 270,603 2016 60 Student and Academic Services 111,915 100,573
2008 58 High Country Conference Center and Parking Deck 167,563 153,998 2003 80A Tea House 425 358
2001 82B Hogan 480 442 1975 16A University Marketing and Operations (Formerly Extended Campuses 23,103 20,354
1976 96 Huffer Lane Facility 5,220 4,985 2003 98A University Police 9,665 8,237
1986 7B Humphreys Office Building 2,177 1,816 2013 30D University Union Expansion 11,888 10,968
1986 54 Information Services 5,444 4,928 1986 30A University Union Dining Services 66,566 58,211
1989 54A Information Systems/Telecom 22,702 21,951 1965 30 University Union Fieldhouse 88,019 84,129
1996 54B Information Systems Annex 2,985 2,783 2008 30C University Union Food Court 24,767 22,722
2015 50A International Pavilion 10,410 9,399 1989 30B University Union Student Administration 24,354 21,810
1994 83 KNAU/Flagstaff Campus Transit 11,893 10,824 1977 73 Walkup Skydome 254,360 244,886
2006 96A Knoles Drive Parking Structure 293,485 287,942
53 Buildings 3,105,294 2,907,090*Listed on the National Registry of Historic Places on May 22, 1986 as the Northern Arizona Normal School District
NOTE: Square footage was calculated using the Postsecondary Education Facilities Inventory and Classification Manual (FICM): 2006 EditionSOURCE: Facility Services
Net Usable Square Footage
Flagstaff Campus Support Buildings
YearBuilt Building Building Name Gross
Square FeetNet Usable
Square FootageYear Built Building Building Name Gross
Square Feet
Facilities K3Fact Book 2019-2020

Fiscal Year 2020
Academic Buildings 1,836,147 1,617,267
Residential - Single Housing 1,697,711 1,497,202
Residential - Family Housing 158,912 133,040
Support Facilities 3,105,294 2,907,090
TOTAL 6,798,064 6,154,599
NOTE: Square footage was calculated using the Postsecondary Education Facilities Inventory and Classification Manual (FICM): 2006 EditionSOURCE: Facility Services
Net UsableSquare Footage
Land Acreage 685
Flagstaff Campus Buildings Summary
Building Type GrossSquare Feet
Fact Book 2019-2020 Facilities K4
1,617,267 1,497,202
133,040
2,907,090
Academic Buildings Residential - Single Housing Residential - Family Housing Support Facilities
Flagstaff Campus BuildingsNet Usable Square Footage
FY20

Glossary
Full-time FacultyFull-time Faculty are academic year appointments with the ranks of Regents' Professor, Professor, Associate Professor, Assistant Professor, Lecturer and Instructor. Administrative faculty such as dean, associate dean, and directors, who hold faculty rank are included if they teach. Part-time faculty who are paid on a per class basis and graduate teaching assistants are excluded from this definition.
Administrative FacultyThe administrative faculty is made up of executive level administrative personnel including assistant/associate deans, deans, directors, and executive directors.
Budgeted Full-time Faculty Equivalent (FTE)Budgeted full-time equivalent faculty is the sum of the appointment percentages of all faculty in a particular department, college or other unit. To calculate budgeted FTE faculty for a particular program, such as Instruction, each appointed percentage is multiplied by the percent of the individual's salary paid from that program, and then summed. For example, a professor in full-time appointment who receives one-half of his salary from Instruction and one-half from Organized Research would be counted as one (1.00) budgeted FTE faculty member with one-half (0.50) budgeted FTE to Instruction and one-half (0.50) budgeted FTE to Organized Research.
Credit Hour or Student Credit Hour (SCH)A credit hour is a unit of measurement assigned to a course and expressed in semester hours. The traditional purpose of SCH is to measure a student's progress toward a degree. The total SCH for a course are arrived by multiplying the number of official students by the number of credit hours. SCH are generated by the level of the course.
Ethnicity/Race Values (All Declared)These ethnicity/race values are duplicated and represent one or more values per student.
FacultyThe term "faculty" is not confined simply to those who teach. It refers to many people in the academic community whose responsibilities range from instruction to research, to public service and to administration, and in many cases a faculty member's responsibilities are made up of a combination of two or more functions.
Full-time Equivalent (FTE) Student
Fact Book 2019-2020 Glossary
The FTE enrollment is the equivalent number of full-time students on the official census day of the semester. Equivalency is established by dividing the total number of SCH by the normal load of credit hours as follows. Lower division SCH are divided by fifteen to calculate FTE. Upper division SCH are divided by twelve to calculate FTE. Graduate SCH are divided by ten to calculate graduate FTE.
Is used to account for transactions related to the university's state-appropriated budget, as approved by the Arizona Legislature and Arizona Board of Regents.
Full-time Graduate StudentA graduate student who holds a bachelor's degree or equivalent, is taking courses at the post-baccalaureate level, and is enrolled for nine or more semester credits.
Full-time Undergraduate StudentAn undergraduate student who is enrolled for twelve or more semester credits.
General Operating Fund

State Operating Budget
Glossary
Instructional FacultyThe term instructional faculty generally refers to the academic rank of professor, associate professor, assistant professor, chairs, instructor, and lecturer in instructional departments. Part-time faculty and graduate assistants may be included depending upon the purpose of the count. Counts of faculty with instructional titles are as of a specific date, established by the federal government, November 1.
IPEDS Ethnicity/Race ValuesEthnicity/Race based on the Integrated Postsecondary Education Data System (IPEDS) definitions. Ethnicity/Race is reported as unduplicated, one value per student.
Off Campus (Financial Aid definition)
HeadcountThe official number of students as identified by the census process.
Students who do not meet self-supporting criteria and do not live with parents.
On Campus (Financial Aid definition) Students who do not meet the self-supporting criteria and live in residence halls.
Self-supporting
Students born before January 1st 1995, veterans, graduate students, married students, orphans/wards of the court, students with legal dependents other than a spouse.
The State Operating Budget is the primary budget at NAU. Two revenue sources support the state operating budget. The first, Collections, consists of student registration fees and tuition, along with some miscellaneous revenue and balance forward. The Arizona Board of Regents authorizes the universities to retain a portion of tuition and fee revenue for bonding debt service, plant projects, and some operating budgets not supported by the state. The remaining fee and tuition collections become a part of the state operating budget. The second major source of funding is General Funds-Arizona's general tax revenues. This amount is appropriated to the university as part of the annual legislative budget process.
Fact Book 2019-2020 Glossary

(SQL - academic level, degree)
Fact Book 2019-2020