FACT BOOK 2015-16 - Cleveland State Community College · filename: cover.doc . CLEVELAND STATE...
82
FACT BOOK 2015-16 VOLUME XXIV Cleveland State Community College 3535 Adkisson Drive P. O. Box 3570 Cleveland, Tennessee 37320-3570 (423) 472-7141 http://www.clevelandstatecc.edu filename: cover.doc
Transcript of FACT BOOK 2015-16 - Cleveland State Community College · filename: cover.doc . CLEVELAND STATE...
FACT BOOK
2015-16
VOLUME XXIV
Cleveland State Community College
3535 Adkisson Drive
P. O. Box 3570
Cleveland, Tennessee 37320-3570
(423) 472-7141
http://www.clevelandstatecc.edu filename: cover.doc

CLEVELAND STATE COMMUNITY COLLEGE
FACT BOOK
2015 - 2016
TABLE OF CONTENTS MISSION, VISION, AND VALUES …………………………………………. 1 SERVICE AREA DEMOGRAPHICS Selected Population Characteristic …………………………………….. 2 Student Profile
Fall Terms………………………………………………………. 3 Spring Terms……………………………………………………. 4
Market Penetration General Population……………………………………………… 5 High Schools …………………………………………………… 6
Workforce Profile Composition of the Workforce ………………………………… 7
GENERAL ACADEMIC INFORMATION
Degrees and Certificates Offered ……………………………………… 8 Average Class Size and Sections Made ……………………………… 9 Entering ACT Scores ………………………………………………….. 10 Grade Point Average …………………………………………………… 11
Average Credit Hour Load per Student ………………………………… 12 INSTITUTIONAL EFFECTIVENESS AND PERFORMANCE SUMMARIES
Performance Funding: Score Report …………. .……………………………………… 13 Dollars Awarded for Performance – History ………………….. 15
ENROLLMENT
History and Trends
Complete Headcount History, All Terms ……………………… 16 Complete Headcount and FTE History, Fall Only …………….. 17 First Time Freshman ………..……………………………..…... 18 Complete Headcount and FTE History, Spring Only ………….. 19 Recent Spring Enrollment Trend ………………………………. 20 Summer Enrollment History …………………………………… 21 Recent Summer Enrollment Trend …………………………….. 22

PATTERNS OF ENROLLMENT
Credit Enrollment by: Residence, Students from Service Area Counties Only …………. 23 Residence – All Students ………………………………………… 24 Class (Freshman, Sophomore, Non-Degree) …………………….. 25 Program Type (Transfer, Career/Technical, Non-Degree) ………. 26 Program Major
Fall Terms……………………………………………………. 27 Spring Terms…………………………………………………. 31
Full-Time and Part-time ………………………………………….. 35 Day and Evening – Fall Terms …………………………………… 36 Day and Evening – Spring Terms ………………………………… 37 Off-Campus Teaching Site
Fall Terms…………………………………………………….. 38 Spring Terms………………………………………………….. 39
Credit Enrollment and Student Credit Hour (SCH) Productivity, by:
All Students By Term …………………………………………… 40 Developmental Studies Comparison to Regular................................ 41 Program Type (Transfer, Career/Technical, Non-Degree) ………. 42 Academic Discipline (Headcount) - Fall Terms ……………….. 43 Academic Discipline (Headcount ) – Spring Terms........................ 44 Academic Discipline (SCH Productivity) – Fall Terms………….. 45 Academic Discipline (SCH Productivity – Spring Terms .............. 46 Institutional Division SCH
Fall Terms………………………………………………… 47 Spring Terms……………………………………………… 48
Full-Time and Part-Time ………………………………………. 49 Alternative Instructional Delivery Systems ………………………. 50
(*for SCH Productivity by Faculty, see Personnel Section)
RETENTION OF STUDENT
First Time Freshman ………………………..…………………… 18 Fall-to-Spring ………………………………................................ 51 Fall-to-Fall ……………………………………………………….. 52
GRADUATION Number of Graduates by:
Total Institution since College Opened ………………………….. 53 Gender and Race ………………………………………………….. 54 Program Type (Transfer, Career/Technical, Certificate) …………. 55 Major By CIP Code……………………………………………… 56

Graduation Rate for All Students Combined …………………………………………… 57 Athletes and Non-Athletes ……………………………………….. 58
PLACEMENT AND TRANSFER Job Placement Rates for Career Program Graduates……………………….. 59 Student Transfers …………………............................................................... 60 LIBRARY Library Holdings ............................................................................................ 61 Library Circulations & Reference Desk Stats ................................................... 62 Library Subject Utilization & Resource Usage ........................................... 63 FINANCIAL AID AND SCHOLARSHIPS Amount of Aid by Federal Program……………………………………….. 64 Number Students Receiving Financial Aid………………………………… 65 Foundation Scholarships by Year………………………………………….. 66 Foundation Performance History………………………………………….. 67 IPEDS Student Financial Aid Stats…………………………………………. 68 ATHLETICS Number of Athletes by Team; Awards and Honors ..........................................69 Graduates (see Graduation section above) BUDGET Revenues…………………………………………………………………… 70 Expenditures……………………………………………………………….. 71 PERSONNEL Organizational Structure…………………………………………………… 72 Number of Full-Time Personnel…………………………………………… 73 Number of Faculty by Rank and Highest Degree Held……………………. 74 Number of Part-Time Faculty……………………………………………… 75 Full-Time and Part-Time Faculty SCH Productivity………………………. 76 PHYSICAL FACILITIES Buildings – Size, Age, Value……………………………………………… 77 CAMPUS SAFETY Campus Crime Report…………………………………………………….. 78
Filename mission.doc
Cleveland State Community College
Mission Statement
Cleveland State Community College provides accessible, responsive, and quality
educational opportunities primarily for residents of southeastern Tennessee. The
College delivers developmental education, university transfer programming,
workforce training and continuing education activities. By engaging a diverse
student body in the learning process, the College aspires to promote success,
enhance quality of life and encourage civic involvement. The College strives to be
a responsible partner in lifelong learning for the individual and in the economic
development of the region.
1

Characteristic Bradley Meigs McMinn Monroe Polk
Total Population 103,879 12,114 53,546 46,020 17,692
Race Distribution (%)White 88.68% 95.17% 91.19% 92.54% 96.34%African American 4.68% 1.73% 4.05% 2.19% 0.63%American Indian 0.35% 0.64% 0.38% 0.51% 0.51%Asian 1.17% 0.43% 0.73% 0.61% 0.32%Pacific Islander 0.08% 0.00% 0.02% 0.03% 0.02%Other 2.94% 0.76% 1.38% 2.28% 0.60%Two or More Races 2.10% 1.27% 2.24% 1.82% 1.58%Hispanic 5.88% 1.82% 3.26% 4.14% 1.79%
Sex (%) Male 48.70% 49.70% 48.60% 49.50% 49.80%
Female 51.30% 50.30% 51.40% 50.50% 50.20%
Age Distribution (%) 0-4 5.73% 4.80% 5.41% 5.74% 5.14% 5-9 5.94% 5.30% 5.71% 5.99% 5.58%
10-19 6.23% 6.03% 6.13% 6.35% 5.93% 15-19 6.62% 5.68% 6.06% 5.49% 5.85% 20-24 7.23% 5.20% 5.98% 5.54% 5.25% 25-34 12.74% 10.28% 11.20% 11.30% 10.73% 35-44 12.65% 13.03% 11.98% 12.08% 12.64% 45-54 13.78% 14.86% 14.11% 13.87% 14.73% 55-64 12.86% 15.16% 14.42% 14.52% 14.57% 65-70 9.81% 13.55% 11.33% 12.48% 12.47% 75-84 4.84% 4.71% 5.60% 5.01% 5.39% 85+ 1.60% 1.42% 2.05% 1.64% 1.72%
Median Age 39.5 44.8 43.1 43.1 44.2
Educational Attainment (%) Popoulation Age 25+ 67,580 8,374 36,400 31,462 11,907
< Grade 9 7.50% 11.50% 7.40% 10.50% 11.00% Grade 9-12 10.00% 13.40% 10.10% 11.60% 11.40% High School 33.00% 40.40% 41.80% 41.90% 43.50%
Some College 22.70% 21.60% 17.90% 18.80% 17.10% Assoc Degree 7.60% 5.30% 8.00% 5.90% 6.70% Bach Degree 12.40% 4.60% 9.30% 6.90% 6.10% Grad Degree 6.90% 3.10% 5.50% 4.40% 4.20%
Household Income Distribution (%) <$15K 15.81% 22.10% 18.19% 19.87% 18.12%
$15,000-$24,999 13.86% 13.14% 13.77% 15.61% 15.51% $25,000-$34,999 13.31% 12.20% 12.55% 14.74% 12.74% $35,000-$49,000 16.34% 14.50% 14.14% 16.62% 15.15% $50,000-$74,999 17.16% 18.23% 19.70% 17.35% 17.89% $75,000-$99,999 11.45% 13.39% 10.76% 9.35% 10.92%
$100,000-$149,999 8.58% 3.85% 8.54% 4.50% 7.81% $150,000-$199,000 2.10% 2.15% 1.28% 1.10% 1.27%
$200,000+ 1.39% 0.43% 1.07% 0.87% 0.60%
https://www.tvasites.com/home.aspxhttp://factfinder2.census.gov/
Selected Population CharacteristicsService Area Counties 2015
Source: TVA Economic Development Sites and Buildings
2
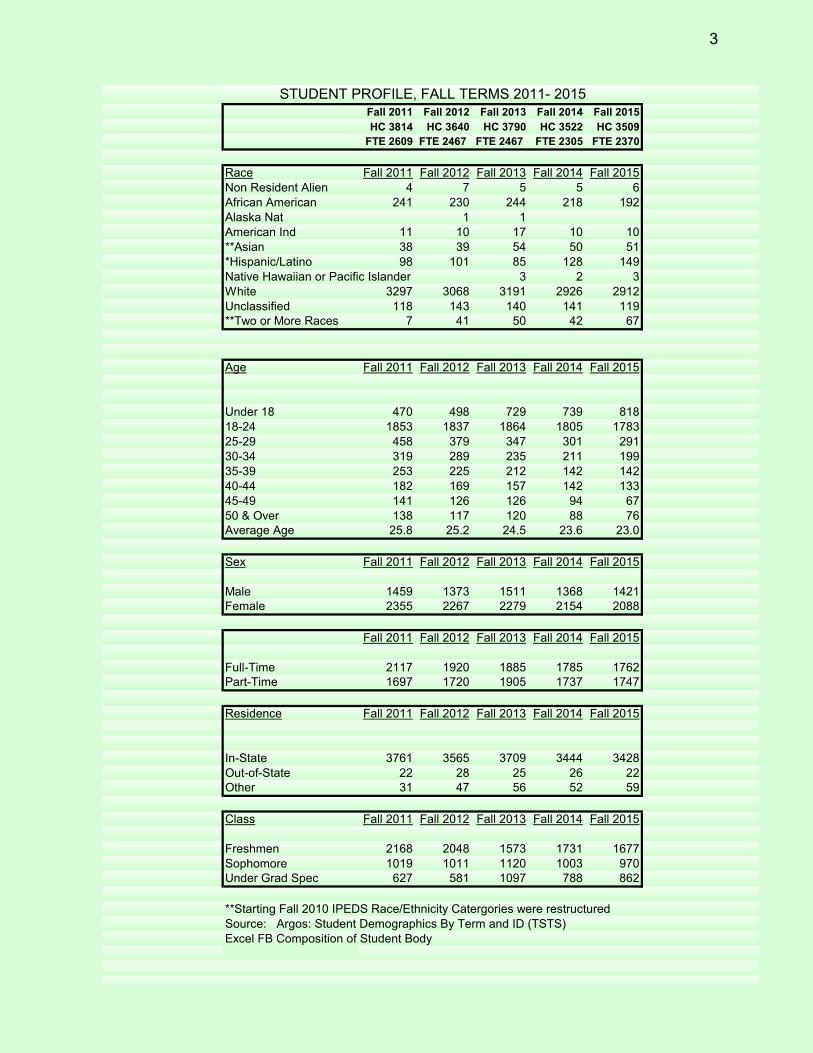
Fall 2011 Fall 2012 Fall 2013 Fall 2014 Fall 2015HC 3814 HC 3640 HC 3790 HC 3522 HC 3509
FTE 2609 FTE 2467 FTE 2467 FTE 2305 FTE 2370
Race Fall 2011 Fall 2012 Fall 2013 Fall 2014 Fall 2015Non Resident Alien 4 7 5 5 6African American 241 230 244 218 192Alaska Nat 1 1American Ind 11 10 17 10 10**Asian 38 39 54 50 51*Hispanic/Latino 98 101 85 128 149Native Hawaiian or Pacific Islander 3 2 3White 3297 3068 3191 2926 2912Unclassified 118 143 140 141 119**Two or More Races 7 41 50 42 67
Age Fall 2011 Fall 2012 Fall 2013 Fall 2014 Fall 2015
Under 18 470 498 729 739 81818-24 1853 1837 1864 1805 178325-29 458 379 347 301 29130-34 319 289 235 211 19935-39 253 225 212 142 14240-44 182 169 157 142 13345-49 141 126 126 94 6750 & Over 138 117 120 88 76Average Age 25.8 25.2 24.5 23.6 23.0
Sex Fall 2011 Fall 2012 Fall 2013 Fall 2014 Fall 2015
Male 1459 1373 1511 1368 1421Female 2355 2267 2279 2154 2088
Fall 2011 Fall 2012 Fall 2013 Fall 2014 Fall 2015
Full-Time 2117 1920 1885 1785 1762Part-Time 1697 1720 1905 1737 1747
Residence Fall 2011 Fall 2012 Fall 2013 Fall 2014 Fall 2015
In-State 3761 3565 3709 3444 3428Out-of-State 22 28 25 26 22Other 31 47 56 52 59
Class Fall 2011 Fall 2012 Fall 2013 Fall 2014 Fall 2015
Freshmen 2168 2048 1573 1731 1677Sophomore 1019 1011 1120 1003 970Under Grad Spec 627 581 1097 788 862
**Starting Fall 2010 IPEDS Race/Ethnicity Catergories were restructuredSource: Argos: Student Demographics By Term and ID (TSTS) Excel FB Composition of Student Body
STUDENT PROFILE, FALL TERMS 2011- 2015
3

Spring 2012 Spring 2013 Spring 2014 Spring 2015 Spring 2016HC 3502 HC 3283 HC 3297 HC 3305 3132FTE 2245 FTE 2154 FTE 2062 FTE 1981 FTE 1972
Ethnicity**Asian 40 37 44 56 49**Hispanic/Latino 90 104 121 82 132African American 222 196 199 201 160Alaska Nat 2 2 1American Indian 8 8 10 8 7Native Hawaian or Pacific Islander 1 2 3 2White 3035 2785 2773 2794 2624Unclassified 93 98 97 100 84Nonresident Alien 4 3 7 11**Two or More Races 14 48 46 53 63
AgeUnder 18 413 316 506 663 62218-24 1712 1751 1778 1710 169925-29 421 331 280 281 26730-34 290 272 213 209 17235-39 238 222 167 135 12340-44 177 165 140 134 11645-49 133 112 99 87 6850 & Over 118 114 114 86 65
Average Age 25.9 25.7 24.5 23.7 23.1
SexMale 1315 1246 1260 1281 1248Female 2187 2037 2037 2024 1884
Full-Time 1703 1630 1517 1409 1255Part-Time 1799 1653 1780 1896 1877
ResidenceUnknownIn-State 3464 3221 3222 3223 3064Out-of-State 30 23 23 25 18Other 8 39 52 47 50
ClassFreshman 1731 1606 1426 1289 1222Sophomore 1143 1143 1061 1076 995Under Grad Spec 628 534 810 940 915
STUDENT PROFILE - SPRING TERMS 2012- 2016
**Starting Fall 2010 IPEDS Race/Ethnicity Categories were restructured.Source: Argos/Reg Student Demographics By Term ID (TSTS).excel Composition of Student Body Spring
4

County 2006 2007 2008 2009 2010 2011 2012 2013 2014 2015
Bradley 1:45 1:46 1:43 1:41 1:40 1:40 1:41 1:42 1:43 1:47
McMinn 1:86 1:80 1:61 1:54 1:77 1:50 1:56 1:52 1:57 1:61
Meigs 1:76 1:63 1:58 1:55 1:52 1:58 1:53 1:45 1:52 1:58
Monroe 1:162 1:154 1:112 1:95 1:129 1:117 1:148 1:123 1:133 1:102
Polk 1:70 1:63 1:60 1:50 1:42 1:48 1:53 1:54 1:61 1:70
Total 1:64 1:64 1:56 1:52 1:56 1:54 1:51 1:52 1:56 1:59
Market Penetration is defined for the purpose of this presentation as the total countypopulation, ages 18 years and older, divided by the total CSCC headcountenrollment of persons residing in those counties, expressed as a ratio of students to population. Students residing outside the service area are excluded from all calculations.
Source: U.S. Census annual estimates by county- http://quickfacts.census.gov/qfd/states
ClSCC 14th Day Enrollment Data; Excel mktpenetrationArgos/Institutional Research/Headcount by County QV
Cleveland State Community CollegeMarket Penetration in the Five-County Service Area
Fall Terms
5
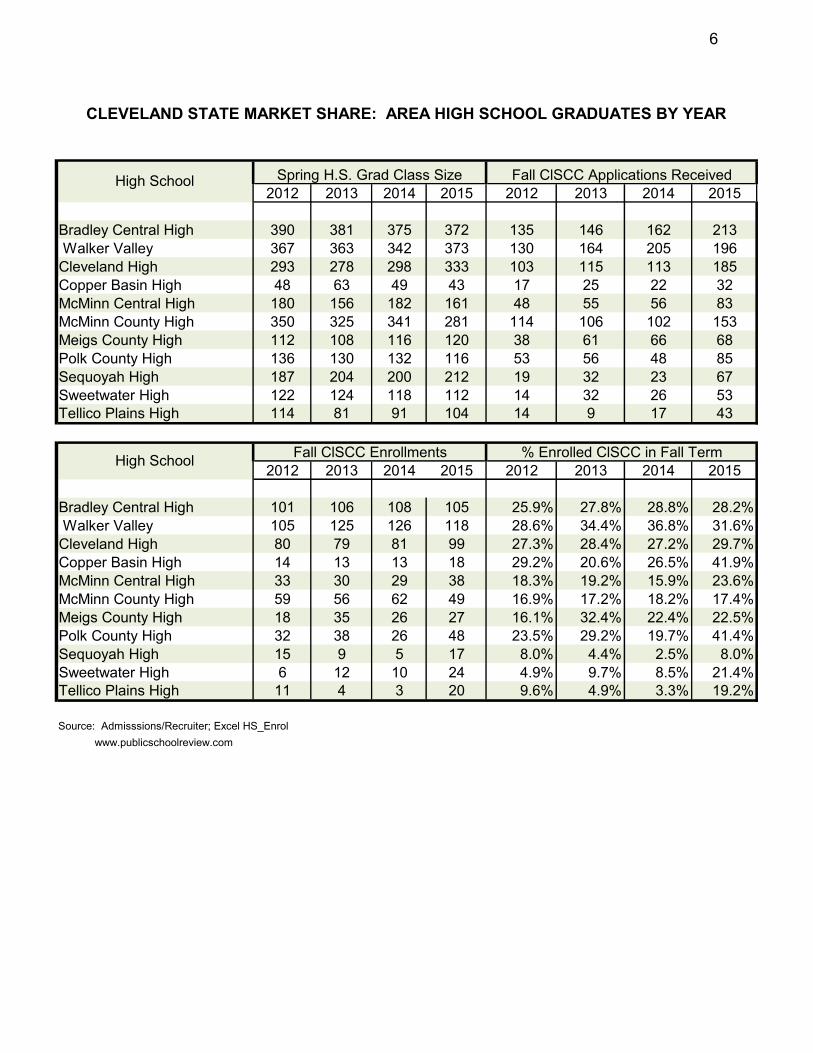
Spring H.S. Grad Class Size2012 2013 2014 2015 2012 2013 2014 2015
Bradley Central High 390 381 375 372 135 146 162 213 Walker Valley 367 363 342 373 130 164 205 196Cleveland High 293 278 298 333 103 115 113 185Copper Basin High 48 63 49 43 17 25 22 32McMinn Central High 180 156 182 161 48 55 56 83McMinn County High 350 325 341 281 114 106 102 153Meigs County High 112 108 116 120 38 61 66 68Polk County High 136 130 132 116 53 56 48 85Sequoyah High 187 204 200 212 19 32 23 67Sweetwater High 122 124 118 112 14 32 26 53Tellico Plains High 114 81 91 104 14 9 17 43
2012 2013 2014 2015 2012 2013 2014 2015
Bradley Central High 101 106 108 105 25.9% 27.8% 28.8% 28.2% Walker Valley 105 125 126 118 28.6% 34.4% 36.8% 31.6%Cleveland High 80 79 81 99 27.3% 28.4% 27.2% 29.7%Copper Basin High 14 13 13 18 29.2% 20.6% 26.5% 41.9%McMinn Central High 33 30 29 38 18.3% 19.2% 15.9% 23.6%McMinn County High 59 56 62 49 16.9% 17.2% 18.2% 17.4%Meigs County High 18 35 26 27 16.1% 32.4% 22.4% 22.5%Polk County High 32 38 26 48 23.5% 29.2% 19.7% 41.4%Sequoyah High 15 9 5 17 8.0% 4.4% 2.5% 8.0%Sweetwater High 6 12 10 24 4.9% 9.7% 8.5% 21.4%Tellico Plains High 11 4 3 20 9.6% 4.9% 3.3% 19.2%
Source: Admisssions/Recruiter; Excel HS_Enrol www.publicschoolreview.com
CLEVELAND STATE MARKET SHARE: AREA HIGH SCHOOL GRADUATES BY YEAR
Fall ClSCC Applications Received
Fall ClSCC Enrollments % Enrolled ClSCC in Fall Term
High School
High School
6
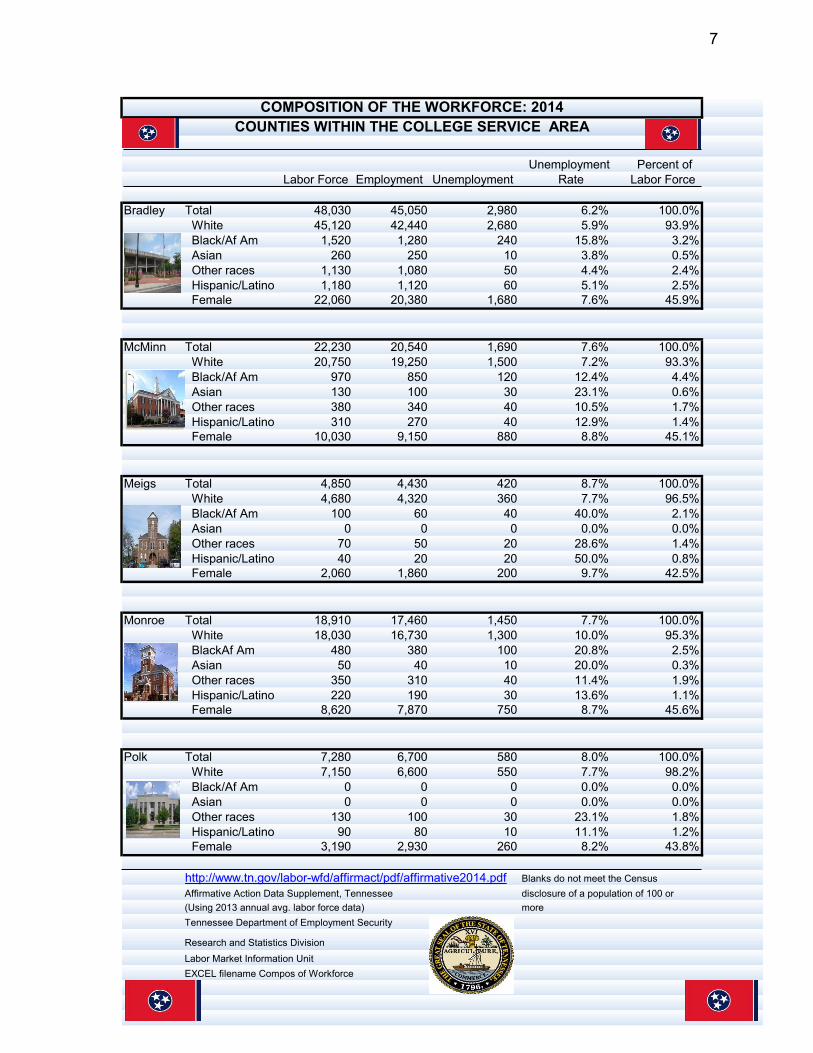
Unemployment Percent ofLabor Force Employment Unemployment Rate Labor Force
Bradley Total 48,030 45,050 2,980 6.2% 100.0% White 45,120 42,440 2,680 5.9% 93.9% Black/Af Am 1,520 1,280 240 15.8% 3.2% Asian 260 250 10 3.8% 0.5% Other races 1,130 1,080 50 4.4% 2.4% Hispanic/Latino 1,180 1,120 60 5.1% 2.5% Female 22,060 20,380 1,680 7.6% 45.9%
McMinn Total 22,230 20,540 1,690 7.6% 100.0% White 20,750 19,250 1,500 7.2% 93.3%
Black/Af Am 970 850 120 12.4% 4.4% Asian 130 100 30 23.1% 0.6% Other races 380 340 40 10.5% 1.7% Hispanic/Latino 310 270 40 12.9% 1.4% Female 10,030 9,150 880 8.8% 45.1%
Meigs Total 4,850 4,430 420 8.7% 100.0% White 4,680 4,320 360 7.7% 96.5%
Black/Af Am 100 60 40 40.0% 2.1% Asian 0 0 0 0.0% 0.0% Other races 70 50 20 28.6% 1.4% Hispanic/Latino 40 20 20 50.0% 0.8% Female 2,060 1,860 200 9.7% 42.5%
Monroe Total 18,910 17,460 1,450 7.7% 100.0% White 18,030 16,730 1,300 10.0% 95.3%
BlackAf Am 480 380 100 20.8% 2.5% Asian 50 40 10 20.0% 0.3% Other races 350 310 40 11.4% 1.9% Hispanic/Latino 220 190 30 13.6% 1.1% Female 8,620 7,870 750 8.7% 45.6%
Polk Total 7,280 6,700 580 8.0% 100.0% White 7,150 6,600 550 7.7% 98.2% Black/Af Am 0 0 0 0.0% 0.0% Asian 0 0 0 0.0% 0.0% Other races 130 100 30 23.1% 1.8% Hispanic/Latino 90 80 10 11.1% 1.2% Female 3,190 2,930 260 8.2% 43.8%
http://www.tn.gov/labor-wfd/affirmact/pdf/affirmative2014.pdf Blanks do not meet the Census Affirmative Action Data Supplement, Tennessee disclosure of a population of 100 or (Using 2013 annual avg. labor force data) moreTennessee Department of Employment Security
Research and Statistics DivisionLabor Market Information UnitEXCEL filename Compos of Workforce
COMPOSITION OF THE WORKFORCE: 2014COUNTIES WITHIN THE COLLEGE SERVICE AREA
7

CIP*TRANSFER PROGRAMS
Teaching (A.S.T.) 08.13.0101.00General Transfer (A.A.) 16.24.0101.01General Transfer (A.S.) 16.24.0101.01Fine Arts (AFA) 30.50.0903.00
CAREER/TECHNICAL DEGREE PROGRAMS
Web Technology (RODP AAS) 06.11.0801.00Industrial Technology (A.A.S.) 09.15.0612.00Early Childhood Education (A.A.S.) 12.19.0706.00Professional Studies (RODP) (A.A.S.) 16.24.0102.02General Technology (A.A.S.) 23.32.0111.00Criminal Justice (RODP) (A.A.S) 27.43.0104.00Public and Government Services (A.A.S.) 27.44.9999.00Medical Informatics 31.51.2706.00Nursing (A.A.S.) 31.51.3801.00Health Sciences (A.A.S.) 31.51.9999.01Business (A.A.S.) 32.52.0201.01Office Systems Administration (A.A.S.) 32.52.0401.00
CAREER/TECHNICAL CERTIFICATE PROGRAMS
Web Page Authoring (RODP) 06.11.0801.00Network Systems Design 06.11.0901.00Civil Technology 09.15.0201.00Electrical Maintenance Fundamentals 09.15.0303.00Zero Energy Housing 09.15.0503.00Climate Control 09.15.0505.00Industrial Automation Fundamentals 09.15.0612.00Mechanical Maintenance Fundamentals 09.15.0805.00Architectural Design 09.15.1303.00Mechanical Drafting 09.15.1306.00Early Childhood Education 12.19.0706.01General Education Core 16.24.0101.00Technology Essentials 23.32.0111.00Process Control Fundamental 25.41.0303.00Law Enforcement Training 27.43.0107.00Construction Surveying 29.46.0415.00Construction Applications 29.46.0415.01Pre Allied Health 31.51.0000.01Paramedic 31.51.0904.00Emergency Medical Services 31.51.0904.02Advanced Emergency Medical Technician 31.51.0904.03Business & Management 32.52.0201.01Customer Service 32.52.0201.02Accounting 32.52.0201.03Computer Business Applications 32.52.0201.04Office Systems Administration 32.52.0401.00
*CIP = Classification of Instructional Programs, a national system forgrouping similar programs of study. The middle six digits identifythe program on the national register, while the prefix and suffix digits are added for state inventory purposes.
Source: THEC Academic Inventory, revised 09-15-2014. filename Acad Prog Inv.xls
Academic Program Inventory, Fall 2015(Active Programs Only)
8

Term/Year Day Evening Day Evening
Fall 1995 15.9 13.3 12.0 13.1Fall 1996 16.9 16.5 13.8 13.3Fall 1997 17.4 14.6 13.3 15.4Fall 1998 17.2 15.7 9.6 11.3Fall 1999 16.3 14.7 10.5 12.9Fall 2000 16.2 14.1 9.8 15.1Fall 2001 16.5 14.3 9.0 13.0Fall 2002 16.0 15.8 11.7 12.1Fall 2003 18.0 17.7 9.2 11.9Fall 2004 18.9 14.8 10.1 13.6Fall 2005 17.6 16.2 9.0 12.2Fall 2006 15.0 14.8 9.9 15.1Fall 2007 14.7 13.9 10.1 13.6Fall 2008 ** 24.0 19.7 15.1 16.7Fall 2009 28.8 18.3 12.2 14.8Fall 2010 23.7 17.5 16.5 18.4Fall 2011 22.2 17.9 17.3 15.1Fall 2012 21.8 14.3 14.5 14.7Fall 2013 21.6 18.7 15.1 15.1Fall 2014 21.5 18.7 15.2 12.0Fall 2015 20.3 17.6 15.9 11.5Excludes Independent Studies*Combined sections counted as one section**Notes (Fall 2008): Explanation for differences in Fall 2007 and Fall 2008. An effort was made to develop a more realistic picture of average class size in Fall 2008. As in Fall 2007, combined sections were counted as one section. However in Fall 2008, counts were adjusted so that only courses managed with a traditional enrollment cap were included. Courses excluded from the calculations were: low enrollment courses (1-2 students) offered gratis, private lessons, the fitness course, the language lab enrollment, varsity athlete courses, and nursing courses
Source: DEN006 from THEC SIS 14th Day Reports Argos/Scheduled Section By Subject QV (TSTS) 14th day excel average class size
Average Class Size*On Campus Off-Campus
Average Class Size; Fall Terms, 1995 - 2015
9
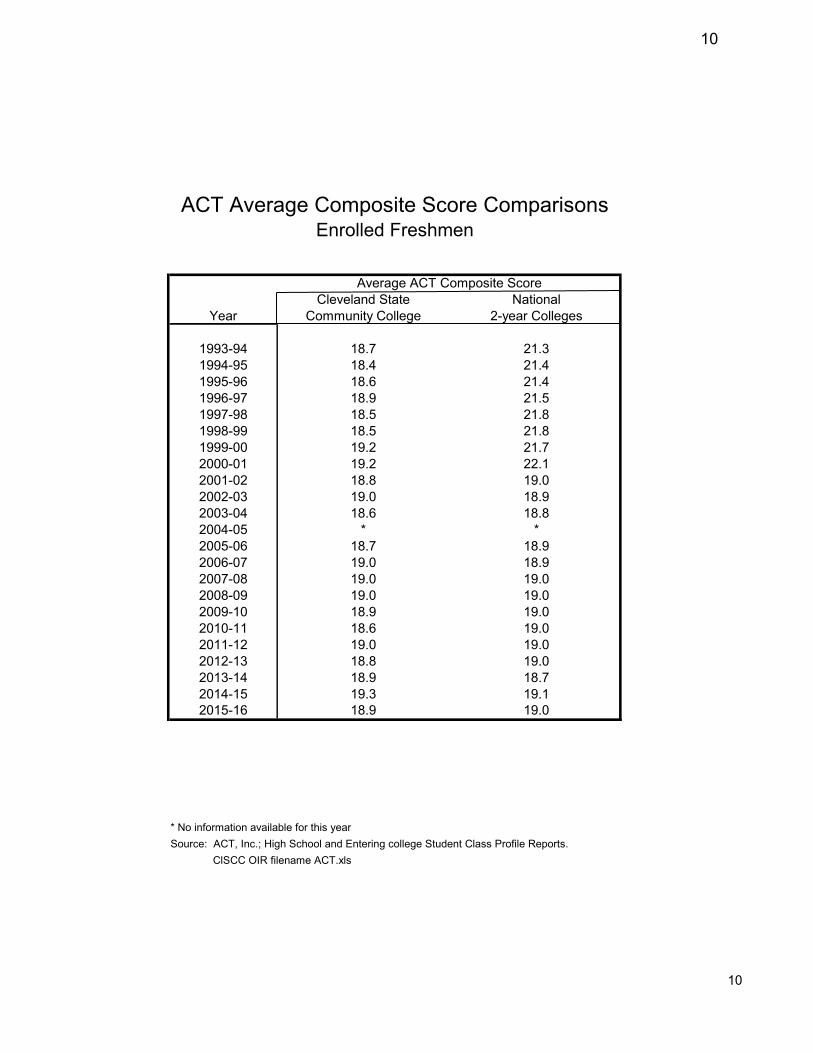
Cleveland State NationalYear Community College 2-year Colleges
1993-94 18.7 21.31994-95 18.4 21.41995-96 18.6 21.41996-97 18.9 21.51997-98 18.5 21.81998-99 18.5 21.81999-00 19.2 21.72000-01 19.2 22.12001-02 18.8 19.02002-03 19.0 18.92003-04 18.6 18.82004-05 * *2005-06 18.7 18.92006-07 19.0 18.92007-08 19.0 19.02008-09 19.0 19.02009-10 18.9 19.02010-11 18.6 19.02011-12 19.0 19.02012-13 18.8 19.02013-14 18.9 18.72014-15 19.3 19.12015-16 18.9 19.0
* No information available for this yearSource: ACT, Inc.; High School and Entering college Student Class Profile Reports. ClSCC OIR filename ACT.xls
Average ACT Composite Score
ACT Average Composite Score ComparisonsEnrolled Freshmen
10
10

Average GPA* of All Students by Term, 1988 - 2015
Year Spring Fall
1988 2.4861989 2.514 2.5301990 2.530 2.5771991 2.746 2.7271992 2.610 2.5411993 2.810 2.7501994 2.760 2.7601995 2.730 2.7401996 2.810 2.7501997 2.840 2.8101998 2.740 2.7001999 2.800 2.7402000 2.780 2.7702001 2.820 2.7502002 2.810 2.8102003 2.840 2.8102004 2.830 2.8102005 2.900 2.8702006 2.830 2.8002007 2.840 2.7902008 2.830 2.8292009 2.915 2.8752010 2.937 2.9342011 2.849 2.7322012 2.818 2.7802013 2.823 2.7642014 2.855 2.8182015 2.808 2.638
*Based upon grades earned at Cleveland State during the year andterm indicated; does not include accepted transfer work or cumulative grades.
Source: Focus, RT_CUMS_SUM.FEX; Excel Average GPA Argos: Academic Affairs/Faculty/GPA Analysis By Instructor
GPA Analysis By Term
11

Source: 14th Days Sis Enrollment Data, INRO52X: HarGraph SCH_LOADArgos: Registered Student Demographics By Student By Term
1-3 hrs 4-6 hrs 7-9 hrs 10-12 hrs 13-15 hrs 16+ hrs2011 538 444 579 1004 938 3112012 502 482 587 846 917 3062013 647 512 590 890 877 2742014 635 525 454 729 822 3572015 622 490 493 483 873 548
0
200
400
600
800
1000
1200
Credit Hour Load Per Student
2011
2012
2013
2014
2015
Fall Terms 2011 - 2015
Source: Argos: Registered Student Demographics By Term (TSTS) 14th Day excel sch_load
12

CLEVELAND STATE COMMUNITY COLLEGE
Performance Funding Score Results
2014-15 The State of Tennessee, through the Tennessee Higher Education Commission, provides incentive funding based upon documented performance in identified areas of assessment. Funding is awarded on the basis of the earned percentage of a total score. Seven criteria (“Standards”) comprise the total score. Institutions annually earn up to 5.45% of their state appropriations, prorated to the total performance funding score. Cleveland State Community College scored a total of 90 of 100 points in 2014-15. _______________________________________________________________________
Cleveland State Community College Performance for 2014-2015
Standard 1A General Education Assessment (15 of 15 points) Students scored 15.1 compared to the national average of 14.1 on
the California Critical Thinking Skills Test. Standard 1B Major Field Assessment (12 of 15 points) Institutional mean was 70.19% compared to the comparison score
of 87.44%. Standard 1C Academic Programs: Accreditation and Evaluation (13 of 15
points) All accreditable programs retained external accrediting status. Standard 1D Satisfaction Studies (Comprehensive Report)
(7 of 10 points) Standard 1E Job Placement (10 of 10 points) Standard IF Assessment Implementation (8 of 10 points) Essay on Sustaining the QEP
1. Present a short review of the QEP/SLI activity (Why it was undertaken including goals and objectives?) AND describe the actions for the year that were taken to accomplish goals and objectives. [2 out of 2 points]
13

2. Describe the assessment taken during the year and present the results of those assessments with the addition of previous results, as they are available. [3 out of 3 points]
3. Discuss how the institution is improving the QEP/SLI based on the assessment results. [2 out of 3 points]
4. Evaluate the QEP/SLI itself (what is working, what is not working) AND outline steps for next year (program implementation and assessment related). [1 out of 2 points]
Standard 2 Student Access and Student Success (25 of 25 points) Our score was based on the number of graduates from the
following subpopulations: (1) Adults, (2) Low Income, (3) African American, (4) Males, and (5) Science, Tech, Engineering, and Math (STEM) programs
Total Score All Standards Combined (90 of 100 points)
14

PERFORMANCE FUNDING; DOLLARS AWARDED, 1979 - 2015
Cycle and Year Points/100 Amount AwardedPilot Cycle
1979 34 22,3491980 59 40,6391981 56 39,4951982 80 58,763
Total for Cycle $161,246
Cycle 11983 81 147,5781984 95 205,3431985 74 166,6111986 100 249,1201987 100 244,987
Total for Cycle 1 $1,013,639
Cycle II1988 70 203,2251989 75 227,8781990 64 194,7561991 72 217,1321992 83 242,668
Total for Cycle 2 $1,085,659
Cycle III1993 95 337,5211994 79 305,3461995 92 356,3951996 89 351,4671997 86 377,088
Total for Cycle 3 $1,727,817
Cycle IV*1998 97 384,3291999 95 400,5312000 92 399,666
Total for Cycle 4 $1,184,526
Cycle V2001 93 415,7692002 96 500,7702003 98 519,5722004 98 519,5722005 95 535,649
Total for Cycle 5 $2,491,332
Cycle VI2005-06 94 586,9442006-07 93 605,3492007-08 96 646,9752008-09 92 643,7822009-10 92 675,734
Total for Cycle 6 $3,158,784
Cycle VII2010-11 91 719,0002011-12 92 704,0002012-13 89 672,0002013-14 92 706,0002014-15 90 668,939
Total for Cycle 7 3,469,939Total dollars awarded since program inception $14,292,942 Performance Funding is a statewide THEC incentive funding program assessing college performanceon graduate skills, student satisfaction, placement, enrollment diversity, accreditation, retention, graduation, and other improvement actions. Source: THEC summaries (Betty Dandridge Johnson) filename: PF dollars
15

Year Fall (Q/S) Winter (Q) Spring (Q) Spring (S) Summer (Q/S)
1967-68 681 768 770 x 461 1968-69 1,368 1,232 1,191 x 878 1969-70 1,576 1,555 1,403 x 1,066 1970-71 1,909 1,769 1,737 x 1,335 1971-72 2,170 2,097 1,838 x 1,002 1972-73 2,167 2,105 1,997 x 1,203 1973-74 2,444 2,217 2,145 x 1,250 1974-75 2,576 2,796 2,678 x 1,614 1975-76 3,116 3,016 2,710 x 1,370 1976-77 3,016 2,796 2,467 x 1,178 1977-78 3,263 3,015 2,833 x 1,222 1978-79 3,415 3,062 2,724 x 1,361 1979-80 3,180 2,926 2,511 x 1,234 1980-81 3,593 3,089 2,583 x 1,165 1981-82 3,091 3,014 2,625 x 1,087 1982-83 3,544 3,199 2,637 x 1,138 1983-84 3,663 3,012 2,714 x 968 1984-85 3,102 2,663 2,226 x 927 1985-86 3,143 2,442 2,066 x 777 1986-87 2,735 2,449 2,202 x 815 1987-88 2,978 2,430 2,143 x 1,058 1988-89 2,977 x x 2,543 1,011 1989-90 3,098 x x 2,685 1,012 1990-91 3,315 x x 2,951 1,164 1991-92 3,306 x x 3,085 1,171 1992-93 3,596 x x 3,159 1,086 1993-94 3,460 x x 2,998 968 1994-95 3,182 x x 2,840 857 1995-96 3,668 x x 2,850 800 1996-97 3,276 x x 2,922 814 1997-98 3,484 x x 2,968 785 1998-99 3,330 x x 2,806 846 1999-00 3,260 x x 2,795 891 2000-01 3,056 x x 2,740 819 2001-02 3,126 x x 2,786 826 2002-03 3,127 x x 2,890 900 2003-04 3,161 x x 2,845 806 2004-05 2,962 x x 2,670 835 2005-06 3,027 x x 2,720 718 2006-07 2,947 x x 2,631 774 2007-08 2,999 x x 2,829 938 2008-09 3,335 x x 3,121 945 2009-10 3,615 x x 3,471 1,027 2010-11 3,753 x x 3,579 1,087 2011-12 3,814 x x 3,502 1,039 2012-13 3,640 x x 3,283 920 2013-14 3,790 x x 3,297 789 2014-15 3,522 x x 3,305 787 2015-16 3,509 x x 3,132
CLEVELAND STATE COMMUNITY COLLEGEHEADCOUNT ENROLLMENT HISTORY, BY TERM*
*Conversion from Semester to Quarter system effected Spring 1988Source: 14th Day Enrollment Reports; excel filename HC Enrollment History by Term.xlsTBR Report SIS500L
16

Source: 14th Day SIS Reports Argos, FTE Headcount By Campus QV (TSTS) 14th Day
0
500
1000
1500
2000
2500
3000
3500
4000
4500
67 68 69 70 71 72 73 74 75 76 77 78 79 80 81 82 83 84 85 86 87 88 89 90 91 92 93 94 95 96 97 98 99 00 01 02 03 04 05 06 07 08 09 10 11 12 13 14 15
Complete History of Enrollment, Fall Terms 1967 - 2015
Headcount
FTE
Comparison of Headcount (HC) and Full-Time Equated (FTE)
YR FTE HC 1967 552 681 1968 1118 1368 1969 1186 1576 1970 1409 1909 1971 1506 2170 1972 1516 2167
YR FTE HC 1973 1659 2444 1974 1692 2576 1975 2051 3116 1976 1918 3016 1977 1910 3263 1978 1919 3415
YR FTE HC 1979 1804 3180 1980 2112 3593 1981 1856 3091 1982 2039 3544 1983 2034 3663 1984 1791 3102
YR FTE HC 1985 1895 3143 1986 1586 2735 1987 1708 2978 1988 1799 2977 1989 1860 3098 1990 2052 3315
YR FTE HC 1991 2137 3306 1992 2249 3596 1993 2151 3460 1994 1929 3182 1995 2204 3668 1996 2111 3276
YR FTE HC 1997 2376 3484 1998 2176 3330 1999 2158 3260 2000 2083 3056 2001 2233 3126 2002 2200 3127
YR FTE HC 2003 2224 3161 2004 2088 2962 2005 2103 3027 2006 2034 2947 2007 2022 2999 2008 2194 3335
YR FTE HC 2009 2504 3615 2010 2591 3753 2011 2609 3814 2012 2467 3640 2013 2467 3790 2014 2305 3522
YR FTE HC 2015 2370 3509 2016 2017 2018 2019 2020
17

2010 2011 2012 2013 2014 2015PT & FT Cohort 717 817 782 772 798 834FT Cohort only 647 741 688 688 714 775
2010 2011 2012 2013 2014 2015PT & FT Cohort 717 817 782 772 798 834FT Cohort only 647 741 688 688 714 775
0
100
200
300
400
500
600
700
800
900
PT & FT CohortFT Cohort onlyLinear (PT & FT Cohort)Linear (FT Cohort only)
First Time Freshman Enrollment Trends, HC Fall Semesters 2010-2015
2010 2011 2012 2013 2014PT & FT Cohort 53% 51% 52% 54% 49%FT Cohort only 58% 56% 59% 60% 54%
0%
10%
20%
30%
40%
50%
60%
70%
PT & FT CohortFT Cohort onlyLinear (PT & FT Cohort)Linear (FT Cohort only)
First Time Freshman Retention Rates Fall Semesters 2010-2014
18
0
500
1000
1500
2000
2500
3000
3500
4000
68 69 70 71 72 73 74 75 76 77 78 79 80 81 82 83 84 85 86 87 88 89 90 91 92 93 94 95 96 97 98 99 00 01 02 03 04 05 06 07 08 09 10 11 12 13 14 15 16
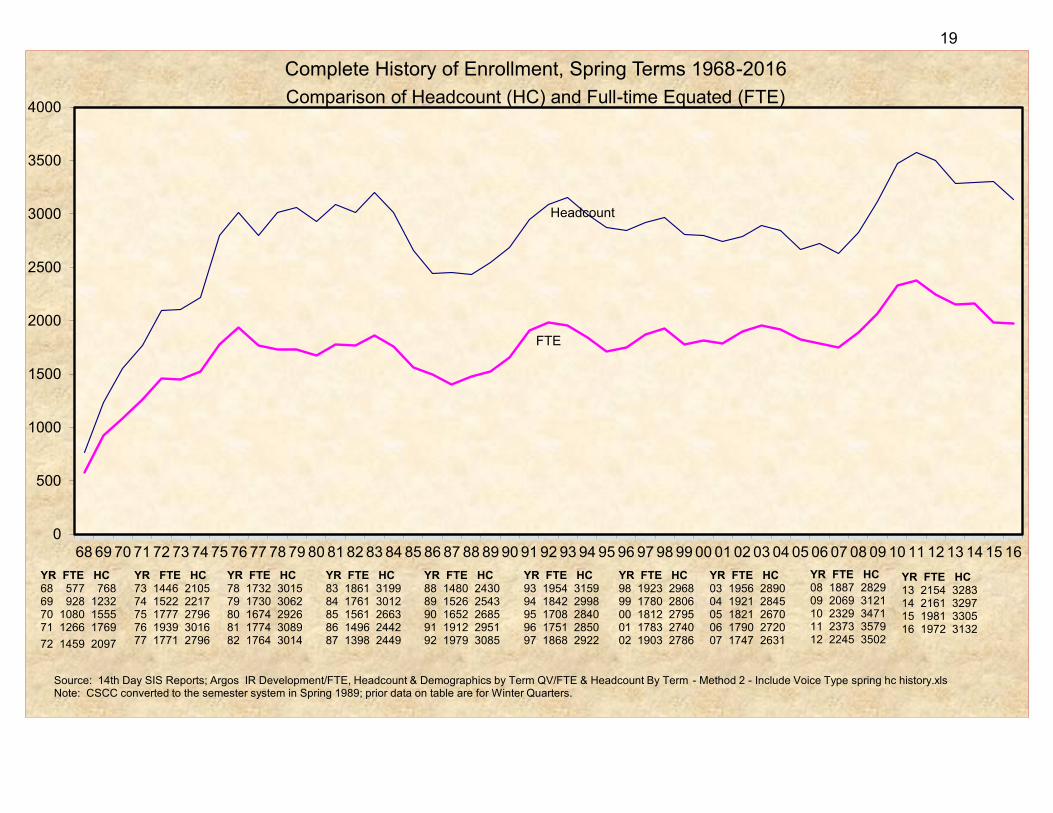
Complete History of Enrollment, Spring Terms 1968-2016 Comparison of Headcount (HC) and Full-time Equated (FTE)
YR FTE HC 68 577 768 69 928 1232 70 1080 1555 71 1266 1769 72 1459 2097
YR FTE HC 73 1446 2105 74 1522 2217 75 1777 2796 76 1939 3016 77 1771 2796
YR FTE HC 78 1732 3015 79 1730 3062 80 1674 2926 81 1774 3089 82 1764 3014
YR FTE HC 83 1861 3199 84 1761 3012 85 1561 2663 86 1496 2442 87 1398 2449
YR FTE HC 88 1480 2430 89 1526 2543 90 1652 2685 91 1912 2951 92 1979 3085
YR FTE HC 93 1954 3159 94 1842 2998 95 1708 2840 96 1751 2850 97 1868 2922
YR FTE HC 98 1923 2968 99 1780 2806 00 1812 2795 01 1783 2740 02 1903 2786
YR FTE HC 03 1956 2890 04 1921 2845 05 1821 2670 06 1790 2720 07 1747 2631
Source: 14th Day SIS Reports; Argos IR Development/FTE, Headcount & Demographics by Term QV/FTE & Headcount By Term - Method 2 - Include Voice Type spring hc history.xls Note: CSCC converted to the semester system in Spring 1989; prior data on table are for Winter Quarters.
Headcount
FTE
YR FTE HC 08 1887 2829 09 2069 3121 10 2329 3471 11 2373 3579 12 2245 3502
YR FTE HC 13 2154 3283 14 2161 3297 15 1981 3305 16 1972 3132
19

Source: Argos FTE Headcount Spring QV (TSTS) 14th Day;excel HC Spring
2012 2013 2014 2015 2016Headcount 3502 3283 3297 3305 3132FTE 2245 2154 2161 1981 1972
0
500
1000
1500
2000
2500
3000
3500
4000
Five-Year Enrollment Trends, Headcount and Full-Time Equated (FTE)
Spring Semesters, 2012-2016
20

Selected Summer Enrollment Data1990-2015
Equated StudentStudent Credit Full-Time Part-Time lst Time Undergrad(FTE) Hours Student Student Student Special
1990 379 1012 5683 79 933 61 320 386 3061991 426 1164 6385 85 1079 86 406 427 3311992 461 1171 6917 113 1058 68 351 476 3441993 403 1086 6052 94 992 72 328 465 2931994 343 968 5138 65 903 39 236 410 3221995 319 857 4779 67 790 20 314 315 2281996 325 800 4876 101 699 24 276 295 2291997 304 814 4557 75 739 44 283 318 2131998 283 785 4244 62 723 21 221 334 2301999 270 846 4048 48 798 51 295 318 2332000 308 891 4622 47 844 35 255 347 2892001 297 819 4456 44 775 44 245 340 2342002 303 826 4545 45 781 39 265 320 2412003 328 900 4913 71 829 48 361 275 2642004 292 806 4374 66 740 43 288 318 2642005 300 835 4494 60 775 47 305 321 2092006 253 718 3801 49 669 40 222 264 1922007 270 774 4050 53 721 51 284 288 2022008 340 938 5104 61 877 36 308 343 2872009 353 945 5298 86 859 53 327 377 2412010 408 1027 6115 98 929 69 378 422 2272011 475 1159 7130 129 1030 144 412 450 2972012 417 1039 6248 103 936 132 370 399 2702013 329 920 4449 41 879 41 250 401 2692014 289 789 3975 39 750 47 204 384 2012015 285 787 3982 38 749 35 225 358 204
Term/Year Headcount Freshman Sophomore
Source: Argos/IR Development/TBR Legacy Enrollment/DEGREE_CREDIT QV
21

Source: Argos/IR Development/TBR Legacy Enrollment/DEGREE_CREDIT_QVSum-enr.xl
Summer 2011 Summer 2012 Summer 2013 Summer 2014 Summer 2015Headcount 1159 1039 920 789 787FTE 475 417 329 289 285
0
200
400
600
800
1000
1200
1400
Five-Year Summer Enrollment Trends: Headcount and FTE 2011- 2015
22

Source: Argos: Registered Student Demographcis 14th Day (TSTS) Fact Book/enr res
Bradley Hamilton McMinn Meigs Monroe Polk OtherFall 2011 1900 197 798 201 293 270 155Fall 2012 1879 196 730 175 234 246 180Fall 2013 1886 192 787 204 284 240 197Fall 2014 1821 174 721 179 265 201 161Fall 2015 1699 205 672 161 348 238 186
0
200
400
600
800
1000
1200
1400
1600
1800
2000
Headcount Enrollment by County of Residence
Fall 2011
Fall 2012
Fall 2013
Fall 2014
Fall 2015
Fall Terms 2011 - 2015
23

Tennessee Residents Other States/County Subtotal Countries Subtotal Total
Benton 1 Alabama 3Bledsoe 3 Bahamas 1Blount 7 Canada 1Bradley* 1699 Florida 1Carter 1 Georgia 67Davidson 5 India 1Decatur 2 Kentucky 2Grundy 1 Lithuania 1Hamilton 205Hawkins 1Henry 1Humphreys 1Knox 12Lincoln 1Loudon 17Madison 1Marion 4Maury 3McMinn* 672Meigs* 161Monroe* 348Montgomery 1Polk* 238Putnam 1Rhea 24Roane 8Robertson 1Rutherford 2Sevier 2Shelby 2Van Buren 1Warren 1Weakley 1White 2Williamson 2
Subtotals 3432 77GRAND TOTAL ALL STUDENTS 3509
HEADCOUNT ENROLLMENT BY LEGAL RESIDENCEALL STUDENTS- FALL 2015
*Service Area CountiesSource: Argos FTE Student Demographics Fact Book Enr by Legal Residence
24

Source: TBR Program ID SIS500LB, Argos: Registered Student Demographics Excel: Fact Book credit hc by student class,
First-timeFreshmen
ReturningFreshmen Sophomores Undergrad/Spec
Fall 2012 731 951 1081 877Fall 2013 743 852 1120 1075Fall 2014 756 730 1050 986Fall 2015 834 838 960 877
0
200
400
600
800
1000
1200
Credit Headcount by Student Classification
Fall 2012
Fall 2013
Fall 2014
Fall 2015
Fall Terms 2011-2015
25

Fall 2011 Fall 2012 Fall 2013 Fall 2014 Fall 2015Transfer 1472 1375 1379 1262 1245Technical 1715 1684 1600 1472 1392Non-Degree 627 581 811 788 872
0
200
400
600
800
1000
1200
1400
1600
1800
2000
Hea
dcou
nt E
nrol
lmen
t Enrollment Trend: Transfer, Technical, Non-Degree Majors
Transfer
Technical
Non-Degree
Note: Transfer = AA + AS+AFA+AST; Technical = AAS + Certificate; None = all others taking credit courses Source: Argos: Registered Student Demographics
Fall Terms, 2011 - 2015
26

2011 2012 2013 2014 2015Associate of Arts General 87 90 78 73 64 Art 37 15 1 Music 23 18 1 Regents On-Line Degree AA 4 6 2 3 Tennessee Transfer Path- Art Studio 1 13 20 22 24 Tennessee Transfer Path - Foreign Language 1 8 6 9 Tennessee Transfer Path - English 4 18 17 Tennessee Transfer Path - Music 6 12 14Total AA 153 154 132 136 102
Associate of Science General 354 282 290 235 231 Agriculture 19 23 6 2 Business Admin. 114 37 8 5 Criminal Justice 98 28 5 2 1 Education 136 114 94 85 84 Forestry, Wildlife, Fish 4 26 42 Health, PE, Rec. 28 20 24 1 1 History 20 7 Human Services/SWOK 90 44 21 27 32 Math 4 2 Math Opt.-Computer Sc 23 16 12 16 Natural Science 36 19 8 3 3 Physical Sc - Chem 7 1 1 Physical Sc - Physics 3 Pre-Computer Science 17 Pre-Dental Hygiene 31 28 28 24 26 Pre-Dental 9 2 Pre Med 47 21 2 1 Pre-Engineering 53 17 3 Pre-Health Professions 1 Pre-Law 23 14 12 8 6 Pre-Medical Tech. 13 12 13 10 8 Pre-Pharmacy 29 5 Pre-Physical Therapy 75 27 2 1 Veterinary Assistant 29 35 29 30 27 Regents On-Line Degree AS 15 12 2 5 2 Tennessee Transfer Path - Accounting 1 13 28 23 24 Tennessee Transfer Path - Agricultural Animal Science 12 12 14 Tennessee Transfer Path - Biology 19 31 38 30 Tennessee Transfer Path _ Business Administration 8 66 121 88 86 Tennessee Transfer Path _ Chemistry 27 40 37 11 Tennessee Transfer Path - Civil Engineering 2 16 11 17 37 Tennessee Transfer Path - Criminal Justice 1 44 77 62 80 Tennessee Transfer Path - Economics 2 2 5 Tennessee Transfer Path - Electrical Engineering 22 31 33 38 Tennessee Transfer Path - English 14 Tennessee Transfer Path - Exercise Science 4 13 24 Tennessee Transfer Path - Foreign Language 7 Tennessee Transfer Path - History 13 17 16 16 Tennessee Transfer Path - Information Systems 1 2 3 2 5 Tennessee Transfer Path - Kinesiology 1 2 7 Tennessee Transfer Path - Mass Communication 5 7 8 8 18 Tennessee Transfer Path - Mathematics 1 6 8 8 5 Tennessee Transfer Path - Political Science 3 6 5 4 Tennessee Transfer Path - Physics 1 3 2 3 Tennessee Transfer Path - Pre-Health Professions 1 55 69 79 56 Tennessee Transfer Path-Nursing 9 14 Tennessee Transfer Path - Pre-Occupational Therapy 6 5 12 13 Tennessee Transfer Path - Pre-Physical Therapy 1 49 74 51 31 Tennessee Transfer Path - Psychology 7 48 58 59 70 Tennessee Transfer Path - Social Work 3 31 43 42 26 Tennessee Transfer Path - Sociology 1 4 8 7
Total AS 1287 1197 1220 1112 1121
Assoc of Sc in Teaching 29 24 16 14 22 Total General Transfer 1469 1375 1368 1262 1245
continued
Fall Semester Headcount Enrollment by Student Choice of Majorand Concentration Area: 2011 - 2015
General Transfer
27

2011 2012 2013 2014 2015Business and Management Accounting 50 49 26 19 Business 119 133 146 64 Computers & Info. System 35 30 23 19 Health Care Management 29 28 23 11 Management 15 5 9 7 Small Business Mgmt 17 15 12 5 RODP AAS 15 6 9 4 2Total Business & Mgmt 280 266 248 129 2
Business Effective Fall 2014 Accounting 8 31 Business 51 118 Computers & Info. System 11 32 Health Care Management 14 16 Management 9 7 Small Business Mgmt 1 10Total Business 0 0 0 94 214
Industrial Technology Chemical Process-Technology 4 2 7 1 Computer Info. Tech 43 47 60 70 67 Construction 16 7 11 9 6 Drafting/Design 29 29 24 25 22 Electronics 13 9 5 12 11 Electro/Mechanical 31 35 37 22 27 Industrial Process 1 5 Operations Technician 3 2 1 Web Technology RODPTotal Industrial Tech 139 131 144 141 138
General Technology Applied Technology 5 8 6 9 10 Business Technology 4 6 5 8 3Total General Technology 9 14 11 17 13
Early Childhod Education 132 119 115 95 84Early Childhood Educ RODP 2Public & Govt Services Criminal Justice 25 49 47 42 33 Legal Admin Asst 25 20 15 11 10
Health Sciences 1 4 14Pre-Nursing 537 519 503 487 408 Pre-Nursing RODPNursing 179 233 199 170 164 Nursing - RODP Nursing - Tennessee Transfer Path 10Medical Informatics 1Paramedic 14Office Systems Admin. Medical Assistant 9 17 30 29 44 Medical Office Assistant 2 13 28 Pre-Medical Office Asst. 53 47 29 26 21 Office Administration 27 19 22 23 15 Office Application Asst 4 7 7 8 5 Medical Transcriptionist 19 14 6 4 1AAS Programs in Phase-Out
Total AAS 1438 1455 1376 1199 1209Total AA, AS, AAS Degrees 2907 2830 2744 2461 2454
continued
Fall Semester Headcount Enrollment by Student Choice of Majorand Concentration Area: 2011 - 2015
Associate of Applied Science
28

2011 2012 2013 2014 2015Office Systems Administration Coding Spec 33 14 3 1 Gen Offc Asst 14 8 11 3 6 Legal Offc Clerk 6 2 2 2 Medical Office Clerk 20 15 17 9 7
Workforce Preparedness: Bus Accounting 7 3 3 Business and Management 9 11 Computer Business Applic 2 4 3 Customer Service 13 17 11 Small Business 2 Supervisory Management 6 2 1 Information Systems Applic 2 1Workforce Preparedness: Tech Architectural 2 1 Civil Technology Construction 2 Mechanical 1 Climate Control 16 17 Construction Survey 1 Electro-Mechanical Maintenance 16 2 Network Sys - Administration Network Sys - Design 1
Business Accounting 3 2 Business and Management 16 14 Computer Business Applic 2 Customer Service 15 16
Early Childhood Education Early Childhood Education 6 5 3Industrial Technology Architectural Design Technical 1 2 1 1 2 Civil Technology 1 Climate Control 9 10 9 Construction Applications 1 2 Electrical Maint Fundamentals Technical 1 11 31 5 7 Industrial Automation Fundamentals 2 1 Mechanical Drafting 2 Mechanical Maintenance Fundamentals 6 2 4 4 Network Systems Design 4 1 4 Process Control Fundamentals 1 1 1 1 Zero Energy Housing Technical 1 1 2
Law Enforcement Training 51 52 56 46 36Emergency Medical Services 80 60 48 2Emergency Medical Technician 48 59Advanced Emergency Medical Technician 5 Regents On-line Certificate 1
Total Certificates 277 228 222 177 183
Total All Degrees & Certificates 3184 3058 2966 2638 2637continued
Fall Semester Headcount Enrollment by Student Choice of Majorand Concentration Area: 2011 - 2015
Certificates
Embedded Certificates
29

2011 2012 2013 2014 2015
Undergraduate Special (N) Special Student 142 86 83 54 59 Certified Nursing Assistant Early Admission 441 471 710 721 803 Non-High School Grad Emerg. Med. Tech (EMT) Peace Officer Trng (POST) Tran-Spec (Transient) 34 21 16 13 10 Corsortium: Special Student Fundamentals in Tech. Degree Eligible Child Development Assoc 10 3 3
Total Undergrad Spec. (N) 627 581 812 788 872
Undeclared Students (U) 5 3 1 GRAND TOTAL, ALL STUDENTS 3816 3642 3778 3427 3509
Source: 14th Day SIS Reports; INR015X; Excel FB Headcount Enrollment by Student Choice
Fall Semester Headcount Enrollment by Student Choice of Majorand Concentration Area: 2011 - 2015
Undergraduate Specials
Argos: Registerd Student Demographics by ID with ProgramStudent Hours By Major By Term QV (TSTS) 14th Day
30
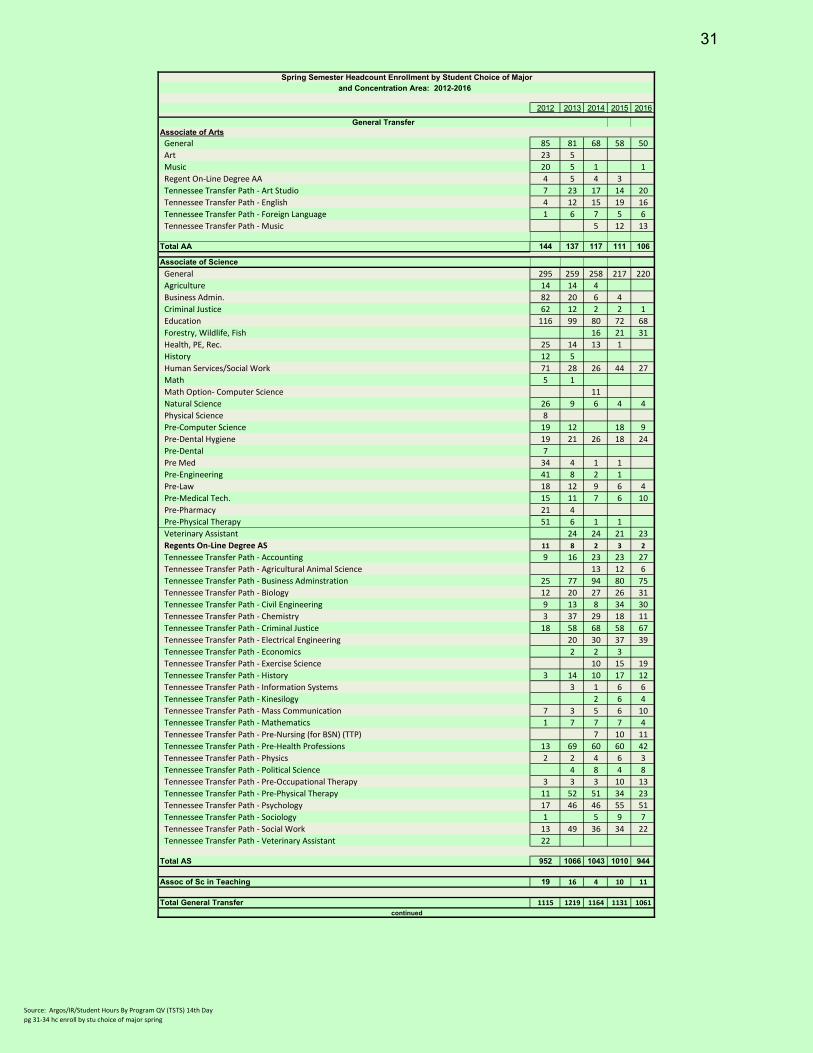
2012 2013 2014 2015 2016
Associate of Arts General 85 81 68 58 50
Art 23 5
Music 20 5 1 1
Regent On-Line Degree AA 4 5 4 3
Tennessee Transfer Path - Art Studio 7 23 17 14 20
Tennessee Transfer Path - English 4 12 15 19 16
Tennessee Transfer Path - Foreign Language 1 6 7 5 6
Tennessee Transfer Path - Music 5 12 13
Total AA 144 137 117 111 106
Associate of Science General 295 259 258 217 220
Agriculture 14 14 4
Business Admin. 82 20 6 4
Criminal Justice 62 12 2 2 1
Education 116 99 80 72 68
Forestry, Wildlife, Fish 16 21 31
Health, PE, Rec. 25 14 13 1
History 12 5
Human Services/Social Work 71 28 26 44 27
Math 5 1
Math Option- Computer Science 11
Natural Science 26 9 6 4 4
Physical Science 8
Pre-Computer Science 19 12 18 9
Pre-Dental Hygiene 19 21 26 18 24
Pre-Dental 7
Pre Med 34 4 1 1
Pre-Engineering 41 8 2 1
Pre-Law 18 12 9 6 4
Pre-Medical Tech. 15 11 7 6 10
Pre-Pharmacy 21 4
Pre-Physical Therapy 51 6 1 1
Veterinary Assistant 24 24 21 23
Regents On-Line Degree AS 11 8 2 3 2
Tennessee Transfer Path - Accounting 9 16 23 23 27
Tennessee Transfer Path - Agricultural Animal Science 13 12 6
Tennessee Transfer Path - Business Adminstration 25 77 94 80 75
Tennessee Transfer Path - Biology 12 20 27 26 31
Tennessee Transfer Path - Civil Engineering 9 13 8 34 30
Tennessee Transfer Path - Chemistry 3 37 29 18 11
Tennessee Transfer Path - Criminal Justice 18 58 68 58 67
Tennessee Transfer Path - Electrical Engineering 20 30 37 39
Tennessee Transfer Path - Economics 2 2 3
Tennessee Transfer Path - Exercise Science 10 15 19
Tennessee Transfer Path - History 3 14 10 17 12
Tennessee Transfer Path - Information Systems 3 1 6 6
Tennessee Transfer Path - Kinesilogy 2 6 4
Tennessee Transfer Path - Mass Communication 7 3 5 6 10
Tennessee Transfer Path - Mathematics 1 7 7 7 4
Tennessee Transfer Path - Pre-Nursing (for BSN) (TTP) 7 10 11
Tennessee Transfer Path - Pre-Health Professions 13 69 60 60 42
Tennessee Transfer Path - Physics 2 2 4 6 3
Tennessee Transfer Path - Political Science 4 8 4 8
Tennessee Transfer Path - Pre-Occupational Therapy 3 3 3 10 13
Tennessee Transfer Path - Pre-Physical Therapy 11 52 51 34 23
Tennessee Transfer Path - Psychology 17 46 46 55 51
Tennessee Transfer Path - Sociology 1 5 9 7
Tennessee Transfer Path - Social Work 13 49 36 34 22
Tennessee Transfer Path - Veterinary Assistant 22
Total AS 952 1066 1043 1010 944
Assoc of Sc in Teaching 19 16 4 10 11
Total General Transfer 1115 1219 1164 1131 1061
Spring Semester Headcount Enrollment by Student Choice of Major
General Transfer
and Concentration Area: 2012-2016
continued
Source: Argos/IR/Student Hours By Program QV (TSTS) 14th Day
pg 31-34 hc enroll by stu choice of major spring
31
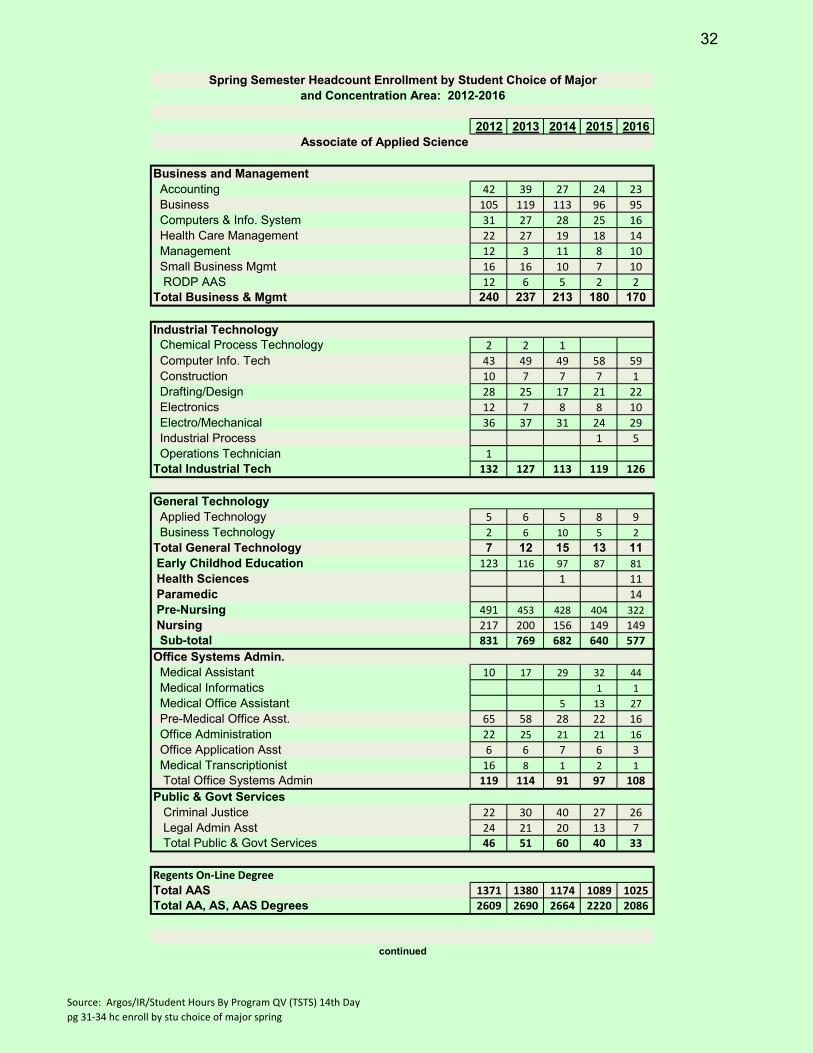
2012 2013 2014 2015 2016
Business and Management Accounting 42 39 27 24 23
Business 105 119 113 96 95
Computers & Info. System 31 27 28 25 16
Health Care Management 22 27 19 18 14
Management 12 3 11 8 10
Small Business Mgmt 16 16 10 7 10
RODP AAS 12 6 5 2 2
Total Business & Mgmt 240 237 213 180 170
Industrial Technology Chemical Process Technology 2 2 1
Computer Info. Tech 43 49 49 58 59
Construction 10 7 7 7 1
Drafting/Design 28 25 17 21 22
Electronics 12 7 8 8 10
Electro/Mechanical 36 37 31 24 29
Industrial Process 1 5
Operations Technician 1
Total Industrial Tech 132 127 113 119 126
General Technology Applied Technology 5 6 5 8 9
Business Technology 2 6 10 5 2
Total General Technology 7 12 15 13 11 Early Childhod Education 123 116 97 87 81
Health Sciences 1 11
Paramedic 14
Pre-Nursing 491 453 428 404 322
Nursing 217 200 156 149 149 Sub-total 831 769 682 640 577
Office Systems Admin. Medical Assistant 10 17 29 32 44
Medical Informatics 1 1
Medical Office Assistant 5 13 27
Pre-Medical Office Asst. 65 58 28 22 16
Office Administration 22 25 21 21 16
Office Application Asst 6 6 7 6 3
Medical Transcriptionist 16 8 1 2 1
Total Office Systems Admin 119 114 91 97 108
Public & Govt Services Criminal Justice 22 30 40 27 26
Legal Admin Asst 24 21 20 13 7 Total Public & Govt Services 46 51 60 40 33
Regents On-Line Degree
Total AAS 1371 1380 1174 1089 1025Total AA, AS, AAS Degrees 2609 2690 2664 2220 2086
Associate of Applied Science
continued
Spring Semester Headcount Enrollment by Student Choice of Majorand Concentration Area: 2012-2016
Source: Argos/IR/Student Hours By Program QV (TSTS) 14th Day
pg 31-34 hc enroll by stu choice of major spring
32

2012 2013 2014 2015 2016
Emergency Medical Technician 61 47 49 19 17
Advanced Emergency Medical Technician 22 13
Law Enforcement Training 27 21 16 17 16
Office Systems Administration Office Careers Coding Spec 24 15 1 1
Office Careers Gen Offc Asst 14 8 8 6 4
Office Careers Legal Offc Clerk 5 4 4
Medical Office Clerk 18 17 16 6 9
Workforce Preparedness: Bus Accounting 4 3 4
Business & Management 12 7
Computer Business Applic 2 3 2
Customer Service 8 13 10
Information Systems Applic 1 1
Quality Management
Retailing Emphasis
Small Business
Supervisory Management 4 1
Workforce Preparedness: Tech Architectural 2 1
Climate Control 10 13 9
Civil Technology 2
Construction 1 1
Construction Survey 1
Electro Mechanical Tech 8
Mechanical 1
Network System Admin 4
Embedded Certificates Accounting 1 2 2
Architectural Design 1 1 3 3
Business & Management 5 16 15
Climate Control 2 9 5
Computer Business Applications 1
Construction Applications 2
Customer Service 3 15 15
Early Childhood Education 2 7 9 2
Electircal Maint Fundamentals 2 38 23 8 15
Industrial Automation Fundamentals 1 2 2 2
Mechanical Drafting 1 3 1
Mechanical Maint Fundamentals 1 5 4 4 3
Network Systems Design 1 1 2 5
Process Control Fundamentals 1 1
Zero Energy Housing 2 1
Regents Online Degree- CRT 1 1
Certificates in Phase-Out
Total Certificates 160 210 168 148 131
Total AA, AS, AAS Degrees 2690 2664 2538 2318 2086
Total All Degrees & Certificates 2850 2874 2706 2466 2217
Spring Semester Headcount Enrollment by Student Choice of Majorand Concentration Area: 2012-2016
continued
Certificates
Source: Argos/IR/Student Hours By Program QV (TSTS) 14th Day
pg 31-34 hc enroll by stu choice of major spring
33
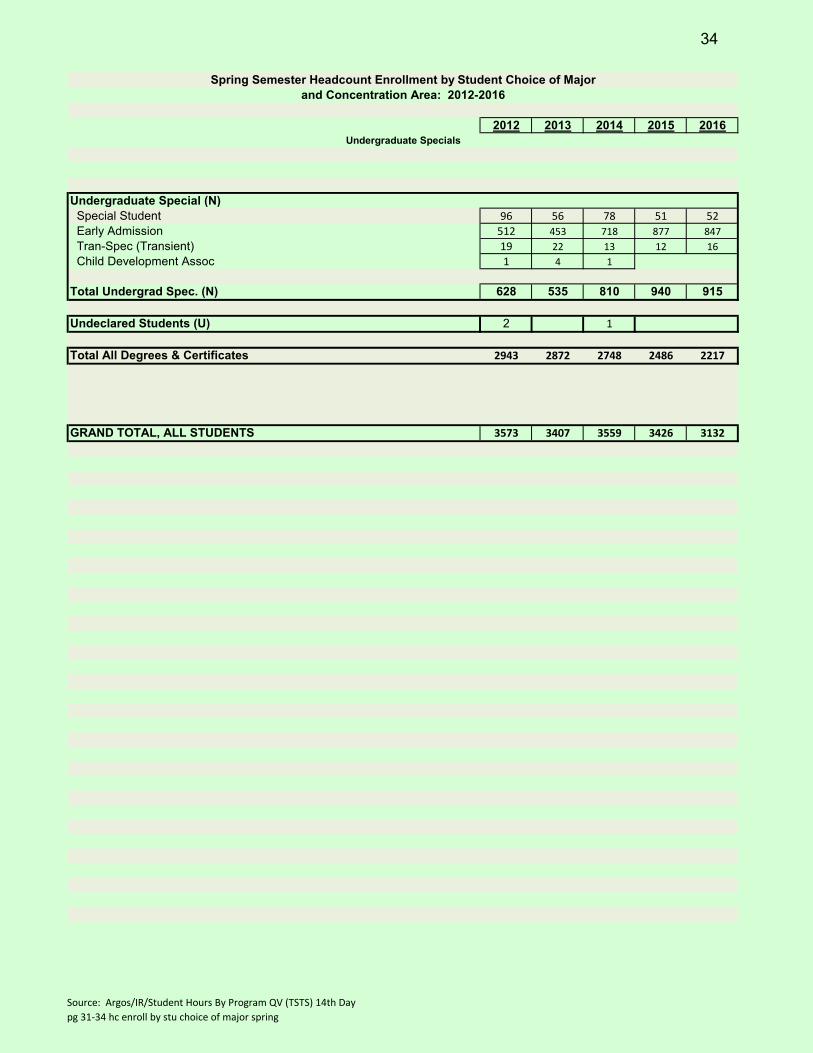
2012 2013 2014 2015 2016
Undergraduate Special (N) Special Student 96 56 78 51 52
Early Admission 512 453 718 877 847
Tran-Spec (Transient) 19 22 13 12 16
Child Development Assoc 1 4 1
Total Undergrad Spec. (N) 628 535 810 940 915
Undeclared Students (U) 2 1
Total All Degrees & Certificates 2943 2872 2748 2486 2217
GRAND TOTAL, ALL STUDENTS 3573 3407 3559 3426 3132
Spring Semester Headcount Enrollment by Student Choice of Majorand Concentration Area: 2012-2016
Undergraduate Specials
Source: Argos/IR/Student Hours By Program QV (TSTS) 14th Day
pg 31-34 hc enroll by stu choice of major spring
34

Source: 14th Day Registered Student Demographics by Term and ID from Banner TSTS
0
500
1000
1500
2000
2500
3000
3500
4000
4500
Fall 2011 Fall 2012 Fall 2013 Fall 2014 Fall 2015Part-time 1697 1720 1905 1737 1762Full-time 1689 2031 2131 2117 1920
Full-time and Part-time Credit Headcount Enrollment
Full-time Part-time
Fall Terms 2011- 2015
53% 50%
47% 50%
51%
49% 43%
57%
44%
56%
35

Fall 2010
Fall 2011
3814
Fall 2012
3640
Fall 2013
3790
Fall 2014
3322
Fall 2015
3509
Day/Evening 763 686 633 635 621 632
Evening Only 278 277 254 244 192 225
Day Only 1307 1378 1376 1561 1624 1691
Independent Only** 243 101 90 111 88 86
Day/Independent** 458 444 428 466 336 300
Evening/Independent** 287 217 192 155 131 107
Day/Evening/Indep** 417 359 290 281 206 179
Day/Evening/RODP 49 36 38 36 37
Day/Evening/Indep/RODP 14 10 16 13 3
Day/RODP 60 61 59 75 64
Day/Indep/RODP 37 49 37 32 26
Evening/RODP 33 45 42 31 23
Evening/Indep/RODP 20 22 19 22 18
Indep/RODP 38 39 34 42 37
RODP 101 115 92 71 81
Unclassified 2 3509
Fall 2011
3814
Fall 2012
3640
Fall 2013
3790
Fall 2014
3322
Fall 2015
3509
Day/Evening % 20.3% 18.0% 17.4% 16.8% 16.4%
Evening Only % 7.4% 7.3% 7.0% 6.4% 5.1%
Day Only % 34.8% 36.1% 37.8% 41.2% 42.8%
Independent Only 6.5% 2.6% 2.5% 2.9% 2.3%
Day/Independent 12.2% 11.6% 11.8% 12.3% 8.9%
Evening/Independent 7.6% 5.7% 5.3% 4.1% 3.5%
Day/Evening/Indep 11.1% 9.4% 8.0% 7.4% 5.4%
Day/Evening/RODP 1.3% 1.0% 1.0% 0.9%
Day/Evening/Indep/RODP 0.4% 0.3% 0.4% 0.3%
Day/RODP 1.6% 1.7% 1.6% 2.0%
Day/Indep/RODP 1.0% 1.3% 1.0% 0.8%
Evening/RODP 0.9% 1.2% 1.1% 0.8%
Evening/Indep/RODP 0.5% 0.6% 0.5% 0.6%
Indep/RODP 1.0% 1.1% 0.9% 1.1%
RODP 2.6% 3.2% 2.4% 1.9%
Unclassified 0.0% 0.0% 0.0% 0.0% 0.0%
100.0% 100.0% 100.0% 0.0% 0.0%
Total Headcount 3753 3814 3640 3790 3522
Day/Evening Evening Only Day Only Independent Only** Day/Independent** Evening/Independent** Day/Evening/Indep**
Fall 2012 3640
633 254 1376 90 428 192 290
Fall 2013 3790
635 244 1561 111 466 155 281
Fall 2014 3322
621 192 1624 88 336 131 206
Fall 2015 3509
632 225 1691 86 300 107 179
0
200
400
600
800
1000
1200
1400
1600
1800
Student Counts by Session Type Combinations Fall 2012 - Fall 2015
Day/Evening/RODPDay/Evening/Indep/R
ODPDay/RODP Day/Indep/RODP Evening/RODP Evening/Indep/RODP Indep/RODP RODP
Fall 20123640
36 10 61 49 45 22 39 115
Fall 20133790
38 16 59 37 42 19 34 92
Fall 20143322
36 13 75 32 31 22 42 71
Fall 20153509
37 3 64 26 23 18 37 81
0
20
40
60
80
100
120
140
Student Counts by Session Type Combinations Fall 2012- 2015
Source: Argos/Headcount By Session Type (TSTS) 14th day
**IDEPENDENT STUDY courses are completed without class attendance and must be completed by end of term. The subject content objectives to be achieved are decided by the instructor and student.
36

Spring 20113579
Spring 20123502
Spring 20133283
Spring 20143297
Spring 20153305
Spring 20163132
Day Only 1191 1269 1143 1432 1563 1513Evening Only 303 309 235 205 207 149Day & Evening 705 562 524 512 455 448Independent Only** 223 82 75 69 86 84Day/Independent** 485 384 407 302 352 335Evening/Independent** 270 180 154 140 92 113Day/Evening/Indep** 402 323 280 208 212 179Day/Evening/RODP 36 41 64 36 29Day/Evening/Indep/RODP 11 24 14 16 6Day/RODP 102 99 112 82 88Day/Indep/RODP 45 58 46 49 50Evening/RODP 47 44 41 30 22Evening/Indep/RODP 11 18 20 12 11Indep/RODP 41 42 34 25 37RODP 100 112 88 88 68Unclassified 0 27 10Total Headcount 3579 3502 3283 3297 3305 3132Day/Evening % 19.7% 16.0% 16.0% 15.5% 47.3% 45.8%Evening Only % 8.5% 8.8% 7.2% 6.2% 6.3% 4.5%Day Only % 33.3% 36.2% 34.8% 43.4% 13.8% 13.6%Independent Only 6.2% 2.3% 2.3% 2.1% 2.6% 2.5%Day/Independent 13.6% 11.0% 12.4% 9.2% 10.7% 10.1%Evening/Independent 7.5% 5.1% 4.7% 4.2% 2.8% 3.4%Day/Evening/Indep 11.2% 9.2% 8.5% 6.3% 6.4% 5.4%***Day/Evening/RODP 1.0% 1.2% 1.9% 1.1% 0.9%***Day/Evening/Indep/RODP 0.3% 0.7% 0.4% 0.5% 0.2%***Day/RODP 2.9% 3.0% 3.4% 2.5% 2.7%***Day/Indep/RODP 1.3% 1.8% 1.4% 1.5% 1.5%***Evening/RODP 1.3% 1.3% 1.2% 0.9% 0.7%***Evening/Indep/RODP 0.3% 0.5% 0.6% 0.4% 0.3%***Indep/RODP 1.2% 1.3% 1.0% 0.8% 1.1%***RODP 2.9% 3.4% 2.7% 2.7% 2.1%Unclassified 0.0% 0.0% 0.8% 0.3% 0.0% 0.0%
100.0% 100.0% 100% 100.0% 100.0% 94.8%Total Headcount 3579 3502 3283 3297 3132
0
200
400
600
800
1000
1200
1400
1600
Day Only Evening Only Day & Evening Independent Only** Day/Independent** Evening/Independent** Day/Evening/Indep**
Spring 20123502
1269 309 562 82 384 180 323
Spring 20133283
1143 235 524 75 407 154 280
Spring 20143297
1432 205 512 69 302 140 208
Spring 20153305
1563 207 455 86 352 92 212
Spring 20163132
1513 149 448 84 335 113 179
Student Counts by Session Type Combinations Spring 2012-2016
0
20
40
60
80
100
120
Day/Evening/RODP Day/Evening/Indep/RODP Day/RODP Day/Indep/RODP Evening/RODP Evening/Indep/RODP Indep/RODP RODP
Spring 20123502
36 11 102 45 47 11 41 100
Spring 20133283
41 24 99 58 44 18 42 112
Spring 20143297
64 14 112 46 41 20 34 88
Spring 20153305
36 16 82 49 30 12 25 88
Spring 20163132
29 6 88 50 22 11 37 68
Spring Counts by Session Type Combinations Spring 2012-2016
**INDEPENDENT STUDY courses are completed withut class attendance and must be completed by end of term. The subject content, objectives to be achieved,are decided by the instructor and student.
37

Off-Campus Site HC SCH FTE HC SCH FTE HC SCH FTE HC SCH FTE
Bradley Central High School 65 222 14.8 74 225 15 50 150 10.0 68 213 14.2Bnradley County Sherriff Office 15 186 12.4Cleveland High School 56 177 11.8 84 264 17.6 39 117 7.8 51 153 10.2Cooper Basin High School 5 15 1 12 36 2.4McMinn County High School 105 516 34.4 123 651 43.4 104 483 32.2 114 544 36.3McMinn Central High School 76 288 19.2 102 366 24.4 87 375 25.0 88 417 27.8Meigs County High School 29 95 6.3 66 300 20.0 74 303 20.2 75 315 21.0Polk County High School 39 204 13.6 38 225 15 42 207 13.8 47 183 12.2Walker Valley High School 61 183 12.2 49 147 9.8 33 99 6.6 23 69 4.6Whirlpool (Formely Magic Chef ) 27 192 12.8 9 81 5.4 14 123 8.2 10 87 5.8Classic Bowling LanesAthens Day Instructional Facility 584 4030 269 554 3586 239 494 3103 206.9 403 3041 202.7Caywood School of Karate 18 18 1.2 15 15 1 11 11 0.7 6 6 0.4Sequoyah High School 52 186 12.4 78 240 16 61 210 14.0 89 416 27.7Sweetwater High School 32 110 7.3 31 99 6.6 56 303 20.2Tellico Plains High School 26 81 5.4 41 123 8.2 52 280 18.7
Total 1112 6111 407.4 1255 6306 420.4 1081 5403 360.2 1109 6249 416.6
Note: FTE is rounded to the nearest whole numberNote: This is a seat count. A student may be taking one or more classes at one or mutliple locations.
Enrollment at Off-Campus Teaching SitesFALL SEMESTERS
**Source: TBR MV_Legacy_Enrollment/Degree Credit Enrollment by Location. Previous data had been taken from Argos/Institutional Research/Headcount by Campus QV which included duplicated headcounts at each site. This page was changed to reflect unduplicated headcount at each site as reported by TBR January 15, 2015.
20152012 2013 2014
Source: TBR Report MV_Legacy_Enrollment/ Degree Credit Enrollment by Location excel Fact Book hc_sch_fte by site.
38

Off-Campus Site HC SCH FTE HC SCH FTE HC SCH FTE HC SCH FTE HC SCH FTE
Athens Day Instructional Facility 549 3694 246.3 502 3396 226.4 454 2789 185.9 393 2245 149.7 419 2640 176.0Bradley Central High School 73 255 17.0 45 141 9.4 44 141 9.4 34 117 7.8 41 132 8.8Bradley County Sheriff's Office 12 144 9.6Cataloochee Ski Area 5 6 0.4 7 7 0.5 0.0Caywook School of Karate 17 19 1.3Shamblin's School of Karate 29 29 1.9 9 9 0.6 18 18 1.2 12 12 0.8 0.0Classic Bowling Lanes 10 10 0.7 0.0Cleveland High School 28 84 5.6 9 27 1.8 24 72 4.8 81 258 17.2 61 199 13.3Copper Basin High School 0.0 6 18 1.2 24 72 4.8 23 69 4.6Whirlpool (Formerly Magic Chef ) 28 219 14.6 14 117 7.8 11 93 6.2 14 126 8.4 10 60 4.0McMinn Central High School 73 240 16.0 77 288 19.2 120 438 29.2 85 377 25.1 86 405 27.0McMinn County High School 79 348 23.2 98 458 30.5 117 620 41.3 102 487 32.5 105 487 32.5Meigs County High School 40 135 9.0 37 150 10.0 67 264 17.6 69 250 16.7 69 258 17.2Polk County High School 41 147 9.8 45 207 13.8 64 207 13.8 57 204 13.6 69 265 17.7Sequoyah High School 39 141 9.4 14 42 2.8 49 162 10.8 62 192 12.8 0.0Sweetwater High School 5 15 1.0 34 113 7.5 31 96 6.4 94 438 29.2Tellico Plains High School 27 93 6.2 45 135 9.0 54 281 18.7Walker Valley High School 117 378 25.2 52 156 10.4 47 150 10.0 66 198 13.2 39 117 7.8
Total 1116 5701 380.1 909 4998 333.2 1082 5178 345.2 1075 4769 317.9 1099 5514 367.6
Note: FTE is rounded to the nearest whole numberNote: This is a seat count. A student may be taking one or more classes at one or mutliple locations.
Enrollment at Off-Campus Teaching SitesSpring Semesters
2012
**Source: TBR MV_Legacy_Enrollment/Degree Credit Enrollment by Location. Previous data had been taken from Argos/Institutional Research/Headcount by Campus QV which included duplicated headcounts at each site. This page was changed to reflect unduplicated headcount at each site as reported by TBR January 15, 2015.
2014 2015 20162013
39

Fall 2011 Fall 2012 Fall 2013 Fall 2014 Fall 2015Series1 39,134 37,003 36,999 34,576 35,557
39,134
37,003 36,999
34,576 35,557
32,00033,00034,00035,00036,00037,00038,00039,00040,000
Student Credit Hours (SCH) Generated Fall
Spring2012
Spring2013
Spring2014
Spring2015
Spring2016
Series1 33,681 32304 30923 29728 29578
33,681
32304
30923
29728 29578
27,000
28,000
29,000
30,000
31,000
32,000
33,000
34,000
Su 2011 Su 2012 Su 2013 Su 2014 Su 2015Series1 6,554 6,248 4449 4334 4272
6,554 6,248
4449 4334 4272
0
1,000
2,000
3,000
4,000
5,000
6,000
7,000Spring Summer
Source: SIS 14th Day Reports INR007X Argos/Sch by sem TBR Reports: SIS500L
40

DSP REG % DSP REG % DSP REG % DSP REG % DSP REG %SCH SCH DSP SCH SCH DSP SCH SCH DSP SCH SCH DSP SCH SCH DSP
First Time Freshman……….3,045 5,678 35% 3,974 5,550 42% 2,285 7,340 24% 2,012 7,994 20% 1,783 9,835 15%
Other Freshman……………..1527 9417 14% 1200 9205 12% 822 8525 9% 712 7217 9% 378 6202 6%
Sophomore…………………..234 11,283 2% 121 10,580 1% 90 10,960 1% 119 10,441 1% 101 10,382 1%
Non-Degree Special…………213 6,876 3% 175 5,969 3% 122 6,661 2% 54 5,862 1% 56 6,662 1%
Total………………………….5,019 33,254 13% 5,470 31,304 15% 3,319 33,486 9% 2,897 31,514 8% 2,318 33,081 7%
*Productivity is measured in Student Credit Hours (SCH) generated through student enrollments.
2015
Comparison of Regular and Learning Support Program Productivity*Fall Terms 2011-2015
Source: Tennessee Board of Regents MV_DEGREE_CREDIT REPORT OF DEGREE CREDIT ENROLLMENT OF ALL STUDENTS BASED ON 14TH DAY ENROLLMENT
2011 2012 2013 2014
41
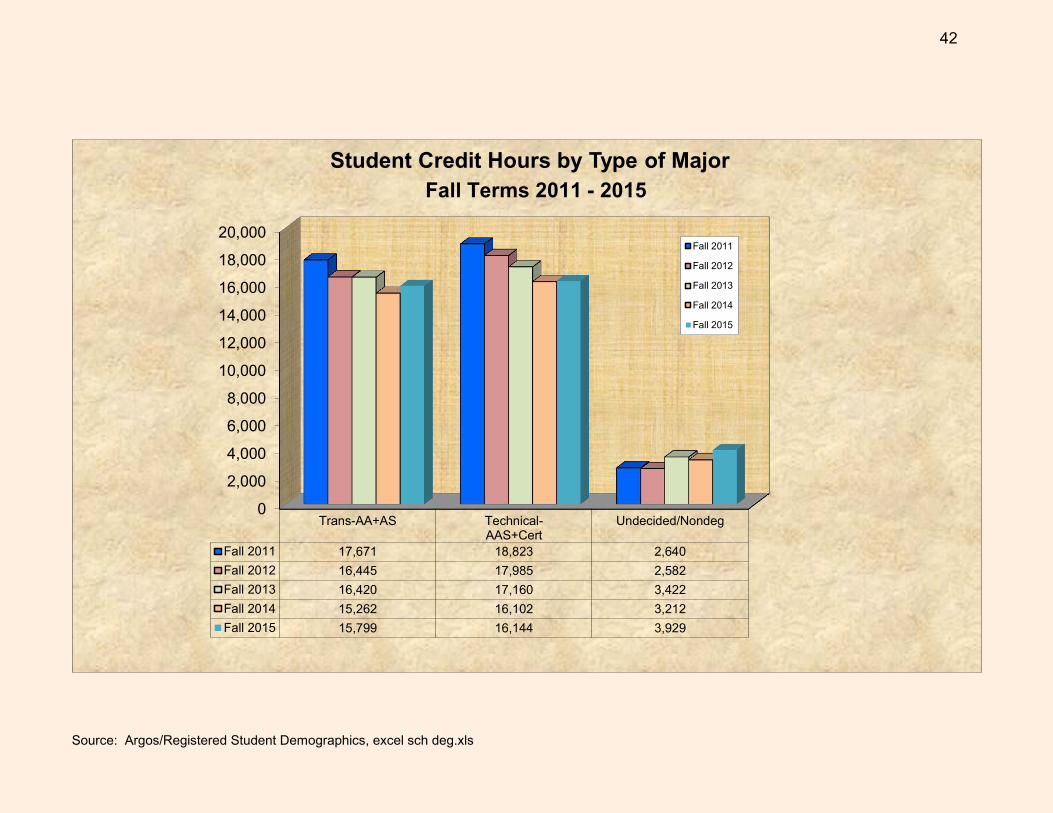
Source: Argos/Registered Student Demographics, excel sch deg.xls
0
2,000
4,000
6,000
8,000
10,000
12,000
14,000
16,000
18,000
20,000
Trans-AA+AS Technical-AAS+Cert
Undecided/Nondeg
Fall 2011 17,671 18,823 2,640Fall 2012 16,445 17,985 2,582Fall 2013 16,420 17,160 3,422Fall 2014 15,262 16,102 3,212Fall 2015 15,799 16,144 3,929
Student Credit Hours by Type of Major
Fall 2011
Fall 2012
Fall 2013
Fall 2014
Fall 2015
Fall Terms 2011 - 2015
42

Dept. 2012 2013 2014 2015 Dept. 2012 2013 2014 2015 Dept. 2012 2013 2014 2015
ACCT 242 237 185 199 AGRI 21 15 DSPM (1) 755 *** *** ***ARC 17 14 13 17 ARTH 51 88 74 53 DSPR (2) 302 *** *** ****BUS 337 334 28 22 ARTP 38 40 55 53 DSPS (3) 319 *** *** ****BUSN 325 388 ASTR 144 124 114 118 DSPW (4) 396 *** *** ***CIS 91 96 74 110 BIOL 1253 1325 1286 1145
CISP 4 CHEM 488 436 366 358First Year Seminar Learning Support (3) 364 343 760
CIT 123 147 149 155 *CJP 116 Reading (2) 376 246 245CPE 100 93 73 69 *CRMJ 114 89 110 Writing (4) 397 309 389CST 33 33 22 COMM 0 16 Math (1) 718 594 545EDU 36 26 19 29 ECED 223 297 249 191EET 59 62 49 41 ECON 140 148 154 141EMT 118 96 32 31 EDU 54 36 37 53EMSA 36 ENGL 1102 1398 1263 1467EMBS 330 360 ENGR 8EMSP 225 FREN -ERG 42 39 45 41 GEOG 8 15 15 14GIS 0 HIST 584 668 528 597HED 94 83 73 HON 12 9 14 14HSCI 5 HUM 370 406 442 344INFS 299 295 230 213 MATH 764 945 1015 1047INT 277 281 232 228 MUS 240 282 268 240LAW 37 33 11 7 PHIL 2LET 495 540 432 414 PHYS 72 69 64 76MDA 76 47 58 63 POLS 29 25 25 25*MGT 98 66 PSYC 585 574 616 540MOA REL 46 43 47 52NUR 223 194 166 158 RODP 583 543 468 458OSA 400 336 279 187 SOCI 169 161 208 133PHED 230 200 150 100 SWRK 104 74 89 75PHO 0 SPAN 107 79 95 71SLE 12 25 27 14 SPCH 323 274 279 432SUR 15 11 15 10
TOTAL 3,458 3205 3032 3190 TOTAL 7,626 8,173 7,860 7,848 TOTAL 1,772 1,855 1,492 1,939*This table shows the number of individual enrollments in departmental courses listed (duplicated).
Note: A zero indicates that the course area existed, but that no classes made. A blank indicates the course area did not exist.RODP = Regents On-Line Degree; all courses combined.PED and PHED are combined as PHEDSource: Argos/Registered Student Demographics
*Ruberic for BUS, CJP, & MGT were changed due to TBR Specification to meet Transfer RequirementsFall 2013 CJP changed to CRMJFall 2014 BUS & MGT were combined to BUSN
***Remedial changed to Learning Support
ACADEMIC DISCIPLINEPart I: Headcount Enrollment*
Fall Terms 2012- 2015
General Transfer Dev. StudiesCareer/Tech2014
43

Dept 2013 2014 2015 2016 Dept 2013 2014 2015 2016 Dept 2013 2014 2015 2016
ACCT 285 248 195 197 AGRI 1 2 6 DSPM (1) 575 579 **** ****ARC 20 15 24 19 ARTH 57 75 74 59 DSPR (2) 123 189 **** ****#BUS 270 237 42 31 ARTP 51 34 51 62 DSPS (3) 106 50 **** ****#BUSN 386 398 ASTR 108 116 112 88 DSPW (4) 176 123 **** ****CIS 84 96 101 94 BIOL 946 1,014 1,117 935 ***Remedial changed to Learning Support
CIT 70 97 84 85 CHEM 365 345 335 362First Year Seminar Learning Support (3) 60 140
CISP 3 2 3 COMM 17 25 Reading (2) 80 75CPE 100 85 72 64 CRMJ 115 105 107 72 Writing (4) 128 112CST 26 2 30 ECED 215 228 214 180 Math (1) 488 383EDU 14 14 6 ECON 169 139 153 150EET 121 90 50 64 EDU 42 48 55 26EMSA 132 114 ENGL 994 1,056 1,073 1,112EMSB 126 78 ENGR 6EMSP 45 GEOG 8 11 19 16EMT 51 107 48 31 HIST 549 601 679 652ERG 50 39 36 33 HON 14 5 2 19GIS 19 10 4 HUM 333 374 417 360HED 85 113 95 63 INTL 16 6 20 22HIT 5 MATH 739 889 942 953HSCI 4 MUS 216 207 285 264INFS 245 241 207 171 PHIL 3INT 228 218 201 204 PHYS 52 64 49 82LAW 10 5 8 6 POLS 25 24 31 38LET 207 136 162 153 PSYC 612 579 654 545MDA 69 42 42 110 REL 49 60 51 45#MGT 183 152 RODP 157 99 110 477NUR 154 199 143 140 SOCI 204 190 147 150OSA 426 372 232 208 SPAN 92 75 78 67PHED 260 201 161 161 SPCH 276 240 304 338SLE 24 26 30 15 SWRK 123 86 97 77SUR 8 7 5 7
TOTAL 2,993 2,763 2,631 2,504 6,528 6,672 7,199 7,185 980 941 756 710*This table shows the number of individual enrollments in departmental courses listed (duplicated).
Note: A zero indicates that the course area existed, but that no classes made. A blank indicates the course area did not exist.RODP = Regents On-Line Degree; all courses combined.PED and PHED are combined as PHEDSource: Argos/Registered Student Demographics ; Excel Duplicated Headcount#Ruberic for BUS & MGT were changed and combined in BUSN Fall 2014
Career/Tech General Transfer
ACADEMIC DISCIPLINEPart 1: Headcount Enrollment*
Spring Terms 2013- 2016
Dev. Studies/Learning Support
Excel: pg 44 and 46 C duplicated headcount spring template
44

Dept. 2012 2013 2014 2015 Dept. 2012 2013 2014 2015 Dept. 2012 2013 2014 2015
ACCT 697 698 543 597 *AGRI 63 47 DSPM (1) 2130 *** *** ***ARC 51 42 39 51 *ARTH 153 264 222 159 DSPR (2) 1255 *** *** ****BUS 1011 1002 84 66 *ARTP 114 118 165 157 DSPS (3) 957 *** *** ****BUSN 975 1164 ASTR 288 248 228 236 DSPW (4) 1014 *** *** ***CIS 192 217 170 230 BIOL 2508 2675 2585 2317 ***Remedial changed to Learning Support
CISP 12 CHEM 976 864 732 713
First Year Seminar Learning Support (3) 1092 1029 2280
CIT 367 433 411 443 CRMJ 348 342 267 330 Reading (2) 808 646 678CPE 223 192 165 158 COMM 48 Writing (4) 580 592 614CST 80 82 33 ECED 614 839 747 573 Math (1) 1995 1665 1557EDU 108 78 57 87 ECON 420 444 462 423EET 177 186 147 123 EDU 162 108 111 159EMT 869 746 96 93 ENGL 3306 3867 3789 4401EMSA 96 ENGR 24EMSB 880 960 FRENEMSP 225 GEOG 24 45 45 42ERG 126 117 135 123 HIST 1752 2004 1584 1783HED 282 249 219 HON 36 27 42 14HSCI 15 HUM 1326 1032INFS 897 885 690 639 INTL 1110 1218 INT 680 674 565 548 MATH 2329 2876 3127 3212LAW 111 99 33 21 MUS 634 760 707 597LET 1210 1320 1056 1012 PHIL 6MDA 253 166 202 232 PHYS 144 208 128 152*MGT 294 198 * POLS 87 75 75 75MOA PSYC 1755 1722 1848 1620NUR 1840 1674 1341 1351 REL 138 129 141 156OSA 970 787 651 497 **RODP 1865 1757 1516 1478PHED 292 225 168 116 SOCI 507 483 624 399SLE 18 41 43 22 SWRK 292 206 267 225SUR 45 33 45 30 SPAN 321 237 285 213
SPCH 969 822 837 1296
TOTAL 10,805 9,895 8,793 9,103 TOTAL 20,915 22,338 21,884 21,863 TOTAL 5,356 4,475 3,932 5,129*This table shows the total number of credit hours generated by all students enrolled in all courses within any of the listed disciplines. For example, use this table to determine the total combined hours generated by all courses bearing the "ENGL" discipline code. To determine Full-Time Equated (FTE), divide the value in any cell by 15. Note: A zero indicates that the course area existed, but that no classes made. A blank indicates the course area did not exist.* Ruberic for BUS, & MGt RODP = Regents On-Line Degree; all courses combined.**RODP Regents On-Line Degree (courses that CSCC does not offer)Source: Argos/Scheduled Section by Subject
ACADEMIC DISCIPLINEPart II: Student Credit Hour (SCH) Productivity*
Fall Terms 2012 - 2015
Dev. StudiesGeneral TransferCareer/Tech
45

Dept. 2013 2014 2015 2016 Dept. 2013 2014 2015 2016 Dept. 2013 2014 2015 2016
ACCT 796 700 553 591 AGRI 4 8 18 DSPM (1) 1656 1683 *** ***ARC 60 45 72 57 ARTH 159 213 222 177 DSPR (2) 509 680 *** ****BUS 810 711 126 93 ARTP 151 102 153 186 DSPS (3) 318 150 *** ****BUSN 1158 1194 ASTR 216 232 224 176 DSPW (4) 471 260 *** ***CIS 212 229 245 250 BIOL 1909 2086 2426 1917 ***Remedial changed to Learning Support
CISP 9 6 9 CHEM 728 688 688 724 180 420CIT 204 283 226 239 COMM 51 75 Reading (2) 202 204CPE 209 166 150 144 CRMJ 345 315 321 216 Writing (4) 258 180CST 74 6 87 ECED 645 655 642 540 Math (1) 1392 1107EDU 42 42 18 ECON 507 417 459 450EET 363 270 150 192 EDU 126 144 147 78EMSA 352 304 ENGL 2982 3168 3219 3336EMSB 336 208 ENGR 18EMSP 240 GEOG 24 33 57 48EMT 504 860 144 93 HIST 1647 1803 2037 1956ERG 137 110 98 92 HON 14 5 2 51GIS 57 30 12 HUM 999 1122 1251 1080HED 255 339 285 189 INTL 32 12 40 44HIT 20 MATH 2261 2713 2902 2918HSCI 12 MUS 556 551 745 675**INFS 735 723 621 513 PHIL 9INT 580 580 523 530 PHYS 104 128 124 164LAW 30 15 24 18 POLS 75 72 93 114LET 506 333 396 408 PSYC 1836 1737 1962 1635***MDA 239 154 146 311 REL 147 180 153 135*MGT 549 456 RODP* 476 301 337 1508NUR 1323 1205 1137 1091 SOCI 612 570 441 450OSA 1061 942 625 571 SPAN 276 225 234 201PHED 390 249 179 175 SPCH 828 720 912 1011SLE 38 40 50 25 SWRK 345 232 247 201SUR 24 21 15 21
TOTAL 9,150 8,542 7,755 7,593 TOTAL 18,004 18,432 20,107 20,093 TOTAL 2,954 2,773 2,032 1,911
*This table shows the total number of credit hours generated by all students enrolled in all courses within any of the listed disciplines. For example, use this table to determine the total combined hours generated by all courses bearing the "ENGL" discipline code. To determine Full-Time Equated (FTE), divide the value in any cell by 15. Note: A zero indicates that the course area existed, but that no classes made. A blank indicates the course area did not exist.* Ruberic for BUS & MGT were combined and changed to BUSN Fall 2014**Ruberic for CIS ***Ruberic for MOA changed to MDARODP* Regents On-Line Degree (courses that CLSCC does not offer)
Source: Argos/Institutional Research/Scheduled Section by Subject QV
First Year Seminar Learning Support (3)
ACADEMIC DISCIPLINEPart II: Student Credit Hour (SCH) Productivity*
Spring Terms 2013 - 2016
Career/Tech General Transfer Dev. Studies
46

Source: Argos: Academic Affiars Classes Schedueld Section By College Division Dept excel: sch div.xls.template: pg 47 duplicated headcount fall template
0
2000
4000
6000
8000
10000
12000
14000
16000
Hum/SocSc AppSc/T Dev Studies Math/NatS Health/Well RODP2011 15050 8258 5643 7021 3100 3972012 12742 7522 5356 6308 3283 18652013 13710 7250 4475 6871 2645 17572014 13544 6044 3932 6800 2749 15162015 13708 6019 5129 6515 3060 1478
Student Credit Hours by Division
Source: 14th Day SIS Reports INR016X; sch div.xls
47

Source: Argos: Academic Affiars_Classes_Schedueld Section By College Division Dept excel: sch div.xls. template: pg 44 46 48 duplicated headcount spring template
Spring Terms 2012 - 2016
48

0
500
1000
1500
2000
2500
3000
3500
4000
Fall 2011 Fall 2012 Fall 2013 Fall 2014 Fall 2015Percent
Part Time 44% 47% 50% 49% 50%
PercentFull Time 56% 53% 50% 51% 50%
Part-time 1697 1720 1905 1737 1747Full-time 2117 1920 1885 1785 1762
Full-time Part-time
PercentFull Time
PercentPart Time
0
5000
10000
15000
20000
25000
30000
35000
40000
Fall2011
Fall2012
Fall2013
Fall2014
Fall2015
PercentPart Time 26% 29% 30% 28% 28%
PercentFull Time 74% 71% 70% 72% 72%
Part-time 10286 10620 11261 9829 10054Full-time 28848 26392 25741 24747 25818
Full-time Part-time
PercentFull Time
PercentPart Time
Full-time and Part-time Credit Headcount and Student Credit Hours Fall Terms 2011 - 2015
Headcount Student Credit Hours
74% 71% 70% 72%
26% 29% 30% 28%
56% 50% 53% 51%
44% 50% 47% 50% 49% 28%
72%
50%
Source: 14th Day SIS Reports, INRO23X, Argos: Registered Student Demographics by Student ID, excel Fact Book, enr and sch ftpt
49

2011 2012 2013 2014 2015 2011 2012 2013 2014 2015 2011 2012 2013 2014 2015
Distance Learning* 1752 1726 1669 1487 1088 5104 5049 4959 4387 3102 340 337 331 292 207 Athens** 44 58 42 7 14 132 174 126 21 42 9 12 8 1 3WWW 951 825 905 952 1029 2560 2230 2512 2670 2925 171 149 167 178 195Video 317 274 239 193 26 951 822 717 579 78 63 55 48 39 5Independent Study 354 325 354 128 305 538 296 402 262 208 36 20 27 17 14Honors 31 58 19 17 29 123 319 102 51 48 8 21 7 5 3Early Bird 27 25 28 28 25 81 75 68 68 61 5 41 5 5 4Business/Industry 108 85 36 27 93 283 213 91 81 273 19 14 5 5 18Dual Enrollment 484 581 905 981 1023 1416 1679 1679 2241 2959 94 112 176 149 197Weekend 18 15 25 30 66 54 45 75 90 198 4 3 5 6 13Regents-On-Line Deg 559 610 538 468 458 1777 1946 1742 1516 1478 118 130 116 101 99Advance 278 218 202 150 216 793 612 606 450 648 53 41 40 30 43#Hybrid 962 1281 1197 1129 1140 2807 4071 3705 3520 3724 187 271 247 235 248#Computer Based Interactive Media 1503 1316 1846 *** *** 4509 3948 5304 *** *** 301 263 354 *** ***#Practium CO-OP 149 97 123 102 115 415 285 339 238 326 28 19 23 18 22
Source: 14th Day TSTS Argos/Scheduled Section by Subject QV; alternate delivery.xls
***Math courses are no longer using "CIM". They are combined in LEC or LAB#Alternate Delivery methods were reclassified to match the Instructional Methods for each course**Includes only students in distance learning classes at off-campus site, sorted by "k" at off-campus site.
*Includes students in all Asynchronus, online, VHS/DVD check out, & RODP at main campus and Athens. DVC(Desktop Video Conferencing Instructional Method discontinued Fall 2015.
INSTRUCTION BY ALTERNATE DELIVERYFALL SEMESTERS
FTEStudent Credit HoursEnrollment
50

*CLSCC data only; does not include transfers to other institutionsSource: Argos/IR Development/Retention/Term to Term Retention Rates QV
0
10
20
30
40
50
60
70
80
1st TimeFrsh (%)
ReturningFrsh (%)
Sophomores(%)
Underg Spec(%)
Total (%)
2011-12 75 74 70 33 712012-13 75 71 73 44 712013-14 78 74 65 46 692014-15 76 69 74 44 722015-16 71 75 66 67 69
Fall Terms to Spring Terms for Academic Years 2011-12 through 2015-16
Percent Retained
51

Left section shows number in entering class; middle section shows how many returned the following Fall; right section is % retained
Term/Yr Entering Cohort Term/Yr Following Fall Enrolled Percent Retained
Other RacesOther Races White Other Races White
M F T M F T M F T M F T M F T M F T M F T M F T M F TFall 86 13 14 27 158 251 409 171 265 436 Fall 87 6 7 13 89 152 241 95 159 254 46% 50% 48% 56% 61% 59% 56% 60% 58%Fall 87 21 10 31 157 318 475 178 328 506 Fall 88 13 8 21 85 160 245 98 168 266 62% 80% 68% 54% 50% 52% 55% 51% 53%Fall 88 17 24 41 215 342 557 232 366 598 Fall 89 8 9 17 121 177 298 129 186 315 47% 38% 41% 56% 52% 54% 56% 51% 53%Fall 89 23 28 51 232 368 600 255 396 651 Fall 90 10 13 23 135 188 323 145 201 346 43% 46% 45% 58% 51% 54% 57% 51% 53%Fall 90 12 18 30 262 346 608 274 364 638 Fall 91 8 11 19 135 221 356 143 232 375 67% 61% 63% 52% 64% 59% 52% 64% 59%Fall 91 18 20 38 238 382 620 256 402 658 Fall 92 4 12 16 155 250 405 159 262 421 22% 60% 42% 65% 65% 65% 62% 65% 64%Fall 92 24 29 53 230 368 598 254 397 651 Fall 93 13 8 21 121 218 339 134 226 360 54% 28% 40% 53% 59% 57% 53% 57% 55%Fall 93 17 23 40 240 356 596 257 379 636 Fall 94 7 12 19 129 201 330 136 213 349 41% 52% 48% 54% 56% 55% 53% 56% 55%Fall 94 26 115 41 198 280 478 224 395 519 Fall 95 11 10 21 103 161 264 114 171 285 42% 9% 51% 52% 58% 55% 51% 43% 55%Fall 95 21 23 44 192 324 516 213 347 560 Fall 96 10 8 18 120 193 313 130 201 331 48% 35% 41% 63% 60% 61% 61% 58% 59%Fall 96 15 14 29 222 349 571 237 363 600 Fall 97 8 4 12 139 191 330 147 195 342 53% 29% 41% 63% 55% 58% 62% 54% 57%Fall 97 40 65 105 211 256 467 251 321 572 Fall 98 7 19 26 116 152 268 123 171 294 18% 29% 25% 55% 59% 57% 49% 53% 51%Fall 98 23 110 133 203 209 412 226 319 545 Fall 99 11 13 24 128 164 292 139 177 316 48% 12% 18% 63% 78% 71% 62% 55% 58%Fall 99 25 27 52 209 248 457 234 275 509 Fall 00 6 5 11 106 130 236 112 135 247 24% 19% 21% 51% 52% 52% 48% 49% 49%Fall 00 35 26 61 202 268 470 237 294 531 Fall 01 17 15 32 116 165 281 133 180 313 49% 58% 52% 57% 62% 60% 56% 61% 59%Fall 01 32 33 65 233 330 563 265 363 628 Fall 02 17 21 38 128 189 317 145 210 355 53% 64% 58% 55% 57% 56% 55% 58% 57%Fall 02 25 29 55 210 314 523 235 343 578 Fall 03 11 15 26 126 192 317 137 207 344 44% 52% 47% 60% 61% 61% 58% 60% 60%Fall 03 17 18 35 228 330 558 245 348 593 Fall 04 11 8 19 118 196 314 129 204 333 65% 44% 54% 52% 59% 56% 53% 59% 56%Fall 04 11 18 29 267 279 546 286 311 597 Fall 05 7 16 23 148 159 307 155 175 330 64% 89% 79% 55% 57% 56% 54% 56% 55%Fall 05 34 33 67 190 333 523 224 366 590 Fall 06 11 19 30 84 197 281 95 216 311 32% 58% 45% 44% 59% 54% 42% 59% 53%Fall 06 37 34 71 218 313 531 255 347 602 Fall 07 18 19 37 123 181 304 141 200 341 49% 56% 52% 56% 58% 57% 55% 58% 57%Fall 07 43 38 81 209 282 491 252 320 572 Fall 08 15 23 38 114 153 267 129 176 305 35% 61% 47% 55% 54% 54% 51% 55% 53%Fall 08 32 40 72 214 250 464 246 290 536 Fall 09 16 35 51 114 146 260 130 171 301 50% 88% 71% 53% 58% 56% 53% 59% 56%Fall 09 37 44 81 258 386 644 295 430 725 Fall 10 14 39 53 145 231 376 159 270 429 38% 89% 65% 56% 60% 58% 54% 63% 59%Fall 10 49 43 92 273 353 626 322 396 718 Fall 11 15 15 30 127 192 319 142 207 349 31% 35% 33% 47% 54% 51% 44% 52% 49%Fall 11 62 67 129 288 400 688 350 467 817 Fall 12 23 36 59 147 211 358 170 247 417 37% 54% 46% 51% 53% 52% 49% 53% 51%Fall 12 52 65 117 272 395 667 324 460 784 Fall 13 25 27 52 136 218 354 161 245 406 48% 42% 44% 50% 55% 53% 50% 53% 52%Fall 13 57 66 123 281 370 651 338 436 774 Fall 14 25 28 53 146 215 361 171 243 414 44% 42% 43% 52% 58% 55% 51% 56% 53%Fall 14 47 61 108 290 400 690 337 461 798 Fall 15 19 31 50 150 190 340 169 221 390 40% 51% 46% 52% 48% 49% 50% 48% 49%Note: Sum of black and white students will not equal total because other race students are not included.Cohort = First-time students, full and part-time, who entered in Fall, plus those who entered in Summer and returned FallClSCC data only; does not include transfers to other institutions.Source: 14th Day THEC Reports; RT_COHORT_RETENT.FEX; EXCEL filename STUDENT RETENTION RATES Fall 2008 -2014 information pulled from Argos Excel: Argos/IR Development/Cohorts/FTF Term to Term Retention - Race, Gender, Ethnicity, Time
FALL-TO-FALL RETENTION RATES BY RACE: 1986-87 THROUGH 2014-2015
Total All Races FTF
Total All Races FTF
Total All Races FTFWhite Race
52

09-'10 10-11 11-12 12-13 13-14 14-15Graduates 502 580 899 1042 1175 913
0
200
400
600
800
1000
1200
1400
Source: Academic Inventories 1977 - 09; Total grads from 1967 - 1977 = 1,367. grads_hist
Total Graduates, All Programs 2009-10 Through 2014-2015
Source: Academic Inventories 1977 - 09; Total grads from 1967 - 1977 = 1,367. grads_hist
Total grads since 1967 = 16,806
Beginning Fall 2011 embedded certificates for General Transfer were offered for the first time, therefore increasing the number of certificates.
53
dhawkins
Highlight
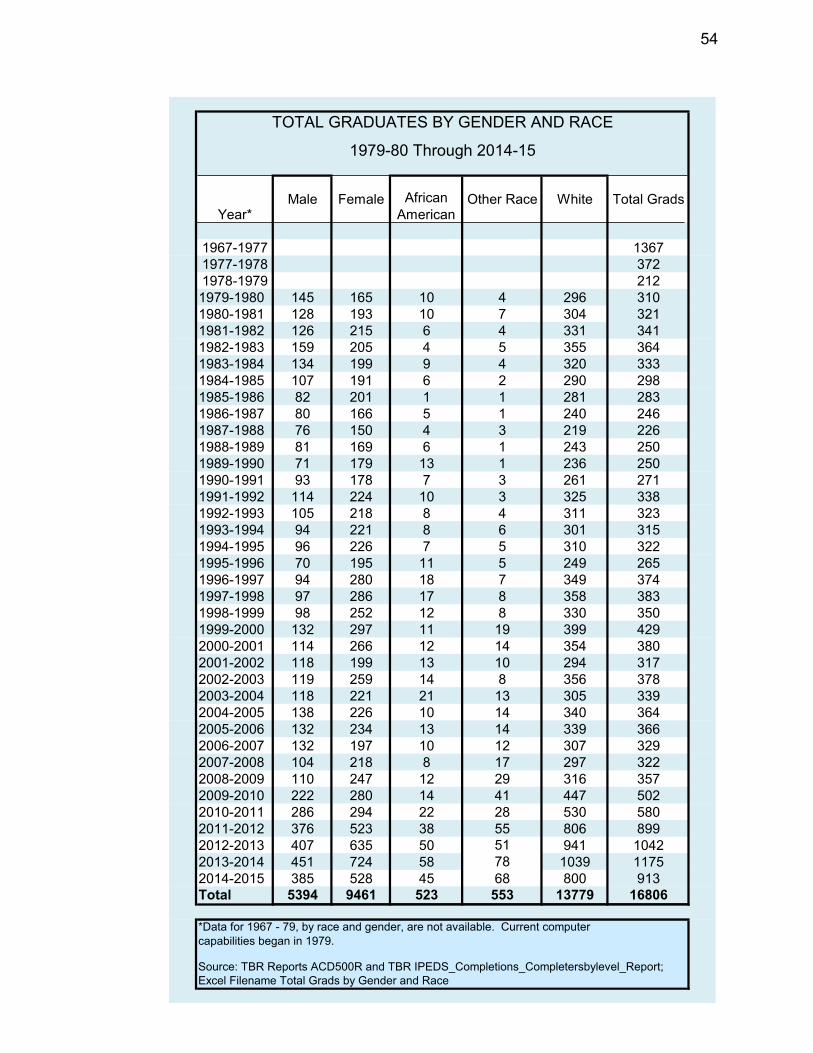
TOTAL GRADUATES BY GENDER AND RACE
1979-80 Through 2014-15
Year*Male Female African
AmericanOther Race White Total Grads
1967-1977 13671977-1978 3721978-1979 2121979-1980 145 165 10 4 296 3101980-1981 128 193 10 7 304 3211981-1982 126 215 6 4 331 3411982-1983 159 205 4 5 355 3641983-1984 134 199 9 4 320 3331984-1985 107 191 6 2 290 2981985-1986 82 201 1 1 281 2831986-1987 80 166 5 1 240 2461987-1988 76 150 4 3 219 2261988-1989 81 169 6 1 243 2501989-1990 71 179 13 1 236 2501990-1991 93 178 7 3 261 2711991-1992 114 224 10 3 325 3381992-1993 105 218 8 4 311 3231993-1994 94 221 8 6 301 3151994-1995 96 226 7 5 310 3221995-1996 70 195 11 5 249 2651996-1997 94 280 18 7 349 3741997-1998 97 286 17 8 358 3831998-1999 98 252 12 8 330 3501999-2000 132 297 11 19 399 4292000-2001 114 266 12 14 354 3802001-2002 118 199 13 10 294 3172002-2003 119 259 14 8 356 3782003-2004 118 221 21 13 305 3392004-2005 138 226 10 14 340 3642005-2006 132 234 13 14 339 3662006-2007 132 197 10 12 307 3292007-2008 104 218 8 17 297 3222008-2009 110 247 12 29 316 3572009-2010 222 280 14 41 447 5022010-2011 286 294 22 28 530 5802011-2012 376 523 38 55 806 8992012-2013 407 635 50 51 941 10422013-2014 451 724 58 78 1039 11752014-2015 385 528 45 68 800 913Total 5394 9461 523 553 13779 16806
*Data for 1967 - 79, by race and gender, are not available. Current computer capabilities began in 1979.
Excel Filename Total Grads by Gender and RaceSource: TBR Reports ACD500R and TBR IPEDS_Completions_Completersbylevel_Report;
54

10-11 11-12 12-13 13-14 14-15AA/AS 30 19 16 16 23AAS 30 22 19 22 17Certif 40 59 65 62 60
40
59 65 62 60
30
22 19 22
17
30 19 16 16
23
0%
10%
20%
30%
40%
50%
60%
70%
80%
90%
100%
Distribution of Graduates among Transfer,Career/Technical,
Certif AAS AA/AS
Source: TBR IPEDS Completions by Award Level(Jul 1-June 30 annually); excel grad%
and Certificate Programs (%) 2010-11 through 2014-15
55

ACTIVE PROGRAMS (with year approved)
GENERAL TRANSFER PROGRAM CIP CODE 2010-11 2011-12 2012-13 2013-14 2014-15 5-Yr Avg
Associate of Arts 1967 16.24.0101.01 12 11 20 10 20 14.6Associate of Science 1967 16.24.0101.01 161 160 149 179 198 169.4Associate of Science Teaching Option 2006 08.13.0101.00 1 1 1 1 0.8
Total General Transfer 174 172 170 190 218 184.8
CAREER/TECHNICAL DEGREE PROGRAMS CIP CODE 2010-11 2011-12 2012-13 2013-14 2014-15 5-Yr Avg
Web Page Authoring (RODP) 2007 06.11.0801.00 1 0.2Industrial Technology (A.A.S.) 1973 09.15.0612.00 27 23 26 28 18 24.4Early Childhood Education (A.A.S.) 1999 12.19.0706.00 18 30 24 23 18 22.6General Technology (A.A.S.) 1993 13.21.0101.01 4 4 1.6Regents Online Professional Studies (ROPS) 2001 16.24.0102.02 1 1 0.4General Technology (A.A.S.) 2012 23.32.0111.00 10 3 2.6Public & Govt't Services (A.A.S.) 2003 27.44.9999.00 11 8 10 5 4 7.6Nursing (A.A.S.) 1967 31.51.1601.00 50 54 69 104 38 63Health Sciences 2012 31.51.9999.01 3 0.6Business and Management (A.A.S.) 1978 32.52.0201.01 50 60 45 61 49 53Office Systems Administration (A.A.S.) 1975 32.52.0401.00 20 21 28 22 18 21.8
Total Career/Technical Degree 181 200 202 255 151 197.8
CERTIFICATE PROGRAMS CIP CODE 2010-11 2011-12 2012-13 2013-14 2014-15 5-Yr Avg
Web Page Authoring (RODP) 2007 06.11.0801.00 1 1 0.4Network Systems Design 2011 06.11.0901.00 2 5 21 13 8.2Electrical Maintenance Fundamentals 2011 09.05.0303.01 2 8 34 4 9.6Civil Technology 2011 09.15.0201.00 3 6 3 2.4Zero Energy Housing 2011 09.15.0503.00 3 2 1Climate Control 2011 09.15.0505.00 5 6 6 4 4.2Mechanical Maintenance Fundamentals 2011 09.15.0805.00 5 7 16 12 8Architectural Design 2011 09.15.1303.00 1 6 6 4 3.4Mechanical Drafting 2011 09.15.1306.00 1 3 8 4 3.2Early Childhood Education 2012 12.19.0706.01 25 27 28 16General Education Core 2011 16.24.0101.01 299 418 322 259 259.6Workforce Preparedness: Business 1997 23.32.0101.00 7 17 1 5Workforce Preparedness: Technology 1997 23.32.0101.01 39 3 8.4Technology Essentials 2011 23.32.0111.00 4 8 8 4Process Control Fundamentals 25.41.0303.00 3 2 1Law Enforcement Training 2003 27.43.0107.00 93 67 67 70 60 71.4Construction Surveying 2011 29.46.0415.00 1 4 2 5 2.4Fine Arts 2012 30.50.0903.00 1 0.2Pre-Allied Health 2011 31.51.0000.00 18 49 20 17.4Emergency Medical Services 2003 31.51.0904.00 59 64 55 60 64 60.4Business & Management 2010 32.52.0201.00 20 13 62 48 28.6Office Careers 1975 32.52.0401.00 26 37 27 26 6 24.4
Total Certificate 225 527 670 730 544 539.2
2010-11 2011-12 2012-13 2013-14 2014-15 5-Yr AvgTOTAL ALL GRADUATES 580 899 1042 1175 913 921.8
GRADUATES BY MAJOR, ACTIVE AND PHASE-OUT, 2010-11 Through 2014-15
Source: TBR IPEDS Completion Data
56

2000 2001 2002 2003 2004 2005 2006 2007 2008 2009 2010 2011 2012 2013 2014 2015Orig Cohort 529 625 577 622 597 587 601 571 618 748 718 817 784 774 791Grad by 2015 with a Degree128 145 159 143 123 119 121 134 132 171 126 151 110 90 2Percent Received A Degree 23.47% 21.36% 22.86% 17.55% 18.48% 14.03% 11.63%
2008 2009 2010 2011 2012 2013Orig Cohort 618 748 718 817 784 774Grad by 2015 with a Degree 132 171 126 151 110 90Percent Received A Degree 21.36% 22.86% 17.55% 18.48% 14.03% 11.63%
618
748 718
817 784 774
132 171
126 151
110 90
21.36% 22.86% 17.55% 18.48% 14.03% 11.63% 0
100
200
300
400
500
600
700
800
900
Axis
Titl
e
Persistence to Graduation First Time Freshman Cohort* Students who remained at CSCC and graduated with a degree
by Spring 2015
Source: Argos: IR Development/Cohorts/Degree Awards By Cohort QV
2008 2009 2010 2011 2012 2013
Orig Cohort 618 748 718 817 784 772
Grad by 2015 with Associate Degree and/or certificate 178 253 195 211 149 123
% Rec Degree and/or certificate 28.80% 33.82% 27.16% 25.83% 19.01% 15.93%
618
748 718
817 784 772
178
253
195 211
149 123
28.80% 33.82% 27.16% 25.83% 19.01% 15.93%
Persistence to Graduation First Time Freshman Cohort* Students who remained at CSCC and received a degree and/or
certificate by Spring 2015
Orig Cohort Grad by 2015 with Associate Degree and/or certificate % Rec Degree and/or certificate
*Cohort = Firt-time students, Full- and Part-Time, who entered in Fall, plus those who entered in Summer and returned Fall.
Institution-only data; does not include graduation at other institutions following transfer.
57

0
100
200
300
400
500
600
700
800
ALL Students AthletesGraduated 81 11Total 648 32
3-Year Graduation Rates: Athletes vs. All Students
Total Graduated
Full-Time Freshmen Full-Time Cohort* Students Entering Fall 2012 Who Had Graduated by Spring 2015
Institutional data only; does not include CSCC students who may have graduated from other institutions following transfer. Cohort=1st time Freshmen, Degree-Seeking report; source: Athletic Director: Excel grads athl Argos:Degree Awards By Term By Major QV
34%
13%
58
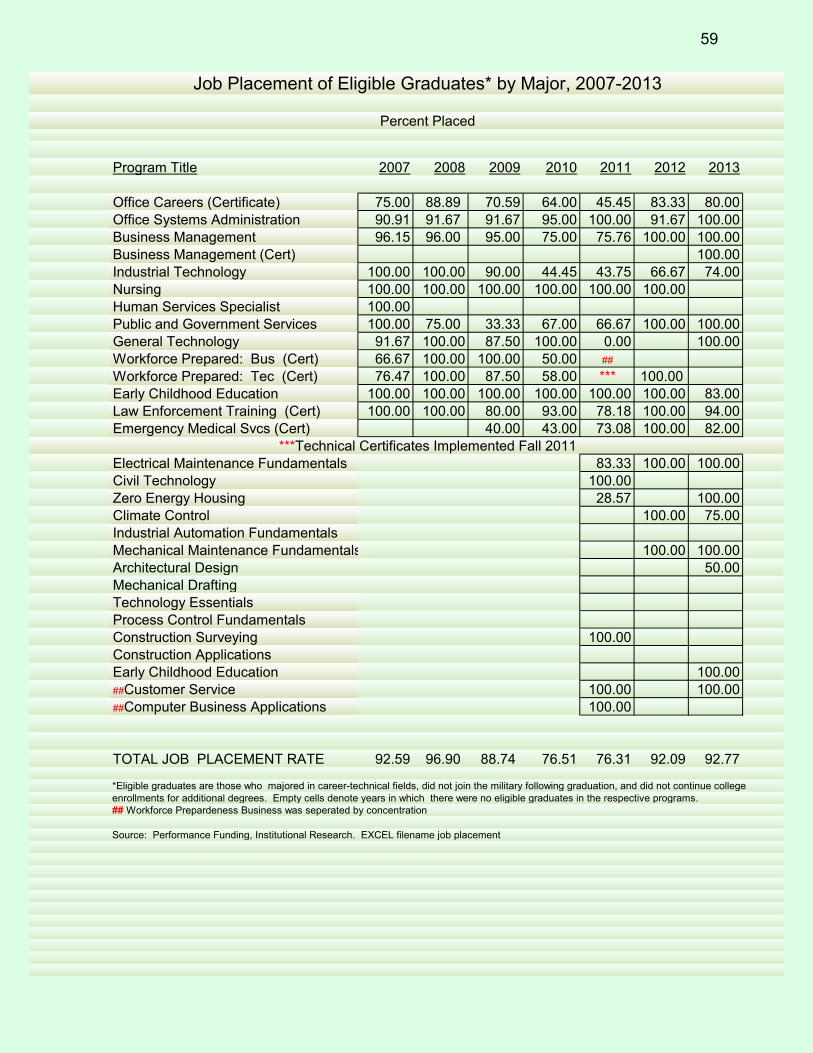
Program Title 2007 2008 2009 2010 2011 2012 2013
75.00 88.89 70.59 64.00 45.45 83.33 80.0090.91 91.67 91.67 95.00 100.00 91.67 100.0096.15 96.00 95.00 75.00 75.76 100.00 100.00
100.00100.00 100.00 90.00 44.45 43.75 66.67 74.00100.00 100.00 100.00 100.00 100.00 100.00100.00100.00 75.00 33.33 67.00 66.67 100.00 100.00
91.67 100.00 87.50 100.00 0.00 100.0066.67 100.00 100.00 50.00 ##
76.47 100.00 87.50 58.00 *** 100.00100.00 100.00 100.00 100.00 100.00 100.00 83.00100.00 100.00 80.00 93.00 78.18 100.00 94.00
40.00 43.00 73.08 100.00 82.00
83.33 100.00 100.00100.00
28.57 100.00100.00 75.00
100.00 100.00Architectural Design 50.00Mechanical Drafting
100.00
100.00100.00 100.00100.00
TOTAL JOB PLACEMENT RATE 92.59 96.90 88.74 76.51 76.31 92.09 92.77
*Eligible graduates are those who majored in career-technical fields, did not join the military following graduation, and did not continue collegeenrollments for additional degrees. Empty cells denote years in which there were no eligible graduates in the respective programs.## Workforce Prepardeness Business was seperated by concentration
Source: Performance Funding, Institutional Research. EXCEL filename job placement
Business Management (Cert)
Job Placement of Eligible Graduates* by Major, 2007-2013
Percent Placed
Early Childhood EducationLaw Enforcement Training (Cert)Emergency Medical Svcs (Cert)
Human Services SpecialistPublic and Government ServicesGeneral TechnologyWorkforce Prepared: Bus (Cert)Workforce Prepared: Tec (Cert)
Office Careers (Certificate)Office Systems AdministrationBusiness Management
Industrial TechnologyNursing
Electrical Maintenance FundamentalsCivil Technology
***Technical Certificates Implemented Fall 2011
Zero Energy HousingClimate ControlIndustrial Automation FundamentalsMechanical Maintenance Fundamentals
Technology Essentials
##Computer Business Applications
Process Control FundamentalsConstruction SurveyingConstruction ApplicationsEarly Childhood Education##Customer Service
59

TO TO TO TO TO TO TOTALFROM APSU ETSU MTSU TSU TTU UOM TO UNIV
CSTCC 6 19 30 5 25 1 86CLSCC 1 23 13 0 16 0 53COSCC 15 4 197 10 23 6 255DSCC 5 1 9 2 4 39 60JSCC 11 3 29 3 3 96 145MSCC 7 4 272 20 84 2 389NSCC 76 2 153 148 51 2 432NSTCC 1 199 5 0 9 0 214PSTCC 10 51 46 6 65 3 181RSCC 2 37 25 1 122 2 189STCC 10 3 41 18 3 428 503VSCC 49 7 146 49 69 2 322WSCC 3 143 13 2 11 1 173
196 496 979 264 485 582 3002
Student Transfers to TBR UniversitiesFall 2015
TBR Community
College Total
Source: Tennessee Board of Regents MV_LEGACY-ENROLLMENT
60
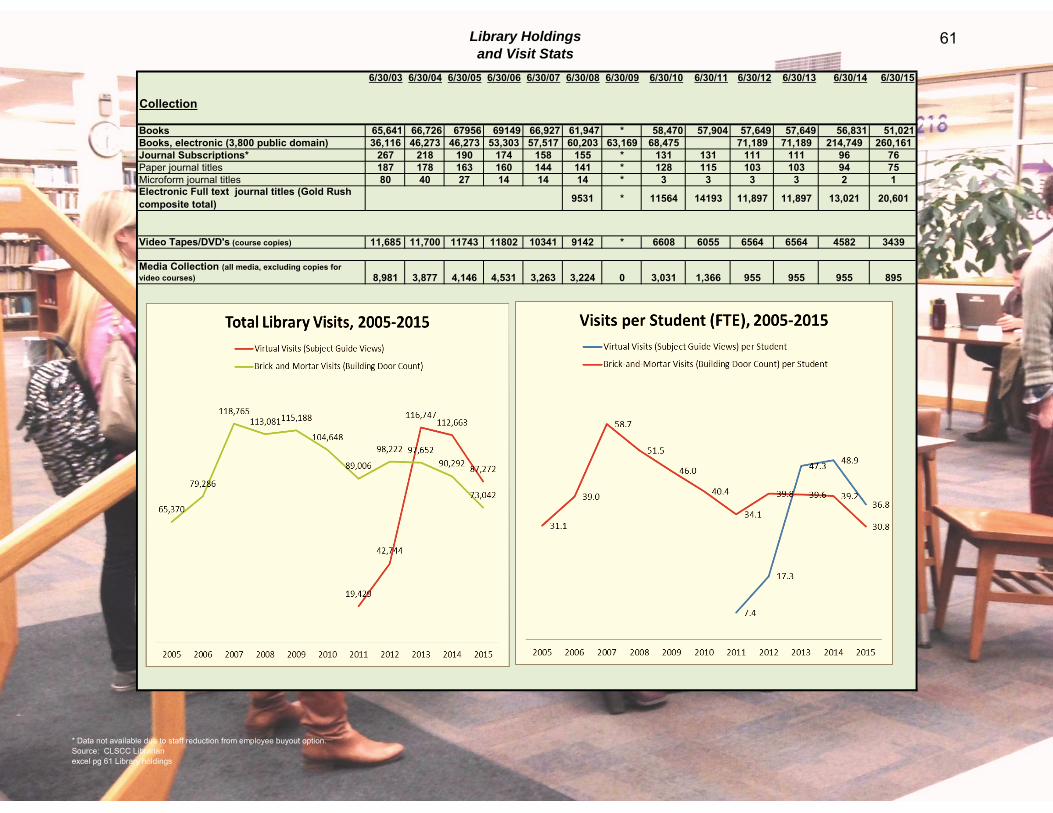
Library Holdings
and Visit Stats
6/30/03 6/30/04 6/30/05 6/30/06 6/30/07 6/30/08 6/30/09 6/30/10 6/30/11 6/30/12 6/30/13 6/30/14 6/30/15
Collection
Books 65,641 66,726 67956 69149 66,927 61,947 * 58,470 57,904 57,649 57,649 56,831 51,021Books, electronic (3,800 public domain) 36,116 46,273 46,273 53,303 57,517 60,203 63,169 68,475 71,189 71,189 214,749 260,161Journal Subscriptions* 267 218 190 174 158 155 * 131 131 111 111 96 76Paper journal titles 187 178 163 160 144 141 * 128 115 103 103 94 75Microform journal titles 80 40 27 14 14 14 * 3 3 3 3 2 1Electronic Full text journal titles (Gold Rush composite total) 9531 * 11564 14193 11,897 11,897 13,021 20,601
Video Tapes/DVD's (course copies) 11,685 11,700 11743 11802 10341 9142 * 6608 6055 6564 6564 4582 3439
Media Collection (all media, excluding copies for video courses) 8,981 3,877 4,146 4,531 3,263 3,224 0 3,031 1,366 955 955 955 895
* Data not available due to staff reduction from employee buyout option.Source: CLSCC Librarianexcel pg 61 Library holdings
61

Library Circulation and Refernce Desk Stats along with Use per Student and Per Librarian
ReferenceDesk
Referrals
Printing/Photocopy
Help
ComputerHelp
Other
2013 331 959 440 985
2014 317 751 303 898
0
200
400
600
800
1000
1200
Circulation Desk Questions
2013
2014
Service Desk Transactions 2013 2014 2015
Avg. Transactions per Librarian – All Queries
1417.9 1032.1 776.1
Reference Questions 391.8 387.6 291.9
Other Queries 1026.1 644.5 484.2
Avg. Transaction per non-librarian
678.8 567.3 573.5
Information Literacy Class Sessions 2013 2014 2015
# of Sessions 87 123 149
Total # of Students 1365 1967 2873
Avg. Attendance per Session
15.5 16 20.4
Sessions Taught per Librarian
30.7 43.4 52.5
Source: CSCC Library
62

Library Subject Utilization
and
Library Resource Usage
Totals Totals Totals Totals Totals Totals Totals Totals
2009 2010 2011 2012 2013 2014 2015Cumulative
1999-15
Total Items charged 156315 9927 9249 8589 6622 6869 5941 5206 208718
Items charged by patron code
Students 140569 8939 8199 7455 5477 5677 4831 3973 185120
Faculty 2484 165 169 176 147 149 163 194 3647
Staff 8533 487 522 609 794 806 698 799 13248
Community 3469 270 292 227 173 161 203 166 4961
Adjunct Faculty 454 36 49 81 16 43 32 25 736
Emeritus 93 11 18 41 15 12 14 5 209
College at Home 387 12 0 0 0 0 0 0 399
TALC,TBR,LMU - Consortia 201 4 0 0 0 21 0 0 226
Reach 125 3 0 0 0 0 0 0 128
Item records new 12781 3363 2673 3079 2765 3069 2435 2792 32957
Titles added new (fiscal year count)14805 2219 3522 1319 1567 1777 2498 1607 29314
Non-book circulation
Periodicals 801 119 39 101 77 62 59 17 1275
Microfilm 391 104 70 49 9 3 5 27 658
Video tapes/DVDs 87171 1901 1562 1268 909 605 422 348 94186
Equipment/Calculators & Laptops 3267 318 285 261 298 308 334 352 5423
TOTALS 91630 2442 1956 1679 1293 978 820 744 101542
A-AZ General 1320 63 50 38 32 44 38 30 1615
B-Bx Philosophy/Religion 1134 138 168 128 126 151 112 116 2073
C-F History 3621 562 501 492 395 467 400 453 6891
G-GT Human Sciences 338 45 26 30 21 30 30 26 546
GV Sports 394 48 32 43 26 25 33 40 641
H-J Social Issues 4292 695 649 584 450 583 421 386 8060
K-KZ Law 258 54 62 74 26 41 51 39 605
L-LZ Education 867 93 70 93 87 71 71 63 1415
M-NZ Fine Arts 679 65 43 43 34 30 73 71 1038
P-PT Literature 6302 722 545 549 493 617 540 512 10280
PZ Children's Literature 4961 1150 866 1140 799 950 775 632 11273
Q-QR Science 2086 146 160 142 228 105 205 181 3253
R-RZ Clinical Sciences 4928 413 261 282 138 245 217 214 6698
S-VZ Technology 1368 111 103 117 86 121 137 106 2149
Z Bibliography 97 7 8 4 5 9 13 14 157
All Bks prior to 1991 15170 941 800 726 601 565 502 466 19771
Best Sellers 7750 293 438 475 426 343 249 202 10176
Law Room 1861 1 1 5 5 1 2 2 1878
Reference 186 11 6 8 10 14 6 5 246
Reserve 4169 1522 2045 1598 1118 1190 869 564 13075
Special collections 120 12 7 4 0 2 5 4 154
Total Book circulation 61901 7092 6841 6575 5106 5604 4749 4126 101994
Totals
Cumulative
1999-2008
Book circulation by subject
Categories
Figures do not include 7/03-12/03Govt Docs moved into gen collection removed as separate category
Vertical File, Reavis, and Career removed as separate categories
C:\Users\dhawkins\Desktop\The Big File Cabinet\Fact Book 2015-2016\pg 63 Library Subject Ut
63

Direct Subsidized, $1,134,711, 21%
Plus Direct Loan, $6,732, 0%
Workstudy, $26,108, 0%
Pell, $3,016,356, 56%
SEOG, $37,950, 1%
Unsubsidized Stafford, $1,177,249, 22%
Distribution of Federal Financial Aid Awards
Fall 2015
Total Financial Aid for Fall 2015 = $5,399,106 (estimated)
Source: Argos/Student Services/Financial Aid/ FA Awards Matrix by Term QV; FinAid.xls
64

Workstudy, 35, 1%
Pell, 1418, 44%
SEOG, 255, 8%
Unsubsidized Stafford , 733, 23%
Plus Direct Loan, 2, 0%
Subsidized Stafford, 758, 24%
Number of Students Receiving Federal Financial Aid
Fall 2015
Total Number of Students on Federal Financial Aid for Fall 2015 = 3201(duplicated)
Source: Argos/Student Services/Financial Aid/FA Awards Matrix by Term QV; FinAid.xls
65

Cleveland State Community College FoundationSCHOLARSHIP AWARDS, 1976 - 2015
Year Total Number of Cost ofEnded Awarded Students Full Scholarship*
1976 5,850 23 3001977 5,455 17 3751978 6,367 19 3751979 12,193 37 3751980 18,553 65 3751981 19,288 65 3751982 26,052 84 4261983 43,524 121 4681984 52,203 134 4681985 69,183 162 5221986 71,522 157 5701987 80,715 175 6421988 87,699 171 6871989 95,216 169 7241990 98,069 157 8481991 103,589 151 8481992 103,821 159 8481993 103,862 157 9281994 72,117 157 9661995 91,830 123 9661996 97,826 109 1,0241997 115,483 116 1,0861998 126,341 122 1,0861999 144,706 122 1,1302000 190,118 158 1,1982001 231,077 184 1,4352002 272,489 195 1,6352003 79,213 62 1,7472004 116,420 133 2,0772005 122,656 172 2,2052006 172,250 222 2,3952007 164,709 235 2,4832008 170,082 197 2,6272009 190,064 226 2,7692010 201,158 319 2,9332011 197,332 162 3,1002012 170,576 161 3,3652013 *** 225,396 209 3,5092014 554,061 446 3,6052015 557,339 519 3,947
Total $5,266,404 6372
*Cost of Tuition for Academic Year; some students received partial scholarships.Source: Cleveland State Community College Foundation, Audit Report for the Year EndedJune 30, 2012. Complete report is available in the Office of Instituitonal Advancement.***2013 Data includes Bradley AchievesFile name: scholaships.xls
66
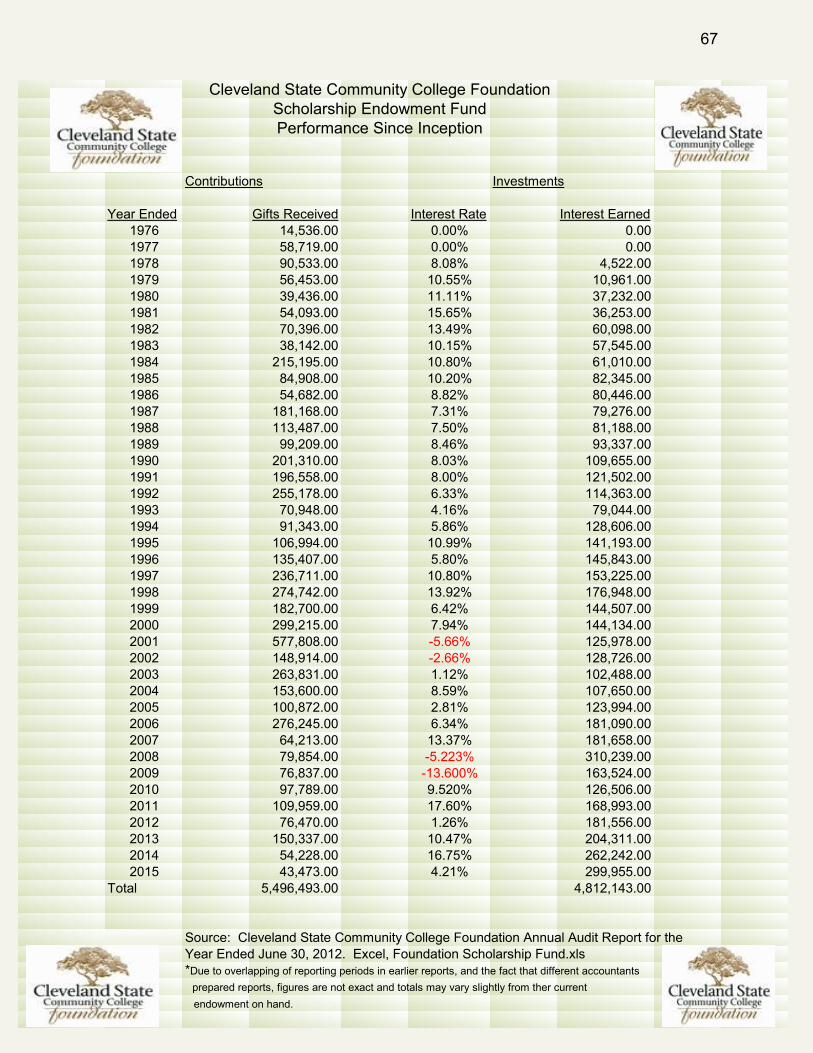
Cleveland State Community College FoundationScholarship Endowment FundPerformance Since Inception
Contributions Investments
Year Ended Gifts Received Interest Rate Interest Earned1976 14,536.00 0.00% 0.001977 58,719.00 0.00% 0.001978 90,533.00 8.08% 4,522.001979 56,453.00 10.55% 10,961.001980 39,436.00 11.11% 37,232.001981 54,093.00 15.65% 36,253.001982 70,396.00 13.49% 60,098.001983 38,142.00 10.15% 57,545.001984 215,195.00 10.80% 61,010.001985 84,908.00 10.20% 82,345.001986 54,682.00 8.82% 80,446.001987 181,168.00 7.31% 79,276.001988 113,487.00 7.50% 81,188.001989 99,209.00 8.46% 93,337.001990 201,310.00 8.03% 109,655.001991 196,558.00 8.00% 121,502.001992 255,178.00 6.33% 114,363.001993 70,948.00 4.16% 79,044.001994 91,343.00 5.86% 128,606.001995 106,994.00 10.99% 141,193.001996 135,407.00 5.80% 145,843.001997 236,711.00 10.80% 153,225.001998 274,742.00 13.92% 176,948.001999 182,700.00 6.42% 144,507.002000 299,215.00 7.94% 144,134.002001 577,808.00 -5.66% 125,978.002002 148,914.00 -2.66% 128,726.002003 263,831.00 1.12% 102,488.002004 153,600.00 8.59% 107,650.002005 100,872.00 2.81% 123,994.002006 276,245.00 6.34% 181,090.002007 64,213.00 13.37% 181,658.002008 79,854.00 -5.223% 310,239.002009 76,837.00 -13.600% 163,524.002010 97,789.00 9.520% 126,506.002011 109,959.00 17.60% 168,993.002012 76,470.00 1.26% 181,556.002013 150,337.00 10.47% 204,311.002014 54,228.00 16.75% 262,242.002015 43,473.00 4.21% 299,955.00
Total 5,496,493.00 4,812,143.00
Source: Cleveland State Community College Foundation Annual Audit Report for theYear Ended June 30, 2012. Excel, Foundation Scholarship Fund.xls*Due to overlapping of reporting periods in earlier reports, and the fact that different accountants prepared reports, figures are not exact and totals may vary slightly from ther current endowment on hand.
67

IPEDS Student Financial Aid Survey Summary
Description
Total grant aid received by all undergraduate students $10,234,791 $11,525,968
Number of undergraduate students who received a Pell Grant $1,558 $1,816
Percentage of FTFT students receiving any financial aid 96% 94%
Percentage
of FTFT
students
receiving
grant aid by
type
Average
amount of
grant aid
received by
type
Percentage
of FTFT
students
receiving
grant aid by
type
Average
amount of
grant aid
received by
type
Total grant aid received by all undergraduate students 93% $5,141 91% $5,082
Federal Government 61% $4,183 64% $4,280
Pell 61% $3,925 64% $4,181
Other Federal 13% $1,358 11% $687
State/Local Government 65% $2,653 57% $2,551
Institutional 15% $3,363 17% $2,555
Percentage
of FTFT
students
receiving
loans by
type
Average
amount of
loans
received by
type
Percentage
of FTFT
students
receiving
loans by
type
Average
amount of
loans
received by
type
22% $4,385 22% $4,385
0.22 $4,385 22% $4,385
0% N/A 0% N/A
Award Amount Award AmountGrant or scholarship aid from the federal government, state/local
government, the institution, and other sources known to the
institution2,883 $10,234,791 2,853 $11,525,968
Pell Grants 1,558 $5,591,864 1,816 $6,972,665
Federal student loans 892 $4,622,198 1,244 $5,807,528
*Post 9/11 GI Bill Benefits 88 $257,287 84 $229,466
* Added to IPEDS reporting starting AY 13-14
5 Year Average
All Undergraduate students
Total
Federal
Non-federal
Aid TypeFall 2014
Fall 2014 5Year Average
Source: IPEDS Student Financial Aid prepared by CSCC Financial Aid
68

Men Women Men Women Men Women
Baseball 19 0 15 0 34 0Basketball 12 12 3 2 15 14Softball 0 20 0 2 0 22
Total 31 32 18 4 49 36
Cleveland State Community College is a member of the Tennessee Community College Athletic Association and the National Junior College Athletic Association.
Source: ClSCC Director of Athletics; EXCEL Athletics
Scholarship Non-Scholarship Total
ATHLETICS
Intercollegiate Team Sports 2015-2016
69

Source: CLSCC Finance Adminstiration Business Manager. Info from Financial Report 2014-2015; budget rev
Appropriations, 8,989,713, 29.1%
Other Sources, 31,223, 0.1%
Gifts, 550,492, 1.8% Tuition and Fees, 10,999,645, 35.6%
Auxiliary Enterprises, 191,863, 0.6%
Grants and Contracts, 10,057,133, 32.6%
Sales and Services, 76,195, 0.2%
College Revenues
Appropriations
Other Sources
Gifts
Tuition and Fees
Auxiliary Enterprises
Grants and Contracts
Sales and Services
Fiscal Year Ended June 30, 2015
70

Source: CLSCC Finance Administration Business Manager, Info from Financial Report 2013-2014; excel budget exp
Instruction, $9,916,7711 33.0%
Auxiliary Enterprise, $23,666 , 0.1%
Schol & Fellowships, $9,883,207 , 32.9%
Oper & maint, $1,759,408 , 5.9%
Acad Support, $1,164,914 , 3.9%
Institutional Support, $3,967,440 , 13.2%
Extension & Public Svc, $370,897 , 1.2%
Student Services, $2,919,705 , 9.7%
College Expenditures Fiscal Year Ended June 30, 2015
Source: CSCC Finance & Administriaon Business Manager. Info from Financial Report 2014-15 filename college expenditures.xls
71
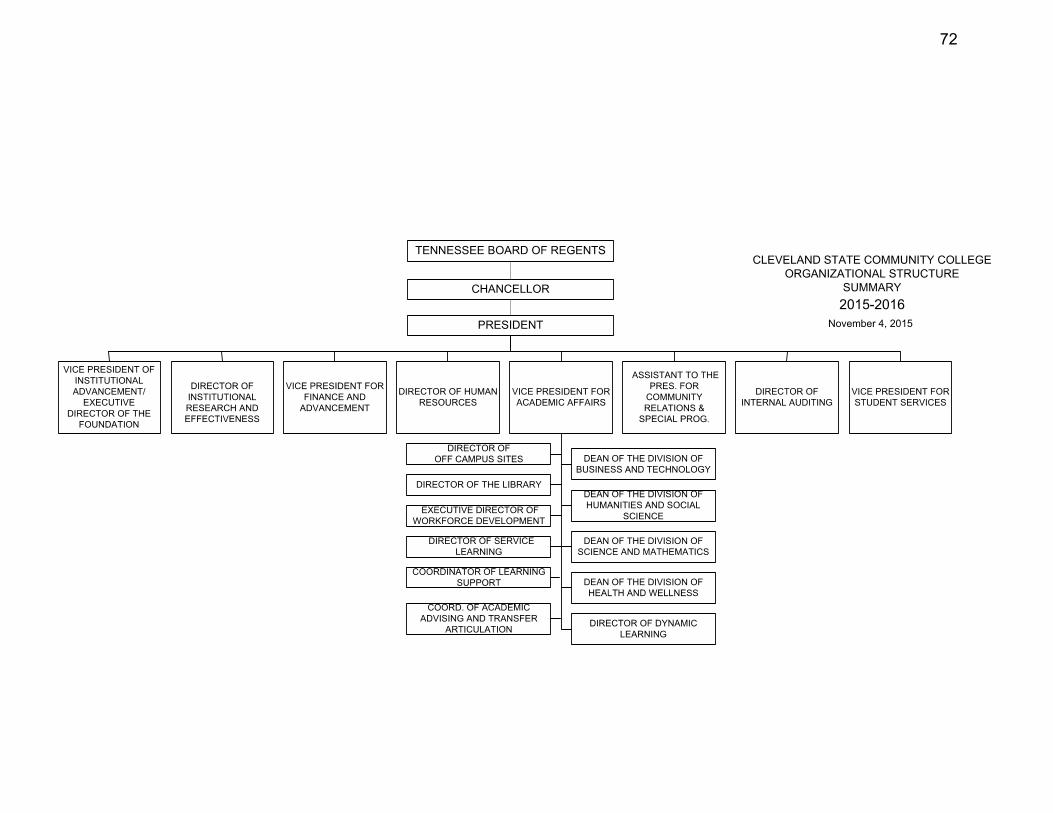
72

01 Exec/Admn/Mgr, 7, 3%
02 Faculty, 76, 38%
07 Svc/Maint, 9, 4%
06 Skill Crafts, 3, 2% 05 Tech/Para,
9, 4%
04 Cler/Sec, 40, 20%
03 Prof NonFac, 58, 29%
Regular Full-Time Personnel by EEO Classification 2014-15
Source: Human Resource Ofc, as of 04-11-16; pers_eeo
73
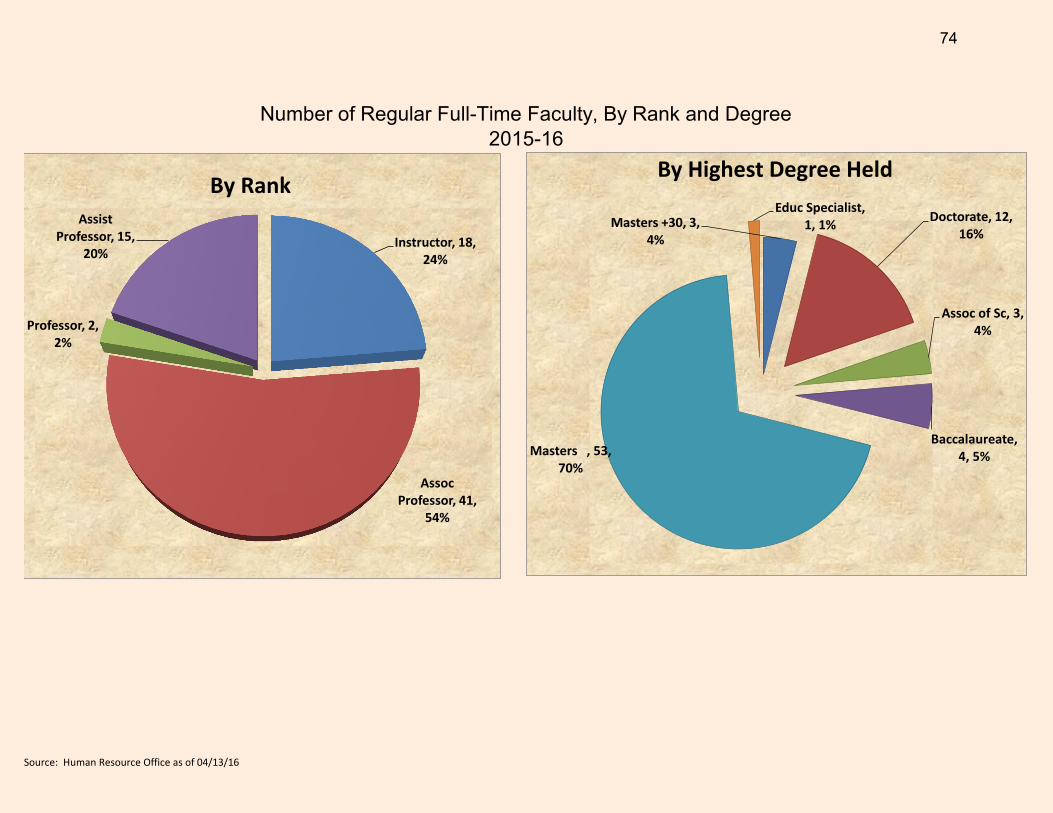
Instructor 18 Masters +30 3 3.9%
Assoc Professor 41 Doctorate 12 15.8%
Professor 2 Assoc of Sc 3 3.9%
Assist Professor 15 Baccalaureate 4 5.3%
76 Masters 53 69.7%
Educ Specialist 1 1.3%
76 98.7%
Number of Regular Full-Time Faculty, By Rank and Degree2015-16
Instructor, 18, 24%
Assoc Professor, 41,
54%
Professor, 2, 2%
Assist Professor, 15,
20%
By Rank
Masters +30, 3, 4%
Doctorate, 12, 16%
Assoc of Sc, 3, 4%
Baccalaureate, 4, 5% Masters , 53,
70%
Educ Specialist, 1, 1%
By Highest Degree Held
Source: Human Resource Office as of 04/13/16
74
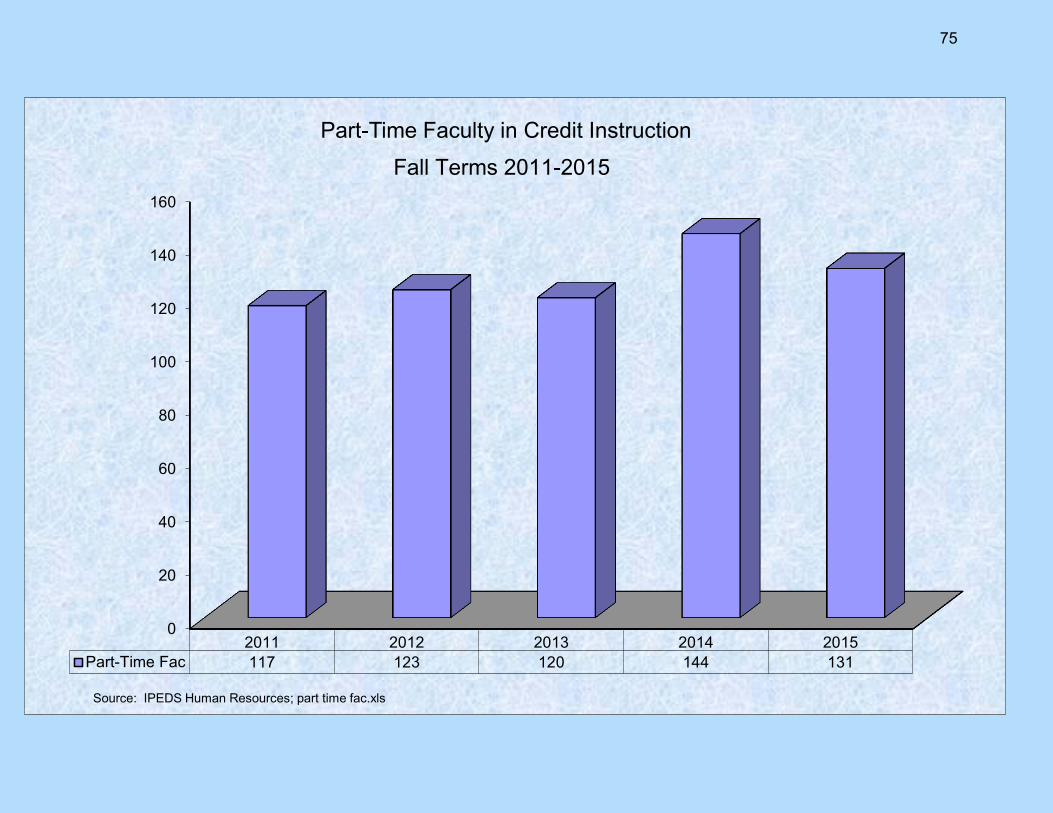
0
20
40
60
80
100
120
140
160
2011 2012 2013 2014 2015Part-Time Fac 117 123 120 144 131
Part-Time Faculty in Credit Instruction
Fall Terms 2011-2015
Source: IPEDS Human Resources; part time fac.xls
75

Source: Argos/Academic Affairs/Faculty/Faculty Load QV.
2011-12 2012-13 2013-14 2014-15 2015-16Part Time 24,623 22,070 20,388 19,852 20,631Full Time 54,772 43,791 44,512 41,559 42,404
54,772
43,791 44,512 41,559 42,404
24,623
22,070 20,388 19,852 20,631
0
10,000
20,000
30,000
40,000
50,000
60,000
70,000
80,000
90,000
Part-Time and Full-Time Faculty Productivity in Student Credit Hours Academic Year Totals for 2011-12 through 2015-16
Full-time faculty includes academic deans who teach; part-time faculty includes non-faculty employees who teach.
76

Cleveland State Community CollegePhysical Facilities
Structure Year of Gross Net Assignable EstimatedConstruction Square Feet Square Feet Replacement Value
D.F. Adkisson Administration 1967 24,362 13,445 $5,207,800George R. Johnson Cultural
Heritage Center 1978 18,340 11,481 $3,696,000Career Education Building 1974 26,578 $12,283,400L. Quentin Lane Gymnasium 1967
44,13935,542 $12,351,420
Mary T. Barker Humanities 197056,02825,289 14,855 $6,562,710
Library 1967 40,416 24,768 $7,379,820Maintenance 1973 9,964 8,962 $1,511,400Science 1967 23,850 14,577 $9,413,625Technology 1975 27,124 20,897 $5,246,400George L. Mathis Student Center 1967 36,971 21,736 $8,304,400North Physical Education Dugout 1980 474 0 $30,000West Physical Education Dugout 1980 247 0 $44,460Concession 2009 488 0 $87,840Buford Guy Observatory 1974 151 143 $56,625Pressbox (2) 2008 200 0 $28,000Softball Dugout - Visitor 1995 180 0 $32,400Softball Dugout - Home 1995 180 0 $32,400Athletic Storage (5) 2004 558 0
7$100,440
Small Business Incubator North 2011 8,199 ,664 $1,120,000Small Business Incubator South 1975 31,537 22,176 $7,016,240Athens Off-site Campus 2000 17,702 14,443 $3,540,400JA Building 1970 1,214 547 $169,960
Total 367,870 238,354 $84,215,740
Gross Square Feet includes all under-roof space
Net Assignable Square Feet includes only the interior area of academic, community service, support service and administrative rooms
Estimated Replacement Value is determined by a cost/square foot formula provided in the Mean Building Construction Cost. Data Manual.Value includes buildings and contentsSource: ClSCC Physical Facilities Inventory ; MS EXCEL, FB_FACIL.XLS
2015-2016
77

2006 2007 2008 2009 2010 2011 2012 2013 2014 2015
Assault 1 4 3 1 5 0 2 2 2 0
Burglary 0 0 0 3 1 1 0 0 0 1
Larceny 7 5 4 3 13 4 2 4 7 9
Vandalism 2 4 3 4 8 1 3 4 2 1
All Other Offenses 1 1 1 3 1 0 0 1 2 0
2006 2007 2008 2009 2010 2011 2012 2013 2014 2015
Undergraduate Students 2947 2999 3335 3615 3753 3814 3640 3790 3522 3509Staff Personnel 118 119 119 122 126 121 119 125 122 125Faculty Personnel 69 70 69 69 72 70 71 72 70 76Security Personnel 5 6 7 7 7 9 3 4 5 10
Total Campus Population 3139 3194 3530 3813 3958 4014 3833 3991 3719 3720
Source: Tennessee Bureau of Investigation, Crime on Campus, Statistical Report of Crimes on Campuses of all Tennesse Institutions of Higher Education, April, annually. Excel filename: CrimeonCampus.xls
Note: "In compliance with the federal Campus Sex Crimes Prevention Act and the TennesseeCollege and University Campus Sex Crimes Prevention Act of 2002, members of the campuscommunity may obtain the most recent information received from the Tennessee Bureau ofInvestigation (TBI) concerning sex offenders employed, enrolled or volunteering at thisinstitution at (Campus Security, Office of Public Safety, etc.). Information is also availableon the TBI's website listing of sex offenders located on the internet athttp://www.ticic.state.tn.us/SEX_ofndr/search_short.asp."
Total OffensesReported
COLLEGE CRIME STATISTICSCLEVELAND STATE COMMUNITY COLLEGE
Campus Population StatisticsFall Term Campus Population
78