
Fact Book 1970 I he University of Georgic › _resources › files › factbook ›...
125
LD 2090 .G38 1970 c. 3 Fact Book 1970 I he University of Georgic: J
Transcript of Fact Book 1970 I he University of Georgic › _resources › files › factbook ›...
I LD
2090 .G38 1970 c. 3
Fact Book 1970 I he University of Georgic: J

November 2, 1970
Dear Colleague:
The UNIVERSITY OF GEORGIA FACT BOOK was developed in 1969.
Its purpose is to provide a ready source of basic factual information for use in
answering common questions regarding the University, preparing grant pro
posals, developing long-range plans, replying to questionnaires, recruiting
new faculty members, and preparing speeches for various occasions. Its publi
cation is a first step toward alleviating the problems of University personnel in
securing necessary data.
This 1970 edition of THE UNIVERSITY OF GEORGIA FACT BOOK is
being distributed to each faculty member of the University. We hope that
this information will be helpfu I to you and wi II enhance your understanding of
the scope and progress of your University. Your comments and suggestions on
this publication will be welcome.
Sincerely yours,
~J 1f. G~~t;;;'-' ,,~ S. W. Pelletier, Provost


Fact Book 1970 /The University of Georgia
Edited by Nathan R .. Keith, Jr ..
Office of Institutional Research and Planning
PREFACE
The basic purpose of this Fact Book is to present useful objective
information about the University of Georgia. It is by no means an exhaustive
presentation of statistical information about the University. The editor has
attempted to include information which might be relevant to the audience for
which The Fact Book is designed. This is the second edition of The Fact Book.
Additional information has been included and the information from the 1969
Fact Book has been updated to 1970.
This information was obtained from the various campus offices responsible
for generating the source data. Because of the number of offices involved,
minor inconsistencies may occur since some related information was collected
and summarized at different points in time. The editor appreciates the excellent
cooperation that he received from all offices in collecting the data.
This project is conducted as a service to the University by the Office of
Institutional Research and Planning. Suggestions, corrections, and criticisms
ore solicited and should be sent to the editor at the Office of Institutional
Research and Planning.
N.R.K.

TABLE OF CONTENTS
List of Figures
I. ADMINISTRATION Central Administrative Officers Colleges and Schools, Dates of Establishment and Deans Institutes and Service Agencies
II. ADMISSIONS New Freshmen - Fall 1961 -70 Summary of New Freshmen by High School Summary of New In-State Transfers
Ill • ENROLLMENT Cumulative Summer School Enrollment (Head Count) 1961-70 Fall Quarter Enrollment by Class Levels (Head Count) 1961-70 Fall Quarter Enrollment by Schools and Colleges 1961-70 Fall Quarter Enrollment by Sex 1961-70 Resident/Non-Resident Distribution of Campus Enrollment Cumulative Campus Enrollment by States
Fall, Winter, Spring 1968-69 and 1969-70 Foreign Students Fall 1970 Distribution of Foreign Students by Country Fall 1970
IVo DEGREES COI"~FERRED
Total Degrees Conferred by School or Coli ege 1961 -70 Graduate Degrees Conferred 1961-70 Types of Degrees Conferred 1961-70 Undergraduate and Professional Degrees Conferred
by Year, School, and Sex 1961 -70
V. OTHER STUDENT RELATED INFORMATION Class Sizes, Sect , and Credit Hours Distribution of Honors Students by Major Honors Program-- Enrollment Numbers and Section Numbers
for Individual Quarters Honors Program Degrees Course Exemptions through Advanced
Summer/Fall 1969 on
Scores 1969 National Honorary Fraternities
Ill
Tests
Achievement
Page
VI
2 2 3
5 6 8
11 12 16 17 18 19
20 20
22 24 26 31
36 37 38
38 39
39
Social Fraternities Cumulative Fraternity Scholastic Averages Social Sororities Cumulative Sorority Scholastic Averages Graduate Fellows and Assistants University Health Services Financial Aid Programs --University Administered Financial Aid Programs -- Private and State Administered Placement Services Georgia Athletic Association Georgia Head Coaches Athletes at the University of Georgia, Spring Quarter 1970 Academics Pertaining to Scholarship Athletes University of Georgia Athletic Facilities Georgia Athletic Training Facilities Georgia Southeastern Conference Championships
VI. FACULTY Faculty by Rank-- Total University 1969-70 Highest Earned Degrees Held by Faculty Members -
Total University 1969-70 Faculty Average Salaries
VII. LIBRARY Growth in Volumes Growth in Non-Book Holdings Circulation Statistics 1969-70 Special Collections
VIII. RESEARCH Source of all Research Funds 1969-70 Source of Research Funds from Grants and Contracts 1969-70 Source of Grant and Contract Research Funds
• SERVI Alumni lations Bureau Educational Studies and Field Services The Center for Management Systems Development and Analysis Computer Center
Extension Service The Georgia Center for Continuing Education
Services D Commun
The Institute for Behavioral Research
Page
41 42 43 44 45 46 49 50 51 52 52 53 53 54 54 55
57 57
58
60 60 61 61
63 65 67
70 73
76 77 78 79 80 81
The Institute of Community and Area Development The Institute of Continuing Legal Education in Georgia The Institute of Ecology The Institute of Government The Institute of Higher Education The Institute of Natural Resources The Services Program of the College of Business Administration
X. REVENUE Sources, Amounts, and Percentages of Revenue 7/1/69 - 6/30/70 Expenditures by Amounts and Percentage 7/1/69 - 6/30/70 State Appropriations for Various Services, 1968-69, 1969-70,
1970-71 Percentage of Distribution from Various Sources of Income
for Resident Instruction 1960-61 through 1969-70 State of Georgia Appropriations 1960-61 through 1969-70
XI. AUXILIARY ENTERPRISES University Bookstore University Food Service University Golf Course University Printing Department
XII. PHYSICAL FACILITIES Main Campus Major Academic Buildings and Dates of Initial Occupancy Major Building Projects Since 1960
Completed Projects Projects Currently Under Construction Authorized Projects Being Planned
Land Holdings Residence Halls Fraternity and Sorority Buildings Residence Summary Married Housing Units Campus Bus System Maintenance and Operating Personnel for University Facilities
v
Page
82 83 84 85 86 87 88
90 91 92
93
94
96 97 98 98
100 1 01
103 106 107 108 109 110 111 112 113 114

LIST OF FIGURES
Figure Page
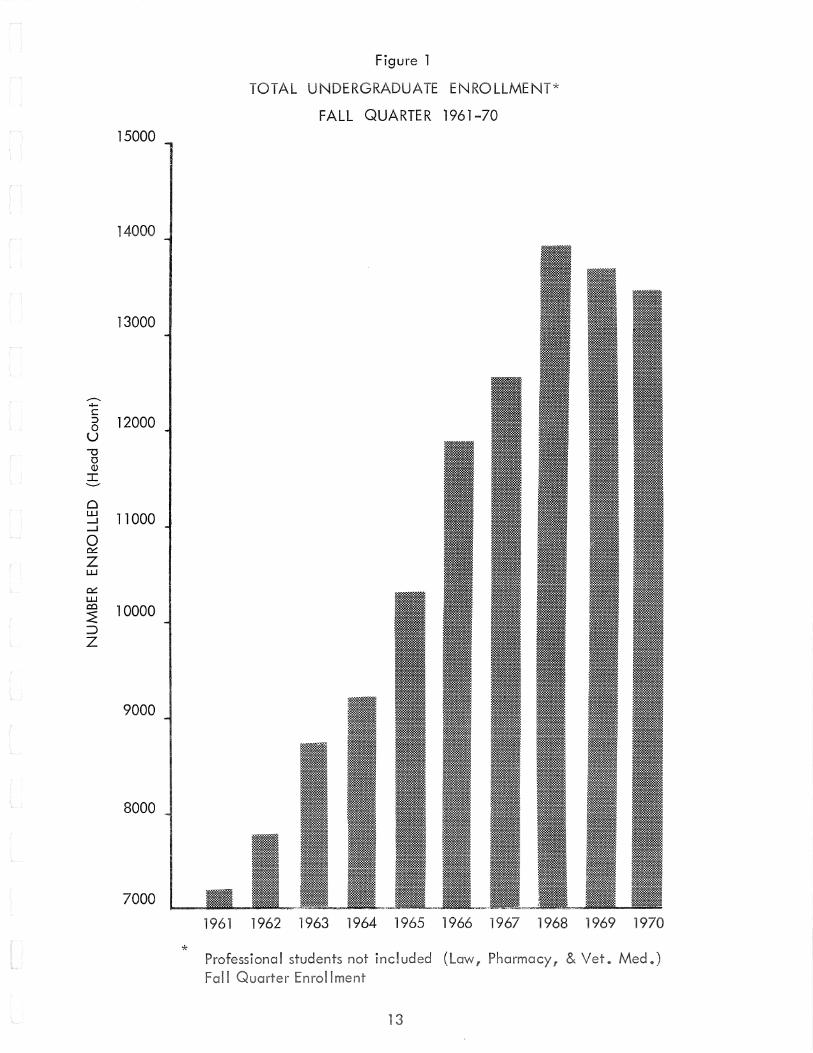
Total Undergraduate Enrollment Fall Quarter 1961-70 13
2 Total Professional Enrollment Fall Quarter 1961-70 14
3 Total Graduate Enrollment Fall Quarter 1961-70 15
4 Total Degrees Conferred 1961-70 23
5 Graduate Degrees Conferred 1961-70 25
6 Masters Degrees Conferred 1961 -70 29
7 Doctoral Degrees Conferred 1961-70 30
8 Baccalaureate Degrees Conferred 1961-70 33
9 Professional Degrees Conferred 1961-70 34
Administration
---

CENTRAL ADMINISTRATIVE OFFICERS
Fred C. Davison
S. William Pelletier
GeorgeS.
Robert C. Anderson
John W. Fanning
John L. Green, Jr.
President
Provost
Vice
Vice President for Research
Vice President for Services
Vice President for Business and Finance
COLLEGES AND SCHOOLS DATE OF ESTABLISHMENT AND DEAN
DATE DEAN
College of Arts and Sciences 1801 H. Boyd McWhorter
School of Law 1859 M. Lindsey Cowen
School of Pharmacy 1903 Kenneth L. Waters
College of Agriculture 1906 Henry W. Garren
School of Forest Resources 1906 Allyn M. Herrick
College of Education 1908 Joseph A. Williams
Graduate School 1910 Thomas H. Whitehead
College of 1912 lliam C. F
School of Journalism 1915 Warren K. Agee
School of Home Economics 1933 Mary Speirs
School of Veterinary Medi 1946 Richard B. Talbot
School of Social Work 1964 Charles A. Stewart
School B.
2
I

INSTITUTES AND SERVICE AGENCIES
Bureau of Educational Studies and Field Services
Center for Management Systems Development and Analysis
Computer Center
Cooperative Extension Service
Georgia Center for Continuing Education
Institute of Comparative Medicine
institute of Community and Area Development
Institute of Continuing Legal Education
Institute of Ecology
Institute of Government
Institute of Higher Education
Institute of Natural Resources
Services Division, College of Business Administration
University Library
DIRECTOR
Doyne M. Smith
Fred H. Wise
James L. Carmon
Linton W. Eberhardt, Jr.
Thomas W. Mahler
Richard B. Talbot
Ernest E. Melvin
James W. Curtis
Eugene P. Odum
Morris W. H. Coli ins, Jr.
Cameron L. Fincher
E. Leonard Cheatum
W. Wray Buchanan
W. Porter Kellam

Admissions

(,)1
Fc1 Quarter
1961
1962
1963
1964
1965
1966
1967
1968
1969
1970
NEW FRESHMEN
Fall 1961-70
Applied
-2835
3094
3567
3981
4685
5150
5207 *
5672 *
5484
5600
Admitted
2220
2495
2830
3246
3873
4013
3691 *
4416 *
4159 *
4291
* Does not include Summer --approximately 200 enrolled each summer.
Source: Admissions Office
Enrolled
1745
1917
2084
2285
2536
2512
2482 *
2677 *
2456 *
2486

High School
Athens
Avondale
Briarcliff
Chamblee
Columbus
Cross Keys
Druid Hills
Dykes
Grady
Hardaway
Henderson
Jenkins
Lakeside
Lanier
Marietta
A. L. Miller
North Fulton
Northside
North Springs
SUMMARY OF NEW FRESHMEN
Fall 1970
Richmond Academy
Sandy Springs
St. Pius X
Male
58
7
21
10
13
4
12
21
10
6
13
15
24
25
15
0
4
19
20
11
9
4
HIGH SCHOOL*
Female Total
49
16 23
24 45
18 28
9 22
11 15
5 17
8 29
13 23
15 21
11 24
11 26
29 53
0 25
13 28
28 28
13 17
15 34
25
20 44
16
7 16
17 21
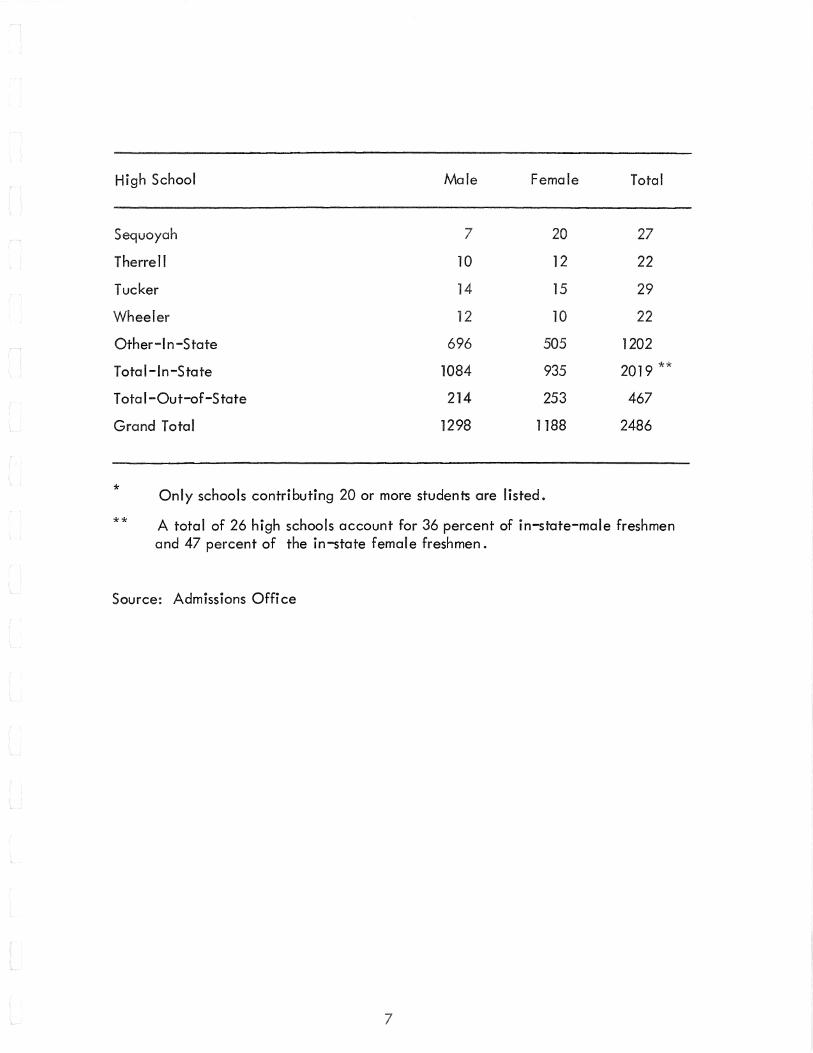
High School Male Female Total
Sequoyah 7 20 27
Therrell 10 12 22
Tucker 14 15 29
Wheeler 12 10 22
Other-In-State 696 505 1202
Total-In-State 1084 935 2019 **
Total-Out-of-State 214 253 467
Grand Total 1298 1188 2486
* Only schools contributing 20 or more students are listed.
** A total of 26 high schools account for 36 percent of in-state-male freshmen and 47 percent of the in-state female freshmen.
Source: Admissions Office
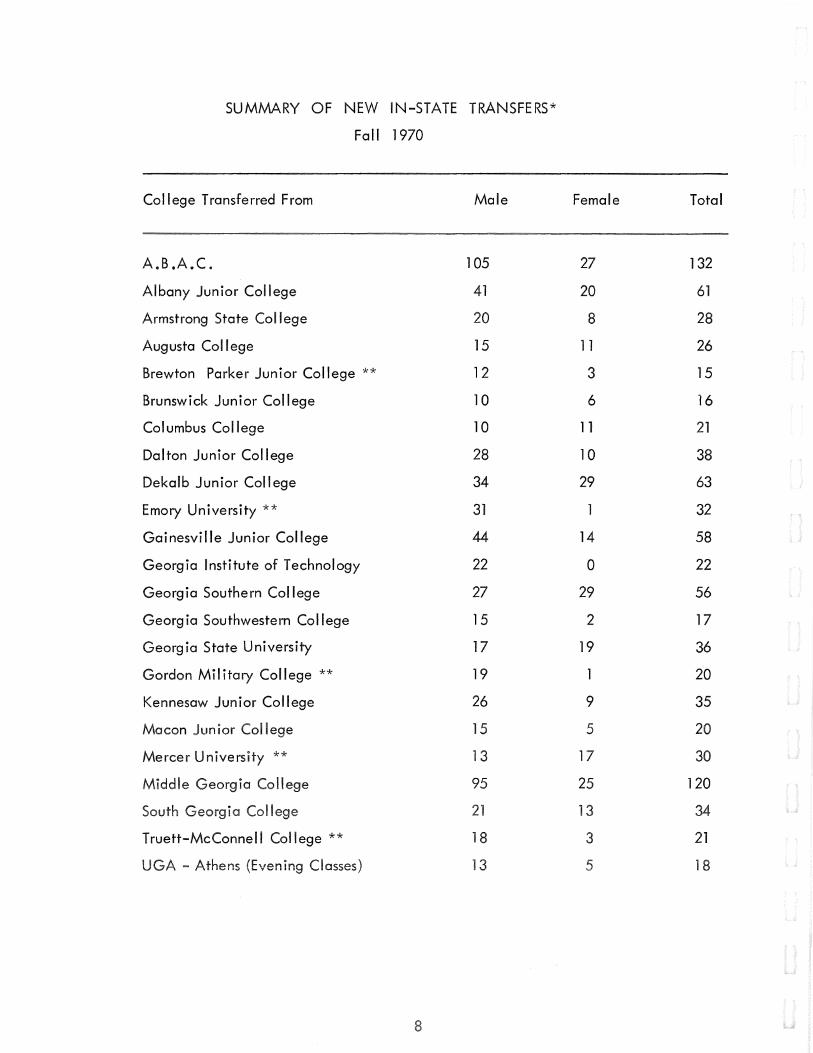
SUMMARY OF NEW IN-STATE TRANSFERS*
Fall 1970
College Transferred From Male
A.B.A.C. 105
Albany Junior College 41
Armstrong State College 20
Augusta College 15
Brewton Parker Junior College ** 12
Brunswick Junior College 10
Columbus College 10
Dalton Junior College 28
Dekalb Junior College 34
Emory University ** 31
Gainesville Junior College 44
Georgia Institute of Technology 22
Georgia Southern College 27
Georgia Southwestern College 15
Georgia State University 17
Gordon Military College ** 19
Kennesaw Junior College 26
Macon Junior College 15
Mercer University ** 13
Middle Georgia College 95
South Georgia College 21
Truett-McConnell College ** 18
II - Athens (Evening Classes) 13 ...,
8
Female Total
27 132
20 61
8 28
11 26
3 15
6 16
11 21
10 38
29 63
32
14 58
0 22
29 56
2 17
19 36
20
9 35
5 20
17 30
25 120
13 34
3 21
5 18

Co II ege Transferred From Male Female Total
Valdosta State College 11 19 30
West Georgia College 28 39 67
Young Harris College ** 24 24 48
All Other In State 88 4 92
Total In State 802 424 1226
Total Out-of-State 336 299 635
Grand Total 1138 723 1861
* All schools listed with 15 or more transfers.
** Private Institutions
Source: Admissions Office
9

Enrollment
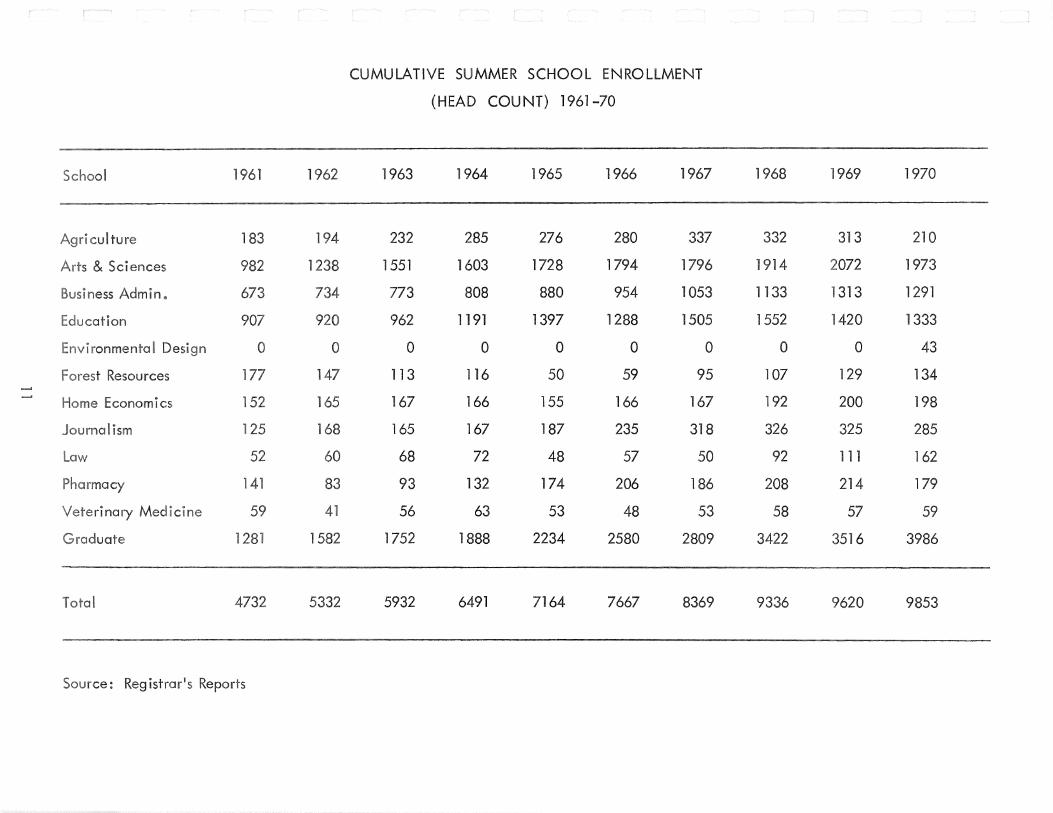
CUMULATIVE SUMMER SCHOOL ENROLLMENT
(HEAD COUNT) 1961-70
1963 1964 1965 1966 1967 1968 969 1970

~
1'-) lst
Year
L
FALL QUARTER ENROLLMENT BY CLASS LEVELS (HEAD COUNT) 1961-70
l 1 1962-63 1963-64 1964-65 1965-66 1966-67 1967-68 1968-69 1969-70 1970-71
2211 2470 2703 2806 2714 3317 3000 3238
1811 880 2058 1857 2393 2872 2573 2851 2828 2646
987 2302 2439 2383 3302 3538 3934 3844 3766
1585 682 2032 2321 2628 2706 3530 3645 3809 3790
990 1133 1101 1397 1725 2157 2718 3182 3489
. 1 256 202 283 286 350 375 369 413 473
161 184 225 180 221 207 252 258 275 312
1 150 179 217 206 250 234 288 259 297
45 56 63 52 49 52 54 60 60
1 185 154 163 255 193 188 218 218 215
8647 9421 10552 11094 12524 14460 15613 17652 17888 18286
Registrar's Reports
.--.. .... s:: ::> 0
u "U 0 <1>
I
0 w __J __J
0 0<::
z w
0<:: w ca ~ ::J z
15000
14000
13000
12000
11000
10000
9000
8000
7000
*
Figure 1
TOTAL UNDERGRADUATE ENRO
FALL QUARTER 1961-70
*
1961 1962 1963 1964 1965 1966 1967 1968 1969 1970
& .)
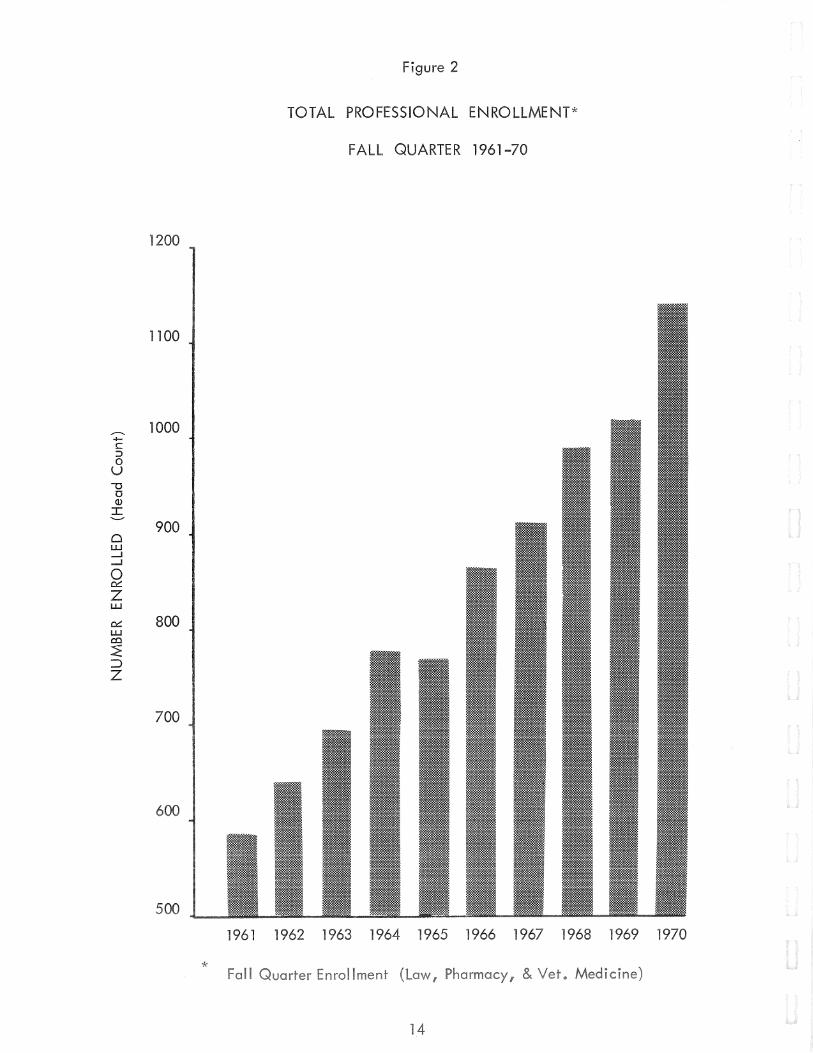
Figure 2
TOTAL PROFESSIONAL ENROLLMENT*
FALL QUARTER 1961-70
1200
1100
---- 1000 ..... c ::::> 0 u ""0 0 (J)
I ------- 900 0 w -I -I
0 0::::
z w
0:::: 800 w co ~ ::)
z
700
*
4
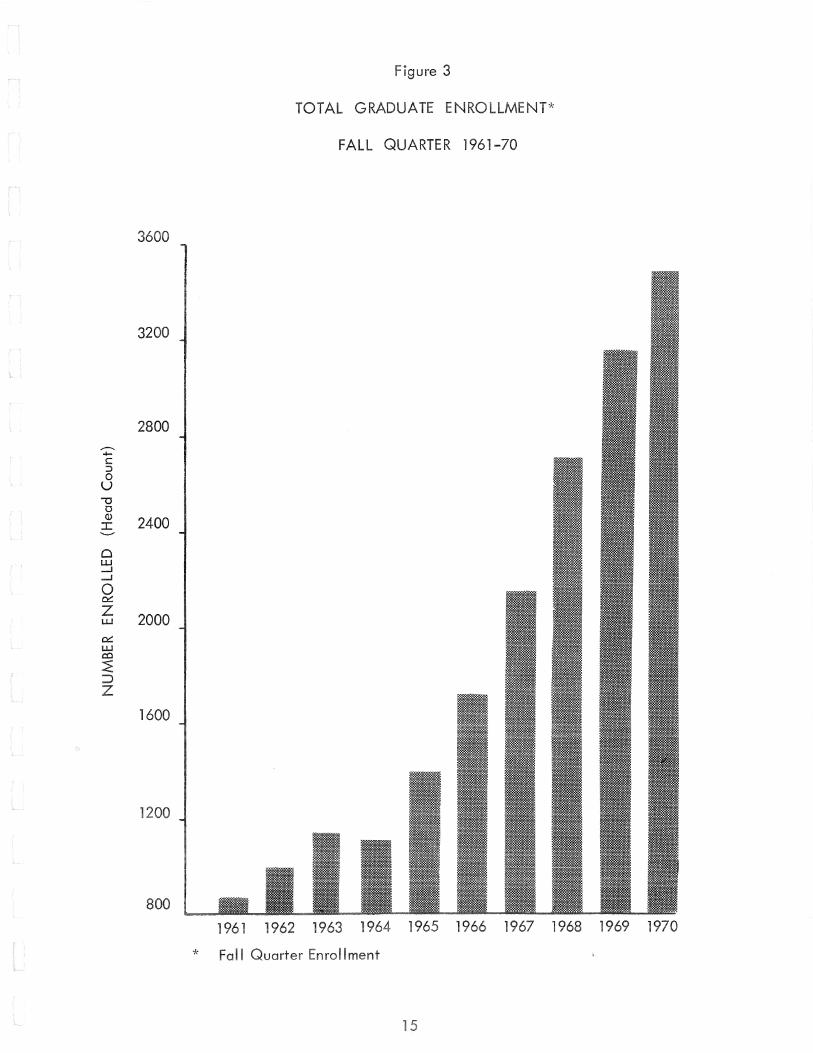
Figure 3
TOTAL RADUATE ENRO
FALL QUARTER 1961-70
3200
2800 ----.. .... c ::> 0 u
""0 0 ;j) 2400 I
0 w ....J ....J
0 0::::
z 2000 w
0:::: LJ.J co :2: ::J z
1600
800
* lment

0..
FALL QUARTER ENROLLMENT BY SCHOOLS & COLLEGES 1961-70
1961-62 1962-63 1963-64 1964-65 1965-66 1966-67 1967-68 1968-69 1969-70 1970-71
culture 611 623 720 746 803 899 904 857 679 657
& Sciences 2766 3290 3877 4159 4658 5230 5282 5921 5680 5884
ness Administration 1703 1718 1777 1858 2091 2389 2486 2803 2767 2670
1158 1211 1360 1445 1633 1943 2285 2657 2728 2658
ronmental Design 137* 151
Resources 260 203 211 202 211 288 343 341 364 328
1-1 '"'"""' E con om i cs 336 360 357 312 350 397 393 470 487 487
ism 354 376 420 494 562 733 850 890 840 807
189 224 222 217 203 246 283 326 401 499
174 187 235 .325 348 400 395 421 378 409
rinary Medicine 223 229 240 235 218 220 235 248 245 247
School 873 990 1133 1101 1397 1725 2157 2718 3182 3489
8647 9421 10552 11094 12474 14460 15613 17652 17888 18286
* Formerly included in Agriculture.
: Registrar 1s Reports
1961-62
1962-63
1963-64
1964-65
1965-66
1966-67 ~
"'l 1967-68
1968-69
1969-70
1970-71
Source: Registrar 1s Reports
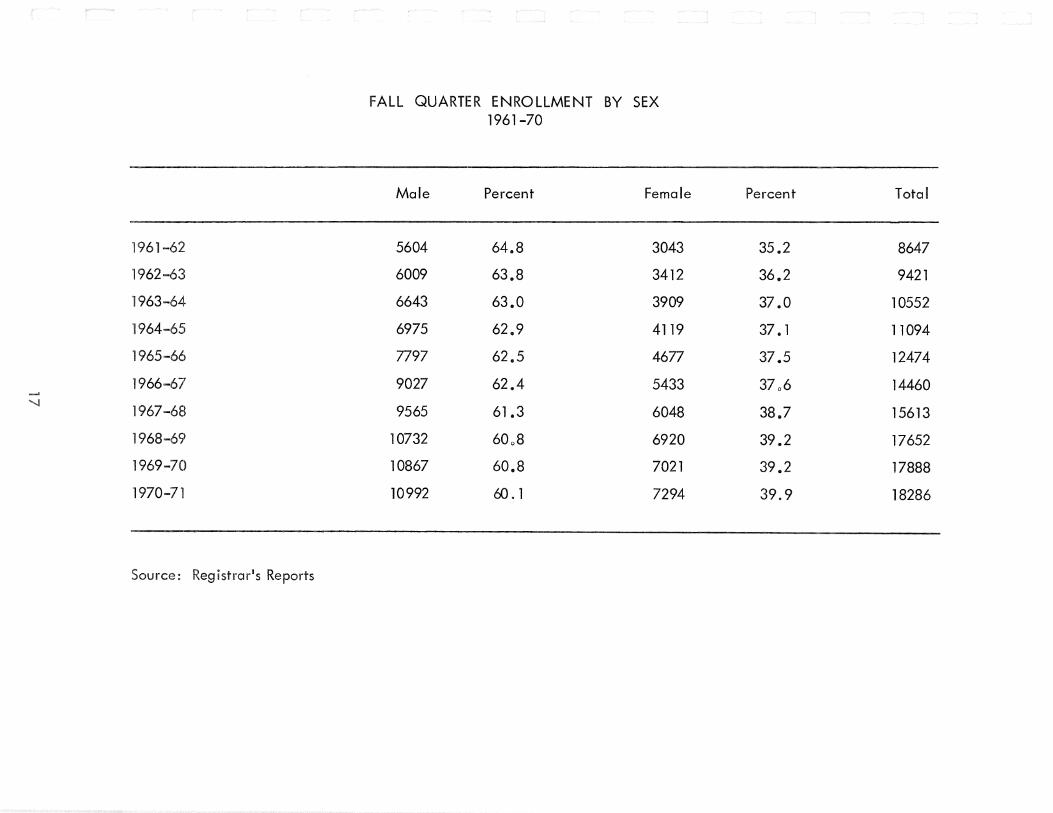
FALL QUARTER ENROLLMENT BY SEX 1961-70
Male Percent Female
5604 64.8 3043
6009 63.8 3412
6643 63.0 3909
6975 62.9 4119
7797 62.5 4677
9027 62.4 5433
9565 61.3 6048
10732 60o8 6920
10867 60.8 7021
10992 60. 1 7294
Percent Total
35.2 8647
36.2 9421
37.0 10552
37.1 11094
37.5 12474
37o6 14460
38.7 15613
39.2 17652
39.2 17888
39.9 18286
Sl
on this
Reports
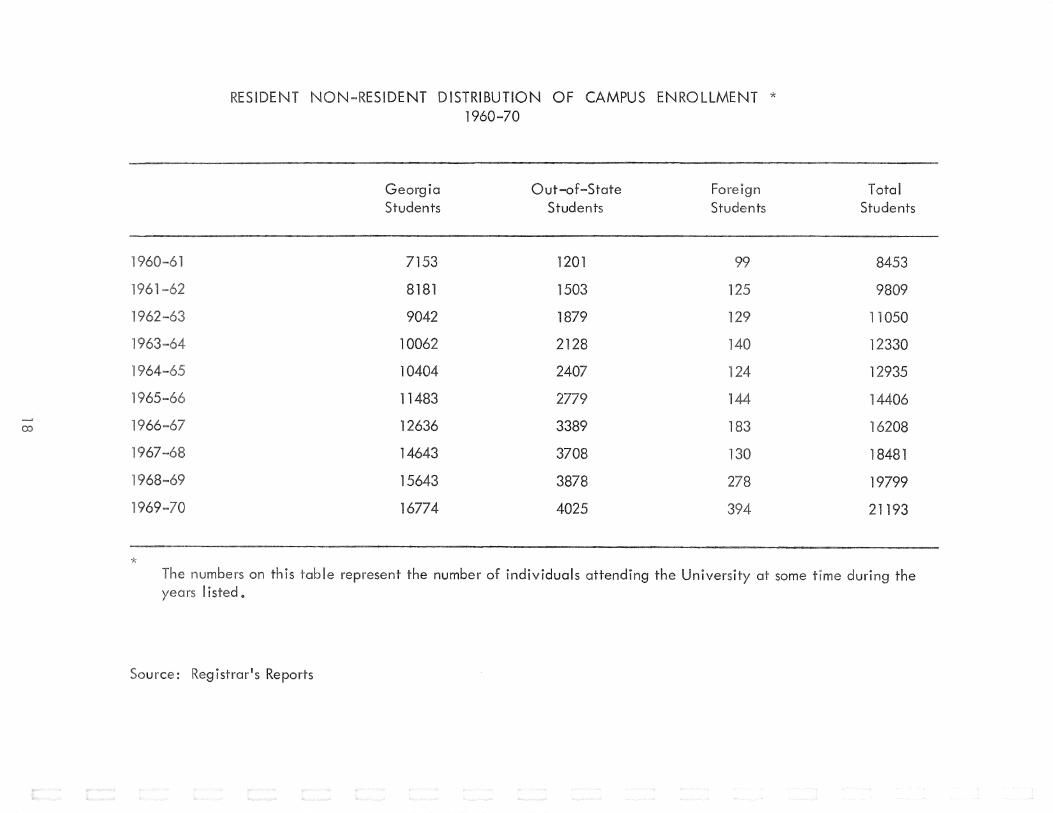
SIDENT DISTRIBUTION OF CAMPUS E 1960-70
Georg Students
7153
8181
9042
10062
10404
11483
12636
14643
15643
16774
Out-of-State Students
1201
1503
1879
2128
2407
3389
3708
3878
4025
represent the number of individuals attending the
LLMENT *
8453
1
1 1050
1 12330
12935
1 14406
1 6208
1 18481
19799
21193
at some the
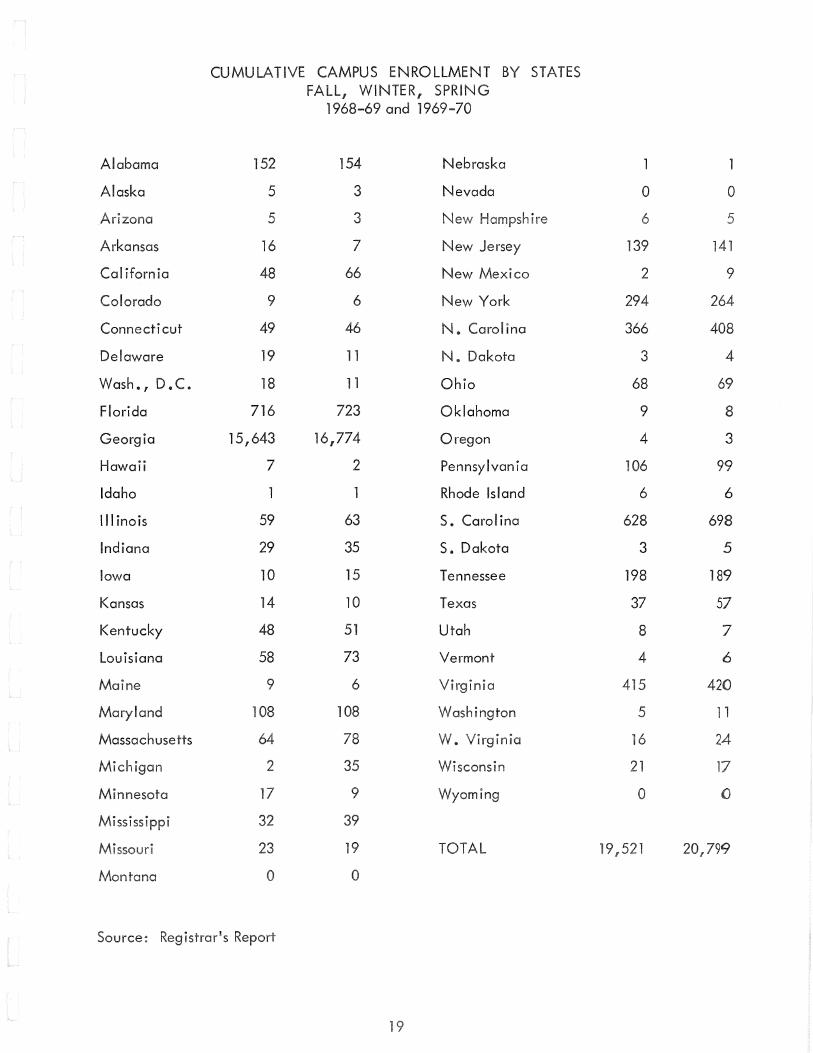
Alabama
Alaska
Arkansas
California
Colorado
Connecticut
Delaware
Wash., D.C.
Florida
Georgia
Hawaii
Idaho
Illinois
indiana
Iowa
Kansas
Kentucky
Louisiana
Maine
Maryland
Massachusetts
Minnesota
Source: Reg
CUMULATIVE CAMPUS ENROLLMENT BY STATES FALL, WINTER, SPRING
1968-69 and 1969-70
152 154 Nebraska
5 3 Nevada
5 3 ire
16 7 New Jersey
48 66 New Mexico
9 6 New York
49 46 N. Carolina
19 ll N. Dakota
18 11 Ohio
716 723 Oklahoma
15,643 16,774 Oregon
7 2 Pennsylvania
Rhode Island
59 63 S. Carol ina
29 35 S. Dakota
10 15 Tennessee
14 10 Texas
48 51 Utah
58 73 Vermont
9 6 Virgi
l 08 108 Washington
64 rgin
2 35
17 9 Wyoming
32
19
0 0
Report
0 0
6 5
139 141
2 9
294 264
366 408
3 4
68 69
9 8
4 3
106 99
6 6
628 698
3 5
198 189
37 57
8 7
4 6
415 420
5 11
16
21 17
0 0
799
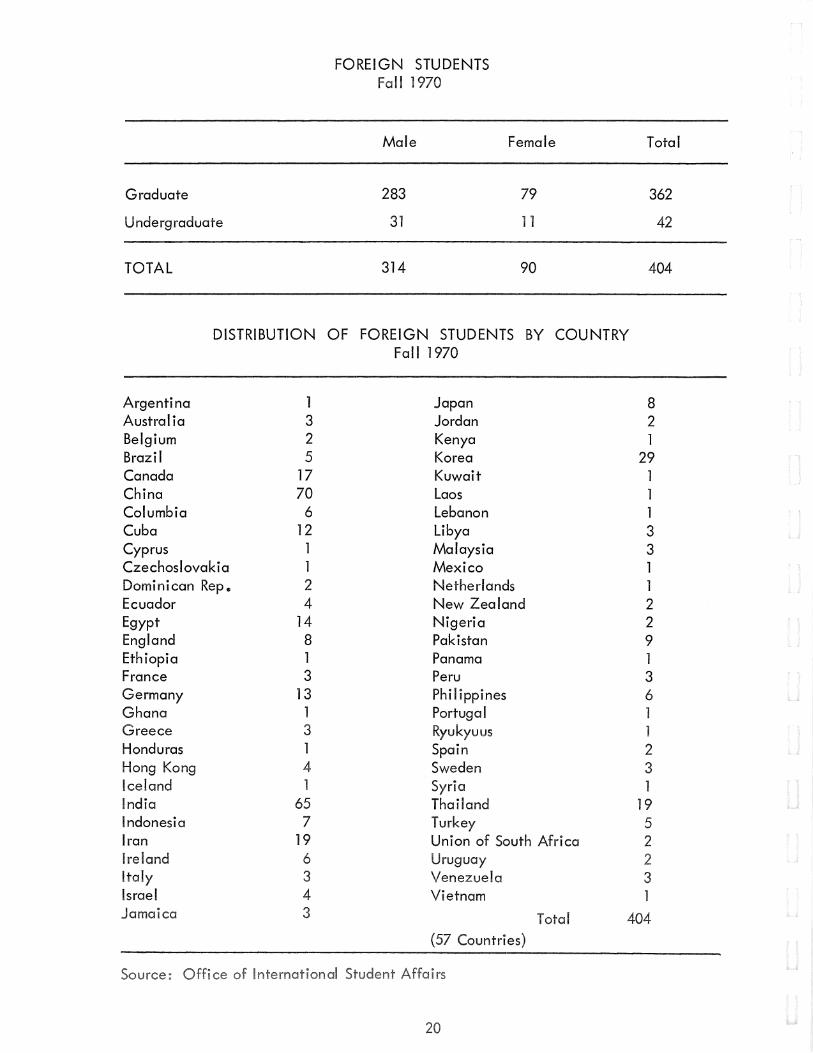
Graduate
Undergraduate
TOTAL
DISTRIBUTION
Argentina 1 Australia 3 Belgium 2 Brazil 5 Canada 17 China 70 Columbia 6 Cuba 12 Cyprus 1 Czechoslovakia 1 Dominican Rep. ")
L..
Ecuador 4 Egypt 14 England 8 Ethiopia l France 3 Germany 13 Ghana 1 Greece 3 Honduras 1 Hong Kong 4 Iceland 1 India 65 Indonesia 7 Iran 19 Ireland 6 Italy 3 Israel 4
ca 3
FOREIGN STUDENTS Fall 1970
Male
283
31
314
Female
79
11
90
Total
362
42
404
OF FOREIGN STUDENTS BY COUNTRY Fall 1970
Japan 8 Jordan 2 Kenya 1 Korea 29 Kuwait 1 Laos 1 Lebanon 1 Libya 3 Malaysia 3 Mexico 1 Netherlands New Zealand 2 Nigeria 2 Pakistan 9 Panama 1 Peru 3 Philippines 6 Portugal 1 Ryukyuus 1 Spain 2 Sweden 3 Syria 1 Thailand 19 Turkey 5 Union of South Africa 2 Uruguay 2 Venezuela 3 Vietnam 1
404 (57 Countries)
Degrees Conferred
culture
&
cs 71
42
cine
1
*
Registra
1
367
383
4
47
58
326
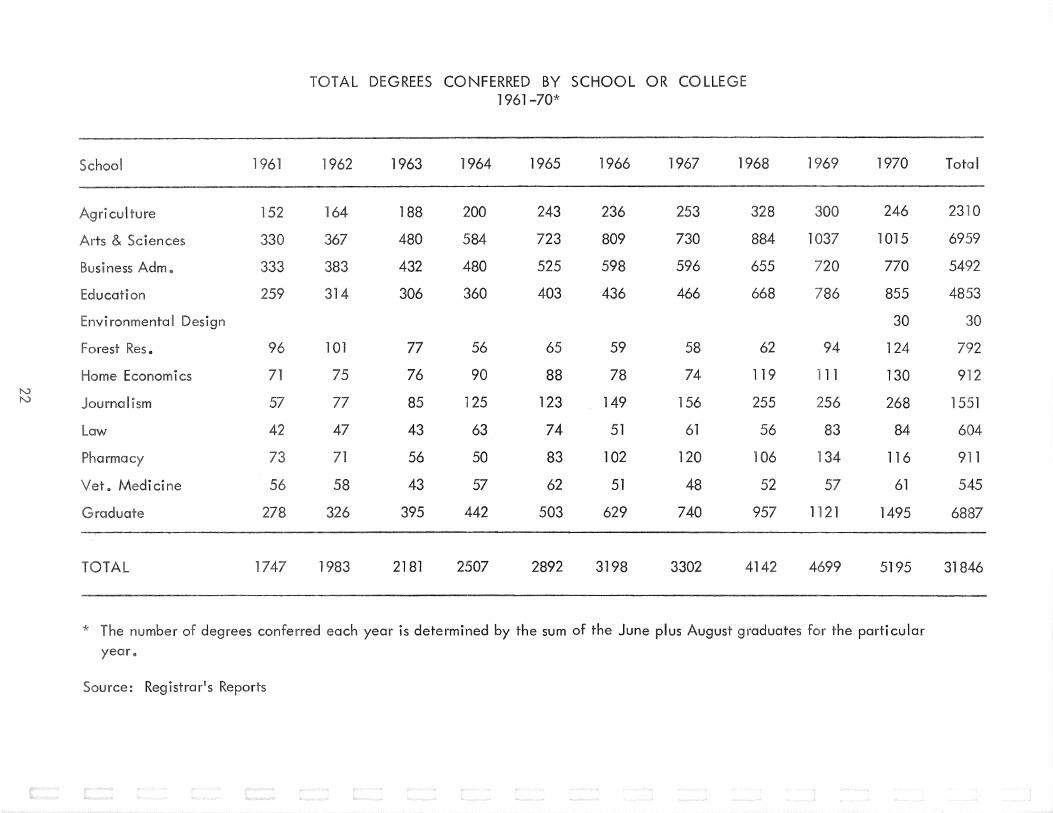
DEGREES CONFERRED BY SCHOOL OR CO 1961-70*
1963 1964 1965 1966 1967
188 200 243 236 253
480 584 723 809 730
432 480 525 598 596
306 360 403 436 466
77 56 65 59 58
76 90 88 78 74
85 1125 123 149 156
43 63 74 51 61
56 50 83 102 120
43 57 62 51 48
395 442 503 629 740
2181 2507 2892 3198 3302
1968 1 1970
328 246
884 1 1015
655 720 770
668 855
30
62 124
119 11 130
255 268
56 83 84
106 34 116
52 61
1 21 1495
42 4699 5195
each year is determined by the sum of the June plus August graduates for the particular
Total
23 0
5492
4853
9 2
1551
604
9 1
545
6887
31846
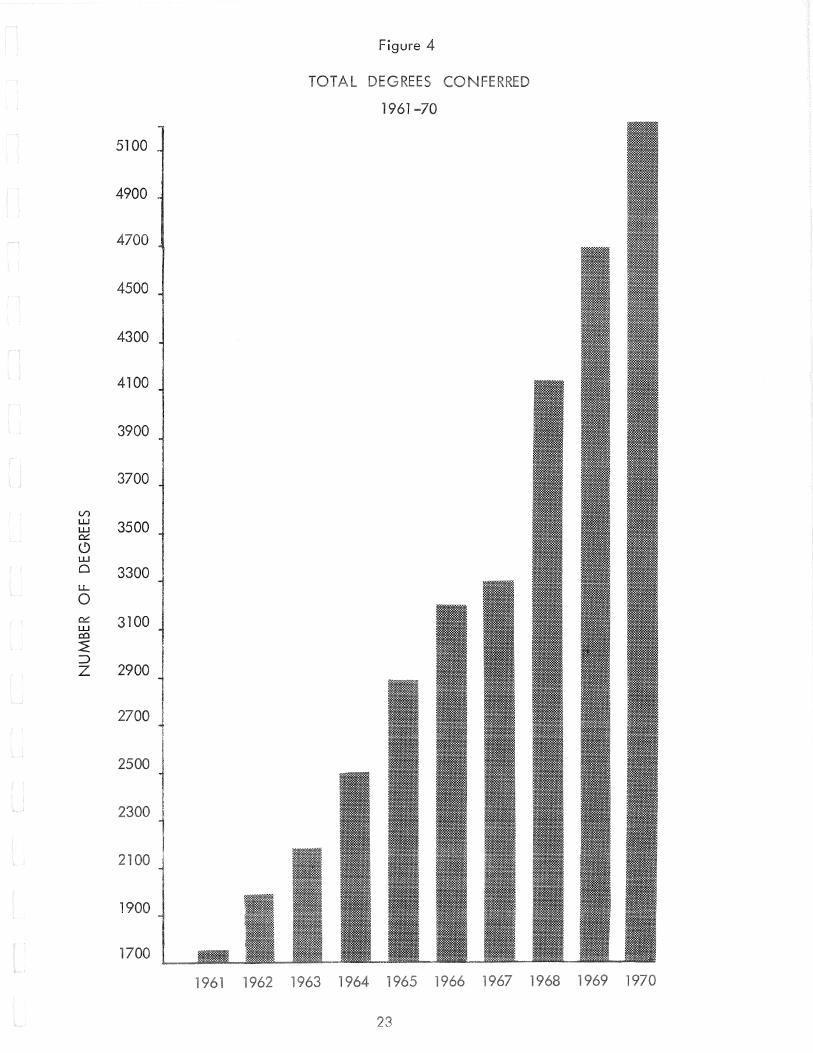
Figure 4
1961
5100
4900
4700
4500
4300
4100
3900
3700
Vl w 3500 w 0:::
0 w 0 3300 LL
0 0::: 3100 w co ~ ::J z 2900
21
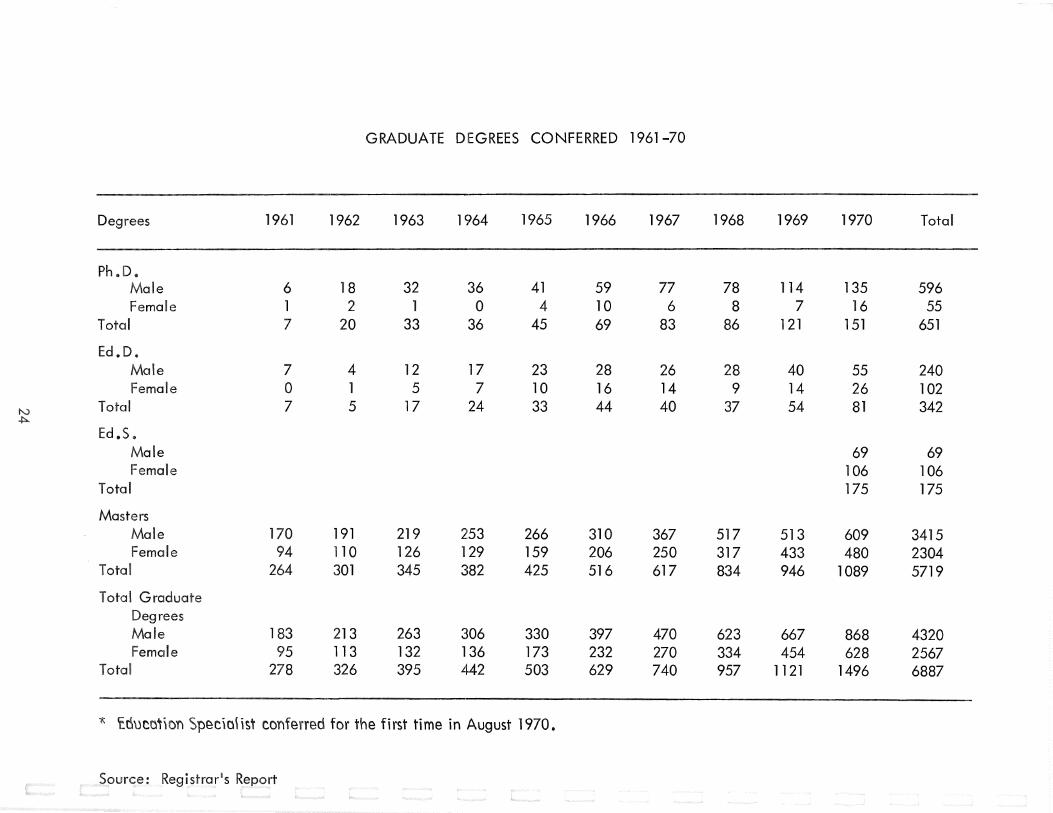
GRADUATE DEGREES CONFERRED 1961-70
Degrees 1961 1962 1963 1964 1965 1966 1967 1968 1969 1970 Total
-Ph .D.
Male 6 18 32 36 41 59 77 78 114 135 596 Female 1 2 1 0 4 10 6 8 7 16 55
Total 7 20 33 36 45 69 83 86 121 151 651
Ed .D. Male 7 4 12 17 23 28 26 28 40 55 240 Female 0 1 5 7 10 16 14 9 14 26 102
Total 7 5 17 24 33 44 40 37 54 81 342
Ed.S. Male 69 69 Female 106 106
Total 175 175
Masters Male 170 191 219 253 266 310 367 517 513 609 3415 Female 94 110 126 129 159 206 250 317 433 480 2304
Total 264 301 345 382 425 516 617 834 946 1089 5719
Total Graduate Degrees Male 183 213 263 306 330 397 470 623 667 868 4320 Female 95 113 132 136 173 232 270 334 454 628 2567
Total 278 326 395 .£142 503 629 740 957 1121 1496 6887
" !.0\)CO,)Dn Spec\o\ist conferred for the first time in August 1970.
Source: Registrar 1s Report
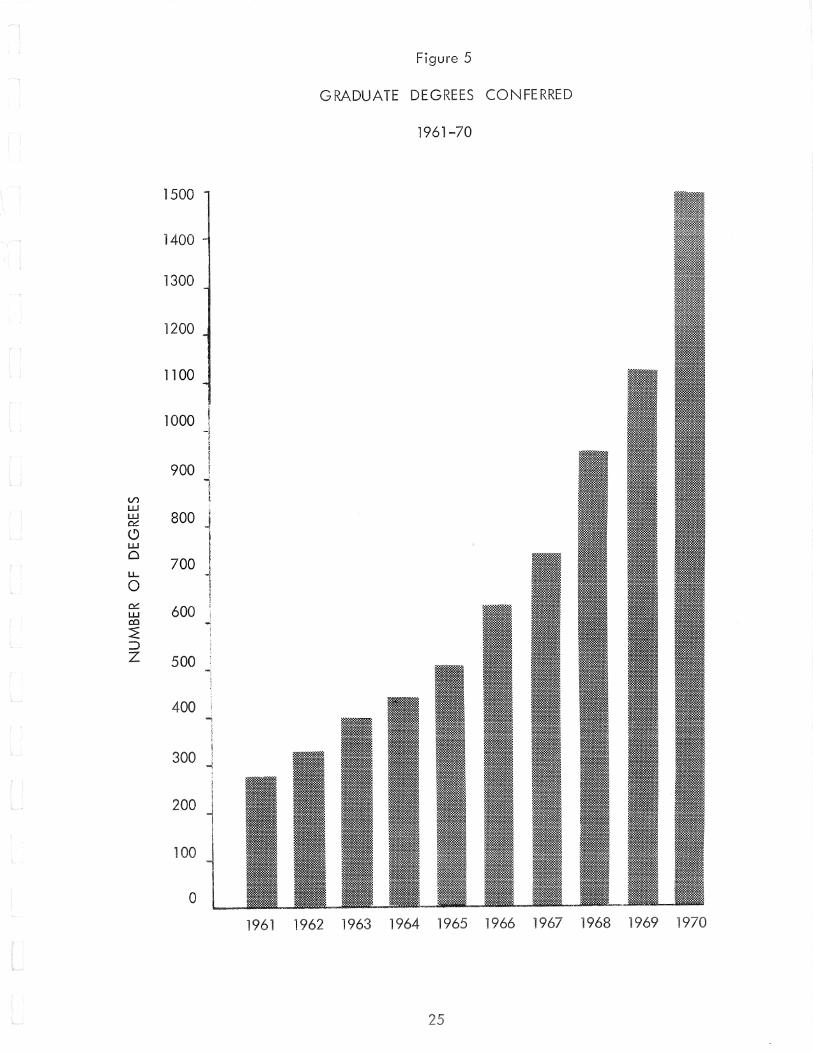
Figure 5
GRADUATE DEGRE CONFERRED
1961-70
1500
1400
1300
1200
1100
1000 -i : ' I
900 I !
l Vl I u.J i u.J 800 0.:: J 0 ! u.J ! 0
700 I ' Ll... i
0 !
0.:: ~
600 I
u.J co ..;
~ ~ ::J z 500
400 -,
300
200
0
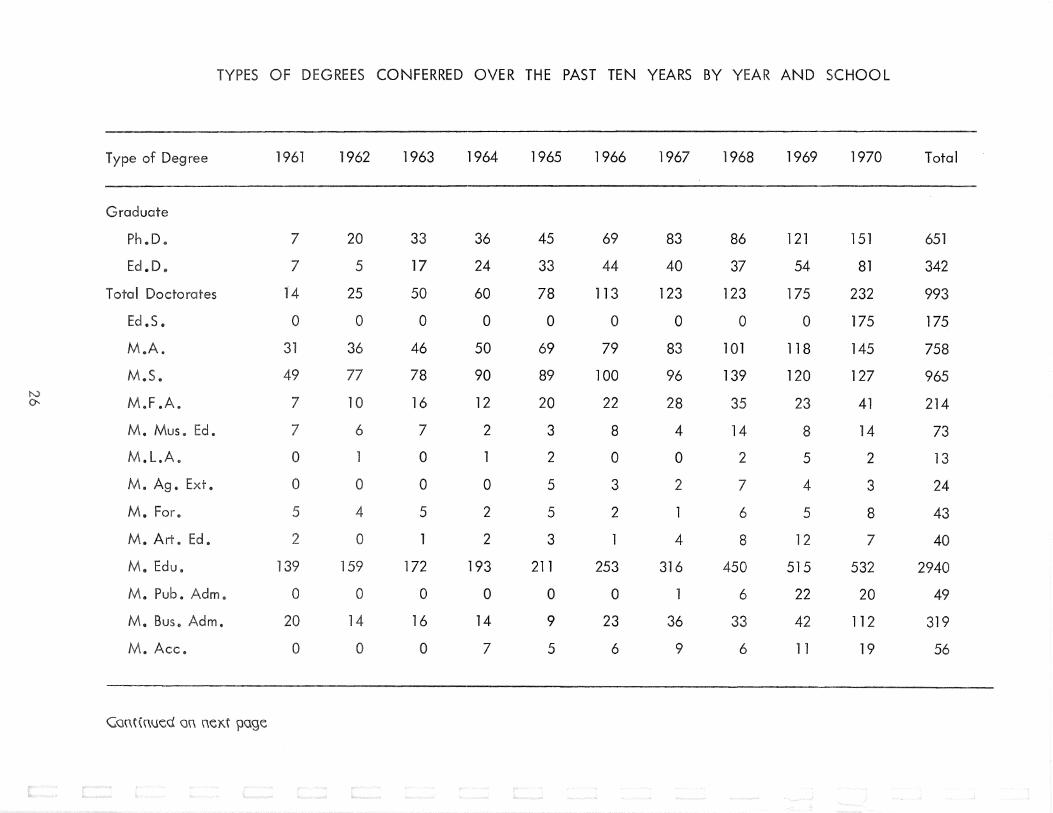
OF DEGREES CONFERRED OVER THE PAST TEN YEARS BY YEAR AND SCHOOL
Type of Degree 1961 1962 1963 1964 1965 1966 1967 1968 1969 1970 Total
--Graduate
Ph.D. 7 20 33 36 45 69 83 86 121 151 651
• D • 7 5 17 24 33 44 40 37 54 81 342
Total Doctorates 14 25 50 60 78 113 123 123 175 232 993
. s. 0 0 0 0 0 0 0 0 0 175 175
.A. 31 36 46 50 69 79 83 1 01 118 145 758
.s. 49 77 78 90 89 100 96 139 120 127 965
.F . 7 10 16 12 20 22 28 35 23 41 214
• Mus. . 7 6 7 2 3 8 4 14 8 14 73
• L.A. 0 1 0 1 2 0 0 2 5 2 13
• Ag. . 0 0 0 0 5 3 2 7 4 3 24
• For. 5 4 5 2 5 2 1 6 5 8 43
2 0 1 2 3 1 4 8 12 7 40
• Edu. 139 159 172 193 211 253 316 450 515 532 2940
• Pub. Adm 0 0 0 0 0 0 1 6 22 20 49
• Bus. Adm. 20 14 16 14 9 23 36 33 42 112 319
• Ace. 0 0 0 7 5 6 9 6 11 19 56
C:GG\(G\Jec! G\\ GeKt poge
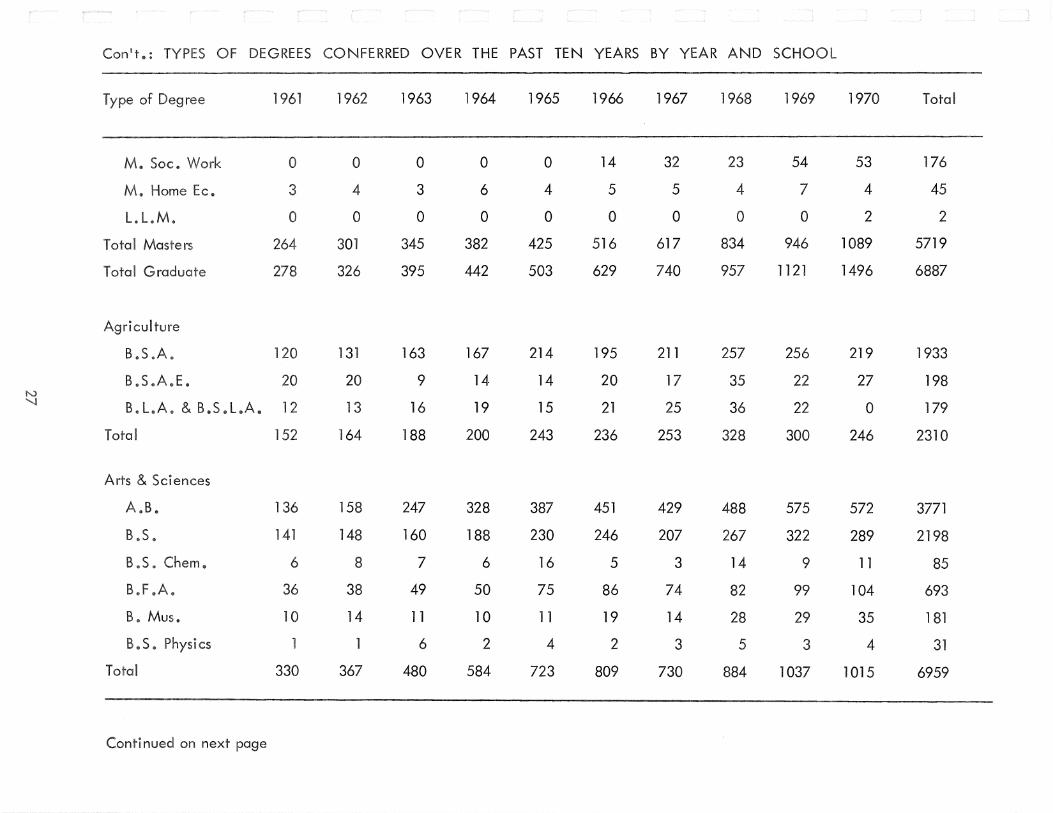
t.: ES N RRED OVER THE PAST TEN YEARS BY YEAR AND SCHOOL
of 1961 1962 1963 11964 1965 1966 1967 1968 1969 1970 Total
M. Soc. 0 0 0 0 0 14 32 23 54 53 176
Home . 3 4 3 6 4 5 5 4 7 4 45
LL.M. 0 0 0 0 0 0 0 0 0 2 2
301 345 :382 425 516 617 834 946 1089 5719
326 395 442 503 629 740 957 1121 1496 6887
Agriculture
B.S A 1 131 163 167 214 195 211 257 256 219 1933
B.S.A.E. 20 9 14 14 20 17 35 22 27 198
B.L.A &B.SL.A. 12 13 16 19 15 21 25 36 22 0 179
l 164 188 :200 243 236 253 328 300 246 2310
Arts &
A.B. 136 158 247 328 387 451 429 488 575 572 3771
B.S. 141 148 160 188 230 246 207 267 322 289 2198
B S . 6 8 7 6 16 5 3 14 9 11 85
B.F .A 36 38 49 50 75 86 74 82 99 104 693
B. Mus. 10 14 1 1 10 1 1 19 14 28 29 35 181
B.S cs 1 1 6 2 4 2 3 5 3 4 31
330 367 480 584 723 809 730 884 1037 1015 6959
Continued on next page
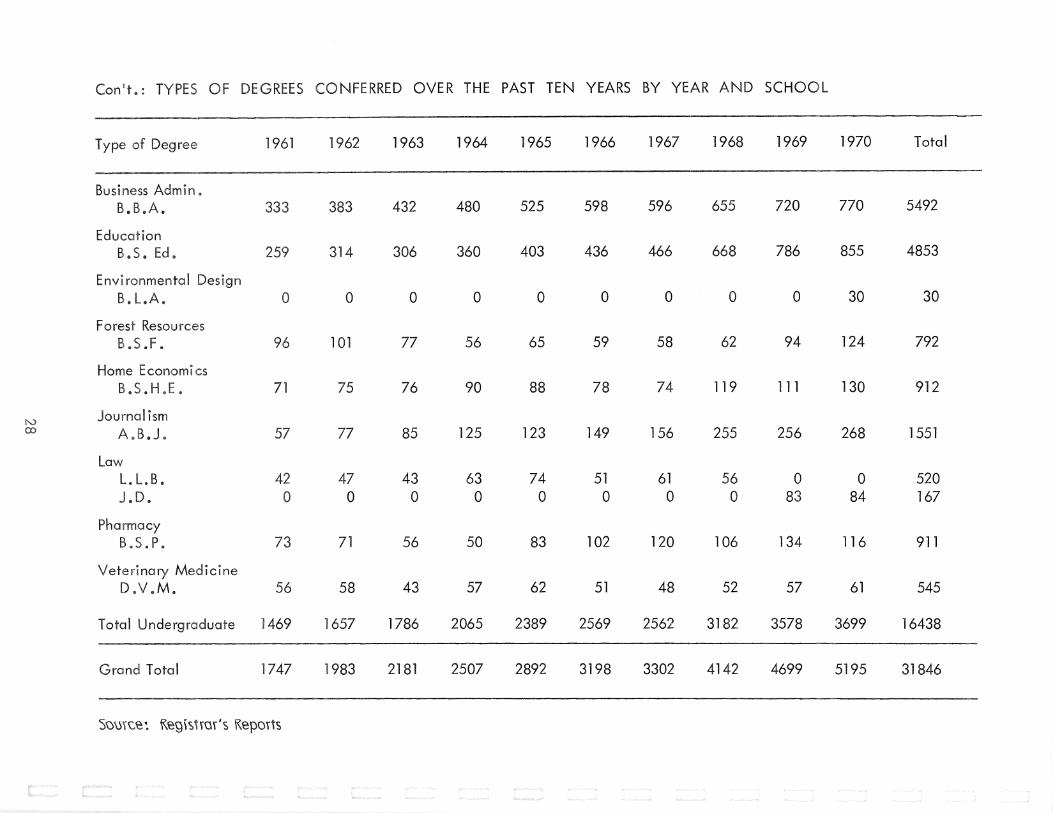
Con't.: OF DEGREES NFERRED OVER lrHE PAST TEN YEARS BY YEAR AND SCHOOL
Type Degree 1961 1962 1963 1964 1965 1966 1967 1968 1969 1970 Total
Business Admin. B. B.A. 333 383 432 480 525 598 596 655 720 770 5492
Education B.S. . 314 306 360 403 436 466 668 786 855 4853
ronmental Design B. L.A. 0 0 0 0 0 0 0 0 0 30 30
Forest Resources B.S.F. 96 1 77 56 65 59 58 62 94 124 792
Home E conom cs B.S.H.E 71 75 76 90 88 78 74 119 111 130 912
ism A B.J 77 85 125 123 149 156 255 256 268 1551
Law LL.B. 42 47 43 63 74 51 61 56 0 0 520
• D. 0 0 0 0 0 0 0 0 83 84 167
Pharmacy B.S.P. 73 71 56 50 83 102 120 106 134 116 911
Veterinary Medicine D.V.M. 56 58 43 57 62 51 48 52 57 61 545
Total Undergraduate 1469 1657 1786 2065 2389 2569 2562 3182 3578 3699 16438
Grand Total 1747 1983 2181 2507 2892 3198 3302 4142 4699 5195 31846
SIJ\j'iC~e: 1\egis~rm's Reports

Figure 6
MASTERS DEGREES CONFERRED
1961-70
1200
1100
1000
900
800 Vl LU LU 0::::
0 700 L.U 0
1J_ 600 0 0:::: L.U co 500 :E :::> z
400
300
200
100
0
1961 1962 1963 1964 1965 1966 1967 1968 1969 1970

Figure 7
DOCTORAL DEGREES CONFERRED
1961-70
150
140
130
120
110
100
90 V"l u.J u.J 80 ~
0 u.J 0
LL. 70 /'""\ v
~ u.J 60 co ~ ::J z 50
40
30
20
lO
0
1961 1962 1963 1964 1965 1966 1967 1968 1969 197ry
•

UNDERGRADUATE AND PROFESSIONAL DEGREES CONFERRED BY YEAR, SCHOOL AND SEX 1961-70
----1961 1962 1963 1964 1965 1966 1967 1968 969 1970 Total
culture Male 50 162 182 194 230 233 246 316 288 234 2235
le 2 2 6 6 13 3 7 12 12 12 152 64 188 200 243 236 253 328 300 246 23 0
& Sciences Male 206 221 256 345 413 479 400 500 606 554 3980
le 24 146 224 239 310 330 330 384 431 661 3179 330 367 480 584 723 809 730 884 1037 1215 7159
ness Adm. Male 314 360 409 449 499 575 572 616 704 5175 Female 19 23 23 31 26 23 24 39 43 66 317 I 333 383 432 480 525 598 596 655 720 770 5492
m Mae 77 86 84 83 77 89 95 136 143 176 1046 Female 182 228 222 277 326 347 371 532 643 679 3807 I 259 4 306 360 403 436 466 668 786 855 4853 ronmenta Design Male 28 28 Female 2 2
30 30 Res.
Mae 96 01 77 56 65 59 58 62 93 124 791 Female 0 0 0 0 0 0 0 0 1 0 l I 96 01 77 56 65 59 58 62 94 124 792
Continued on next page

1t u
le
o Medicine Ma
le
Undergraduate Degrees Ma Female I
0 71 71
0 42
3 73
54 2
56
1041 428
1469
rce: Registrar's Reports
0 75 75
49 28
0 47
64 7
71
56 2
58
1146 511
1657
SSIONAL DEGREES CONFERRED BY YEAR, SC
1963
0 76 76
57 28 85
43 0
43
51 5
56
43 0
43
1202 584
1786
1964
0 90 90
73 52
125
62 1
63
49 1
50
56 1
57
1367 698
2065
1965
0 88 88
75 48
123
74 0
74
78 5
83
60 2
62
1571 818
2389
1966
0 78 78
82 67
149
50 1
51
95 7
102
50 1
51
1712 857
2566
1967
0 74 74
85 71
156
58 3
61
111 9
120
46 2
48
1671 891
2562
1968
1 118 119
1 128 255
54 2
56
99 7
106
50 2
52
1961 1224 3185
LAND
1
1 110 111
142 114 256
82 1
83
121 13
134
52 5
57
2205 1373 3578
1970
129 130
152 116 268
81 3
84
103 13
116
58 3
6"1
2215 1684 3899
1961-70
3
2
1551
593 11
604
841 70
911
525 20
545
16091 9068
25159

Figure 8
BACCALAUREATE DEGREES N RRED
1961-70
3400
3200
3000
2800
2600 V> w w 0:::: 2400 () w 0
u... 2200 0 0:::: w co 2000 :E ::)
z 1800
1600
1400
1200
800
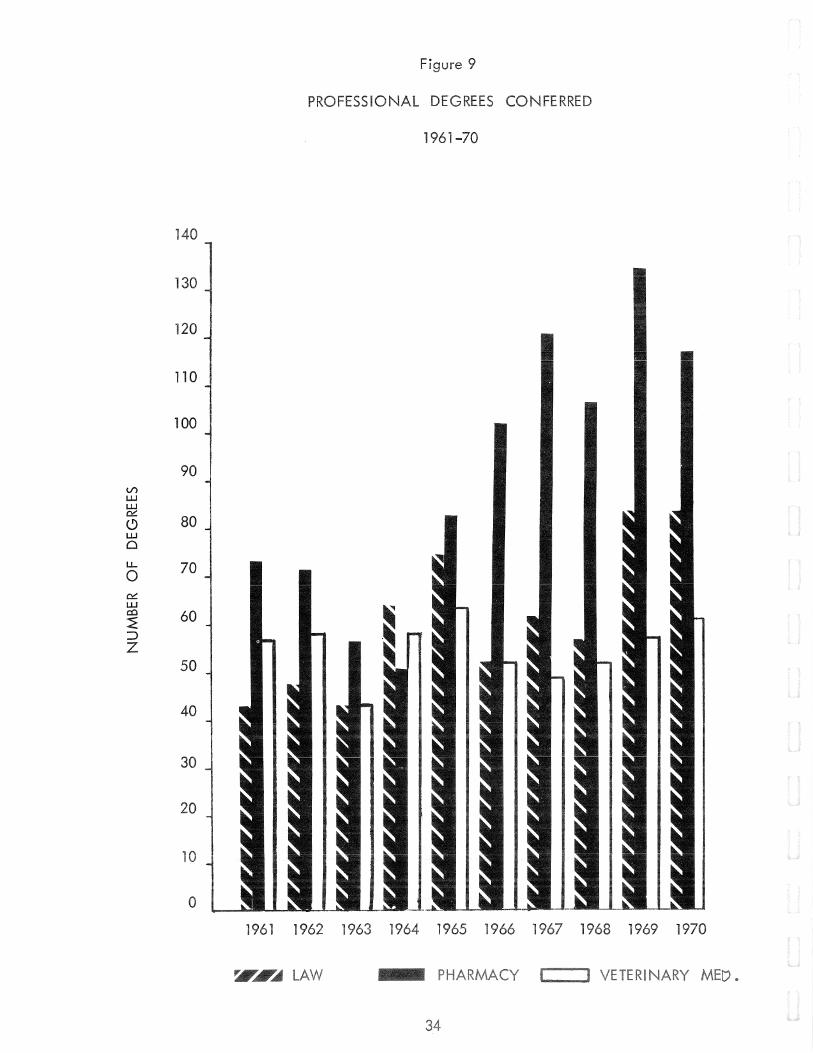
Figure 9
PROFESSIO REES N RRED
1961-70
130
120
110
100
90 Vl w w 0:::
80 0 w 0
u... 70 0 0::: w ca 60 ~ ::J z
50
40
30
10
0
1961 1962 1
Other Student-Related Information
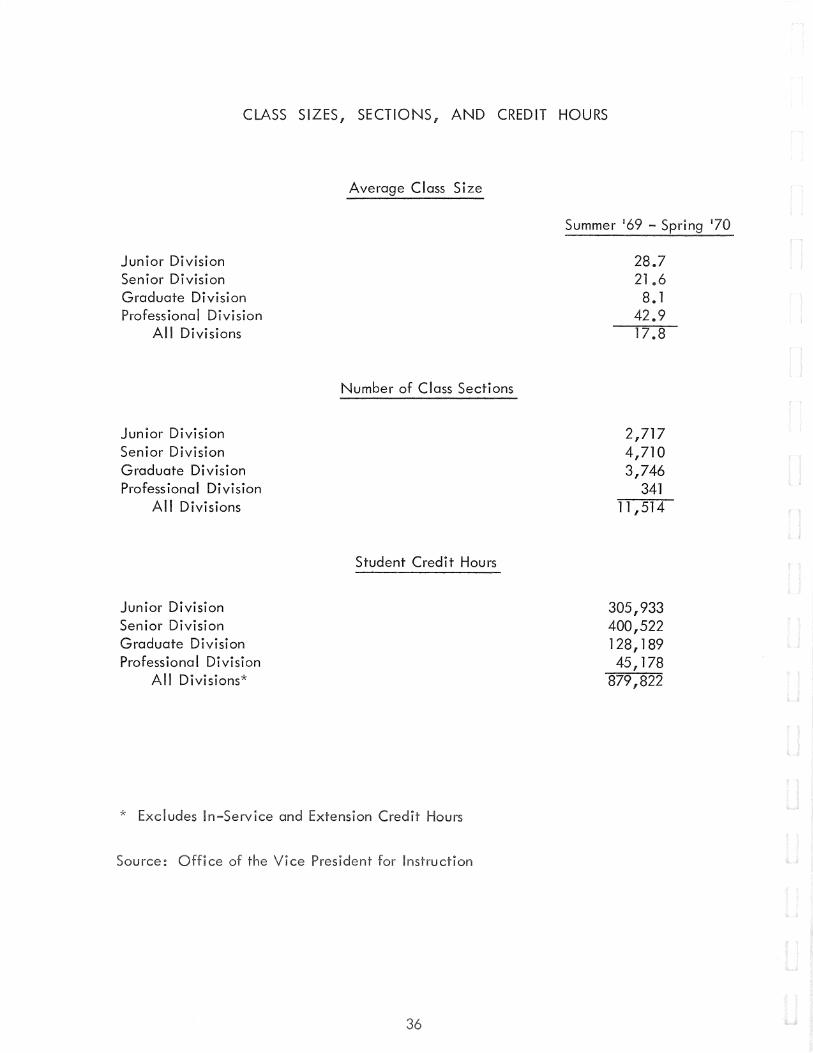
CLASS SIZES, SECTIONS, AND CREDIT HOURS
Junior Division Senior Division Graduate Division Professional Division
All Divisions
Junior Division Senior Division Graduate Division Professional Division
All Divisions
Junior Division Senior Division Graduate Division Professional Division
All Divisions*
* In
ce the ce
Average Class Size
Number of Class Sections
Student Credit Hours
Summer 169 - Spring '70
28.7 21.6 8. 1
42.9 17.8
2,717 4,710 3,746
341 11,514
305,933 400,522 128,189 45' 178
879,822
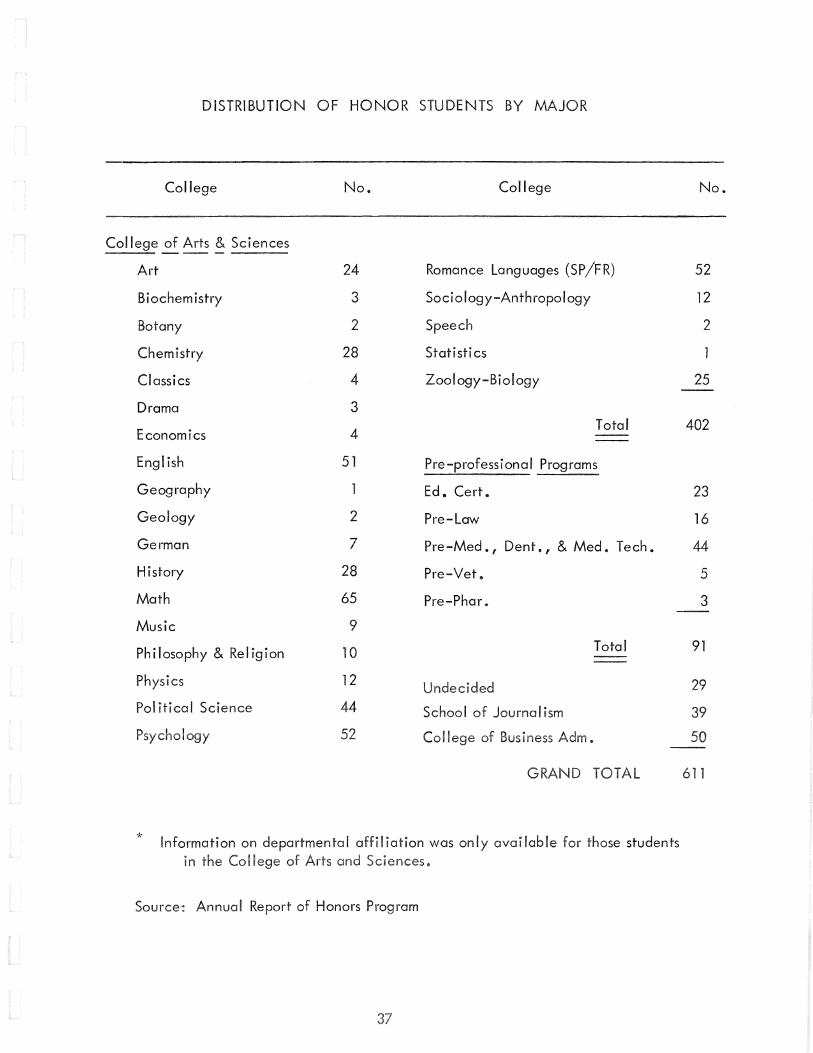
DISTRIBUTION OF HONOR STUDENTS BY MAJOR
College No. College No.
College~ Arts~ Sciences
Art 24 Romance Languages (SP /FR) 52
Biochemistry 3 Sociology-Anthropology 12
Botany 2 Speech 2
Chemistry 28 Statistics
Classics 4 Zoology-Biology 25
Drama 3
Economics 4 Total 402
English 51 Pre-professional Programs
Geography Ed. Cert. 23
Geology 2 Pre-Law 16
German 7 Pre-Med., Dent., & Med. Tech. 44
History 28 Pre-Vet. c::. -.J
Math 65 Pre-Phar. 3
Music 9
Philosophy & Religion 10 Total 91
Physics 12 Undecided 29 Political Science 44 School of Journal ism 39 Psychology 52 College of Bus 50
GRAND TOTAL 611
* Information on departmental affiliation was only available for those students in the liege
Annual Report of Honors Program
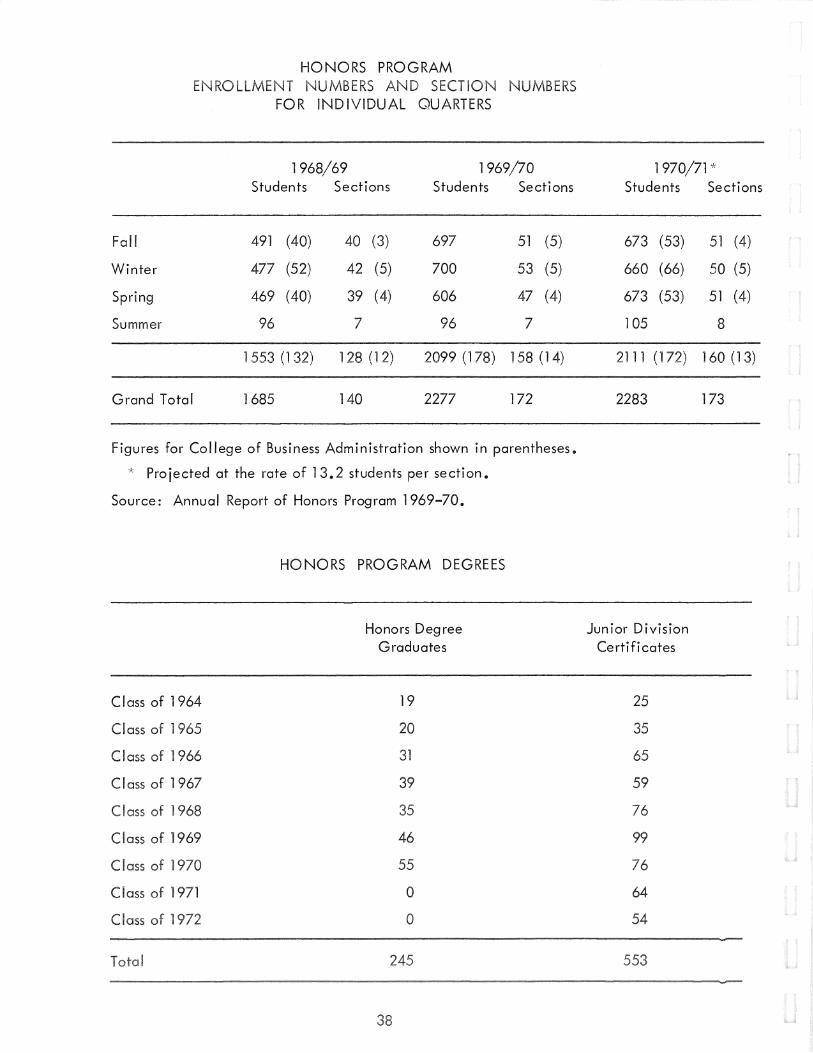
HONORS PROGRAM RO ERS D SECT
FOR INDIVIDUAL QUARTERS
1968/69 1969/70 Students Sections Students Sections
Fall 491 (40) 40 (3) 697 51 (5)
Winter 477 (52) 42 (5) 700 53 (5)
Spring 469 (40) 39 (4) 606 47 (4)
Summer 96 7 96 7
1553 (132) 128 (12) 2099 (178) 158 (14)
Grand Total 1685 140 2277 172
Figures for College of Business Administration shown in parentheses.
* Projected at the rate of 13.2 students per section.
Source: Annual Report of Honors Program 1969-70.
Class of 1964
Class of 1965
Class of 1966
Class of 1967
lass
Class of 1969
c Class of 1971
HONORS PROGRAM DEGREES
Honors Degree Graduates
19
31
39
46
0
0
1970/71 * Students Sections
673 (53)
660 (66)
673 (53)
105
2111 (172)
2283
Junior Division Certificates
25
59
64
51 (4)
50 (5)
51 (4)
8
160 (13)
173
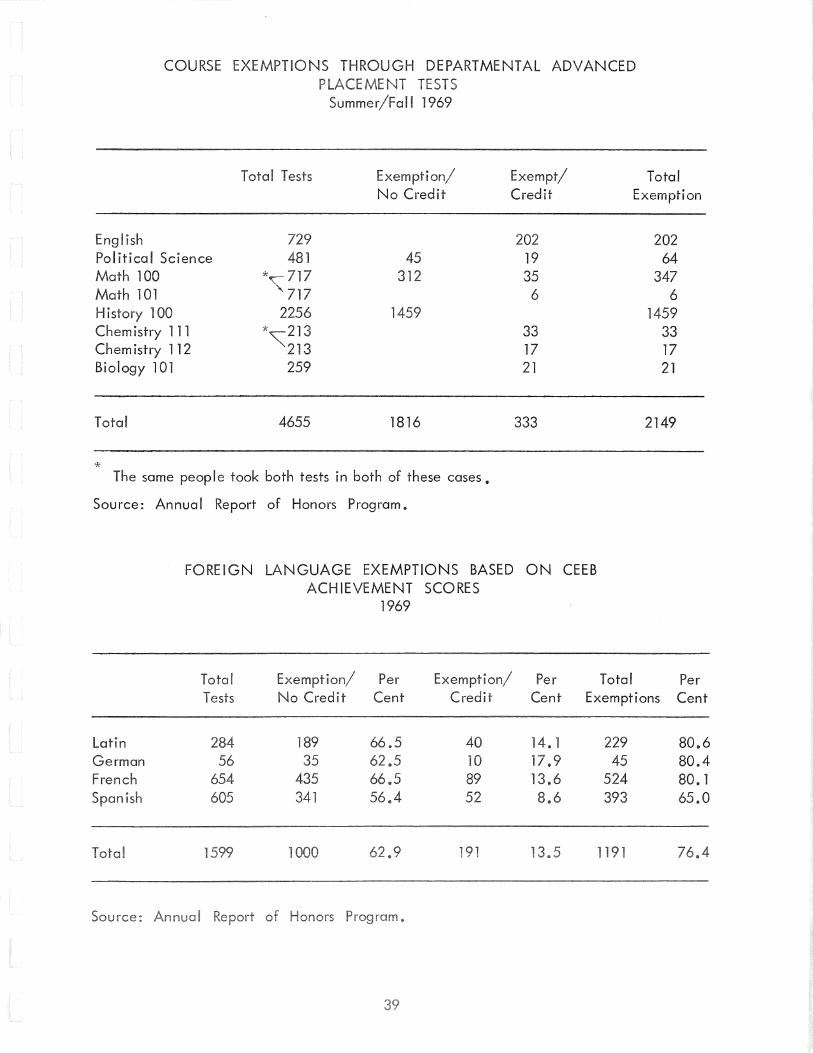
COURSE MPTIONS THROUGH DEPARTMENTAL ADVANCED p
i 1969
Exemption/ Exempt/ No Credit Credit
English 202 Political Science 481 45 19 Math 100 *~717 312 35 Math 1 717 6 History 100 Chemistry 111 *~213 33 Chern is try 112 '213 17 Biology 101 259 21
Total 4655 1816 333
* The same people took both tests in both of these cases.
Source: Annual Report of Honors Program.
FOREIGN LANGUAGE EXEMPTIONS BASED ON CEEB ACHIEVEMENT SCORES
1969
Per Exemption/ Per
Total Exemption
202 64
347 6
1459 33 17 21
2149
Total Per No Credit Credit Cent Exemptions Cent
Latin 284 14. 1 80.6 German 56 10 17.9 45 80.4
89 13.6 524 80. 1 8.6 393 65.0
.9 19 i3 1191 4

Name
Alpha Epsilon Delta
ph a Lamda De Ita
Alpha Zeta
Beta Gamma Sigma
Blue Key
Gamma Sigma Delta
Gamma Theta Upsilon
Kappa De Ita Pi
Mortar Board
Omicron Delta Kappa
Phi Alpha Theta
Phi Beta Kappa
Phi Eta Sigma
Phi Kappa Phi
Phi Zeta
Pi Mu Epsilon
Pi Sigma Alpha
Psi Chi
Pho
Ita Pi
Xi
Xi Sigma Pi
can
Date
1932
1934
1918
1933
1966
1929
1939
1934
1956
1914
1938
1923
1925
1934
1948
1929
lege
Pre-medical
Freshman Women
Agriculture (men)
Commerce & Business Administration
Service (men)
Agriculture, Home Economics & Veterinary Medicine
Geography
Education
Senior Women
Leadership (men)
History
Liberal Arts
Freshman Men
General
Veterinary Medicine
Mathematics
Government & Political Science
Psychology
Pharmacy (men)
ish
c Research
(men)
ed , 1968.
"
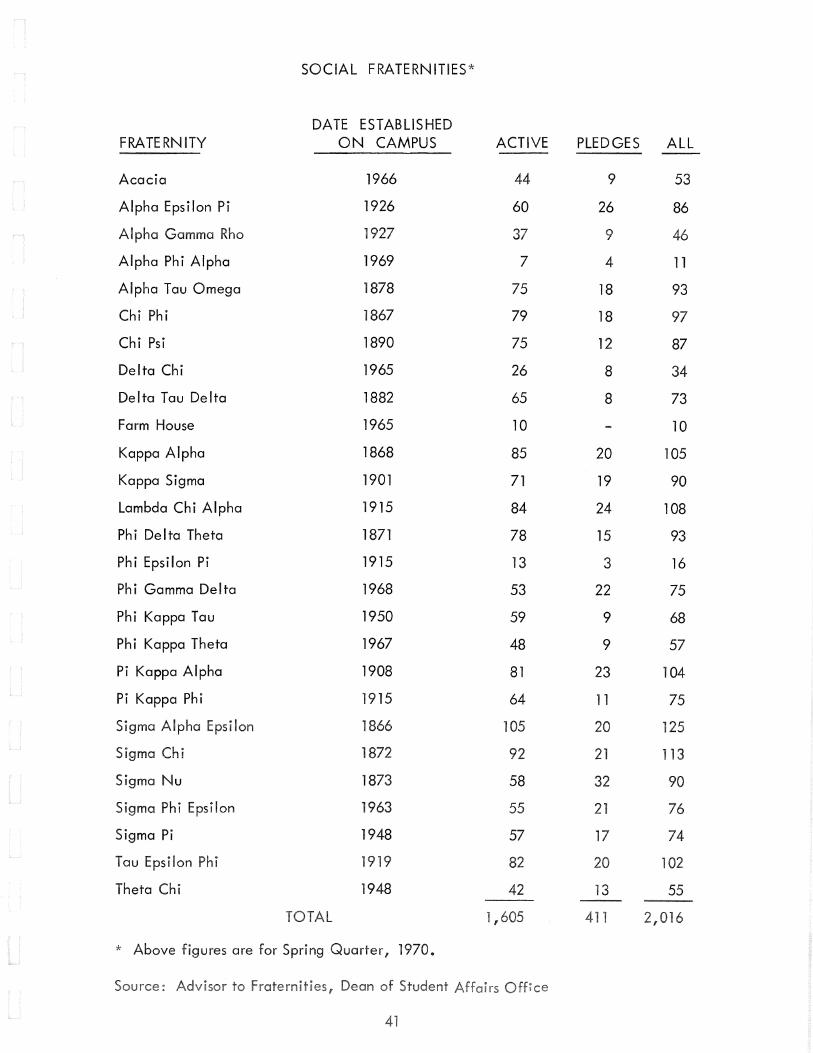
SOCIAL FRATERNITIES*
DATE ESTABLISHED FRATERNITY ON CAMPUS ACTIVE PLEDGES ALL
Acacia 1966 44 9 53
Alpha Epsilon Pi 1926 60 26 86
Alpha Gamma Rho 1927 37 9 46
Alpha Phi Alpha 1969 7 4 11
Alpha Tau Omega 1878 75 18 93
Chi Phi 1867 79 18 97
Chi Psi 1890 75 12 87
Delta Chi 1965 26 8 34
Delta Tau Delta 1882 65 8 73
Farm House 1965 10 10
Kappa Alpha 1868 85 20 105
Kappa Sigma 1901 71 19 90
Lambda Chi Alpha 1915 84 24 108
Phi De Ita Theta 1871 78 15 93
Phi Epsilon Pi 1915 13 3 16
Phi Gamma Delta 1968 53 22 75
Phi Kappa Tau 1950 59 9 68
Phi Kappa Theta 1967 48 9 57
Pi Kappa Alpha 1908 81 23 104
Pi Kappa Phi 1915 64 11 75
Sigma Alpha Epsilon 1866 105 20 125
Sigma Chi 1872 92 21 113
Sigma Nu 1873 58 32 90
Sigma Phi Epsilon 1963 55 21 76
Sigma Pi 1948 57 17 74
Tau Epsilon Phi 1919 82 20
Theta Chi 1948 42 13 55
1 , 411 2,016
* Above figures are for Spring Quarter, 1970.
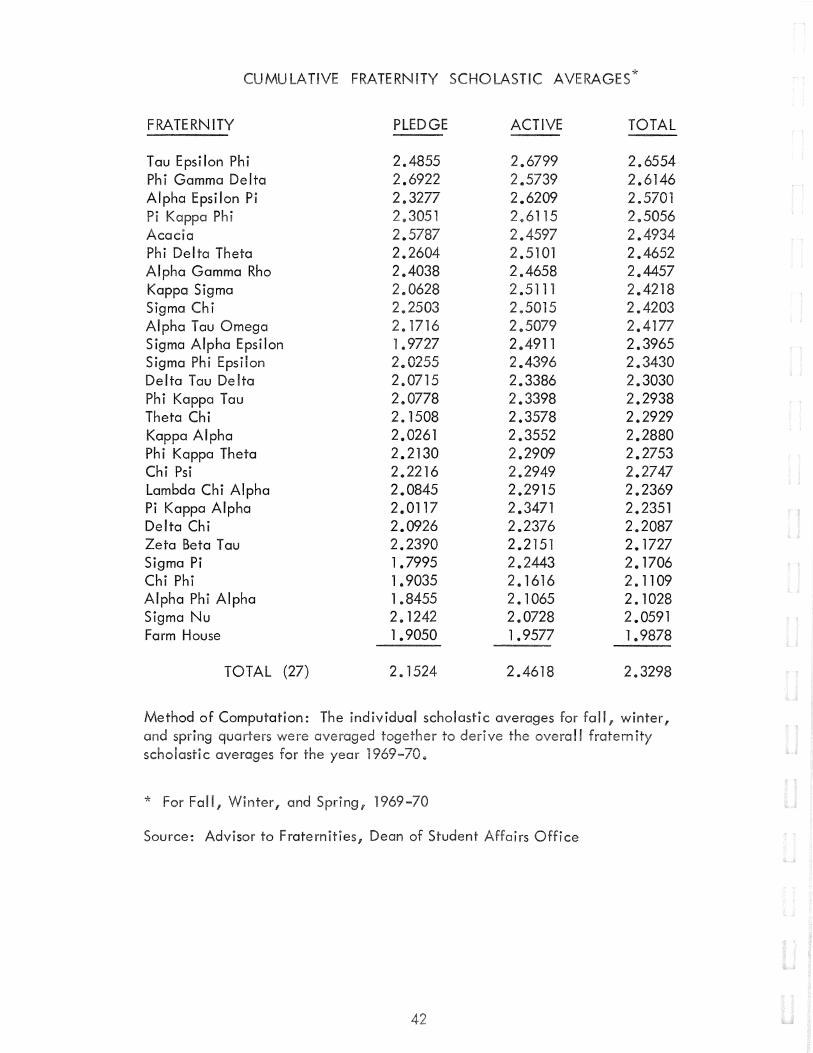
CUMULATIVE FRATERNITY SCHOLASTIC AVERAGES*
FRATERNITY
Tau Epsilon Phi Phi Gamma Delta Alpha Epsilon Pi
Kappa Phi Acacia Phi Delta Theta A I ph a Gamma Rho Kappa Sigma Sigma Chi Alpha Tau Omega Sigma Alpha Epsilon Sigma Phi Epsilon Delta Tau Delta Phi Kappa Tau Theta Chi Kappa Alpha Phi Kappa Theta Chi Psi Lambda Chi Alpha Pi Kappa Alpha Delta Chi Zeta Beta Tau Sigma Pi Chi Phi Alpha Phi Alpha Sigma Nu Farm House
TOTAL (27)
PLEDGE
2.4855 2.6922 2.3277 2.3051 2. 2.2604 2.4038 2.0628 2.2503 2.1716 1. 9727 2.0255 2.0715 2.0778 2.1508 2.0261 2.2130 2.2216 2.0845 2.0117 2.0926 2.2390 1.7995 1. 9035 1.8455 2.1242 1. 9050
2.1524
ACTIVE
2.6799 2.5739 2.6209 2.6115 2.4597 2.5101 2.4658 2.5111 2.5015 2.5079 2.4911 2.4396 2.3386 2.3398 2.3578 2.3552 2.2909 2.2949 2.2915 2.3471 2.2376 2.2151 2.2443 2.1616 2.1065 2.0728 1. 9577
2.4618
TOTAL
2.6554 2.6146 2.5701 2.5056 2.4934 2.4652 2.4457 2.4218 2.4203 2.4177 2.3965 2.3430 2.3030 2.2938 2.2929 2.2880 2.2753 2.2747 2.2369 2.2351 2.2087 2. 1727 2.1706 2. 1109 2. 1028 2.0591 1. 9878
2.3298
Method of Computation: The ividual scholastic averages for fall, winter, and spring were to overall
I B • "' r .I '1 scholasnc averages ror me year 1
* Fall, f l
Source: Advisor to Fraternities, Dean of Student rs ce

SO RITIE
DATE ESTABLISHED SORORITY ON CAMPUS ACTIVE PLEDGES ALL
Alpha Chi Omega 1938 66 24 90
Delta Pi 1933 27 100
Alpha Gamma Delta 1923 71 5 76
Alpha Omicron Pi 1934 64 19 83
Alpha Xi Delta 1960 37 13 50
Chi Omega 1922 79 25 104
Delta Delta Delta 1933 65 33 98
Delta Gamma 1967 65 17 82
Delta Phi Epsilon 1935 41 24 65
Delta Zeta 1961 20 7 27
Kappa AI pha Theta 1937 91 28 119
Kappa Delta 1924 73 27 100
Kappa Kappa Gamma 1947 93 28 121
Phi Mu 1921 91 26 117
Pi Beta Phi 1936 53 30 83
Sigma Delta Tau 1924 48 25 73
Sigma Kappa 1964 47 17 64
Zeta Tau Alpha 1949 67 27 94
TOTAL 1 '144 402 1,546
* Above figures are for Spring Quarter, 1970.
Advisor to Sororities, Dean Student Affairs ce
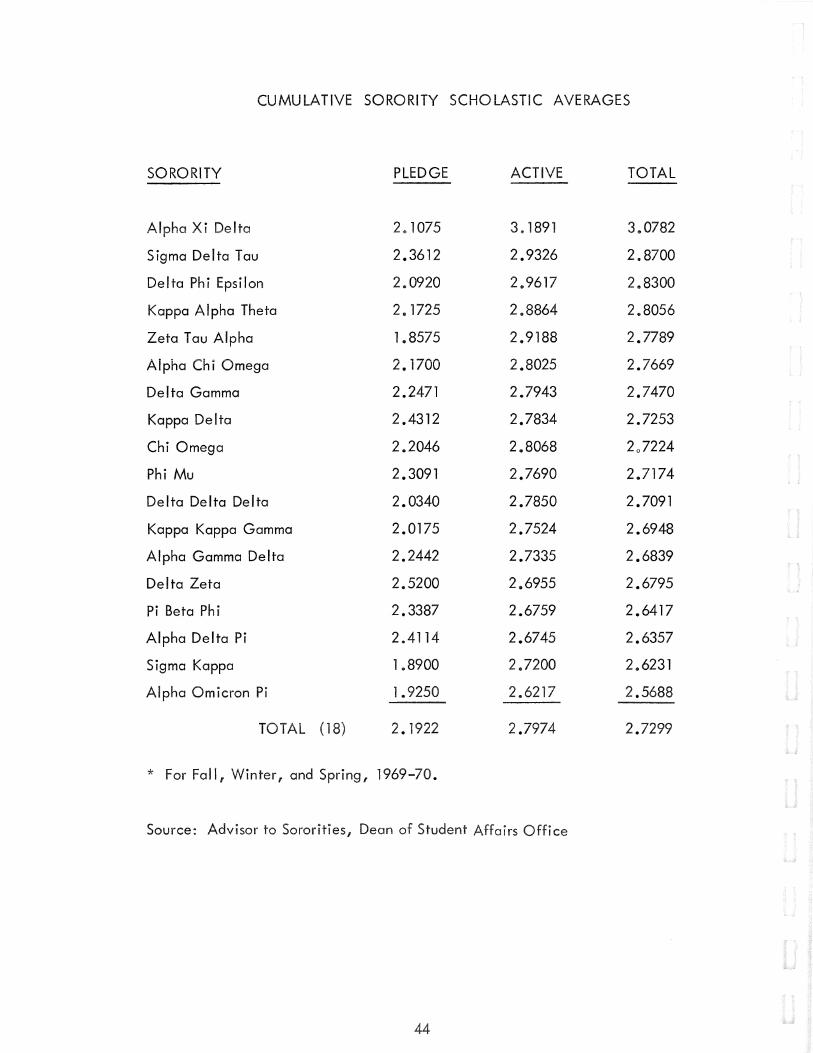
CUMULATIVE SORORITY SCHOLASTIC AVERAGES
SORORITY PLEDGE ACTIVE TOTAL
Alpha Xi Delta 2.1075 3. 1891 3.0782
Sigma Delta Tau 2.3612 2.9326 2.8700
Delta Phi Epsilon 2.0920 2.9617 2.8300
Kappa Alpha Theta 2. 1725 2.8864 2.8056
Zeta Tau Alpha 1.8575 2.9188 2.7789
Aipha Chi Omega 2.1700 2.8025 2.7669
Delta Gamma 2.2471 2.7943 2.7470
Kappa Delta 2.4312 2.7834 2.7253
Chi Omega 2.2046 2.8068 2o7224
Phi Mu 2.3091 2.7690 2.7174
Delta Delta Delta 2.0340 2.7850 2.7091
Kappa Kappa Gamma 2.0175 2.7524 2.6948
Alpha Gamma Delta 2.2442 2.7335 2.6839
Delta Zeta 2.5200 2.6955 2.6795
Pi Beta Phi 2.3387 2.6759 2.6417
Alpha Delta Pi 2.4114 2.6745 2.6357
Sigma Kappa 1.8900 2.7200 2.6231
Alpha Omicron Pi 1. 9250 2.6217 2.5688
TOTAL (18) 2. 1922 2.7974 2.7299
* For Fall, Winter, and Spring, 1969-70.
Source: Advisor to Sororities, Dean of Student Affairs Office
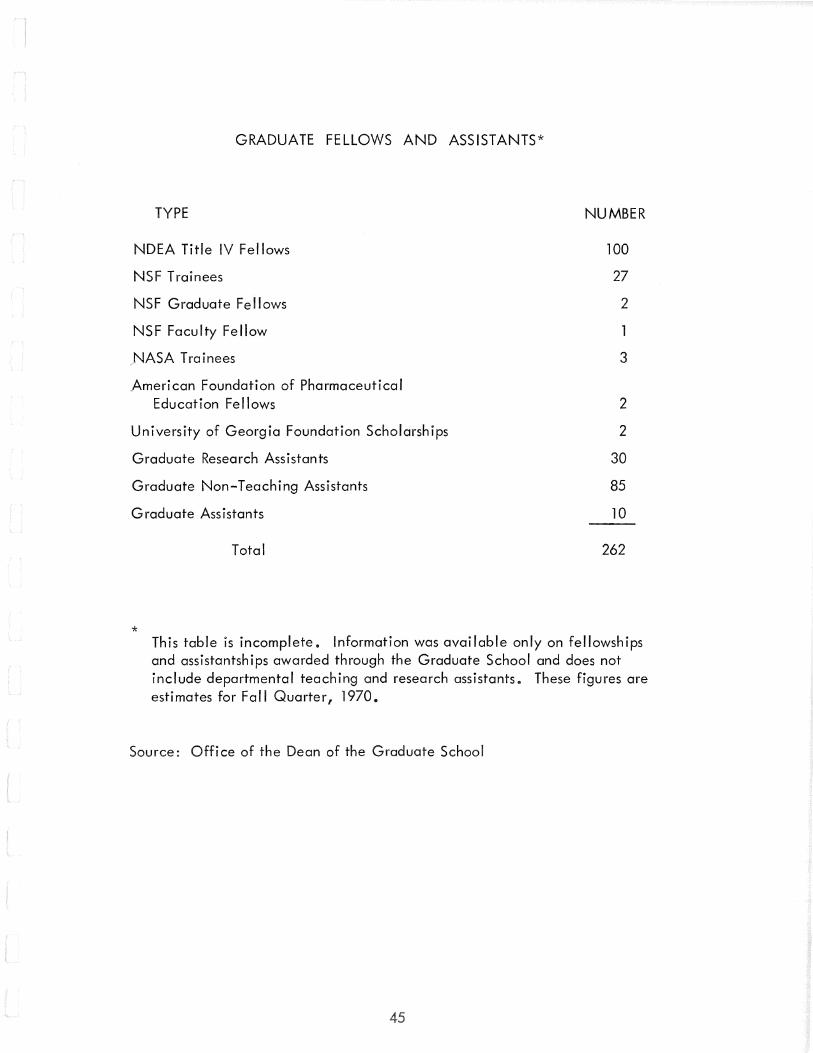
GRADUATE FELLOWS AND ASSISTANTS*
TYPE
NDEA Title IV Fellows
NSF Trainees
NSF Graduate Fellows
NSF Faculty Fellow
.NASA Trainees
American Foundation of Pharmaceutical Education Fellows
University of Georgia Foundation Scholarships
Graduate Research Assistants
Graduate Non-Teaching Assistants
Graduate Assistants
Total
*
NUMBER
100
27
2
3
2
2
30
85
10
262
This table is incomplete. Information was available only on fellowships and assistantships awarded through the Graduate School and does not include departmental teaching and research assistants. These figures are estimates for Fall Quarter, 1970.
Source: Office of the Dean of the Graduate School
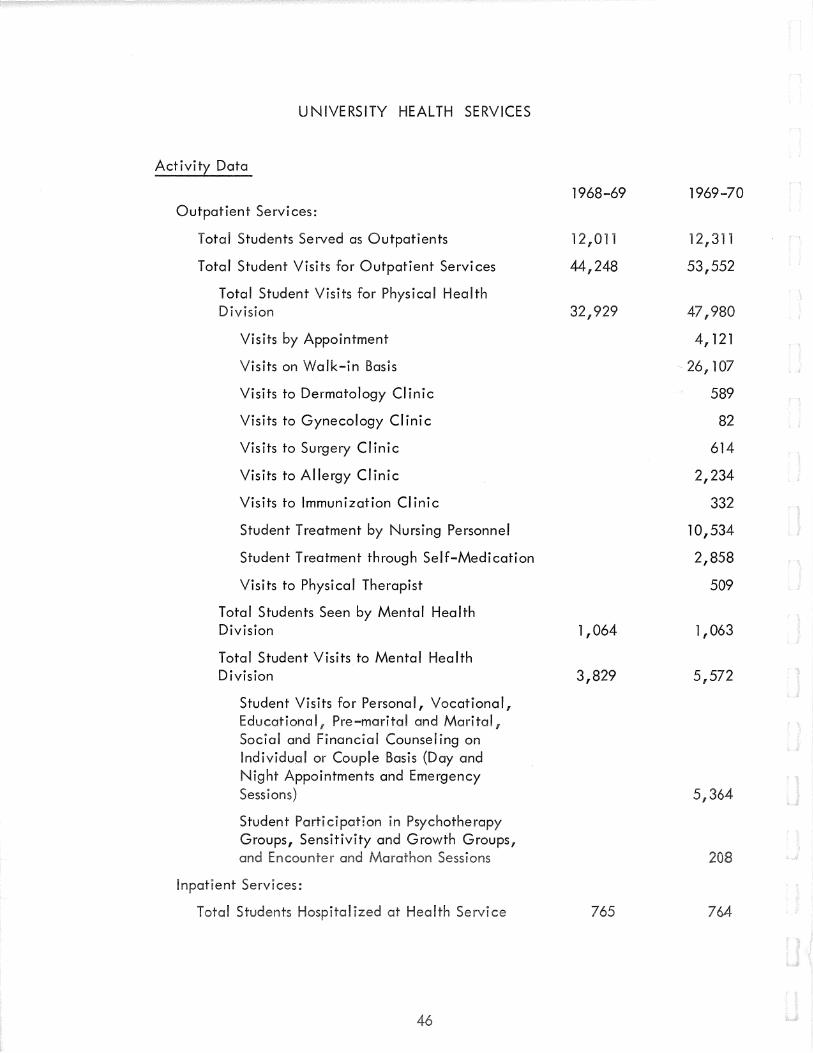
UNIVERSITY HEALTH SERVICES
Activity Data
Outpatient Services:
Total Students Served as Outpatients
Total Student Visits for Outpatient Services
Total Student Visits for Physical Health Division
Visits by Appointment
Visits on Walk-in Basis
Visits to Dermatology Clinic
Visits to Gynecology Clinic
Visits to Surgery Clinic
Visits to Allergy Clinic
Visits to Immunization Clinic
Student Treatment by Nursing Personnel
Student Treatment through Self-Medication
Visits to Physical Therapist
Total Students Seen by Mental Health Division
Total Student Visits to Mental Health Division
Student Visits for Personal, Vocational, Educational Pre-marital and Marital Social and Financial Counseling on Individual or Couple Basis (Day and Night Appointments and Emergency Sessions)
Student Participation in Psychotherapy Groups, Sensitivity and Growth Groups,
Inpatient Services:
at ce
1968-69
12,011
44,248
32,929
1,064
3,829
1969-70
12,311
53,552
47,980
4,121
26,107
589
82
614
2,234
332
10,534
2,858
509
1,063
5,572
364
764

Con 1t.: UNIVERSITY HEALTH SERVICES
Total Prescriptions Filled by Pharmacy
Total Laboratory Procedures Processed
Total X-ray Films Taken
Student/Health Service liaison
SGA Advisor to Health
Advisor to student Drug Committee
Facul consultant to Judi I Council
Nursing liaison with Creswell Hall
Facul advisor to Mortar Board
1968-69
37,250
18,771
3,744
representatives on Career Deve Program
Non-University Medical Consultants Utilized on Referral Basis
Radiology
Pathology
0 rthoped i cs
Dentistry
Ear, Nose and Throat
M.D.
M.D.
M.Da
D.D.S.
M.D.
Teaching, Research, and Liaison with Other Medical Institutions
instructional Services: Medical College of Georgia
School of Pharmacy
School of Social Work
School of Veterinary Medicine
School of Forestry
College of Education
Deportment
University School of Medicine
1969-70
36,957
27,803
2
4
1
3
2 2 l 1
5,883
M.D.
M.D.
A.C.S.W.
M.D.
M.D.
M.D. Ed.D, Ph D. A.C.S.W.
.D .D • . D.
MD Ph.D

Con 1t.: UNIVERSITY HEALTH SERVICES
Student Internships Served in the Health Service
College of Education 2
Clinical Psychology
School of Social Work
School of Pharmacy
Accreditations
114
Hospital:
Mental Health Division:
Joint Commission on the Accreditation of Hospitals
American Board on Counseling Services, Inc.
Full-Time Professional Staff
Mental Health Psychiatrists
Physical Health Physicians
Hospital Administrator
Clinical Psychologist
Counseling Psychologists
Psychiatric Social Worker
Registered Nurses
Medical Records Librarian
Pharmacist
Laboratory Technologist
X-Ray Technician
Dietician
* One full-time and one half-time pharmacist.
1968-69
3
7
3
14
Source: Office of the Director of University Health Services
1969-70
3
8
1
4
13
1.5*
National Defense Student Loans University Trust Fund loans University Emergency Loans Cuban Fund Health Professional Veterinary Medicine
Enforcement Education Program Loans
College Work Study Program
Educational Opportunity Grants Health Professions Pharmacy Grant Heath Profession Vet. Med. Grant Law Enforcement Education Grant
General Motors Scholarship Kahn Memorial arship National Merit Scholarship Regents Scholarship Universi Freshman Scholarship Other Scholarsh Programs
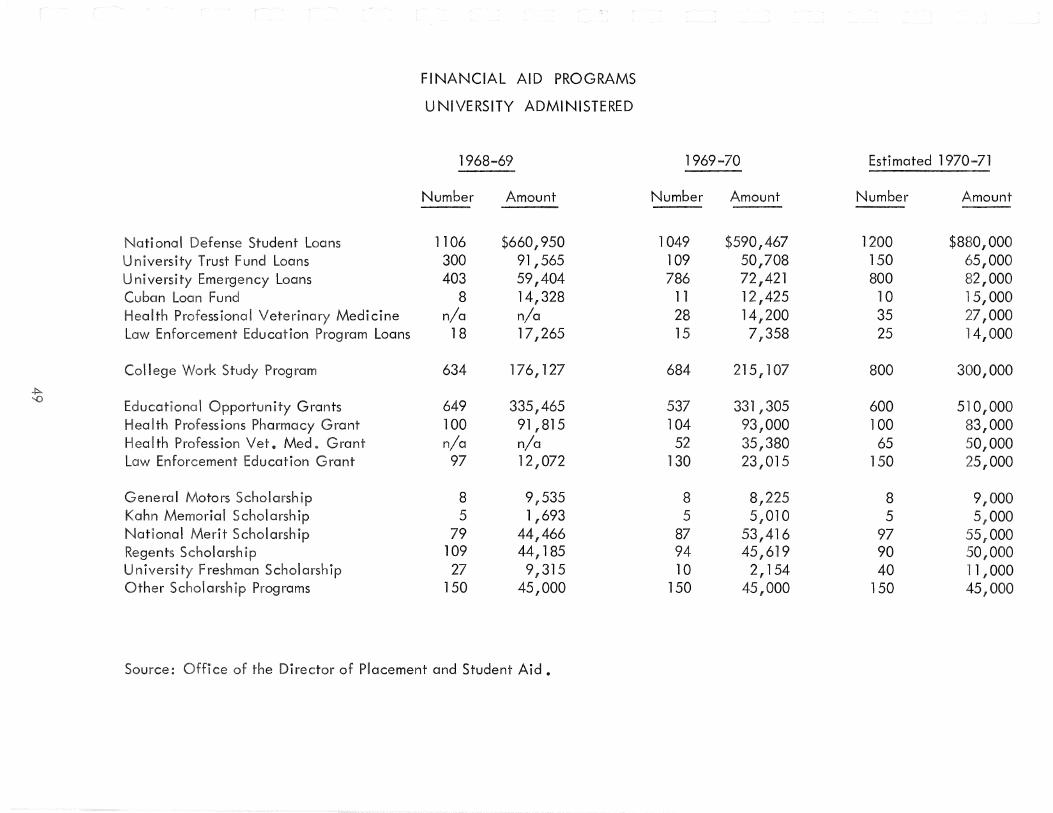
FINANCIAL AID PROGRAMS
UNIVERSITY ADMINISTERED
1968-69
Number Amount
1106 $660,950 300 91,565 403 59,404
8 14,328 n/a n/a
18 17,265
634 176,127
649 335,465 100 91,815 n/a n/a 97 12,072
8 9,535 5 1,693
79 44,466 109 44,185 27 9,315
150 45,000
Source: ce ot the Director of Placement and Student Aid.
1969-70 Estimated 1970-71 -
Number Amount Number Amount
1049 $590,467 1200 $880,000 109 50,708 150 65,000 786 72,421 800 82,000
11 12,425 10 15,000 28 14,200 35 27,000 15 71358 25 '14,000
684 215/107 800 300,000
537 331,305 600 5 0,000 104 93,000 100 83,000 52 35,380 65 50,000
130 23,015 150 25,000
8 8,225 8 9,000 5 51010 5 5,000
87 53,416 97 55,000 94 45,619 90 50,000 10 2,154 40 11,000
150 45,000 150 45,000
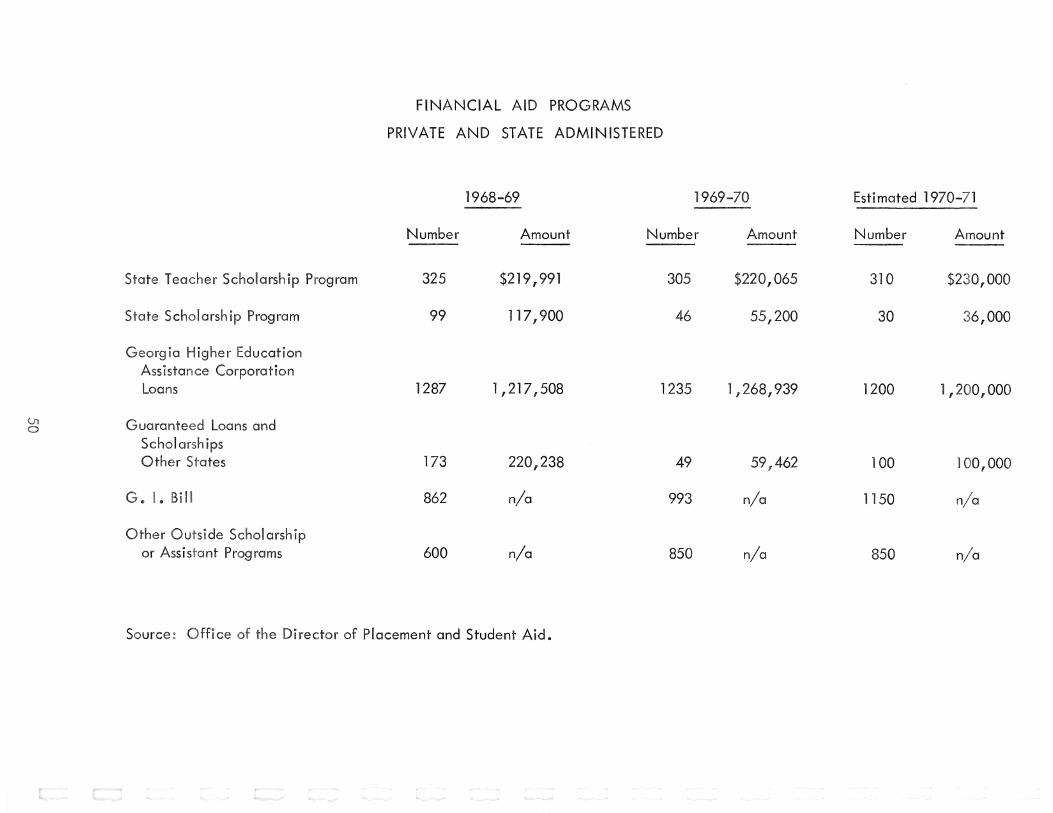
FINANCIAL AID PROGRAMS
PRIVATE AND STATE ADMINISTERED
1968-69 1969-70
Number Amount Number Amount
Teacher Scholarsh Program
State Scholarsh io Program
II
Other arsh
325
99
1287
173
862
600
$219,991
117,900
1,217,508
220,238
n/a
n/a
Source rector of Placement and Student Aid.
305
46
1235
49
993
850
$220,065
55,200
1,268,939
59,462
n/a
n/a
Estimated 1970-71
Number
310
30
1200
100
1150
850
Amount
$230,000
36,000
1,200,000
100,000
n/a
n/a
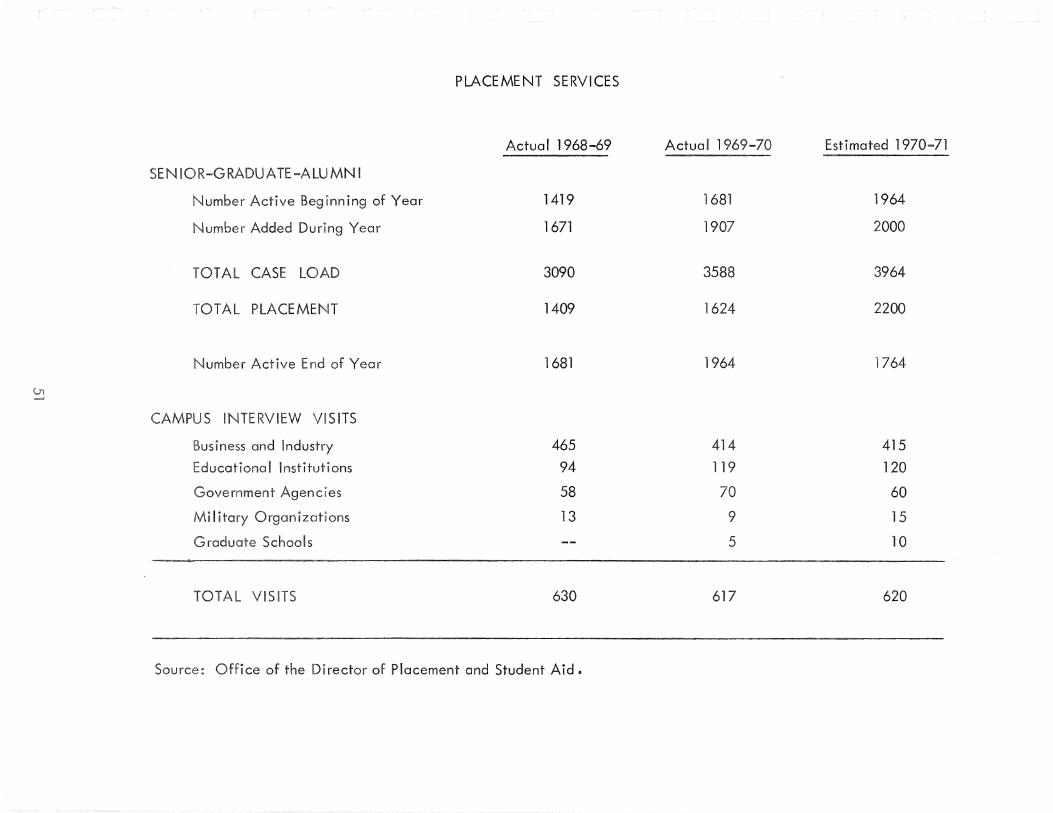
PLACEMENT SERVICES
Actual 1968-69 Actual 1969-70 Estimated 1970-71 _,
N R-G -ALUMNI
Beg ing of Year 1419 1681 1964
umber During Year 1671 1907 2000
CASE 3090 3588 3964
PLACEMENT 1409 1624 2200
Number End of Year 1681 1964 1764
s IN lEW SITS
Bus Industry 465 414 415
I Institutions 94 119 120
Government 58 70 60
li Organizations 13 9 15
raduate Schools -- 5 10
VIS 630 617 620
ce of the Director of Placement and Student Aid.

GEORGIA ATHLETIC ASSOCIATION
BOARD OF DIRECTORS
CHAIRMAN
TREASURER
FACULTY CHAIRMAN
ATHLETIC DIRECTOR
FACULTY MEMBERS:
ALU MN l MEMBERS
Dr. Fred C. Davison
John Green, Jr.
Dr. Boyd McWhorter
Joel Eaves
Dr. Mark Hanna
W. E. Hudson
Dr. Joe LaRocca
Reid Parker
Dr. Ira E. Aaron
Dr. George Parthemos
Cook Barwick, Atlanta
W. D. Bradshaw, Canton
George Fesperman, Waycross
Thomas E. Greene, Macon
Thomas H. Paris, Gainesville
Dr. S. A. Rodenberry, Columbus
Harold M. Walker, Atlanta
GEORGIA HEAD COACHES
Athletic Director:
Football: Basketball: Baseball: Track:
Tennis: Swimming:
I Gymnastics:
Joel Eaves
Vince Dooley Ken Rosemond Jim Whatley Forrest Towns Dick Copas Dan Magill Pete Scholle
ller Lee Cunningham
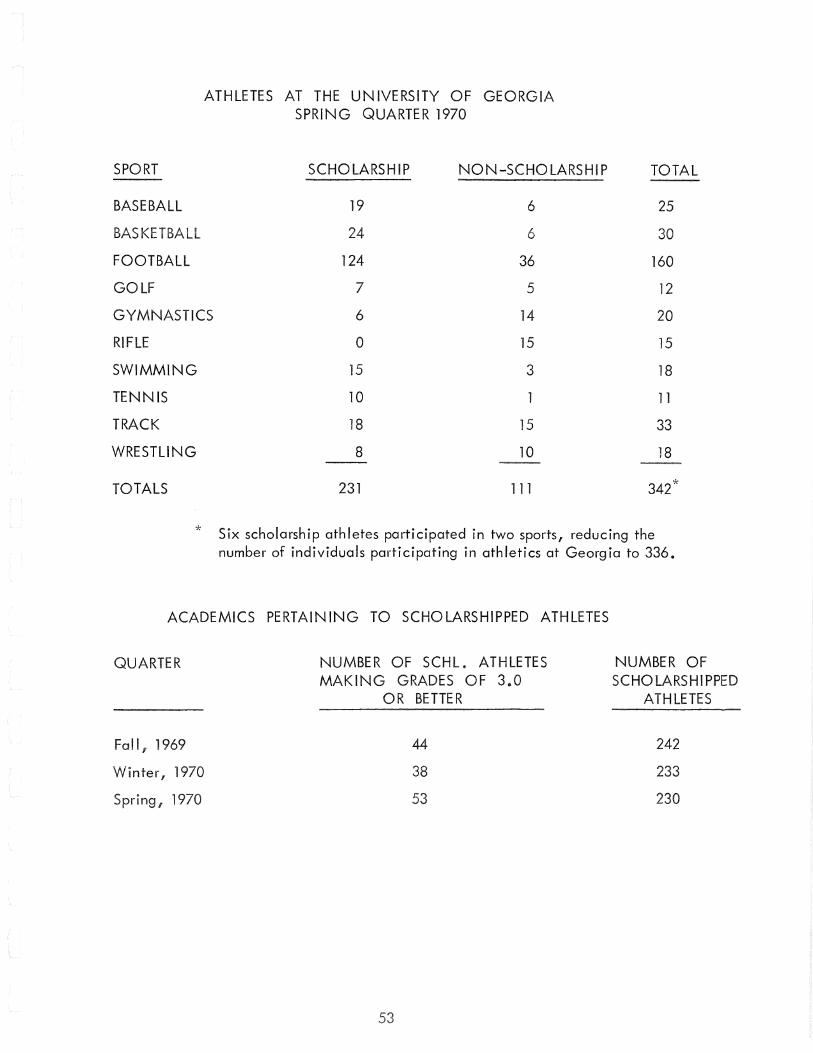
SPORT
BASEBALL
BASKETBALL
FOOTBALL
GOLF
ATHLETES AT THE UNIVERSITY OF GEORGIA SPRING QUARTER 1970
SCHOLARSHIP NON-SCHOLARSHIP
19 6
24 6
124 36
7 5
GYMNASTICS 6 14
RIFLE 0 15
SWIMMING 15 3
TENNIS 10
TRACK 18 15
WRESTLING 8 10
TOTALS 231 111
TOTAL
25
30
160
12
20
15
18
11
33
18
342*
* Six scholarship athletes participated in two sports, reducing the number of individuals participating in athletics at Georgia to 336.
ACADEMICS PERTAINING TO SCHOLARSHIPPED ATHLETES
QUARTER
Fall, 1969
Winter, 1970
Spring, 1970
NUMBER OF SCHL. ATHLETES MAKING GRADES OF 3.0
OR BETTER
44
38
53
NUMBER OF SCHOLARSHIPPED
ATHLETES
242
233
230

UNIVERSITY OF GEORGIA ATHLETIC FACILI
SPORT FIELD OR HOUSE SEATING CAPACITY
BASEBALL Frank D. Foley Field
BASKETBALL Coliseum
FOOTBALL Sanford Stadium
GO University of Georgia Golf Course
GYMNASTICS uses Coliseum
SWIMMING Stegeman Hall
N IS F ld Stadium
TRACK University track
WRESTLING uses Coliseum
GEORGIA ATHLETIC TRAINING FACILITIES
COLISEUM- Facilities located within the Coliseum include:
1. main training room with steam bath 2. small training room 3. weight room 4. theatre-style meeting room 5. dressing foci I ities for football, basketball, track,
baseball, wrestling, plus several dressing rooms for visiting teams.
HENRY FIELD TENNIS STADIUM- dressing quarters for tennis team
GEMAN - dressing quarters for swimming team
1,000
10,400
58,898
10,400
500
300
1,000
10,400
PRACTI FIELDS - Ids (a I other teams use the ey play to practice) with the
team whi a wrest!

SOUTHEASTERN CONFERENCE CHAMPIONSHIPS WON BY GEORGIA inception of inn in 1933)
YEAR
1933
1937
1942
1946
1948
1950
1951
1952
1953
1954
1955
1957
1958
1959
1961
1962
1963
1965
1968
1969
SPORT
Baseball
Track
Golf
Football
Football
Football
Golf
Golf Swimming
Golf Swimming
Baseball
Baseball
Swimming
Golf
Golf
Golf Football
Golf
Golf
Golf
Golf
Golf
Football
Footbal I
f
f
Faculty
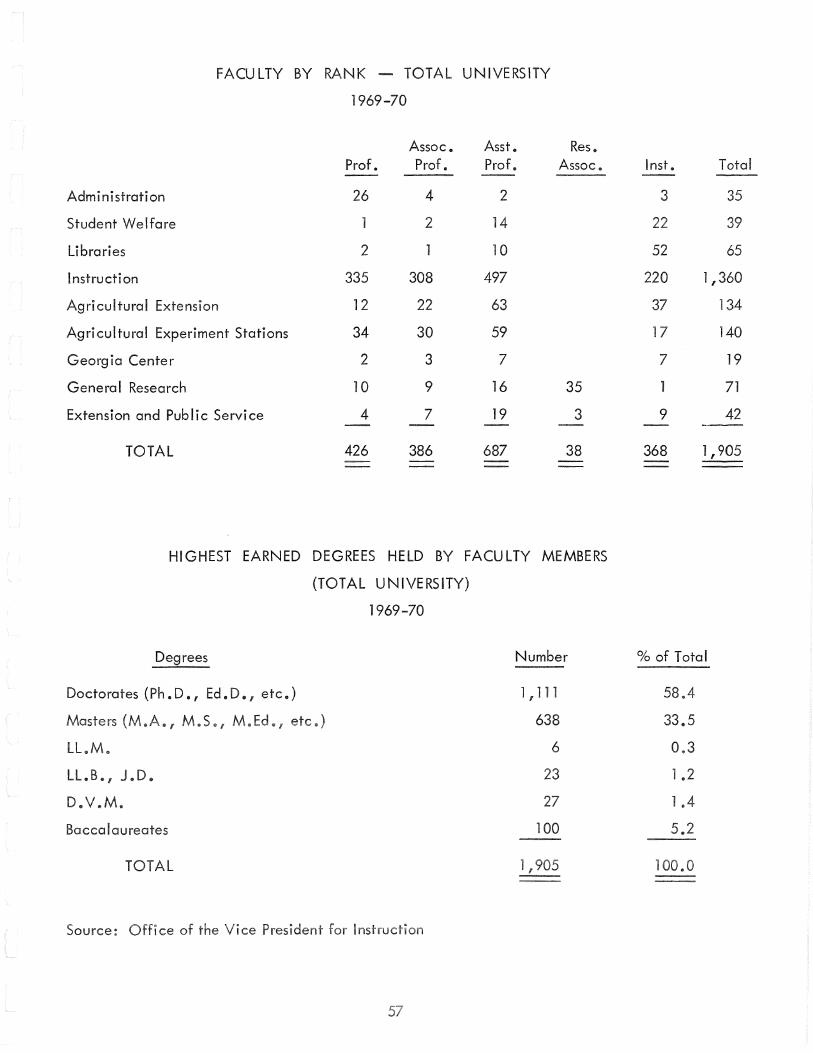
FACULTY BY RANK - TOTAL UNIVERSITY
1969-70
Assoc. Asst. Res. Prof. Prof. Prof. Assoc.
Administration 26 4 2
Student Welfare 2 14
Libraries 2 10
Instruction 335 308 497
Agricultural Extension 12 22 63
Agricultural Experiment Stations 34 30 59
Georgia Center 2 3 7
General Research 10 9 16 35
Extension and Pub I i c Service 4 7 19 3
TOTAL 426 386 687 38
HIGHEST EARNED DEGREES HELD BY FACULTY MEMBERS
(TOTAL UNIVERSITY)
Degrees
Doctorates (Ph.D., Ed. D., etc.)
(M.A., .S., M.Ed , etc.)
.M.
LL.B., J.D.
D .M.
Baccalaureates
TOTAL
Source: ce ce
1969-70
Number
1 .. 111
638
6
23
27
100
lnst. Total
3 35
22 39
52 65
220 1,360
37 134
17 140
7 19
71
9 42 -·-~
368 1 f 905
%of Total
58.4
33.5
0.3
1.2
1.4
5.2
.o --

Professor
Assoc. Prof.
Asst. Prof.
Instructor
All Ranks
FACULTY AVERAGE SALARIES*
(With Foundation)
1969-70
Number of Teaching Faculty
9 Mo • 1 2 Mo • T ota I
181 154 335
178 130 308
354 143 497
157 63 220
870 490 1,360
* Military, retired persons, and deans omitted.
Total falls short of total employees by deduction of temporary part-time persons.
Source: Office of the Vice President for Instruction
Average Salaries
$18,050
14,295
11,788
8,832
13,420
Library
----
LIBRARY STATISTICS
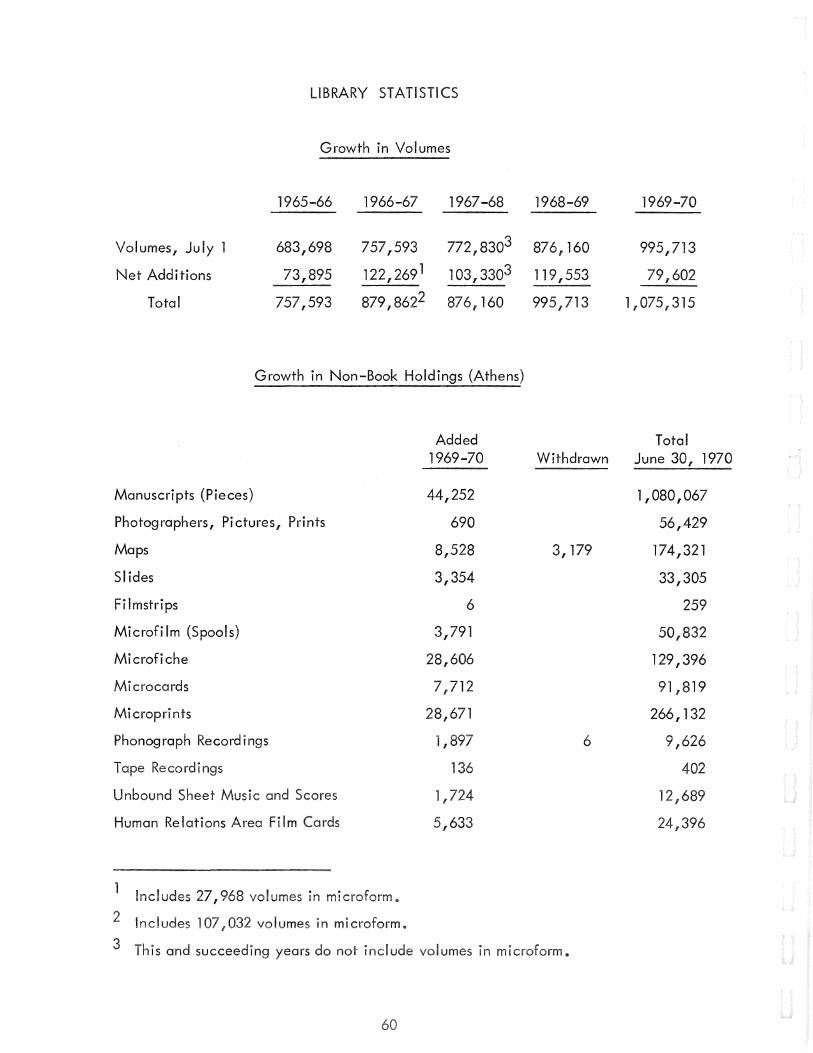
Growth in Volumes
1965-66 1966-67 1967-68 1968-69 1969-70
Volumes, July 1 683,698 757,593 772,8303 876,160 995,713
Net Additions 73,895 122,2691 103,3303 119' 553 79,602
Total 757,593 87918622 876,160 9951713 1 f 075,315
Growth in Non-Book Holdings (Athens)
Added Total 1969-70 Withdrawn June 30, 1970
Manuscripts (Pieces) 44,252 1,080,067
Photographers, Pictures, Prints 690 56,429
Maps 8,528 3, 179 174,321
Slides 3,354 33,305
Filmstrips 6 259
Microfilm (Spools) 3,791 501832
Microfiche 28,606 129,396
Microcards 712 91,819
Mi croprints 28,671 266,132
Phonograph Recordings 1,897 6 9,626
Tape Recordings 136 402
Unbound Sheet Music and Scores 1,724 12,689
Human Relations Area Film Cards 5,633 24,396
Includes 27,968 volumes
2 Includes 1 032 volumes in microform.
3 This and succeeding years do not include volumes in mi
Non-Reserve Books
Students Faculty Other
Total
Non-Book Materials
Out-of-Building use Building use
Total
Grand Total Circulation
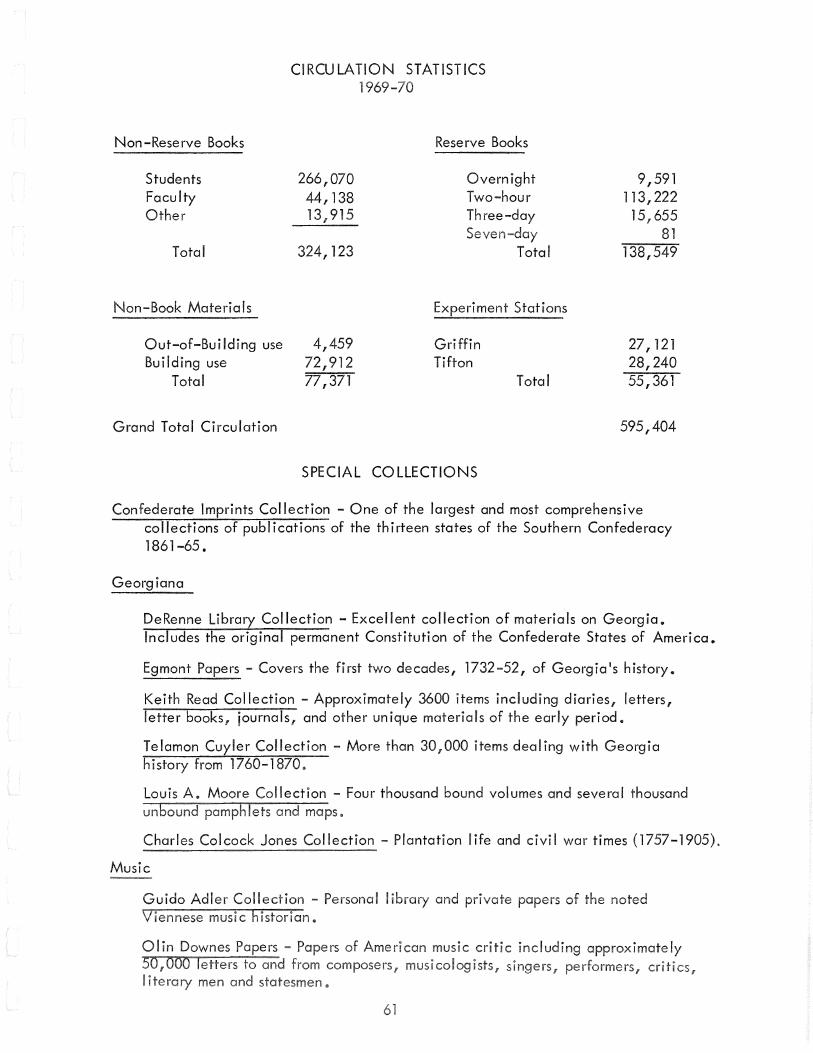
CIRCULATION STATISTICS
266,070 44, 138 13/915
324,123
4,459 72,912 77,371
1
Reserve Books
Overnight Two-hour Three-day Seven-day
Total
Experiment Stations
Griffin Tifton
Total
SPECIAL COLLECTIONS
9,591 113,222 15,655
81 138,549
27,121 28,240 55,361
595,404
Confederate Imprints Collection - One of the largest and most comprehensive collections of publications of the thirteen states of the Southern Confederacy 1861-65.
Georgiana
DeRenne Library Collection -Excellent collection of materials on Georgia. Includes the original permanent Constitution of the Confederate States of America.
Egmont Papers- Covers the first two decades, 1732-52, of Georgia 1s history.
Keith Read Collection - Approximately 3600 items including diaries, letters, letter books, journals, and other unique materials of the early period.
Telamon Cuyler Collection- More than 30,000 items dealing with Georgia hi story from 17 60-1870.
Louis A. Moore Collection - Four thousand bound volumes and several thousand
Charles Colcock Jones Collection- Plantation life and civil war times (1757-1905).
Music
Research

or College
I Research
& Sciences
Administration
Resources
raduate School
Economics
ism
I Work
culture
nistration
Research Stores
Center
SOURCE OF ALL RESEARCH FUNDS 1969-70
State Appropriated Research Funds Funds from Sales
$3,022,364 $
408,473
1,077,307
46,846
75,000
113,994
38,602
31,200
158,883
33,750
185,565
93,960
54,163
777,092 508,221
Research Grants and Contracts Total
$5,696,444 $8,718,808
99,800 508,273
8511194 1,928,501
53,687 100,533
176,437 251,437
28,454 142,448
38,602
31,200
54,009 212,892
794,409 828,159
217,298 402,863
184,726 184,726
93,960
54,163
716,247 2,001,560
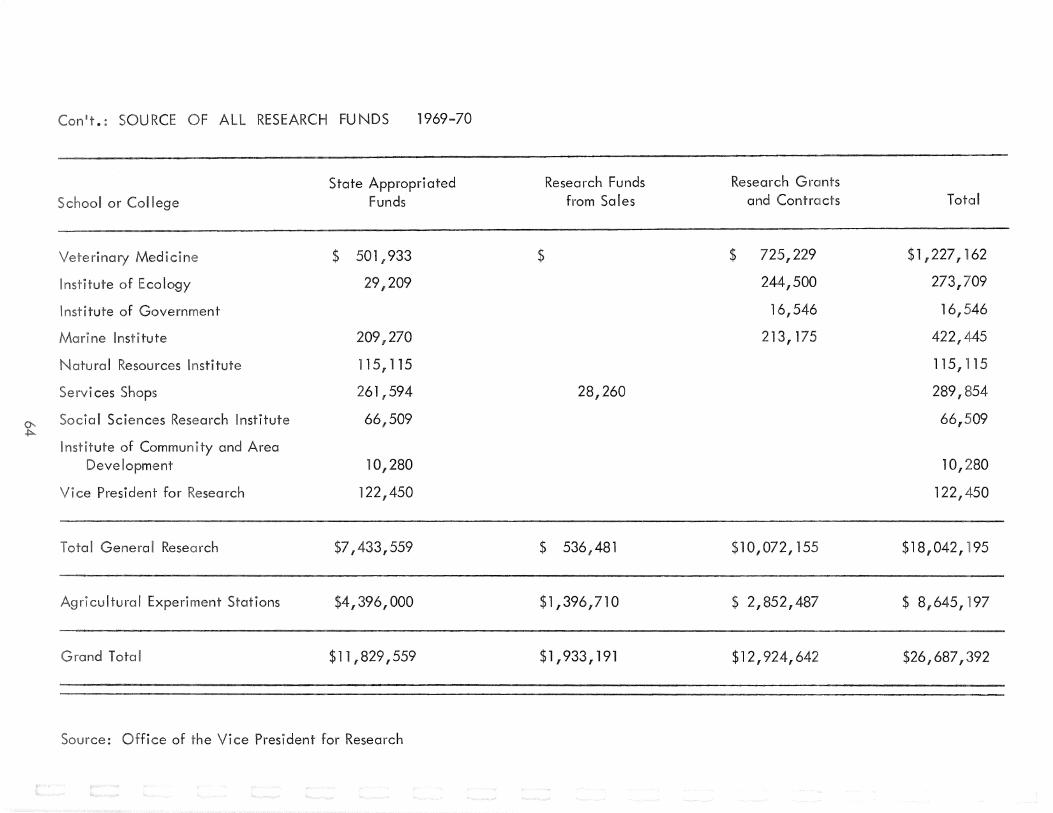
. RESEARCH FU NOS 1969-70
State Appropriated Research Funds Research Grants
or Lollege Funds from Sales and Contracts Total
rina Medi $ 501,933 $ $ 725,229 $1,227,162
tute of Ecology 29,209 244,500 273,709
16,546 16,546
ne lnst tute 209,270 213,175 422,445
I Resources tute 115,115 115, 15
261,594 28,260 289,854
I Sciences Research tute 66,509 66,509
Community and Area Development 10,280 10,280
ce President for Research 122,450 122,450
Genera Research $7/433,559 $ 536,481 $10,072,155 $18,042, 95
cultura Experiment Stations $4,396,000 $1,396,710 $ 2,852,487 $ 8,645, 97
Total $11,829,559 $1 f 933,191 $12,924,642 $26,687,392
ce of the Vice President for Research
or Lo!lege
I Research
inistration
Resources
School
Economics
I Work
Center
Government
of Ecology
culture
Genera Resemch
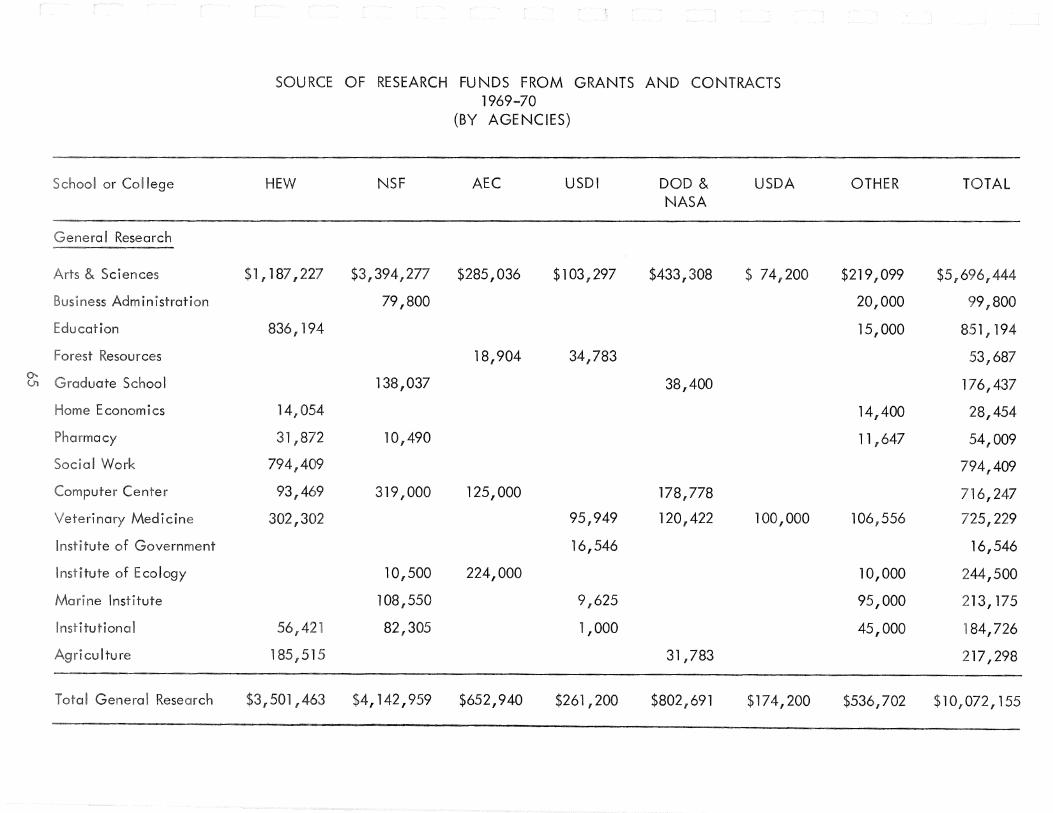
SOURCE OF RESEARCH FUNDS FROM GRANTS AND CONTRACTS 1969-70
(BY AGENCIES)
HEW NSF AEC USDI DOD & USDA NASA
$1,187,227 $3,394,277 $285,036 $103,297 $433,308 $ 74,200
79,800
8361194
18,904 34,783
138,037 38,400
14,054
31 ,872 10,490
794,409
93,469 319,000 125,000 178,778
302,302 95,949 120,422 100,000
16,546
10,500 224,000
108,550 9,625
56,421 82,305 1,000
1851515 31,783
$3.501,463 $4,142,959 $652,940 $261,200 $802,691 $174,200
OTHER TOTAL
$219,099 $5,696,444
20,000 99,800
15,000 851,194
53,687
176,437
14,400 28,454
11 ,647 54,009
794,409
716,247
106,556 725,229
16,546
10,000 244,500
95,000 213,175
45,000 84,726
217,298
$536J02 $10,072, 155
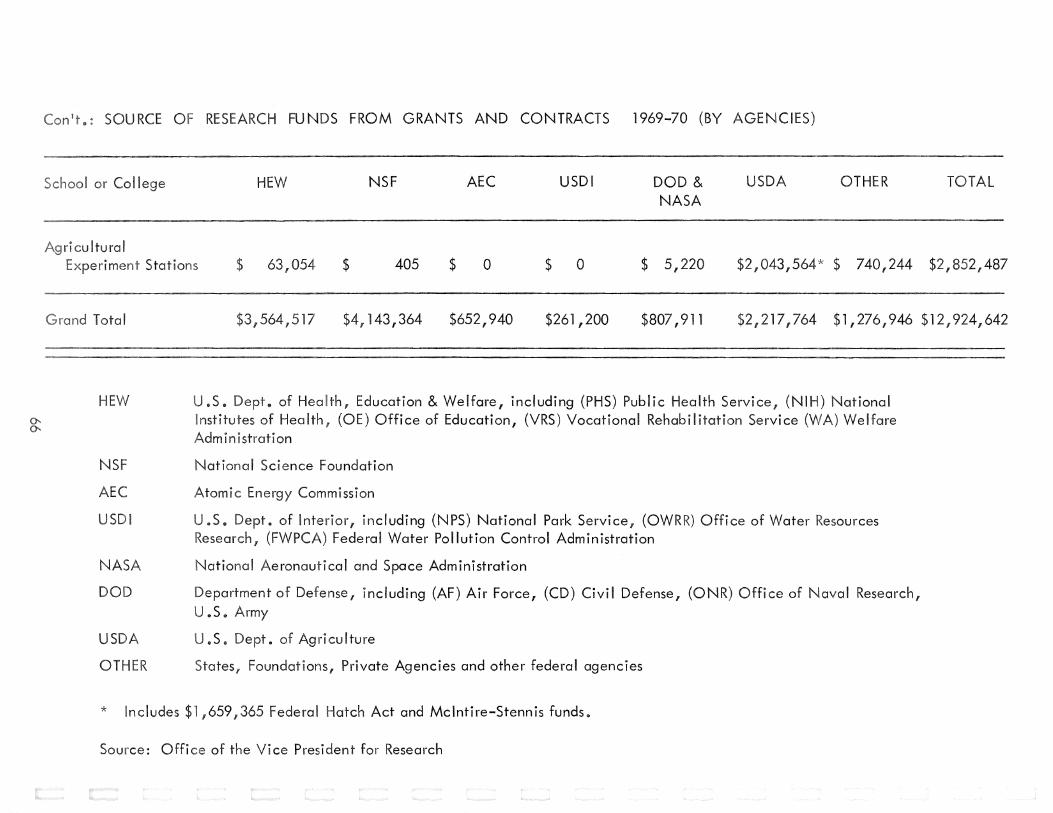
: RCE
or College
SEARCH FUNDS FROM GRANTS AND CONTRACTS 1969-70 (BY AGENCIES)
HEW NSF AEC USDI DOD & NASA
USDA OTHER TOTAL
ri cultural Stations $ 63/054 $ 405 $ 0 $ 0 $ 5,220 $2,043,564* $ 740,244 $2,852,487
H
$3,564,517 $4,143,364 $652,940 $261,200 $807' 911 $2,217,764 $1,276,946 $12,924,642
U.S. • of Heath, Education & Welfare, including (PHS) Public Health Service, (NIH) National nstitutes of Health, (OE) Office of Education, (VRS) Vocational Rehabilitation Service (WA) Welfare
.Administration
National Science Foundation
Atomic Energy Commission
USDI .S. Dept. of Interior, including (NPS) National Park Service, (OWRR) Office of Water Resources
USDA
OTHER
Research, (FWPCA) Federal Water Pollution Control Administration
I Aeronautical and Space Administration
Department of Defense 1 including (AF) Air Force, (CD) Civil Defense, (ONR) Office of Naval Research, U.S. Army
. s. • of Agriculture
States, Foundations, Private Agencies and other federal agencies
* ncludes $ ,659,365 Federal Hatch Act and Mcintire-Stennis funds.
Source: Office of the Vice President for Research

or College
I Research
Arts & Sciences
Administration
Forest Resources
Economics
Computer r
ogy
Institute
culture
General Research
SOURCE OF GRANT AND CONTRACT RESEARCH FUNDS 1969-70
Federal State Other Total
$51477,345 $ 9,432 $209,667 $51696,444
79,800 20,000 99,800
836,194 13,500 1,500 851,194
53,687 53,687
176,437 176,437
14,054 14,400 28,454
42,362 11,647 54,009
794,409 794,409
716,247 716,247
618,673 106,556 725,229
234,500 10,000 244,500
16,546 16,546
118,175 95,000 213,175
139,726 45,000 184,726
217,298 217,298
$9,535,453 $42,932 $493,770 $101072,155
Percent of Total
57.2
1.0
8.6
.6
1.8
.3
6
8.0
7.2
7.3
2.5
.2
2.3
2
2.2
100.0
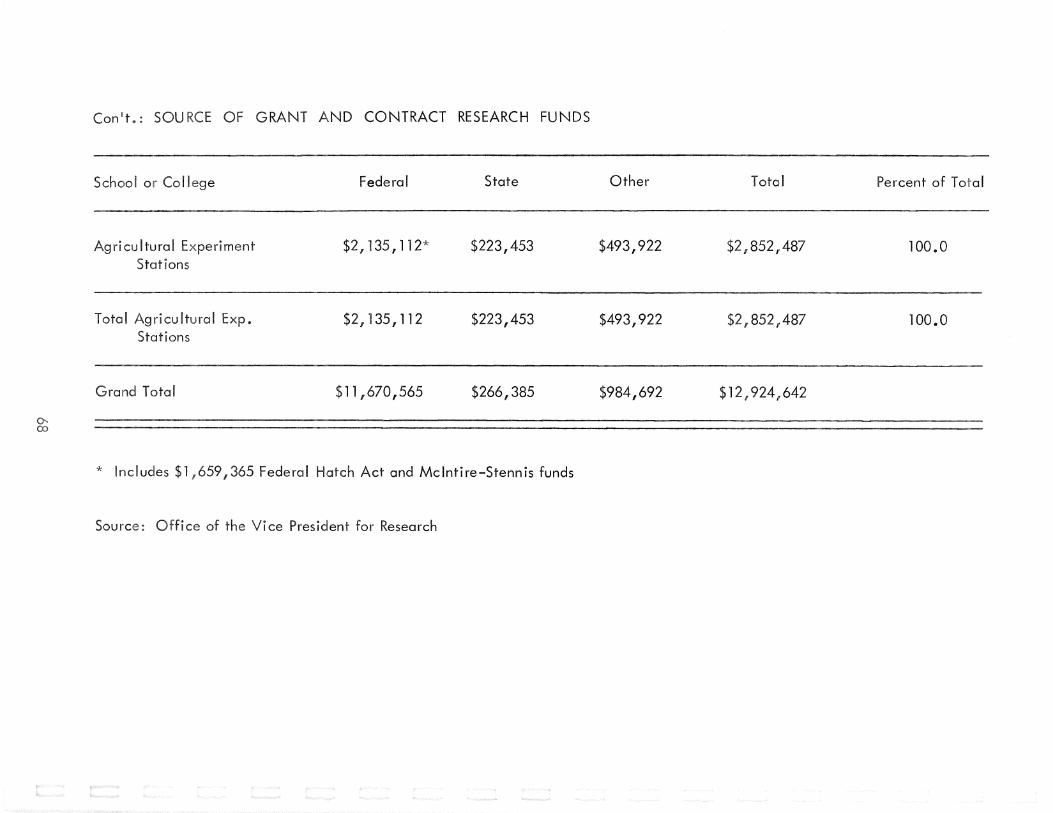
Con t : SOU
Schoo or College
Agricultural Experiment Stations
Total Agricultural Exp. Stations
Total
GRANT AND CONTRACT RESEARCH FUNDS
Federal State
$2, 135,112* $223,453
$2,135,112 $223,453
$11,670,565 $266,385
* ncludes $1 659,365 Federal Hatch Act and Mcintire-Stennis funds
Source: Office of the Vice President for Research
Other Total Percent of Total
$493,922 $2,852,487 100.0
$493,922 $2,852,487 100.0
$984,692 $12,924,642
Services

ALUMNI RELATIONS
Staff
Director of Alumni Relations, Associate Director of Alumni Relations, Two Assistant Directors of Alumni Relations, Business Manager 1 Office Manager. Clerical staff of twelve.
Facilities
The Alumni House is located in the recently renovated Field House on South Campus adjacent to The Coliseum.
Functions
The Office of Alumni Relations conducts all four major functions of an alumni program --alumni activities, fund raising, alumni publications, and record keeping.
Programs
Major programs of the Alumni Society include (l) formation and promotion of alumni chapters throughout Georgia and in major population centers where large numbers of University alumni live outside the state, (2) handling class reunions on the basis of five-year rotation 1 (3) conducting the Annual Meeting of the Alumni Society each spring, (4) UGA TODAY program which brings back to the campus key alumni leaders for presentation of up-to-date information on the University, (5) a highly successful annual giving program that ranks 14th in the nation among major state colleges and universities in the number of contributors (1968-69), (6) student recruitment program with major emphasis on National Merit Semi-Finalists and the upper 5 per cent in academic standing among the junior and senior classes of Georgia high schools, (7) public relations program for high school advisers and junior college admission officers and advisers, (8) recognition of the letter-winner each year in each of the 10 intercollegiate sports who has had the highest
c average for (9) a major program among student leaders on campus that udes assisting each year with the Blue Key Banquet and the ODK -Mortar Board Banquet for student leaders, (10) active program among the younger al been graduated the University during 10 (11) an enlarged program for alumni associations among the graduates of the various I schools and colleges on campus (Law, Veterinary Medicine, Business, Pharmacy, JournalismL (12) emphasis on scholar-
A 1 (13)
ipS
more alumni in special

fund drives on campus1 (15) publication of GEORGIA ALUMNI RECORD (five issues a year) and GEORGIA NEWSLETTER (six issues a year), (16) conducts alumni tours each year for interested alumni, (17) developed a highly sophisticated computer system for record keeping. Major changes in the computer system wi II be completed during 1970-71 and this will permit the Alumni Society to be of greater service to its alumni, faculty 1 and friends.
Publications
(a) GEORGIA ALUMNI RECORD 1 published during the months of September1
November, January, March, and June.
(b) GEORGIA NEWSLETTER, published during the months of August, October, February 1 April, May, plus a special newsletter to members of recently graduated classes sent during the Spring.
(c) Various school alumni association pub I ications such as newsletters for the College of Business Administration, School of Pharmacy, College of Veterinary Medicine, School of Journalism.
Factual Information on Alumni Listings
(a) Alumni by Classes (Spring 1970)
1870 through 1899 1900 through 1919 1920 through 1929 1930 through 1939 1940 through 1949 1950 through 1959 1960 through 1969
86 952
2,346 6,404
12,236 16,226 25,920
(b) Other classifications on file (Associates, SNS, Faculty-Non Alumni, Honorary, etc.)
(c) Total on Fi (Spring 1970)
(d) New Degree Holders
June, 1970 1970 (estimate)
maie
3,369 100
64, 171
5,864
70,035
5,469
0
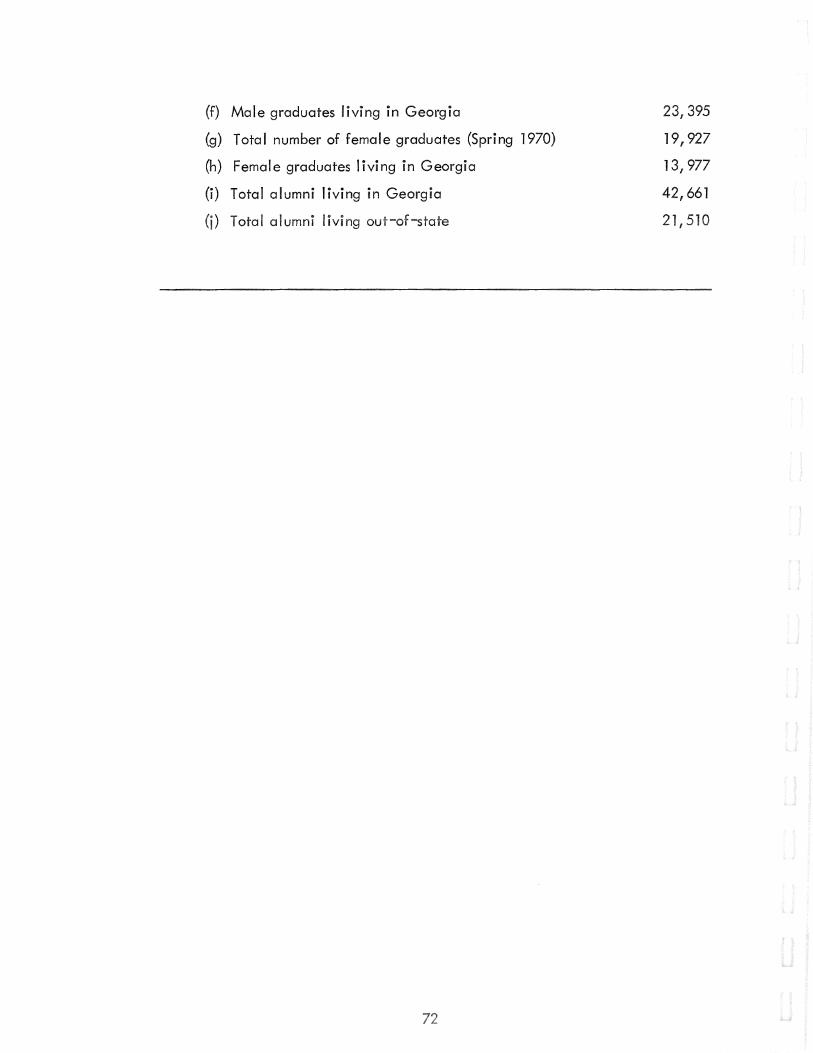
(f) Male graduates living in Georgia 23,395
(g) Total number of female graduates (Spring 1970) 19 f 927
(h) Female graduates living in Georgia 13,977
(i) Total alumni living in Georgia 42,661
(i) Total alumni living out-of-state 21,510
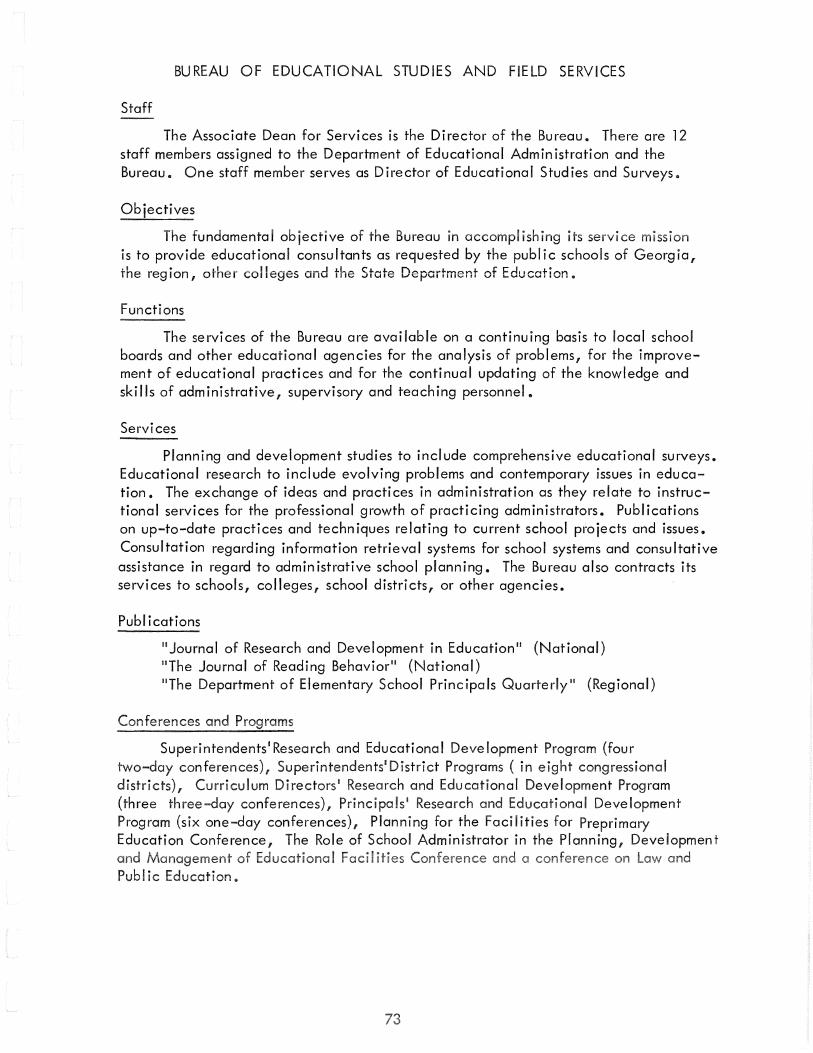
BUREAU OF EDUCATIONAL STUDIES AND FIELD SERVICES
Staff
The Associate Dean for Services is the Director of the Bureau. There are 12 staff members assigned to the Department of Educational Administration and the Bureau. One staff member serves as Director of Educational Studies and Surveys.
Objectives
The fundamental objective of the Bureau in accomplishing its service mission is to provide educational consultants as requested by the public schools of Georgia, the reg ion, other colleges and the State Department of Education ct
Functions
The services of the Bureau are available on a continuing basis to local school boards and other educational agencies for the analysis of problems, for the improvement of educational practices and for the continual updating of the knowledge and skills of administrative, supervisory and teaching personnel.
Services
Planning and development studies to include comprehensive educational surveys. Educational research to include evolving problems and contemporary issues in education. The exchange of ideas and practices in administration as they relate to instructional services for the professional growth of practicing administrators. Publications on up-to-date practices and techniques relating to current school projects and issues. Consultation regarding information retrieval systems for school systems and consultative assistance in regard to administrative school pi ann ing. The Bureau also contracts its services to schools, colleges, school districts, or other agencies.
Pub! ications
11 Journal of Research and Development in Education 11 (National) 11 The Journal of Reading Behavior 11 (National) "The Department of Elementary School Principals Ouarterly 11 (Regional)
Conferences and Programs
Superintendents'Research and Educational Development Program (four two-day conferences), Superintendents'District Programs (in eight congressional districts), Curriculum Directors• Research and Educational Development Program (three three-day conferences), Principals 1 Research and Educational Development Program (six one-day conferences), Planning for the Facilities for Preprimary Education Conference, The Role of School Administrator in the Planning, Development
I Public Education.
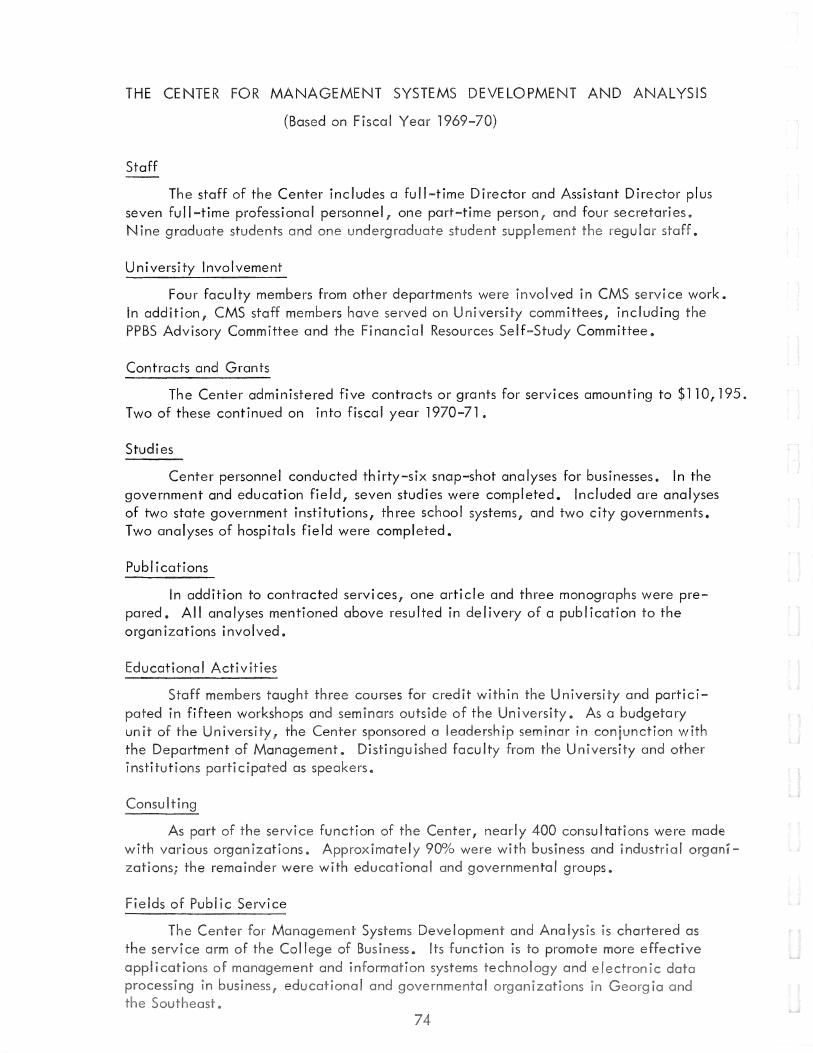
THE CENTER FOR MANAGEMENT SYSTE DEVELOPMENT AND ANALYSIS
(Based on F 1969-70)
Staff
The staff of the Center includes a full-time Director and Assistant Director plus seven full-time professional personnel, one part-time person, and four secretaries. Nine g one ement regu
University Involvement
Four faculty members from other departments were i ved in CMS ce work. In addition, CMS staff members have served on University committees, including the PPBS Advisory Committee and the Financial Resources Sel Committee.
Contracts and Grants
The Center administered five contracts or grants for services amounting to $110,195. Two of these continued on into fiscal year 1970-71.
Studies
Center personnel conducted thirty-six snap-shot analyses for businesses. In the government and education field, seven studies were completed. Included are analyses of two state government institutions, three school systems, and two city governments. Two analyses of hospitals field were completed.
Publications
In addition to contracted services, one article and three monographs were prepared. All analyses mentioned above resulted in delivery of a publication to the organizations involved.
ree courses for Universi and participated in fifteen workshops and sem a budgetary unit of Un the the Department of Management.
ci as

COMPUTER CENTER
Hardware
The processing units presently in operation are an IBM/360 model 65, an IBM 7094, two IBM l40i 1s, an iBM 1620, and an IBM 1130. these processors are attached a variety of peripheral devices, including tape drives, disks, drums, data cells, and 45 remote terminals.
Software
The scientific languages FORTRAN IV and ALGOL, the business language COBOL, and the general purpose language PL/1 are all in use on at least one machine. An assembler language is available for every machine. In addition, a conversational language is in use for remote terminals, and a simplified mathematical language is used on the AMTRAN console.
Services
In the continuing effort to improve services to the University community, the Computer Center has organized a Users Service group. In addition to functioning as the information desk for the Center1 Users Services will assume production responsibility for standard programs and provide indirect assistance in the areas of programming and control languages.
Other services are also available through the Computer Center. Statisticians are available to assist in the statistical analysis of experimental data using computers. The Computer Software Management and Information
(COSMIC) d programs inal developed by the National Aeronautics and Space Administration (NASA), the Atomic Commission
1 and the Department of Defense Information Sciences group c researchers rences to current past I iterature in
cular fie
COOPERATIVE EXTENSION SERVICE
The Cooperative Extension Service is an educational undertaking of the University of Georgia College of Agriculture and the U.S. Department of Agriculture with the cooperation of the counties of the state. Administratively, it is an integral part of the University. It was created by the Smith-Lever Act of Congress in 1914 which provided for the Department of Agriculture to join with the states in conducting off-campus educational programs relating to agriculture, resource development, home economics and youth development.
Staff
Specialists in more than 20 subject matter areas are available to assist county Extension personnel and, through them, the people of the state in planning programs and carrying out recommended practices. The specialist and administrative and supervisory staff numbers about 150. Most of these are housed on the Athens campus although some are located in other areas including the new Rural Development Center at Tifton.
Responsib i I ities
Two major responsibilities of the Extension Service are to be a service arm for the University and an educational arm for the USDA. The county agents and county Extension home economists are representatives of both the University and USDA. In their dual roles they carry out broad educational programs in agriculture, resource development, home economics and youth development and inform the public of Federal farm programs and other USDA services. There are approximately 450 such agents in the state.
Service Activities
Major areas of service within the broad categories of work include agricultural engineering 1 agronomy, animal science, community and resource development, dairy science, economics and farm management, entomology, forestry, horticulture, landscape architecture, marketing and utilization, plant pathology, poultry science, veterinary medicine, family life, food science ond food preservation, health, home management, housing, equipment home furnishings, nutrition and youth develop-ment, including the 4-H lub program. The subject matter specialists gather the latest research information from the experiment stations, the USDA and elsewhere and make it available to the agents along with recommendations.
Special programs are also carried out with resource development, rural area development and area redevelopment, including the work of the Area Planning and
I Food and Nutrition Education program. It cooperates in Opportunities Act. In 1969-70 the Extension Service distributed 1 204,200 to citizens state.

THE GEORGIA CENTER FOR CONTINUING EDUCATION
Facilities
Staff
The Georgia Center is a residential adult education facility with:
137 double bedrooms with a sleeping capacity of 274 18 conference rooms of varying sizes with a total
seating capacity of l, 120 8 dining areas with a total seating capacity of 916
48 offices 2 libraries 4 elevators
The Center has an average monthly payroll of over 500. This includes:
247 hourly employees 96 salaried employees on weekly or bi-weekly payrolls 54 administrative employees on monthly payrolls 11 administrative personnel joint-staffed with other
schools, colleges or institutes on campus 59 part-time instructors 71 (average) University of Georgia faculty members
contributing to the Center1s program
Program
During the 1969-70 fiscal year the Center conducted:
298 conferences reg some 25 1
770 other meetings and activities involving
Extension programs in virtually every county the state including non-credit programs and credit courses at
g I
and broadcast over a statewide network other stations

THE GEORGIA CENTER FOR CONTINUING EDUCATION
INSTRUCTIONAL SERVICES DIVISION
ces D a 47
2. The four departments within Instructional Services are University Extension, Conferences and Short Courses, Program Development and Evaluation, and Inter-Institutional Programs.
3. The University Extension Department is responsible for the off-campus credit and non-credit continuing education effort of the Georgia Center.
4. The Conferences and Short Courses Department is responsible for the residential conference program at the Georgia Center.
5. The Department of Program Development and Evaluation is composed of a staff of 20 specialists who are joint-staffed with one of 8 academic departments, colleges, and institutes.
6. The Department of Inter-Institutional Programs is responsible for strengthening relationships with other institutions of higher education and developing joint programs in continuing education.
7. The Georgia Center has a professional staff member jointly employed with and housed in each of three University System Junior Colleges.
8. The off-campus credit program of University Extension is equal in enrollment to a college with 2 1 139 full-time students. The enrollment consists of 1,049 equivalent fu 11-time undergraduate students and 1, 090 equivalent fu 11-time graduate students.
E GEORG NTER FOR INUING CATION
COMMUNICATIONS DIVISION
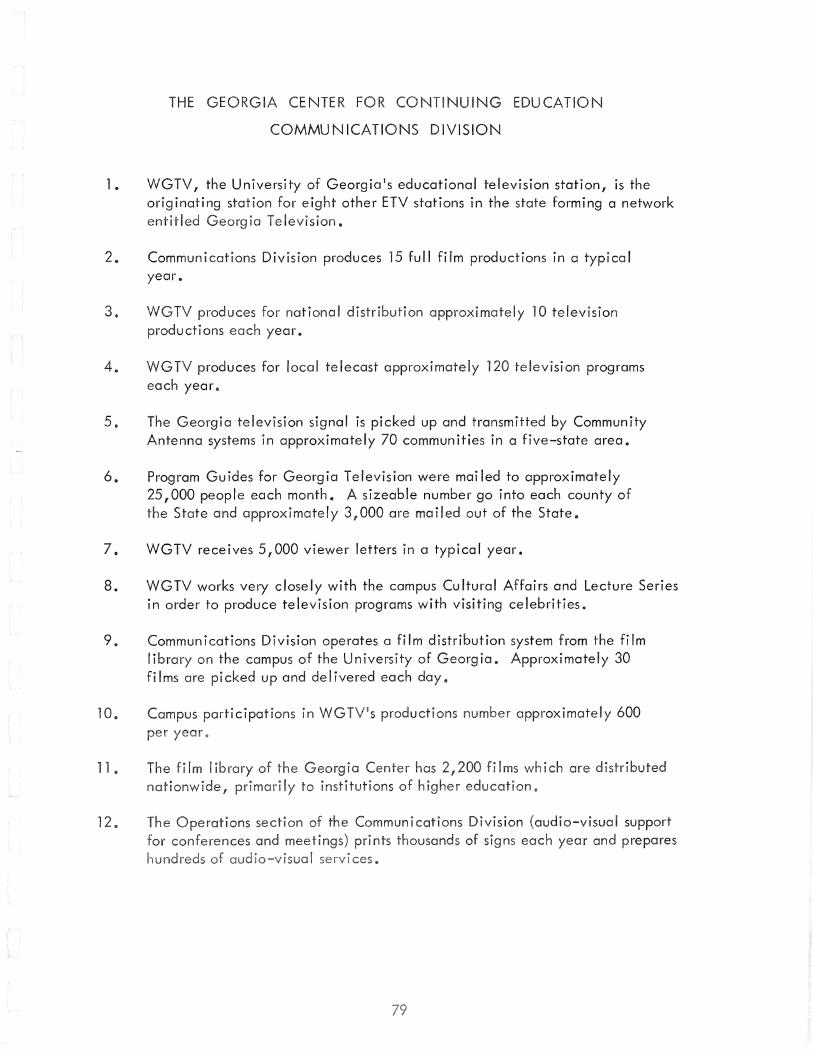
1. WGTV, the University of Georgia's educational television station, is the originating station for eight other ETV stations in the state forming a network entitl ia levis ion.
2. Communications Division produces 15 full film productions in a typical year.
3. WGTV produces national ly 10 television productions each year.
4. WGTV produces for local telecast approximately l television programs each year.
5. The Georgia television signal is picked up and transmitted by Community Antenna systems in approximately 70 communities in a five-state area.
6. Program Guides for Georgia Television were mailed to approximately 25,000 people each month. A sizeable number go into each county of the State and approximately 3,000 are mailed out of the State.
7. WGTV receives 5,000 viewer letters in a typical year.
8. WGTV works very closely with the campus Cultural Affairs and Lecture Series in order to produce television programs with visiting celebrities.
9. Communications Division operates a film distribution system from the film library on the campus of the University of Georgia. Approximately 30
10.
11.
12
films are eked up and delivered each day.
Campus participations in WGTV 1s productions year
approximately 600
are d
year prepares
THE INSTITUTE FOR BEHAVIORAL RESEARCH
The Institute for Behavioral Research is a multidisciplinary research organization. Its purpose is to encourage a pooling of the expertise of staff members and graduate students such departments as Management 1 Political Science, Educational Psychology, Psychology and Sociology in behalf of an attack upon significant social and behavioral problems at both basic ond applied levels.
Physically the Institute for Behavioral Research is housed in the new and spacious Graduate Studies building with ready access to the University of Georgia Computer Center, a technical I ibrary, and related foci lities.
Staff members are appointed on a basis reflective of their commitment to current research projects, and Graduate Research Assistantships are available to students contemplating appropriate thesis or dissertation research.
A broad base of support is being sought through the development of plans which will enable the institute to serve not only national and regional interests, but those of the State of Georgia and the University community as well.
Staff
THE INSTITUTE OF COMPARATIVE MEDICINE
(Based on Fiscal Year 1969-70)
Director and Associate Director plus 75 professional personnel jointly staffed from the College of Veteiinary lvA,edicinc, College of l\rts and Sciences, School of Pharmacy, College of Agriculture, School of Forestry, and School of Home Economics.
Functions
The Institute functions in coordinating research on the fundamental aspects of comparative medicine and the clinical sciences. The educational mission of the Institute is, therefore, oriented toward the strengthening of the graduate programs in the biomedical sciences. The service function of the Institute is manifest in the consultative roles of its members in comparative and laboratory animal medicine programs of the University System agencies and organizations.
Contracts and Grants
The Institute of Comparative Medicine was responsible for the administration of $1,087,933 -- in contracts and grants during Fiscal year 1969-70.
Publications
Submitted 53* papers for publication in biomedical journals.
* represents close approximate figure

THE INSTITUTE OF COMMUNITY AND AREA DEVELOPMENT
(Based on Fiscal 1969-70)
Staff
Full-time Director and Associate Director plus 27 professional personnel jointly staffed with academic departments, schools and other institutes.
Uni
Involved 50 faculty members from 25 departments, schools or other institutes in !CAD service work.
Contracts and Grants
Administered 32 contracts or grants for services amounting to $545 1 394.
Studies
Conducted 81 studies for community and area organizations, state agencies, or federal agencies.
Publications
Pub I ished 58 reports or other documents on technical subjects for groups outside the University.
Educational Activities
Organized, conducted or participated in 84 leadership seminars, forums, panels or workshops, and gave 58 lectures or special talks to outside groups.
Consulting
Participated in 224 technical consultations with outside groups, 78 general planning consultations, and honored 139 requests for factual information.
Fields of Public Services
, economics, fine arts, recreati , ces, pharmaceutical
field enforcement, general governmental
sociology, trade and services, l
ces
THE I OF CONTINUING LEGAL EDUCATION IN EORGIA
The Institute of Continuing
of Emory and a continuing legal education program for the Georgia
s
holds hver.ty-Hve to thirty seminars a year to lawyers abreast of changes and new developments one to three Courses are d at the as well as in the major cities
The University of Georgia pays the salaries of the Director the Institute and staff as well as provides office facilities Institute in the Law School Building.
Staff
The faculty of the Institute is picked from the law faculties of Georgia, Mercer and Emory Universities. Prominent practitioners and specialists of the State Bar of Georgia and national experts teach and lecture at these seminars.
Services
Seminars are also held for Superior Court Judges and judges of other Georgia Courts, as well as for City and County Attorneys and District Attorneys.
THE iNSTlTU OF ECOLO
Staff
Full-time Executive Director plus full, associate, and student members jointly staffed with 15 academic departments and schools. A technical and clerical staff of 16 persons.
Foci I ities
Administrative offices and computer facilities in the Rockhouse (Lumpkin House). Laboratories in Biological Science and Forest Resources Buiidings. Research area at Horseshoe Bend near the campus. Operates the Savannah River Ecology Laboratory near Augusta, Georgia for the U.S. A.E.C. Has members and students at University of Georgia 1s Marine Institute on Sapelo Island, Georgia.
Contracts and Grants
Administered five grants amounting to $585,796. Total support through member 1s grants is $649,851.
Research Programs
Operates five multidisciplinary research programs: 1) radiation ecology at SREL, 2) marine ecology, 3) temperate forest ecology 1 4) tropical ecology and 5) avian ecology.
Pub I i cations
Members published over 100 papers or books in 1969.
Training Programs
Operates a training program in Environmental Health, amounting to about $100,000 per year. Also developing a systems ecology training program in cooperation with the Department of Zoologyo Over 130 graduate students enrolled in ecology in academic departments.
Service Activities
Members active on many international, national and local committees. Have special relationships with the International Biological Program, Organization for Tropical Studies, and International Society of Ecology. Members on the Joint Congressional Committee on
ronment. Members I, committees in the U.S. and Georgia. Members also give speeches and conduct workshops for layme11, as well as serve as ecological consultants.
c departments Computer
ronmental
!try Science, Law, Forest

THE INSTITUTE OF GOVERNMENT
(As of June 30, 1970)
Staff
In addition to the Director, the Institute employs 37 full-time professional personnel, including 20 jointly-staffed with other University functions such as the departments of Political Science, Sociology, Accounting, and Banking and Finance, the School of Social Work, the Georgia Center for Continuing Education, and the institute of Community and Area Development. Ten staff members were employed under grants or contracts and nine graduate students served in a variety of research assistantships.
Budget, Contracts, and Grants
The 1969-70 budget for the Institute of Government was approximately $402,000, and will be at $460,000 for fiscal year 1970-71. In addition, during fiscal year 1969-70, the Institute cooperated with the Georgia Center in administering federally funded governmental training programs totalling $403,000. Other functional elements of the Institute held grants or contracts with an approximate value of $381,000.
Studies and Consultations
During 1969-70, the Institute of Government faculty provided consultative services or conducted studies in connection with more than 85 different projects.
Publications
During 1969-70, the institute of Government staff published five books, approximately ten formal, full-length reports, and, in addition, a comprehensive report on the state 1s legislative body produced by a blue-ribbon group, The Citizens Committee on the Georgia General Assembly. Of its publications, both past and current, the Institute sold 2,772 and made complimentary distribution of 1 ,632 during the fiscal year.
Training Activities
Through connection with the Georgia Center and at various locations around the state, the Institute of Government planned, conducted, or co-sponsored more than 150 conferences or seminars in various aspects of governmental training, police science, and corrections.
Other Educational Activities
Institute of Government serves as an of the Board in the development of police science degree programs at Georgia state colleges. It also administers the off-campus Master of Publ Administration program in cooperation with the Department of Politi cal Science.
E H
Staff
Director and Associate faculty of the Department of H
rector pi us seven fu II Education.
staff members who are also
u i is in ce for several colleges in six southeastern
states and is engaged in research on higher education at the University of Georgia. It has been for coordinating the U Higher Education General Information Survey for the total U
members of tute developed a doctoral program in higher education was added to the graduate curriculum during 1969-70. IHE also coordinates the
I assistantsh program for faculty members teaching in Georgia colleges. Other seminars and noncredit programs are periodically sponsored by the Institute.
Contracts and Grants
Under Title Ill of the Higher cation Act of 1965, the Institute assists developing colleges improve their administration and faculty resources and helps in curriculum development. The University currently has fourteen Title Ill affiliates who have been awarded over one million dollars by USOE. Contracts for services have also been made with other individua I institutions throughout Georgia and the Southeast. The Institute is currently conducting two special programs for personnel from developing institutions. One of these programs, funded under the Education Professions Development Act (EPDA), deals with the Administrative Team and the other with Management Information Systems.
Other Projects
The Institute staff has worked with the Southern Association of Colleges and Schools, The Southern Regional Education Board, The Southern Education Foundation, The American
The Associat for Institutional Research in various projects • I to faculty
ing, administrat
THE INSTITUTE OF NATURAL RESOURCES
(Based on Fiscal Year 1969-70)
Full-time staff includes director and three associate directors, plus a resea associate and two clerical
Facilities
Offices located in Building No. l of the School of Forest Resources. Various laboratory facilities of other units of the University are available for use by INR.
Contracts and Grants
Total budget for INR for 1969-70 was approximately $120,000. Administered a research grant of $19,883 from the National Park Service.
Programs
Coordinates programs pertaining to (l) Marine Sciences and technology of coastal resource use and management; (2) biological resources -- fish,
ldlife, forests; (3) use and management of water and mineral resources.
Administers the new created Marine Extension Service. The director of I NR is also d of Coastal Resources Development for e University

THE SERVICE PROGRAM OF THE COLLEGE OF BUSINESS ADMINISTRATION
1969-1970
Staff
The Division of Services staff consists of an Administrative Assistant for Services who serves as director, two Field Representatives, and a secretary.
Consultation and Visitation*
Consultation/Visitations by College of Business Administration (Includes efforts of individuai facuity, Center for Management Systems, Division of Research, and Division of Services.) -- Community Groups (45), Federal/State Government (110), City/County Government (45), APDC' s (73), Business and Industry (980), Associations (136), Other Educational Institutions (27), Off-campus Seminars (21), Campus Seminars (52).
Seminars/Workshops
Fifty-one (51) sponsored or co-sponsored seminars/workshops were held at the Georgia Center. Approximately 309 conference days were logged. We had 1700 participants from 24 different states plus the District of Columbia and the Virgin Islands.
Studies/Publications
The Division of Research conducted and/ or participated in eight major studies during the year. Working individually and with the Division, many of the faculty conducted and participated in numerous studies funded by private firms, associations, and governmental units. The faculty of the College had 55 articles in journals, 5 books, 17 monographs, 5 chapters or parts of books, and 2 proprietary studies. Funded projects expanded during the year with a yearly total of $670,181.
Data Collection and Dissemination
The Division of Research continued its collection and dissemination of data about the local business activity in the State of Georgia. The data was published in
--~-Business (12 !able in S cal Abstract.
* Figures represent individual calls or visits to firms, etc. in each group classification.
Revenue
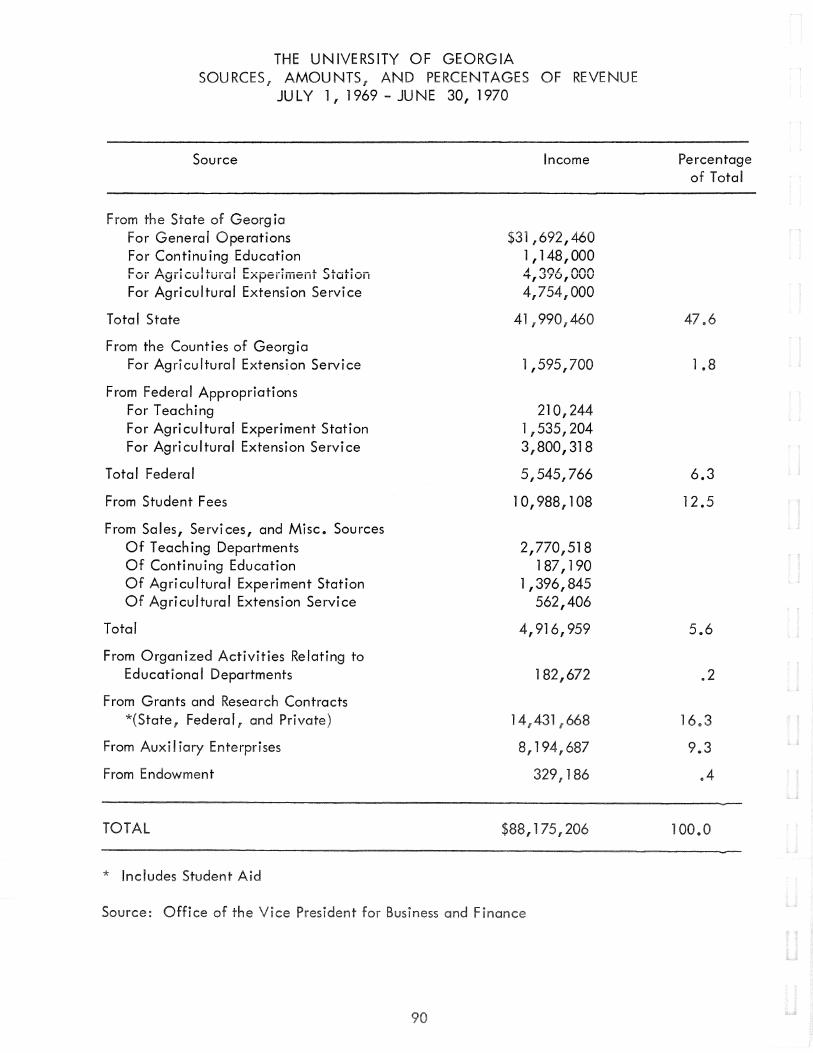
THE UNIVERSITY OF GEORGIA SOURCES, AMOUNTS .. AND PERCENTAGES OF REVENUE
JULY 1, 1969 - JUNE 30, 1970
Source
From the State of Georgia For General Operations For Continuing Education For Agricultural Experiment Station For Agricultural Extension Service
Total State
From the Counties of Georgia For Agricultural Extension Service
From Federal Appropriations For Teaching For Agricultural Experiment Station For Agricultural Extension Service
Total Federal
From Student Fees
From Sales, Services, and Misc. Sources Of Teaching Departments Of Continuing Education Of Agricultural Experiment Station Of Agricultural Extension Service
Total
From Organized Activities Relating to Educational Departments
From Grants and Research Contracts *(State, Federal and Private)
From Auxi I iary Enterprises
From Endowment
TOTAL
* Includes Student Aid
Source: Office of F
Income
$31,692,460 1,148,000 A -:lf'\L f'\1'\f'\ '+1 v7u1 vvv
4,754,000
41,990,460
1,595,700
210,244 1 ,535, 204 3,800,318
5,545,766
l 0, 988,108
2,770,518 187,190
1,396,845 562,406
4,916,959
182,672
14,431 668
8,194,687
329,186
$88,175,206
Percentage of Total
47.6
1.8
6.3
12.5
5.6
.2
16 3
9.3
.4
100.0

THE UNIVERSITY OF GEORGIA EXPENDITURES BY AMOUNTS AND PERCENTAGE
JULY 1 , 1969 - JUNE 30, 1970
Expenditure Amount
Instruction and Departmental Research $32,410,163
Organized Activities Relating to Educational Departments 344,342
General Administration and General Expenses 5,771,826
Library 2,605,539
Operation and Maintenance of Instructional Plant Facilities 4,804,361
Organized Research (Not Including Agricultural Experiment Station) 6,404,182
Extension and Public Service 5,037,170
Student Aid 2,851,912
Auxi I iary Enterprises 7,911,090
Agricultural Experiment Station 8,955,846
Ag ltural Extension Serv 10,763,997
TOTAL $87,860,428
ce of Vice President for Business and Finance
Percentage of Total
36.9
.4
6.6
3.0
5.5
7.3
5.7
3.2
9.0
10.2
12.2
100.0
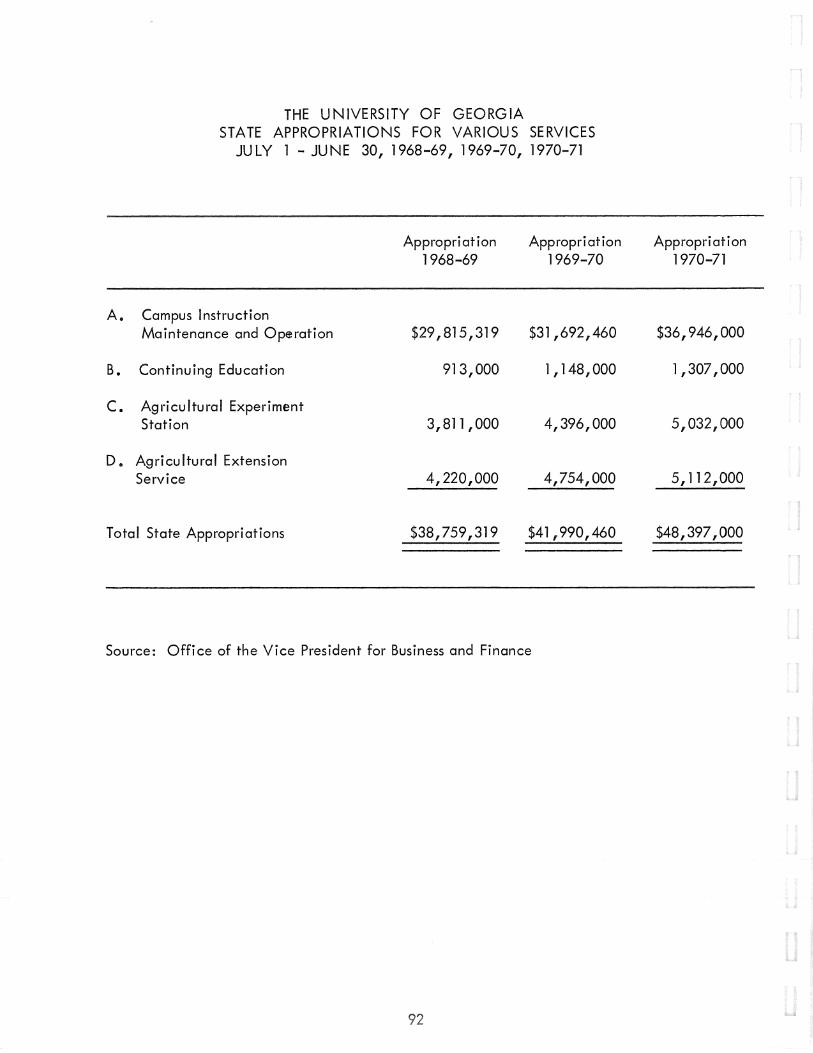
A.
B.
c.
D.
THE UNIVERSITY OF GEORGIA STATE APPROPRIATIONS FOR VARIOUS SERVICES
JULY 1 -JUNE 30, 1968-69, 1969-70, 1970-71
Campus Instruction Maintenance and Operation
Continuing Education
Agricultural Experiment Station
Agricultural Extension Service
Appropriation 1968-69
$29,815,319
913,000
3,811,000
4,220,000
Appropriation 1969-70
$31,692,460
1,148,000
4,396,000
4,754,000
Total State Appropriations $38,759,319 $41,990,460
Source: Office of the Vice President for Business and Finance
Appropriation 1970-71
$36,946,000
1,307,000
5,032,000
5,112,000
$48,397,000

Fiscal ';~ T ~ar
1960-61
1961-62
1962-63
1963-64
1964-65
1965-66
1966-67
1967-68
1968-69
1969-70
THE UNIVERSITY OF GEORGIA PERCENTAGE DISTRIBUTION FROM VARIOUS SOURCES
OF REVENUE FOR RESIDENT INSTRUCTION 1960-61 - 1969-70
Per Cent From Per Cent From C'L __ J._ A~---... --- .... ~-.&.!- ..... - c:: .... l....l--o~- J:r'!o-t:" ..JIUit:: .-.pf-.11UfJIIUIIUII;) VIVU~III I ._W<J
71 .60 23.70
65.91 29.52
65.50 30.23
67.05 26.32
67.70 27.58
71.00 25.51
61 .71 28.63
72.54 18.80
74.19 18.51
69.72 22.53
Source: Office of the Vice President for Business and Finance
Per Cent From Other Sources
4.70
4.57
4.27
6.63
4.72
3.49
9.66
8.66
7.30
7.75
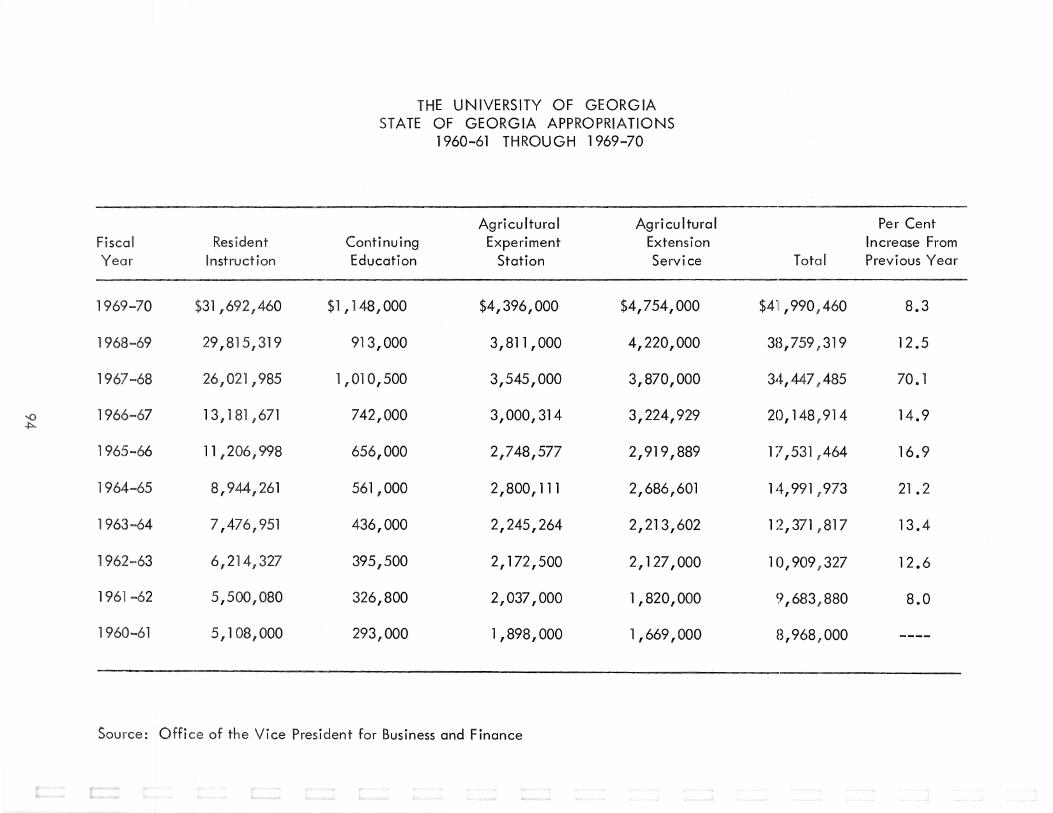
Fiscal
1969-70
1968-69
1967-68
l
1965-66
1964-65
1963-64
1962-63
1961
1960-61
Resident Instruction
$31,692,460
29,81 319
26, ,985
13 I 1 ,671
11,206,998
8, 261
7,476,951
6,21 327
5,500,080
5,108,000
THE UNIVERSITY OF GEORGIA STATE OF GEORGIA APPROPRIATIONS
1960-61 THROUGH 1969-70
Agricultural Agricultural Continuing Experiment Extension Education Station Service
$1,148,000 $4,396,000 $4,754,000
913,000 3,811,000 4,220,000
1 'Ol 0,500 3,545,000 3,870,000
7421000 3,000,314 3,224,929
656,000 2,748,577 2,919,889
561,000 2,800,111 2,686,601
436,000 2,245,264 2,213,602
395,500 2,172,500 2,127,000
326,800 2,037,000 1,820,000
293,000 1,898,000 l ,669,000
Office of Vice President for Business and Finance
Per Cent Increase From
Total Previous Year
$4'1 I 990,460 8.3
3B,759 319 12.5
34,447 485 70.1
20,148 914 14.9
17,531 464 16.9
14,991,973 21.2
12,371 817 13.4
10,909,327 12.6
9,683,880 8.0
8,968,000

Auxiliary Enterprises
--
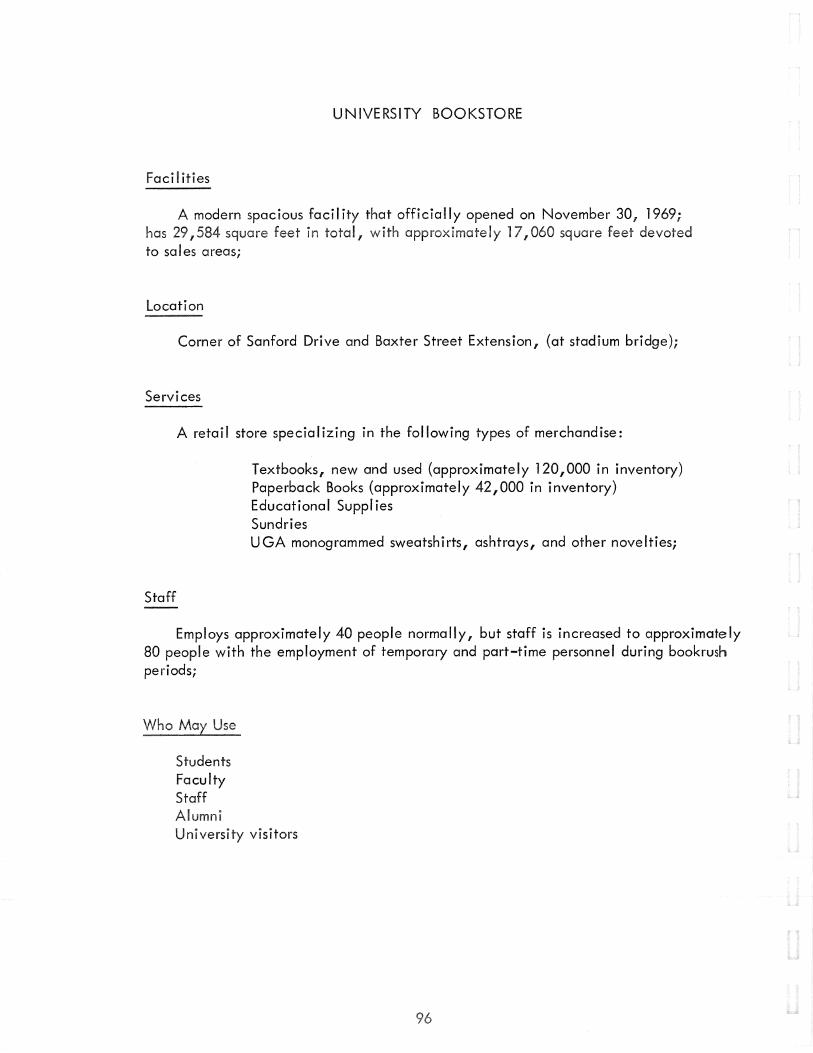
UNIVERSITY BOOKSTORE
Facilities
A modern spacious foci! ity that officially opened on November 30, 1969; has 29,584 square feet in total, with approximately 17,060 square feet devoted to sales areas;
Location
Corner of Sanford Drive and Baxter Street Extension, (at stadium bridge);
Services
A retail store specializing in the following types of merchandise:
Staff
Textbooks, new and used (approximately 120,000 in inventory) Paperback Books (approximately 42,000 in inventory) Educational Supplies Sundries UGA monogrammed sweatshirts, ashtrays, and other novelties;
Employs approximately 40 people normally, but staff is increased to approximately 80 people with the employment of temporary and part-time personnel during bookrush periods;
Who Use
Students Faculty Staff
umnl University visitors

UNIVERSITY FOOD SERVICE
Unit Name: BOLTON HALL SNELLING HALL BULLDOG ROOM McWHORTER DINING HALL
Seating Capacity: 1,000 360 376 224
Size of Facility: 1 2, 872 sq. ft. 6,000 sq. ft. 7,000 sq. ft. 3, 7 65 sq • ft.
Location Baxter Street Green Street Memorial Hall Ag Drive and
Field Street
ces Cafeteria Student Snack Bar Cafeteria for Athletic -
Cafeteria Small Group Association Faculty Luncheon Banquets Banquet Services Ice Cream Parlor
No. of Employees: 57 44 28 14 -
Who Ma}'J:l~ Students Students Students Athletes Faculty & Faculty & Faculty &
Staff Staff Staff Univ. Groups Univ. Groups Univ. Groups

UNIVERSITY GOLF COURSE
Facilities
An 18 Hole Championship Course, 6, 930 yards long, designed by Robert Trent Jones; a 30 Tee Driving Range with two (2) Putting Greens, and one (1) Chipping Green; the Course was opened in September of 1968.
location
Mi I ledge Extension, off East Campus Road, approximately one (1) mile south of the Married Student Housing Complex;
Services
All facilities listed above, also rental motorized cars, rental pull rental clubs, and locker space; Retail Pro-Shop with inventory of balls, clubs, shoes, bags, etc.
Who May Use
Students Faculty Alumni Dependents of Students, Faculty, and Alumni Conferees
UNIVERSITY PRINTING DEPARTMENT
Facilities
A complete Printing Plant which has the equipment to produce almost all types of printing jobs; has approximately 9,800 square feet total area.
location
The basement floor of Terrell Hall;
Services
the areas of
eon a II
Any department or unit I the of or the Studer1t

Physical Facilities
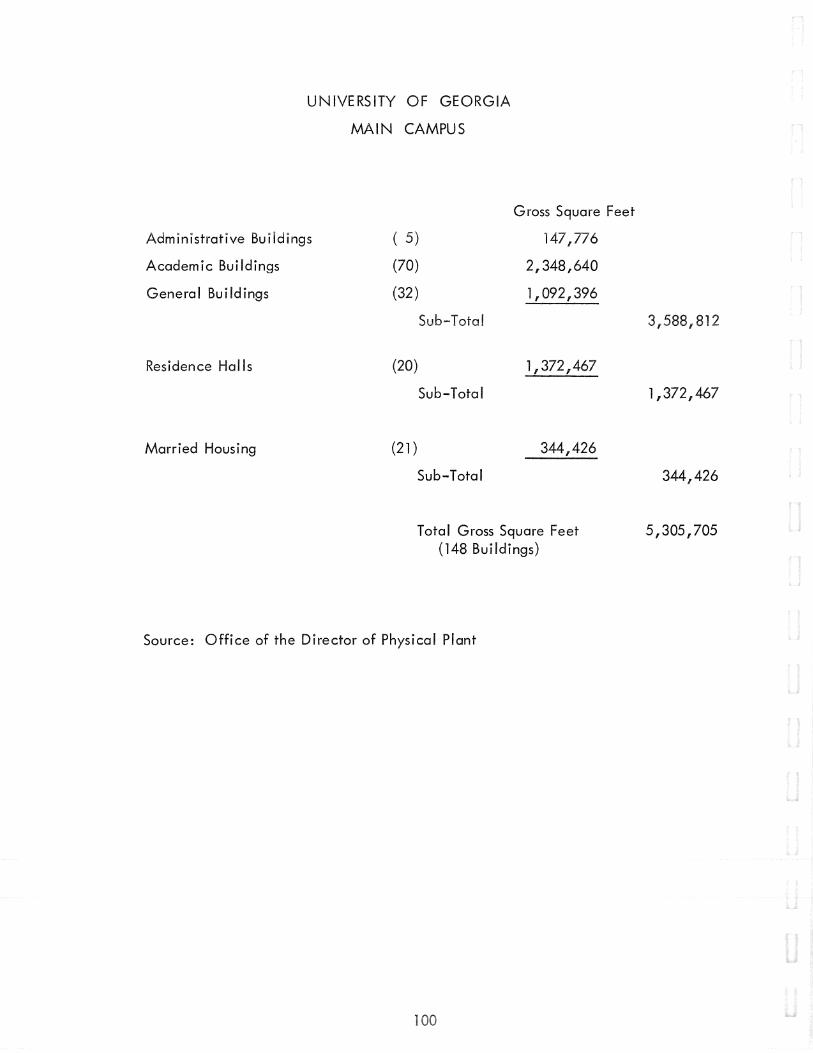
UNIVERSITY OF GEORGIA
MAIN CAMPUS
Administrative Buildings
Academic Buildings
General Buildings
Residence Halls
Married Housing
( 5)
(70)
(32)
Sub-Total
(20)
Sub-Total
(21)
Sub-Total
Gross Square Feet
147,776
2,348,640
1,092,396
1,372,467
344,426
T ota I Gross Square Feet (148 Buildings)
Source: Office of the Director of Physical Plant
3,588,812
1,372,467
344,426
5,305,705

MAJOR ACADEMIC BUILDINGS AND DATE OF INITIAL OCCUPANCY
(Athens Campus)
Building Name Initial Building Name Initial Occupancy Occupancy
Academic 1831 Golf Pro Shop 1969 Agricultural Eng. 1966 Graduate Studies Research Agricultural Ext. 1937 Center 1968 Alumni House 1969 Griggs Hall 1942 Army ROTC 1931 Hardman Hall 1918 Baldwin Hall 1938 High Temperature Lab 1962 Barrow Hall 1911 Hoke Smith Annex 1940 Barrow Hall Shop 1936 5-Home Management Houses 1940 Biological Sciences 1960 Infirmary 1942 Bishop House 1837 Journalism 1969 Bolton Hall 1963 Journalism Auditorium 1969 Business Adm. 1924 Laundry 1963 Business Services 1968 Law School 1932 Business Services Annex 1969 Law School Addition 1967 Candler Hall 1901 LeConte Hall 1938 Central Research Stores 1969 Library, Main Chapel 1831 (Dunlap Little) 1952 Chemistry 1960 Library, Science 1968 Child Development Lab 1970 Livestock -Pou I try 1960 Coliseum 1964 Lucy Cobb 1858 Conner Hall 1908 Lucy Cobb Seney-Stovall Dairy Science 1939 Chapel 1885 Dawson Hall 1932 Lucy Cobb Carriage Demosthenian Hall 1824 House 1808 Dudley Hall 1942 Lucy Cobb Gym 1905 Environmental Design 1901 Lumpkin House 1850 Fain Hall 1942 Lustrat House 1847 Fine Arts 1941 Mail Room 1951 Food Science 1959 Margaret Hall 1898 Forest Resources # 1 1938 Meigs Hall 1905 Forest Resources #2 1968 Memorial Hall 1923
Resources #3 1968 Moore lege 1 Garden Club of Georgia 1850 New College 1823 Geography, Geology 1960 Old College 1801 Georgia Center for Park I 1938
Continuing Education 1956 Park Hall Addition 1970 Georgia Museum of 1907 Peabody Hall 1913
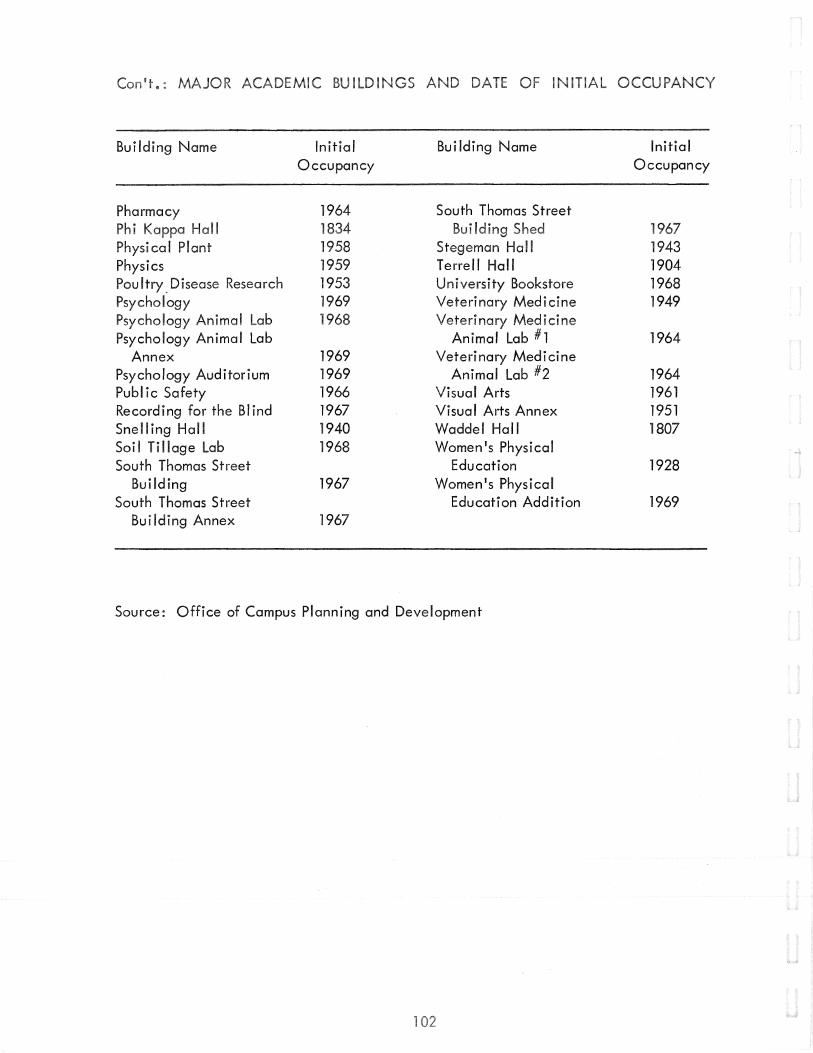
It • : R MIC ILDINGS N L OCCU
Building Name Initial Building Name Initial Occupancy Occupancy
Pharmacy 1964 South Thomas Street I 1834 ilding 1
Physical Plant 1958 Stegeman Hall 1943 Physics 1959 Terrell Hall 1904 Poultry_Disease Research 1953 University Bookstore 1968 Psychology 1969 Veterinary Medicine 1949 Psychology Animal Lab 1968 Veterinary Medicine Psychology Animal lab Animal Lab # 1 1964
Annex 1969 Veterinary Medicine Psychology Auditorium 1969 Animal Lab #2 1964 Public Safety 1966 Visual Arts 1961 Recording for the Blind 1967 Visual Arts Annex 1951 Snelling Hall 1940 Waddel Hall 1807 Soi I Ti !loge Lab 1968 Women 1s Physical South Thomas Street Education 1928
Building 1967 Women's Physical South Thomas Street Education Addition 1969
Building Annex 1967
Source: Office of Campus Planning and Development

MAJOR BUILDING PROJECTS
COMPLETED PROJECTS -- 1960-1970
University Completion Federal & State Total
Project Date Funds Funds Other Projected Cost
Physics 1959** 000 1,670,000 1,700,000
Food Science 1959** 1/310,000 1,310,000
Biological Sciences 1960 600,000 3,000,000 3,600,000 Chemistry 1960 000 2,490,000 2,523,000
Geography - Geology 1960 1, 000 11550,000
Livestock Poultry 1960 1,230,000 1 1230 I 000
Visual Arts 1961 919,000 919,000
Six Dormitories 1961 3,180,000 3,180,000
High Temperature Lab 1962 32,000 32,000
Georgia Seed Lab (State) 1963 253,000 253,000
Stadium Bridge 1963 225,000 225,000
Creswell Hall & Bolton Hall 1963 3,620,000 3,620,000
Laundry & Dry Cleaning Bldg. 1963 100,000 100,000
Horticulture Bldg. (Tifton) 1963 360,000 360,000
Pharmacy Building 1964 100,000 1,680,000 1,780,000
Coliseum 1964 4,090,000 4,090,000
Forestry Research Lab (Federal) 1964 611,000 611 ,000
Poultry Disease Lab (Federal) 1964 900,000 900,000
ng 1964 1,025,000 1,025,000
Animal Lab (Vet. Med.) 1964 40,000 40,000
Education 1
Agricul ng 1966 000 11 000 1 '975,000
l, 000 Student (Brumby I) 300,000 3,300,000
000

Con•t.: MAJOR BUILDING PROJECTS COMPLETED PROJECTS -- 1960-1970
Project
Food Science Lab (Griffin)
Animal Disease Lab (Tifton)
Expansion of Campus Electrical System
164 Student Dorm. & Dining (McWhorter Hall)
1000 Student Dorm. ( Russe II Ha II)
Completion Federal Date Funds
1966
1966
1966
1967
1967
University & State Funds
750,000
460,000
225,000
978,000
Recording for the Blind, Inc. 1967
3,600,000
(Callaway Foundation)
Agricultural Engineering & Lab. Building (Tifton)
Alpha Chi Omega Sorority
Delta Phi Epsilon Sorority
Addition to Law School
Expansion Central Heating & Distribution System (0-47)
Sanford Stadium Expansion
Graduate Studies Research Center and Science Library
Business Services
Forestry Addition
If Pro Shop
Addition to Main Lab. --1
Soil llage Lab
* ccupancy Date
1967
1967
1967
1967
1967
1967
1968
1968*
1968
1968
1968
115,000
184,000
293,000
2,998,000
420,000
(Athletic Association)
2,074,000 3,559,000
81,000
640,000 1,276,000
500
63,000
Other
100,000
Total Project Cost
750,000
460,000
225,000
978,000
3,600,000
100,000
115,000
184,000
293,000
2,998,000
420,000
3,295,000 3,295,000
5,6331000
81,000
1,916,000
42,500
63,000
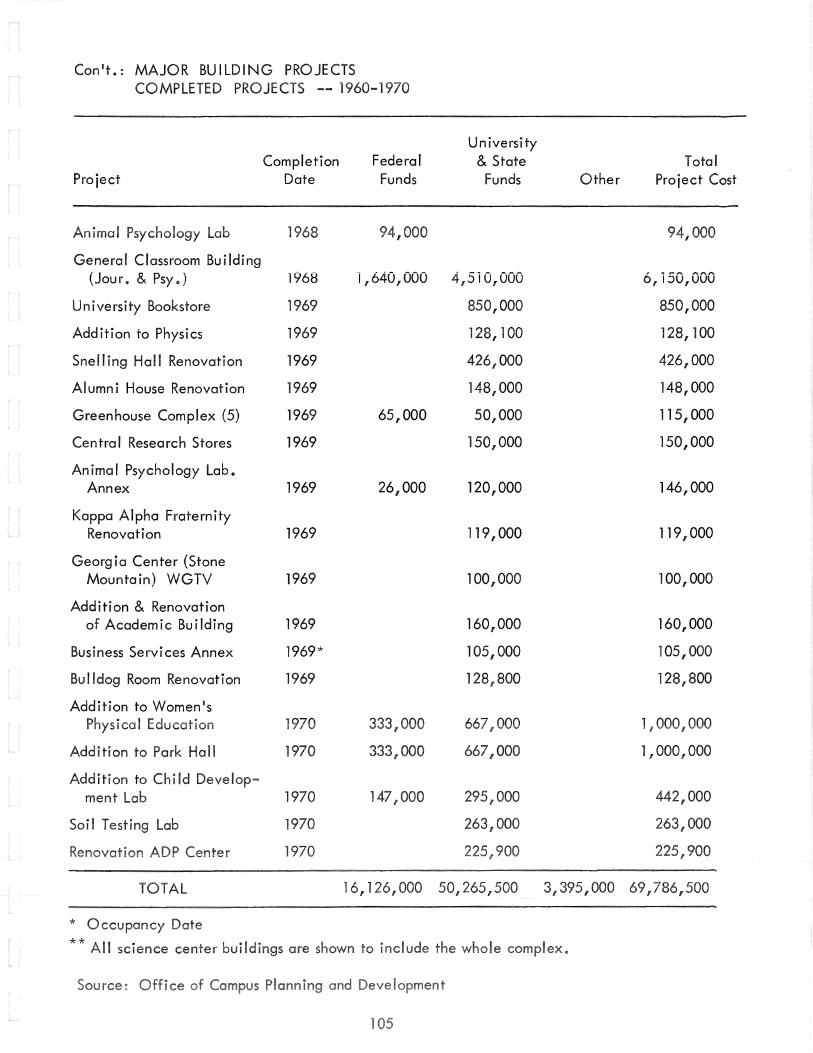
Con't.: MAJOR BUILDING PROJECTS COMPLETED PROJECTS -- 1960-1970
Completion Federal Project Date Funds
Animal Psychology 1968 000
General Classroom Building (Jour. & Psy.) 1968 1,640,000
University Bookstore 1969
Addition to Physics 1969
Snelling Hall Renovation 1969
Alumni House Renovation 1969
Greenhouse Complex (5) 1969 65,000
Central Research Stores 1969
Animal Psychology Lab. Annex 1969 26,000
Kappa Alpha Fraternity Renovation 1969
Georgia Center (Stone Mountain) WGTV 1969
Addition & Renovation of Academic Building 1969
Business Services Annex 1969*
Bulldog Room Renovation 1969
Addition to Women•s cal 1970 333,
Addition to Park Hall 1970 333,000
Addition to Child Develop-ment Lab 147,
Soil Testing Lab 1970
16,126,000
*
** I science center to i are
University & State Total
Funds Other Project Cost
000
4,5i0,000 6,150,000
850,000 850,000
128,100 128,100
426,000 426,000
148,000 148,000
50,000 115,000
150,000 150,000
120,000 146,000
119,000 119,000
100,000 100,000
160,000 160,000
105,000 105,000
128,800 128,800
667, 1,000,000
667,000 1,000,000
,000 442,000
000 263,000
,900
50,265,500 3,395,000 786,500
e ex.

u &
l ,
*
155,
f
l f
155,
100,000
500
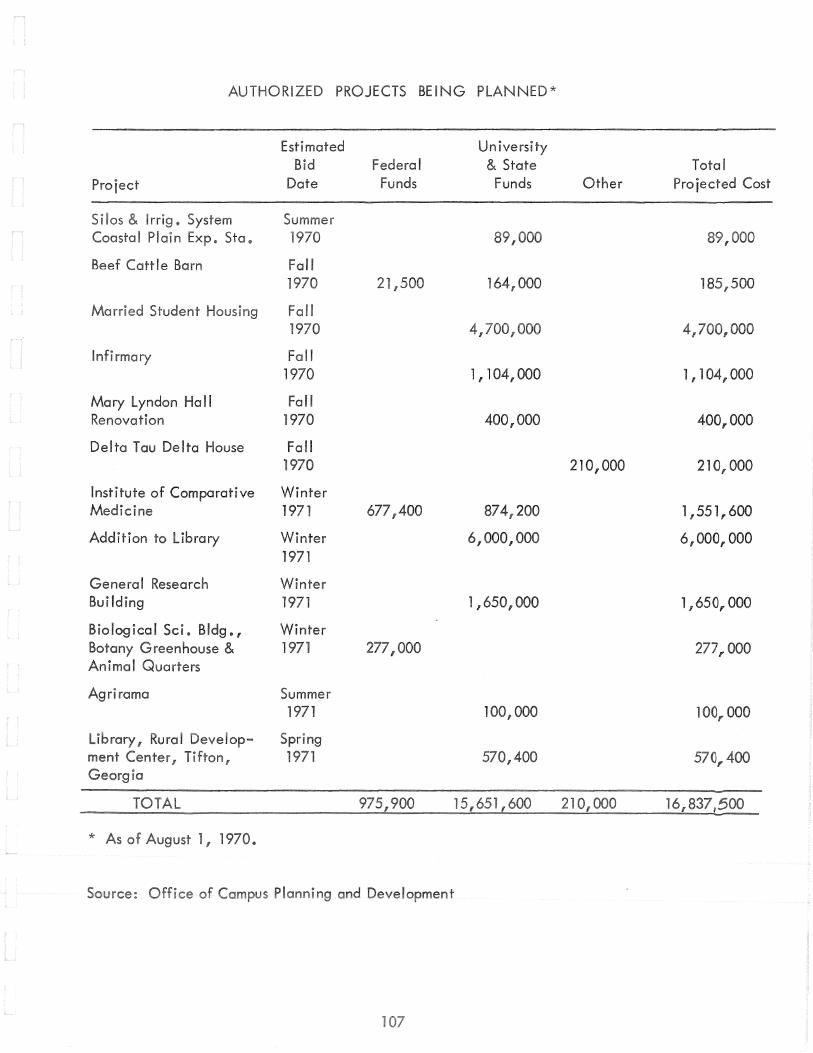
Federal
II
Hall
ta Tau Ita House II
Institute of Comparative Winter 1 1 400
General Research
Biological Sci. Bldg. 1
&
ram a
*
t
1,1 000
400,000
21 000
200
6,000,
1 , 000
Total jected Cost
f l 000
400,.000
210,000
1,551, 600
6,000,000
1 ,650, 000
000
000

LAND HOLDINGS
THE UNIVERSITY OF GEORGIA CAMPUS
Ma Campus and Related Areas
COLLEGE EXPERIMENT STATIONS
Main Areas Durham Farm Hardman Forest Sams Forest Watkins Springs Forest Wilkins Farm Georgia Mountain Station Northwest Branch Station Piedmont Field Station Southeast Branch Station Southwest Branch Station Plant Science Farm
GEORGIA STATION
Georgia Station
COASTAL PLAIN STATION
Coastal Plain Station Range Grazing Station Shade Tobacco Station
AGRICULTURAL ION SERVICES
lin 4-H Center Rock Eagle 4-H Center
Total
Source: Office of the Director of Physical Plant
ACRES
1,435
2,188 90
456 570 597 947 396
1,255 14,241
469 447 343
1 ,251
2,406 2,804
414
170 1,461
31 f 940

Women•s Residence Halls
Boggs Brumby Church
Creswell Hill Lipscomb Mary Lyndon Mel I Myers Rutherford Soule
Sub-Total 11 Buildings
Men•s Residence Halls
Clark Howell Joe Brown McWhorter Milledge Morris Payne Reed Russell Tucker
Sub-Total 9 Buildings
RESIDENCE HALLS
Date of Initial Occupancy
l 1 1966 1961 1963 1961 1961 1937 1961 1953 1939 1920
Date of Initial Occupancy
1937 1932 1967 1921 1957 1939 1953 1967 1961
20 Residence lis
Source: Office Campus and
Capacity
l 996 164 992 168 164 132 164 481 156 119
3,700
Capacity
200 137 167 154 152 234 486
1,000 176
2,706
6,406

FRATERNITY AND SORORITY BUILDINGS
University Owned Fraternity Houses
Alpha Epsilon Pi
Chi Phi Chi Psi Kappa Alpha Kappa Sigma Phi Delta Phi Epsi I on Pi Pi Kappa Alpha Sigma Chi Sigma Nu Tau Epsilon Phi
Sub-Total 12 Buildings
Not University Owned
Acacia Alpha Gamma Rho Delta Chi Delta Tau Delta Farm House Lambda Chi Alpha Phi Gamma De Phi Kappa Tau Phi Kappa Theta
i Kappa Phi Sigma pha E lon Sigma Phi Epsi
Theta Chi
14
Capacity
34
28 29 42 46 35 25 66 40 35 32
466
Capacity
32 46 16 21 24 52 25 31
30 38
42
8 10 14 6
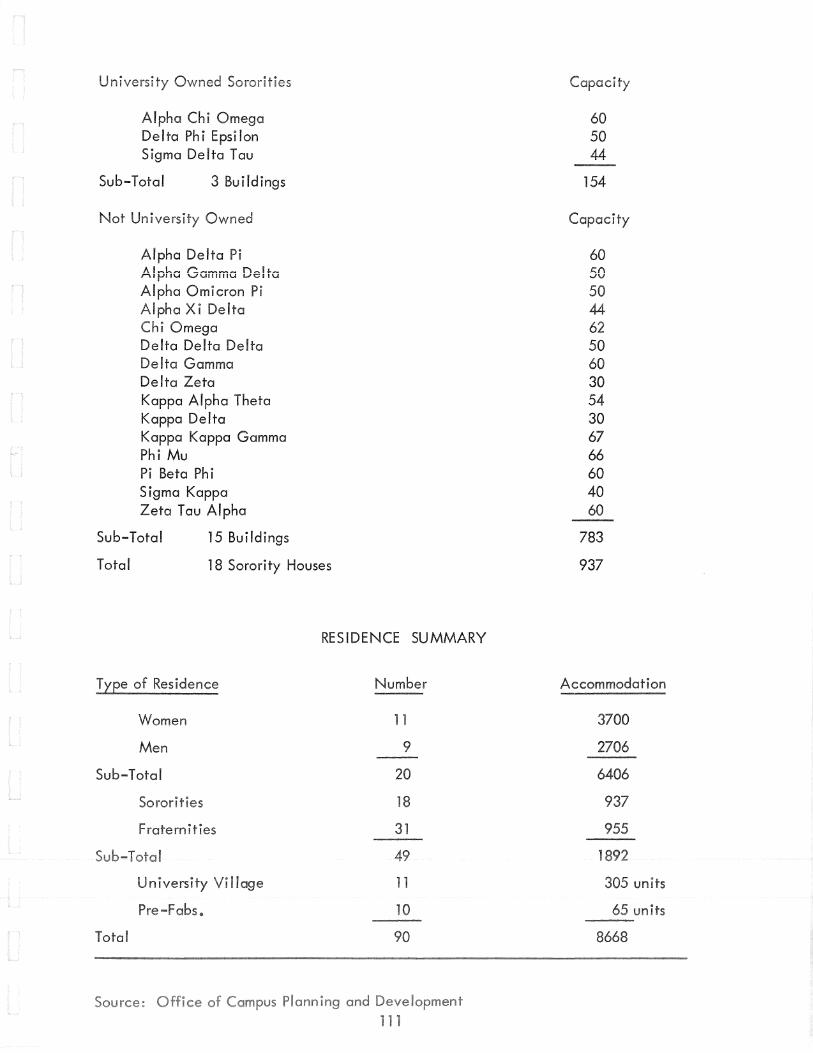
Un
Alpha Chi Omega Delta Phi Epsilon Sigma Delta Tau
Sub-Total 3 Buildings
Not
Alpha Delta A l~l-~ ~~--- r.~l'--r-\ltJIIY '-"'VlHIIiiU VYIIU
Alpha Omicron Alpha Xi Delta
i Omega Delta Delta Delta Delta Gamma Delta Zeta Kappa Alpha Theta Kappa Delta Kappa Kappa Gamma Phi Mu Pi Beta Phi Sigma Kappa Zeta Tau Alpha
Sub-Total 15 Buildings
Total 18 Sorority Houses
Men
Sub-Total
u
RESIDENCE SUMMARY
Number
1 1
9
20
18
31
11
lO
60 50 44
154
60 t:;(\ ..JV
44 62 50 60 30 54 30 67 66 60 40 60
783
937
2706
6406
955
un
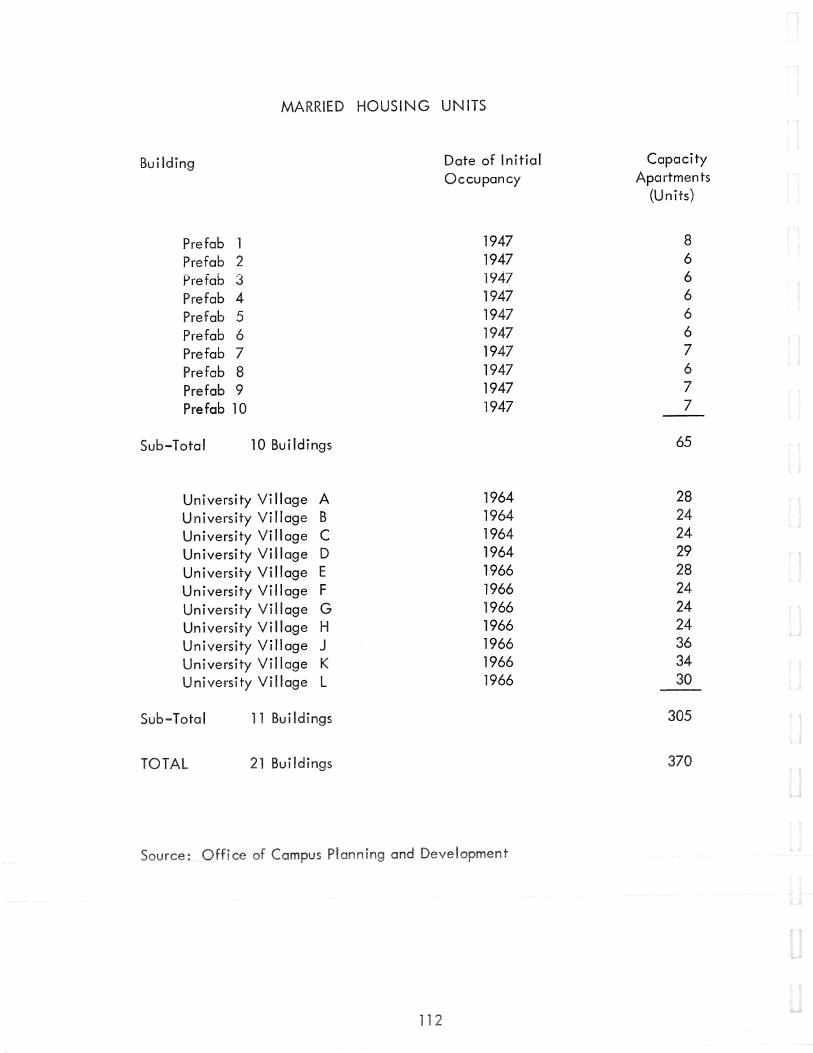
MARRIED HOUSING UNITS
Bui I ding Date of Initial Capacity Occupancy Apartments
(Units)
Prefab 1 1947 8
Prefab 2 1947 6
Prefab 3 1947 6
Prefab 4 1947 6
Prefab 5 1947 6
Prefab 6 1947 6
Prefab 7 1947 7
Prefab 8 1947 6
Prefab 9 1947 7
Prefab 10 1947 7
Sub-Total 10 Bui !dings 65
University Village A 1964 28
University Village B 1964 24
University Village c 1964 24
University Village D 1964 29
University Village E 1966 28
University Village F 1966 24
University Village G 1966 24
University Village H 1966 24
University Village J 1966 36
University Village K 1966 34
University Village L 1966 30
Sub-Total 11 Buildings 305
TOTAL 21 Buildings 370
ce P! t
2

CAMPUS BUS SYSTEM
Number of buses owned by the University of Georgia*
War Surplus buses
1967 Bluebird gas engine-35 Passenger
1968 GM diesel engine-35 Passenger
1969 GM diesei engine-35 Passenger
TOTAL
Four campus routes
Russell Hall Route
North South Route
Married Housing Route
Milledge Route
Night Route (6 p.m. to 9 p.m.)
Regular session of school
(Fall-Winter-Spring) -Ten ( 1 0) buses are used on 4 routes
(Summer) -First session of summer school Second session of summer school
System Utilization
*
Fiscal Year 169- 170
Fiscal Year '69-?0
Fiscal Year 169-'70
Twenty (20 bus drivers
and One (1) foreman
Is are r
11
2
5
2
20
1.5miles
3.0 miles
3.7 miles
4.1 miles
2.0 miles
Source: Office of the Director of Physical Plant
10 buses
6 buses 4 buses
911,656 riders
196,976 miles traveled
4, 034 hours (Campus charter service)

MAINTENANCE AND OPERATING PERSONNEL
FOR UNIVERSITY FACILITIES
Physical Plant
Housing
Other
Total
Source: Office of the Director of Physical Plant
649
148
32
829


![THE PATENTS ACT, 1970 - National Biodiversity Authoritynbaindia.org/uploaded/Biodiversityindia/Legal/14. The Patents Act, 1970.pdf · THE PATENTS ACT, 1970 [39 of 1970, dt. 19-9-1970]](https://static.fdocuments.in/doc/165x107/5e4d13e80eb10b1fef07cead/the-patents-act-1970-national-biodiversity-the-patents-act-1970pdf-the.jpg)