Facolt a di Ingegneria XXVII Ciclo ORCHESTRATION OF ... · 7.3 Number of virtual routers allocated...
148
Facolt`adiIngegneria Dottorato di Ricerca in Ingegneria Informatica ed Automatica XXVII Ciclo Dipartimento di Ingegneria Elettrica e Tecnologie dell’Informazione ORCHESTRATION OF LOGICAL RESOURCES IN SOFTWARE DEFINED INFRASTRUCTURES ELISA MAINI Ph.D. Thesis Advisors: Coordinator: Prof. Nicola Mazzocca Prof. Francesco Garofalo Eng. Antonio Manzalini Co-Advisor: Prof. Mario Di Bernardo March 2015
Transcript of Facolt a di Ingegneria XXVII Ciclo ORCHESTRATION OF ... · 7.3 Number of virtual routers allocated...
Facolta di Ingegneria
Dottorato di Ricerca in Ingegneria Informatica ed AutomaticaXXVII Ciclo
Dipartimento di Ingegneria Elettrica e Tecnologie dell’Informazione
ORCHESTRATION OF LOGICAL RESOURCESIN SOFTWARE DEFINED INFRASTRUCTURES
ELISA MAINI
Ph.D. Thesis
Advisors: Coordinator:Prof. Nicola Mazzocca Prof. Francesco GarofaloEng. Antonio Manzalini
Co-Advisor:Prof. Mario Di Bernardo
March 2015

ORCHESTRATION OF LOGICAL RESOURCES
IN SOFTWARE DEFINED INFRASTRUCTURES
by
Elisa Maini
A THESIS
SUBMITTED TO THE UNIVERSITY OF NAPLES FEDERICO II
IN PARTIAL FULFILMENT OF THE REQUIREMENTS
FOR THE DEGREE OF DOCTOR OF PHILOSOPHY
March 2015

UNIVERSITY OF NAPLES FEDERICO IIDepartment of Electrical Engineering and Information Technology
ABSTRACT
ORCHESTRATION OF LOGICAL RESOURCESIN SOFTWARE DEFINED INFRASTRUCTURES
byElisa MAINI, Doctor of Philosophy, 2015
The diffusion of ultra-broadband (in terms of high bandwidth and low latency)
connection, IT hardware advances, and growing availability of open-source software are
causing a paradigm shift in the world of network architectures. In the last years, the
number of devices and smart-objects connected to the network has grown exponentially
and the so-called “machine intelligence” has become part of the life-cycle of industries,
agriculture, smart cities, and eventually public institutions. In this context, the initiative
to integrate heterogeneous networks, including wired/wireless networks and smart-objects,
from both the service management and control viewpoints is considered a critical aspect
of Future Networks. The effect of all these drivers is the so-called “Softwarization” of telco
infrastructures, where the approach to this integration is through the deployment of a net-
work infrastructure supporting software-driven network features that can be instantiated
on-demand. These instantiations will be addressing the changing service requirements and
resource constraints, yet be scalable across multiple services and multiple domains, can
maintain QoS for end-users of a service, and that provide a level of isolation and security
from one service to another.

Research and development activities are currently clearly focused on several con-
cepts such as programmable networks, network virtualisation, open interfaces and plat-
forms, and increasing the degree of intelligence inside the network. The next generation
of Software Defined Infrastructures needs to move from being merely Defined by software
to be Driven by software and must be capable of supporting a multitude of players that
exploit an environment in which services are dynamically deployed and quickly adapt over
a heterogeneous physical infrastructure, according to chaining requirements. One of the
main challenges includes the design and the implementation of specific mechanisms for run-
time orchestration of logical resources in wired environments. In addition to mechanisms
for controlling virtual resources in Software Defined Infrastructures, another challenge in-
cludes the design and implementation of specific algorithms for the efficient mapping of
virtual resources onto physical resources.
This thesis shows how network architectures based on open network features and
resources abstraction offers innovative solutions addressing some of the challenges of Fu-
ture Networks.
Keywords: management, orchestration, network virtualisation, software de-
fined networking, network function virtualisation, placement algorithms, per-
formance evaluation.

PREFACE
Some of the research described in this thesis has undergone peer review and has
been published in, or at the date of this printing is being considered for publication in,
academic journals, books, and conferences. This notice serves to indicate that certain
parts of the material presented here have already been described by the author in the
literature, and some parts are therefore subject to copyright by either publishers or the
author outside this volume. Co-authors are in all instances the student’s thesis advisors.
[1] Management and Orchestration of Virtualized Network Functions. E.
Maini and A. Manzalini. In: Monitoring and Securing Virtualized Networks and
Services, pp. 52–56, Springer Berlin Heidelberg, 2014.
[2] Manifesto of Edge ICT Fabric. A. Manzalini, R. Minerva, E. Kaempfer, F. Cal-
legari, A. Campi, W. Cerroni, N. Crespi, E. Dekel, Y. Tock, W. Tavernier, K. Casier,
S. Verbrugge, D. Colle, R. Vilalta, R. Munoz, R. Casellas, R. Martınez, N. Mazzocca,
E. Maini. In: Proceedings of 17th International Conference on Intelligence in Next
Generation (ICIN 2013), pp. 9–15. Venice, Italy, 2013. Best paper.
[3] The Dynamic Placement of Virtual Network Functions. S. Clayman, E.
Maini, A. Galis, A. Manzalini, N. Mazzocca. In: Proceedings of IEEE/IFIP Network
Operations and Management Symposium (NOMS 2014), pp. 1–9. Krakow, Poland,
2014.
[4] Traffic dynamics and vulnerability in hypercube networks. M. Di Bernardo,
E. Maini, A. Manzalini, N. Mazzocca. In: Proceedings of IEEE Symposium on
Circuits and Systems (ISCAS 2014), pp. 2221–2224. Melbourne, Australia, 2014.
ii
[5] A Compositional Modelling Approach for Live Migration in Software De-
fined Networks. E. Maini and N. Mazzocca. In: Proceedings of 5th International
Conference on Network of the Future (NOF 2014). Paris, France, 2014.
iii

Table of Contents
List of Figures vii
List of Abbreviations ix
1 Introduction 11.1 Context and motivation . . . . . . . . . . . . . . . . . . . . . . . . . . . . . 11.2 Problem statement . . . . . . . . . . . . . . . . . . . . . . . . . . . . . . . . 31.3 Contributions . . . . . . . . . . . . . . . . . . . . . . . . . . . . . . . . . . . 41.4 Thesis outline . . . . . . . . . . . . . . . . . . . . . . . . . . . . . . . . . . . 7
2 SDN, NV and NFV: terms and definitions 82.1 Software Defined Networking . . . . . . . . . . . . . . . . . . . . . . . . . . 9
2.1.1 SDN precursors: road to SDN . . . . . . . . . . . . . . . . . . . . . . 92.1.2 SDN architecture . . . . . . . . . . . . . . . . . . . . . . . . . . . . . 112.1.3 SDN control models . . . . . . . . . . . . . . . . . . . . . . . . . . . 142.1.4 SDN and OpenFlow . . . . . . . . . . . . . . . . . . . . . . . . . . . 16
2.1.4.1 OpenFlow roadmap . . . . . . . . . . . . . . . . . . . . . . 172.1.4.2 OpenFlow pros and cons . . . . . . . . . . . . . . . . . . . 18
2.2 Network Virtualisation . . . . . . . . . . . . . . . . . . . . . . . . . . . . . . 192.2.1 SDN and Network Virtualisation . . . . . . . . . . . . . . . . . . . . 21
2.3 Network Function Virtualisation . . . . . . . . . . . . . . . . . . . . . . . . 222.3.1 Functions under NFV and the use cases . . . . . . . . . . . . . . . . 242.3.2 NFV: realization requirements . . . . . . . . . . . . . . . . . . . . . 26
2.3.2.1 Requirements from the VM perspective . . . . . . . . . . . 272.3.3 SDN and Network Function Virtualisation . . . . . . . . . . . . . . . 28
2.4 Current trends and research directions . . . . . . . . . . . . . . . . . . . . . 30
3 SDN, NV and NFV in evolutionary network scenarios 323.0.1 Examples of core scenarios . . . . . . . . . . . . . . . . . . . . . . . 333.0.2 Examples of edge scenarios . . . . . . . . . . . . . . . . . . . . . . . 35
3.1 Edge ICT Fabric . . . . . . . . . . . . . . . . . . . . . . . . . . . . . . . . . 363.1.1 Network states . . . . . . . . . . . . . . . . . . . . . . . . . . . . . . 363.1.2 Scalable standard hardware nodes . . . . . . . . . . . . . . . . . . . 373.1.3 Global controller . . . . . . . . . . . . . . . . . . . . . . . . . . . . . 393.1.4 Service provisioning . . . . . . . . . . . . . . . . . . . . . . . . . . . 41
iv

3.2 Use cases in Edge Networks . . . . . . . . . . . . . . . . . . . . . . . . . . . 423.2.1 Provisioning of services across Edge Networks . . . . . . . . . . . . . 433.2.2 “Harnessing” storage and computing idle resources at the edge . . . 433.2.3 Follow-me personal data and services . . . . . . . . . . . . . . . . . . 44
3.3 Socio-economic issues and business models . . . . . . . . . . . . . . . . . . . 44
4 Reference model for virtual networks 464.1 Model definition . . . . . . . . . . . . . . . . . . . . . . . . . . . . . . . . . 47
4.1.1 Long Range Dependence . . . . . . . . . . . . . . . . . . . . . . . . . 494.1.1.1 Packet production model . . . . . . . . . . . . . . . . . . . 51
4.2 Topology models . . . . . . . . . . . . . . . . . . . . . . . . . . . . . . . . . 524.2.1 Regular symmetric networks . . . . . . . . . . . . . . . . . . . . . . 53
4.2.1.1 Toroidal networks . . . . . . . . . . . . . . . . . . . . . . . 534.2.1.2 Hypercube networks . . . . . . . . . . . . . . . . . . . . . . 54
4.2.2 Random network . . . . . . . . . . . . . . . . . . . . . . . . . . . . . 554.2.3 Scale-free networks . . . . . . . . . . . . . . . . . . . . . . . . . . . . 56
4.3 Virtual network model . . . . . . . . . . . . . . . . . . . . . . . . . . . . . . 564.4 Topology impact on network functionality . . . . . . . . . . . . . . . . . . . 58
5 Orchestration of logical resources in SDIs 625.1 Mechanism for controlling virtual resources . . . . . . . . . . . . . . . . . . 63
5.1.1 Resource Orchestrator . . . . . . . . . . . . . . . . . . . . . . . . . . 645.1.2 Resource deployment . . . . . . . . . . . . . . . . . . . . . . . . . . . 655.1.3 Live migration . . . . . . . . . . . . . . . . . . . . . . . . . . . . . . 665.1.4 Performance evaluation by using Stochastic Activity Networks . . . 68
5.1.4.1 Model description . . . . . . . . . . . . . . . . . . . . . . . 695.1.4.2 Simulation results . . . . . . . . . . . . . . . . . . . . . . . 73
5.2 Mechanisms for mapping virtual resources onto physical resources . . . . . . 755.2.1 Network Function Chaining model . . . . . . . . . . . . . . . . . . . 765.2.2 Optimization problems formulation . . . . . . . . . . . . . . . . . . . 795.2.3 Performance evaluation . . . . . . . . . . . . . . . . . . . . . . . . . 86
5.2.3.1 Simulation results . . . . . . . . . . . . . . . . . . . . . . . 87
6 Reference architecture for the dynamic placement of logical resources 926.1 Architecture description . . . . . . . . . . . . . . . . . . . . . . . . . . . . . 92
6.1.1 Application layer . . . . . . . . . . . . . . . . . . . . . . . . . . . . . 956.1.2 Orchestration layer . . . . . . . . . . . . . . . . . . . . . . . . . . . . 956.1.3 Abstraction layer . . . . . . . . . . . . . . . . . . . . . . . . . . . . . 976.1.4 Infrastructure layer . . . . . . . . . . . . . . . . . . . . . . . . . . . . 97
7 Experimental results 997.1 Very Lightweight Service Platform testbed . . . . . . . . . . . . . . . . . . . 99
7.1.1 Motivation . . . . . . . . . . . . . . . . . . . . . . . . . . . . . . . . 1007.1.2 Benefits . . . . . . . . . . . . . . . . . . . . . . . . . . . . . . . . . . 1027.1.3 The platform . . . . . . . . . . . . . . . . . . . . . . . . . . . . . . . 103
7.2 Testbed . . . . . . . . . . . . . . . . . . . . . . . . . . . . . . . . . . . . . . 1047.2.1 Router Networking . . . . . . . . . . . . . . . . . . . . . . . . . . . . 1067.2.2 Routing and packet transmission . . . . . . . . . . . . . . . . . . . . 106
v

7.2.3 Start-up and shut-down . . . . . . . . . . . . . . . . . . . . . . . . . 1077.2.4 Monitoring . . . . . . . . . . . . . . . . . . . . . . . . . . . . . . . . 108
7.3 Placement Engine . . . . . . . . . . . . . . . . . . . . . . . . . . . . . . . . 1097.3.1 Least Used Host . . . . . . . . . . . . . . . . . . . . . . . . . . . . . 1117.3.2 N at a time in a Host . . . . . . . . . . . . . . . . . . . . . . . . . . 1127.3.3 Least Busy Host . . . . . . . . . . . . . . . . . . . . . . . . . . . . . 115
7.4 Results . . . . . . . . . . . . . . . . . . . . . . . . . . . . . . . . . . . . . . . 116
8 Conclusions 118
Bibliography 121
vi

List of Figures
2.1 SDN precursors . . . . . . . . . . . . . . . . . . . . . . . . . . . . . . . . . . 102.2 SDN architecture . . . . . . . . . . . . . . . . . . . . . . . . . . . . . . . . . 12
3.1 Evolutionary network scenario . . . . . . . . . . . . . . . . . . . . . . . . . . 343.2 Example of scenario where the “edge” is becoming a “fabric” of resources
to execute network functions and store data . . . . . . . . . . . . . . . . . . 353.3 Evolutionary network scenario: Edge Networks . . . . . . . . . . . . . . . . 43
4.1 A sample model of virtual network . . . . . . . . . . . . . . . . . . . . . . . 474.2 The batch averages of packets/unit time for (a) a real LRD traffic trace
and (b) a Poisson-based trace for the same load, for sizes N = 100. . . . . . 504.3 4-D hypercube mapped into a 2-D mesh using Gray Code . . . . . . . . . . 554.4 Average lifetime and throughput versus the generation rate λ. A LRD traf-
fic source is used to generate panels (a) and (c) while a Poisson traffic sourcefor panels (b) and (c). The number of nodes is N = 256 and host densityρ = 1. Network considered are: square lattice with periodic boundary L×Lwith L = 16; Erdos-Renyi (ER) random networks with p = 0.1; scale-freenetwork with γ = 3; hypercube network with N = 216 = 256 nodes. . . . . . 59
4.5 Effects on throughput of intentional (a) and random (b) attacks node fordifferent types of networks . . . . . . . . . . . . . . . . . . . . . . . . . . . . 60
5.1 Live migration algorithm model . . . . . . . . . . . . . . . . . . . . . . . . . 695.2 Trigger signal and Virtual Machine model . . . . . . . . . . . . . . . . . . . 715.3 Live migration orchestrator and controller model . . . . . . . . . . . . . . . 725.4 Open Switch model . . . . . . . . . . . . . . . . . . . . . . . . . . . . . . . . 735.5 Migration time and downtime versus page dirty rate . . . . . . . . . . . . . 745.6 Migration time and downtime versus link speed . . . . . . . . . . . . . . . . 745.7 Network Function Chaining . . . . . . . . . . . . . . . . . . . . . . . . . . . 765.8 Network Function Chaining model . . . . . . . . . . . . . . . . . . . . . . . 775.9 Comparison of the mean response time (panel 5.9(a)) and of the allocation
resources (panels 5.9(b)) . . . . . . . . . . . . . . . . . . . . . . . . . . . . . 875.10 Comparison of the resource cost (panel 5.10(a)) and of the allocation re-
sources (panel 5.10(b)) . . . . . . . . . . . . . . . . . . . . . . . . . . . . . . 895.11 Influence of upper bounds on both the resource cost (panel 5.11(a)) and
response time (panel 5.11(b)) . . . . . . . . . . . . . . . . . . . . . . . . . . 91
vii

6.1 Overall system architecture and components . . . . . . . . . . . . . . . . . . 93
7.1 Mapping and allocation of elements to hosts . . . . . . . . . . . . . . . . . . 1057.2 Control path to virtual routers and virtual links . . . . . . . . . . . . . . . . 1057.3 Number of virtual routers allocated on each host (shown on the y-axis) . . . 116
viii
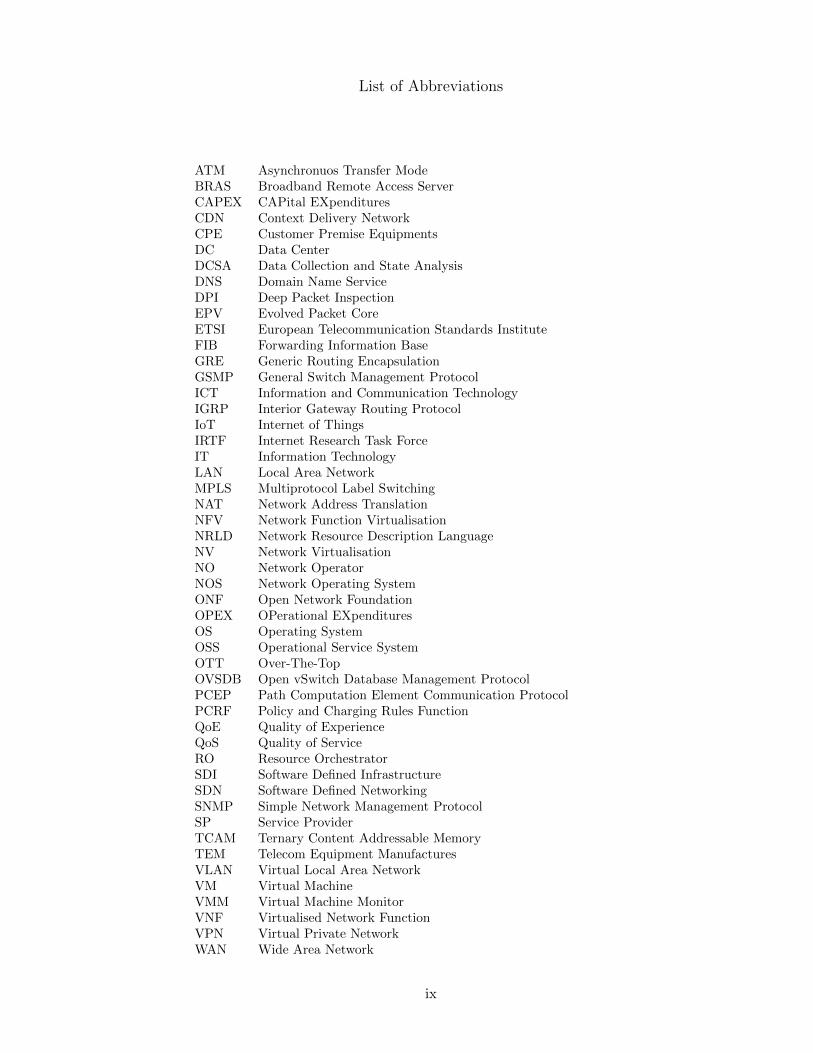
List of Abbreviations
ATM Asynchronuos Transfer ModeBRAS Broadband Remote Access ServerCAPEX CAPital EXpendituresCDN Context Delivery NetworkCPE Customer Premise EquipmentsDC Data CenterDCSA Data Collection and State AnalysisDNS Domain Name ServiceDPI Deep Packet InspectionEPV Evolved Packet CoreETSI European Telecommunication Standards InstituteFIB Forwarding Information BaseGRE Generic Routing EncapsulationGSMP General Switch Management ProtocolICT Information and Communication TechnologyIGRP Interior Gateway Routing ProtocolIoT Internet of ThingsIRTF Internet Research Task ForceIT Information TechnologyLAN Local Area NetworkMPLS Multiprotocol Label SwitchingNAT Network Address TranslationNFV Network Function VirtualisationNRLD Network Resource Description LanguageNV Network VirtualisationNO Network OperatorNOS Network Operating SystemONF Open Network FoundationOPEX OPerational EXpendituresOS Operating SystemOSS Operational Service SystemOTT Over-The-TopOVSDB Open vSwitch Database Management ProtocolPCEP Path Computation Element Communication ProtocolPCRF Policy and Charging Rules FunctionQoE Quality of ExperienceQoS Quality of ServiceRO Resource OrchestratorSDI Software Defined InfrastructureSDN Software Defined NetworkingSNMP Simple Network Management ProtocolSP Service ProviderTCAM Ternary Content Addressable MemoryTEM Telecom Equipment ManufacturesVLAN Virtual Local Area NetworkVM Virtual MachineVMM Virtual Machine MonitorVNF Virtualised Network FunctionVPN Virtual Private NetworkWAN Wide Area Network
ix

“If we know what it was we were doing, it wouldn’ t be called research”.
Albert Einstein
To my husband, Andrea.
x

Chapter 1
Introduction
1.1 Context and motivation
The diffusion of ultra-broadband (in terms of high bandwidth and low latency)
connection, IT hardware advances, and growing availability of open-source software are
causing a paradigm shift in the world of network architectures [1]. In the last years, the
number of devices and smart-objects connected to the network has grown exponentially
and the so-called “machine intelligence” has become part of the life-cycle of industries,
agriculture, smart cities, and eventually public institutions. In this context, the initiative
to integrate heterogeneous networks, including wired/wireless networks and smart-objects,
from both the service management and control viewpoints is considered a critical aspect
of Future Networks [2].
The effect of all these drivers is the so-called “Softwarization” of telco infrastruc-
tures [3], where the approach to this integration is through the deployment of a network
infrastructure supporting software-driven network features that can be instantiated on-
demand. These instantiations will be addressing the changing service requirements and
1

resource constraints, yet be scalable across multiple services and multiple domains, can
maintain Quality of Service (QoS) for end-users of a service, and that provide a level of
isolation and security from one service to another.
Research and development activities are currently focused on several concepts such
as programmable networks, network virtualisation, open interfaces and platforms, and
increasing the degree of intelligence inside the network. The next generation of Software
Defined Infrastructure (SDI) needs to move from being merely Defined by software to
be Driven by software and must be capable of supporting a multitude of players that
exploit an environment in which services are dynamically deployed and quickly adapt over
a heterogeneous physical infrastructure, according to chaining requirements.
Programmability in network elements (routers, switches, and so forth) was intro-
duced over a decade ago as the basis for the rapid deployment and customization of new
services (i.e. the first architectural state of the Software Defined Networking, SDN concep-
tual view [4]). Advances in “programmable networks” have been driven by the industry
adoption of OpenFlow [5] and a number of requirements that have given rise to a new
business model of the same telecom business actors, and roles (e.g. the second archi-
tectural state of the SDN conceptual view: Software Defined Networks). We are moving
away from the “monolithic” approach to networks where systems are vertically integrated,
towards a component-based approach, where systems are made of multiple components
from different manufacturers, interacting with each other through open interfaces to form
a service. The result is a truly open service platform representing a marketplace wherein
services and service providers compete with each other, while customers may select and
customize services according to their needs (e.g. the third architectural state of the SDN
conceptual view: Software-Driven/Enabled Networks) [6].
2

The next generation of SDIs will be engineered to facilitate the integration and
delivery of Information and Communication Technology (ICT) services, computing and
network clouds leading to redefine roles and relationships between the players in the value
chains, whilst opening new service models and business opportunities for the digital society
and economy. Moreover, SDI will enhance integration of the key enabling technologies such
as programmability, network virtualisation, Network Function Virtualisation (NFV) [7],
[8], and self-management.
1.2 Problem statement
The integration of the Internet, software technologies and traditional telecommu-
nications and communication technologies, has been always a challenge for network and
Service Operators (SOs), as far as service deployment and management [6], [9], [10] is
concerned.
One of the main challenges includes the design and the implementation of specific
mechanisms for run-time orchestration of logical resources in SDIs, considering only wired
environments. A major aspect for this challenge is the development of technology-specific
methods that enable the provisioning of virtual networks and storage and a processing
resources over a SDN substrate infrastructure. This include the creation, configuration
and tearing-down of virtual resource components, considering both networking and com-
putational and storage resources. By using NFV, networking resources can be re-allocated
according to changing network conditions or service demands. Additionally, this challenge
considers the development of autonomous actions that provide virtual network stability,
performance, and optimizations even with the absence of higher-level control. These
include, for example, virtual resource remapping in case of resource scarcity, increased
3

resilience through transparent resource migration in case of hardware failure or energy
saving using adaptive virtual resource consolidation.
In addition to mechanisms for controlling virtual resources in SDI, another challenge
includes the design and implementation of specific algorithms for the efficient mapping of
virtual resources onto physical resources in SDN [104], [12]. The mapping takes into ac-
count the top-level service and operational requirements such as QoS requirement (e.g.
minimizing network latency). By addressing this challenge, virtual networks can be cus-
tomized with “optimally” allocated capabilities such as virtual nodes (with computing
and storage capabilities), virtual links and paths for specific networked services.
This thesis shows how network architectures based on open network features and
resources abstraction offers innovative solutions addressing some of the challenges of Future
Networks.
1.3 Contributions
The issue of the logical resource orchestration (including network functions and ser-
vices) raises several research challenges. Resource orchestration should be supported by
a centralised software entity (the Resource Orchestrator – RO), whose overall goal is to
ensure successful hosting and delivery applications by meeting QoS of service applica-
tion owners (e.g. maximise availability, maximise throughput, minimise latency, avoid
overloading, etc.) and resource providers (e.g. maximise utilisation, maximise energy
efficiency, maximise profit, etc.) respectively. The RO is responsible for a number of or-
chestration operations (including resource selection, resource deployment, resource mon-
itoring, and resource control), which need to be programmed to control the resources at
design time, as well as at the run time for ensuring the fulfilment of QoS objectives.
4

Based on representative use cases and application scenarios, the work in this Ph.D.
develops approaches and methodologies that address the issue of resource orchestration.
The contributions of this work are organized into four main Chapters, as follows.
1. Applicability of software defined and virtualisation concepts in Future
Network scenarios: this Chapter aims to analyse the applicability of SDN, Net-
work Virtualisation (NV) and NFV principles in evolutionary network contexts by
defining innovative application scenarios. Specifically, the Chapter identifies both the
main critical aspects of the current Internet – characterised by static and uneconom-
ical resources – and the potential advantages that could be achieved by integrating
new paradigms/technologies such as SDN and NFV (e.g. programmability and costs
reduction) [64].
2. Highly dynamic virtual environments description: this Chapter aims to pro-
vide a mathematical description for highly dynamic virtual environments including
virtual networks, logical networks, cloud computing networks, mobile ad-hoc net-
works, sensor networks and Internet of Things (IoT). Using graph and queuing the-
ory, we have analysed logical and topological models in order to verify the expected
dynamics and to get information about the network performance, efficiency, and
robustness. In [81], we have developed a network model consisting of three key com-
ponents: (i) a model for traffic generation, (ii) a routing algorithm for the forwarding
of data packets, and (iii) a graph model to represent network topology. Using such
a network model, we have analysed hypercube networks and compared them with
other regular structures (e.g. regular lattice) in order to show their advantages and
applicability to distributed Data Centers (DCs).
5

3. Management and orchestration of logical resources in SDI: in this Chapter
the management of the “complexity” of Operators’ networks is analysed by using
flexible software solutions. A deep integration of software in the networks offers both
the possibility to develop network functions as applications, executing either in the
Clouds or in an ensemble of distributed Information Technology (IT) resources, and
providing new services to the end users. In fact, SDN and NFV offer the possibility to
manage and “orchestrate” both the virtual and physical networks resources according
to specific requirements (e.g. latency, energy consumption) with high flexibility.
4. Framework for the dynamic placement of virtual network functions and
services: this Chapter describes an architecture based on Resource Orchestrator.
The main task of such Resource Orchestrator is to achieve a dynamic placement of
virtual IT resources in the network minimising the energy consumption. Specifically,
we have considered and compared different algorithms and strategies for the alloca-
tion of virtual resources on physical nodes [12], [104] and provided some experimental
results by using the Very Lightweight Service Platform (VLSP) testbed1.
To summarise, this thesis highlights the main criticality of the current Internet and
investigates how new network paradigms and principles such as SDN and NFV might sup-
port Network Operators (NOs) and network administrators to make network management
easier. The research approach adopted in this work may be defined as an “evolutionary ap-
proach”, whose aim is to provide technical solutions and new ideas to overcome limitations
of the current technologies.
1http://clayfour.ee.ucl.ac.uk/usr/
6

1.4 Thesis outline
The rest of this thesis is organized as follows. Chapter 2 provides the state-of-the
art and the necessary background on driver technologies for Future Networks. It also
illustrates the main open issues and research challenges highlighting the motivations and
the main contribution of the thesis. Chapter 3 analyses the applicability of SDN, NV
and NFV principles in evolutionary network contexts. Chapter 4 provides a mathemati-
cal description for high dynamic virtual environments. Chapter 5 analysis some aspects
related to the management and orchestration of virtual networks. Chapter 6 describes
an architecture based on Resource Orchestrator for the management and orchestration of
network resources. In Chapter 7 some placement algorithms and strategies are considered
and compared. Finally, Chapter 8 concludes with final remarks and illustrates the future
direction of the work.
7

Chapter 2
SDN, NV and NFV: terms and definitions
The progress of IT technology is impacting the evolution of ICT and heavily the
life of the modern consumers. Nowadays, ICT plays an important role in the way people
interact: end users are connected anytime and anywhere by embedded devices, which in-
clude not only smartphones and tablets but a huge number of smart-objects empowered
with intelligence and capabilities to interconnect with any other object (usually not con-
sidered yet as network nodes). New services demanded by end-users, are characterised
by strict requirements in terms of availability, QoS, QoE, dependability, resilience and
protection as well as by high dynamism (new services and applications are introduced
daily/hourly). In this “complex” and pervasive environment, the network that delivers
these services needs to be capable of adapting to the unpredictable shifting demands, due
to the ubiquitous access, quickly, automatically and economically. As such, network man-
agement and the orchestration of network resources is becoming a key challenge both the
industry and research community. Despite the evolution of technologies, most of existing
management applications have been applied to the management of individual devices [14].
New approaches to address the management of Future Networks are, therefore required.
8

In last years SDN, NV and NFV have gained lot of attention by both industry and re-
search community, thanks to three synergy concepts: (i) network programmability by a
clear separation of data and control planes, (ii) sharing of network infrastructure to pro-
vide multi-tenancy, and (iii) replacing the functions that traditionally run on a specialized
hardware, with the software-realizations that run on commodity servers.
Recently, a group of NOs, SPs, and vendors have created the ONF [15], an industrial-
driven organization, to promote SDN, NV, NVF and standardize the protocols [5]. There
have also been standardization efforts on SDN at the IETF [16] and IRTF [17].
2.1 Software Defined Networking
This section provides a brief survey of the state-of-art of SDN. It starts with dis-
cussing the historical prospective of “programmable” networks from the early ideas to
recent developments, covering use-cases and drivers. Then, the section presents the SDN
architecture models and the OpenFlow standard in particular, discussing current alterna-
tives for implementation [18].
2.1.1 SDN precursors: road to SDN
This subsection provides overview of the early programmable networking efforts and
precursors to the current SDN paradigm, which was designed to simplify network hardware
while improving the flexibility of network control. While SDN has received a considerable
amount of industry attention, it is worth noting that the idea of “programmable” networks
and decoupled control logic has been around for many years. The Table 2.1 and Figure 2.1
provide the summary of such technologies that act as precursors to SDN (more details can
be found in [18], [19], [39]).
9
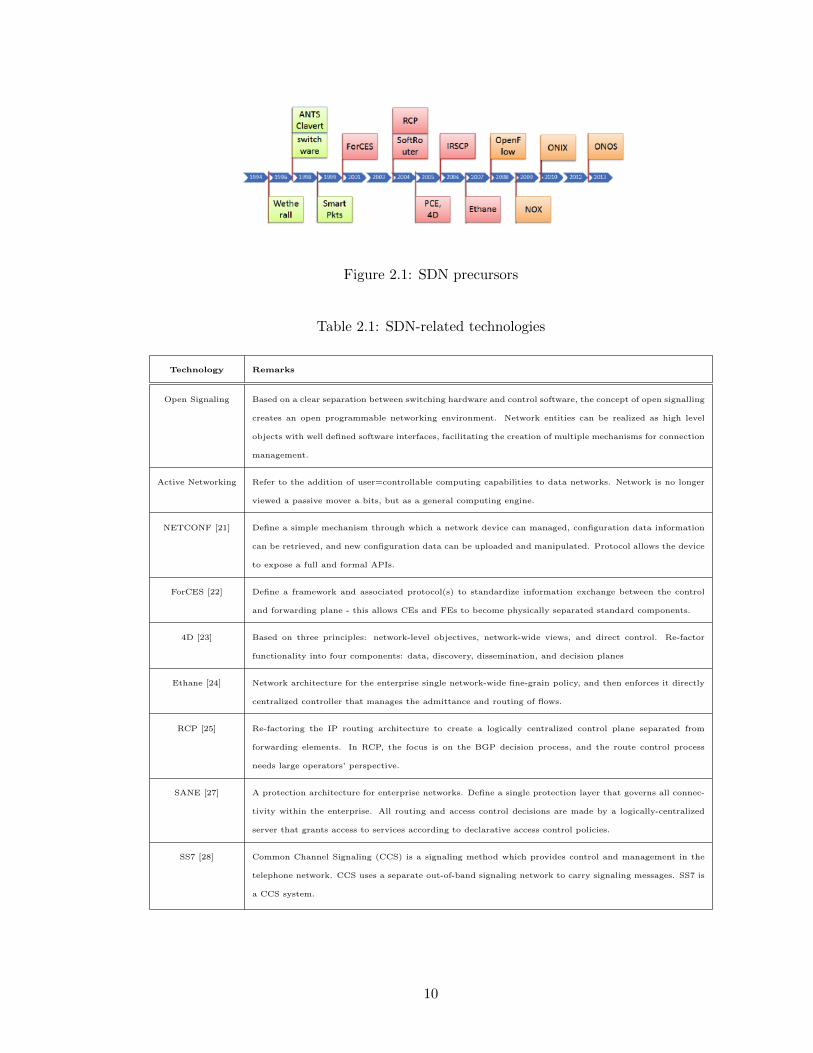
Figure 2.1: SDN precursors
Table 2.1: SDN-related technologies
Technology Remarks
Open Signaling Based on a clear separation between switching hardware and control software, the concept of open signalling
creates an open programmable networking environment. Network entities can be realized as high level
objects with well defined software interfaces, facilitating the creation of multiple mechanisms for connection
management.
Active Networking Refer to the addition of user=controllable computing capabilities to data networks. Network is no longer
viewed a passive mover a bits, but as a general computing engine.
NETCONF [21] Define a simple mechanism through which a network device can managed, configuration data information
can be retrieved, and new configuration data can be uploaded and manipulated. Protocol allows the device
to expose a full and formal APIs.
ForCES [22] Define a framework and associated protocol(s) to standardize information exchange between the control
and forwarding plane - this allows CEs and FEs to become physically separated standard components.
4D [23] Based on three principles: network-level objectives, network-wide views, and direct control. Re-factor
functionality into four components: data, discovery, dissemination, and decision planes
Ethane [24] Network architecture for the enterprise single network-wide fine-grain policy, and then enforces it directly
centralized controller that manages the admittance and routing of flows.
RCP [25] Re-factoring the IP routing architecture to create a logically centralized control plane separated from
forwarding elements. In RCP, the focus is on the BGP decision process, and the route control process
needs large operators’ perspective.
SANE [27] A protection architecture for enterprise networks. Define a single protection layer that governs all connec-
tivity within the enterprise. All routing and access control decisions are made by a logically-centralized
server that grants access to services according to declarative access control policies.
SS7 [28] Common Channel Signaling (CCS) is a signaling method which provides control and management in the
telephone network. CCS uses a separate out-of-band signaling network to carry signaling messages. SS7 is
a CCS system.
10

The Open Signaling (OPENSIG) working group began in 1995 with a series of work-
shops dedicated to making ATM, Internet and mobile networks more open, extensible, and
programmable [29]. The core of their proposal was to provide access to the network hard-
ware via open, programmable network interfaces; this would allow the deployment of new
services through a distributed programming environment. Motivated by these ideas, an
IETF working group was created, which led to the General Switch Management Protocol
(GSMP) [30], a general purpose protocol to control a label switch. In the mid 1990s,
the Active Networking [31], [32] initiative proposed the idea of a network infrastructure
that would be programmable for customized services. However, it never achieved the sig-
nificance necessary to be transferred to widespread use and industry deployment, mainly
due to practical security and performance concerns [33]. The 4D project [23], [25], [34]
advocated a clean slate design that emphasized separation between the routing decision
logic and the protocols governing the interaction between network elements. Finally,
Ethane [24] laid the foundation for what would become SDN. Ethane’s identity based ac-
cess control would likely be implemented as an application on top of a SDN controller such
as NOX [35]. A parallel approach to SDN is under development by the IETF Forwarding
and Control Element Separation (ForCES) Working Group [22].
2.1.2 SDN architecture
As shown in the Figure 2.2, a SDN architecture consists of three main tiers.
1. The Application tier encompasses solutions that focus on the expansion of network
services. These solutions are mainly software applications that communicate with
the controller.
2. The Control Plane tier includes a logically-centralized SDN controller, that main-
11

tains a global view of the network that takes requests through clearly defined APIs
from application layer and perform consolidated management and monitoring of
network devices via standard protocols.
3. The Infrastructure (or Data Plane) tier involves the physical network equipment,
including Ethernet switches and routers. It provides programmable and high speed
hardware and software, which is complaint with industry standards.
Figure 2.2: SDN architecture
At the bottom layer, the physical network consists of the hardware forwarding
devices which store the Forwarding Information Base (FIB) state of the network data
plane (e.g., Ternary Content Addressable Memory entries – TCAM – and configured
port speeds), as well as associated meta-data including packets, flows, and port coun-
ters. The devices of the physical network may be grouped into one or more separate
controller domains, where each domain has at least one physical controller. Data plane
interface or standards-based protocols, typically termed as “southbound protocols”, de-
fine the control communications between the controller platform and data plane devices
such as physical and virtual switches and routers. There are various southbound protocols
12

such as OpenFlow, Path Computation Element Communication Protocol (PCEP), Simple
Network Management Protocol (SNMP), Open vSwitch Database Management Protocol
(OVSDB), etc.
The Control Plane tier is the core of the SDN, and is realized by the controllers
of each domain, which collect the physical network state distributed across every control
domain. This component is sometimes called the Network Operating System (NOS), as
it enables the SDN to present an abstraction of the physical network state to an instance
of the control application (running in Application Layer), in the form of a global network
view.
Northbound open APIs refer to the software interfaces between the software mod-
ules of the controller and the SDN applications. These interfaces are published and open
to customers, partners, and the open source community for development. The application
and orchestration tools may utilize these APIs to interact with the SDN Controller. Ap-
plication layer covers an array of applications to meet different customer demands such as
network automation, flexibility and programmability, etc. Some of the domains of SDN
applications include traffic engineering, network virtualization, network monitoring and
analysis, network service discovery, access control, etc. The control logic for each applica-
tion instance may be run as a separate process directly on the controller hardware within
each domain.
From the above description of the architecture, we can see that the SDN controller
is a key element (both in terms of southbound and northbound interactions). Ashton
et all [26], prepared a check-list of what to look for in an SDN controller. In this list,
they included the following: (i) OpenFlow support (versions and extensions); (ii) network
functionality (network isolation, QoS support); (iii) programmability (APIs and policy
13

definitions); (iv) reliability (redundancy and availability); (v) centralized monitoring and
visualization; (vi) network virtualisation support (creation and management); (vii) scal-
ability (number of switches, hosts, flows); (viii) performance (delays, drops and through-
put); (ix) security (authentications and filters); (x) vendor characteristics. This check-list
provides an understanding of challenges in development of a SDN controller.
2.1.3 SDN control models
Enterprises and NOs who deploy a Software Defined Network typically use one
of the two different models of SDN: centralized or distributed. Each model has different
infrastructure elements and requirements to consider. A successful deployment will require
choosing the right SDN architecture, then testing it in an organized way, based on the
right infrastructure.
A. Centralized controller model (or revolutionary model). The centralized model of
SDN technologies, as discussed in the SDN precursors subsection, has evolved from
researchers who aimed to replace adaptive discovery, a distributed process, with
central control of forwarding. In this architecture, a central software process (or
centralized SDN controller) maintains the entire topology and status of the net-
work’ s devices and understands the network addressing and connectivity from the
user’s perspective. The central process running on the controller may support vari-
ous algorithms and policies to define routes through the network for each and every
flow [36], [37]. The paths are created by addressing all devices along the way to
update their (forwarding) table to forward the packets along the path correctly.
The OpenFlow protocol was designed to support the centralized controller to com-
municate forwarding table changes to network devices. This communication could
14

happen either proactively, based on a network map, or reactively, in response to a
request from a device. The challenge in this SDN approach is the lack of a proven
model for centralized control, as there is no proof that central control of networking
can scale and there exists no currently accepted technology to test its capabilities.
The problems of scalability and central control can be addressed in a data center,
a delivery network or a Wide Area Network (WAN) core, rather than whole of the
Internet or even an enterprise WAN. Deploying centralized SDN in these smaller
domains can spread widely and quickly. However, recently various researchers and
vendors are working to explore the best way of linking disparate SDN domains into
a complete end-to-end network.
B. Distributed SDN (or evolutionary model). The distributed nature of networking
intelligence in the Internet has been highly successful. Also, the same control proto-
cols that are used in the Internet have also taken hold in local and private networks.
Many experts and vendors, who have both witnessed and been part of this success
of adaptive distributed model, believe the “purist model” ( fully centralized SDN
strategy), is a revolutionary one and the evolutionary approach is more prudent.
To this group, which includes many IP experts and router equipment vendors, the
software that should be defining network behaviour is higher-level software, per-
haps even application software [36]. The distributed model “adds” mechanisms of
software-based control to traditional IP and Ethernet networks. We should note
that the distributed model, like the centralized model, accepts the need to gather
information about network status and collect it at a central point where it can be
acted on to manage the performance. However, in the distributed model, the goal of
SDN is to offer more controllable behaviour. Typically, such goals are achieved by
15

levering on various existing protocols like Multiprotocol Label Switching (MPLS),
Generic Routing Encapsulation (GRE), and policy-based protocols. For example,
Policy and Charging Rules Function (PCRF) – part of the Evolved Packet Core
(EPC) that supports service data flow detection, policy enforcement and flow-based
charging – could be the principal means by the SDN controllers decide how to set up
and manage flows [38]. The main challenge for distributed SDN is that it is yet to
prove that it can offer the kind of control granularities over traffic and connectivity
that centralized SDN technologies could offer. In addition, there’s also the problem
of what should be the accepted framework for applying distributed SDN principles -
when various vendors choose different approach to integrate SDN into their existing
closed systems.
2.1.4 SDN and OpenFlow
In the initial white paper [5], OpenFlow was simply referred as “a way for researchers
to run experimental protocols in the networks they use every day”. The analogy used by
the authors in describing OpenFlow is to think of OpenFlow as a general language or an
instruction set that lets one write a control program for the network rather than having
to rewrite all of code on each individual router. In centralized SDN architecture (the
model that standards group ONF support) the key element is the connecting technology
that communicates central control decisions to devices. OpenFlow has become the official
protocol to use in a centralized SDN model to make high-level routing decisions. As a
result, the creation of central-control SDN must be based on selecting devices and control
software that support the OpenFlow standard.
OpenFlow is not yet a complete standard, and is still undergoing significant changes.
16
Tom Nolle [42], highlighted following shortfalls of OpenFlow. Openflow doesn’t have a
mechanism for fully managing devices, particularly for con- trolling port/trunk interfaces
and queuing. OpenFlow doesn’t communicate network status fully either, so central con-
trol software will need some source of information about loads, traffic and operational state
for nodes and trunks. OpenFlow also lacks a specific process for establishing the paths
to take between controller and switch, so there’s a question of how OpenFlow networks
“boot from bare metal”, meaning how they become operational from a newly installed
state. Finally, majority of the existing controllers have exposed northbound APIs, by
which any application or management software can gain access to the features supported
by the controller. However, it is still not clear what kind of software is available to take
advantage of these interfaces and how it would be integrated with the controller. All
of this makes it hard to conceptualize how a current network could evolve to support a
centralized SDN model. The capabilities of the control software that runs above the SDN
controller itself, are the key to success for the centralized SDN model [42].
2.1.4.1 OpenFlow roadmap
Initially the OpenFlow protocol standardized a data plane model and a control plane
API, mainly by relying on the technologies that legacy switches already supported [39].
For example, network elements included the support of fine-grained access control and flow
monitoring. On these elements, enabling OpenFlow’ s initial set of capabilities was as easy
as performing a firmware upgrade (without any hardware upgrade) to make it OpenFlow-
capable. It is well- known that OpenFlow’ s initial target deployment scenario was campus
networks, meeting the needs of a networking research community actively looking for
ways to conduct experimental work on network architectures within a research – friendly
17
operational setting – the “Clean-Slate” program [40]. In 2008-09, the OpenFlow group
at Stanford (in partnership with 7 other universities) led an effort to deploy OpenFlow
test beds across many campuses and demonstrate the capabilities of the protocol both
on a single campus network and over a wide-area backbone network spanning multiple
campuses [24]. As real SDN use cases materialized on these campuses, OpenFlow began to
take hold in other realms, such as data- center networks, where there was a distinct need to
manage network traffic at large scales. This led many experts to state that SDN/Openflow
“was born in the campus, matured in the data center” [41]. Although OpenFlow includes
many of the principles from earlier work on the separation of control and data planes,
the rise of OpenFlow offered several additional intellectual contributions – such as (i)
generalizing network devices and functions, (ii) the vision of a network operating system,
and (iii) distributed state management techniques [39].
2.1.4.2 OpenFlow pros and cons
Over the past few years, almost all of the major network device vendors have an-
nounced OpenFlow support. As there are several versions of the OpenFlow standard,
vendors may not have released software for the latest version. A number of OpenFlow
compatible controllers can provide central control for a community of devices, and many
OpenFlow-based SDN trials and deployments have been conducted using these tools. This
success can be attributed to either a planned or unplanned collaborations between equip-
ment vendors, chip-set designers, network operators, and networking researchers.
18

2.2 Network Virtualisation
As mentioned by Carapinha et all [43], virtualisation, in general, provides an ab-
straction between user and physical resources, so that the user gets the illusion of direct
interaction with those physical resources. NV technology is a key component that not
only is an integral part of the overall design to support the evolution and coexistence of
different network architectures but also acts as an abstraction layer between services and
infrastructure to facilitate innovation [44].
Some researchers [39] caution that a precise definition of network virtualisation is
elusive, and some disagree as to whether some of the mechanisms such as slicing represent
forms of network virtualisation. Accordingly, they define the scope of network virtualisa-
tion to include any technology that facilitates hosting a virtual network on an underlying
physical network infrastructure. However, there have been some well agreed definitions on
what a virtualised networks should be. A virtualised network may include overlays, tun-
nels, virtual devices, and multi-tenancy. But, it must provide total physical, location and
stateful independence. That is, a virtualised network is a faithful and accurate reproduc-
tion of the physical network that is fully isolated and provides both location independence
and physical network state independence [45].
The concept of network virtualisation is not new, and the concept has been realized
in the past in the form of Virtual Local Area Networks (VLANs) and Virtual Private Net-
works (VPNs), which have been a highly successful approach to provide separate virtual
networks over a common physical infrastructure. A complete study on network virtuali-
sation would require a separate survey [46], [47], and below we just summarize in few sen-
tences. The detailed survey of the evolution of Network virtualisation and programmable
19

networks can be found in [19].
VPNs fulfil the basic goal of providing different logical networks over a shared in-
frastructure. However, it suffers from a few limitations, such as: (i) all virtual networks
are based on the same technology and protocol stack; (ii) lack of true isolation of vir-
tual network resources; (iii) lack of clean separation of the roles of infrastructure provider
and VPN service provider; (iv) only network administrators could create these virtual
networks; (v) incrementally deploying new technologies is difficult.
To overcome some of these challenges, the researchers and practitioners resorted
to running overlay networks, where a small set of “enhanced” nodes use tunnels to form
their own topology on top of a legacy network [19]. In an overlay network, the “enhanced”
nodes run their own control-plane protocol, and direct data traffic (and control-plane mes-
sages) to each other by encapsulating packets, sending them through the legacy network,
and stripping the encapsulation at the other end. NV goes a step further (of what VPNs
achieve) by enabling independent programmability of virtual networks [43]. So, a virtual
network is no longer necessarily be based on IP, or any other specific technology, and any
kind of network architecture can in principle be built over a virtual network. Another
important strength of virtualisation is the native capability to handle multi-provider sce-
narios and hide the specificities of the network infrastructure, including the existence of
multiple administrative domains. Although some workaround solutions exist, this has
traditionally been a complicated issue for VPNs. Finally, network virtualisation aims to
provide true isolation (instead of just an illusory isolation, as provided by VPNs) of vir-
tual networks – sharing the same infrastructure – by employing various approaches such
as using different operating system instances.
20

2.2.1 SDN and Network Virtualisation
As argued by Martin Cassado of VMWare [48], Network virtualisation and SDN are
two different things and somewhat incomparable. SDN is a mechanism (that is relevant
to system builders) and network virtualisation is a solution. He goes on to give the
software-development analogy: “A programming language would be the SDN using which
the program(s) can be built out of it. Whereas, network virtualisation, on the other hand,
is a product category or solution set that customers use to change the paradigm of their
network”. That is, just as server virtualisation changed the paradigm for server operations
and management, network virtualisation changed the paradigm for network operations and
management. So, one can use SDN in NV but it is not mandatory. The researchers, apart
from Martin Cassado, have also mentioned that SDN can be applied to many problems:
graphic engineering, security, policy or network virtualisation. However, SDN in NV
provides the possibility of deep programmability of network infrastructures for quickly
modifying network behaviour and providing more sophisticated policy controls through
rich applications.
Other researchers [39] argue that although network virtualisation has gained promi-
nence as a use case for SDN, the concept pre-dates modern-day SDN and has in fact
evolved in parallel with programmable networking. The two technologies (SDN and NV)
are in fact tightly coupled: Programmable networks often presumed mechanisms for shar-
ing the infrastructure (across multiple tenants in a data center, administrative groups
in a campus, or experiments in an experimental facility) and supporting logical network
topologies that differ from the physical network, both of which are central tenets of net-
work virtualisation.
21

Apart from SDN as an enabling technology for network virtualisation in which Cloud
providers need a way to allow multiple customers (or tenants) to share the same network
infrastructure, the researchers have pointed additional two ways in which SDN and NV
can relate to each-other. These additional two ways are (1.) evaluating SDN control
applications in a virtualised environments before deploying on operational network (ex:
MiniNet) (2.) Virtualising an SDN network (ex: FlowVisor).
In this remaining part we will focus mostly on the network virtualisation in cloud
environment (DCs). In this context, we will broadly classify network virtualisation into
two broad approaches – hop-by-hop and distributed edge overlays [49].
2.3 Network Function Virtualisation
Proprietary appliances that are too diverse, and ever growing in numbers, make the
operation of service additions and upgrades increasingly difficult. Typically, these appli-
ances are turn-key in-line systems, that maintain real-time state of subscriber mobility,
voice and media calls, security and contextual content management [50]. NFV is an initia-
tive of the ETSI Industry Specification Group to virtualise network functions previously
performed by these proprietary dedicated hardware [51], [52].
The white paper on NFV [8] defines NFV as a consolidation of network functions
onto industry-standard servers, switches and storage hardware located in Data/Distribu-
tion centers – an optimized data plane under virtualisation. NFV allows administrators to
replace physical network devices (traditional) with software that is running on commodity
servers. This software realizes the “network functions” that were previously provided by
the dedicated hardware (network devices).
NFV is about implementing network functions in software - that run today on pro-
22

prietary hardware – leverage (high volume) standard servers and IT virtualisation. To
understand the significance of NFV, we should consider the recent trends. The trends
include increased user mobility, explosion of devices and traffic, emergence and growth
of cloud services, convergence of computing, storage and networks and finally new vir-
tualisation technologies that abstract underlying hardware yielding elasticity, scalability
and automation. Accordingly, challenges and issues with respect to these trends include:
(i) huge capital investment; (ii) operators facing increasing disparity between costs and
revenues; (iii) increasing complexity, large and increasing variety of proprietary hardware
appliances in operator’ s network; (iv) reduced hardware life-cycle; (v) lack of flexibility
and agility; (f) launching new services is difficult and takes too long, and often requires yet
another proprietary box which needs to be integrated into existing infrastructure. The ma-
jor advantage of using NFV is to address the above challenges and issues. As highlighted
by Yamazaki et all [53], NFV helps to reduce network operator CAPital EXpenditures
(CAPEX) and OPerational EXpenditures (OPEX) through reduced equipment costs and
reduced power consumption, and also helps to reduce complexity and make managing a
network and deploying new capabilities easier and faster.
As mentioned by Manzalini [54], there are quite a lot of middle-boxes deployed in
current networks: not only these nodes are contributing to the so-called “network ossifi-
cation”, but also they represent a significant part of the network capital and operational
expenses (e.g., due to the management effort that they require). Basically, a middle-box
is a stateful system supporting a narrow specialized network functions (e.g., layer 4 to 7)
and it is based on purpose-built hardware (typically closed and expensive). The next sig-
nificant advantage of using NFV is in removing, or even reducing, the number of middle-
boxes deployed in current networks, which would realize several advantages such as cost
23

savings and increased flexibility.
NFV also supports multi-version and multi-tenancy of network functions, and al-
lows use of a single physical plat- form for different applications, users and tenants [55].
As described by Yun Chao [56] NFV enables new ways to implement resilience, service
assurance, test and diagnostics and security surveillance. It facilitates innovation towards
new network functions and services that are only practical in a pure software network
environment. We should note that NFV is applicable to any data plane and control plane
functions, fixed or mobile networks, and also the automation of management and config-
uration of functions is very important for NFV to achieve scalability. Ultimately, NFV
aims to transform the way network operators architect and operate their networks [56].
2.3.1 Functions under NFV and the use cases
The network devices that the commodity server and the software aim to replace
can range from firewalls and VPN gateways to switches and routers. Researchers [51]
argue that almost any network function can be virtualised. The NFV focus in the market
today includes switching elements, network appliances, network services and applications.
Considering the description in the white paper [8], the below list summarizes various
network functions that are considered for NFV [57].
• Switching elements such as Broadband Remote Access Server (BRAS) or Broadband
Network Gateway (BNG), carrier grade NAT and routers.
• Mobile network nodes such as Home Location Register/Home Subscriber Server
(HLR/HSS), Serving GPRS Support NodeMobility Management Entity (SGSN-
MME), Gateway GPRS support node/Packet Data Net- work Gateway (GGSN/PDN-
GW), RNC, NodeB and Evolved Node B (eNodeB).
24

• Functions in home routers and set top boxes.
• Virtualized home environments.
• Tunneling gateway elements such as IPSec/SSL virtual private network gateways.
• Traffic analysis elements such as Deep Packet Inspection (DPI), Quality of Experi-
ence (QoE) measurement.
• Service Assurance, Service Level Agreement (SLA) monitoring, Test and Diagnos-
tics.
• Next-Generation Networks (NGN) signaling such as Session Border Controller (SBCs),
IP Multimedia Sub- system (IMS).
• Converged and network-wide functions such as AAA servers, policy control and
charging platforms.
• Application-level optimization including Content delivery network (CDNs), Cache
Servers, Load Balancers, Application Accelerators.
• Security functions such as Firewalls, virus scanners, intrusion detection systems,
spam protection.
Considering the above listing, the use-cases of NFV can cover virtualisation of mobile
Core/Edge network nodes, home environment, content delivery networks, mobile base
Station, wireless LAN controllers, Customer Premise Equipments (CPE) and Operation
Services Systems (OSS).
Below, we enlist three practical deployments of NFV by major Telecom vendors.
25

• British Telecom, in partnership with HP, Intel, wind-river and tail-f, developed as
proof of concept, a combined BRAS and CDN functions on Intel Xeon Processor
5600 Series HP c7000 BladeSystem using Intel 82599 10 Gigabit Ethernet Controller
sidecars [200]. BRAS is chosen as an “acid test”, whereas CDN is chosen as it
architecturally complements BRAS.
• Move access network functions to the Data Center: Deutsche Telecom recently
launched the “Terastream” project, which simplify IP access networks with NFV
and SDN [58], [59].
• Reduce OPEX by simplifying home networks: France Telecom s proposal for virtual
home gateway to Broad- band Forum. This proposal aims to increase flexibility in
service deployment at the edge. The project is supported by Telefonica, Portugal
Telecom and China Telecom [60].
2.3.2 NFV: realization requirements
Efficient realization of virtualised network functions should consider various aspects
such as flexible processing, good performance with respect to handling millions of packets,
efficient isolation mechanisms, flow migration and per-flow state to support mobility and
finally support for multiple domains. Hence, when planning for the network functions
virtualisation, the administrator has to address the following issues.
• Network functions to virtualise, considering the return of investment.
• Approach to integrate with the existing network management infrastructure, inter-
operability.
• Scalability and elasticity issues.
26

• Resource management approach, and APIs to expose for ease of management.
• Availability and service failover/recovery mechanisms.
With the success of NFV, next generation network functions will be implemented as
pure software instances running on standard servers - unbundled virtualised components
of capacity and functionality. One of the existing approaches, as explained by Barkai et
all [50] to realize such a network functions is to divide the whole process into two-steps-as
described below.
• Significant component-based unbundling: unbundling refers to breaking up the pack-
ages that once offered as a single unit, providing particular parts of them at a scale
and cost unmatchable by the original package provider [61]. In this case, it is the
unbundling of both capacity and functionality locked in monolithic systems. In this
first step, the monolithic systems are broken to components that will be running on
virtual machines.
• Dynamically assemble discrete functional components to elastic end-to-end services.
In this second step, the broken down components are assembled using various tech-
niques such as flow-mapping [50].
One should note that such “scatter-gather” rearrangement of carrier functionality
needs to work on commodity hardware. In addition, realization of NFV may also pose the
challenge of assembling components developed by third-parties, into whole solutions.
2.3.2.1 Requirements from the VM perspective
Researchers [61] argue that the traditional virtual machines VMs may not be able
to address the challenges of NFV. Traditional VMs are Fat - with huge overheads, poor
27

performance, and limited to only few VMs per server. Whereas, the VMs for NFV needs
to be “Small” - with minimal overhead, excellent performance, many number of VMs
per server, and natively supports network functions. One of the most popular VMs de-
signed for NFV is ClickOS [61]. ClickOS is both light-weight (just around 1.4MB) and
scalable. One can run many instances (in multiple thousands) on a single commodity
PC. ClickOS also boots and migrates quickly, which can be used to realize the following
network functions: Broadband Remote Access Server (BRAS), residential gateway, deep
packet inspection, caching solutions, and enterprise firewalls.
2.3.3 SDN and Network Function Virtualisation
NFV provides immense possibilities for the providers to take advantage of the full
potential of their network infrastructures, and to offer novel commercial services to their
customers. SDN is not a requirement for NFV, but the two technologies are complemen-
tary - Intel terms NFV as a complementary initiative to SDN. Administrators/engineers
can implement NFV, choosing to rely on traditional networking algorithms such as span-
ning tree or IGRP instead of moving to an SDN architecture. Yet, SDN can improve
performance and simplify operations in a network functions virtualization environment.
Jim Machi, in his report [62], discusses elaborately this relation between SDN and
NFV. He begins with mentioning that both technologies are designed to increase flexibility,
decrease costs, support scalability, and speed the introduction of new services. In addition,
Both SDN and NFV are likely drivers for innovation in telecommunications, networking
and enterprise DCs. Finally, both owe their existence to similar market forces, including
(i) better processor capability – significant improvement in the processor technology, (ii)
simplification in connectivity – scope for separation of planes, and (iii) virtualisation
28
maturity.
While SDN was originally conceived to control the operation of network hardware
devices, researchers have shown that it can just as easily integrate into an NFV environ-
ment, communicating with software-based components on commodity servers. The first
white paper on NFV suggests that NFV and SDN have some overlap, but neither SDN is
a subset of NFV, nor the other way around. So, the important questions to address are,
Where do SDN and NFV intersect? and, How will the interaction between SDN and NFV
impact the evolution of both ideas? These are the interesting and challenging questions
that are, and will be, addressed by various researchers and vendors, in different ways in
future.
In general, as long as NFV addresses the general case of “policy-managed” forward-
ing, and need dynamic service orchestration. SDN can play a role in realization of the same
- i.e., NFV can increase network efficiency by using SDN concepts. NFV may demand
virtual network overlays - the model of tunnels and vSwitches, would segregate virtual
functions to prevent accidental or malicious interaction. This use of network overlays, for
virtual function segregation, in NFV will drive the need for applying SDN based solutions.
The multi-tenancy requirement would also influence NFV to adopt a software-overlay net-
work model. In addition, if NFV allows services to be composed of virtual functions hosted
in different data centers, that would require virtual networks to stretch across data centers
and become end-to-end. An end-to-end virtual network would be far more interesting to
enterprises than one limited to the data center. SDN will play a crucial role in such an
extended NFV realization. Hence, SDN when applied to NFV can help in addressing the
challenges of dynamic resource management and intelli- gent service orchestration. When
using SDN-based approach for NFV, there are lots of aspects that need to be looked such
29

as:
• To seamlessly integrate the Virtualised Network Functions (VNF) into the existing
SDN and cloud architectures - importantly, from the perspective of multi-tenancy.
• To ensure that the considered SDN controller that has all the necessary features the
architecture needs. For example, flow-mapping service may or may-not exist as an
in-built feature of the controller.
• To ensure if the scalability aspect of the existing SDN- architecture is sufficient
to support potentially hundreds of millions of subscriber flows and their “affinity-
associations” [50] to virtualisation function instances.
• To extend the existing SDN control model – decoupling of not just control and
forwarding, but also control and forwarding topologies [50].
Different SDN solution vendors address some or all of these challenges in different
ways. A typical approach would be include necessary network services at the control-
tier and provide robust, efficient northbound abstractions (APIs), apart from having an
ecosystem including application developers.
2.4 Current trends and research directions
SDN is moving towards next level of standardization and various companies are
bringing out their products in the market. The vendors who have their own SDN con-
trollers are moving towards setting up an ecosystem. The SDN ecosystem is where all
the stakeholders – asic vendors, switch vendors, controller vendors and network applica-
tion services vendors - join hands to either achieve interoperability or provide complete
30

suite of solution. The success of the open-source controller platforms like Opendaylight,
with well- defined Northbound APIs, has fuelled the trend of controlling SDN networks
smoothly through applications. These applications are developed targeting various do-
mains and network services.
31

Chapter 3
SDN, NV and NFV in evolutionary net-
work scenarios
Network Carriers are experiencing an increasingly challenging environment in which
they have to continuously scale their networks in order to meet rapidly growing users and
traffic demands. In fact in last years, a huge number of aggregation nodes, smart de-
vices and “things” are creating very dynamic networks especially located at the edge of
the current networks, up to around users. Technological advances in terms of hardware
performance, embedded communication and cost reductions are progressively moving an
enormous amount of processing, storage and and communication-networking capability
towards to edge. Following such trend, Edge Networks will be where more of the “intelli-
gence” will placed.
As already introduced in the previous Chapter, SDN, NV and NFV play an im-
portant role in the design of Future Networks. In fact, network programmability offered
by SDN, NV and NFV provides software solutions for a fast, flexible and dynamic de-
ployment of new network functions and services. This means that executable code may
32

be injected into the network elements (such as router, switches and application servers)
in order to create the new functionality. The use of software to dynamically program
individual network devices, network systems and services are driving the evolution of the
current infrastructures towards to Future Networks and Services. Such concept has been
introduced to take into consideration these new realities in the Telecommunications in-
dustry, characterized by factors such as the explosion of digital traffic (e.g. increasing use
of Internet, increasing demand for new multimedia services and for a general mobility)
and the convergence of networks and services.
The key feature in Future Network architecture is a clear split between the Core
Network and Edge Networks. In fact, future infrastructures will be composed by stateless
Core Network and a stateful Edge Networks and DCs. Key assumption is that network
functions and services will be executed in ensembles of VMs, allocated and moved across
a scalable distributed platform deployed at the edge and orchestrated with DC resources
as depicted in Figure 3.1. So, the collection of the information related to the state of such
Edge ICT Fabrics [64], of their resource capabilities, related usage (i.e. states) and data
flows set-up, will be crucial to support orchestration and management operations.
From the points of view of NOs and SPs, as well as from other players angle, such as
OTTs, enterprise networks providers, consumer electronics providers, etc, the programma-
bility offered by SDN and NFV plays a crucial role in more application scenarios [63]
detailed in the following subsections.
3.0.1 Examples of core scenarios
Core networks scenarios typically consider SDN and virtualisation technologies as
paradigms providing incremental improvements (in terms of flexibility, programmability,
33

Figure 3.1: Evolutionary network scenario
etc.) of current networking concepts. Specially in SDN, it is recognized that the concept
of the separation of hardware from (control) software is not really new, but the point is
that the decoupling is made possible today thanks to the hardware technology advances.
In the context of these core scenarios, dynamic Network Function (or Service) Chaining
is one of the most mentioned classes of use cases, where IT and networks resources are
integrated where network services are provided by “chaining” the execution of several
service components. SDN and virtualisation techniques are often assessed as an opportu-
nity reducing CAPEX and OPEX costs. In fact, as previously mentioned, savings may
derive from centralizing and, above all, automating processes and postponing investments
through optimized usage of resources (provided that carriers class performances are still
achieved by the adoption of general purpose hardware). On the other hand a deeper in-
tegration of networks and IT (e.g. Cloud) domains, and the related Operations requires
also a deep “change of culture” in NOs and SPs, and maybe the development of new skills
for mastering “software”. This might require some time to define new models of busi-
ness sustainability and a seamless integration between legacy equipment and the related
34

management systems.
3.0.2 Examples of edge scenarios
Edge scenarios concerns the exploitation of SDN and virtualisation principles for
creating very dynamic virtual networks out of a variety of aggregation nodes, devices,
elements located at edge of current networks, up to around users. Some of these elements
usually are not considered yet as network nodes: for example, cars, robots, drones, any
smart-object with embedded communications, etc. In other words, this is about developing
a “fabric” [64] made of an enormous number of nodes and elements aggregated in an
application driven way, as depicted in Figure 3.2.
Figure 3.2: Example of scenario where the “edge” is becoming a “fabric” of resources to
execute network functions and store data
In the past, the term “fabric” has been used to refer to a distributed computing
system consisting of loosely-coupled storage, networking and processing capabilities inter-
connected by high-bandwidth links. It has also been used for describing flat, simple intra
DC networks optimized for horizontal traffic flows, mainly based on a concept of “server-
35

to-server connectivity”. Based on these previous meanings, in this context, the term fabric
is extended to indicate the edge of the metro networks, becoming like as distributed DCs
consisting of loosely coupled processing and storage resources interconnected by pervasive
high speed wired and wireless links. Some use cases are provided in Section 3.2.
3.1 Edge ICT Fabric
In the following subsections,we provide some considerations about architectural as-
pects related to “Edge ICT Fabric”, proposed in [64].
3.1.1 Network states
In the Edge ICT Fabric approach there is an original challenge regarding the Data
Collection and State Analysis (DCSA), stemming from the fact that the network nodes are
now VMs and therefore their state is also influenced by the overall POP DC conditions.
The DCSA must take into account that the overall system conditions are not simply
described by the state of the network elements but also by the state of the system hosting
the VMs. Therefore the DCSA must have general communication capabilities, enabling
cross boundaries communication between POP DCs, and general semantic capabilities to
describe the state and condition of resources of very different nature and spanning different
logical layers of the Edge ICT Fabric architecture.
Here we envisage an approach in line with previous works proposing approaches
applicable to the management of state information spanning cross-layer in systems where
the network and IT resources are strictly interacting [65], [66]. For instance, the Network
Resource Description Language (NRDL) can be used to describe and cross-correlate data
regarding the network and the IT resources in a unified way, enabling automated and
36

cognitive application service provisioning as demonstrated by the test examples reported
in [67], [68], [69].
3.1.2 Scalable standard hardware nodes
Current communication networks are built on very specialized network elements
with bespoke hardware and software architectures specifically developed to provide the
best performance/cost ratio for the particular function they are meant to represent. This
results in an exceedingly heterogeneous selection of network elements where each node
can only provide the function it was originally designed for and any new service that
requires new functionality typically necessitates the deployment of new specialized types
of hardware.
IT processes today are embracing a very different paradigm where services are de-
ployed as VMs running on standard hardware resources, either on site or in the cloud.
This scheme allows an IT organization to respond much faster to evolving needs and to
reach higher usage rates of its computing resources.
The idea of extending this flexibility to Telecommunications networks is getting a
growing attention, even more when looking at a deeper integration of processing, storage
and networking resources. This is still lacking today as networks are mostly based on spe-
cialized hardware nodes. Until recently, processor-based network equipment was typically
designed around a heterogeneous system concept, in which the networking control plane
ran on one processor architecture ( e.g., x86 architecture processors) while the data plane
executed on a different architecture, such as a multi-core MIPS platform, with specialized
network acceleration features.
In order to benefit from the level of performance attainable with such a system, one
37

would accept the additional inflexibility resulting from heterogeneous software architecture
as well as the complexity associated with the integration and maintenance of two different
code bases. Clearly, this is not an ideal solution, and a unified system architecture, in which
the control plane and data plane run on the same processor architecture while achieving
the necessary cost-performance targets, is preferable for several reasons: scalable node
development, development and integration is simplified; processor resource utilization is
improved because the control plane and data plane can be distributed among cores with
greater flexibility; and software maintenance is much easier with a common code base and
a single programming environment.
Virtualisation enables operation of multiple VMs, each containing a guest Operating
System (OS) and its associated applications, on the same physical board. The coexistence
of multiple OSs is made possible by a software layer, known as a Virtual Machine Mon-
itor (VMM) or hypervisor, that abstracts the underlying processor cores, memory, and
peripherals, and presents each guest OS with what appears to be a dedicated hardware
platform. The hypervisor also manages the execution of guest OSs in much the same way
that an OS manages the execution of applications.
Virtualisation also provides a transition path for enabling innovative new designs
while maintaining legacy applications. Virtualisation makes the migration easier by allow-
ing the legacy applications to run in a shadow environment alongside new code, allowing
compliance testing of the new code in real time. The ability to support legacy and new
code on a single platform can also ease the regulatory compliance burden in Telecom ap-
plications. Telecom Equipment Manufacturers (TEMs) can add new features on one VM,
while a legacy application runs unchanged in its own VM. Because the legacy applications
run unmodified, it is significantly easier to recertify them.
38

TEMs can also look to virtualisation to help them take advantage of multi-core
processors. Many systems require reuse of legacy code written for a single-core processor.
Reworking this code for multi-core execution is often impractical. In the Telecom industry,
most TEMs have significant investments in validated, single-threaded code. This code is
typically irreplaceable, and in some cases only exists in binaries that cannot be modified.
Virtualisation makes it possible to run multiple instances of this software on the same
processor, each within its own VM, leading to significant improvements in cost, power,
and size.
Recent generations of Intel R©, Xeon R©, CoreTM and AtomTM processors provide the
networking performance necessary to enable their use as a unified platform for converged
networking equipment, especially when combined with high-performance packet processing
software from the Intel R©Data Plane Development Kit (Intel R©DPDK). Each of the above
processor families (specific versions) also supports accelerator technology that improves
virtualization performance.
3.1.3 Global controller
The Global controller, based on the service requests and the Edge ICT Fabric states,
has to compute how to direct traffic flow, routed by nodes, through these computing
elements for additional processing (e.g. VMs) to execute the required services (e.g. L4-L7
middle-box network functions).
Efficient methods are required to create optimal said paths and Edge ICT Fabric-
resource allocations under continuously changing conditions. The latter involves: i) situ-
ations in which moving users need that required data and services/network functions are
moving with them, as well as ii) situations of elastic service requests where resources need
39

to scale up or down to meet the customer’s demand.
These type of problems require efficient and dynamic reallocation mechanisms for
both network and processing resources (involving path computation/traffic engineering).
In addition it is necessary to design and implement scalable and dynamic discovery, control,
and communication framework. This framework should enable the controller to exert its
control over the edge devices, and facilitate state collection.
The discovery function is the infrastructure which the Global Controller uses to get
an up to date image of the available edge assets. The discovery mechanisms will allow
edge devices to join the resource pool and register their assets (i.e. resources, data and
services) as candidates for utilization. Object registration and resource discovery products
will be stored in a distributed data store.
The framework will implement scalable and efficient communication channels that
will allow the Global Controller to manage and coordinate the edge devices. For this
purpose we envision communication forms like a scalable membership service, an attribute
replication service, as well as message queues, scalable publish-subscribe, and converge cast
services.
An additional scope of this framework is to support the implementation of a robust
controller cluster that is cloud ready, consistent, and immune to failures. The framework
will be distributed and highly elastic, in order to serve the uniform growth from small scale
to large scale systems. It will be based on peer-to-peer technologies that will instantiate
overlay communication topologies congruent with the varied network topologies that the
edge devices are embedded in.
40

3.1.4 Service provisioning
Service provisioning will require methods for efficient service provisioning of net-
working and processing resources in distributed settings. The crucial challenge of this
issue is to translate higher-level constructs or primitives resulting from resource alloca-
tion/optimization mechanisms into lower-level instructions and configurations.
Provisioning logic can be split into two parts: i) primitives for individual data
plane and processing elements of Edge ICT Fabrics, and ii) primitives for coordinated
provisioning of several distributed Edge ICT Fabrics. This will enable programmability of
forwarding functions, middle-box functionality such as fire-walling, Deep Packet Inspection
(DPI), or more advanced services such as for content delivery (CDN).
For these purposes, the provisioning functionality could rely and further build on
the communications framework provided by the Global controller. A provisioning program
could consist of a set of higher level primitives describing network and resource configu-
rations. This program can be executed by a run-time environment which translates them
into lower-layer instructions such as OpenFlow, middle-box primitives, etc. Part of the
program remains running in the run-time environment to react to events which lower-level
elements such as network switches or middle-boxes are not able to handle (for example
packets for which no OpenFlow entry can be found, or events which cannot be processed
due to lack of resources).
The provisioning program can react on these events by, e.g., installing new rules,
or reserving additional resources. The role of the run-time environment is to ensure that
these high level provisioning program abstractions are correctly translated and executed
into lower-level actions. Such an architecture will allow provisioning of elastic services on
41
top of distributed Edge ICT Fabrics, based on allocation schemes designed for the Global
controller.
3.2 Use cases in Edge Networks
Some selected use cases show the key potential for using SDN and NFV to improve
the quality of the applications for end users, to increase business opportunities and also to
enhance the market for value-added SPs. These trends will be coupled with the economic
drive given by a myriad of new players entering the telco/ICT markets. These factors
are expected to impact the economic market in a way that will drive investment outside
of the network infrastructure boundary and stimulate the advent of new communications
paradigms [70]. The edges of the networks will be transformed into complex Micro Data
Center consisting of a number of diverse and autonomous, but inter-related nodes, devices,
machines: this will create a “complexity” which has to be managed and controlled [64].
The network functions and services will be exposed, as opposed to being hidden as
they are currently. They will be executed in VMs running mostly in these Micro Data
Center at the edge of the network, closer to the end users and customers, and partly in
VMs that are in mainstream Data Center. The orchestration and management should
be ensured by a system which knowing both infrastructure and network “states”, will be
capable of optimizing configurations on the distributed nodes.
Figure 3.3 presents an overview of a Future Network architecture that encapsulates
these Micro Data Center at the edge of the network, connected by high throughput optical
links and core routers to large DCs.
This Future Network architecture is being planned for the following three telco use
case examples. Such use cases have as a foundation the Future Network with Micro Data
42

Dynamic(alloca+on(and(orchestra+on(of(network(func+ons
Data$CenterData$Center
CoreRouter
CoreRouter
CoreRouter
CoreRouter
MicroDataCenter
Core(Network
CPE
Fixed(and(Radio(Access(Nodes
EdgeNetworks
MicroDataCenter
MicroDataCenter
MicroDataCenter
Figure 3.3: Evolutionary network scenario: Edge Networks
Centers at the edges of the network and DCs in the network, combined with virtualised
Software Defined Networks. For these use cases to be deployed it is necessary that the exe-
cution of the network functions and service elements are dynamically allocated somewhere
in the physical network and executed by virtual resources.
3.2.1 Provisioning of services across Edge Networks
A SP may want to provide end-to-end ICT services to end users who are attached
to Edge Networks even if belonging to different NPs. This could be achieved by operating
an overlay platform capable of hooking, managing and orchestrating all the virtualised
resources and functions made available by the different network providers.
3.2.2 “Harnessing” storage and computing idle resources at the edge
Daily there are plenty of idle or less utilized resources in networks and services
platforms. Harnessing these idle resources could allow optimizing CAPEX, whilst adopt-
ing new business models. Obviously not all services could be provided by using idle
43

resources: examples of provisioned services will be CDN-like services, content sharing,
data collections, aggregation, transformation, optimal re-distribution of VMs across the
set of networks and servers and providing stabilization of the local networks following
electricity demand-response loops, etc. Also in this use-case a platform is necessary for
virtual resources and functions monitoring, allocation and move.
3.2.3 Follow-me personal data and services
Data and ICT services (seen as apps executed as sets of VMs) will follow the users
when they are moving from one network attachment point to another one, even across
different edge networks. Management and orchestration capabilities should allow this
“follow-me” service whereby these VMs will be moved seamlessly. Moreover, data and
services associated to users can be even federated to build distributed virtual DCs at the
edge at costs which are a small and a fraction of traditional clouds.
3.3 Socio-economic issues and business models
In the near future the edge will look like a distributed network processing architec-
ture, deeply integrating processing, storage and networking resources. This will impact
dramatically future networks evolution. Technology and business developments will be
more and more strictly intertwined in the future. Obviously, a certain technology will be
adopted not only if it is advantageous (reducing costs) and trusted but also if it will be
able to enable desired business ecosystems (with the related foreseen business models);
on the other hand, newly designed potential ecosystems will look for enabling solutions
and technologies capable to bring them into reality. The introduction of this increased
functionality at the edge opens up opportunities to execute network functions and ap-
44

plications closer to the customer increasing his quality of experience, offloading network
traffic and device functionality. Additionally this will increase the reach of applications
allowing an even smoother deployment of high end applications on a worldwide scale with
the constraints mainly imposed by the edge ICT fabric. Of course the advent of new appli-
cations and the success of the functionality installed at the edge will be depending on the
economics of the applications installed and running on this edge. Indeed, the impact of
the price for using the functionality at the edge will be an important aspect here. However
the ecosystem and potentially additional incentives and pricing schemes could prove at
least as important. Installing the functionality at the edge involves new investments in
both software and hardware and as well in the training and equipment at the developer’s
side. For a developer to step into this approach, he will also need to have a clear view on
the costs associated to using each of the new functionalities at his disposal. Setting the
price from a provider point of view will be a task involving typical investment modelling,
simulation and analysis. Checking the profitability of an application developer will use
this pricing in a dedicated investment analysis.
As already touched upon, the use of ICT functionality at the edge will most probably
have an impact on the load of the access, metro and core network as well as on the
device constraints at the customer side. It will open up a huge field of opportunities to
develop and distribute applications and open the market at this point to new players. It
is mandatory to tackle any economic calculation in such context in a multi-actor manner
in which the full business model and ecosystem is taken into account in the calculation
of one actor’s business case. Adding this business model view on top of the previously
mentioned detailed investment analysis for edge ICT and application providers is the key
to understanding the impact of edge ICT and creating a successful business model for it.
45
Chapter 4
Reference model for virtual networks
Highly dynamic networks are network environments where nodes and links are reg-
ularly added or removed at short notice. Dynamic networks include virtual networks,
logical networks, cloud computing networks, mobile ad-hoc networks, sensor networks and
the IoTs. Such environments are within the context of Future Networks and the man-
agement/monitoring of infrastructures is today an important research field. In fact, such
distributed infrastructures need to be self-organized in order to match not only the re-
quirements of end users and network managers but also the constraints of the network
infrastructures, including dynamic topologies such as networks of mobile users and virtual
networks with “migratable” virtual machines.
A well-known dynamic network contexts are virtual networks. Virtual network is a
collection of virtual nodes connected together by a set of virtual links to form a virtual
topology. In such networks, links and nodes may be reconfigured quickly and may be,
for example, powered down to save energy or the node may be redeployed to a different
logical area of the network. On the other hand, virtual nodes may be brought online to
deal with resources which are near their limits for bandwidth or CPU power. They are
46

Figure 4.1: A sample model of virtual network
characterised in the literature either as a main means to test new Internet architectures or
as a critical component of Future Networks. In this context, especially in virtual resource
management, the virtual network description plays a key role in virtual resource discovery,
selection and provisioning process.
4.1 Model definition
In virtual environments, the network resources include node, link, interface, and
path. Each network element can be virtualised into multiple sub-elements. For example,
(i) a physical node can be virtualised as one or more virtual nodes such as virtual routers,
virtual switches or VMs running applications; (ii) a physical link may be contain multiple
virtual links with different bandwidth; (iii) one or more multiple physical/virtual interfaces
may connect to a physical/virtual link. An simple model of network virtualization is shown
in Figure 4.1.
Generally speaking, a virtual network can be represented by a graph G = (V, E),
where V is the set of virtual nodes (vertices) and E is the set of virtual links. Virtual
links can have a direction, but here we are only going to consider undirected links. A
virtual node can transfer virtual information to another virtual node in the form of data-
47

packets if there is a virtual link between them. If there is no direct virtual link between
virtual nodes, then a path in the network is the sequence of distinct virtual nodes visited
when transferring data-packets from one virtual node to another. The degree k of a
virtual node is the number of virtual links which have the virtual node as an end-point, or
equivalently, the number of nearest neighbours of a virtual node. The degree of a virtual
node is a local quantity, however, the virtual node degree distribution of the entire network
gives important information about the global properties of a network and can be used to
characterise different network topologies (in the rest of this Chapter, virtual nodes and
virtual links will be denoted as nodes and links, respectively).
The binding elements between the topology and the traffic dynamics are the routing
mechanisms. The path that a packet follows when travelling the network is determined
by the routing algorithm. A packet travels through the network visiting different nodes.
If one of the nodes is busy, the packet is stored in the queue at that node. Eventually, as
the node serves its queue, the packet is forwarded toward its destination. Usually longer
routes and/or congested queues mean longer delivery times. The routing algorithm tries
to reduce the packet delivery time by selecting short, lightly utilised routes. In such a
network, the traffic characteristics are not drastically changed as the packet transverses
the network. The delivery time for a packet from its source to its destination is finite. As
the load increases, the delivery time will typically increase accordingly. There is a critical
load where the delivery time diverges, or at least increases dramatically. At this point the
network is congested.
The statistical properties of packet traffic can be described by a model where the
traffic input is Poisson-like where the auto-correlation decays exponentially fast. Traffic
with this decay property, of which the Poisson type is a particular example, is referred to
48

as having Short Range Dependence (SRD). From studies carried out in the early 1990’s [72]
it is known that Poisson-like models do not capture all the statistical properties of packet
traffic. Packet traffic exhibits spurts of activity over a large number of time scales. These
bursts last from milliseconds to days and they look similar independently of the time scale.
This phenomenon is known as self-similar traffic. One characteristic of this self-similar
traffic is that it has Long Range Dependence (LRD), i.e. the traffic is strongly correlated
at all time scales of engineering interest. This observation was a surprise as, previously,
the properties of packet traffic were described as SRD processes. The packet delivery time
is the time that elapses between the creation of a packet at its source s, to the arrival at
its destination d. This time is known as the end-to-end time, packet lifetime or latency.
The following subsection describes the LRD statistic used to model the data traffic
in virtual networks.
4.1.1 Long Range Dependence
The statistical nature of LRD traffic is formally defined in [73]. A key requirement
is that the autocorrelation of packet traces γ(k), where the lag is k, satisfies a power
law decay of the form γ(k) ∼ Ck−β where β ∈ (0, 1) and C is constant. Equivalently,
γ(k) ∼ Ck−2−2H , where H = 1 − β/2 ∈ (12 , 1) is the Hurst parameter. By comparison,
Poisson-like traffic has an exponential rate of decay γ(k) ∼ C ′α−k with α > 1 and C ′
a constant. The Hurst parameter distinguishes between LRD traffic for H ≈ 1 and the
onset of SRD traffic for H ≈ 1/2, when the autocorrelation decay changes to exponential.
The effect of scaling is shown for Figure 4.2(a) long-range dependent and Fig-
ure 4.2(b) short-range dependent traffic for a time series of a random variable Xn, n =
0, 1, 2, .... The data is averaged in batch sizes of N = 100.
49

The standard deviation in the Poisson traffic varies as the square root of the batch
size, or magnification, and we see a “smoothing” of the traffic as N increases in Fig-
ure 4.2(b). Thus the mean is an increasingly effective indicator of the instantaneous load,
i.e expected packet rate, in the traffic. By comparison, for LRD traffic, we see that the
variation around the mean remains relatively high for large N in Figure 4.2(a). Even
when averaged over longer time intervals by several orders of magnitude, we can still
obtain packet rates which are close to 0 and 1.
One of the consequences of LRD traffic is that it increases queue lengths and latency
dramatically. The length of a queue fed with LRD traffic sources decays as a power law,
compared with an exponential decay if it is fed with Poisson traffic sources. The effects of
LRD cannot be “removed” by a control mechanism and LRD needs to be allowed for, both
in computer models of network behaviour and in the routing algorithms used to control
data flow through networks.
(a) LRD traffic (b) SRD traffic
Figure 4.2: The batch averages of packets/unit time for (a) a real LRD traffic trace and
(b) a Poisson-based trace for the same load, for sizes N = 100.
50
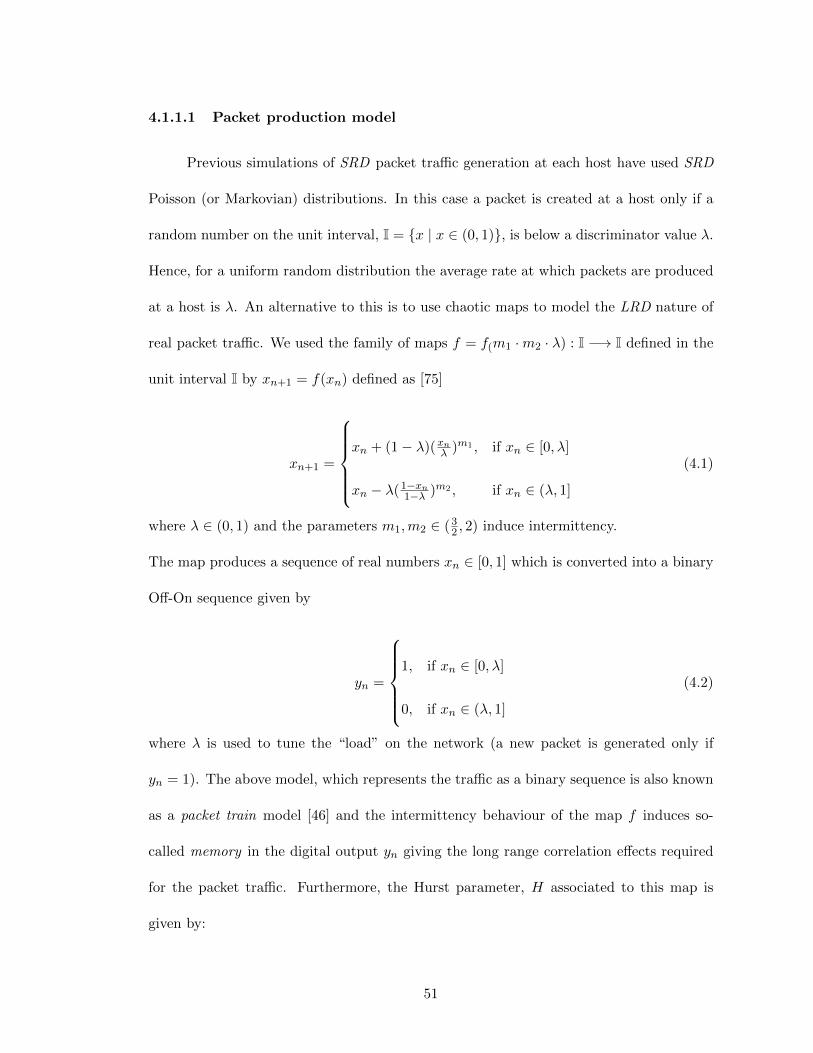
4.1.1.1 Packet production model
Previous simulations of SRD packet traffic generation at each host have used SRD
Poisson (or Markovian) distributions. In this case a packet is created at a host only if a
random number on the unit interval, I = {x | x ∈ (0, 1)}, is below a discriminator value λ.
Hence, for a uniform random distribution the average rate at which packets are produced
at a host is λ. An alternative to this is to use chaotic maps to model the LRD nature of
real packet traffic. We used the family of maps f = f(m1 ·m2 · λ) : I −→ I defined in the
unit interval I by xn+1 = f(xn) defined as [75]
xn+1 =
xn + (1− λ)(xnλ )m1 , if xn ∈ [0, λ]
xn − λ(1−xn1−λ )m2 , if xn ∈ (λ, 1]
(4.1)
where λ ∈ (0, 1) and the parameters m1,m2 ∈ (32 , 2) induce intermittency.
The map produces a sequence of real numbers xn ∈ [0, 1] which is converted into a binary
Off-On sequence given by
yn =
1, if xn ∈ [0, λ]
0, if xn ∈ (λ, 1]
(4.2)
where λ is used to tune the “load” on the network (a new packet is generated only if
yn = 1). The above model, which represents the traffic as a binary sequence is also known
as a packet train model [46] and the intermittency behaviour of the map f induces so-
called memory in the digital output yn giving the long range correlation effects required
for the packet traffic. Furthermore, the Hurst parameter, H associated to this map is
given by:
51

H = 1− β
2=
3m− 4
2(m− 1)(4.3)
where β = 2−mm−1 ∈ (0, 1) and m = max {m1,m2} with m1,m2 ∈ (32 , 2). Thus m1,m2 = 1.5
corresponds to Poisson-like behaviour and as m1 and m2 increase towards 2, the behaviour
is increasingly LRD as proved in [74] (e.g. in our model m1 = 1.95 and m2 = 1.95).
4.2 Topology models
The way that the elements of the network are connected to each other and the nodal
degree properties have an impact on its functionality. As said previously, the representa-
tion and study of the connectivity of a network is carried out using concepts from graph
theory. A path that goes from source node s, to destination node d, in the smallest number
of hops is called the shortest-path. The length of the shortest-path ls,d is the number of
nodes visited when going from s to d. There can be more than one shortestpath between
a pair of nodes. The characteristic path length l is defined as:
l = 1− 1
N(N − 1)
∑s∈V
∑d6=s∈V
ls,d (4.4)
where N is the total number of nodes, is the average shortest-path over all pairs of nodes.
Sometimes, l is referred to as the diameter of the network.
In a network, there are nodes that are more prominent because they are highly
used when transferring packet-data. A way to measure this “importance” is by using the
concept of betweenness centrality of a node. We will refer to this concept here as medial
centrality. Given a source s, and destination d, the number of different shortest-paths is
g(s, d). The number of shortest-paths that contain the node w is g(w, s, d). The proportion
52

of shortest-paths, from s to d, which contain node w is defined as:
ps,d(w) =g(w, s, d)
g(s, d)(4.5)
Remark: The proportion of shortest-paths and the shortest-path length are related by
ls,d =∑w∈W
ps,d(w)− 1 (4.6)
where W is the set that contains the nodes visited by the shortest paths from s to d. The
medial centrality of node w is defined as
CB(w) =∑s∈V
∑d6=s∈V
ps,d(w) (4.7)
where the sum is over all possible pairs of nodes with s 6= d. The medial centrality measures
how many shortest paths pass a certain node. A node with a large CB is “importance”
because a large amount of packets flow through it, that is, it carries a large traffic load.
If this node fails or gets congested, the consequences to the network traffic can be very
drastic. The following subsections describe some interesting regular structures and no
regular structures.
4.2.1 Regular symmetric networks
In a regular network all nodes have the same degree. By symmetry, the medial
centrality is constant for all nodes.
4.2.1.1 Toroidal networks
The toroidal rectangular network (H) is based on a square lattice of nodes in which
each node has four neighbours with boundary nodes appropriately identified. The finite
53

rectangular lattice Z consists of N = L2 nodes. The position of each node in the lattice
is given by the coordinate vector r¯
= (i, j) where i and j are integers in the range 1 to L.
The network has periodic boundary conditions throughout, and so each coordinate of (i, j)
is effectively reduced −mod(L + 1) to give a toroidal topology. To measure the distance
between a pair of nodes the periodic “Manhattan” metric is used, which measures the sum
of vertical and horizontal displacements between two nodes.
4.2.1.2 Hypercube networks
Hypercube networks play an increasingly important role in global communication
operations, interconnecting networks of microcomputers in parallel and distributed envi-
ronments [76], [77].
Generally speaking, an n-dimensional p-ary hypercube consists of pn nodes. Each
node has n nearest neighbours. Nodes are labelled using base-p numbers, and it is assumed
that any two nodes i and j are connected via a bidirectional link if their labels differ in
exactly one coordinate position, i.e. Node (xn−1, xn−2, ..., xi, ..., x0)base−p is connected to
Node (xn−1, xn−2, ..., xi, ..., x0)base−p if (xi 6= xi), 0 ≤ i < n [79]. Here we will focus
on a binary hypercube topology where p=2. Such a structure can be associated to a
graph G(V,E) in which [78]: a) V has 2n vertices; b) every vertex has degree n; c) G
is connected; d) any two adjacent nodes A and B are such that the nodes adjacent to A
and those adjacent to B are linked one-to-one. Note that it is possible to map the n-D
hypercube topology onto a 2 − D mesh topology using Gray Code, modelling this kind
of problem in graph-theoretical terms as that of a graph embedding [78]. In the nominal
case a binary hypercube topology with n = 4, in Figure 4.3(a), is mapped onto the L×L
mesh with L = 4 shown in Figure 4.3(b).
54

(a) 4-D hypercube (b) 4-D hypercube into a 2-D mesh
Figure 4.3: 4-D hypercube mapped into a 2-D mesh using Gray Code
4.2.2 Random network
Random networks have been used to model communications networks. The reason
is that because some of the communication networks tend to have a complex topology and
the interactions defining their structure are apparently random.
From a set of nodes, a random network is built by connecting every pair of nodes
with probability p. If the total number of nodes is N and if p > 1/N then, with probability
1, the network is fully connected, or equivalently, there is at least one path connecting any
pair of nodes. This is the only case we are going to consider here, as we are interested in
connected networks. The degree distribution of a random graph is well approximated by
a binomial distribution [80]:
P (k) =
(N − 1
k
)pk(1− p)N−1−k (4.8)
The degree distribution tends to be concentrated around some “typical” node degree, or
average node degree k.
55

4.2.3 Scale-free networks
Many technological networks are not described by a random or a regular network;
instead they are better described by a network where the degree distribution is described
by a power law where
P (k) ∼ Ck−β (4.9)
for β > 1 and C constant. The probability that a node has k edges connected to it is
given by P (k). In practical terms a power law distribution means that the majority of the
nodes will have very few neighbours, but there is a very small set of the nodes with a very
large number of neighbours. Networks with this property are known as scale-free because
power-laws are free of a characteristic scale, that is, there is no characteristic node degree.
4.3 Virtual network model
Here we consider the model described in [81], which has been previously studied by
several authors. The model consists of two types of nodes: routers (that store and forward
packets) and hosts (that are also sources of traffic). Assuming the network has N nodes
and a density ρ ∈ [0, 1] of hosts then ρN is the number of total hosts and (1 − ρ)N is
the total number of routers. We suppose for the sake of simplicity that host nodes are
randomly distributed in the network. The network model considered in this paper consists
of the following key components:
1. Traffic generation model : a packet is generated at a host using either a uniform
random distribution (Poisson-like) or a LRD distribution defined by a chaotic map.
Each source generates its traffic independently of the other sources; the traffic load
56

is increased or decreased by varying the probability of packet generation at each
node [74], [82]. A random destination is assigned to each newly generated packet.
The destination node is selected with uniform probability among all other hosts in
the network.
2. Buffer size: each node keeps a queue of unlimited or limited length where the newly
generated packets or those waiting to be routed are stored. Any packets that is
generated is put at the end of the host’ s queue. If a packet arrives at a router
is stacked at the end of the router’s queue. Packets at the head of each queue,
exceeding its maximum capability, are dropped. The packets are removed when
they arrive at their destination site.
3. Routing algorithm at every time-steps: each node picks a packet at the head of its
queue and forwards the packet to the next node. The information that each packet
carries about its source and destination is used by the following routing algorithm
as follow. i) A neighbour closest to the destination node is selected. ii) If more than
one neighbour is at the minimum distance from the destination, the link through
which the smallest number of packets has been forwarded is selected. iii) If more
than one of these links shares the same minimum number of packets forwarded, then
a random selection is made.
The process of packet generation, hop movement, queue updating and updating of the
routing table occurs at each time step.
57

4.4 Topology impact on network functionality
In this section we consider networks with different topologies generated using the
most appropriate algorithms. For example, we use Erdos-Renyi (ER) algorithm to generate
a random network and the static model introduced in [84] to generate scale-free topologies.
Furthermore, square lattices with periodic boundary conditions are also considered. Using
the network model and traffic generator detailed above, simulations were carried out to
analyze various aspects of the end-to-end performance for each different type of network.
In all cases, the network size was set to N = 256 nodes and the host density to ρ = 1.
In Figure 4.4(a) average lifetimes are plotted versus the load for the four cases
with LRD traffic sources at each host. Here the average lifetime is simply the average
time spent by packets in the network. The load is computed as the average number of
packets produced by each traffic source per time step of the simulation. Figure 4.4(a)
confirms that, as pointed out in [84], [74] the network topology is indeed a very important
factor. In fact, a regular lattice network has longer lifetimes than a scale-free network. In
Figure 4.4(b) the same measurements are made with Poisson traffic sources substituted for
LRD sources. When the traffic sources act following a Poisson distribution we notice a less
pronounced influence of the network structure, confirming the importance of selecting the
traffic generation model. Note that the hypercube network presents shorter lifetimes than
regular lattices and even scale-free networks. Figure 4.4(c) shows throughput plotted as a
function of the traffic load. The throughput is defined as the number of packets reaching
their destination per unit time per host. Results are consistent with those for the average
lifetime. The scale-free network performs more efficiently for both types of algorithm. We
observe that the hypercube topology presents a higher throughput than that of a square
58

regular lattice. Similar behavior is observed for Poisson sources (Figure 4.4(d)). It is
worth mentioning here that in both cases, the hypercube network structure was found
to present a performance which is better than a regular square lattice but also combines
(a) LRD source (b) Poisson source
(c) LRD source (d) Poisson source
Figure 4.4: Average lifetime and throughput versus the generation rate λ. A LRD traffic
source is used to generate panels (a) and (c) while a Poisson traffic source for panels (b)
and (c). The number of nodes is N = 256 and host density ρ = 1. Network considered
are: square lattice with periodic boundary L×L with L = 16; Erdos-Renyi (ER) random
networks with p = 0.1; scale-free network with γ = 3; hypercube network with N = 216 =
256 nodes.
59

the beneficial effects of other topologies such as scale-free and random networks when the
average lifetime is considered. This effects is even more pronounced when a more realistic
LRD traffic generation model is considered.
In addition to the above analysis, we consider the throughput as a performance
indicator measuring its change in the presence of different types of attacks. In this context,
an attack is considered as a general strategy to power down nodes for different goals
(for example for energy saving). In particular, two types of attacks are considered:(ii)
intentional attacks where nodes with the highest degrees are removed from the network;
(ii) random attacks where nodes selected at random are removed.
Figure 4.5(a) and Figure 4.5(b) show the throughput measured for different net-
works (such as square lattice, random, scale-free and hypercube topologies) in presence of
intentional and random attacks as a function of the time k. We next look at the effects of
attacks on the same networks assuming that nodes are removed intentionally or at random
(a) Intentional attacks (b) Random attacks
Figure 4.5: Effects on throughput of intentional (a) and random (b) attacks node for
different types of networks
.
60

when k = 200. As expected we note that intentional attacks have a much higher effect
on the overall network performance. Further, we observe that hypercube networks show
much higher resilience to intentional attacks than scale free networks, again combining
some of the beneficial, features of different network structures.
61

Chapter 5
Orchestration of logical resources in SDIs
The diffusion of ultra-broadband (in terms of high bandwidth and low latency)
connection, IT hardware advances, and growing availability of open-source software are
causing a paradigm shift in the world of network architectures [1]. In last years, the number
of devices and smart-objects connected to the network has grown exponentially and the
so-called “machine intelligence” has take part in the life-cycle of industries, agriculture,
smart cities and eventually public institutions. In this context, the initiative to integrate
heterogeneous networks, including wired/wireless networks and smart-objects, from both
the service, management and control viewpoints is considered as a critical aspect of Future
Networks [2].
The effect of all these drivers is the so-called “Softwarization” of telco infrastruc-
tures [3], where the approach to this challenge is through the deployment of a network
infrastructure supporting software-driven network features that can be instantiated on-
demand. These instantiations will be addressing the changing service requirements and
resource constraints, yet scalable across multiple services and multiple domains, that can
maintain QoS for end-users of a service, and that provide a level of isolation and security
62

from one service to another.
Research and development activities are clearly focused on several concepts: pro-
grammable networks, NV, open interfaces and platforms, and increasing degree of intelli-
gence inside the network. The next generation of SDI needs to move from being merely
Defined by software to be Driven by software and must be capable of supporting a mul-
titude of players that exploit an environment in which services are dynamically deployed
and quickly adapted over a heterogeneous physical infrastructure, according to changing
requirements.
The integration of the Internet, software technologies and traditional telecommu-
nications and communication technologies, has been always a challenge for network and
service operators, as far as service deployment and management [6], [9], [10] is concerned.
Soft-approach based on SDN and NFV should cope with heterogeneous environments
providing an uniform view (virtualisation) of different technological networks and compu-
tational resources. The research challenge to asses this view with special emphasis on the
wired environments are described in next sections.
5.1 Mechanism for controlling virtual resources
One of the main challenge includes the design and the implementation of specific
mechanisms for run-time orchestration of logical resources in SDIs, considered for rep-
resentative wired environments. A major aspect for this challenge is the development
of technology-specific methods that enable the provisioning of virtual networks and stor-
age/processing resources over SDN substrate infrastructure. This include the creation,
configuration and tearing-down of virtual resource components, considering both net-
working and computational/storage resources. By using NFV, networking resources can
63
be re-allocated according to changing network conditions or service demands. Addition-
ally, this challenge considers the development of autonomous actions that provide virtual
network stability, performance and optimizations even absence of higher-level control.
These include, for example, virtual resource remapping in case of resource scarcity, in-
creased resilience through transparent resource migration in case of hardware failure or
energy saving using adaptive virtual resource consolidation.
5.1.1 Resource Orchestrator
The issue of the logical resource orchestration (including network functions and ser-
vices) raises several research challenges. Resource orchestration should be supported by
a centralised software entity (the Resource Orchestrator – RO), whose overall goal is to
ensure successful hosting and delivery applications by meeting QoS of service applica-
tion owners (e.g. maximise availability, maximise throughput, minimise latency, avoid
overloading, etc.) and resource providers (e.g. maximise utilisation, maximise energy effi-
ciency, maximise profit, etc.) respectively. RO is responsible of a number of orchestration
operations (including resource selection, resource deployment, resource monitoring, and
resource control), which need to be programmed to control the resources at the design time
as well as at the run time for ensuring the fulfilment of QoS objectives. Briefly stated,
these operations are:
• Resource selection (at the design and run time): an application analyses
candidate software resources to determine whether they can be selected for realizing
required functionality satisfying certain resource requirements and constraints (e.g.
inter-operability with other software resources, compatibility with target hardware
resources, cost, availability, etc.). Next, compatible hardware resources that can be
64

allocated to software resources are selected.
• Resource deployment (both design and run time): instantiating software
resources on IT infrastructure (or cloud service) and configuring them for commu-
nication and inter-operation with other software resources.
• Resource monitoring (run time): monitoring of QoS of applications involves
detection of event patterns (e.g. load spike) from information produced by deployed
resources (e.g., usage statistics).
• Resource control (run time): based on event pattern detection, a RO can react
to deviation in application behaviours and initiate (policy-based) corrective actions,
ideally without disrupting the run-time system. An example resource control oper-
ation could be to “move” an application by migrating it from small CPU resource
configuration to extra-large CPU resource for improving throughput.
Using such operations, the RO “governs” the behaviour of the system in response to
changing context and in accordance with applicable business goals and policies.
5.1.2 Resource deployment
Network function or service deployment is the general process of creating, configur-
ing, and starting new instances of particular network function or services on a particular
execution environment. Similarly, service termination is the reserve function of stopping,
destroying and removing instances and/or their corresponding environment.
To efficiently manage virtual network functions and services within a virtual net-
work, information on platform and execution environment to be necessary. In fact, for
deploying new instances, the RO needs to be aware of the availability of physical (or
65
virtual) resources. All detailed information of the underlying resources and their current
state are abstracted from the execution environment (monitoring operation).
One of the core aspects of network functions and service deployment is an efficient
resource placement. The goal of service placement is find where/which physical resources
to deploy service instances to achieve some high level objectives (such as minimizing energy
consumption or load balancing). Specifically, it means find where/which physical resources
to run VM instances according to a given placement algorithm. Generally speaking, VM
placement can be static or dynamic and a particular case of dynamic placement is live
migration described in next subsection.
5.1.3 Live migration
Programmable networks offer many advantages for the management of network func-
tions and services that may be executed as virtual network functions in an ensemble of
VMs dynamically placed into distributed platforms at edges of the network. This implies,
also, the possibility to move such VMs according to requirements and constraints of the
physical machines where they are hosted.
Conventional VM live migration involves the transfer of the CPU and memory state
as well as the storage data. However, storage data migration in WAN is still an important
challenge on which researchers are spending more efforts [85]. In the other side, the
live migration inter-data centers presents the problem to allow IP change; solutions like
tunnelling [86] and later-2 expansion [87] work around the problem of connection loss
due to a change of the IP address. Using OpenFlow VMs are allowed keep their original
IP addresses, maintaining all existing connections [88], [89]. Moreover, this protocol (i)
allows the mobility between the layer-2 and layer-3, (ii) allows a programmable SDN, and
66

(iii) network resources can be remotely configured, controlled and monitored. Therefore,
SDN-based solutions could improve management operations and performance as well as
enable the VM migration in intra and inter data centers [90], [91] Recent works [92], [93]
present a SDN architecture to enable the VM live migration and evaluate its performance.
Conventional VM live migration involves the transfer of the CPU and memory state
as well as the storage data. However, storage data migration in WAN is still an important
challenge on which researchers are spending more efforts [85]. In the other side, the
live migration inter-data centers presents the problem to allow IP change; solutions like
tunnelling [86] and later-2 expansion [87] work around the problem of connection loss
due to a change of the IP address. Using OpenFlow VMs are allowed keep their original
IP addresses, maintaining all existing connections [88], [89]. Moreover, this protocol (i)
allows the mobility between the layer-2 and layer-3, (ii) allows a programmable SDN, and
(iii) network resources can be remotely configured, controlled and monitored. Therefore,
SDN-based solutions could improve management operations and performance as well as
enable the VM migration in intra and inter data centers [90], [91] Recent works [92], [93]
present a SDN architecture to enable the VM live migration and evaluate its performance.
Generally speaking, the VM live migration involves several key factors such as the
VM memory size, page dirty rate, the network transmission rate and the migration algo-
rithm. The page dirty rate is the rate which the VM memory page change with. These fac-
tors and even more the migration algorithm used, can introduce relevant variations of the
migration performance. There are different techniques for the live migration [94], [95], [96]
that trade-off two important performance parameters: the migration time and the down-
time. Migration time refers to the time required to move the VM between physical hosts
while downtime is the portion of the time when the VM is not running. stop© [95] de-
67

signs halt the original VM and copy its entire memory to the destination. This techniques
minimise the migration time but suffers from high downtime as the VM is suspended dur-
ing the entire transfer. On the other side, on-demand [96] migration operates by stopping
the VM copy only essential kernel data to the destination. The remainder of the VM
address space is transferred when it is accessed at the destination. While this technique
has a very short downtime, it suffers from high migration time. Among the several tech-
niques used, the iterative pre-copy algorithm [97] minimizes the total migration time and
downtime than other algorithms used, such as on demand migration and the stop©.
Using an iterative approach, the hosted VM in the source physical machine can be kept
in an active state during the migration towards the new destination. Since the VM is
running, some memory pages are changed during the migration and must be re-sent. The
term “iterative” means that pre-coping occurs in several rounds and the data to be trans-
mitted during a round are the dirty pages generated in the previous round. The pre-copy
phase terminates if: 1) the memory dirtying rate exceeds the memory transmitted rate;
2) the remaining dirty memory becomes smaller than a pre-defined threshold value; 3)
the number of iterations exceeds a given value. After several rounds of synchronization, a
very short stop-and-copy phase is performed to transmit the remaining dirty pages. Then,
the VM is halted for the final state transfer and re-starts it in the new location.
5.1.4 Performance evaluation by using Stochastic Activity Networks
This section provides a formal method based on Stochastic Activity Network (SAN)
which aims to analyse the live migration performance of a single VM between two dif-
ferent physical hosts in the network. In particular, we introduce a generic model of a
Future Network infrastructure based on SDN and NFV principles. This generic model is
68

implemented by defining SAN sub-models and interfaces among them to share informa-
tion. Specifically, it intends to proof of the advantages that could gain NOs in adopting
the proposed modelling approach. In particular, our model intends to support the design
phase of the network infrastructure, providing a valid tool to define its features and con-
figuration parameters. Finally, such model could help SOs and NOs for the evaluating the
impact of the new technologies on the live migration, widely used as conventional method
for changing the placement of the VMs in the network.
5.1.4.1 Model description
This subsection describes our modelling approach in order to support the design of
a Future Network by defining a “generic” modelling framework for performance analysis
of the live migration. Our approach exploits the usage of the formal models, allowing
to create the overall model of the system under analysis in a well-structured way. We
adopt a component-based view of the network applying divide-et-impera techniques: the
overall system model is decomposed recursively into sub-models until reaching an atomic
sub-model. The effectiveness of this approach has been showed in [98] where a modelling
framework has been defined and then implemented exploiting the flexibility of the SAN
formalism.
Figure 5.1: Live migration algorithm model
69

The analysis of the VM live migration over a SDN requires to consider the en-
tire application field by modelling four different components: (i) the Controller, (ii) the
OpenFlow Switch, (iii) the VM –which are the traditional components in SDN – and (iv)
the VM Live Migration Orchestrator. This latter is a soft-component in charge of the
resources management and orchestration as well as for the starting and stopping of the
migration. This is argued by many efforts that the ETSI [99] is spending in this direction;
however, in this work, the capability of the orchestrator is limited to the triggering the
migration for a given VM. The implementation of the system has been realized using the
SAN formalism [100]. The choice of this approach is due to the great flexibility and power
in the modelling given by using such formal method. One of main advantages of the
SAN formalism is the possibility to map each component of the designed architecture into
“atomic” models. Component interfaces have been realized by sharing extended places,
which contain complex data structures used by atomic models to read and write shared
information.
Virtual Machine model (shown in Figure 5.3) consists of three main parts: (i)
the live migration algorithm (Figure 5.1), (ii) a trigger signal (Figure 5.2(a)), and (iii)
one part that represents the typical production and delivery of packets (Figure 5.2(b)).
The pre-copy algorithm executes in several rounds and each iteration is modelled using
the place Iteration. When a new iteration starts, a new token is added to this place.
The extended place VMSource is an input parameter set as the memory size of the hosted
VM into the source physical machine. VMDest represents the fraction of memory of such
VM that is transferred to the destination machine during the migration. The memory size
of the hosted VM into the source physical machine, the memory dirtying rate during the
migration and the elapsed time at each round are modelled as VMSource, DirtyPages
70
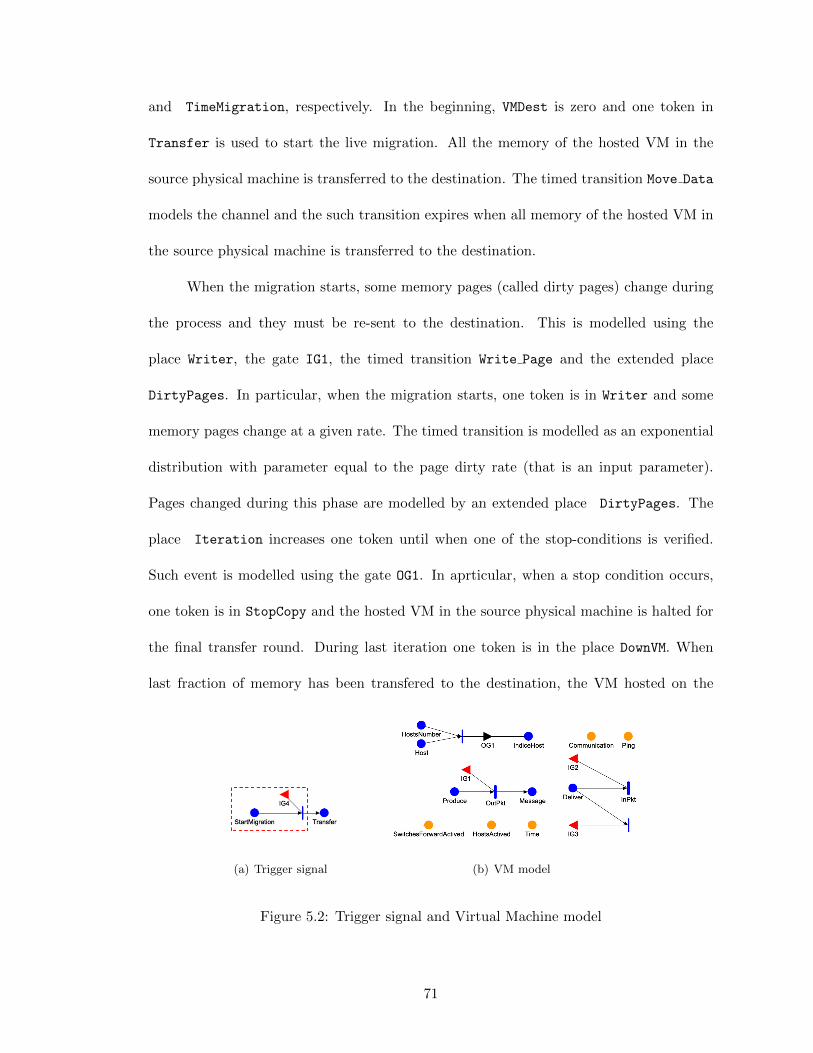
and TimeMigration, respectively. In the beginning, VMDest is zero and one token in
Transfer is used to start the live migration. All the memory of the hosted VM in the
source physical machine is transferred to the destination. The timed transition Move Data
models the channel and the such transition expires when all memory of the hosted VM in
the source physical machine is transferred to the destination.
When the migration starts, some memory pages (called dirty pages) change during
the process and they must be re-sent to the destination. This is modelled using the
place Writer, the gate IG1, the timed transition Write Page and the extended place
DirtyPages. In particular, when the migration starts, one token is in Writer and some
memory pages change at a given rate. The timed transition is modelled as an exponential
distribution with parameter equal to the page dirty rate (that is an input parameter).
Pages changed during this phase are modelled by an extended place DirtyPages. The
place Iteration increases one token until when one of the stop-conditions is verified.
Such event is modelled using the gate OG1. In aprticular, when a stop condition occurs,
one token is in StopCopy and the hosted VM in the source physical machine is halted for
the final transfer round. During last iteration one token is in the place DownVM. When
last fraction of memory has been transfered to the destination, the VM hosted on the
(a) Trigger signal (b) VM model
Figure 5.2: Trigger signal and Virtual Machine model
71
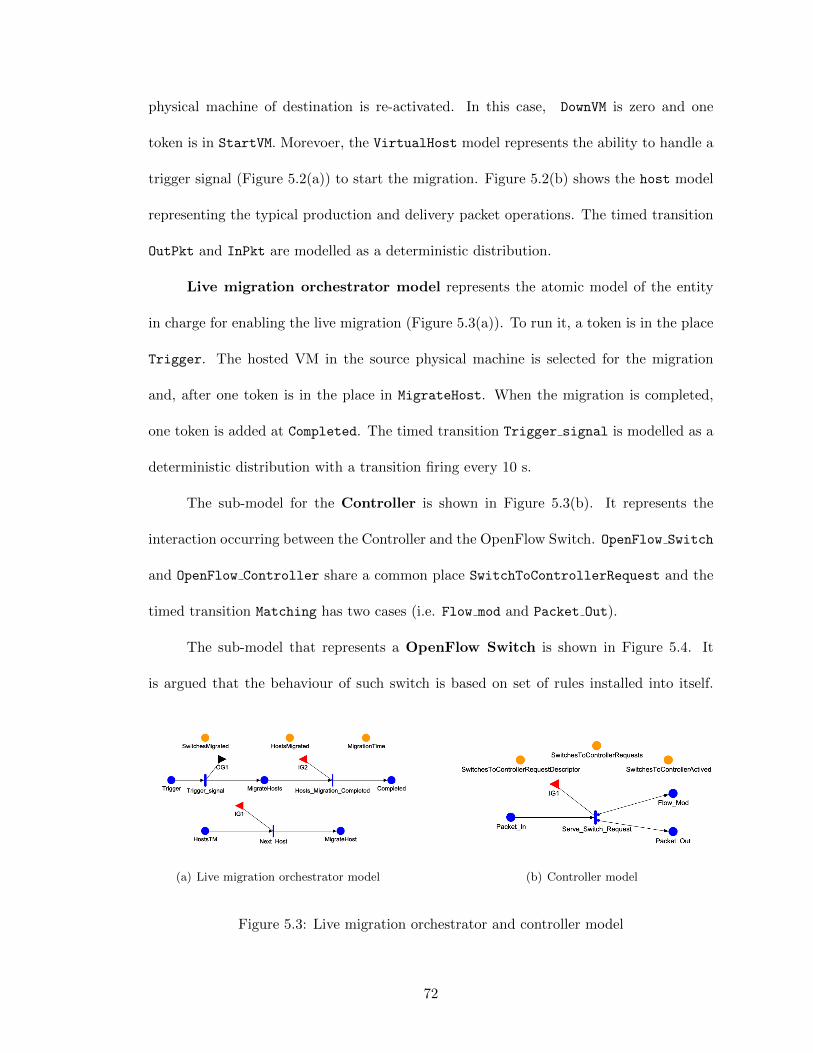
physical machine of destination is re-activated. In this case, DownVM is zero and one
token is in StartVM. Morevoer, the VirtualHost model represents the ability to handle a
trigger signal (Figure 5.2(a)) to start the migration. Figure 5.2(b) shows the host model
representing the typical production and delivery packet operations. The timed transition
OutPkt and InPkt are modelled as a deterministic distribution.
Live migration orchestrator model represents the atomic model of the entity
in charge for enabling the live migration (Figure 5.3(a)). To run it, a token is in the place
Trigger. The hosted VM in the source physical machine is selected for the migration
and, after one token is in the place in MigrateHost. When the migration is completed,
one token is added at Completed. The timed transition Trigger signal is modelled as a
deterministic distribution with a transition firing every 10 s.
The sub-model for the Controller is shown in Figure 5.3(b). It represents the
interaction occurring between the Controller and the OpenFlow Switch. OpenFlow Switch
and OpenFlow Controller share a common place SwitchToControllerRequest and the
timed transition Matching has two cases (i.e. Flow mod and Packet Out).
The sub-model that represents a OpenFlow Switch is shown in Figure 5.4. It
is argued that the behaviour of such switch is based on set of rules installed into itself.
(a) Live migration orchestrator model (b) Controller model
Figure 5.3: Live migration orchestrator and controller model
72

Figure 5.4: Open Switch model
Basically, if a rule matches an incoming packet, the forwarding decision is instantaneously
executed on the switch. Otherwise, if there is no matching rule, the switch asks the con-
troller for an action to execute. We model these events by using two cases associated to
the timed transition Serve switch request. For such transition a normal distribution
with a mean of 4µs and standard deviation of 101.43 has been used according to the
reference [101]. Moreover, Write Flow Entry, Output Action and Matching are mod-
elled as a uniform distribution with lower bound 4µs and upper bound 16.5µs. Finally,
FlowExpires is modelled as a normal distribution with mean 1 and standard deviation
0.2ms.
5.1.4.2 Simulation results
This section reports some results obtained by using Mobius tool [102], a software tool
for modelling the behaviour of complex systems. The modelling language is based either
graphical or textual representations supporting several modelling formalisms including
SAN, Markov chains and extensions as well as stochastic process algebras. Functionality
73

of the system can be defined as model input parameters, and then the behaviour of the
system can be automatically studied across wide ranges of input parameter values. In
particular, we use Mobius for the analysing and evaluating the VM live migration in SDIs.
To perform useful results, we evaluate the migration time and downtime by changing
the page dirty rate. Figure 5.5 shows the effect of varying the page dirty rate on migration
time and downtime for three different link speed values: 100 Mbps, 1 Gbps and 10 Gbps.
The memory size VM migrated experimentation is 1024 MB. This value is used for all
experiments. We observe an interesting relationship between page dirty rate and migration
(a) Migration Time (b) Downtime
Figure 5.5: Migration time and downtime versus page dirty rate
(a) Migration Time (b) Downtime
Figure 5.6: Migration time and downtime versus link speed
74

performance: specifically, such relationship is not linear this occur because of the stop
conditions defined in the migration algorithm. In line with some results presented in [97],
if the page dirty rate is below the link capacity, all modified pages are transferred in a
timely fashion resulting in a low migration time and downtime. In the other side, if the
page dirty rate starts approaching towards the link capacity, the migration performance
degrades significantly. Moreover, it is relevant to observe the impact of the link speed on
the live migration performance. Results have been obtained considering a page dirty rate
set as 300.000 pages/second. Figure 5.6 shows clearly that the migration performance are
influenced by link speeds; moreover such figure highlights that relationship between the
link capacity and the migration time is inversely proportional. Same consideration about
the relationship between the link capacity and the downtime.
5.2 Mechanisms for mapping virtual resources onto physical
resources
This challenge includes the design and implementation of specific algorithms for
an efficient mapping of virtual resources onto physical resources. Specific optimization
techniques are developed for efficiently mapping between virtual resources and physical
network infrastructure [104], [12]. The mapping takes into account the top-level service/-
operational requirements such as QoS requirement (e.g. minimizing network latency). By
addressing this challenge virtual networks are customized with optimally allocated capa-
bilities such as virtual nodes (with computing and storage capabilities), virtual links and
path for specific networked services.
Flexibility, programmability and ultra-low latency connectivity will be some of the
75

key challenges to enable new service scenarios. These requirements are important also from
a socio-economic perspective in order to make future Infrastructures sustainable from a
business viewpoint. In particular, this thesis focuses on one of said challenging require-
ments which is the ultra-low latency (e.g., units of ms) connectivity. This requirement has
been selected among the others (e.g., flexibility, programmability, security, dependability,
etc.) as capable of creating new service models (e.g., pervasive robotics). Next subsec-
tions are focused on the problem of minimizing end-to-end latency in a so-called SDI by
modelling a Network Function Chains with queuing systems. In particular, simulation
results on the end-to-end allocation of resources showed that the scheme allows achieving
the minimal end-to-end latency whilst minimizing at the same time the resources costs.
5.2.1 Network Function Chaining model
The reference scenario we consider in this paper is constituted by the topology
depicted in Figure 5.7, which represents a generic Telecommunications infrastructure.
Such topology can be divided in different segments: (i) Cloud Computing Cen-
tralized DC (in the rest of the paper will be denoted as Cloud DC), that provide high
computational and storage capabilities; (ii) Core network, composed by routers with high
speed WAN connections that forward the traffic from the aggregation nodes to the Cloud
Figure 5.7: Network Function Chaining
76

DC and vice versa; (iii) Edge DC, which consists of small Data Centres with processing
and storage resources interconnected by pervasive high speed wired and wireless links;
(iv) Access-Distribution network, which is constituted by the aggregation nodes, that
aggregate the traffic of thousands of Users (i.e. the Terminal). Considering the refer-
ence scenario described above, we model the network as a queuing systems. Specifically,
Access-Distribution network latency and Core network latency can be modelled using
M/M/1 queuing model with a single server and infinite buffer. We denote as D and H the
transmission capacity of the Access-Distribution network and Core network, respectively.
Moreover, the queue discipline follow a first come first served (FCFS) strategy. Terminal,
Edge DC and Cloud DC are modelled as distributed sites, generically called Data Centres,
and, also, we consider each of this site as computational unit, without looking into their
topology. Each DC consists of a scheduling server, a bunch of computing servers and a
transmission server. The capability of servers in each DCs depends of the number of jobs
or tasks processed in each of them, as depicted in Figure 5.8.
The scheduling server receives all coming requests, and then schedules these requests
to computing server. Computing server acts as the real processor, which receives tasks
Figure 5.8: Network Function Chaining model
77

from the scheduling server and then processes requests using their own resources. We
assume the latency of internal communications between the scheduling master and the
computing server is negligible. The weight of the scheduling server represents the requests
schedule rate; in particular we denote the scheduling server of the Terminal site, of the
Edge DC site and Cloud DC site as A, E and I, respectively. Instead, the weight of the
computing server represents tasks computation rate. We suppose there are N computing
servers for the Terminal site, for the Edge DC site and Cloud DC site denoted as Bi,
Fi, Ji, respectively. Also, we assume that each task is indecomposable and independent
with each other. After processing, all the service results are transmitted by a transmission
server, denoted as C, G and K for Terminal site, of the Edge DC site and of the Cloud DC
site, respectively. Finally, we introduce an additional queue with a transmission server L.
In each DC site, two consecutive arriving requests, the inter-arrival time is a random
variable, which can be modelled as an exponential random variable [106], [107], [108].
Therefore, the arrivals of the request follow a Poisson Process with arrival rate λ. In
each DC, we employ possibility random generation method as scheduling scheme, which
means the possibility pi of task requests sent to computing server i is randomly generated.
Thus, the arrival rate of scheduling requests to computing server i is piλ. According
to the decomposition property of Poisson process, the arrivals of task requests at the
computing server i in each DC follow a Poisson process with arrivals rate piλ. For each
computing server, it has its own computation queue to store task requests waiting for
processing. After computation phase, all results are sent to the transmission server and
a transmission queue is used to store coming results. Since the whole system is a close
system, the arrivals of results at the transmission queue follow the Poisson process with
arrival rate λ. In each DC, the service rate of the transmission queue is determined by
78

the bandwidth capacity of the respective DC site.
The IT resource cost in the service Chaining Network can be charged according to
the utilized resources by the time. In this paper, we employ a linear function to model the
relationship between the cost and the allocated IT resources. The total cost is formulated
as (5.1).
Cost = (αA+βN∑i=1
Bi+γC+δD+εE+ζN∑i=1
Fi+ηG+θH+ιI+κN∑i=1
Ji+µK+νL)t (5.1)
t is the time period with is set to 1 hour in this paper; α, β, γ, δ, ε, ζ, η, θ, ι, κ, µ, ν are
costs of network resource servers.
5.2.2 Optimization problems formulation
This section provides a detailed formulation of the problem of allocating resources
in the case in which there is only one kind of network service provided in each site of the
network. As presented in the previous section, requests coming to each site of the network
follow a Poisson process with arrival rate λ. In each DC site, all requests enter into the
schedule queue first. The service time of the schedule queue is assumed to be exponentially
distributed with mean service time A−1, E−1 and I−1 for the Terminal site, for the Edge
DC site and for the DC site, respectively. In particular, each service time captures the
schedule capacity of the server in each site. Thus, the schedule queue is modelled as a
M/M/1 queuing system and, in order to maintain the stability, the following constraints
are required: λ < A, λ < E and λ < I. Consequential, the response time of schedule
queues are given by (5.2a), (5.2b) and (5.2c) for the Terminal site, for the EdgeDC site
and for the DC site, respectively.
79

TschTerminals =1/A
1− λ/A(5.2a)
TschEdgeDC =1/E
1− λ/E(5.2b)
TschDC =1/I
1− λ/I(5.2c)
In each site, scheduling servers distribute requests to different computing servers according
to the randomly generated possibility. We suppose that in the Terminals, EdgeDC and
DC sites there are N computing servers and their computational rates are represented
by B1, B2, ..., BN , F1, F2, ..., FN and J1, J2, ..., JN , respectively. The service time of each
computing server i is exponentially distributed with mean service time B−1i , F−1i and J−1i
for the Terminal site, for the EdgeDC site and for the DC site, respectively. To maintain
the stability, the following constraints are required: piλ < Bi, piλ < Fi and piλ < Ji.
Consequential, the response time of schedule queues are given by (5.3a), (5.3b) and (5.3c)
for the Terminal site, for the EdgeDC site and for the Cloud DC site, respectively.
TcompTerminals =N∑i=1
piBi
1− piλBi
(5.3a)
TcompEdgeDC =
N∑i=1
piFi
1− piλFi
(5.3b)
TcompDC =
N∑i=1
piJi
1− piλJi
(5.3c)
After processing, all service results are sent to the transmission queue. In this paper, we
suppose that there is no loss in the previous stages, so the arrivals of service results at
the transmission queue also follow the Poisson process with arrival mean λ for each site of
the network. The service time of the transmission queue is assumed to be exponentially
distributed with mean service time C−1, G−1 and K−1 for the Terminal site, for the
80

Edge DC site and for the Cloud DC site, respectively, where C, G and K capture the
transmission capacity of the server in each site. The transmission queue is modelled as a
M/M/1 queue and in order to maintain the stability, the following constraints are required:
λ < C, λ < G and λ < K. Consequential, the response time of schedule queues are given
by (5.4a), (5.4b) and (5.4c) for the Terminal site, for the EdgeDC site and for the Cloud
DC site, respectively.
TtranTerminals =1/C
1− λ/C(5.4a)
TtranEdgeDC =1/G
1− λ/G(5.4b)
TtranDC =1/K
1− λ/K(5.4c)
As presented in Section 2, also Access-Distribution network latency and Core network
latency can be modelled using M/M/1 queuing model, where D and H represent the
transmission capacity of the Access-Distribution network and Core network, respectively.
Consequential, the response time of Access-Distribution Network and Core Network are
given by (5.5a) and (5.5b), respectively.
TtranAccessDistribution =1/D
1− λ/D(5.5a)
TtranCore =1/H
1− λ/H(5.5b)
Finally, we introduce an additional queue with a transmission server L. Its response time
is given by (5.6).
TtranTrans =1/L
1− λ/L(5.6)
81

The total response time can be formulated by (5.7)
TTotale ' 2{TTerminal(s)site + TAccessDistrivutionNet + TEdgeDCsite + TCoreNet + TDCsite}
+ TTrans ' 2{1A
1− λA
+N∑i=1
piBi
1− piλBi
+1C
1− λC
+1D
1− λD
+1E
1− λE
+N∑i=1
piFi
1− piλFi
+
+1G
1− λG
+1H
1− λH
+1I
1− λI
+N∑i=1
piJi
1− piλJi
+1K
1− λK
}+1L
1− λL
(5.7)
To simply, we consider the total response time as the double value of the one-way response
time given by the summation of response time of the queues described above.
The response time minimization problem can be stated as: to minimize the
total service response time in the network by optimizing the capacities of the master
server, the computing server, and the transmission server, subject to the queuing stability
constraint for each queuing system and the network resource cost constraint. Mathe-
matically, the problem can be formulated by (5.8), where T is the upper bound of the
service response time. Similarity, we employ the Lagrange multiplier method to solve the
optimization problem (5.8).
We optimize the network resource cost minimization problem to provide net-
work services at minimal resource cost. The resource cost minimization problem can be
stated as: to minimize the total resource cost in the network by optimizing the capacities
of the master server, the computing server, and the transmission server, subject to the
queuing stability constraint for each queuing system and the constraint on the service
response time. Mathematically, the problem can be formulated by (5.9), where M is the
upper bound of the resource cost. The Lagrange multiplier method is applied to solve the
optimization problem (5.9).
82

minimize τ (5.8a)
subject to λ < A, (5.8b)
piλ < Bi, i = 1, . . . , N, (5.8c)
λ < C, (5.8d)
λ < D, (5.8e)
λ < E, (5.8f)
piλ < Fi, i = 1, . . . , N, (5.8g)
λ < G, (5.8h)
λ < H, (5.8i)
λ < I, (5.8j)
piλ < Ji, i = 1, . . . , N, (5.8k)
λ < K, (5.8l)
λ < L (5.8m)
Cost ≤M. (5.8n)
minimize Cost (5.9a)
subject to λ < A, (5.9b)
piλ < Bi, i = 1, . . . , N, (5.9c)
λ < C, (5.9d)
λ < D, (5.9e)
λ < E, (5.9f)
piλ < Fi, i = 1, . . . , N, (5.9g)
λ < G, (5.9h)
λ < H, (5.9i)
λ < I, (5.9j)
piλ < Ji, i = 1, . . . , N, (5.9k)
λ < K, (5.9l)
λ < L (5.9m)
τ ≤ T . (5.9n)
83

A =M − (α+ β + γ + δ + ε+ ζ + η + θ + ι+ κ+ µ+ ν)λ
√α(√α+√βN∑i=1
√pi +
√γ +√δ +√ε+√ζN∑i=1
√pi +
√η +√θ +√ι+√κN∑i=1
√pi +
√µ+√ν)
+ λ
(5.10a)
Bi =
√pi(M − (α+ β + γ + δ + ε+ ζ + η + θ + ι+ κ+ µ+ ν)
√β(√α+√βN∑i=1
√pi +
√γ +√δ +√ε+√ζN∑i=1
√pi +
√η +√θ +√ι+√κN∑i=1
√pi +
√µ+√ν)
+ piλ, i = 1, . . . , N
(5.10b)
C =M − (α+ β + γ + δ + ε+ ζ + η + θ + ι+ κ+ µ+ ν)λ
√γ(√α+√βN∑i=1
√pi +
√γ +√δ +√ε+√ζN∑i=1
√pi +
√η +√θ +√ι+√κN∑i=1
√pi +
√µ+√ν)
+ λ
(5.10c)
D =M − (α+ β + γ + δ + ε+ ζ + η + θ + ι+ κ+ µ+ ν)λ
√δ(√α+√βN∑i=1
√pi +
√γ +√δ +√ε+√ζN∑i=1
√pi +
√η +√θ +√ι+√κN∑i=1
√pi +
√µ+√ν)
+ λ
(5.10d)
E =M − (α+ β + γ + δ + ε+ ζ + η + θ + ι+ κ+ µ+ ν)λ
√ε(√α+√βN∑i=1
√pi +
√γ +√δ +√ε+√ζN∑i=1
√pi +
√η +√θ +√ι+√κN∑i=1
√pi +
√µ+√ν)
+ λ
(5.10e)
Fi =
√pi(M − (α+ β + γ + δ + ε+ ζ + η + θ + ι+ κ+ µ+ ν)
√ζ(√α+√βN∑i=1
√pi +
√γ +√δ +√ε+√ζN∑i=1
√pi +
√η +√θ +√ι+√κN∑i=1
√pi +
√µ+√ν)
+ piλ, i = 1, . . . , N
(5.10f)
G =M − (α+ β + γ + δ + ε+ ζ + η + θ + ι+ κ+ µ+ ν)λ
√η(√α+√βN∑i=1
√pi +
√γ +√δ +√ε+√ζN∑i=1
√pi +
√η +√θ +√ι+√κN∑i=1
√pi +
√µ+√ν)
+ λ
(5.10g)
H =M − (α+ β + γ + δ + ε+ ζ + η + θ + ι+ κ+ µ+ ν)λ
√θ(√α+√βN∑i=1
√pi +
√γ +√δ +√ε+√ζN∑i=1
√pi +
√η +√θ +√ι+√κN∑i=1
√pi +
√µ+√ν)
+ λ
(5.10h)
I =M − (α+ β + γ + δ + ε+ ζ + η + θ + ι+ κ+ µ+ ν)λ
√ι(√α+√βN∑i=1
√pi +
√γ +√δ +√ε+√ζN∑i=1
√pi +
√η +√θ +√ι+√κN∑i=1
√pi +
√µ+√ν)
+ λ (5.10i)
Ji =
√pi(M − (α+ β + γ + δ + ε+ ζ + η + θ + ι+ κ+ µ+ ν)
√κ(√α+√βN∑i=1
√pi +
√γ +√δ +√ε+√ζN∑i=1
√pi +
√η +√θ +√ι+√κN∑i=1
√pi +
√µ+√ν)
+ piλ, i = 1, . . . , N
(5.10j)
K =M − (α+ β + γ + δ + ε+ ζ + η + θ + ι+ κ+ µ+ ν)λ
√µ(√α+√βN∑i=1
√pi +
√γ +√δ +√ε+√ζN∑i=1
√pi +
√η +√θ +√ι+√κN∑i=1
√pi +
√µ+√ν)
+ λ
(5.10k)
L =M − (α+ β + γ + δ + ε+ ζ + η + θ + ι+ κ+ µ+ ν)λ
√ν(√α+√βN∑i=1
√pi +
√γ +√δ +√ε+√ζN∑i=1
√pi +
√η +√θ +√ι+√κN∑i=1
√pi +
√µ+√ν)
+ λ
(5.10l)84

A =
√α+√βN∑i=1
√pi +
√γ +√δ +√ε+√ζN∑i=1
√pi +
√η +√θ +√ι+√κN∑i=1
√pi +
√µ+√ν
√αT
+ λ (5.11a)
Bi =
√α+√βN∑i=1
√pi +
√γ +√δ +√ε+√ζN∑i=1
√pi +
√η +√θ +√ι+√κN∑i=1
√pi +
√µ+√ν
√βT√pi
++piλ, i = 1, . . . , N
(5.11b)
C =
√α+√βN∑i=1
√pi +
√γ +√δ +√ε+√ζN∑i=1
√pi +
√η +√θ +√ι+√κN∑i=1
√pi +
√µ+√ν
√γT
+ λ (5.11c)
D =
√α+√βN∑i=1
√pi +
√γ +√δ +√ε+√ζN∑i=1
√pi +
√η +√θ +√ι+√κN∑i=1
√pi +
√µ+√ν
√δT
+ λ (5.11d)
E =
√α+√βN∑i=1
√pi +
√γ +√δ +√ε+√ζN∑i=1
√pi +
√η +√θ +√ι+√κN∑i=1
√pi +
√µ+√ν
√εT
+ λ (5.11e)
Fi =
√α+√βN∑i=1
√pi +
√γ +√δ +√ε+√ζN∑i=1
√pi +
√η +√θ +√ι+√κN∑i=1
√pi +
√µ+√ν
√ζT√pi
++piλ, i = 1, . . . , N
(5.11f)
G =
√α+√βN∑i=1
√pi +
√γ +√δ +√ε+√ζN∑i=1
√pi +
√η +√θ +√ι+√κN∑i=1
√pi +
√µ+√ν
√ηT
+ λ (5.11g)
H =
√α+√βN∑i=1
√pi +
√γ +√δ +√ε+√ζN∑i=1
√pi +
√η +√θ +√ι+√κN∑i=1
√pi +
√µ+√ν
√θT
+ λ (5.11h)
I =
√α+√βN∑i=1
√pi +
√γ +√δ +√ε+√ζN∑i=1
√pi +
√η +√θ +√ι+√κN∑i=1
√pi +
√µ+√ν
√ιT
+ λ (5.11i)
Ji =
√α+√βN∑i=1
√pi +
√γ +√δ +√ε+√ζN∑i=1
√pi +
√η +√θ +√ι+√κN∑i=1
√pi +
√µ+√ν
√κT√pi
++piλ, i = 1, . . . , N
(5.11j)
K =
√α+√βN∑i=1
√pi +
√γ +√δ +√ε+√ζN∑i=1
√pi +
√η +√θ +√ι+√κN∑i=1
√pi +
√µ+√ν
õT
+ λ (5.11k)
L =
√α+√βN∑i=1
√pi +
√γ +√δ +√ε+√ζN∑i=1
√pi +
√η +√θ +√ι+√κN∑i=1
√pi +
√µ+√ν
√νT
+ λ (5.11l)
85

5.2.3 Performance evaluation
In the following section, we evaluate the performance of the resource allocation
scheme proposed in the previous section by comparing it with the equal allocation scheme.
Due to the computational complexity, our simulations only consider four computing servers
in each DC. We assume that the schedule probabilities for such computing servers in each
DC are set as p = {0.1, 0.2, 0.3, 0.4}. The mean arrival rate of requests is set in a range
between 2 ∗ 104 and 6 ∗ 104 requests/s. The resource of servers [109] are charged by the
value in Table 5.1.
Table 5.1: Cost of servers
Resources of servers $/request
α 0.12*10−4
β 0.48*10−4
γ 0.20*10−4
δ 0.20*10−4
ε 0.12*10−4
ζ 0.48*10−4
η 0.20*10−4
θ 0.20*10−4
ι 0.12*10−4
κ 0.48*10−4
µ 0.20*10−4
ν 0.20*10−4
86

5.2.3.1 Simulation results
For performance evaluation, we examine the mean response time (s) and the re-
source cost ($) with different values of λ (requests/s). For the purpose of comparison, we
introduce the equal resource allocation scheme as a reference scheme, which is the pro-
posed scheme without the minimization problem formulation. Specifically, in the equal
allocation scheme, server’s capacity A, Bi, C, D, E, Fi, G, H, I, Ji, K, L are randomly
choose in order to maintain the stability constraints. Then, the resource cost and the
response time are computed by using (5.1), (5.7) respectively.
Figure 5.9 shows the mean response time achieved by using both the optimal allo-
cation scheme proposed (by solving the problem (5.8)) and equal allocation scheme. The
resource cost constraint is set to 50$. From Figure 5.9(a) we can see that the proposed
optimal allocation scheme achieves much lower response time compared to the equal al-
location scheme under the same budget constraint. Moreover, for high values of λ, equal
(a) Comparison of the mean response time (b) Comparison of the allocated resources
Figure 5.9: Comparison of the mean response time (panel 5.9(a)) and of the allocation
resources (panels 5.9(b))
87

allocation scheme shows much higher response time than proposed allocation scheme,
again highlighting its advantage in whole the range of arrival rate. Figure 5.9(b) shows
the detailed information of the allocated resources for two schemes when λ is set to 60000
requests/s. As shown in Figure 5.9(b) the allocation of a higher portion of resources in
the Terminal and Edge DC sites, leads to a smaller response time (more details are shown
in Table 5.2).
Table 5.2: Service Rate
Resources of servers Proposed allocation scheme Equal allocation scheme
A 3.6534*105 1.20480*105
B 4.8936*105 3.34372*105
C 3.6534*105 1.20252*105
D 2.4267*105 1.20494*105
E 3.1004*105 1.20192*105
F 6.0076*105 3.37462*105
G 3.1004*105 1.20274*105
H 3.1004*105 1.20092*105
I 3.6534*105 1.20388*105
J 3.5842*105 3.24914*105
K 3.1004*105 1.20128*105
L 1.5502*105 0.60238*105
Figure 5.9 highlights how the proposed allocation scheme can significantly improve
the network performance and achieve a better performance balancing resources among
88

Terminal, Edge DC and DC. We can also notice that the allocation of more computation
resources to the Edge DC (represented by F ) and the Terminal (represented by E) im-
prove significantly the end-to-end response time. In fact, the increase of smart nodes and
devices at the edge of the network (i.e. close to the Users) globally make available enough
processing-computational power, data storage capability and communication bandwidth
to provide several network functions and services with local edge resources. As conse-
quence, the allocation of the network functions at the edges of the network may improve
the overall network performance as well as to provide a drastic reduction of resource costs.
In Figure 5.10 we evaluate the resource cost between the proposed optimal allocation
scheme and the equal allocation scheme by using a service time constraint set as T = 1 ms;
this means that the mean service response time should not exceed this time requirement.
As in the previous simulation, Figure 5.10(a) shows that the proposed optimal allocation
scheme achieves a much lower resource cost compared to the equal allocation scheme
under the same service time constraint. Moreover, we can get the reason from the allocated
(a) Comparison of the mean response time (b) Comparison of the allocated resources
Figure 5.10: Comparison of the resource cost (panel 5.10(a)) and of the allocation resources
(panel 5.10(b))
89

resources shown in Figure 5.10(b) when λ is set to 60000 requests/s (more details are shown
in Table 5.3). Specifically, in the equal allocation scheme a smaller portion of resources
are allocated to the DC sites and this degrades the performance. This is demonstrated
by Figure 5.10(b), which shows how the allocation of the resources closer to the Users
presents also the advantage to reduce the resource costs.
Table 5.3: Service Rate
Resources of servers Proposed allocation scheme Equal allocation scheme
A 1.6348*105 1.20202*105
B 1.8546*105 2.49868*105
C 1.6348*105 1.20070*105
D 1.4174*105 1.20394*105
E 1.5368*105 1.20398*105
F 1.6225*105 3.67514*105
G 1.5368*105 1.20004*105
H 1.5368*105 1.20112*105
I 1.6348*105 1.20288*105
J 1.6225*105 3.76856*105
K 1.5368*105 1.20408*105
L 0.7684*105 0.60002*105
In order to better understand the influence of upper bounds on both the resource
cost and response time, additional simulations are provided in Figure 5.11(a) and Fig-
ure 5.11(b). In particular in Figure 5.11(a) we evaluate the resource cost by varying the
90

upper bound time constraint T between 0.1 ms and 10 ms. We can see that for T > 1 ms,
the resource cost performance growths drastically. Conversely, for T < 1 ms, the resource
cost is beyond the threshold value M . In the other side, for T > 1, the resource cost
approaches toward a constant value. In Figure 5.11(b) we evaluate the mean response
time by varying the upper bound cost resource constraint M between 10 and 100. In
Figure 5.11(b) we can see that loosing the constraint the mean response time improves.
Moreover, for M ' 50, the mean response time is beyond the threshold value T .
(a) Resource cost versus the upper bound mean
response time constraint
(b) Mean response time versus the upper bound
resource cost constraint
Figure 5.11: Influence of upper bounds on both the resource cost (panel 5.11(a)) and
response time (panel 5.11(b))
.
91

Chapter 6
Reference architecture for the dynamic place-
ment of logical resources
6.1 Architecture description
The driving forces for both SDN and NFV have been presented together with the
evolutionary scenario and use cases, which would utilize SDN and NFV within a Future
Network system. This Chapter presents an overview of the management and orchestration
architecture which is needed in order for such networks to operate.
From an architectural viewpoint, network functions and services can be defined as a
number of software components with their accompanying context together with configura-
tion parameters. The provisioning of a service involves the creation of a IT infrastructure,
followed by the installation of all necessary software components into the infrastructure,
and finally to configure and start those components. With SDN and NFV these processes
can be simplified as the infrastructure provides a platform from which virtual machines
can be run. SDN can be directly manifested as virtual network topologies which need to
92

be setup, have a managed lifecycle, and need to be shut-down – all under software control.
The reference architecture, depicted in Figure 6.1, has four main layers: (i) the application
layer, (ii) the orchestration layer, (iii) the abstraction layer, and (iv) the infrastructure
layer.
Orche
stra)o
nLayer
Abstrac)on
Layer
Infrastructure
LayerVirtual
RouterVirtualRouter
VirtualRouter
…Virtual8Infrastructure
Host Host Host Host…
Monitoring8Manager
PlacementEngine
Service8Orchestrator
ManagementApplica)on
ManagementApplica)on
ManagementApplica)on
…
Applica)
onLayer
Local8Controller8/8Network8Hypervisor
Global8Controller
Data8Center8and8Network8Infrastructure
MonitoringData
MonitoringData
Figure 6.1: Overall system architecture and components
The application layer executes management applications that define the software compo-
nents of a network service together with their configuration parameters. The orchestra-
tion layer is a software element which does most of the management and orchestration.
It is in charge of managing the full lifecycle of the virtual network functions (e.g. vir-
tual routers) in the network and the allocation of the applications running on the virtual
nodes. The orchestration layer provides a Global Controller, which contains: (a) Service
Orchestrator, which does the orchestration of the all elements of a service; (b) a Moni-
toring Manager, which collects and manages all of the monitoring data received from the
infrastructure layer (including virtual and physical resources); (c) a Placement Engine,
93

which is involved in the placement of the virtual resources. The Global Controller is also
responsible for the allocation of their applications. The abstraction layer contains a
software element which presents an abstraction for managing virtual elements. It provides
a Local Controller that acts as a network hypervisor, and works in a similar way to a host
level hypervisor managing VMs. The infrastructure layer contains both the virtual in-
frastructure, which represents the virtual resources (i.e. the virtual routers) that make up
the virtual networks, and the Data Center infrastructure, which are the physical resources
that are the hosts running the VMs.
In general, the Global Controller is a distributed management infrastructure that has
centralized functionality and it is responsible for the set-up, configuration, optimization,
and shut-down of the network entities. As depicted in Figure 6.1, it takes input from
various management applications regarding various requirements (e.g. network resources
or response time) and then configures the network nodes through a set of Local Controllers.
In order to manage the challenging and dynamic infrastructures of virtual networks
there needs to be a monitoring system which can collect and report on the behaviour of
both the physical resources (e.g. CPU usage, memory usage) and the virtual resources
(e.g. utilization level of the virtual links). These monitoring data items are sent to the
Global Controller so that it can use the monitoring information in order to make decisions
regarding network strategies. In particular, it may decide to add new nodes in order to
fulfil the high-level policies and goals which are NOs requirements. In this way, the virtual
network topology changes dynamically according to the network virtual resources usage.
The following subsections describe in more detail each of the layers.
94

6.1.1 Application layer
As stated this layer executes management applications that define the software com-
ponents and network functions of a network service together with their configuration
parameters. There maybe many management applications which can interact with the
orchestration layer. It is expected that some of the Management Applications will be sim-
ple, whilst others will be more complex. All of them will interact with the orchestration
layer via a well-defined API.
6.1.2 Orchestration layer
The Orchestration layer is responsible for the placement of the virtual routers, the
allocation of service components and functions running on the routers as applications. In
particular, it is responsible for instantiating the virtual routers as it is the software element
which does most of the management and orchestration and is in charge of managing the full
lifecycle of the virtual routers. Mainly, the orchestration layer has the following functions:
1. it starts and stops the Local Controllers on each physical machine;
2. it acts as a control point for the platform by sending out the command;
3. it acts as a management elements for the platform by collecting monitoring data and
enabling reactive behaviour.
This layer is composed of different components: namely the Service Orchestrator, the Mon-
itoring Manager and the Placement Engine. The Service Orchestrator is the component
in charge of performing the automatic deployment of the function/service as application
running on the virtual routers.
95

The Placement Engine is the component in charge of performing the actual place-
ment of the virtual routers according to the initial topology and the usage of the virtual
network elements. This is an important feature because, when we configure a network,
considering some initial information, some of these parameters may change during the
course of the system’s operation and a reconfiguration may be required to maintain op-
timized collection of information. For this reason, our approach considers a mechanism
to achieve adaptation in a flexible manner. The decision on the Placement Engine is en-
coded in an algorithm which can be rather simple, such as counting the number of virtual
routers on a host, or it can be based on a set of constraints and policies that represent the
network properties. In this work we have considered i) infrastructure based measures for
the placement of the virtual nodes and ii) as constraints, the usage of the virtual network
entities (in this case, the usage of the virtual links) for placement. The results of using
different Placement Engines will be highlighted later in this paper.
The Monitoring Manager is an important component of the architecture and
its monitoring function is a vital part of a full control loop that goes from the Global
Controller, through a control path, to monitoring probes which collect and send data,
back to the Global Controller which makes decisions based on the data. By using various
probes in many parts of the whole system, much monitoring data is sent to the Global
Controller, which processes the data and can adapt the network to observed changes.
Each virtual router has a probe to monitor the usage of the network resources (e.g.
the state congestion of the links). The data provided by the probes is collected by the
Monitoring Manager and used by the Global Controller to create or remove the virtual
routers according to the current state of the network. The monitoring software used
96

in this paper is called Lattice and was developed within the RESERVOIR project1 and
has been used for monitoring virtualised services in federated cloud environments [117],
for monitoring virtual networks [118], and as the monitoring system for an Information
Management uses Information Aggregation Points and Information Collection Points to
aggregate, filter, and collect data in scalable manner within virtual networks [111]. Lattice
[112] has been proven as ideal for the task of collecting monitoring data in this type of
dynamic network environment.
6.1.3 Abstraction layer
This layer offers the capabilities for interacting between the Orchestrator and the
Infrastructure Layers providing an abstraction. It contains the Local Controller software
element, which presents a common abstraction for starting, stopping, and configuring
virtual elements. A single Local Controller is started on each physical host that needs to
execute virtual routers, and works in a similar way to a host level hypervisor managing
virtual machines. It is a network hypervisor, which has the following functions: i) it
starts and stops virtual routers; ii) it tells routers to create and remove virtual network
connections, and iii) to get or set attributes on routers or links.
6.1.4 Infrastructure layer
At the bottom, the infrastructure layer consists of a number of virtual routers,
which is the virtual infrastructure, instantiated in a number of physical machines (or
hosts), which is the Data Center infrastructure. The virtual routers are logically indepen-
dent software entities which, as a real routers, communicate with each other via network
interfaces. The network traffic is made up of datagrams, which are sent to and from
1http://www.reservoir-fp7.eu
97

each router. Each virtual router can be dynamically created, dynamically destroyed in
the virtual network. In fact, each router is connected to a Local Controller, which sends
the instructions to start up or shut-down routers on the local machine and for routers to
set-up or tear-down connections with other virtual routers.
98

Chapter 7
Experimental results
7.1 Very Lightweight Service Platform testbed
To validate our design and architectural work, a working implementation of the
architecture explained in the Chapter 6 has been created. The experiments used the Very
Lightweight Service Platform (VLSP) [110] which has been implemented by University
College London for the purpose of testing and evaluating various aspects of SDN and
highly dynamic virtual environments.
This platform includes run-time monitoring, adoption, and adjustment of networks
like SDN, and also having a dynamic programming environment which allows the set-up
of complete network topologies on-the-fly a fully SDN. The is based on a foundational
framework called User Space Routing. This uses a set of virtual routers and virtual
network connections (or virtual links) to create a network environment which can easily
accommodate (i) fast set-up and tear down of a virtual router, and (ii) fast set-up and
tear down of a virtual connection. As each virtual router can run programs and service
elements, it becomes possible to construct an arbitrary network and compute topology.
99
7.1.1 Motivation
There were many motivations for designing and building the User Space Routing
framework. These were accumulated from experience on the RESERVOIR project [114],
which investigated running services in VMs, and the AutoI project [115], which investi-
gated the virtualization of network elements, and the UniverSELF project [116], which
investigated management techniques and systems for modern network architectures. It
was found that the use of a hypervisor and the associated VMs did work as expected and
as required, however, there were some issues that hindered various experimental situations.
Authors found that using a hypervisor and VMs added only 5% to 10% overhead
to operations, compared to running the same operations in the physical machine, which
is most cases was entirely acceptable. The small loss of efficiency was easily overcome by
the flexibility of having VMs. In terms of experimental and research issues, some were
general issues and others were specific to the domain. Moreover, they found the following
general issues:
• the number of VMs that can run on a physical host is limited. This can be due
to the actual resources of the physical machine that need to be shared (such as the
number of cores and the amount of memory available), together with the switching
capabilities of the hypervisor;
• the speed of start-up of a virtual machine can be quite slow. Although virtual
machines boot up in the same order of magnitude as a physical host, there are
extra layers and inefficiencies that slow them down. Also, if many VMs are started
concurrently, then we observe that the physical machine and the hypervisor thrash
trying to resolve resource utilization;
100

• the size of a VMs image is quite large. A VMs has to have a disc image which
contains a full operating system and the applications needed for the relevant tasks.
To start a VMs, the operating system needs to be booted and then the applications
started. So every virtualised application needs the overhead of a full OS.
Moreover, authors found the following issues that were more domain specific:
• in terms of virtual networks, and virtualized routers in particular, authors observed
that 98% of the router functionality they never utilized in any of the experiments
that were run. Although software routers such a XORP and Quagga allow anyone
to play and evaluated soft networks, the overhead of a virtual ma- chine, with a full
OS, and an application where only 2% is used, seems to be an ineffective approach
for many situations;
• when trying to configure the IP networking of VMs and virtual routers, there are
some serious hurdles. The VMs do not talk directly to the network, but go via
the hypervisor. The hypervisor has various schemes for connecting VMs to the
underlying network, each of which has different behaviour. In most situations where
experimentation of virtual routers is required, there needs to be a large range of IP
addresses available. However, this is often hard to come by. Authors found that the
limits of addressing, the IP networking configuration, and VM to VM interoperability
a hindrance to network topology and network flexibility.
It was felt that to make more progress in the area of dynamic and virtual networking
experimentation and research, we needed to design and build a testbed that did not have
these limits, but still retain virtual machine technology. The main goals of the testbed
over using a hypervisor running a standard VMs and standard OS are to have:
101

• better scalability;
• lower resource utilization;
• quicker start-up speed;
• reduced heaviness;
• eliminate the issue where 98% of the router functionality not needed;
• more networking flexibility.
The choice was made to write our own simple router with simple service capabilities, in
Java, that could run in a Java Virtual Machine (the JVM).
7.1.2 Benefits
The benefits of a lightweight VM that includes a simple router and the basic capa-
bilities of a service component are:
• it is possible to run many more routers on a host;
• it is easier to test scalability and stability;
• it is possible do enhanced monitoring and management evaluations;
• it provides a different way to do virtual networks: we can create arbitrary topologies
using virtual routers;
• it is possible to do more evaluations of network management functions by not using
complete routers and full services.
In general, it is a more effective platform for experimenting with many aspects of virtual
networks.
102

7.1.3 The platform
The platform is designed using four main layers: (i) a management application
layer which executes management applications that define the software components and
network functions of a network service together with their configuration parameters; an
orchestration layer which is a software element which does most of the management and
orchestration and is in charge of managing the full lifecycle of the virtual routers in the
network and the allocation of the applications running on the virtual nodes. It is called
“Global Controller” and it does the orchestration of the all elements of a service; (iii)
an abstraction layer which contains a software element which presents an abstraction for
starting, stopping, and configuration virtual elements. It is called “Local Controller”
and acts as a network hypervisor, and works in a similar way to a host level hypervisor
managing VMs; (iv) an infrastructure layer which contains both the virtual infrastructure
and represents the virtual resources (i.e. the virtual routers) that make up the virtual
networks, and the which are the physical resources that are the hosts running the virtual
routers. The platform uses a set of virtual routers and virtual network connections to
create an environment which can easily accommodate:
• fast setup / teardown of a Virtual Router;
• fast setup / teardown of a Virtual Connection;
• each Virtual Router can run programs / service elements;
so it becomes possible to construct an arbitrary network and compute topology. The
testbed has been validated in previous work we have undertaken on virtual networks and
highly dynamic networks [111] [113].
103

7.2 Testbed
The testbed set up has three components: (i) the main component is the Router
itself, which runs inside a JVM; (ii) a per-host controller, and (iii) a supervisor and ex-
perimental controller. The routers are complemented by a lightweight per-host controller
called the Local Controller which has the role of sending instructions to start up or shut
down routers on the local machine and to inform routers to initiate or tear down con-
nections with other routers; and the whole testbed and experiment is supervised by a
Global Controller. The testbed is configured with the Global Controller on one host, and
the Local Controllers running on any host that is to execute virtual routers. Under con-
trol from the Global Controller, individual Local Controllers are requested to start up a
new virtual router when these new routers are needed. The choice of Local Controller
is decided by the Placement Engine. As described earlier, the Placement Engine uses an
algorithm to determine which is the best host to put a router onto. The Global Controller
also sends requests, via a Local Controller, to connect virtual routers together via virtual
network links. To highlight how these components are distributed across the physical
resources, consider a micro data center with 4 hosts. We see depicted in Figure 7.1, how
these components are placed and how they interact. In the bottom left host the Global
Controller is executing. It has the Service Orchestrator, the Monitoring Manager, and the
Placement Engine as subcomponents. The other 3 hosts each have a Local Controller.
The dashed line shows the control path from the Global Controller to all of the Local
Controllers. After requests have been sent to create virtual routers and virtual links, we
observe a virtual topology that spans across these 3 hosts. The solid black line represents
the virtual links. An alternate view of these components, showing a layered view, sepa-
104

rates the control path from the virtual network. In the VLSP testbed, the virtual routers
are autonomous entities and therefore the virtual network executes independently from
the control elements. The control layers interact with the virtual layer. We see this view
depicted in Figure 7.2.
Host Host
LocalController
LocalController
Router
Router
Router
Router
Router
Router
Router
Router
Router
LocalController
Host
Router
Host
GlobalController Placement
Engine
Monitoring Manager
Service Orchestrator
Figure 7.1: Mapping and allocation of elements to hosts
Router
Router
Router
Router
Router
Router
Router
Router
RouterRouter
LocalControllers
GlobalController
Routers
Figure 7.2: Control path to virtual routers and virtual links
105

7.2.1 Router Networking
The virtual router is implemented in Java and is a relatively complex software
entity. The routers have virtual network connection to the other virtual routers they are
connected to, and exchange routing tables to determine the short path to all other routers.
Data packets are sent between routers and queued at input and output. A system of ports
(like the current transport layer ports) is exposed with a DatagramSocket interface very
similar to standard “sockets”. Virtual applications can be run on the virtual routers and
can listen to and send data on their associated virtual sockets. Datagrams have headers
with a source address, destination address, protocol, source port, destination port, length,
checksum and Time To Live (TTL). Many of the features of real IP packets are replicated
in the virtual domain. As such, we can take Java software that runs on real hosts, and
run it on the virtual routers, with a small effort required to make the Socket code conform
the virtual DatagramSocket interface.
7.2.2 Routing and packet transmission
Routing in these virtual routers is based on distance-vector routing. We have incor-
porated the split horizon hack and poison reverse. To prevent routing storms, minimum
times between table transmissions are set. In addition, because the experiment here de-
mands a certain “churn” of virtual routers, addresses which disappear permanently must
be dealt with. In distance vector routing it is well-known that dead addresses can leave
routing loops. This is dealt with in the current system by implementing time to live (TTL)
in packets (so that packets in a routing loop expire rather than fill the network) and also
implementing a maximum routing distance beyond which a router is assumed unreachable
and removed from routing tables (so that the routing loops do not persist forever).
106

The virtual applications can listen on virtual ports and send datagrams to any
virtual address and port. Packets are queued both inbound and outbound. The outbound
queue is blocking in order that transmitting applications can slow their sending rate.
The inbound queue is tail-drop so that when too much traffic is sent drops will occur
somewhere. TTL is decreased at each hop and, on expiry, a “TTL expired” packet is
returned - this allows the virtual router system to implement trace-route as a virtual
application. Virtual routers in the system send all traffic, including routing tables and
other control messages, via the virtual network sockets. UDP-like, that is, delivery is not
guaranteed and a failure to deliver will not be reported to the application (although if the
router on which a virtual application runs has no route to the host this can be reported
to the application).
7.2.3 Start-up and shut-down
The start up and shut-down of virtual routers is managed by the Global Controller
and is performed by the Local Controller which resides on each host. A virtual router will
be started on the same physical machine as the Local Controller. The Local Controller is
also used to shut-down a virtual router or to control the connection of virtual routers with
virtual links. The Local Controller behaves in the same way a hypervisor does in other
virtualised environments and can also pass on Global Controller commands to Routers.
The start up and shut-down of virtual routers can be managed by the Global Con-
troller. It is configured to create different probability distributions for router creation,
router lifetimes and for new virtual link inter-arrival times.
107

7.2.4 Monitoring
The underlying monitoring framework used by the testbed on the routers, is known
as Lattice, is described in [117] and [118]. The Lattice monitoring system has been used
successfully to provide data on all of the virtual elements and the running services of
a cloud computing service environment [117] as well as for virtual networks [118]. The
measurements supplied have been used for service and network management. In many
systems, probes are used to collect data for system management. In this regard, Lattice
also relies on probes. However, to increase the power and flexibility of the monitoring
we introduce the concept of a data source. A data source represents an interaction and
control point within the system that encapsulates one or more probes. A probe sends a
well defined set of attributes and values to a data consumer at a predefined interval.
In Lattice we have fully dynamic data sources, in which each one can have multiple
probes, with each probe returning its own data. The data sources are able to turn on
and turn off probes, or change their sending rate dynamically at run time. Furthermore,
data sources can add new probes to a data source at run-time. By using this approach we
are able to instrument virtual routers on-the-fly system without having to restart them
in order to get new information. Each virtual router has at least one probe which can
generate data. Monitoring data is also collected from each Local Controller. This data is
send to the Monitoring Manager of the Global Controller which processes it. This is the
data that is used by the Placement Engine for determining where a new virtual router is
placed.
108

7.3 Placement Engine
This section describes work performed and presents some experimental results us-
ing the VLSP testbed. For the purpose of this paper we will will only look at collected
experimental data for various Placement Engines. The evaluation of other orchestration
elements, such as the Service Orchestrator, are to be covered in other papers. We show
how the Placement Engine can make a decision which will enable the starting of different
virtual routers on different physical hosts depending on a set of factors. A Placement
Engine is a software component that encapsulates an algorithm for choosing the “best”
destination to place a new virtual router. Placement Engine algorithms can be based on
infrastructure metrics or on virtual network metrics. It is possible to write many differ-
ent Placement Engines which rely on different metrics and algorithms. The Placement
Engine is a configurable module that can be changed as needed according to different
placement strategies. From the previous descriptions of the architecture and the testbed,
the Placement Engine is a component of the Global Controller as shown in Listing 7.1.
The choice as to which Placement Engine to run is dependent on the high-level
goals and policies that are set for the whole of the networked system. As an example,
there may be a high-level goal which is “to reduce energy consumption”. To satisfy such a
goal, the placement engine would need to have an algorithm which placed virtual routers
ensuring that the least number of physical resources were used. Conversely, a goal such
as “balance the load across all physical nodes” would need a different placement engine
with a different algorithm. To highlight how these placement algorithms perform we have
devised an experiment whereby new routers and new links are created using a probability
distribution.
109

Listing 7.1: Placement Engine, “PlacementEngine.java”
package usr.globalcontroller;
import usr.localcontroller.LocalControllerInfo;
import java.util.Set;
/**
* A PlacementEngine is responsible for determining the placement
* of a Router across the active resources.
*/
public interface PlacementEngine {
/**
* Get the relevant LocalControllerInfo for a placement of a router.
*/
public LocalControllerInfo routerPlacement ();
/**
* Get the relevant LocalControllerInfo for a placement of a router
with a specific address.
*/
public LocalControllerInfo routerPlacement(String address);
/**
* Get all the possible placement destinations
*/
public Set <LocalControllerInfo > getPlacementDestinations ();
}
The virtual routers are created using a Poisson process (with exponential distribution of
inter-arrival times) as this has been shown to be a realistic distribution for a number
of real traffic arrival processes on the current Internet [121, table 3]. Also, each new
virtual router has a randomized “lifetime”, so a virtual router can shut-down at run-time.
Links are added between nodes as a random process, with every virtual router having one
link plus a number of extra links, with a Poisson distribution. The routers are linked at
random, so we observe that older routers tend to acquire more links. This experimental
set-up provides a highly dynamic and adapting network scenario with which to test the
Placement Engines. For the tests we created a testbed scenario that utilizes 4 hosts in
a configuration presented in Figure 7.1 and Figure 7.2. This will give us placement data
for 3 hosts. Although the number of hosts used for real virtual networks is likely to be
considerably higher than 4, having 3 allows us to present our results more clearly. We have
110

considered three different Placement Engines for the same experimental set-up, using the
randomly generated virtual topology. The algorithms embedded in each of the Placement
Engines are based on monitoring data from the infrastructure or monitoring data from
the virtual network. In the following more details about each placement algorithm are
provided.
7.3.1 Least Used Host
Listing 7.2: Placement Engine: Least Used, “LeastUsedLoadBalancer.java”
/* Get the relevant LocalControllerInfo for a placement of a router.
*/
public LocalControllerInfo routerPlacement () {
LocalControllerInfo leastUsed = null;
double minUse = 0.0;
double thisUsage = 0.0;
for (LocalControllerInfo localInfo : getPlacementDestinations ()) {
thisUsage = localInfo.getUsage (); // same as localInfo.
getNoRouters () / localInfo.getMaxRouters ()
// Logger.getLogger ("log").logln(USR.STDOUT , localInfo +" Usage
"+ thisUsage);
if (thisUsage == 0.0) { // found an empty host
leastUsed = localInfo;
break;
}
if (thisUsage < minUse || leastUsed == null) {
minUse = thisUsage;
leastUsed = localInfo;
}
}
if (minUse >= 1.0) {
return null;
}
return leastUsed;
}
111
The algorithm listed in Listing 7.2 is the Least Used placement algorithm. It collects the
number of virtual routers allocated to each physical host and chooses the host that has
the least number of virtual routers. If more than one host is at the minimum level, then
a random host is chosen. This algorithm is a kind of load balancing algorithm as it tries
to get a similar number of routers on each host.
7.3.2 N at a time in a Host
Here we present the N at a time placement algorithm ( Listings: 7.3, 7.4 and 7.5).
It tries to allocate N routers at a time into a single host (in this run, N = 5). If the
number of routers is a factor of N , then the algorithm chooses are different host. When
all the hosts are packed with a factor of N, then a random host is chosen. It too collects
the number of virtual routers allocated to each physical host in order to make a decision.
Listing 7.3: Placement Engine: N at a time in a Host, “NupPlacement.java”
/**
* It allocates routers in blocks of N
* It finds the LocalController which has space for another router.
*/
public class NupPlacement implements PlacementEngine {
// The GlobalController
GlobalController gc;
// The no of routers to place on a host
int count = 5;
/**
* Constructor
*/
public NupPlacement(GlobalController gc) {
this.gc = gc;
Logger.getLogger("log").logln(USR.STDOUT , "NupPlacement:
localcontrollers=" + getPlacementDestinations ());
}
112
Listing 7.4: Placement Engine: N at a time in a Host, “NupPlacement.java”
/**
* Get the relevant LocalControllerInfo for a placement of a router
with
* a specified name and address.
*/
public LocalControllerInfo routerPlacement(String name , String address)
{
LocalControllerInfo toUse = null;
int minUse = Integer.MAX_VALUE;
int thisUsage = 0;
long elapsedTime = gc.getElapsedTime ();
// now work out placement
for (LocalControllerInfo localInfo : getPlacementDestinations ()) {
thisUsage = localInfo.getNoRouters ();
if (localInfo.getNoRouters () >= localInfo.getMaxRouters ()) {
// cant use this one
continue;
}
// Logger.getLogger ("log").logln(USR.STDOUT , localInfo +" Usage
"+ thisUsage);
if (thisUsage % count != 0) { // found a candidate with a free
slot
toUse = localInfo;
break;
}
// now check if there is less usage
if (thisUsage < minUse) {
minUse = thisUsage;
toUse = localInfo;
}
}
Logger.getLogger("log").logln(1<<10, "NupPlacement:end_of_
first_loop:toUse=" + toUse + "minUse=" + minUse);
113

Listing 7.5: Placement Engine: N at a time in a Host, “NupPlacement.java”
// check if we didn’t chose one
if (toUse == null) {
// chhose one with the minimum usage
for (LocalControllerInfo localInfo : getPlacementDestinations ()
) {
thisUsage = localInfo.getNoRouters ();
// choose a random with min use
if (thisUsage == minUse) {
toUse = localInfo;
}
}
}
// still chose nothing
if (toUse == null) {
//so choose a random one
toUse = getPlacementDestinations ().iterator ().next();
}
// log current values
Logger.getLogger("log").logln(1<<10, toTable(elapsedTime));
Logger.getLogger("log").logln(USR.STDOUT , "NupPlacement: choose " +
toUse + " use: " + thisUsage);
Logger.getLogger("log").logln(1<<10, gc.elapsedToString(elapsedTime
) + ANSI.CYAN + "NupPlacement:choose" + toUse + "use:" +
thisUsage + "for" + name + "/" + address + ANSI.RESET_COLOUR);
return toUse;
}
114

7.3.3 Least Busy Host
Here we present the Least Busy placement algorithm. It tries to determine the host
that is least busy in terms of virtual network traffic. It collects monitoring data from all
the the virtual routers (as shown in Listing 7.6) in the virtual network and calculates how
much virtual traffic has been sent on each of the hosts. The host that has the lowest
amount of traffic since the last placement decision is chosen as the host for the current
placement. This algorithm is useful in contexts where the QoS of the virtual network is
important as it places virtual routers close to other virtual routers that are not sending
much traffic.
Listing 7.6: Placement Engine: Least Busy, “LeastBusyPlacement.java”
// at this point we know which host has what volume.
// now we need to skip through all of them and find the host
// with the lowest volume
long lowestVolume = Long.MAX_VALUE;
for (Map.Entry <LocalControllerInfo , Long > entry : lcVolumes.
entrySet ()) {
Long volume = entry.getValue ();
if (volume < lowestVolume) {
lowestVolume = volume;
leastUsed = entry.getKey ();
}
}
115
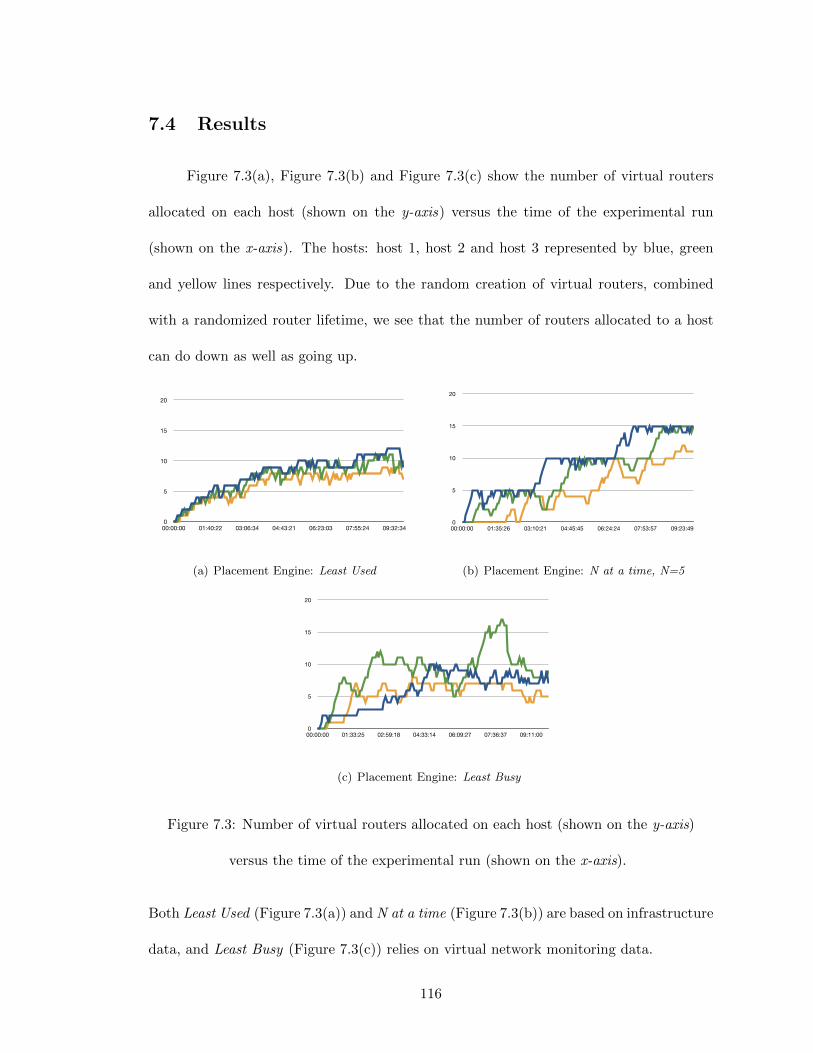
7.4 Results
Figure 7.3(a), Figure 7.3(b) and Figure 7.3(c) show the number of virtual routers
allocated on each host (shown on the y-axis) versus the time of the experimental run
(shown on the x-axis). The hosts: host 1, host 2 and host 3 represented by blue, green
and yellow lines respectively. Due to the random creation of virtual routers, combined
with a randomized router lifetime, we see that the number of routers allocated to a host
can do down as well as going up.
0
5
10
15
20
00:00:00 01:40:22 03:06:34 04:43:21 06:23:03 07:55:24 09:32:34
(a) Placement Engine: Least Used
0
5
10
15
20
00:00:00 01:35:26 03:10:21 04:45:45 06:24:24 07:53:57 09:23:49
(b) Placement Engine: N at a time, N=5
0
5
10
15
20
00:00:00 01:33:25 02:59:18 04:33:14 06:09:27 07:36:37 09:11:00
(c) Placement Engine: Least Busy
Figure 7.3: Number of virtual routers allocated on each host (shown on the y-axis)
versus the time of the experimental run (shown on the x-axis).
Both Least Used (Figure 7.3(a)) and N at a time (Figure 7.3(b)) are based on infrastructure
data, and Least Busy (Figure 7.3(c)) relies on virtual network monitoring data.
116

Observation of Figure 7.3(a) shows that the allocations are very similar for each
host. Observations of Figure 7.3(b) show that allocation pattern is very different from
the Least Used algorithm. Furthermore, as routers reach the end of their lifetime we see
them disappearing from the allocation count, but the algorithm still tries to pack in N
routers to a host. Observations of Figure 7.3(c) show that the allocation pattern is again
different from the previous two placement algorithms. This placement is not impacted by
any infrastructure monitoring data, only virtual network traffic. As the traffic decreases
on a host then the number of routers allocated to that host increases. These fluctuations,
combined with router death, show a marked variation from Least Used and N at a time.
The results presented here demonstrate that the different embedded algorithms in
each of the Placement Engines give very different placement strategies for the virtual
routers. It is expected that over time the placement algorithms for virtual routers will be-
come more complex and factor-in metrics from both infrastructure and virtual resources.
These placement engines may be able to utilize or share some algorithmic elements from
compute cloud placement algorithms such as [119] and [120]. By having a detailed un-
derstanding of the behaviour of these different placement algorithms, it will be possible
to choose the best Placement Engine to achieve fully effective operation. The Placement
Engine should be swappable at run-time in order to make placements that match chang-
ing high-level goals and policies. Such flexibility is a key aspect of a management and
orchestration system.
117

Chapter 8
Conclusions
This thesis presented the motivations and research challenges for next generation
of networks based on software-defined principles. We believe that the next generation of
networks needs to move from being merely defined by software to driven and enabled by
software and must be capable of supporting a multitude of network and service providers
that exploit an environment in which network functions and services are dynamically
deployed and quickly adapted over a heterogeneous physical infrastructure, according
to changing requirements. Specifically, in this work we have proposed an architecture
based on a resource orchestrator for run-time orchestration of logical resources in wired
environments. Moreover, we have developed and implemented specific mechanisms and
algorithms for an efficient mapping of virtual resources onto physical resources in Software
Defined Infrastructures – considered representative of wired environments.
This work consists of three basic contributions: (i) the definition of a model rep-
resenting a virtual network; (ii) the design of a network architecture based on soft-
orchestration of virtual network resources; (iii) the development of placement algorithms
for an efficient mapping of virtual resources onto physical resources.
118

Concerning the first contribution, a virtual network can be represented by graphs
which consist of a set of virtual nodes (vertices) and a set of virtual links. A virtual node
can transfer virtual information to another virtual node in the form of data-packets if
there is a virtual link between them. If there is no direct virtual link between the virtual
nodes, then a path in the network is the sequence of distinct virtual nodes visited when
transferring data-packets from one virtual node to another. Moreover, we have intro-
duced statistical properties of packet traffic described by a model where the traffic is both
Poisson-like (or Short Range Dependence) and self-similar (or Long Range Dependence).
We have considered networks with different topologies generated using the most appropri-
ate algorithms (for example, Erdos-Renyi (ER) algorithm to generate a random network
and the static model introduced in [84] to generate scale-free topologies). Using the net-
work model and traffic generator detailed above, simulations were carried out to analyze
various aspects of the end-to-end performance for each different type of network, observ-
ing that hypercube networks show much higher performance (in terms of throughput and
latency) and resilience to intentional attacks than scale free networks, again combining
some of the beneficial, features of different network structures.
As for the second contribution, from the underlying physical resources, a set of
virtual networks can be created using the mechanisms of the virtualisation. These virtual
networks have different properties – according to specific needs – and their creation can
be programmable using SDN paradigm. An orchestrator is a software entity in charge of
managing the full lifecycle of virtual resources in the network and the allocation of the ap-
plications running on the virtual elements. Our solution consists of an orchestration layer,
which contains: (a) a Service Orchestrator, which does the orchestration of the all elements
of a service; (b) a Monitoring Manager, which collects and manages all of the monitoring
119

data received from the infrastructure layer (including virtual and physical resources); (c)
a Placement Engine, which is involved in the placement of the virtual resources, accord-
ing to specific requirements or high-level policies (e.g. energy consumption). Specifically,
it encapsulates an algorithm (based on infrastructure metrics or on virtual metrics) for
choosing the “best” destination to place a new virtual resource.
Our last considerations are on placement algorithms for an efficient mapping be-
tween virtual and physical resources which are provided by the third contribution of
this thesis. SDI would be able to create a virtual network and instantiate the requested end
user’ s functionalities at the required locations to provide the desired QoS, e.g. minimiz-
ing network latency. This challenge includes the design and implementation of algorithms
in the Placement Engine in order to “optimise” mapping of virtual resources onto the
physical resources. In this work, an optimisation technique based on the minimization
problem formulation has been proposed. Simulation results show that our optimal alloca-
tion scheme achieves both much lower response time and resource costs with respect to the
equal allocation scheme (used as a reference scheme) under the same budget constraint and
time service constraint. Moreover, simulation results highlight how the allocation of the
resources closer to the users, in order to execute network functions and services, will bring
several advantages, not only in terms of flexibility but also in performance improvements
and costs reductions.
120

Bibliography
[1] Software Networks at the Edge: a shift of paradigm. A. Manzalini, R. Saracco. In:Proceedings of 2013 IEEE SDN for Future Networks and Services (SDN4FNS 2013),pp. 1–6. Trento, Italy, 2013.
[2] Towards the Future Internet - Emerging Trends from European Research. G. Tselen-tis, A. Galis, A. Gavras, S. Krco, V. Lotz, E. Simperl, B. Stiller, T. Zahariadis (eds.),pp. 300, April 2010.
[3] Softwarization of Future Networks and Services-Programmable Enabled Networks asNext Generation Software Defined Networks. A. Galis, S. Clayman, L. Mamatas, J.Rubio-Loyola, A. Manzalini, S. Kuklinski, J. Serrat, T. Zahariadis. In: Proceedings of2013 IEEE SDN for Future Networks and Services (SDN4FNS 2013), pp. 1–7. Trento,Italy, 2013.
[4] ETSI, Software-aware and Management-aware SDN, Initiative presented at 3rd ETSIFuture Networks Workshop 9-11 April 2013
[5] OpenFlow: enabling innovation in campus networks. N. McKeown, T. Anderson,H. Balakrishnan, G. Parulkar, L. Peterson, J. Rexford, S. Shenker, J. Turner. In:Newsletter ACM SIGCOMM Computer Communication Review, vol. 32, issue 2, pp.69–74, April 2008.
[6] Software Enabled Future Internet - Challenges in Orchestrating the Future Internet.A. Galis, J. Rubio-Loyola, S. Clayman, L. Mamatas, S. Kuklinski, J. Serrat, T.Zahariadis. In: Mobile Networks and Management Lecture Notes of the Institutefor Computer Sciences, Social Informatics and Telecommunications Engineering, vol.125, pp. 228–244, 2013.
[7] ETSI, Network Functions Virtualisation (NFV), ETSI Industry Grouphttp://portal.etsi.org/portal/server.pt/community/NFV/367
[8] ETSI, Network Functions Virtualisation Introductory White Paper,http://portal.etsi.org/NFV/NFV White Paper.pdf
121

[9] Monitoring, Aggregation and Filtering for Efficient Management of Virtual Networks.S. Clayman, R. Clegg, R. Mamatas, G. Pavlou, A. Galis. In: Proceedings of 7thInternational Conference on Network and Service Management (CNSM 2011), pp.1–7, Paris, France, 2011.
[10] R. Clegg, S. Clayman, G. Pavlou, R. Mamatas, A. Galis. On the selection of man-agement and monitoring nodes in dynamic networks. In: IEEE Transaction on Com-puters, vol. 62, issue 6, pp. 1207–1220, June 2013.
[11] The Dynamic Placement of Virtual Network Functions. S. Clayman, E. Maini, A.Manzalini, N. Mazzocca. In: Proceedings of IEEE/IFIP Network Operations andManagement Symposium (NOMS 2014), pp. 1–9. Krakow, Poland, 2014.
[12] Management and Orchestration of Virtualized Network Functions. E. Maini, A. Man-zalini. In: A. Sperotto, G. Doyen, S. Latre, M. Charalambides, B. Stiller (eds.), Mon-itoring and Securing Virtualized Networks and Services, Springer Berlin Heidelberg,LNCS, vol. 8508, pp. 52–56, June 2014.
[13] Traffic dynamics and vulnerability in hypercube networks. M. Di Bernardo, E. Maini,A. Manzalini, N. Mazzocca. In: Proceedings of IEEE Symposium on Circuits andSystems (ISCAS 2014), pp. 2221–2224. Melbourne, Australia, 2014.
[14] On the future of Internet management technologies. J. Schonwalder, A. Pras, and J.P. Martin-Flatin. In: IEEE Communications Magazine, vol. 41, issue 10, pp. 90-97,Oct. 2003.
[15] Open Networking Foundation:https://www.opennetworking.org
[16] The Internet Engineering Task Force (IETF):https://www.ietf.org
[17] Internet Research Task Force (ITRF):https://irtf.org
[18] SDN and its use-cases: NV and NFV. S.K.N. Rao. White paper, 2014.
[19] A Survey of Software-Defined Networking: Past, Present, and Future of Pro-grammable Networks. B. Nunes, Marc Mendonca, Xuan-Nam Nguyen, K. Obraczka,Thierry Turletti. In: IEEE Communications Surveys & Tutorials, vol. 16, issue 3, pp.1617–1634, Feb. 2014.
[20] The Road to SDN: An intellectual history of programmable networks. N. Feamster,J. Rexford, and E. Zegura. In: Magazine Queue – Large-Scale Implementations, vol.11, issue 12, pp. 20, Dec. 2013.
122

[21] NETCONF Configuration Protocol. R. Enns. RFC 4741 (Proposed Standard), Dec.2006. Obsoleted by RFC 6241.
[22] Forwarding and Control Element Separation (ForCES) Protocol Specification. A. Do-ria, J. H. Salim, R. Haas, H. Khosravi, W. Wang, L. Dong, R. Gopal, and J. Halpern.RFC 5810 (Proposed Standard), Mar. 2010.
[23] A clean slate 4D approach to network control and management. A. Greenberg, G.Hjalmtysson, D. Maltz, A. Myers, J. Rexford, G. Xie, H. Yan, J. Zhan, and H. Zhang.In: Newsletter ACM SIGCOMM Computer Communication Review, vol. 35, issue 5,pp. 41–54. Oct. 2005.
[24] Ethane: Taking control of the enterprise. M. Casado, M. Freedman, J. Pettit, J. Luo,N. Keown, and S. Shenker. In: Proceedings of the 2007 conference on Applications,technologies, architectures, and protocols for computer communications (SIGCOMM2007), pp. 1-12. Chicago. 2014.
[25] Design and implementation of a routing control platform. M. Caesar, N. Feamster, J.Rexford, A. Shaikh, and J. van der Merwe. In: Proceedings of the 2nd conference onSymposium on Networked Systems Design & Implementation (USENIX NSDI 2005),pp. 15–28. Boston, MA. 2005.
[26] Ten Things to Look for in an SDN Controller. Ashton, Metzler (et all). May 2013.https://www.necam.com/Docs/?id=23865bd4-f10a-49f7-b6be-a17c61ad6fff
[27] Secure active network environment architecture: realization in SwitchWare. D.Alexander, W. Arbaugh, A. Keromytis, and J. Smith. In: Proceedings 6th Inter-national Conference on Network Protocols (ICNP 1998) pp. 37–45. Austin, Texas,USA. 1998.
[28] Signaling in telecommunication networks. J. G. Van Bosse and F. U. Devetak. 2nded. John Wiley and Sons. 2007.
[29] Open signaling for atm, internet and mobile networks. A. Campbell, I. Katzela, K.Miki, and J. Vicente. In: Newsletter ACM SIGCOMM Computer CommunicationReview, vol. 29, issue 1, pp. 97-108 . Jan. 1999.
[30] General Switch Management Protocol (GSMP). A. Doria, F. Hellstrand, K. Sundell,and T. Worster. V3. RFC 3292 (Proposed Standard), Jun. 2002.
[31] Towards an Active Network Architecture. D. L. Tennenhouse and D. J. Wetherall.In: Newsletter ACM SIGCOMM Computer Communication Review, vol. 37, issue 5,pp. 81–94. Oct. 2007.
[32] A survey of active network research. D. Tennenhouse, J. Smith, W. Sincoskie, D.Wetherall, and G. Minden. In: IEEE Communications Magazine, vol.35, issue 1,pp.80–86. Jan. 1997.
123

[33] Towards practical programmable packets. J. Moore and S. Nettles. In: Proceedings ofthe 20th Conference on Computer Communications (INFOCOM 2001). Anchorage,Alaska. 2001.
[34] Network wide decision making: toward a wafer thin control plane. J. Rexford, A.Greenberg, G. Hjalmtysson, D. Maltz, A. Myers, G. Xie, J. Zhan, and H. Zhang. In:In Proceedings of HotNets 2004, pp. 59–64. Chicago 2004.
[35] Nox: towards an operating system for networks. N. Gude, T. Koponen, J. Pettit, B.Pfa, M. Casado. In: Newsletter ACM SIGCOMM Computer Communication Review,vol. 38, issue 3, pp. 105–110. Jul. 2008.
[36] Tom Nolle: SDN technologies primer: Revolution or evolution in architecture?http://searchsdn.techtarget.com/tip/SDN-technologies-primer-Revolution-or-evolution-in-architecture
[37] Allied Telesis, Demystifying Software-Defined Networking.http://www.alliedtelesis.com/userfiles/file/WPn Demystifyingn SDNnRevA.pdf
[38] Graham Finnie, Policy Control and SDN: A Perfect Match.https://www.sandvine.com/downloads/general/analystreports/analystreport-heavy-reading-policy-control-and-sdn-a-perfectmatch.pdf
[39] The case for separating routing from routers. N. Feamster, H. Balakrishnan, J. Rex-ford, A. Shaikh, and K. van der Merwe. In: Proceedings of the ACM SIGCOMMworkshop on Future directions in network architecture (FDNA 2004), pp. 5–12. Port-land, Oregon, USA. Sep. 2004.
[40] The Clean-Slate: An Interdisciplinary Program at Stanford.http://cleanslate.stanford.edu/
[41] NFV and SDN: Whats the Difference?. Prayson Pate.http://www.sdncentral.com/technology/nfv-and-sdn-whats-thedifference/2013/03/
[42] Centralized vs. decentralized SDN architecture: Which works for you?. Tom Nolle.http://searchsdn.techtarget.com/tip/Centralized-vsdecentralized-SDN-architecture-Which-works-for-you
[43] Network Virtualization a View from the Bottom. J. Carapinha and J. Jimnez. In:Proceedings of the 1st ACM workshop on Virtualized infrastructure systems andarchitectures (VISA 2009), pp. 73–80. Barcelona, Spain, 2009.
[44] A Use Case Driven Approach To Network Virtualization. D. Schlosser, M. Jarschel, M.Duelli, T. Hofeld, K. Hoffmann, M. Hoffmann, H.-J. Morper, D. Jurca, A. Khan. In:IEEE Kaleidoscope 2010, published via OPUS Wrzburg under OpenAccess, Wrzburg.Dec. 2010.
124

[45] Network Overlays vs. Network Virtualization. Scott Lowe.http://blog.scottlowe.org/2013/04/16/network-overlays-vs-network-virtualization/
[46] Network Virtualization and Software Defined Networking for Cloud Computing–ASurvey. R. J. and S. Paul. In: IEEE Communications Magazine, vol. 51, issue 11, pp.24–31. Nov. 2013.
[47] Network Virtualization for QoSAware Resource Management in Cloud Data Centers:A Survey. P. Rygielski and S. Kounev. In: PIK - Praxis der Informationsverarbeitungund Kommunikation, vol. 36, issue 1, pp. 55–64. Feb. 2013.
[48] SDN vs. network virtualization: Q& A with VMwares Martin Casado. MichelleMcNickle.http://searchsdn.techtarget.com/news/2240183487/SDN-vs-network-virtualization-QA-with-VMwares-Martin-Casado
[49] Proactive Overlay versus Reactive Hop-by-Hop, Juniper Networks.http://www.juniper.net/us/en/local/pdf/whitepapers/2000515-en.pdf
[50] Software defined flow-mapping for scaling virtualized network functions. S. Barkai,R. Katz, D. Farinacci, and D. Meyer. In: Proceedings of the 2nd ACM SIGCOMMworkshop on Hot topics in software defined networking, pp. 149–150. Hong-Kong,China. 2013.
[51] SDN/NFV Primer.http://www.6wind.com/software-definednetworking/sdn-nfv-primer/
[52] ETSI NFV.www.etsi.org/technologies-clusters/technologies/nfv
[53] Accelerating SDN/NFV with Transparent Offloading Architecture. Koji Yamazaki.https://www.usenix.org/conference/ons2014/technicalsessions/presentation/yamazaki.
[54] Future Edge ICT Networks. A. Manzalini. In: IEEE COMSOC MMTC E-Letter, vol.7, No. 7. Sep. 2012.
[55] Telefonica: NFV Move in the network.http://www.ietf.org/proceedings/87/slides/slides-87-nsc-0.pdf
[56] Defining NFV. Yun Chao Hu. In: ITU Workshop on Software Defined Networking(SDN).http://www.itu.int/en/ITUT/Workshops/S1P2 Yun Chao Hu V2.pptx.
[57] Network Functions Virtualization and ETSI NFV ISG. Andy Reid.http://www.commnet.ac.uk/documents/commnet workshop networks/CommNetsEPSRCworkshop Reid.pdf
125

[58] Terast3eam: A simplified service delivery model.https://ripe67.ripe.net/presentations/131-ripe2-2.pdf
[59] SDN in Terastream.http://www.opennetsummit.org/pdf/2013/ presentations/axel clauberg hakan mill-roth.pdf
[60] Virtual Home Gateway. Daniel Abgrall.http://archive.eurescom.eu/∼pub/deliverables/documents/P2000-series/P2055/D1/P2055-D1.pdf
[61] Unbudling- Wiki.http://en.wikipedia.org/wiki/Unbundling
[62] NFV Said to SDN: Ill Be There for You. Jim Machi.http://www.sdncentral.com/market/nfv-said-sdn-ill/2013/12/
[63] Software-Defined Networks for Future Networks and Services, Main Technical Chal-lenges and Business Implications. A. Manzalini, R. Saracco, I. C. Buyukkoc, P.Chemouil, S. Kuklinski, A. Gladisch, M. Fukui, W. Shen, E. Dekel, D. Soldani,M. Ulema, W. Cerroni, F. Callegati, G. Schembra, V. Riccobene, C. M. Machuca,A. Galis, J. Mueller. White Paper based on the IEEE Workshop Software DefinedNetworks for Future Networks and Services (SDN4FNS 2013). Jan. 2014.
[64] Manifesto of Edge ICT Fabric. A. Manzalini, R. Minerva, E. Dekel, Y. Tock, E.Kaempfer, W.Tavernier, K. Casier, S. Verbrugge, D. Colle, F. Callegati, A. Campi,W. Cerroni, R. Vilalta, R. Munoz, R. Casellas, R. Martınez, N. Crespi, N. Mazzocca,E. Maini. In: Proceedings of 17th International Conference on Intelligence in NextGeneration Networks (ICIN), pp. 9–15. Venice, Italy. 2013.
[65] Network Resource Description Language. A. Campi, F. Callegati. In: Proceedingsof IEEE Global Communications Conference (GLOBECOM 2009), pp. 1-6. Hawaii,USA. 2009
[66] Towards a Service Oriented Framework for the Future Optical Internet. Chinwe Es-ther Abosi. PhD Thesis, School of Computer Science and Electronic Engineering,University of Essex, April 2011.
[67] Automated transport service management in the future Internet concepts and op-erations. F. Callegati, A. Campi, W. Cerroni. In: Journal of Internet Services andApplications, vol. 2, issue 2, pp. 69–79. Sep. 2011.
[68] Application scenarios for cognitive transport service in next-generation networks. F.Callegati, W. Cerroni, A. Campi. In: IEEE Communications Magazine, vol. 50, issue.3, pp. 62–69. Mar 2012.
126

[69] Integrated Signaling Framework for Joint Reservation of Application and NetworkResources for the Future Internet. B. Martini, W. Cerroni, M. Gharbaoui, A. Campi,P. Castoldi, F. Callegati. In: Proceedings of the Global Telecommunications Confer-ence (GLOBECOM 2011), pp. 1–5. Houston, USA, 2011.
[70] Toward Future Networks: A Viewpoint from ITU-T. D. Matsubara, T. Egawa, N.Nishinaga, V. P. Kafle, M. K. Shin, A. Galis, In: IEEE Communications Magazine,vol. 51, issue 3, pp. 112–118. March 2013.
[71] ITU-T Rec. Y.2001.General Overview of NGN . 2004.
[72] Local Area Network Traffic Characteristics, with Implications for Broadband NetworkCongestion Management. H. H. Fowler and W. Leland. In: IEEE Journal on SelectedAreas in Communications, vol. 9, issue 7, p. 1139–1149. Sep. 1991.
[73] Statistics of long memory processes. J. Beran. Oct. 1994 by Chapman and Hall/CRC.
[74] Internet Packet Traffic Congestion. D.K. Arrowsmith, R. J. Mondrcigon-C, J. M. Pittsand M. Woolf. In: Proceedings of the 2003 International Symposium on Circuits andSystems (ISCAS 2003), pp. 746–749. Bangkok Thailand. 2003
[75] Chaotic Maps as Models of Packet Traffic. A. Erramilli, R. P. Singh, and P. Pruthi.In: Proceeding of The Fundamental Role of Teletraffic in the Evolution of Telecom-munication Networks, (ITC 1994), pp. 329-338. 1994.
[76] Improving Data Center Performance and Robustness with Multipath TCP. C. Raiciu,S. Barre, C.Pluntke, A. Greenhalgh, D. Wischik and M. Handley. In: Proceedings ofthe ACM SIGCOMM 2011 conference, pp. 266–277. Toronto, Ontario, Canada. 2011.
[77] Dahu: Commodity Switches for Direct Connect Data Center Networks. S. Radhakr-ishnan, M.Tewari, R. Kapoor, G. Porter and A. Vahdat. In: Proceedings of the 9thACM/IEEE Symposium on Architectures for Networking and Communications Sys-tems, pp. 59–70. Oakland, CA, USA. 2013
[78] Topological properties of hypercube. Y. Saad and M.H. Schultz. In: IEEE Transac-tions on Computers, vol. 37, issue 7, pp. 867–872. Jul. 1988.
[79] Hypercube Connected Rings: A Scalable and Fault-Tolerant Logical Topology forOptical Networks. S. Banerjee and D. Sarkar. In: Computer Communications, vol.24, issue 11, pp. 1060–1079. Jun. 2001.
[80] Random Graphs. B. Bollob as. Academic Press.1985.
[81] Traffic dynamics and vulnerability in hypercube networks. M. Di Bernardo, E. Maini,A. Manzalini, N. Mazzocca. In: Proceedings of IEEE Symposium on Circuits andSystems (ISCAS 2014), pp. 2221–2224. Melbourne, Australia, 2014.
127

[82] Data Traffic, Topology and Networks. D. K. Arrowsmith, R. J. Mondragon and M.Woolf. Eds. Vattay and Kocarev Springer Verlag, pp. 127–158. 2005.
[83] Chaotic maps as models of packet traffic. A. Erramilli, R. P. Singh and P. Pruthi.In: The Fundamental Role of Teletraffic in the Evolution of Telecommunications. J.Labetoulle, J. W. Roberts (eds.), pp. 329–338. 1994.
[84] Communication models with distributed transmission rates and buffer sizes. D. K.Arrowsmith, M. Di Bernardo and F. Sorrentino. In: Proceedings IEEE Symposiumon Circuits and Systems (ISCAS 2006), pp. 5047–5050. Island of Kos, Greece. May2006.
[85] Exploiting Neighbourhood Similarity for Virtual Machine Migration over Wide-AreaNetwork. H. Lai, Y. Wu and Y. Cheng. In: Proceedings of the 7th IEEE InternationalConference on Software Security and Reliability (SERE 2013). Gaithersburg, MD,USA. 2013.
[86] Live Wide-Area Migration of Virtual Machines Including Local Persistent State. R.Bradford, K. Kotsovinos, A. Feldmann and H. Schioberg. In: Proceedings of the 3rdInternational ACM SIGPLAN/SIGOPS Conference on Virtual Execution Environ-ments (SIGPLAN VEE 2007). San Diego, CA, USA. 2007.
[87] VXLAN: A Framework for Overlaying Virtualized Layer 2 Networks over Layer 3Networks. M. Mahalingam, D. Dutt, K. Duda, P. Agarwal et al.. Internet Draft.2013.
[88] A Demonstration of Virtual Machine Mobility in a OpenFlow Network. R. Erickson,G. Gibb, B. Heller, D. Underhill et al.. SIGCOMM (Demo). Seattle, WA, USA. 2008.
[89] Elastic IP and Security Groups Implementation Using OpenFlow. G. Stabler, A.Rosen, K. Wang and S. Goasguen. In: Proceedings of the 6th International Workshopon Virtualization Technologies in Distributed Computing Date (HPDC 2012). Delft,Netherlands. 2012.
[90] Improving Cloud Data centre Scalability, Agility and Performance using OpenFlow.C. Baker, A. Anjum, R. Hill, N. Bessis and S. Kiani. In: proceedings of the 4th In-ternational Conference on Intelligent Networking and Collaborative Systems (INCoS2012). Bucharest, Romania. 2012.
[91] B4: Experience with a Globally-Deployed Software Defined WAN. S. Jain, A. Kumar,S. Mandal, J. Ong et al.. In: Proceedings of the 2nd ACM SIGCOMM workshop onHot topics in software defined networking, pp. 3–14. Hong-Kong, China. 2013.
[92] Transparent, Live Migration of a Software Defined Network. S. Ghorbani, E. Keller,M. Caesar, J. Rexford, C. Schlesinger and D. Walker. In: Proceedings of the ACMSymposium on Cloud Computing (SoCC 2014). Seattle, WA, USA. 2014.
128

[93] Live Migration of an Entire Network (and its Hosts). E. Keller, D. Arora, D. P.Botero and J. Rexford. In: Proceedings of the 11th ACM Workshop on Hot Topicsin Networks (HotNets-XI 2011). pp. 109–114 Redmond, WA, USA. 2011.
[94] Live migration of virtual machines. C. Clark, K. Fraser, S. J. G. Hansen, E. Jul,C. Limpach, I. Pratt, and A. Warfield. In: Proceedings of the 2nd conference onSymposium on Networked Systems Design & Implementation (NSDI 2005), Boston,MA, USA. 2005.
[95] Internet suspend/resume. M. Kozuch and S. Satyanarayanan. In: Proceedings ofthe 4th IEEE Workshop on Mobile Computing Systems and Applications (WMCSA2002), pp. 40–46. New York, USA. 2002.
[96] Attacking the process migration bottleneck. E. Zayas. In: ACM Special InterestGroup on Operating Systems, SIGOPS, vol. 21, pp. 13–24. 1987.
[97] Predicting Performance of Virtual Machine Migration. S. Akoush, R. Sohan, A. Rice,A. W. Moore and A. Hopper. In: Proceedings of the 18th International Symposiumon Modeling, Analysis and Simulation of Computer and Telecommunication Systems(MASCOTS 2010), pp. 37–46. Miami Beach, Florida, USA. 2010.
[98] A San-Based Modeling Approach to Performance Evaluation of an IMS-CompliantConferencing Framework. S. Marrone, N. Mazzocca, R. Nardone, R. Presta, S. P. Ro-mano, V. Vittorini. In: Transactions on Petri Nets and Other Models of ConcurrencyIV, Springer Berlin Heidelberg, pp. 308-333. 2012.
[99] ETSI:http://www.etsi.org
[100] Stochastic Activity Networks: Formal definition and Concepts. W. H. Sanders andJ. F. Meyer. Lectures on formal methods and performance analysis, pp. 315–343.2002.
[101] Modeling and Performance Evaluation of an OpenFlow Architecture. M. Jarschel,S.Oechsner, D. Schlosser, R. Pries, S. Goll and P. Tran-Gia. In: Proceedings of the23rd International Teletraffic Congress (ITC 2011), pp. 1–7. San Francisco, USA.2011.
[102] Mobius modelling tool.https://www.mobius.illinois.edu
[103] Service Function Chaining Problem Statement draft IETF.https://datatracker.ietf.org/doc/draft-ietf-sfc-problem-statement/?include text=1
[104] S. Clayman, E. Maini, A. Manzalini, N. Mazzocca. The Dynamic Placement of Vir-tual Network Functions. In: Proceedings of 2014 IEEE/IFIP Network Operations andManagement Symposium (NOMS), pp. 1–9. Krakow, Poland (2014).
129

[105] W. John, K. Pentikousis, G. Agapiou, E. Jacob, M. Kind, A. Manzalini, F. Risso, D.Staessens, R. Steinert, C. Meirosu. Research Directions in Network Service Chaining.In: Proceedings of 2013 IEEE SDN for Future Networks and Services (SDN4FNS),pp. 1–7. Trento, Italy (2013).
[106] A. Satyanarayana, P. Suresh Varma, M.V. Rama Sundari, P Sarada Varma. Per-formance Analysis of Cloud Computing under Non Homogeneous Conditions. In:International Journal of Advanced Research in Computer Science and Software En-gineering (IJARCSSE), vol. 3, issue 5, May 2013.
[107] Zheng Wang, An-Lei Hu. Predicting DNS Server Load Distribution. In: Proceedingsof 32nd IEEE International Performance Computing and Communications Conference(IPCCC), pp. 1–2. San Diego, CA (2013).
[108] Pulak K Chowdhury. Bottleneck Analysis in WOBAN: Wireless Optical hybridBroadband Access Networks. In: IEEE Journal on Selected Areas in Communica-tions Performance Evaluation, vol. 26, issue 6, Aug. 2008.
[109] https://cloud.google.com/compute/pricing
[110] User Space Routing. S.Clayman. Open Source Software:http://clayfour.ee.ucl.ac.uk/usr/
[111] Monitoring, Aggregation and Filtering for Efficient Management of Virtual Net-works. S. Clayman, R. Clegg, L. Mamatas, G. Pavlou and A. Galis. In: Proceedingsof the 7th International Conference on Network and Service Management (CNSM2011), pp. 1–7. Paris, France. 2011.
[112] The Lattice Monitoring Framework. S. Clayman. Open Source Software:http://clayfour.ee.ucl.ac.uk/lattice/
[113] Selection of management/monitoring nodes in highly dynamic networks. R. Clegg, S.Clayman, G. Pavlou, L. Mamatas and A. Galis. In: IEEE Transactions on Computers,vol. 62, issue 6. Jun. 2012.
[114] RESERVOIR Project: http://www.reservoir-fp7.eu
[115] Autol Project: http://ist-autoi.eu
[116] UniverSELF Project: http://www.univerself-project.eu
[117] Monitoring Service Clouds in the Future Internet. S. Clayman, A. Galis, C. Chap-man, G. Toffetti, L. Rodero-Merino. In: Towards the Future Internet: EmergingTrends from European Research, pp. 115–126. April 2010.
130
[118] Monitoring Virtual Networks With Lattice. S. Clayman, A. Galis and L. Mamatas.In: Proceedings of IEEE/IFIP Network Operations and Management SymposiumWorkshops (NOMS Wksps 2010), pp. 239 - 246. Osaka, Japan. 2010.
[119] SLA-aware Placement of Multi-Virtual Machine Elastic Services in Compute Clouds.D. Breitgand, A. Epstein. In: Proceedings of IFIP/IEEE International Symposiumon Integrated Network Management (IM 2011). Dublin, Ireland. 2011.
[120] Improving Consolidation of Virtual Machines with Risk-aware Bandwidth Oversub-scription in Compute Clouds. D. Breitgand, A. Epstein. In: Proceedings of the 31stAnnual IEEE International Conference on Computer Communications (IEEE INFO-COM 2012), pp. 2861–2865. Orlando, Florida, USA. 2012.
[121] A critical look at power law modelling of the internet. R.Clegg, C.DiCairano-Gilfedder,and S.Zhou. In: Computer Communications, vol. 33, issue. 3, pp. 259–268.2010.
131

ACKNOWLEDGEMENTS
Probably, the most read part of each thesis is the Acknowledgements section. It
represents a way to acknowledge those who were important in writing the thesis and to
thank all other people that were important while writing the thesis (as they are also in
the audience on the day of the defence). I will do something similar and tell you about
the experiences and feelings during the PhD time.
The completion of my dissertation and subsequent PhD has been a long journey.
This thesis represents not only my work at the keyboard but it is also a milestone in my
professional growth. The PhD has been a truly life-changing experience for me and it
would not have been possible to do without the support and guidance that I received from
many people. First and foremost I would like to thank my husband Andrea. He has been
a source of love and energy ever since the beginning as well as an example for me to follow.
This thesis is dedicated to him, for always believing in me, giving me comfort and care in
many difficult times. He has been my “personal” advisor and I will forever be grateful for
giving me his valuable experience and guided me with decisions and choices. Thanks for
being with me always.
A special acknowledgement goes to my advisors, Prof. Nicola Mazzocca and Antonio
Manzalini, for supporting me during these past three years. It has been an honour to be
their PhD student. Prof. Mazzocca has been always close to me, giving me the freedom to
pursue various projects without objection. I will forever be grateful for not asking me to
make a choice and for understanding my reasons. In regards to Antonio, I appreciated all
his contributions of time and ideas to make my PhD experience productive and stimulating.
Also, I wish to thank my co-advisor Prof. Mario Di Bernardo for his helpful advice and
suggestions in general.
132

I am especially grateful to Prof. Alex Galis and Dr Stuart Clayman for the oppor-
tunity to visit UCL. They have contributed immensely to my personal and professional
growth. A special thanks to Stuart, who has been source of friendships as well as good
advice and collaboration. I am very happy to develop my research career at UCL, which
I really appreciate for the high quality of its research.
Words can not express how grateful I am to my parents, Virginio and Titti, who
raised me with a love for knowledge, desire to learn, and curiosity to discover as well
as supported me in all my pursuits. Also, I would like to thank my brother and my
grandparents for all their love and encouragement.
A special thanks to my father-in-law, who can not read these acknowledgements but
I am sure he will find another way to receive them. I keep in my mind the dear memory
of his big blue eyes and his smile, the same eyes and smile that I see every day in his
son. Moreover, I wish to thanks my “big” family: my mother-in-law Elisa, Cinzia, Ketty,
Claudia, Salvatore, Alberto, Francesco and my nieces Anna and Elisa. Everybody has
been part of my life in these three years.
Finally, I wish to spend some words to thank myself. The secret to get up after a
fall or a failure is the passion, the determination and self-worth. I say thank to myself for
having always believed, to be stubborn, courageous in the decisions and to love so much
my job.
Thanks to all!
- Elisa
133

***
Probabilmente, i Ringraziamenti sono la parte piu letta di ogni tesi. Rappresentano
un modo per ringraziare chi e stato importante per la scrittura della tesi e tutte le altre
persone che lo sono stati durante (gli stessi che sono li ad ascoltarti il giorno della discus-
sione). Faro qualcosa di simile raccontandovi della mia esperienza e delle sensazioni che
ho provato durante il periodo del dottorato.
La conclusione del lavoro di tesi ed il conseguente Dottorato di Ricerca e stato un
lungo percorso. Questa tesi non rappresenta soltanto un lavoro alla tastiera ma e una
tappa fondamentale nella mia crescita professionale. Il dottorato e stata un’ esperienza
che ha radicalmente cambiato la mia vita e questo non sarebbe stato possibile senza il
supporto e la guida che ho ricevuto da molte persone. Innanzitutto, desidero ringraziare
mio marito Andrea. E stato una sorgente di amore ed di energia fin dall’inizio oltre che,
per me, un esempio da seguire. La mia tesi non puo che essere dedicata a lui per aver
sempre creduto in me, per avermi aiutato e consolato in molti momenti difficili. E stato
il mio advisor “personale” regalandomi la sua prezionsa esperienza e guidandomi in ogni
decisione e in ogni scelta. Grazie per essere sempre con me.
Un ringraziamento speciale va ai miei advisor, il Prof. Nicola Mazzocca ed Antonio
Manzalini per avermi supportato in questi tre anni. E stato un onore per me essere la
vostra dottoranda. Il Prof. Mazzocca mi e stato sempre vicino dandomi la liberta in ogni
iniziativa senza mai obiettare. Gli saro per sempre grata per non avermi mai messo di
fronte ad una scelta e per aver sempre capito le mie ragioni. Per quanto riguarda Antonio,
ho apprezzato molto tutti i suoi contributi in termini di tempo ed idee per rendere la mia
esperienza di dottorato produttiva e stimolante. Tengo, inoltre a ringraziare il mio co-
advisor Prof. Mario Di Bernardo, in generale per essermi stato di aiuto nella supervisione
134

e nei suggerimenti.
Sono molto grata al Prof. Alex Galis ed al Dr Stuart Clayman per l’opportunita di
passare un periodo di ricerca in UCL. Entrambi hanno constribuito immensamente alla
mia crescita personale e professionale. Un ringraziamento speciale a Stuart, che e stato
per me sorgente di amicizia oltre che di supporto e collaborazione. Sono molto felice di
continuare la mia carriera in UCL, che apprezzo molto per l’alta qualita della sua ricerca.
Le parole non possono esprimere la gratitudine verso i miei genitori, Virginio e Titti,
che mi hanno trasmesso l’amore per il sapere, il desiderio di imparare e la curiosita di
scoprire oltre che ad avermi sostenuto in ogni mia iniziativa. Desidero, inoltre, ringraziare
mio fratello ed i miei nonni per il loro amore ed incoraggiamento.
Un ringraziamento speciale a mio suocero, che non potra leggere questi ringrazi-
amenti ma sono certa trovera qualche altro modo per ricerverli. Custodisco nella mia
memoria il caro ricordo di quei grandi occhi blu e del suo sorriso, gli stessi occhi e lo stesso
sorriso che rivedo ogni giorno in suo figlio. Desidero inoltre ringraziare tutta la mia “big
family”: mia suocera Elisa, Cinzia, Ketty, Claudia, Salvatore, Alberto, Francesco e le mie
nipoti Anna ed Elisa. Ognuno di loro e stato parte della mia vita in questi tre anni.
Infine, desidero spendere qualche parola per ringraziare me stessa. Il segreto per
alzarsi sempre dopo una caduta o una delusione e la passione, la determinazione e la
stima in se stessi. Dico grazie me stessa per averci sempre creduto, per essere caparbia,
coraggiosa nelle decisioni e per amare cosı tanto il mio lavoro.
Grazie a tutti!
- Elisa
135