Facility Redesign using Systematic Layout Planning
13
Ramaa A et.al. Facility Redesign using Systematic Layout Planning Facility Redesign using Systematic Layout Planning Ramaa A *1 , Vikram N B 1 , Nandini B 1 1 Department of IEM, RV College of Engineering Abstract This paper presents facility redesign of Glazing and Metal Works using systematic layout planning. Process sequence, material flow and activity relationship were studied. The lay-out was designed and simulated. The new layout showed reduced material flow distance by 33%, waiting time by 30% and increased space utilization by 14%. Keywords: Systematic Layout planning, Facility Layout design, Simulation. 1.0 Introduction Block layout of facility is designed considering the relationship amongst the departments. Internal layout design deals with placement of equipment, storage space, paths, etc. within the departments [1]. A methodology to redesign plant layout starts with collection of relevant data and information, performing flow analysis along with identifying the supporting services, and ending with implementation of the redesigned plant layout. Flow process charts, flow diagrams and operation process charts are commonly used for studying the existing layout. The common storage rack systems like flow rack system, single deep rack, double deep rack, push back rack can be considered while designing layout of warehouse [2]. For developing alternatives for redesigning the existing facility, factors such as ease of access, space utilization, cost of implementation and long-term viability are selected to evaluate the alternatives [3-4]. Weighted factor comparison can used to choose the best facility layout [5]. In simulation of layout using ARENA, factors such as total travelling distance, total travelling time, travelling cost, number of cross over, output over a certain time duration, average resource utilization, total average work in process, total average waiting time and total time spent in system are used as evaluation factors [6 -7]. Efficiency indices can be used to evaluate the existing and proposed layout. Direct material handling, production line flexibility and aisle space are some of the efficiency indices which can be used to indicate an improvement in efficiency of the proposed layout [8]. Material flow distance is used to compare the proposed layout with the existing [9] and adjacency score can be used for the evaluation [10]. The main objective of this paper was to redesign production floor layout of a department using Muther’s Systematic Layout Planning (SLP) methodology. Alternative layouts were simulated using ARENA simulation tool. *Mail address: Ramaa A, Associate Professor, Dept. of IEM, RV College of Engineering®, Bengaluru – 59 Email: [email protected], Ph: +91 9886846831 RVJSTEAM, 1,2 (2020) 126
Transcript of Facility Redesign using Systematic Layout Planning
Ramaa A et.al. Facility Redesign using Systematic Layout Planning
Facility Redesign using Systematic Layout Planning Ramaa A
*1, Vikram N B
1, Nandini B
1
1Department of IEM, RV College of Engineering
Abstract
This paper presents facility redesign of Glazing and Metal Works using
systematic layout planning. Process sequence, material flow and activity
relationship were studied. The lay-out was designed and simulated. The new
layout showed reduced material flow distance by 33%, waiting time by 30%
and increased space utilization by 14%.
Keywords: Systematic Layout planning, Facility Layout design, Simulation.
1.0 Introduction
Block layout of facility is designed considering the relationship amongst the
departments. Internal layout design deals with placement of equipment, storage
space, paths, etc. within the departments [1]. A methodology to redesign plant
layout starts with collection of relevant data and information, performing flow
analysis along with identifying the supporting services, and ending with
implementation of the redesigned plant layout. Flow process charts, flow
diagrams and operation process charts are commonly used for studying the
existing layout. The common storage rack systems like flow rack system, single
deep rack, double deep rack, push back rack can be considered while designing
layout of warehouse [2]. For developing alternatives for redesigning the existing
facility, factors such as ease of access, space utilization, cost of implementation
and long-term viability are selected to evaluate the alternatives [3-4]. Weighted
factor comparison can used to choose the best facility layout [5].
In simulation of layout using ARENA, factors such as total travelling distance,
total travelling time, travelling cost, number of cross over, output over a certain
time duration, average resource utilization, total average work in process, total
average waiting time and total time spent in system are used as evaluation
factors [6 -7]. Efficiency indices can be used to evaluate the existing and
proposed layout. Direct material handling, production line flexibility and aisle
space are some of the efficiency indices which can be used to indicate an
improvement in efficiency of the proposed layout [8]. Material flow distance is
used to compare the proposed layout with the existing [9] and adjacency score
can be used for the evaluation [10]. The main objective of this paper was to
redesign production floor layout of a department using Muther’s Systematic
Layout Planning (SLP) methodology. Alternative layouts were simulated using
ARENA simulation tool.
*Mail address: Ramaa A, Associate Professor, Dept. of IEM, RV College of Engineering®,
Bengaluru – 59
Email: [email protected], Ph: +91 9886846831
RVJSTEAM, 1,2 (2020) 126

Ramaa A et.al. Facility Redesign using Systematic Layout Planning
2.0 Methodology
The study was undertaken in Glazing and Metal Works factory in which the
process layout was followed with incidences of back tracking and unnecessary
movements. Placement of machines resulted in unsmooth and discontinuous
movement of parts between machines. Unused machines and empty spaces
present between the lines hindered movement of workers and the parts. The
space utilization was only 70% of the total available 1.3 x 10⁵ sq. feet.
2.1 Study of Existing lay-out
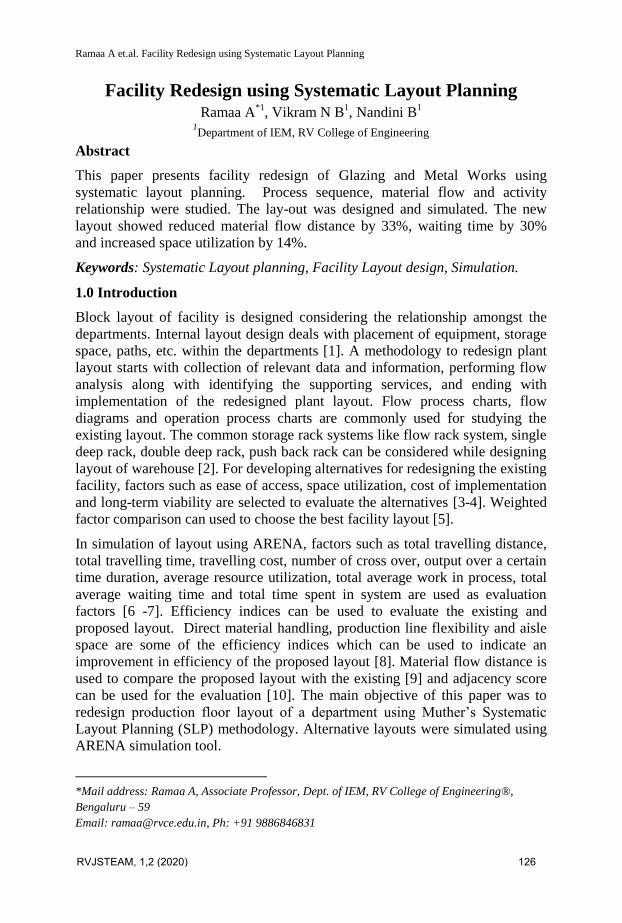
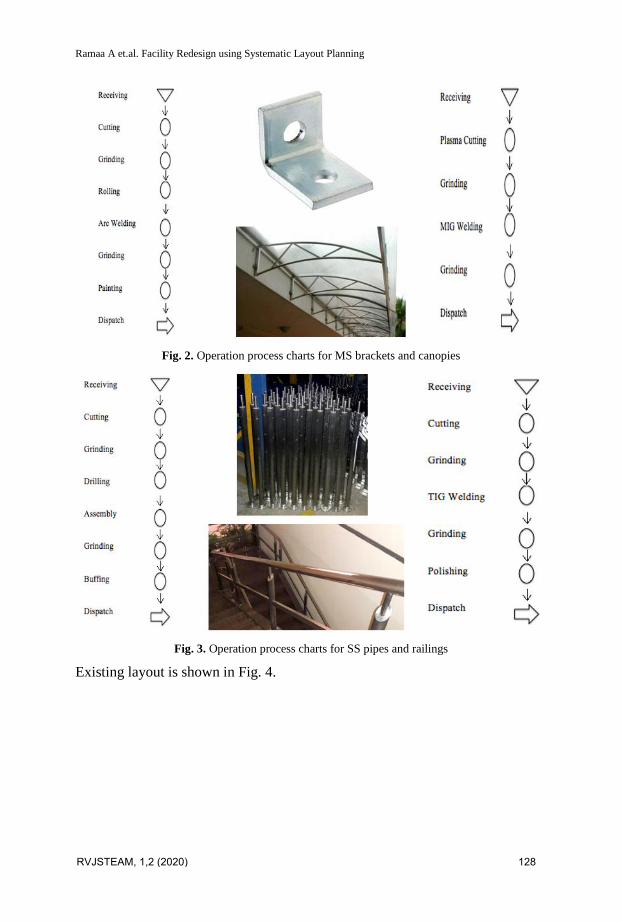
Aluminum fabrication, mild steel fabrication and stainless steel fabrication were
the three main fabrication units. Detailed analysis was performed on two major
products from each of the three units: window and panel in aluminum
fabrication, bracket and canopy in mils steel fabrication and pipe and railing in
stainless steel fabrication. Operation process charts for these products are shown
in Fig. 1 to 3.
Fig. 1. Operation Process Charts for aluminium Panels and windows
RVJSTEAM, 1,2 (2020) 127
Ramaa A et.al. Facility Redesign using Systematic Layout Planning
Fig. 2. Operation process charts for MS brackets and canopies
Fig. 3. Operation process charts for SS pipes and railings
Existing layout is shown in Fig. 4.
RVJSTEAM, 1,2 (2020) 128

Ramaa A et.al. Facility Redesign using Systematic Layout Planning
Fig. 4. Layout of existing facility - Department
2.2 Systematic Layout Planning
2.2.1 Material Flow
Flow of materials for aluminum products through the facility is mapped using
AutoCAD (Fig. 5). It depicts both forward (blue) and backward (green)
movements. Materials flow for other products was also studied.
Fig. 5. Material flow process for aluminium panels
RVJSTEAM, 1,2 (2020) 129

Ramaa A et.al. Facility Redesign using Systematic Layout Planning
2.2.2 Mileage chart
FROM-TO chart data serves as baseline and is useful for finding the degree of
closeness necessary between different departments for material interaction.
Table 1 represents linear distances between different departments for each
major process in aluminium fabrication. Similarly, mileage charts for the other
two fabrications were studied. Departments having more material movement
were placed together to minimize material handling and to ensure an optimum
material flow.
Table 1. Mileage Chart - aluminum fabrication
2.2.3 Activity Relationship Chart
Activity Relationship Chart between pairs of departments were derived by the
From-To chart, mileage chart and material flow. The relationship chart displays
which departments are related to others and it also rates the importance of the
closeness between them. The relationship chart for all 3 fabrications were
prepared after considering both quantitative data of distances travelled as well
Value Closeness Line code Allocation
A Absolutely necessary 5%
E Especially Important 10%
I Important 15%
O Ordinary Closeness
OK
20%
U Unimportant 50%
RVJSTEAM, 1,2 (2020) 130

Ramaa A et.al. Facility Redesign using Systematic Layout Planning
as the qualitative data collected from the working personnel. Fig. 6 displays the
activity relationship chart of aluminum fabrication.
Fig. 6. Activity Relationship Chart - Al Fabrication
2.2.4. Space Relationship Diagram
This is the next crucial step in SLP. Considering the material flow and the
relationship between each department, space relationship diagram for aluminum
fabrication was generated (Fig. 7). It makes the proximity and relationship
between two departments visually evident. The activity relationship diagrams
for mild steel and stainless steel fabrication were also generated.
Fig. 7. Space Relationship Diagram - Al Fabrication
RVJSTEAM, 1,2 (2020) 131

Ramaa A et.al. Facility Redesign using Systematic Layout Planning
2.2.5. Space Requirements
The total working area of departments was collected which indicates the space
required for each department. It is used in generating the alternative layouts for
the facility. It is converted into the required area and the alternative block plans
are derived using the areas for each department.
2.2.6 Closeness Relationship Matrix
This is the final step in SLP. A closeness relationship matrix is made using the
activity relationship chart as an input. Weights are assigned to each relationship:
A=10000, E=1000, I=100, O=10, U=0, X=-1000. Total closeness rating (TCR)
for each department is calculated using the above weights. The department with
the highest TCR is selected and located at the centre of the proposed layouts.
The departments are selected from highest to lowest TCR while developing the
alternative layouts, and are placed around the centre department and the
dimensionless diagram is generated for aluminium fabrication as shown in table
2 and Figure 8. The TCR for the other two fabrications are also calculated.
Table 2. Total Closeness Ratings - Al Fabrication
Fig. 8. Activity Relationship Diagram-Al Fabrication
2.2.7 Transportation Cost Matrix
Transportation cost matrix is a quantitative method that is used to draw a
comparison between the existing and the proposed layouts. It is the product of
production volume, distance and cost of the respective matrices. In the cost
matrix, it is assumed that all backward moves cost $1.25/unit volume/ unit
distance and all forward moves cost $1/unit volume/ unit distance.
RVJSTEAM, 1,2 (2020) 132

Ramaa A et.al. Facility Redesign using Systematic Layout Planning
The Formula used for total transportation cost is
where,
f is the production volume to and from departments
d is the distances between the departments
c is the cost for the moves between the departments
i is the department from which the material flows
j is the department to which the material flows
N is the number of departments
The sum of the resultant matrix is the facility transportation cost. The cost
matrix and transportation matrix for the aluminum fabrication is shown in Table
4 and 5. The same procedure is conducted for the other two fabrications as well.
Table 3. Cost Matrix - Aluminium Fabrication
Total Transportation Cost for Aluminum was Rs. 3.64 x 10⁵, Mild Steel Rs.
4,841.4 and Stainless Steel Rs. 1.37 x 10⁵, totaling to Rs. 5.06 x 10
5.
3.0 Redesign of Existing lay-out
The data collected from the analysis phase of the layout planning was used in
proposing a new layout (Fig. 9). The dimensionless block diagrams prepared
based on the relationship chart serves as a basis for the new layout. SLP
technique resulted in the new plant layout after taking into consideration
practical limitations and constraints and is shown in Fig. 9. When the material
RVJSTEAM, 1,2 (2020) 133

Ramaa A et.al. Facility Redesign using Systematic Layout Planning
flow was observed in proposed method, it was seen that the backtracking was
reduced significantly. From the proposed mileage chart it was observed that the
distance between the departments for each of the fabrication has reduced
drastically. From To chart and the cost matrix for the proposed layout is same as
the existing layout.
Fig. 9. Proposed Layout
3.1 Transportation Cost Matrix - Proposed
The transportation costs for the proposed layout was computed. Table 4 and 5
represent the transportation cost and summary of transportation costs for
aluminum fabrication.
Table 4. Transportation Cost Matrix – Al Fabrication
RVJSTEAM, 1,2 (2020) 134

Ramaa A et.al. Facility Redesign using Systematic Layout Planning
Table 5. Summary of Transportation Cost – Al Fabrication (in Rs)
Sl No Fabrication TC (Existing) TC (Proposed)
1 Aluminum 2.84 x 10⁵ 1.87 x 10
5
2 Mild Steel 4,841.4 799.9
3 Stainless Steel 1.37 x 10⁵ 1.37 x 10
5
Grand Total 4.26 x 10⁵ 3.24 x 10
5
3.2 Simulation
To evaluate the proposed layout, comparisons on certain key performance
indices between the existing layout and proposed layout are performed. The
indices used to evaluate the effectiveness of the proposed layout are waiting
time, % utilization and number of products produced in the case study.
Simulation was performed to evaluate the performance. First, cycle time and the
waiting time of each process are collected. The distribution of data is
determined using the ARENA input analyzer. Three simulation models were
prepared for this study. The simulation process involves the parts arrival,
processing at different stations and finally shipped. The simulation was
executed for one month, eight hour and two shifts per day basis.
4.0 Results
The sample simulation model of Aluminum Fabrication department is shown in
Figure 10. Simulation results are summarized in Table 6 and overall comparison
of existing and proposed layouts are presented in Table 7.
RVJSTEAM, 1,2 (2020) 135

Ramaa A et.al. Facility Redesign using Systematic Layout Planning
Fig. 10. Simulation model of the proposed method of aluminum fabrication unit
Table 6. Summary of simulation results
Sl.
No Fabrication
No of Products
produced
(16 hours)
Waiting time
(minutes per 16
hours)
% Utilization
Existing Proposed Existing Proposed Existing Proposed
1 Aluminum 276 279 51.16 28.9 65.82 85.56
2 Mild Steel 81 82 256.8 187.2 72.54 86.81
3. Stainless
Steel
80 81 57.13 39.04 79.83 85.62
RVJSTEAM, 1,2 (2020) 136

Ramaa A et.al. Facility Redesign using Systematic Layout Planning
Table 7. Results of Existing vs. Proposed Layout
Sl. No Metric Existing Proposed
1. Transportation Cost (Rs) 4.26 x 10⁵ 3.24 x 10
5
2 No of Products 437 442
3 Waiting Time (min) 365.09 255.14
4 Distance(m) 1364.01 914.03
5 % Utilization 72.73 85.99
6 Space utilization (%) 72.73 85.99
7 Net revenue (Rs – crore) 152 153.56
5.0 Conclusion
Facility layout of Glazing and Metal Works was redesigned using systematic
layout planning. Data on the existing layout was obtained by using Process
sequence, material flow and activity relationship. The lay-out was designed and
simulated. The new layout showed reduced material flow distance by 33%,
waiting time by 30% and increased space utilization by 14%.
References
1. Bartholdi, J John, Steven T Hackman, Warehouse & Distribution Science:
Release 0.89. Atlanta: Supply Chain and Logistics Institute, 2008
2. Rouwenhorst, Bart, B Reuter, V Stockrahm, Geert-Jan van Houtum, R J
Mantel, Willem HM Zijm, Warehouse design and control: Framework and
literature review, European journal of operational research, 2000, 122(3),
515-533
3. Master, R Tobiah, Warehouse Redesign of Facility Layout, Racking System
and Item Classification at Sunrize Tackle, Inc., 2009
4 Gu, Jinxiang, Marc Goetschalckx, Leon F McGinnis, Research on
warehouse design and performance evaluation: A comprehensive
review, European Journal of Operational Research, 2010, 203 (3), 539-549
5 De Koster, René, Tho Le-Duc, Kees Jan Roodbergen, Design and control of
warehouse order picking: A literature review, European Journal of
Operational Research, 2007, 182(2), 481-501
6 J Gu, M Goetschalckx, L F McGinnis, Research on warehouse operation: A
comprehensive review, European Journal of Operational Research, 2007,
177(1), 1-21
7 M Rajesh, N V R Naidu, P Naveen Kumar, Plant layout optimization of
oven manufacturing unit using CORELAP algorithm, International Journal
of Research in Engineering and Technology, 2016, 5(16)
RVJSTEAM, 1,2 (2020) 137

Ramaa A et.al. Facility Redesign using Systematic Layout Planning
8 Hakim, Inaki Maulida, Vidyahningtyas Istiyanti, Improvement of layout
production facilities for a secondary packaging area of a pharmaceutical
company in Indonesia using the CORELAP method, International Journal
of Technology, 2015, 6(6), 1006-1016
9 Baker, Peter, Marco Canessa, Warehouse design: A structured
approach, European journal of operational research, 2009, 193(2), 425-436
10 Ali Naqvi, Syed Asad, Productivity improvement of a manufacturing
facility using systematic layout planning, Cogent Engineering, 2016, 3(1),
1207296
RVJSTEAM, 1,2 (2020) 138


![ENGINEERING LICENSURE · Facilities Engineering and Planning Process flow Network optimization Layout design techniques (e.g., systematic layout planning [SLP], affinity diagram,](https://static.fdocuments.in/doc/165x107/5e75525c21e9f2704210bd5a/engineering-licensure-facilities-engineering-and-planning-process-flow-network-optimization.jpg)