FACILITY PROFILE Irving Oil Refining G.P. Saint John ...
31
FACILITY PROFILE Irving Oil Refining G.P. Saint John Refinery Prepared by: Authorizations Branch New Brunswick Department of Environment & Local Government December 2019 TABLE OF CONTENTS BACKGROUND PROCESS DESCRIPTION AIR POLLUTION CONTROL POTENTIAL AIR QUALITY CONTAMINANTS POTENTIAL IMPACTS OF AIR EMISSIONS AIR QUALITY COMPLIANCE AND ENFORCEMENT PUBLIC OUTREACH CONTACTS
Transcript of FACILITY PROFILE Irving Oil Refining G.P. Saint John ...
FACILITY PROFILE
Irving Oil Refining GP
Saint John Refinery
Prepared by
Authorizations Branch
New Brunswick Department of Environment amp Local Government
December 2019
TABLE OF CONTENTS
BACKGROUND
PROCESS DESCRIPTION
AIR POLLUTION CONTROL
POTENTIAL AIR QUALITY CONTAMINANTS
POTENTIAL IMPACTS OF AIR EMISSIONS
AIR QUALITY COMPLIANCE AND ENFORCEMENT
PUBLIC OUTREACH
CONTACTS
BACKGROUND
The Irving Oil Refinery built on a plot of farmland in 1959 in east Saint John officially
opened on July 20 1960 At the time the refinery was designed to process 38500 barrels
of crude oil per day (BPD) Two new process areas constructed in 1976 resulted in the
refinery becoming the largest in Canada with a nameplate capacity of 266000 BPD The
refinery has continued to improve unit and process efficiencies and currently has a
reference rate of 313000 barrels per day offering a secure and reliable energy supply to
customers across Eastern Canada and the Northeastern United States
In order to prepare for the requirement for cleaner burning fuels the availability of
natural gas as well as potential changes in the supply of crude oils Irving Oil Refining
GP (formerly Irving Oil Limited) registered the Refinery Upgrade Project (1) under the
Environmental Impact Assessment (EIA) Regulation in March of 1998 This project
which the Minister allowed to proceed under specific conditions (2) on August 13 1998
involved the construction of eight new units of which three were petroleum production
units and five were environmental control units These are discussed in the sections on
Process Description and Air Pollution Control By the end of 2001 all new units had
been commissioned
The Irving Oil Refining GP refinery produces a range of fuels for transportation (ultra-
low sulphur gasoline ultra-low sulphur diesel jet fuel) and combustion applications
(home heating oil kerosene Bunker C) Other fuels produced for use in more specialized
combustion and transportation applications include butane and propane The heaviest
components of crude oil are used in asphalt which is sold for paving
PROCESS DESCRIPTION
The refinery consists of units for distillation cracking reforming (molecular
rearrangement) product treating steam and hydrogen production sulphur recovery and
tanks for blending and product storage Below are brief descriptions of the process
operations
Distillation
The purpose of crude oil refining is to convert the diverse mixture of petroleum
hydrocarbons present in the crude oil into component streams having the best use and
marketability Crude oil contains a mixture of hydrocarbons of various chemical
compositions and boiling points as well as impurities such as brine and sulphur and
nitrogen compounds This mixture contains a range of petroleum hydrocarbons from the
lightest methane which is the primary constituent of natural gas to the heaviest residues
with high molecular weights that are used in paving asphalt Between these are a series
of hydrocarbons that are separated for use in gasoline jet fuel diesel fuel home heating
oil and heavy fuel oils
The first step in the refining process following removal of brine is to separate the
hydrocarbons present in the crude oil into distinct boiling ranges Some of the separated
products may be used directly in saleable products while others must be processed further
in order to make the most of their inherent value and to meet product specifications
The separation process known as distillation takes place in a distillation column as
shown in Figure 1 The crude oil is first heated to temperatures above 700 degF after which
it is fed to a distillation column containing a series of perforated trays Due to differences
in the boiling points of the hydrocarbons the crude oil vapours condense on the trays at
different levels within the distillation column The lower boiling point hydrocarbons
(heavier products) condense first and are withdrawn near the bottom of the column As
the crude oil vapours move up the column progressively lighter fractions condense and
are withdrawn Those fractions that do not condense are withdrawn as a gas at the top of
the column
The heavy ends those hydrocarbons that are too heavy to boil off in the first distillation
column collect in the bottom of the column and are withdrawn and sent to a second
distillation column which operates under a vacuum Under vacuum the hydrocarbons
boil at lower temperatures and gas oils which could not be vaporized in the first column
move up through the column and are separated out The heaviest (bottom) products are
used in asphalt The separated gas oils are further processed in the cracking units as
described under Cracking
Figure 1 Schematic of Crude Oil Distillation Column
The refinery operates two crude oil distillation units
bull Crude Unit No 3 (146000 BPD) constructed in 1976
bull Crude Unit No 4 (120000 BPD) constructed in 1999 and commissioned in
2000
Cracking
Following distillation the gas oils which represent approximately half of the crude are
broken into smaller molecules in processes referred to as cracking operations Cracking
employs a catalyst which is a material that is used to promote a reaction but which is not
consumed in the reaction The catalyst is used either to speed up the reaction or to allow
it to occur at a lower temperature which renders the process more energy efficient
Following are the three cracking units at the refinery
bull Residue Fluid Catalytic Cracking Unit (RFCCU) (85000 BPD) where residual
oil (high molecular weight residual oil) is cracked and can be separated into
fractions including fuel gas propane propylene butane butylene gasoline diesel
and decant oil
bull Fluid Catalytic Cracking Unit (FCCU) (25000 BPD) where vacuum gas oils
are cracked and separated into fractions that form gasoline diesel and liquefied
petroleum gas (LPG) and
bull Visbreaker (20000 BPD) where residue from the vacuum tower of the crude
units is cracked at high temperatures to make gasoline and diesel fuels
Molecular Rearrangement
Light molecules in the gasoline component streams can be rearranged to improve their
properties as gasoline blending components Reforming is normally carried out in the
presence of hydrogen and a catalyst at temperatures of up to 1000 o F
The refinery has five of these units which perform specific operations as follows
bull Butamer Unit (12000 BPD) where normal butane is converted to isobutene
bull Two Alkylation Units (8000 BPD and 10000 BPD) where iso-butane from other
units is combined with butylenenormal butane mixture to make alkylate a high
octane zero sulphur low vapour pressure gasoline blending component and
bull Rheniformer No 1 (11000 BPD) and Rheniformer No 2 (28000 BPD) where
gasoline blending stocks are reformed to yield a higher-octane fuel
Product Treating
Most refinery streams are treated to remove contaminants such as sulphur organic acids
metals and surfactants that might be detrimental to engines or the environment The
refinery has five units that are used to treat product streams to remove contaminants
bull Naphtha Hydrotreating Unit (NHT) (44000 BPD) where sulphur is completely
removed from the naphtha by reaction with hydrogen over a catalyst
bull Hydrocracker (45000 BPD) where heavy diesel and light cycle oil are
desulphurized in the presence of hydrogen and a catalyst resulting in the
production of ultra-low sulphur diesel products
bull Hydrodesulphurizer (HDS) (56000 BPD) where the sulphur in diesel blending
components is converted to hydrogen sulphide by reacting with hydrogen over a
catalyst
bull Merox Plants (44500 BPD) where mercaptans which are odorous compounds
are removed from gasoline and jet fuels and
bull CD-Tech Unit (58000 BPD) where sulphur compounds are removed from cat-
cracker gasoline in a two-stage process
Steam Production
Many of the process units contain heat exchangers to recapture waste heat from process
streams Steam produced in the refinery boilers and heat recovery steam generators
(HRSGs) is used to provide power in turbines and ejectors to heat processes and
materials and as part of the refining process
The refinery currently has four boilers (1 3 5 and 6) and two HRSGs which burn
refinery fuel gas The HRSGs operated as stand-alone units until late 2004 when
combustion turbines were commissioned as part of the Grandview Cogeneration Project
The combustion turbines generate up to 90 Megawatts (MW) of electricity that is sold to
NB Power a portion (approximately 65 MW) of which is re-sold to Irving Oil Refining
GP for use in the refinery The HRSGs now derive a significant portion of their heat
input from waste heat generated by the combustion turbines significantly increasing the
efficiency of steam generation
Hydrogen Production
Hydrogen required as a feedstock for the hydrocracker and the diesel and naphtha
hydrotreaters is produced by a Hydrogen Plant where natural gas is the primary feed but
naphtha or butane may also be used at high temperature and pressure and in the presence
of a catalyst is converted to hydrogen and carbon dioxide Hydrogen is also produced as
a by-product of the molecular rearrangement process
A Hydrogen Recovery Unit recovers hydrogen from various process streams within the
refinery
Storage Blending and Shipping
Approximately 15 to 20 different component streams are produced by the refinery These
products are stored in the tank field before being blended together in appropriate
proportions to make various grades of gasoline low-sulphur diesel jet fuel furnace oil
and asphalt The finished products are also stored in the refinery tank field prior to being
shipped to customers via road rail and ship The tank storage area contains 135 tanks
storing crude oil blending components and finished products There are also a total of 8
spheres and 10 bullets for storing butane and propane
AIR POLLUTION CONTROL
Owing to the complexity of the refinery air pollution control is achieved through a
variety of techniques including engineering design task and unit specific control
technologies operating strategies and procedures and programs having specific emission
reduction goals These are summarized in the following sub-sections
Fuel Combustion Controls
Generally speaking there is no air pollution control equipment on fuel combustion stacks
(although there are some exceptions) Control is typically exercised by maximizing heat
recovery at the process design stage through the choice of fuel and fuel sulphur levels and
through optimizing furnace operating conditions For example process heaters for Crude
Unit No 4 were designed to be more than 90 percent efficient in terms of energy usage
which is reported to be 20 percent more energy efficient than the furnaces associated with
Crude Unit No1 which they replaced
Sulphur Recovery
Refinery processing operations where possible are designed as closed cycle operations
This means that there are few emissions to the atmosphere There are several reasons for
this including safety environmental protection product recovery and economics The
lightest fractions produced by each processing unit are stripped of their saleable
components and the remaining gases called sour gas (because of the hydrogen sulphide it
contains) are sent to the Amine Sulphur Recovery Unit where the hydrogen sulphide is
removed The cleaned gas known as refinery fuel gas or sweet gas is used throughout
the refinery to provide product heating with minimal emissions
Recovered hydrogen sulphide gas is fed to the Sulphur Recovery UnitsHATGU where
the sulphur is recovered for sale to the fertilizer and pulp and paper industries Some
hydrogen sulphide gas is fed to the Sulphuric Acid Regeneration Unit where it is
converted to sulphuric acid and used in the alkylation process Approximately ninety nine
percent of the sulphur is recovered in this process with the rest being emitted through the
Sulphur Recovery Unit stacks as sulphur dioxide
Water is used in a variety of processes within the refinery to clean and cool product
streams Water that comes into direct contact with petroleum products becomes
contaminated and is likewise handled in a closed system The sour water that results from
these operations is cleaned of its impurities in the Sour Water Stripper where hydrogen
sulphide and ammonia are removed The recovered impurities are fed along with the
hydrogen sulphide from the Amine Recovery Unit to the Sulphur Recovery Units AND
hatgu
The refinery presently has
bull two Amine Sulphur Recovery Units (2450 mscfh recycle rate) and two Sour
Water Stripping Units (7600 BPD each) The second units in each case were
added during the upgrade to provide additional sulphur extraction capability as
well as redundancy for maintenance and other shutdown periods
bull a Tail Gas Unit to remove additional sulphur from the Sulphur Recovery Units
exhaust (tail) gas The original unit (Sulphuric Acid Tail Gas Unit) installed
during the upgrade did not operate as expected so the refinery was required to
propose a solution In 2008 a new unit was installed (the Hydrogenation Amine
Tail Gas Unit or HATGU) which is achieving the desired sulphur recovery
bull a Sulphuric Acid Regeneration Unit to regenerate spent sulphuric acid catalyst
from the Alkylation Plants and
bull two Sulphur Recovery Units (100 long tons per day each)
Flares
Process units are linked together in a system that allows for pressure relief of vessels
being shut down for maintenance or due to upset conditions such as a power interruption
The pressure is relieved by piping the excess product to one of three flares where the
hydrocarbons are combusted at a safe distance from people and equipment The flares are
equipped with smokeless technology and steam assisted air dispersion equipment The
flare system tips were upgraded in 2004 to reduce noise when additional steam is directed
to the flares In addition the No 1 flare was upgraded during the fall 2007 turnaround
and as a result of the newer technology employed noise levels have been reduced
FCCU Particulate Control
Particulate matter emissions from the FCCU are minimized by a series of cyclonic
separators Flue gases from the catalyst regenerator are passed through six sets of primary
and secondary cyclones where centrifugal forces cause the particulate matter to move to
the outside surface of the cyclones where they drop to the bottom and are removed Flue
gases from the secondary cyclones are sent to a third stage containing 80 high efficiency
cyclones and then to a fourth stage high-efficiency cyclone where the majority of the
remaining particulate is removed prior to it being released through the stack During the
2017 Turnaround the primary and secondary cyclones were replaced with an improved
design to improve steady state performance As the flue gas continues through each stage
the size and amount of the particles left in the stream decreases Recovered catalyst is
returned to the unit for re-use or recycled
FCCU Carbon Monoxide Control
As part of the 1976 refinery expansion a platinum combustion promoter was added to the
regenerator The promoter keeps the heat in the bottom of the regenerator where
combustion of carbon monoxide to carbon dioxide is completed without hazard and
reduces the concentration of the carbon monoxide emissions from approximately 10 to
001 percent
Particulate Matter and Sulphur Dioxide Control on RFCCU
A Flue Gas Scrubber (FGS) was installed as part of the Refinery Upgrade Project to
control emissions of particulate matter and sulphur dioxide from the RFCCU catalyst
regeneration process
Noise Control
Noise emissions from the refinery are controlled through the equipment selection
process a silencer to reduce noise on the FCCU was installed in 1995 in response to
concerns from neighbours around the refinery Noise mitigation is recognized as an
integral part of the design process and noise level specifications were included in the
upgrade project procurement process In the fall of 2007 the refinery conducted a noise
study as a requirement through their Approval to Operate Although the results of the
study showed noise to be within benchmark levels at their property line it did help
identify certain activities and units that contribute to slightly increased levels As a result
several process and mechanical changes were made (such as the installation of silencers)
to reduce intermittent noise levels
Hydrogen Plant Carbon Dioxide Control
Primary sources of carbon dioxide within the refinery are from fuel combustion and from
synthetic hydrogen production through steamnaphtha reforming In order to reduce the
refinerys emissions of carbon dioxide recycle a contaminant emission and produce a
saleable product Irving Oil Refining GP entered into a joint venture with Praxair
Canada Inc and constructed a carbon dioxide liquefaction plant in the Grandview
Industrial Park in 1997 Over half of the carbon dioxide emissions generated from the
hydrogen plant are recovered and recycled as a food grade product
Instrumentation and Stack Monitoring
The refinery re-instrumentation carried out between 1991 and 1993 allowed for more
frequent and precise control of all refinery processes This improved control allows the
optimization of refinery processes which contributes markedly to energy efficiency and
emission reductions During re-instrumentation a second fiber optic communication
backbone was installed which provides a backup for the control system and allows the
refinery to continue safe operation in the event that a portion of the control system
becomes inoperable
Stack emissions are monitored for a number of parameters In some cases the monitors
provide direct measurements of contaminant concentrations such as the sulphur dioxide
continuous emission monitors on the sulphur plant stacks In other cases such as the
furnaces boilers and the FCCU process parameters including fuel flow oxygen and
temperature are continuously measured These measurements allow for optimal control of
the process as well as in combination with frequent fuel sulphur analysis for the
calculation of sulphur dioxide emissions
Continuous Emission Monitors (CEMs) for sulphur dioxide and nitrogen oxides are
operational on the Flue Gas Scrubber the Tail Gas Unit and the Sulphuric Acid
Regeneration Unit During the construction of the Grandview Cogeneration Project
CEMs for sulphur dioxide and nitrogen oxides were installed on both HRSGs
Operational Procedures
The refinery burns refinery fuel gas (sweet gas) to provide heat for the refining process
Of the existing total of 26 stacks all but the FCCU emit flue gases from the combustion
of refinery fuel gas
Adherence to the Sulphur Dioxide Response Plan also contributes to reducing emissions
and minimizing their impact The operating approval requires the refinery to implement
the plan when ambient sulphur dioxide concentrations are above 8 parts per hundred
million (pphm) which is approximately one half the maximum permissible 1-hour
ground level concentrations of sulphur dioxide at any one of five ambient monitors
In order to conserve energy process heaters and boilers are operated near stoichiometric
(ideal) conditions that is the minimum amount of air required is used to enable complete
combustion of the fuels This operating objective has the benefit of minimizing emissions
of all contaminants
Shutdown start-up and maintenance procedures are designed to minimize emissions
During planned shutdowns units are steamed out and the resulting hydrocarbon mixture
is burned in the flare(s) with clean fuels such as propane or LPG to minimize the
hydrocarbon emissions Wherever possible mechanical procedures are now employed to
remove coke build-up on boiler tubes as opposed to the previous practice of slowly
burning the coke out Further during maintenance of the sulphur plants or associated
units the refinery uses low sulphur crude to reduce the load on the operating sulphur
recovery plant
Product Quality
Product (fuel) quality affects emissions at the refinery level during product distribution
and in product usage Changes to fuel quality are frequently driven by environmental and
health concerns and often become requirements of national fuel regulations in Canada
and the United States
The Alkylation Unit (to reduce volatile organic compound (VOC) emissions) and
Dehexanizer (for US reformulated gasoline) are process units that were installed between
1987 and 1994 as a result of new Canadian and US federal gasoline regulations aimed at
reducing emissions from both gasoline storage and use
More recent federal environmental initiatives necessitated the upgrade to the Diesel
Hydrodesulphurizer and the Hydrocracker in 1995 which allowed production of low
sulphur diesel This became a requirement in 1998 as a result of the Diesel Fuel
Regulations (3) The Aromatics Saturation Unit was constructed in 1997-98 to reduce the
benzene content in gasoline as required by the Benzene in Gasoline Regulations (4) The
CD-Tech Unit installed in 2003 as part of the RFCCU provides enhanced capability to
ensure that the Sulphur in Gasoline Regulations (5) are met Irving Oil has also made
infrastructure improvements such as new pipelines in preparation for adherence with the
ultra-low sulphur diesel requirements mandated under the Sulphur in Diesel Fuel
Regulations (6) In 2006 the hydrocracker was converted into a diesel treater to help
meet these requirements
The Ultra-Low Sulphur Gasoline Regulations had required an average gasoline sulphur
content of 30 ppm or lower In January 2017 Federal Tier 3 gasoline regulations were
implemented requiring an annual average gasoline sulphur content of 10 ppm The
refinery operations determined that gas desulphurization combined product sulphur of 15
ppm would be required in order to meet the Tier 3 regulation under various operating
scenarios An additional hydrotreating step was installed to the existing Gasoline
Desulphurization Unit (GDS) which is a two-step hydrotreating unit in order to meet a
desired sulphur content of 15 ppm Combining the remaining gasoline blend components
with the hydrotreated stream allows the annual average combined sulphur in gasoline to
meet the 10 ppm regulation
Fugitive Emissions Programs
In 1993 the Irving Oil Refinery began an annual program aimed at reducing its
contribution to ground-level ozone in keeping with the Code of Practice for the
Measurement and Control of Fugitive VOC Emissions from Equipment Leaks October
1993 (7) established by the Canadian Council of Ministers of the Environment (CCME)
This program is comprised of the detection and repair of leaks (fugitive emissions) from
specific process components such as pump seals valves flanges vents connectors and
compressor seals The detection component of the program began in 1993 The program
was expanded to include the repair of leaking components in 1995 When a repair cannot
be made immediately it is scheduled for the next available maintenance turnaround
In addition all Irving Oil Refining GP storage tanks are required to be maintained in
accordance with the CCME Environmental Guidelines for Controlling Emissions of
Volatile Organic Compounds from Aboveground Storage Tanks June 1995 (8) and the
requirements of this guideline have been incorporated into an annual tank reliability
program carried out by the refinery
An odour study was completed throughout the previous Approval lifetime that identified
odour issues that were addressed through various action items and process improvements
POTENTIAL AIR QUALITY CONTAMINANTS
The refinery is situated in east Saint John and although it is in an industrial area there are
several residential areas within close proximity Emissions from the refinery come from
four main source areas
bull Sulphur Block (includes two Sulphur Recovery Units the Tail Gas Unit and the
Sulphuric Acid Regeneration Unit) where although 99 percent of the sulphur fed
to the units is recovered less than 1 percent is released to the atmosphere as
sulphur dioxide as well as small amounts of nitrogen oxides particulate matter
and carbon dioxide
bull Refinery Boilers and the No 3 Crude Unit fired heaters where refinery fuel gas
combustion results in the emission of sulphur dioxide particulate matter nitrogen
oxides carbon dioxide and small amounts of carbon monoxide and
hydrocarbons
bull FCCU catalyst regenerator where sulphur dioxide particulate matter nitrogen
oxides carbon dioxide and small amounts of carbon monoxide and hydrocarbons
are emitted
bull FGS where nitrogen oxides particulate matter carbon dioxide and small amounts
of sulphur dioxide and carbon monoxide are emitted
Fugitive emissions can also have an effect on local air quality
POTENTIAL IMPACTS OF AIR EMISSIONS
Acid Deposition
Emissions of sulphur dioxide and nitrogen oxides can be transformed in the atmosphere
to acidic particles which ultimately fallout as acid deposition (acid rain is one way in
which this deposition occurs) This deposition can occur far from the original source of
the emissions The majority of the acid deposition measured in New Brunswick is caused
by emission sources in the US mid-west and central Canada Generally speaking acid
deposition in New Brunswick has shown significant improvement through national and
international efforts to reduce acid causing emissions primarily through controlling
emissions of sulphur dioxide
The Department continues to report the acid disposition measurements in the Annual Air
Quality Report
Climate Change
When fossil fuels are burned it results in the generation of greenhouse gases (GHG) such
as carbon dioxide (CO2) and methane (CH4) which are the main contributors to the
problem of climate change The Department has been working on a Climate Change
Action Plan for several years and the Approval has a number of conditions related to
reporting and improvements in greenhouse gas emissions
Ground-Level Ozone
Ozone (O3) is a reactive unstable form of oxygen It is not emitted directly from stacks or
exhaust pipes but it is formed as a result of photochemical reactions between other
pollutants most importantly nitrogen oxides and volatile organic compounds (VOCs)
such as solvent and gasoline vapours Both stationary and mobile emissions sources
contribute precursor pollutants that have the potential to result in the formation of
ground-level ozone
It has been estimated that 85 percent of ground-level ozone enters this region from the
North Eastern United States Central Canada and the American Mid-West (9) Elevated
levels generally occur in the summer under very warm conditions when large stable air
masses move up the eastern seaboard into the Fundy region Although the contribution of
local sources may pose an added stress to already deteriorating air quality conditions
during such episodes in general local sources are relatively minor contributors to ground-
level ozone levels experienced in our region Control programs in New Brunswick
specifically for ground-level ozone are therefore not able to reduce ambient
concentrations appreciably Despite this all measures which can reduce the emission of
ozone precursors are promoted such as the refinerys Fugitive Emissions Program Of
particular interest are programs where multiple environmental benefits may be expected
For example improving energy efficiency will reduce greenhouse gas emissions as well
as nitrogen oxides and sulphur dioxide Therefore efficiency measures are favoured over
measures exclusively targeting ground-level ozone
AIR QUALITY COMPLIANCE AND ENFORCEMENT
Compliance and Enforcement options used by the Department of Environment are
outlined in the Departments Compliance and Enforcement Policy (10) These may
include but are not limited to schedules of compliance warnings orders and
prosecutions Although not specifically outlined in the Policy it is also possible to amend
approvals with more stringent conditions both during its valid period or at the time of
renewal to address specific compliance issues or to improve the environmental impact of
the facility Most recently a new Regulation under the Clean Air Act allows for the
issuance of administrative penalties for minor violations as an alternative to
traditionally-used enforcement options
All sources of air emissions in the province are required to comply with the Clean Air Act
and Air Quality Regulation In addition to establishing ambient standards for
contaminants in air Section 3 of the Air Quality Regulation requires that no person shall
construct modify or operate a source without applying for and obtaining an
approvalrdquo The refinery currently operates under Approval to Operate I-8902 issued
July 1 2015 The current Approval expires on June 30 2020
APPROVAL AMENDMENTS and PROJECTS
The Approval was amended twice during the lifetime of the Approval
On November 15th 2015 the Approval was amended to update the operation and
maintenance of the ambient monitoring program that had been upgraded as well as
adding general GHG conditions to the Approval to include reporting and submitting a
Greenhouse Gas Management Plan
On December 21 2016 the Approval was amended to update the definition of Facility to
add the Hydrogen Recovery Unit (Plant 426) This was not a new unit at the Facility
however it was previously owned and operated by Air Liquid Canada and was
acquisitioned by Irving Oil on December 31 2016
On April 4 2017 an Approval to Construct the Tier 3 Gasoline Project was issued This
modification did not increase or change emissions at the refinery or increase the capacity
Compliance with the Approval to Operate
Following are the key issues addressed in the Approval to Operate for Irving Oil Refining
GP including comments on compliance with the associated conditions and actions taken
to achieve compliance with these conditions A summary of the key conditions are in
italics
Emergency Response and Reporting
Conditions 27 amp 28
Notify the Department immediately (or the Coast Guard if not during business hours)
following an environmental emergency and provide a written report within five
business days of the incident
The refinery continues to notify the Department of all environmental emergency
incidents following the emergency response conditions in the approval Environmental
incidents of a non-emergency status are reported to the Department via email to the
regional office as well as the approvals engineer
Notable environmental emergencies during the lifetime of the Approval that impacted the
neighbouring community included
bull On February 21 2015 strong odours were reported from a broken seal in the
internal floating roof of Tank 100 The tank was taken out of service for repairs
A temporary odour control unit was installed that included a caustic scrubber and
carbon filter unit while it was being emptied and taken out of service
bull On November 12 2017 an upset occurred in the FCCU where 21 metric tonnes of
catalyst was released Additional details are provided in the FCCU Condition 36
discussion
bull On June 17 2018 a fuel oil release of 92-100 barrels occurred from the FCCU
Additional details are provided in the FCCU Condition 36 discussion
bull On October 8 2018 a Hydrodesulphurization (HDS) unit fire occurred during the
Turnaround period that impacted the HDS and the 2 Rheniformer Ambient air
quality monitoring in the surrounding area did not indicate any air quality
concerns throughout the incident as the plume from the fire dispersed well in the
direction of the Bay Water used for fire suppression was directed to the industrial
wastewater treatment unit which was at normal operation and met all water
quality limits
Additional VOC testing was completed by a third-party consultant around the
refinery to confirm there were no lingering air quality impacts to the environment
A thorough investigation that included third-party consultants such as forensic fire
investigators and metallurgists concluded the HDS reactor effluent line failed due
to an area of localized pipe thinning as a result of internal corrosion The units
were rebuilt with a primary focus of increasing the corrosion resistance to prevent
any recurrence of the problem
The units were approved to be put back into service on June 28 2019
bull On July 5th 2019 a trip in the Residue Fluid Catalytic Cracking Unit (RFCCU)
while the refinery was in a steam shortage caused a particularly noticeable flaring
event with black smoke The steam shortage occurred due to other units being
down for planned and unplanned maintenance A review was completed to assess
preventive measures to reduce the chance or a recurrence of a steam shortage
during a flaring event
Condition 29
Provide the Department with training on the IOLGP Environmental Emergency
Response Plan
This training is scheduled for early 2020 at the refinery
Limits
Condition 31
Limit annual emissions of sulphur dioxide to 5200 tonnes per calendar year and 30
day rolling average emissions to 145 tonnes per day
The refinery consistently has been below these limits during the period of the approval
(see Table 1 for a summary of annual emissions) Over the past five years average
annual emissions of sulphur dioxide have remained well below the limit
Table 1 Annual SO2 Emissions (Tonnesyear)
SO2 2015 2016 2017 2018 Average
Flue Gas Scrubber 114 123 116 96 112
FCCU 1051 1077 914 1006 1012
Sulphur Block 637 474 539 562 553
Boilers HRSGs and Process Heaters 18 10 54 47 32
Flares 2 1 83 51 34
Total SO2 Emissions (tonnesyear) 1822 1685 1706 1762 1744
Prior to 2000 the Irving Oil refinery had an annual sulphur dioxide emissions cap of
9500 tonnes In the EIA for the Refinery Upgrade Project Irving Oil Refining GP
proposed a reduction in the annual sulphur dioxide cap to 8000 tonnes This cap was
included in their Approval to Operate issued in October 2000 and the cap was reduced
again to 7200 tonnes when the Approval was renewed in 2005 and to 5500 tonnes in
2010 Sulphur dioxide emissions from the refinery have typically been stable and
consistent as shown in Table 1
Condition 32
Limit the annual emission of Sulphur compounds (SO2) from the Sulphur Block to less
than 4000 kgday based on an annual average
The refinery consistently has been below these limits during the period of the approval
(see Table 2 for a summary of annual emissions)
Table 2 Average SO2 Emissions from the Sulphur Block
Year Average SO2 (kgday)
2015 1745
2016 1299
2017 1477
2018 1540
Condition 33
Limit the annual emission of Nitrogen Oxides (NO2) to less than 5500 metric tonnes
per year
The refinery consistently has been below these limits during the period of the approval
(see Table 3 for a summary of annual emissions)
Nitrogen oxide emissions reported by the refinery are based on a variety of sources
including stack tests mass and energy balances US EPA emission factors and design
data The refinery has NOx CEMs on the FGS SRUs SARU and HRSGs
Table 3 Annual NOx Emissions
NOx 2015 2016 2017 2018 Average
Flue Gas Scrubber 811 987 1227 787 953
FCCU 15 15 16 179 56
Sulphur Block 24 23 28 28 26
Boilers HRSGs and Process Heaters 1800 1813 1622 1540 1694
Flares 65 26 29 45 41
Total NOx Emissions (tonnesyear) 2715 2865 2923 2579 2771
Condition 34
Limit the annual point source emissions of particulate matter (PM) to less than 500
metric tonnes per year
The refinery consistently has been below these limits during the period of the approval
(see Table 4 for a summary of annual emissions)
Particulate matter emissions from the refinery are measured in two ways material
balances on the catalyst being used in the FCCU and periodic stack tests Fuel
combustion the FCCU catalyst regenerator stack and the FGS are the major sources of
particulate matter emissions from the refinery
Table 4 Annual PM Emissions
PM 2015 2016 2017 2018 Average
Flue Gas Scrubber 238 265 235 219 239
FCCU 105 93 104 80 96
Sulphur Block 2 2 2 3 2
Boilers HRSGs and Process Heaters 109 110 98 98 104
Flares 0 0 0 0 0
Total PM Emissions (tonnesyear) 454 471 439 400 441
Condition 35
Operate the Flue Gas Scrubber so that an emission rate of 50 mgNm3 particulate
matter on a dry basis is achieved
Annual performance tests conducted on the Flue Gas Scrubber indicate that particulate
emissions were below the target emission rate except for the testing in July 2019 An
additional source testing survey was completed on the flue gas scrubber in September
2019 to verify the previous results The September 2019 testing demonstrated the
particulate matter emission rate is below the target and no further work was required
Stack testing results are summarized in Table 5
During the Fall Turnaround in 2018 the internal components in Flue Gas Scrubber were
replaced for optimal performance
Table 5 Source Testing Results for PM in the FGS
Year Average PM (mgNm3)
2015 489
2016 410
2017 365
2018 418
2019 (July) 594
2019 (Sep) 341
Condition 36
Maintain particulate matter emissions from the fluidized catalytic cracking unit within
an annual average limit of 300 kilograms per day during normal operation
Particulate emissions in the Fluidized catalytic cracking unit (FCCU) are reported
monthly based on a calculated rate that is very conservative There have been several
occasions when the estimate has been over 300 kgday for the month however source
testing results have consistently demonstrated the unit operates are within the limits
Table 6 Source Testing Results for PM in the FCCU
Year PM (kgh) PM (kgd)
Sep 2015 845 203
Feb 2016 97 233
Oct 2017 828 199
May 2018 614 147
July 2018 280
Nov 2018 124
Feb 2019 121
FCCU Upsets
During the 2017 Turnaround upgrades were completed to the FCCU to improve catalyst
particulate losses from the stack On November 12 2017 during start-up following the
completed optimization project an upset occurred where 21 metric tonnes of catalyst was
released The upset was caused by the modifications completed to the operating
parameters
Mitigative actions included developing a FCCU Catalyst Release dispersion model to
provide an indication of the extent of the particulate deposition from the upset and assess
environmental impacts to the surrounding area The model can also assess normal
operation emissions from the FCCU as well as any historical or future releases to the
community The model was used to prepare a response plan for future occurrences to
determine affected areas for community notifications and mitigation Irving Oil also
performed 3 additional source testing events in 201819 to demonstrate the improvements
in emissions from the FCCU optimization project
The Approval Holder is required to provide actions taken to prevent the recurrence of the
problem following an environmental emergency For the catalyst release the risk of a
catalyst release during start up and shut down has been reduced with mitigation measures
implemented to the operating parameters and controls and the full implementation of the
optimization project
On June 17 2018 a fuel oil release occurred from the FCCU An unplanned shutdown
occurred on the unit During the emergency shutdown process a supply feed valve was
left partially open While the unit was being restarted 92-100 barrels of fuel oil was
released due to a pressure release in the unit from the partially opened feed valve
A dispersion model was completed to provide an indication of the extent of the liquid
droplets deposition It was estimated that 4-6 barrels (600 ndash 1000 litres) of fuel oil was
released outside the refinery boundary Soil samples were also taken at a location within
the deposition zone The samples showed trace amounts of total petroleum hydrocarbon
(TPH) but were well within the RBCA Tier 1 Risk Base Screening Limit criteria for No
6lube oil and the Tier II Pathway Specific Screening Levels soil ingestion for No 6lube
oil
For preventative measures piping was re-routed to ensure the feed valves remain closed
when the unit trips
In the two FCCU upset occurrences both the DELG and the Department of Health were
involved in the assessment of the impacts from the releases and approval of the mitigative
actions
Environmental Quality Limits
Condition 37
Limit ambient total reduced sulphur concentrations to 13 μgm3 (9 ppb) as a 10 minute
average and 7 μgm3 (5 ppb) as a 24 hour average
Reduced sulphur compounds are highly malodorous
Three permanent ambient monitoring stations collect TRS data Champlain Heights
Midwood Avenue and Forest Hills
There are very few issues with TRS at the Champlain Heights and Forest Hills
monitoring stations The Midwood Avenue monitoring station has had a number of
exceedances in the past few years however based on wind direction and refinery
operations they are not attributed to the refinery operations
Condition 38
All activities at the facility related to the maintenance decommissioning construction
and commissioning of any units are carried out in a manner to remain under these
noise levels at the nearest receptor
Time 90th Percentile Noise Limit
700 ndash 2300 55
2300 ndash 700 50
During the turnaround period periodic noise monitoring is completed around the refinery
to verify compliance with this condition and Condition 55 (noise monitoring)
Condition 39
The Refinery shall ensure that the sour-gas-to-sweet-gas by-pass valve remains closed
and secured
The valve is not capable of opening It is locked with a numbered tag
Condition 40
Maintain tanks storing volatile organic compounds in accordance with CCME
guidelines Environmental Guidelines for Controlling Emissions of Volatile Organic
Compounds from Aboveground Storage Tanks June 1995
The refinery continues to perform tank inspection maintenance and repair under their
tank upgrade program Irving Oil operates a Storage Tank Maintenance and Inspection
Program which incorporates the requirements of the Canadian Council of Ministers of the
Environment (CCME) Environmental Guidelines for Controlling Emissions of Volatile
Organic Compounds from Aboveground Storage Tanks VOC emissions reported to the
Department from this source have averaged approximately 113 Tonnes from 2015 to
2018
EPISODE CONTROL
Condition 41 amp 42
Maintain and provide updates to the Director as they are prepared a Sulphur Dioxide
Response Plan the purpose of which is to prevent exceedances of the maximum
permissible ground-level concentrations of sulphur dioxide as per Schedule C of the
Air Quality Regulation - Clean Air Act
Implement procedures as required to prevent exceedances of the maximum permissible
ground-level concentrations of sulphur dioxide as per Schedule C of the Air Quality
Regulation - Clean Air Act This includes but is not necessarily limited to
implementation of procedures invoked by the Irving Oil Refining GP Sulphur Dioxide
Response Plan
The refinery continues to implement the Sulphur Dioxide Response Plan when necessary
Sulphur dioxide concentrations are monitored 24 hours a day by operators within the
Refinery Control Centre If sulphur dioxide levels rise beyond pre-set limits at any one of
the six monitors the refinery takes action to reduce sulphur dioxide emissions in an effort
to prevent exceedances of the regulated standards The information received at the
refinery consists of instantaneous sulphur dioxide concentrations 5-minute rolling
averages and hourly and 24 hour sulphur dioxide averages
Condition 43amp 44
Ensure that within sustainable limits the feed to the HATGU is maximized so as to
minimize sulphur dioxide emissions from the Sulphur Block
Ensure that the gaseous effluent from the Amine Sulphur Recovery Units and the Sour
Water Stripping Units is directed during normal operation to the Sulphur Recovery
Units and HATGU andor the Sulphuric Acid Regeneration Unit and during upset
conditions to flare stacks No 2 andor No 3 where upset means an inability to
beneficially operate any of the components associated with the recovery of sulphur
The HATGU is an integral part of the pollution control system and refinery operations
The SO2 emissions from the Sulphur block remain steady and well within the limits set
out in Condition 32
These conditions are in place to ensure Sulphur emissions are reduced as much as
possible
Condition 45 amp 46
Conduct all Maintenance and Turnaround operations in a manner that minimizes
emissions to the environment All necessary and reasonable measures shall be taken to
prevent impacts on the ambient environment including the creation of odorous or noisy
emissions Where Turnarounds are conducted the Approval Holder shall continue to
conduct all operations in compliance with the Approval
The Approval Holder shall ensure that maintenance decommissioning construction
andor commissioning activities which are known or suspected to be noisy shall be
limited to the hours between 0700 and 2300 Monday to Saturday During periods
when noisy activities are scheduled to be conducted either between the hours of 2300
and 0700 on Sunday or on Statutory Holidays the Approval Holder shall provide the
Departments Saint John Regional Office with advance notification of 2 days
These conditions are in place to ensure periods of potentially increased noise levels are
minimized as much as possible
Condition 47
At least once per year conduct training for its staff with respect to the impacts of its
operation (normal and abnormal) such that operation staff are aware of the potential
for environmental impacts on the surrounding communities and are thereby better
prepared to operate the Facility in a manner which is pro-active in identifying and
mitigating impacts
350 employees have been trained in an hour presentation in 2019 alone Following this
all new employees will receive this training This ensures that if there is an upset or issue
operational staff are aware of the notification protocols and potential environmental
impacts
TESTING AND MONITORING
Condition 49
The Approval Holder shall continuously monitor the flow rate temperature and
sulphur dioxide concentrations from the Sulphur Recovery Units (SRUs) when flue
gases are being directed through the SRU stacks The Approval Holder shall also
continuously monitor the flow rate temperature sulphur dioxide and nitrogen oxide
concentrations from stacks associated with the Sulphuric Acid Regeneration Unit the
Flue Gas Scrubber and the Heat Recovery Steam Generators Continuous Emission
Monitors shall be maintained and performance tested in accordance with the
CONTINUOUS EMISSION MONITORING SYSTEM (CEMS) CODE dated 1998
as published by Alberta Environmental Protection Environmental Service Records of
quality-assured data shall be maintained for a minimum of three years and made
available in electronic or hard copy when requested by the Department
The CEMS testing allows operators to effectively operate these units and minimize
sulphur emissions
Condition 51
Continue to implement the Fugitive Volatile Organic Compound Emissions
Measurement and Reduction Program in accordance with the Environmental Code of
Practice for the Measurement and Control of Fugitive Emissions from Equipment
Leaks as published by the Canadian Council of Ministers of the Environment
(CCME) dated October 1993
The Leak Detection and Repair (LDAR) Program is completed annually at the refinery as
per the current federal CCME Code of Practice The program includes through
identification inspection and analysis of all assessible components susceptible to volatile
organic compounds (VOCs) leaks including pumps valves and their seals as well as
flanges and their gaskets
The LDAR Program helps to improve plant operation and reduces the release of VOCs
When leaks are identified and as conditions allow repairs are made to correct leaks
Table 7 demonstrates the reduction in fugitive VOC emissions from the Detection and
Maintenance Program
Year Reduction in Fugitive
Emissions
2015 33
2016 18
2017 17
2018 24
Condition 52
By September 30 of each year investigate odour mitigation as it may be applied the
tank farm and in particular the tanks within the tank farm that are or have been
determined to have the greatest contribution to odorous impacts As part of this on-
going investigation the Approval Holder shall prepare annual reports that delineate the
efforts to control odours from these source types the results of these investigations any
mitigation to be permanently applied and any further investigations that are planned
for the succeeding year If the Approval Holder determines that there is a no more that
can be done to mitigate odours the report submitted is to reflect this conclusion
The refinery has multiple programs and procedures in place to continue to mitigate
odours from petroleum storage tanks These include the Tank Life Extension Program
odour abatement systems third party tank degassing systems and operation of tanks
according to the CCME Environmental Guidelines for Controlling Emissions from
Above Ground Storage Tanks
Irving Oil maintains tanks through the Tank Life Extension Program The Program
objective is to achieve compliance with the American Petroleum Institute (API) 653 for
above ground storage tanks The maintenance work reduces VOC emissions and the
potential associated odours
The odour abatement system is used to mitigate odours in the community from the tank
field This system is on standby and is always available in the event that odours are
detected
During the 2016 Turnaround the third-party degassing system was used at the refinery as
a preventative measure No concern calls were received in relation to odours during this
turnaround period The system has proven to be an effective way to minimize tank odours
and VOCs and will be considered on a case-by-case basis during future turnarounds and
tank maintenance
Reid vapour pressure testing and tank temperatures are routinely monitored to maintain
products within the CCME Guidelines to protect the integrity of internal floating rooves
and seals
Odour concern calls have reduced overall from this Approval period compared to the last
Approval period In 2015 there was a spike due to internal seal damage on the recovered
oil tank This tank was taken out of service and repairs were made to address this issue
Conditions 53amp54
Operate and maintain six sulphur dioxide ambient monitors in the east Saint John
area and provide the refinery and the Department with real-time access to the
information gathered by these monitors Operate and maintain the appropriate
hardware and software to provide the Facility with independent and real-time access to
data
As a condition of the amended air quality approval to operate Irving Oil Refining GP is
required to operate and maintain six ambient sulphur dioxide monitoring stations in east
Saint John These are located north of the refinery at the Silver Falls Irving to the south-
south east at the Irving Forest Products site in the Grandview Industrial Park to the south
at the blower building for the Irving Paper lagoon (known as Grandview West 1)
Midwood Avenue Champlain Heights subdivision and Forest Hills The Department and
the refinery both have rapid access to the information collected at the six monitoring
stations
The refinery is one of several significant sources of sulphur dioxide in the Saint John
region and elevated ambient concentrations of sulphur dioxide may result from emissions
from any or all of these sources The exceedances of the sulphur dioxide ambient
objectives at various monitoring locations in East Saint John are shown in Table 8
Exceedances have decreased dramatically since the installation of the HATGU and there
have been only a few exceedances throughout the lifetime of the Approval
Table 8 Exceedances of Maximum Permissible Ground Level Concentrations
(Provincial Objectives) for SO2 East Saint John
Midwood Avenue
Champlain Heights
Grandview West 1
Forest Hills Forest Products
Silver Falls
1-HR OBJECTIVE
2015 0 0 4 0 0 0
2016 0 0 1 1 0 0
2017 0 0 0 0 0 0
2018 0 0 0 3 0 0
2019 0 0 2 0 0 0
24-HR OBJECTIVE
2015 0 0 0 0 0 0
2016 0 0 0 0 0 0
2017 0 0 0 0 0 0
2018 0 0 0 0 0 0
2019 0 0 1 0 0 0
2015
The one-hour objective was exceeded on 4 occasions all occurring at the Grandview
West (Irving Oil Limited - IOL) monitoring station during January and February Some
operational issues were experienced with the Hydrogenation Amine Tail Gas Unit at IOL
which were assessed and mitigated
2016
The one-hour objective was exceeded once (one-hour duration) at the Grandview West
station (Irving Oil Ltd) on November 24th This was associated with a short interruption
of the operation of the sulphur plant at the refinery
2019
The one-hour objective was exceeded twice (one-hour duration) on November 7th amp 8th
and the 24-hour objective was also exceeded Nov 8th The SO2 exceedance source was
identified as elevated SO2 emissions from the Sulfuric Acid Regeneration Unit (SARU)
stack On the 7th an unplanned maintenance outage occurred and on the 8th the SARU was
in heat-up mode from a planned maintenance outage
Condition 56
The Approval Holder shall continue to implement the Refinery Implementation
Strategy Plan for Continuous Improvements in Odour Management and prepare an
annual update to summarize the years work to address odours andor odour
assessment
In 2010 an Odour Impact Assessment Follow Up study was completed that included a
strategy for continued improvements in odour mitigation initiatives and monitoring The
recommendations included
bull Continued focus on minimizing odour calls from flaring activity
bull Maintain community concern call program
bull Tank Maintenance and monitoring program
bull Utilizing refinery odour dispersion model
For flaring activity efforts have focussed on optimizing the flare steam to fuel ratio to
reduce concern calls and exceedances related to Total Reduced Sulphur (TRS) at the
ambient monitoring stations In 2014 reported concern calls for flaring was 29 compared
to 2 in 2018 There were only 3 reported TRS Exceedances combined from 2015 to 2018
The community concern call program and tank maintenance and monitoring program are
described in other sections of the Facility Profile
In 2013 an air dispersion model system of odour emissions generated by sources at the
refinery was purchased The refinery was modelled according to various refinery
scenarios using weather station data in order to evaluate odour impacts to the surrounding
neighbourhood
The model was initially utilized to help identify areas for improvement within the
refinery odour footprint and reduce concern calls Since this initial period the key
sources of odours have been recognized and the model has been used less frequently The
model is available in the event that it might be required for future identification of odour
sources
Condition 57
Prior to February 01 2016 develop an Ambient VOC Monitoring Plan to implement
around the refinery boundary to better quantify the ambient air quality in relation to
VOCs
Irving Oil developed a VOC Fenceline Monitoring Study which was completed from
June 2016 Through August 2017 Irving contracted a local engineering firm to prepare
the plan and conduct the testing Twelve sample locations were selected around the
refinery perimeter with a total of 312 samples collected The air contaminants monitored
included benzene 13-butadiene ethylbenzene toluene and xylenes
Irving Oil was the first refinery in Canada to conduct this type of study and selected the
USEPA method 325AB This method is a regulatory requirement in the United States for
oil refineries for fenceline monitoring In this method VOCs are collected from air using
a diffusive passive sampler at specified locations around the facility boundary
The US EPA fenceline benzene action level (limit) is 9ugm3 and all measured results at
the selected refinery fenceline sample locations were below the action level (limit) by a
significant margin Table 9 summarizes the results obtained from the study
Table 9 Summary of Results from the VOC Fenceline Monitoring
Location Benzene
(ugm3)
13-butadiene
(ugm3)
Ethylbenzene
(ugm3)
Toluene
(ugm3)
Xylenes
(ugm3)
1 082 lt030 06 348 234
2 248 037 193 127 827
3 115 037 072 35 285
4 155 033 107 481 444
5 18 032 108 589 443
6 08 lt030 lt055 263 209
7 058 lt030 lt041 111 102
8 042 lt030 lt040 066 lt080
9 042 lt030 lt050 19 153
10 035 lt030 lt041 075 lt089
11 048 lt030 lt045 154 11
12 052 lt030 lt041 124 093
Annual Average Ambient
Guidelines (ugm3)
3 and 045
and 9
03 and 2 200 - -
Alberta guideline is 3 ugm3 Ontario guideline is 045 ugm3
Quebec guideline is 03 ugm3 and Ontario guideline is 2 ugm3
USEPA action rule is 9 ugm3
REPORTING
Condition 63
Submit any updates to the Five-Year Source Testing Plan
Performance tests have been completed as required based on the approved 5 Year Source
Testing Plan
General
Monthly and annual reports are submitted as required Irving Oil Refining is in
compliance with all report submission requirements Additional information in the
reports that have not been discussed in the Facility Profile are described below
Condition 64 d)
Summary of emissions of VOCs and benzene
Table 10 demonstrates the annual VOC emissions and Table 11 demonstrates the annual
Benzene emissions
Table 10 Annual VOC Emissions (Tonnes)
Source 2015 2016 2017 2018
Fugitive emissions 86 149 147 151
Tank Farm 101 112 126 114
Fuel Distribution 77 78 75 73
Stack emissions 87 87 68 65
Spills 2 2 0 1
Flares 77 36 41 54
Wwtp 35 32 34 36
TOTAL 467 497 491 493
Table 11 Annual Benzene Emissions (Tonnes)
Source 2015 2016 2017 2018
Fugitive Emissions 1081 1346 1590 1644
Tank Farm 0445 0399 0334 0301
Fuel Distribution 0025 0026 0025 0025
Stack emissions 0000 0000 0000 0
Spills 0001 0001 0000 0
Flares 0000 0000 0000 0
Wwtp 0611 0545 0580 0621
TOTAL 2162 2317 2528 2591
VOC and Benzene emission have remained fairly consistent over the lifetime of the
Approval
Condition 64 e)
the annual average maximum and standard deviation of the daily mean
concentrations of sulphur (expressed as hydrogen sulphide) in Refinery Fuel Gas
Table 12 H2S Concentration in Fuel Gas
H2S 2015 2016 2017 2018
Average vol 00013 00007 00007 00006
Maximum mean vol 01050 00143 00711 00033
Standard deviation vol 00068 00011 00037 00007
Refinery fuel gas composition has remained fairly consistent over the lifetime of the
Approval
Enforcement
Enforcement options used by the Department of Environment are outlined in the
Departments Compliance and Enforcement Policy These may include but are not limited
to schedules of compliance verbal and written warnings orders and prosecutions
Although not specifically outlined in the Policy it is also possible to amend approvals
with more stringent conditions both during its valid period or at the time of renewal to
address specific compliance issues or to improve the environmental impact of the facility
Most recently a new Regulation under the Clean Air Act allows for the issuance of
administrative penalties for minor violations as an alternative to traditionally used
enforcement options
During the life of the current Approval Irving Oil Refinery GP Saint John Refinery has
had no warnings or orders issued nor have there been any prosecutions initiated by this
agency during this period related to air quality
PUBLIC OUTREACH
Call Monitoring
The Irving Oil Refinery receives calls related to air quality noise and other issues in east
Saint John The refinery has a call response procedure that must be followed by the
person who receives the information All calls are investigated and response is provided
to those callers who identify themselves Table shows the number of calls received by the
refinery in the last 4 years
Table 6 Concern calls received directly by the refinery
Year Odour Noise Misc PM Total
2015 48 4 5 10 67
2016 21 14 4 0 39
2017 17 15 2 8 42
2018 11 19 98 0 128
Overall the number of concern calls has decreased for the lifetime of the Approval
compared to the previous one The spikes are contributed to specific upsets at the Facility
including
bull Odour complaints in 2015 following an upset of the floating roof of Tank 100 in
February and a mercaptan leak in September
bull Miscellaneous concern calls in 2018 following the fuel gas oil release from the
FCCU in June
Community Outreach
Community Liaison Committee
The Irving Oil Community Liaison Committee was formed in 1998 as a requirement of
the Environmental Impact Assessment Determination on the refinery Upgrade Project
The purpose of the committee was to liaise with stakeholders on issues associated with
the Refinery Upgrade Project The committee made up of neighbours government
representatives and employee team members continues to operate even though the
Upgrade Project has been completed The Community Liaison Committee meets
quarterly to discuss new projects and review developments on the refineryrsquos safety and
environmental performance
Neighbourhood Tours
Tours are conducted in the neighbourhood using a hybrid vehicle as required The car
was selected for its environmental performance and is used daily by members of the
Environment Group to identify noise andor odours that may be coming from the
refinery If an odour or noise is detected the refinery is inspected for potential sources
Actions are promptly taken to mitigate or eliminate the concern
The tour includes 18 test points including points on Loch Lomond Road Forest Hills
Church Creighton Avenue and four locations along Grandview Avenue The tour also
includes inside the refinery Areas such as the tank farms are inspected for harsh smells
and wind direction
Letters to Neighbours
Irving Oil keeps neighbours informed of events occurring at the refinery through letters
that our either mailed or hand delivered to nearby homes Topics discussed in these
letters include maintenance turnarounds construction notices and project notifications
For both the FCCU catalyst release and fuel gas release letters were hand delivered to
affected neighbours to provide information on the occurrence
Neighbourly News
The Irving Oil Refinery delivers two newsletters annually to approximately six thousand
residents around the Refinery This newsletter serves as a link between the refinery and
the neighbours to keep them up-to-date on the refinerys activities as well as their
environmental initiatives
CONTACTS
For further information on the operation of the Irving Oil Refining GP refinery please
contact
Robyn McMullen
Environment Manager
Irving Oil Refining GP
PO Box 1260
Saint John New Brunswick
E2L 4H6
Telephone (506) 202-2361
Fax (506) 202-4050
E-mail RobynMcMullenirvingoilcom
Principal Contact Saint John Region
Patrick Stull
Regional Director
Region 4 Office
Program Operations and Enforcement Branch
NB Department of Environment amp Local Government
8 Castle Street PO Box 5001
Saint John New Brunswick
E2L 4Y9
Telephone (506) 658-2558
Fax (506) 658-3046
E-mail PatrickStullgnbca
For further information on this document or on environmental regulations relating to air
quality please contact
Sheryl Johnstone
Senior Approvals Engineer
Authorizations Branch
New Brunswick Department of Environment amp Local Government
PO Box 6000 20 McGloin St
Fredericton New Brunswick
E3B 5H1
Telephone (506) 444-4599
Fax (506) 457-7805
E-mail SherylJohnstonegnbca
For comments or enquiries on the public participation process please contact
Chandra Clowater
Acting Manager
Public Education Stakeholder and Fist Nation Engagement Branch
New Brunswick Department of Environment amp Local Government
PO Box 6000 20 McGloin St
Fredericton New Brunswick
E3B 5H1
Telephone (506) 457-7511
Fax (506) 453-3843
E-mail ChandraClowatergnbca
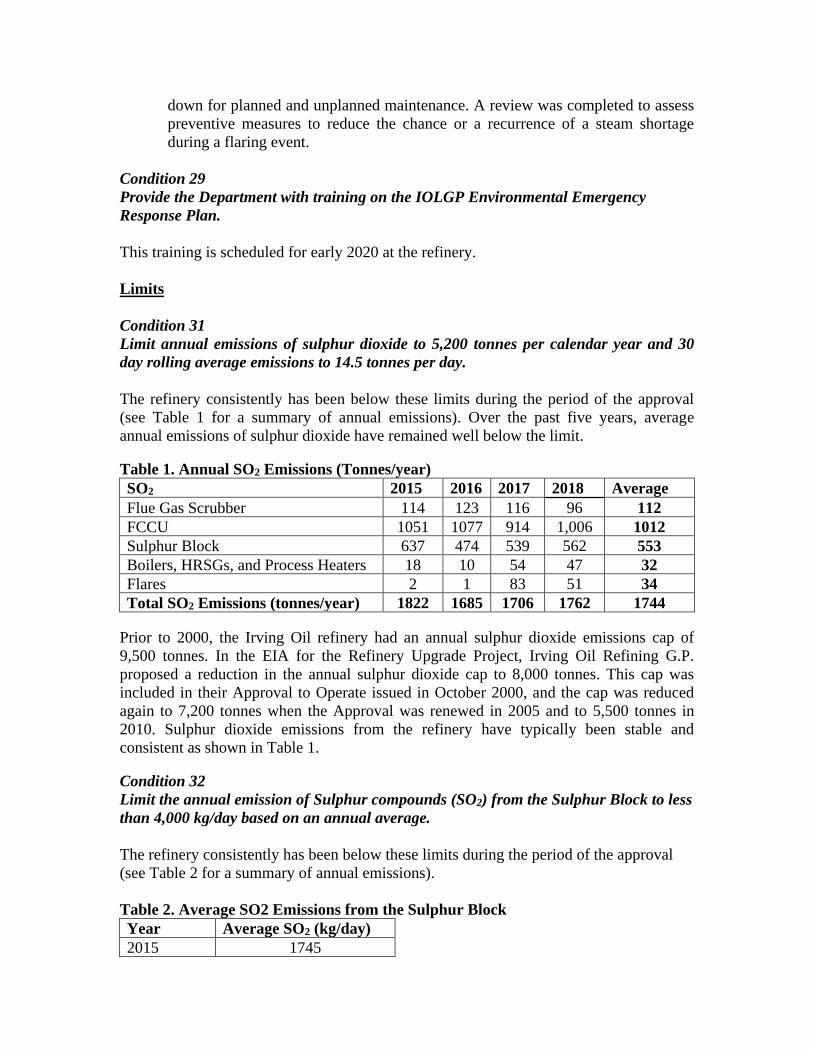
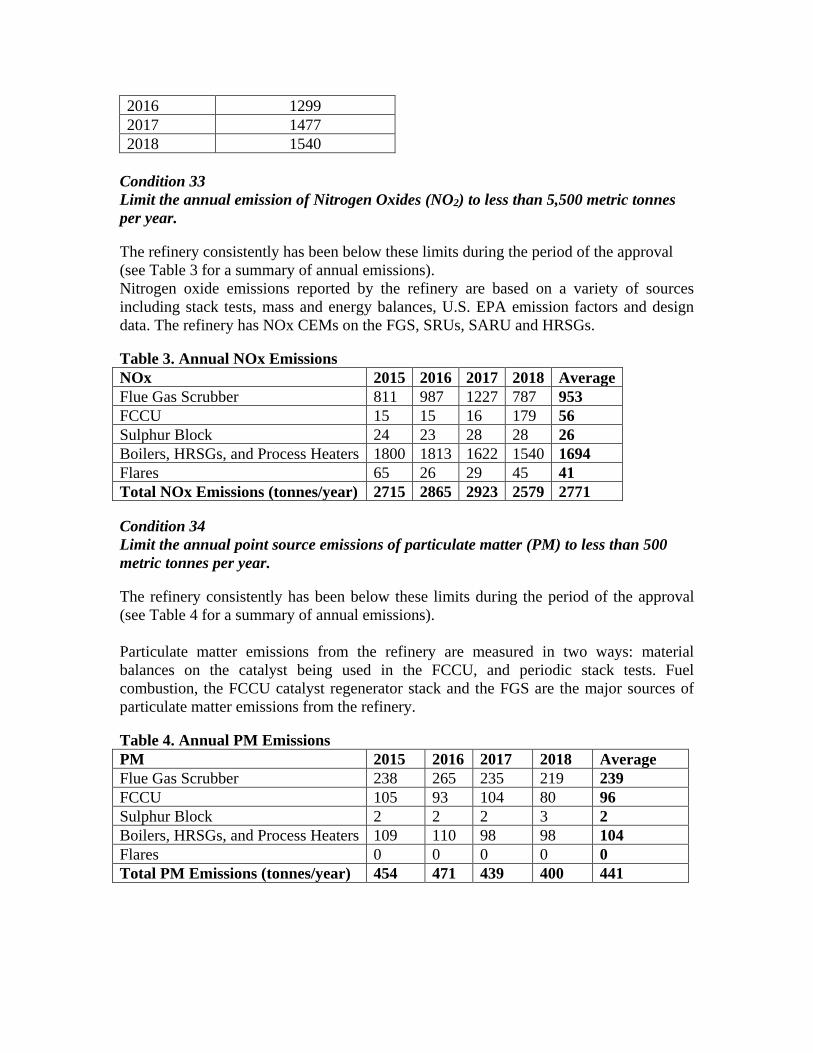
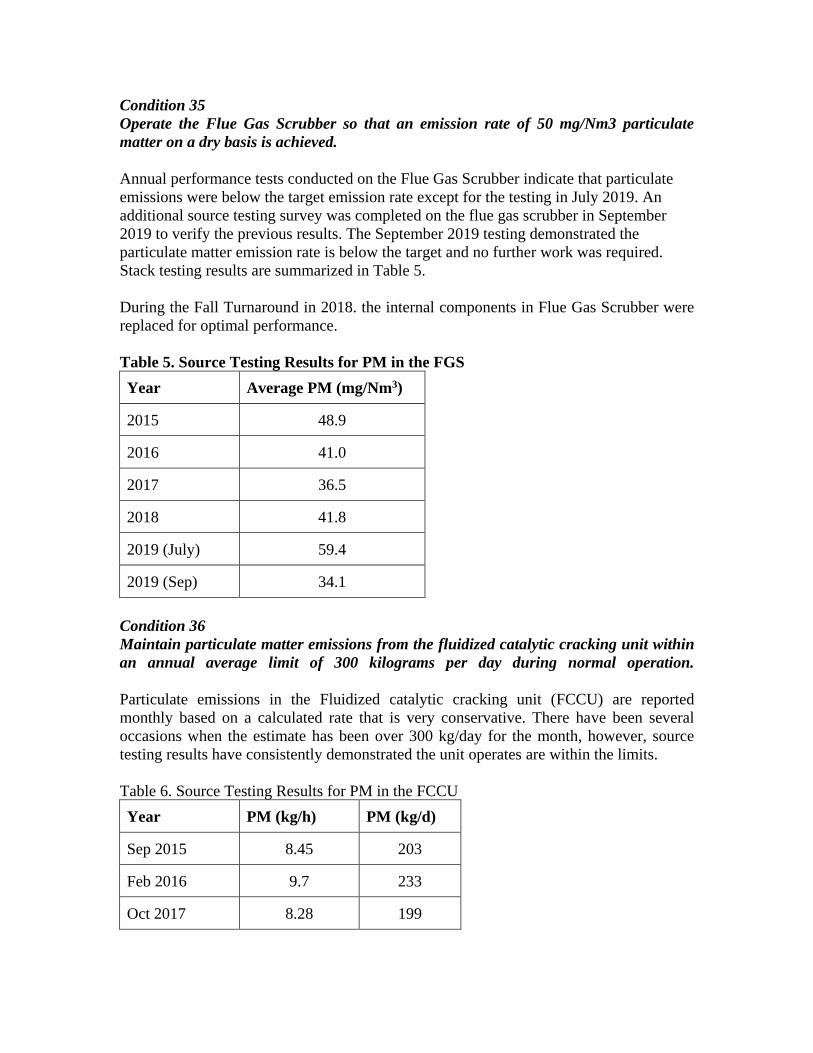
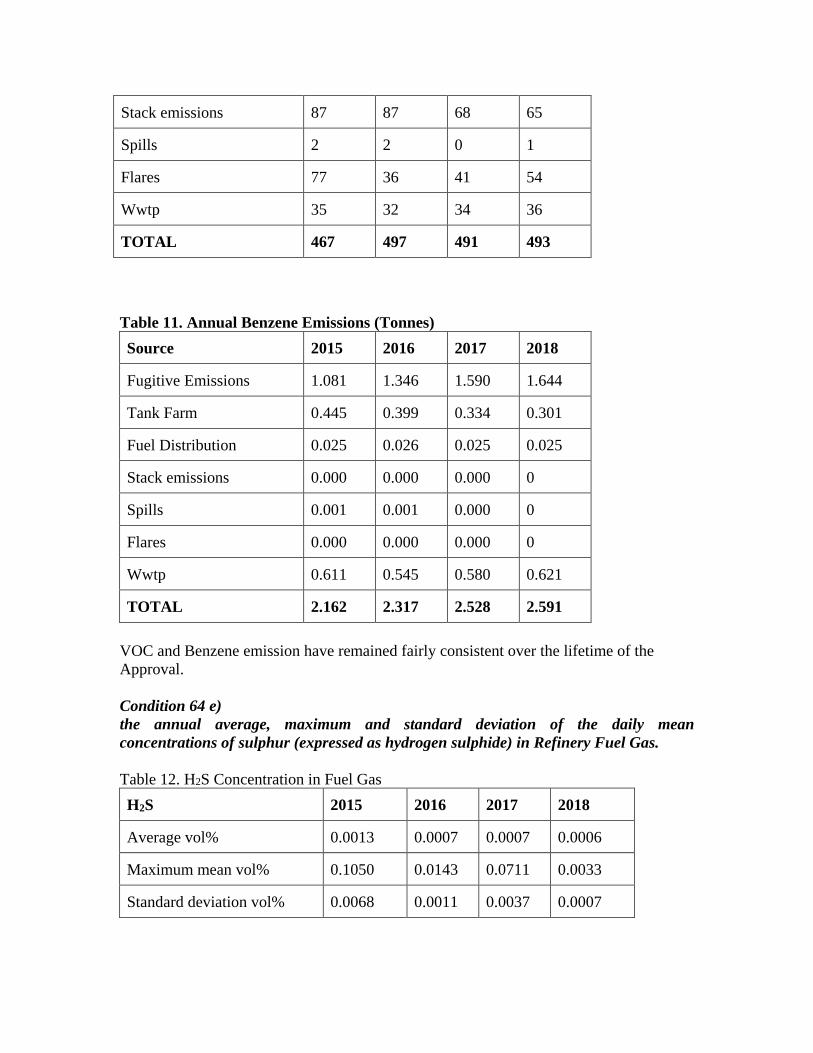
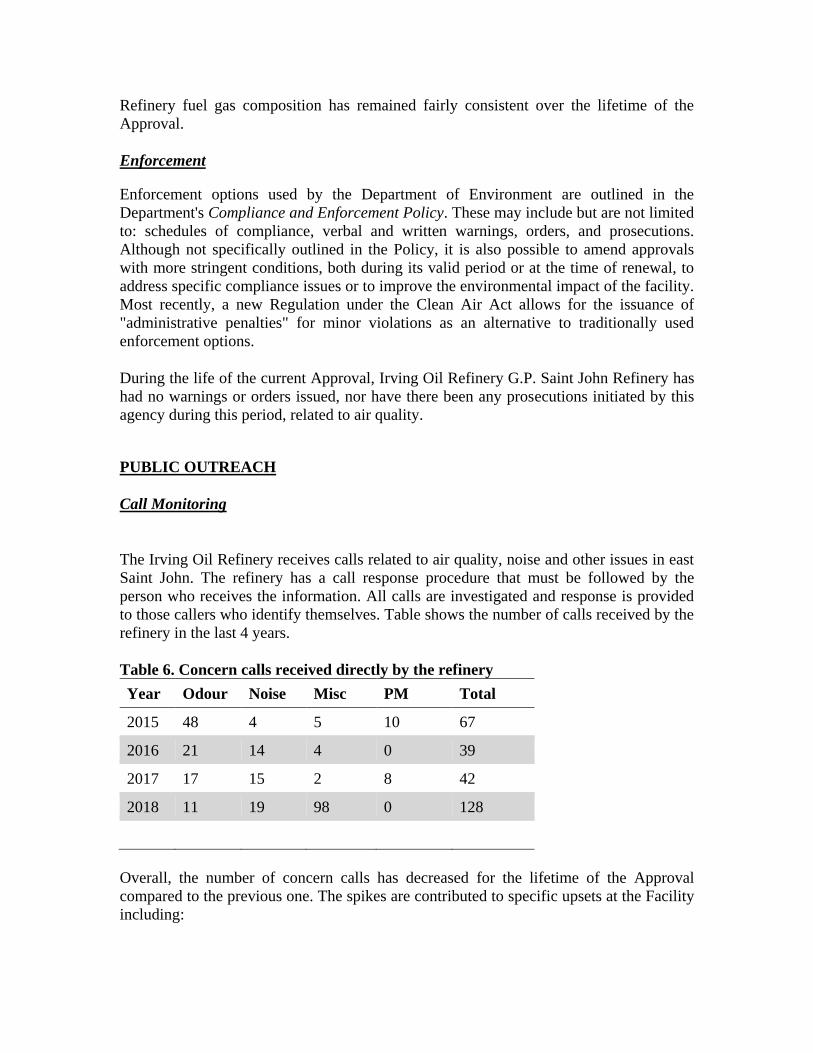
Chandra Clowater
Acting Manager
Public Education Stakeholder and Fist Nation Engagement Branch
New Brunswick Department of Environment amp Local Government
PO Box 6000 20 McGloin St
Fredericton New Brunswick
E3B 5H1
Telephone (506) 457-7511
Fax (506) 453-3843
E-mail ChandraClowatergnbca