Facility Operation and Monitoring Evolution, not Revolution
39
© CBE – ISO14644 Facility Operation and Monitoring Evolution, not Revolution © CBE Pty Ltd This training program is copyright to CBE Pty Ltd and may not be modified, reproduced, sold, loaned, hired or traded in any form without its the express written permission. 1
Transcript of Facility Operation and Monitoring Evolution, not Revolution

© CBE – ISO14644
Facility Operation and Monitoring
Evolution, not Revolution
© CBE Pty Ltd
This training program is copyright to CBE Pty Ltd and may not be modified,
reproduced, sold, loaned, hired or traded in any form without its the express
written permission.
1

© CBE – ISO14644
Progression of Cleanrooms
REVOLUTION (1)
(Past / Now)
EVOLUTION
(Now / Future)
REVOLUTION (2)
(Future)
2

© CBE – ISO14644
Current Issues
3
R E V O L U T I O N (1)

© CBE – ISO14644
Current Issues
Limited Understanding of Cleanrooms
Poor design
Over-design
Poorly tested and characterised cleanrooms
Out-dated regulations
4
© CBE – ISO14644
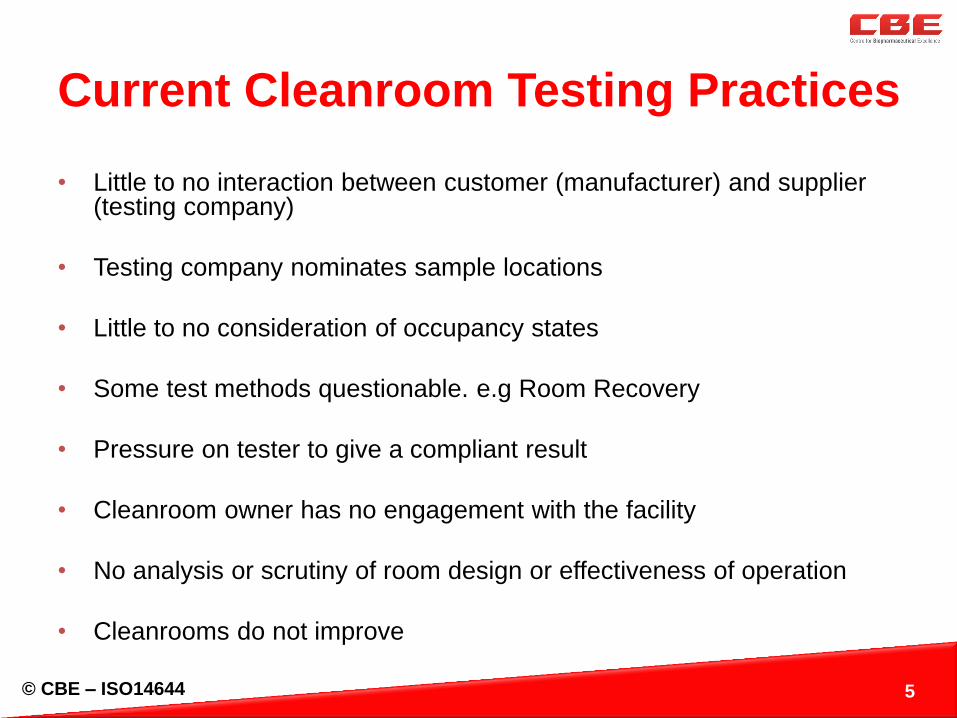
Current Cleanroom Testing Practices
• Little to no interaction between customer (manufacturer) and supplier (testing company)
• Testing company nominates sample locations
• Little to no consideration of occupancy states
• Some test methods questionable. e.g Room Recovery
• Pressure on tester to give a compliant result
• Cleanroom owner has no engagement with the facility
• No analysis or scrutiny of room design or effectiveness of operation
• Cleanrooms do not improve
5

© CBE – ISO14644
New ISO 14644 Standards
6
E V O L U T I O N

© CBE – ISO14644
New ISO 14644 Standards
Part 1 – Classification of air cleanliness by particle concentration (Published 2015)
Part 2 – Monitoring to provide evidence of cleanroom performance related to air cleanliness by particle concentration (Published 2015)
Part 3 – Test Methods (Under review)
Part 4 – Design, Construction and Start-Up (Under review)
Part 16 – Code of practice for improving energy efficiency in cleanrooms and clean air devices (Committee Draft prepared)
Part 17 – Particle Deposition Rate (Under development)
7

© CBE – ISO14644
1999 First edition of Part 1: Classification of Air Cleanliness published
2000 First edition of Part 2: Specifications for testing and monitoring to prove continued compliance with ISO 14644-1 published
2001 Notice of cancellation of FED-STD-209E. US adoption of Parts 1 & 2
2002 AS/NZS ISO 14644 Part 1 and AS/NZS 14644 Part 2 published (mirror document with extra appendices)
2005 First meeting to discuss update to Parts 1 & 2
2015 New Parts 1 & 2 published
2017 AS (/NZS) ISO 14644 Part 1 & 2 to be published (mirror document)
ISO 14644 Part 1 & 2 History

© CBE – ISO14644
Legislated Guidelines
• PE 009 (Annex 1) References EN ISO 14644 Part 1 & 2
‒ EN ISO 14644 Parts 1 & 2 2015 already released (mirror copy)
• Blood products references PE 009 Annex 1
• Veterinary Code references AS/NZS ISO 14644 Part 1
Other Guidelines & Standards
• PE010 References EN ISO 14644 Part 1 & 2
• USP797 references ISO 14644 Parts 1 (1999) & 4 (2001)
• AS2252.5 (CDSCs) AS/NZS ISO 14644 Parts 1 & 3
• AS2252.6 (Clean workstations) AS/NZS ISO 14644 Parts 1, 4 & 5
NATA
• NATA references AS/NZS ISO 14644 Parts 1 & 3
9
What is affected by the updated Parts 1&2?

© CBE – ISO14644 10
Part 1 classification changes

© CBE – ISO14644
ISO 9 now only an “in operation” classification
Intermediate decimal classes – now only 0.5 increment
‒ “Uncertainties associated with particle measurement make increments of less than 0.5 inappropriate”
Definition of a macroparticle descriptor M
‒ For particles larger than 5µm
11
Other Classification Changes

© CBE – ISO14644
* Table derived from PE009-8 Annex 1 Clause 4
**Approximate (e.g. for ISO 7 ≥5.0µm limit is 2,930 as per AS/NZS ISO 14644 Part 1)
5µm concentration for Grade A and Grade B at rest no longer recognised
ISO 4.8 no longer recognised
12
Impact to Annex 1
Grade
Maximum permitted number of particles/m³ *
At rest In operation
≥0.5µm ≥5.0µm ISO**
Equivalent ≥0.5µm ≥5.0µm
ISO**
Equivalent
A 3,520 20 ISO 4.8 3,520 20 ISO 4.8
B 3,520 29 ISO 5 352,000 2,900 ISO 7
C 352,000 2,900 ISO 7 3,520,000 29,000 ISO 8
D 3,520,00
0 29,000 ISO 8
Not
Defined
Not
Defined
Not
Defined

© CBE – ISO14644
Updated Annex 1?
Federal Standard 209E only considered one particle size - 0.5µm.
Grades A and B will be out of step with other Annex 1 grades
However there is no requirement to qualify to more than one particle descriptor in ISO 14644 Part 1
13
Points to Consider

© CBE – ISO14644
Why keep the 5µm descriptor?
From Annex 1 – Regular counts of particles ≥5µm… “may indicate early failure of the HVAC system, filling equipment failure or may also be diagnostic of poor practices during machine set-up and routine operation.” Clause 13 (part)
Microbe Carrying Particles (MCPs). Micro contamination in this space typically occurs when a microbe attached to a large particle (>5µm) enters the work space.
ISO 14644-1 gives permission to use ≥5.0µm through the macroparticle descriptor M.
Classify according to ISO 14644-1 using ≥0.5µm only. Monitor according to Annex 1 using both ≥0.5µm and ≥5.0µm .
14
Points to consider cont…

© CBE – ISO14644
Old method based on the “square root of n+1” sampling technique
New number of samples based on a unit area, where the particle distribution is considered homogenous
• 2m² for cleanrooms <12m²
• 4m² for cleanrooms >12m²
To make sampling cost effective, statistical model is applied that…
“…provides at least 95 % confidence that at least 90 % of the cleanroom or clean zone area does not exceed the class limits.”
ISO 14644-1 :2015 A.4.1
15
The new sampling method

© CBE – ISO14644
Area of cleanroom (m2) less than or equal to
Minimum number of sampling locations to be tested (NL)
2 1
4 2
6 3
8 4
10 5
24 6
28 7
32 8
36 9
52 10
56 11
64 12
68 13
72 14
76 15
104 16
108 17
116 18
148 19
156 20
192 21
232 22
276 23
352 24
436 25
636 26
1000 27
>1000 See Formula (A.1)
16
Table A.1 from ISO 14644-1:2015

© CBE – ISO14644
From section A.4.2:
a) use the minimum number of sampling locations NL derived from Table A.1
b) divide the whole cleanroom or clean zone into NL sections of equal area
c) select within each section a sampling location considered to be representative* of the characteristics of the section, and
d) at each location, position the particle counter probe in the plane of the work activity or another specified point.
In addition to the above:
• You can choose other locations considered critical
• You can use additional sampling locations to facilitate subdivision into equal sections
* Locations may not be representative if they are located directly beneath non-diffused supply air sources (A4.2.1)
17
Location of samples
© CBE – ISO14644
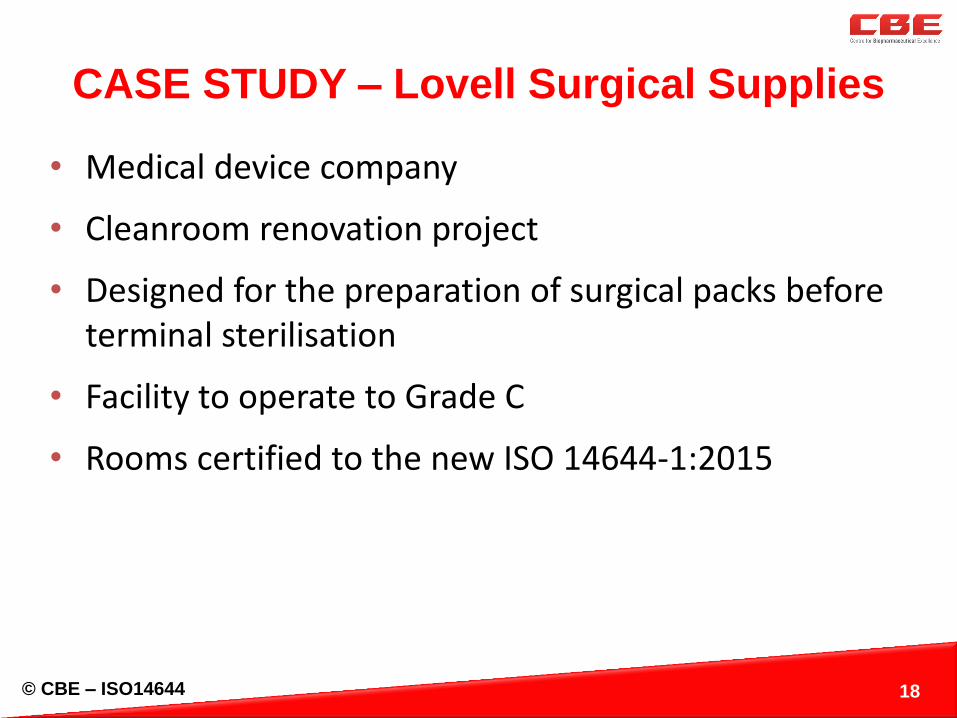
• Medical device company
• Cleanroom renovation project
• Designed for the preparation of surgical packs before terminal sterilisation
• Facility to operate to Grade C
• Rooms certified to the new ISO 14644-1:2015
18
CASE STUDY – Lovell Surgical Supplies

© CBE – ISO14644 Fa
cil
ity l
ayo
ut
19
© CBE – ISO14644
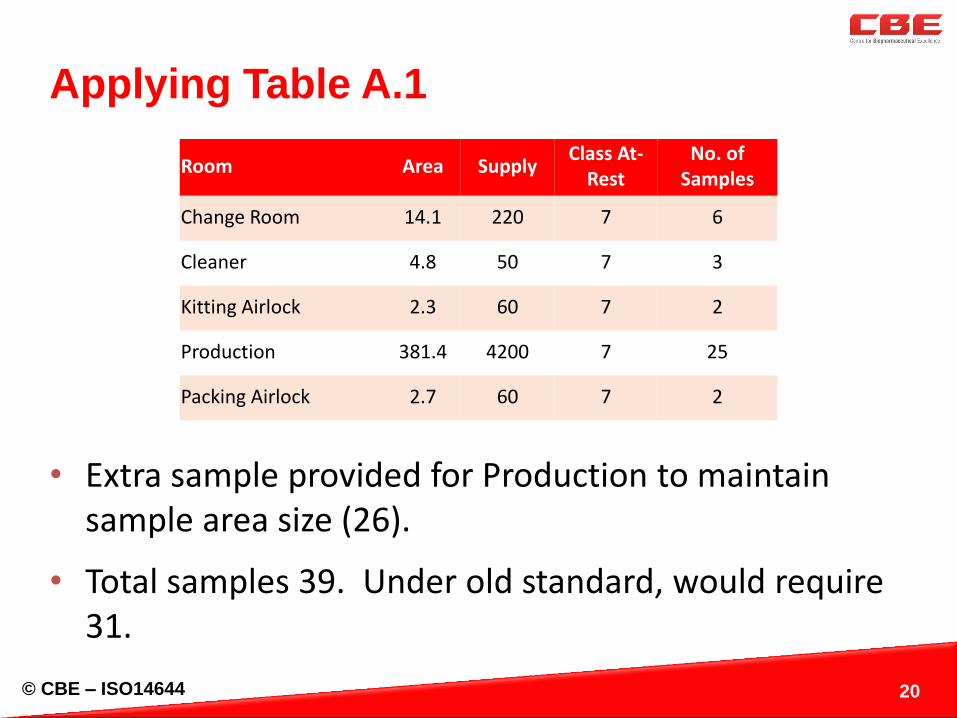
• Extra sample provided for Production to maintain sample area size (26).
• Total samples 39. Under old standard, would require 31.
20
Applying Table A.1
Room Area Supply Class At-
Rest No. of
Samples
Change Room 14.1 220 7 6
Cleaner 4.8 50 7 3
Kitting Airlock 2.3 60 7 2
Production 381.4 4200 7 25
Packing Airlock 2.7 60 7 2

© CBE – ISO14644 21
Sa
mp
lin
g a
rea
s

© CBE – ISO14644 22
An
aly
sis
of
sa
mp
lin
g a
rea
s

© CBE – ISO14644
• Document what is happening in each location
• Consider areas you are interested in
• Consider directional flow of air (smoke studies)
• State a reason for your choice
• Remember guidance provided in A4.2.1
• Use coordinates (X,Y) from one corner when documenting locations
• Determine height of working plane
• In this case we used the same locations for at-rest and in operation. Other facilities may consider different or extra locations for in operation
23
Choosing a “representative” sample location

© CBE – ISO14644
Sample Area Matrix
24

© CBE – ISO14644 25
Sa
mp
lin
g l
oc
ati
on
s

© CBE – ISO14644
A useful tool…
26
• Much more suitable for a cleanroom than a measuring tape
• Needs a clear line of site to the “X” wall and the “Y” wall
• Also useful when preparing layouts • Give this device to your room certifier along
with:
The Sampling Locations Map
The Sample Area
Matrix
© CBE – ISO14644
• Instead of “Specifications for testing and monitoring”, now just about monitoring
• Very little that will be new to the Life Sciences industry
Note:
From PE009-8 Annex 1, Clause 7 (part)
EN ISO 14644-2 provides information on testing to demonstrate continued compliance with the assigned cleanliness classifications.
This is no longer the case. The test frequencies will be moved to the updated Part 3. Currently they are in limbo (TGA has provided guidance on this)
From the introduction of ISO 14644-2:2015:
In some circumstances, relevant regulatory agencies may impose supplementary policies, requirements or restrictions. In such situations, appropriate adaptations of the monitoring procedures may be required.
ISO 14644 Part 2 Changes
© CBE – ISO14644
ISO 14644 Part 3 Changes
A much delayed update to this standard is pending Important meeting held in June Many editorial and technical challenges to current draft Unlikely to be published this year. Perhaps an updated DIS prepared by end of October Structure will be largely the same. Extra test described - segregation A key message is the importance of communication between the tester and the owner Standards Australia committee to consolidate AS 1807 standard for cabinets only. All cleanrooms to be tested to Part 3

© CBE – ISO14644
ISO 14644 Parts 4 and 16
ISO 14644 Part 4: Design, Construction & Start-up is being
updated.
ISO 14644 Part 16: Energy Savings is a new Code of
Practice.
Both are being revised / developed con-currently.
Both re-think the way cleanrooms are designed and
operated.
29

© CBE – ISO14644
The science of cleanroom air supply
Designing a cleanroom by air change rate, based on room volume, is bad science
For non-unidirectional flow cleanrooms, clean air dilutes contamination as it is generated. The ceiling height is irrelevant
This can be represented by the following equation:
Where:
Q = Supply air (flow rate) (m3/s)
D = total particle dispersion rate from personnel and machinery/s
ε = Contamination Removal Efficiency
C= required airborne particle concentration (no./m3) in the considered location (i.e. from ISO 14644 Part 1, Table 1)
30
© CBE – ISO14644
Using the science
Uncertainties on particle generation and the contamination removal efficiency
make calculations difficult without real data
Useful as a guide, but this formula cannot be used as the sole basis for
designing a cleanroom
For an existing cleanroom, data can be gathered and the equation applied
Thus, for a new cleanroom, the ability to reassess the air supply rate at a later
date and reset to a lower energy position can be justified
Most of your contamination is coming from your people
Simply improving your gowning or increasing your cleaning frequency can allow
you to reduce your air supply
31

© CBE – ISO14644
Turndown / Setback
If there is nothing happening in a cleanroom, then there is
minimal contamination being generated
Room air pressures MUST be maintained
Variable air flow rate during manufacturing is possible:
• Specific manufacturing activities
• Number of personnel in the room
• Control programs that can anticipate contamination
32

© CBE – ISO14644
Lovell example Cleanroom operates successfully at a traditionally low air change rate (<15 air changes an hour)
Main cleanroom had three air conditioners:
• AC-3 provides conditioned air and maintains the room pressures
• AC-1 & AC-2 just moves conditioned air around
• AC-1 & AC-2 are turned off overnight
• AC-3 ensures that central cleanroom pressure is maintained
33

© CBE – ISO14644
The future
R E V O L U T I O N (2)
34

© CBE – ISO14644
The future
Even with current technology, non-viable particle counting is an inexact science
Viable particle count results take time with old technology. The new technology still needs more work, but will revolutionise eventually
Do we need to continue to care about the particle concentration of particles between 0.5 and 5.0 micron in the corner of the room near the low level return?
Are we underestimating, or ignoring, something very important?
35

© CBE – ISO14644
What do we know?
Viable particles getting into our products is bad for business
Viable particles are typically carried on non-viable particles that
are >12 micron in size (Microbe Carrying Particles – MCPs)
Particles <5 micron are easily entrained in moving air and removed
from the cleanroom
Particles >5 micron tend to settle out in low air flow and are re-
entrained into the air through movement of personnel. They are
only removed through cleaning
In general, the critical area in a cleanroom is a very small
proportion of the overall area.
Therefore the greatest threat in a cleanroom is a large particle that
settles in a critical area. This can be evaluated through the Particle
Deposition Rate.
36

© CBE – ISO14644
ISO 14644 Part 17 ISO 14644 Part 17 – Particle Deposition Rate (PDR)
Committee draft (CD) currently being prepared by WG14
Proposed to provide guidance on:
How the PDR for particles (or macro-particles) should be measured in a cleanroom at critical locations in order to establish control of airborne contamination, and how it should be monitored to demonstrate control;
describe major mechanisms of particle deposition;
methods used to measure the PDR;
how to establish the required maximum level of a range of particles sizes;
how to use the relation between PDR and product contamination by macro-particles;
aspects of operational methods in a cleanroom that impact on the PDR during manufacturing.
37

© CBE – ISO14644
Application The particle deposition rate is an important characteristic for most cleanrooms. Considers particles between 5 and 500 micron.
It highlights the importance of gowning, cleanroom behaviour and cleaning practices.
New technologies are allowing us to monitor these particles in critical areas in real-time.
Traditional technologies allow us to characterise other variables – e.g. proportion of viable particles attached to macro-particles.
Cleanrooms will become smaller, cheaper, more efficient and more effective.
Standard will be adopted readily by electronics, optics, aerospace industries. Life sciences will probably take a little longer.
38

© CBE – ISO14644 39
Questions ?