Facilities Management Quarterly Strategic Planning Session
90
Facilities Management Quarterly Strategic Planning Session Second Quarter – Fiscal Year 2016 October – December 2015 AGENDA Opening – Phil Jones Brainstorming Session – Phil Jones Strategic Planning Metrics and Actions Plans Look Ahead – Phil Jones …Creating a Campus of Distinction
Transcript of Facilities Management Quarterly Strategic Planning Session
Facilities Management
Quarterly Strategic Planning Session
Second Quarter – Fiscal Year 2016
October – December 2015
AGENDA
Opening – Phil Jones
Brainstorming Session – Phil Jones
Strategic Planning Metrics and Actions Plans
Look Ahead – Phil Jones
…Creating a Campus of Distinction

Goal 1 - Continuously Improve Operation of Campus Facilities
Goal 2 - Create a Reliable and Sustainable Physical Infrastructure
Goal 3 - Foster a Customer Focused Organization
Goal 4 - Recruit, Develop, and Retain Quality Employees
Goal 5 - Promote Good Stewardship
Facilities Management
…Creating a Campus of Distinction
Strategic Planning Session Facilities Management’s Goals
GOAL #1
Continuously Improve Operations of Campus
"In business, words are
words, explanations are
explanations, promises are
promises, but only
performance is reality."
-- Harold Geneen, industrialist

GOAL #1 – Continuously Improve Operations of Campus Facilities Objective: 1.1: Improve Labor Availability Tactic: 1.1.1: Maintain “Wrench” Time at 70%
ACTION PLAN
4
Lead
F. O.
Actions Planned
1. Daily assignment; coordinating and monitoring of work effort.
2. Continue assignment of lead technician in absence of supervisor.
3. Supervisors and Managers weekly assignment; “Manage by Walking around.”
4. Continue to work with Zones and Shops to increase efficiencies.
5. Work with FBO and FIS to finalize RFP “Work Order Process Improvement”
6. PILOT PROGRAM: Checks and balances for all reimbursable work orders using hard copy spreadsheet
Actions Completed
1. Weekly review of work assignment completion.
2. Completed initial training in all Zones “Operating like a business.”
3. Adjusted break schedule to maximize efficiency.
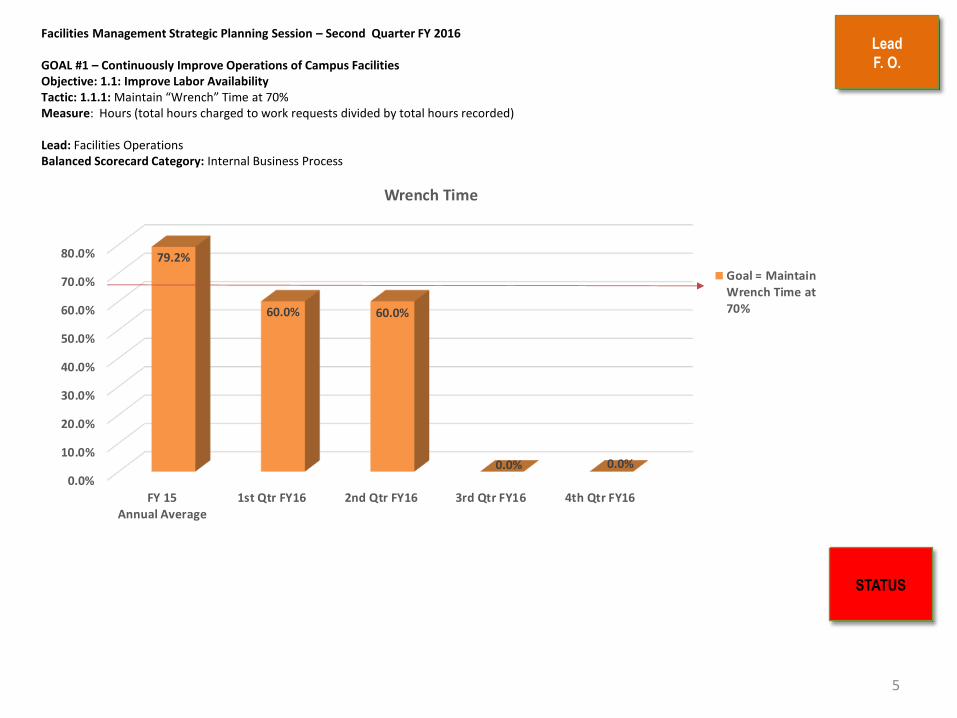
Facilities Management Strategic Planning Session – Second Quarter FY 2016 GOAL #1 – Continuously Improve Operations of Campus Facilities Objective: 1.1: Improve Labor Availability Tactic: 1.1.1: Maintain “Wrench” Time at 70% Measure: Hours (total hours charged to work requests divided by total hours recorded) Lead: Facilities Operations Balanced Scorecard Category: Internal Business Process
Lead
F. O.
5
STATUS
0.0%
10.0%
20.0%
30.0%
40.0%
50.0%
60.0%
70.0%
80.0%
FY 15Annual Average
1st Qtr FY16 2nd Qtr FY16 3rd Qtr FY16 4th Qtr FY16
79.2%
60.0% 60.0%
0.0% 0.0%
Wrench Time
Goal = MaintainWrench Time at70%

GOAL #1 – Continuously Improve Operations of Campus Facilities Objective: 1.2: Improve Logistics Efficiency Tactic: 1.2.1: Improve Non-stock on-time delivery to 95% Tactic: 1.2.2: Reduce Average Non-stock Requisition to Receipt Time to 3.5 Days
ACTION PLAN
6
Lead
F. O.
Actions Planned
1. Weekly review of items that have been ordered repeatedly as non-stock items to stock as order-on-request items (carried at an inventory level of “zero” but pre-sourced for faster ordering and delivery). Monitor daily tracking of long lead items and spikes in usage (historically the main causes for inability to fill).
2. Continue to send out daily email reminders for approvers (Supervisors, Admins and Managers).
3. Monitor the requisition to PO processing time and discuss weekly.
Actions Completed
1. Promoted the continued use of SDI Punch-out.
2. Assigned additional approvers to help expedite the process.
3. Streamlined stock inventory
Facilities Management Strategic Planning Session – Second Quarter FY 2016
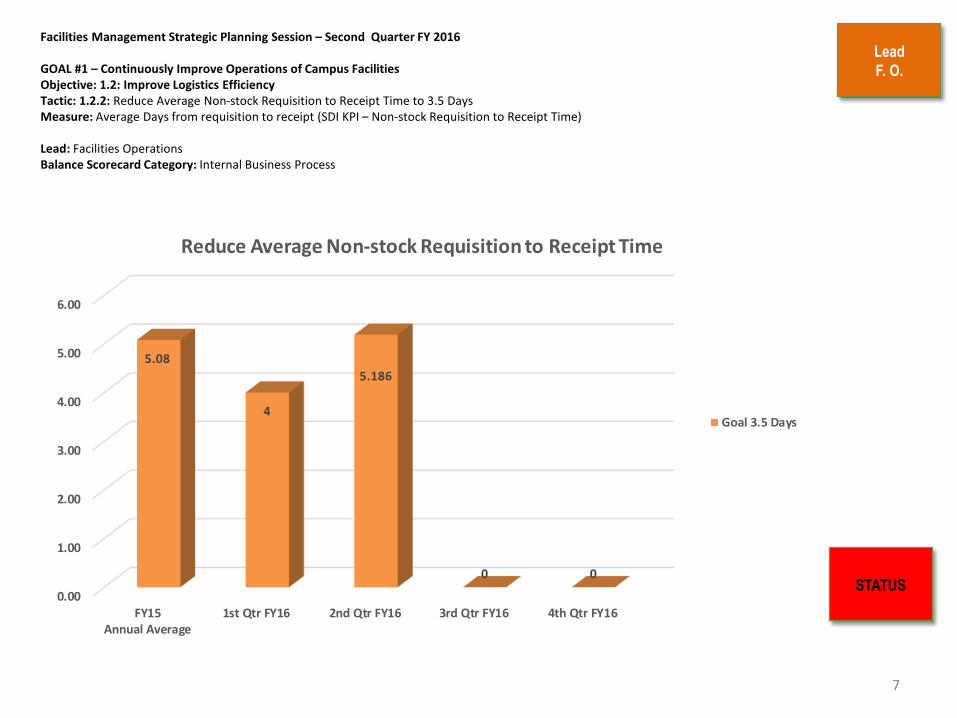
GOAL #1 – Continuously Improve Operations of Campus Facilities Objective: 1.2: Improve Logistics Efficiency Tactic: 1.2.2: Reduce Average Non-stock Requisition to Receipt Time to 3.5 Days Measure: Average Days from requisition to receipt (SDI KPI – Non-stock Requisition to Receipt Time) Lead: Facilities Operations Balance Scorecard Category: Internal Business Process
7
Lead
F. O.
STATUS 0.00
1.00
2.00
3.00
4.00
5.00
6.00
FY15Annual Average
1st Qtr FY16 2nd Qtr FY16 3rd Qtr FY16 4th Qtr FY16
5.08
4
5.186
0 0
Reduce Average Non-stock Requisition to Receipt Time
Goal 3.5 Days

GOAL #1 – Continuously Improve Operations of Campus Facilities Objective: 1.3: Improve Work Request Process Tactic: 1.3.1: Decrease Number of Work Orders Over 14 Days Old by 15% Tactic: 1.3.2: Decrease Work Request Cycle Time by 10% Measure: Hours from Work Request Submitted to Work Complete (APPA Benchmark)
ACTION PLAN
8
Lead
F. O.
Actions Planned
1. Bi-weekly review of recurring services and scheduled services currently being completed using PM work request..
2. Emphasize Facilities Operations OP-16 Timely and Accurate Handling/Processing of WRs. 3. Weekly meeting with Zone Supervisors to monitor 30 day report. 4. Communicate work order priorities (Quarterly Customer, Building Liaison and specific College
Meetings); implemented Sept 2015. 5. Supervisors meeting with technicians on a daily basis.
Actions Completed
1. Communicated work order priorities (Quarterly Customer, Building Liaison and specific College Meetings); implemented July 2014.
2. Reviewed recurring services and scheduled services currently being completed using PM work requests; August 2014.
Facilities Management Strategic Planning Session – Second Quarter FY 2016
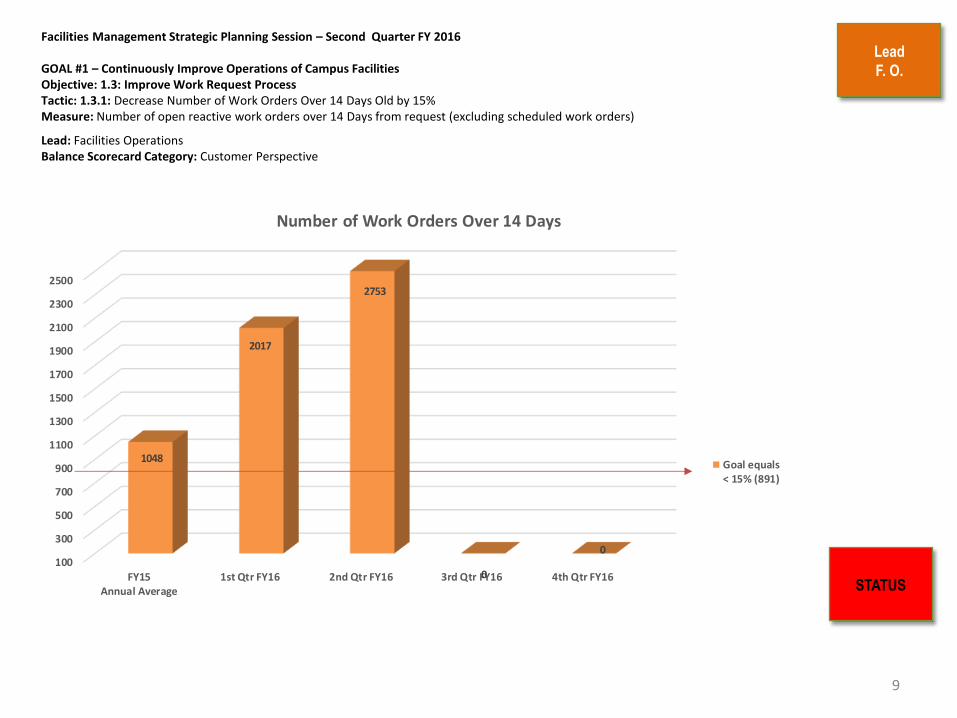
GOAL #1 – Continuously Improve Operations of Campus Facilities Objective: 1.3: Improve Work Request Process Tactic: 1.3.1: Decrease Number of Work Orders Over 14 Days Old by 15% Measure: Number of open reactive work orders over 14 Days from request (excluding scheduled work orders)
Lead: Facilities Operations Balance Scorecard Category: Customer Perspective
9
Lead
F. O.
STATUS
100
300
500
700
900
1100
1300
1500
1700
1900
2100
2300
2500
FY15Annual Average
1st Qtr FY16 2nd Qtr FY16 3rd Qtr FY16 4th Qtr FY16
1048
2017
2753
0
0
Number of Work Orders Over 14 Days
Goal equals< 15% (891)
Facilities Management Strategic Planning Session – Second Quarter FY 2016
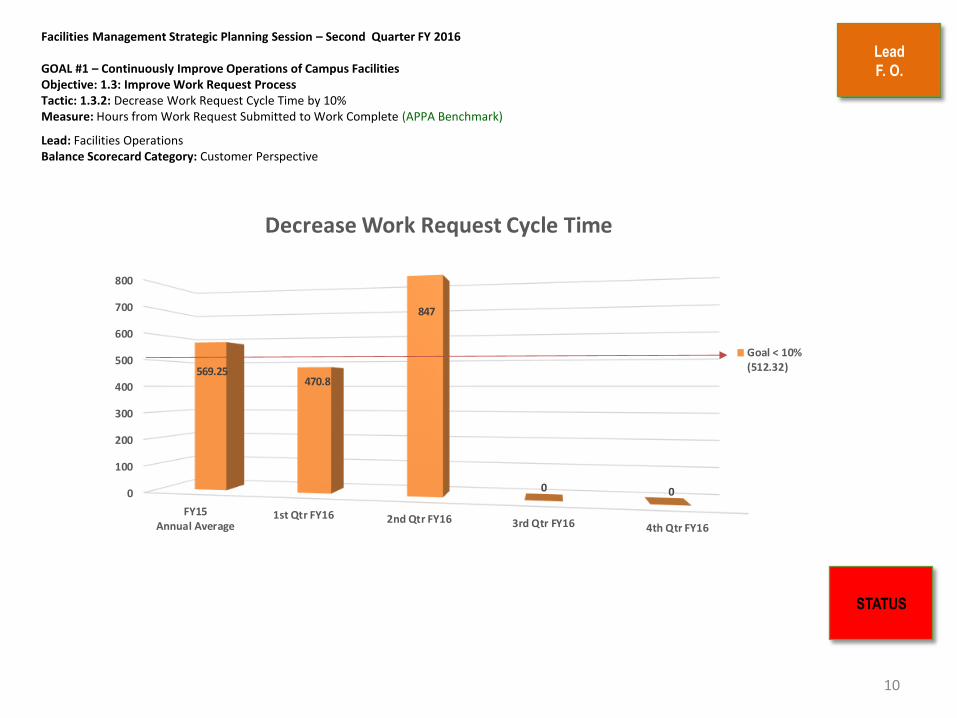
GOAL #1 – Continuously Improve Operations of Campus Facilities Objective: 1.3: Improve Work Request Process Tactic: 1.3.2: Decrease Work Request Cycle Time by 10% Measure: Hours from Work Request Submitted to Work Complete (APPA Benchmark)
Lead: Facilities Operations Balance Scorecard Category: Customer Perspective
10
STATUS
Lead
F. O.
0
100
200
300
400
500
600
700
800
FY15Annual Average
1st Qtr FY16 2nd Qtr FY16 3rd Qtr FY16 4th Qtr FY16
569.25470.8
847
0 0
Decrease Work Request Cycle Time
Goal < 10%(512.32)

Facilities Management Strategic Planning Session – Second Quarter FY 2016 GOAL #1 – Continuously Improve Maintenance and Operations of the Campus Objective: 1.4: Improve BES Processes Tactic 1.4.1: Achieve APPA Level 2 in 98% of Buildings Measure: Percentage of buildings meeting APPA Level 2 cleanliness standards during quarterly inspection (APPA Benchmark) Lead: Building Environmental Services Balanced Scorecard Category: Customer Perspective
Lead BES
11
STATUS
Percentage = 68%
0%
20%
40%
60%
80%
100%
FY15-3rdQTR FY15-4TH
QTR FY16-1stQTR FY16-2nd
QTR
90% 95%
62% 68%
APPA LEVELS
Lead BES
12
0%
1%
2%
3%
4%
5%
6%
7%
8%
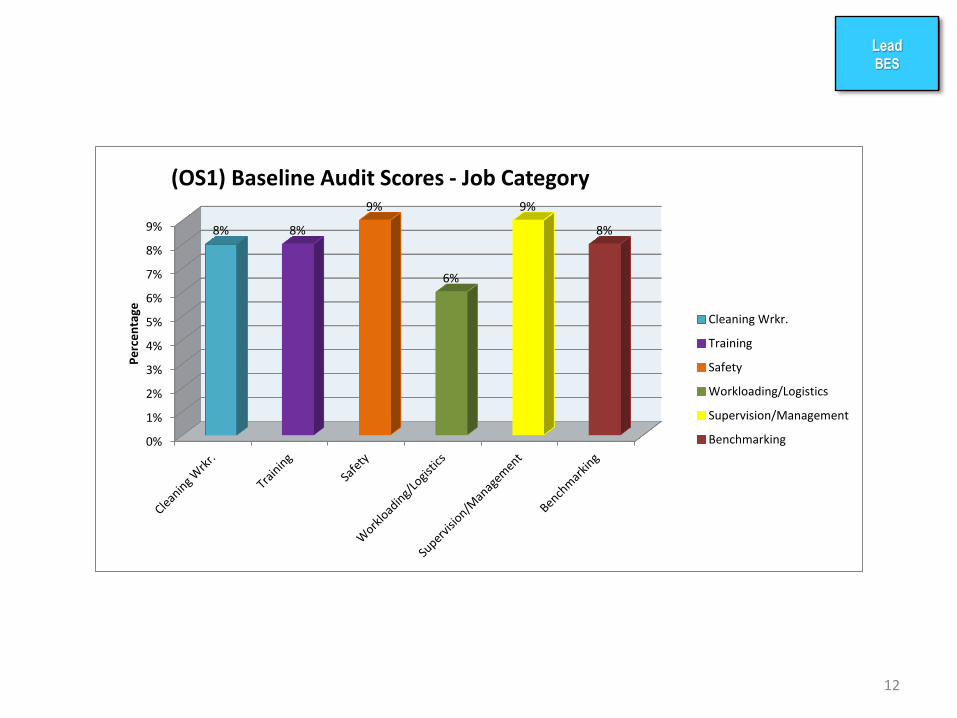
9% 8% 8%
9%
6%
9%
8%
Pe
rce
nta
ge
(OS1) Baseline Audit Scores - Job Category
Cleaning Wrkr.
Training
Safety
Workloading/Logistics
Supervision/Management
Benchmarking

Lead BES
13
0
10
20
30
40
50
60
70
80
13 8
12 12 11 6 8
80
Pe
rce
nta
ge
(OS1) Baseline Audit Scores - Organization Comparison
UNC Chapel Hill
U Mich
WFU
MSU
MT SAC
Provo School District
UNC Charlotte
STANDARD
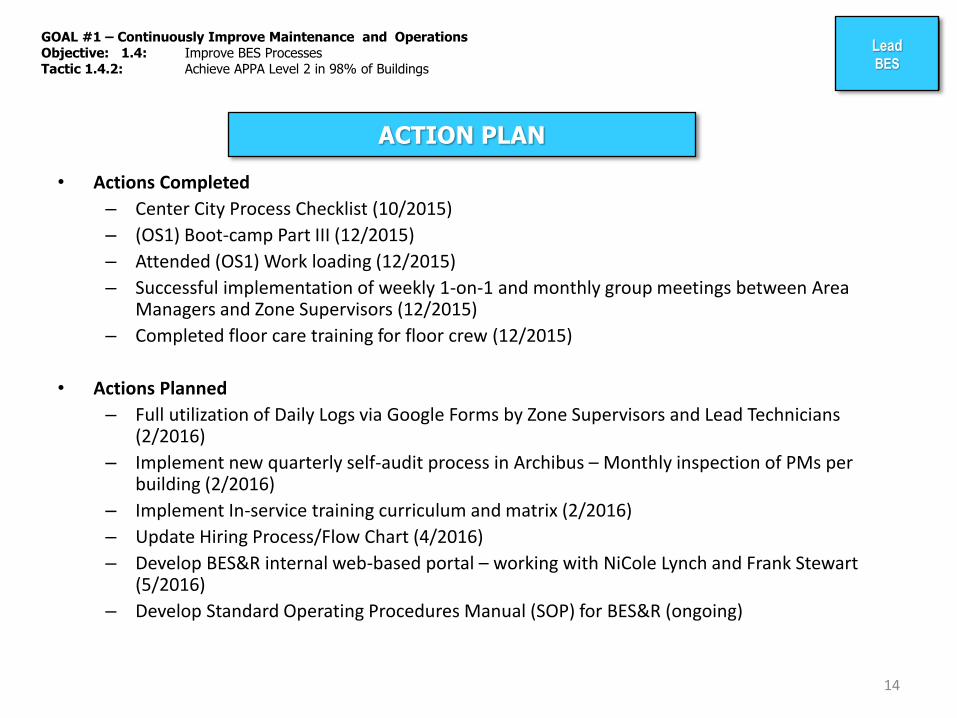
GOAL #1 – Continuously Improve Maintenance and Operations Objective: 1.4: Improve BES Processes Tactic 1.4.2: Achieve APPA Level 2 in 98% of Buildings
ACTION PLAN
• Actions Completed
– Center City Process Checklist (10/2015)
– (OS1) Boot-camp Part III (12/2015)
– Attended (OS1) Work loading (12/2015)
– Successful implementation of weekly 1-on-1 and monthly group meetings between Area Managers and Zone Supervisors (12/2015)
– Completed floor care training for floor crew (12/2015)
• Actions Planned
– Full utilization of Daily Logs via Google Forms by Zone Supervisors and Lead Technicians (2/2016)
– Implement new quarterly self-audit process in Archibus – Monthly inspection of PMs per building (2/2016)
– Implement In-service training curriculum and matrix (2/2016)
– Update Hiring Process/Flow Chart (4/2016)
– Develop BES&R internal web-based portal – working with NiCole Lynch and Frank Stewart (5/2016)
– Develop Standard Operating Procedures Manual (SOP) for BES&R (ongoing)
14
Lead BES
GOAL #1 – Continuously Improve Operation of Campus Facilities Objective: 1.5: Improve Facility Systems Reliability Tactic: 1.5.1: Improve Completion of Preventative Maintenance Work Requests to 90% Tactic: 1.5.2: Decrease number of Unscheduled Equipment Replacement Projects to less than 2 incidents per quarter Tactic: 1.5.3: Fewer than 5 unscheduled outages per quarter Tactic: 1.5.4: Improve Ratio of Preventive/Predictive work requests to reactive request to 50%
ACTION PLAN
Actions Planned 1. Reorganize PM Program
2. Complete conversion from old PM Module to new PM Module.
3. Continue expansion of PM Program and predictive maintenance program. Work with key customers.
4. Continue to review CRDM Project List. Identify and prioritize equipment conditions and needs, for replacement. Indicate urgency and recommend future funding dates.
5. Re-emphasize and update the Customer Handbook; get out and see the customer; swiftly and accurately report outages.
Actions Completed 1. Incorporated FCAP inspection process into CRDM and Daily Operations.
2. Hired PM Supervisor.
15
Lead
F. O.
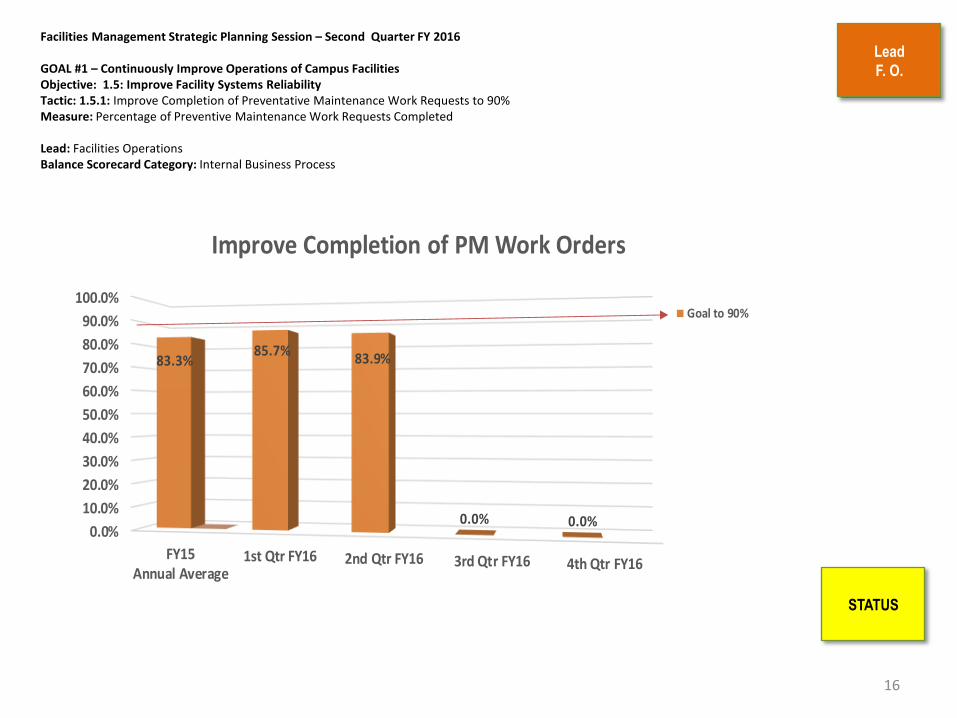
Facilities Management Strategic Planning Session – Second Quarter FY 2016 GOAL #1 – Continuously Improve Operations of Campus Facilities Objective: 1.5: Improve Facility Systems Reliability Tactic: 1.5.1: Improve Completion of Preventative Maintenance Work Requests to 90% Measure: Percentage of Preventive Maintenance Work Requests Completed
Lead: Facilities Operations Balance Scorecard Category: Internal Business Process
16
Lead
F. O.
STATUS
0.0%
10.0%
20.0%
30.0%
40.0%
50.0%
60.0%
70.0%
80.0%
90.0%
100.0%
FY15Annual Average
1st Qtr FY16 2nd Qtr FY16 3rd Qtr FY16 4th Qtr FY16
83.3%85.7%
83.9%
0.0% 0.0%
Improve Completion of PM Work Orders
Goal to 90%

Facilities Management Strategic Planning Session – Second Quarter FY 2016
GOAL #1 – Continuously Improve Operations of Campus Facilities Objective: 1.5: Improve Facility Systems Reliability Tactic: 1.5.2: Decrease number of Unscheduled Equipment Replacement Projects to less than 2 incidents per quarter Measure: Number of Unscheduled Equipment Replacement Projects
Lead: Facilities Operations Balance Scorecard Category: Internal Business Process
17
Lead
F. O.
0.0
0.5
1.0
1.5
2.0
2.5
3.0
3.5
4.0
FY15Annual Average
1st Qtr FY16 2nd Qtr FY16 3rd Qtr FY16 4th Qtr FY16
0.5
2.0
1.0
0.0 0.0
Unscheduled Equipment Replacement Projects
Goal = Less than2 incidents perquarter
STATUS
Facilities Management Strategic Planning Session – Second Quarter FY 2016
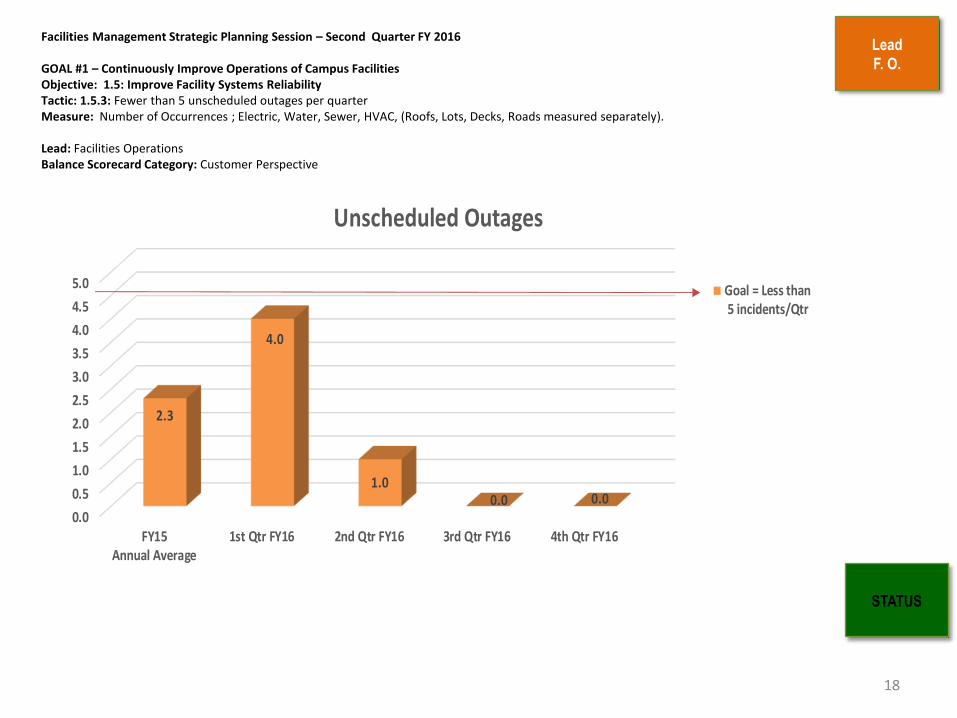
GOAL #1 – Continuously Improve Operations of Campus Facilities Objective: 1.5: Improve Facility Systems Reliability Tactic: 1.5.3: Fewer than 5 unscheduled outages per quarter Measure: Number of Occurrences ; Electric, Water, Sewer, HVAC, (Roofs, Lots, Decks, Roads measured separately). Lead: Facilities Operations Balance Scorecard Category: Customer Perspective
18
Lead
F. O.
STATUS
0.0
0.5
1.0
1.5
2.0
2.5
3.0
3.5
4.0
4.5
5.0
FY15Annual Average
1st Qtr FY16 2nd Qtr FY16 3rd Qtr FY16 4th Qtr FY16
2.3
4.0
1.00.0 0.0
Unscheduled Outages
Goal = Less than 5 incidents/Qtr
Facilities Management Strategic Planning Session – Second Quarter FY 2016
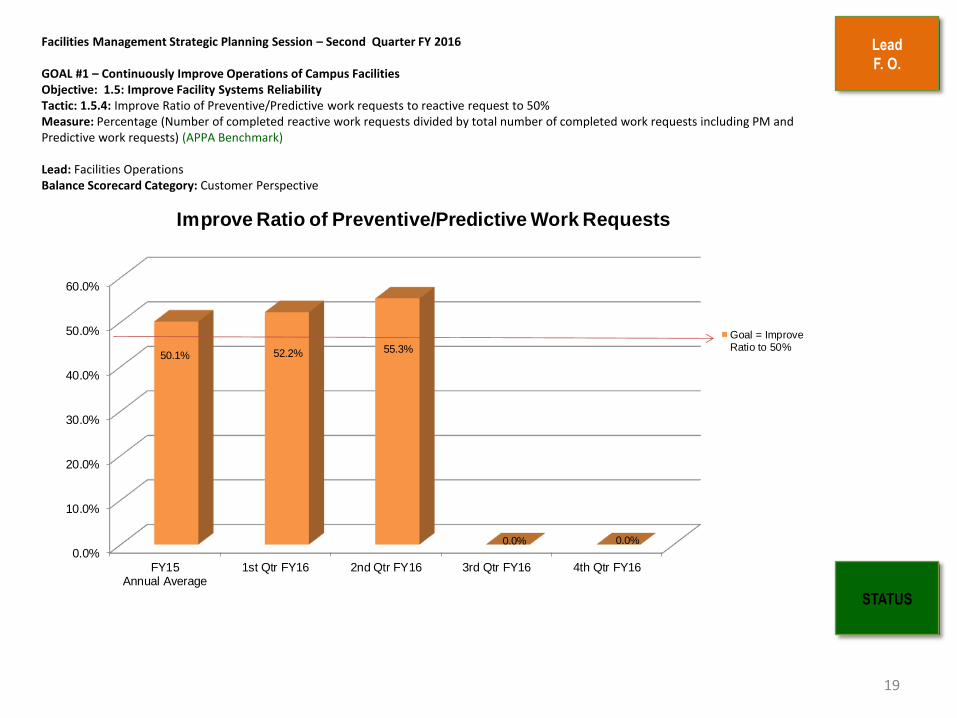
GOAL #1 – Continuously Improve Operations of Campus Facilities Objective: 1.5: Improve Facility Systems Reliability Tactic: 1.5.4: Improve Ratio of Preventive/Predictive work requests to reactive request to 50% Measure: Percentage (Number of completed reactive work requests divided by total number of completed work requests including PM and Predictive work requests) (APPA Benchmark)
Lead: Facilities Operations Balance Scorecard Category: Customer Perspective
19
Lead
F. O.
0.0%
10.0%
20.0%
30.0%
40.0%
50.0%
60.0%
FY15Annual Average
1st Qtr FY16 2nd Qtr FY16 3rd Qtr FY16 4th Qtr FY16
50.1% 52.2% 55.3%
0.0% 0.0%
Improve Ratio of Preventive/Predictive Work Requests
Goal = ImproveRatio to 50%
STATUS
GOAL #2
Create a Reliable and Sustainable Physical Infrastructure
"People with goals
succeed because they
know where they're going"
-- Earl Nightingale,
Motivational Speaker
Lead
FIS
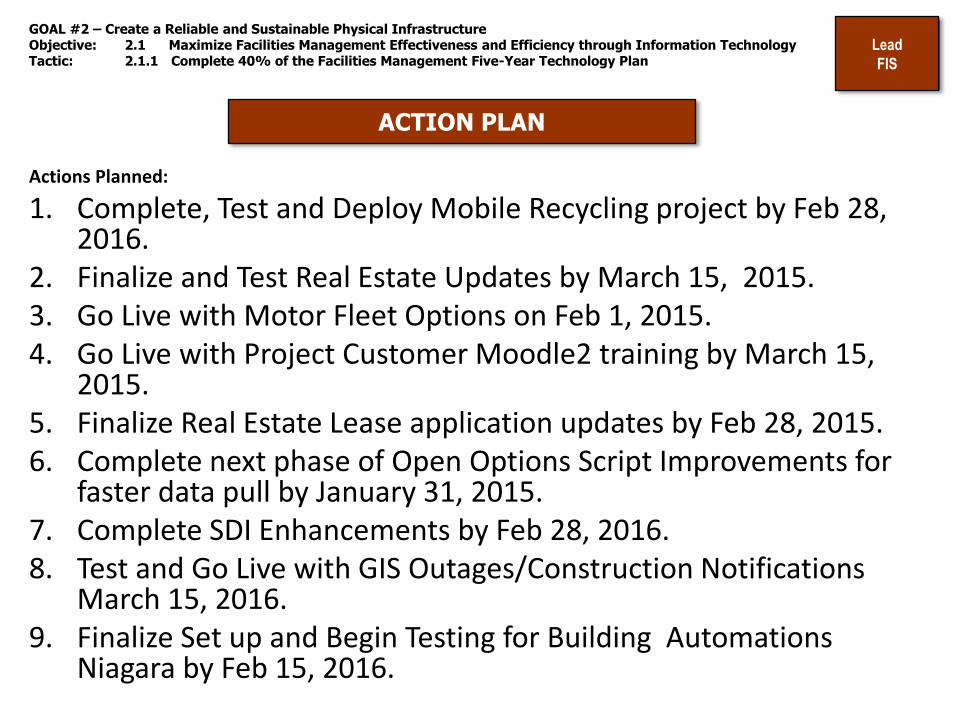
GOAL #2 – Create a Reliable and Sustainable Physical Infrastructure Objective: 2.1 Maximize Facilities Management Effectiveness and Efficiency through Information Technology Tactic: 2.1.1 Complete 40% of the Facilities Management Five-Year Technology Plan
ACTION PLAN
Actions Planned:
1. Complete, Test and Deploy Mobile Recycling project by Feb 28, 2016.
2. Finalize and Test Real Estate Updates by March 15, 2015. 3. Go Live with Motor Fleet Options on Feb 1, 2015. 4. Go Live with Project Customer Moodle2 training by March 15,
2015. 5. Finalize Real Estate Lease application updates by Feb 28, 2015. 6. Complete next phase of Open Options Script Improvements for
faster data pull by January 31, 2015. 7. Complete SDI Enhancements by Feb 28, 2016. 8. Test and Go Live with GIS Outages/Construction Notifications
March 15, 2016. 9. Finalize Set up and Begin Testing for Building Automations
Niagara by Feb 15, 2016.
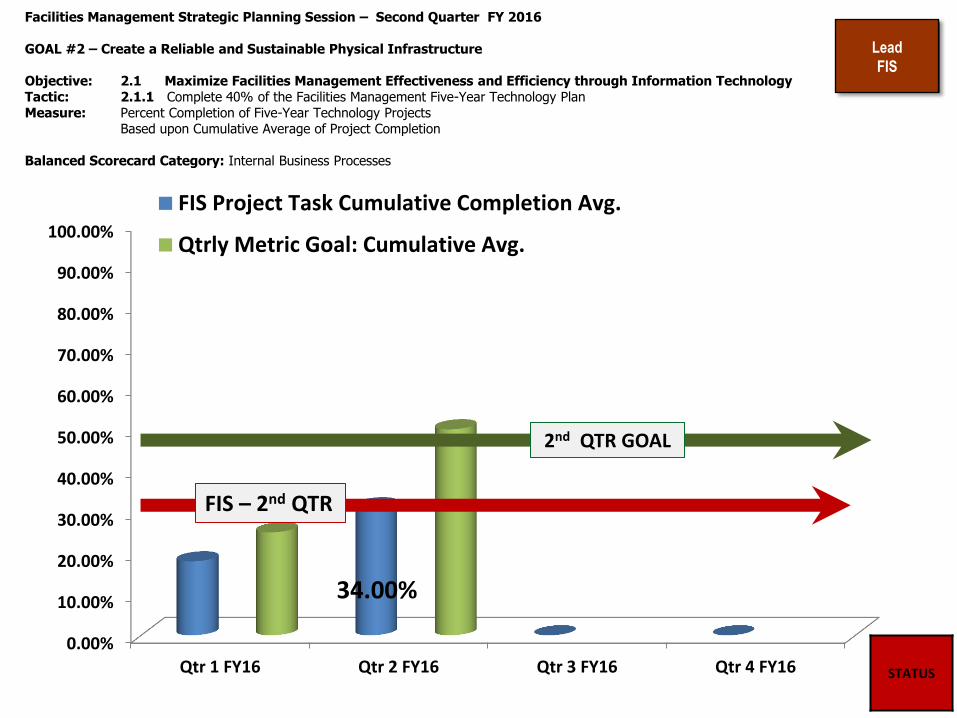
0.00%
10.00%
20.00%
30.00%
40.00%
50.00%
60.00%
70.00%
80.00%
90.00%
100.00%
Qtr 1 FY16 Qtr 2 FY16 Qtr 3 FY16 Qtr 4 FY16
34.00%
FIS Project Task Cumulative Completion Avg.
Qtrly Metric Goal: Cumulative Avg.
Facilities Management Strategic Planning Session – Second Quarter FY 2016 GOAL #2 – Create a Reliable and Sustainable Physical Infrastructure Objective: 2.1 Maximize Facilities Management Effectiveness and Efficiency through Information Technology Tactic: 2.1.1 Complete 40% of the Facilities Management Five-Year Technology Plan Measure: Percent Completion of Five-Year Technology Projects Based upon Cumulative Average of Project Completion Balanced Scorecard Category: Internal Business Processes
Lead
FIS
STATUS
2nd QTR GOAL
FIS – 2nd QTR
Facilities Management Strategic Planning Session – Second Quarter FY 2016
GOAL #2 – Create a Reliable and Sustainable Physical Infrastructure
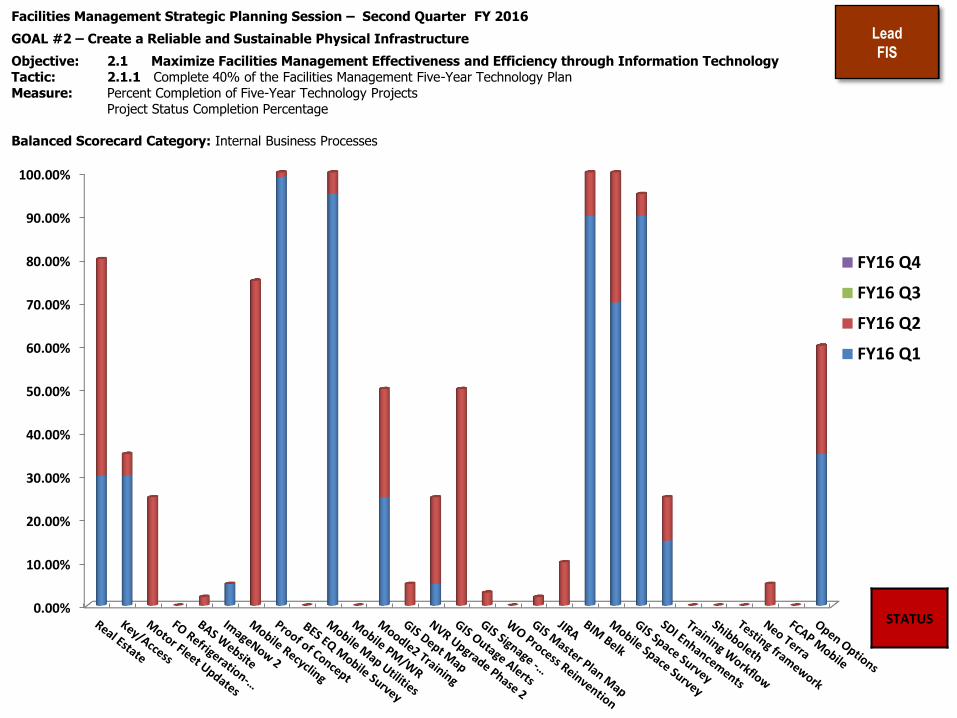
Objective: 2.1 Maximize Facilities Management Effectiveness and Efficiency through Information Technology Tactic: 2.1.1 Complete 40% of the Facilities Management Five-Year Technology Plan Measure: Percent Completion of Five-Year Technology Projects Project Status Completion Percentage Balanced Scorecard Category: Internal Business Processes
Lead
FIS
0.00%
10.00%
20.00%
30.00%
40.00%
50.00%
60.00%
70.00%
80.00%
90.00%
100.00%
FY16 Q4
FY16 Q3
FY16 Q2
FY16 Q1
STATUS
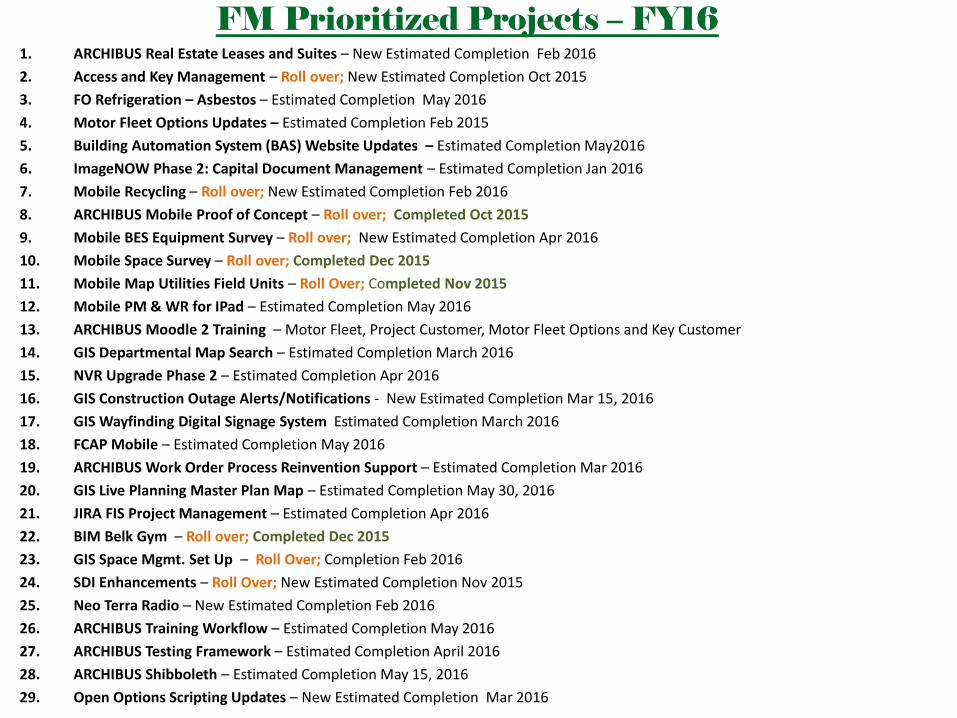
FM Prioritized Projects – FY16 1. ARCHIBUS Real Estate Leases and Suites – New Estimated Completion Feb 2016
2. Access and Key Management – Roll over; New Estimated Completion Oct 2015
3. FO Refrigeration – Asbestos – Estimated Completion May 2016
4. Motor Fleet Options Updates – Estimated Completion Feb 2015
5. Building Automation System (BAS) Website Updates – Estimated Completion May2016
6. ImageNOW Phase 2: Capital Document Management – Estimated Completion Jan 2016
7. Mobile Recycling – Roll over; New Estimated Completion Feb 2016
8. ARCHIBUS Mobile Proof of Concept – Roll over; Completed Oct 2015
9. Mobile BES Equipment Survey – Roll over; New Estimated Completion Apr 2016
10. Mobile Space Survey – Roll over; Completed Dec 2015
11. Mobile Map Utilities Field Units – Roll Over; Completed Nov 2015
12. Mobile PM & WR for IPad – Estimated Completion May 2016
13. ARCHIBUS Moodle 2 Training – Motor Fleet, Project Customer, Motor Fleet Options and Key Customer
14. GIS Departmental Map Search – Estimated Completion March 2016
15. NVR Upgrade Phase 2 – Estimated Completion Apr 2016
16. GIS Construction Outage Alerts/Notifications - New Estimated Completion Mar 15, 2016
17. GIS Wayfinding Digital Signage System Estimated Completion March 2016
18. FCAP Mobile – Estimated Completion May 2016
19. ARCHIBUS Work Order Process Reinvention Support – Estimated Completion Mar 2016
20. GIS Live Planning Master Plan Map – Estimated Completion May 30, 2016
21. JIRA FIS Project Management – Estimated Completion Apr 2016
22. BIM Belk Gym – Roll over; Completed Dec 2015
23. GIS Space Mgmt. Set Up – Roll Over; Completion Feb 2016
24. SDI Enhancements – Roll Over; New Estimated Completion Nov 2015
25. Neo Terra Radio – New Estimated Completion Feb 2016
26. ARCHIBUS Training Workflow – Estimated Completion May 2016
27. ARCHIBUS Testing Framework – Estimated Completion April 2016
28. ARCHIBUS Shibboleth – Estimated Completion May 15, 2016
29. Open Options Scripting Updates – New Estimated Completion Mar 2016
Lead
FIS
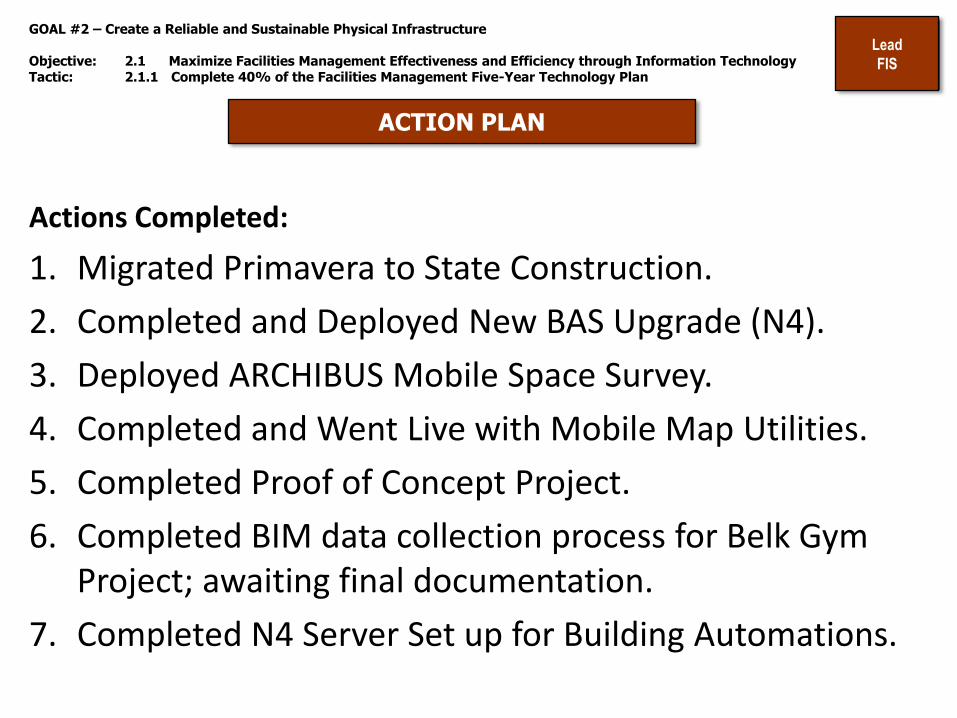
GOAL #2 – Create a Reliable and Sustainable Physical Infrastructure Objective: 2.1 Maximize Facilities Management Effectiveness and Efficiency through Information Technology Tactic: 2.1.1 Complete 40% of the Facilities Management Five-Year Technology Plan
ACTION PLAN
Actions Completed:
1. Migrated Primavera to State Construction.
2. Completed and Deployed New BAS Upgrade (N4).
3. Deployed ARCHIBUS Mobile Space Survey.
4. Completed and Went Live with Mobile Map Utilities.
5. Completed Proof of Concept Project.
6. Completed BIM data collection process for Belk Gym Project; awaiting final documentation.
7. Completed N4 Server Set up for Building Automations.

Interactive Map Traffic
Peaks at beginning of semesters. Peak of 1,950 Users per day when students arrived on campus. Over 16,000 visits in August alone.
August 2015 Traffic
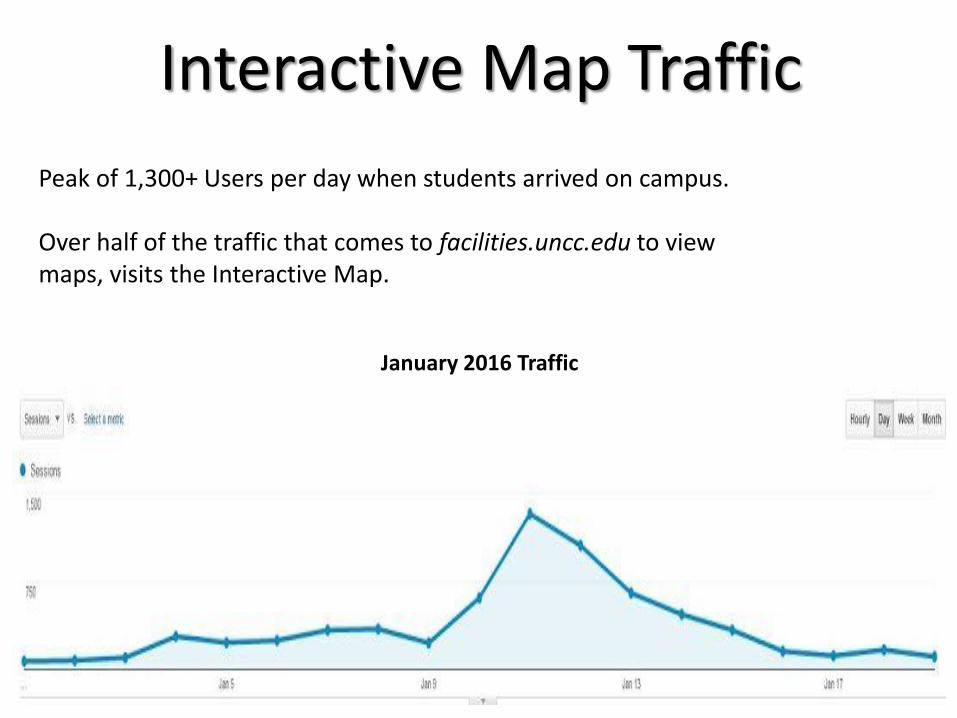
Interactive Map Traffic
Peak of 1,300+ Users per day when students arrived on campus. Over half of the traffic that comes to facilities.uncc.edu to view maps, visits the Interactive Map.
January 2016 Traffic

Interactive Map Traffic
Total traffic since Interactive Map has gone live: over 55,000 visits.
August 2015 - January 2016 Traffic

NEW IMPROVEMENTS
Reduce and Eliminate Paper Processes – Requires interface assistance with FIS:
Convert Scope & Budget to format in Archibus similar to Estimating Workbook.
Timeline: FY16 QTR 2 – DESIGN SERVICES TESTING PHASE IS NOW ONGOING
29
ACTION PLANS FOR IMPROVEMENT
GOAL #2 – Create a Reliable and Sustainable Physical Infrastructure Objective: 2.2: Improve Informal Project Design and Construction Process Lead: Design Services Balanced Scorecard Category: Internal Business Process
Customer Orientation for Design Services Processes and Archibus Design Services Project Management:
Customer meetings to help our Customers understand our processes – Project entry, approvals, timelines, SCO, etc.
Timeline: FY17 QTR 1 – FY17 QTR 4 – Work In Progress
Tactic 2.2.1: 95% of All Construction Projects Meet Scheduled Beneficial Occupancy Date (BOD) Measure: Percentage (Number of Construction Projects completed on or before delivery date divided by total number of project completed.) Tactic 2.2.2: Review Project Capacity - Goal 250 projects per year. Measure: Number of Projects Completed (Annual Goal)
Continue ongoing efforts to assign Classroom Capacity and provide ADA egress information per building.
ONGOING IMPROVEMENTS
Lead -
Design
Services
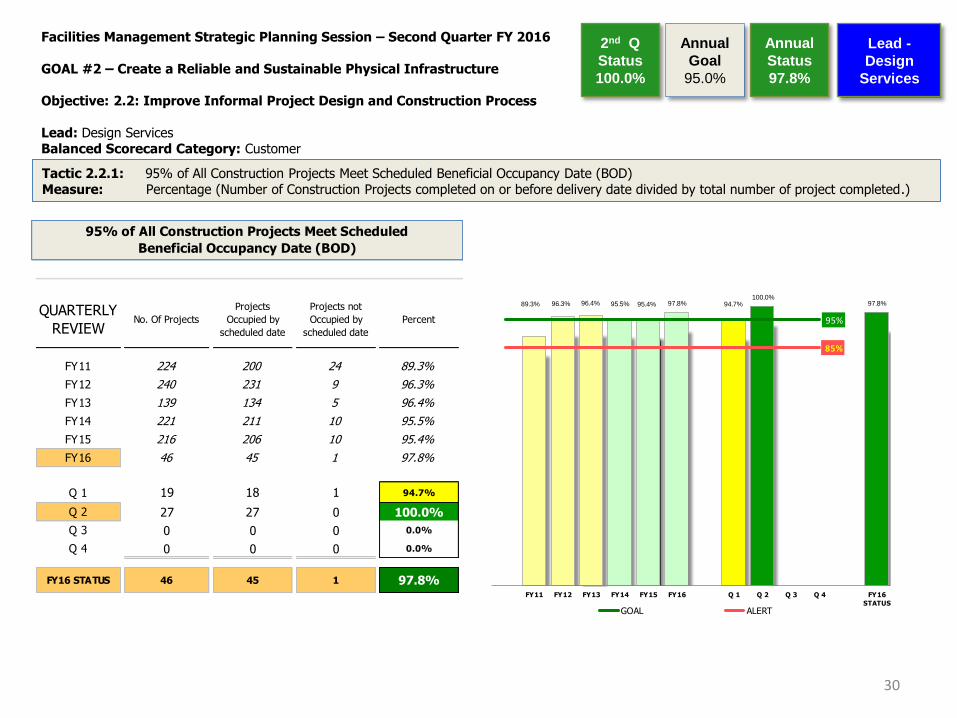
Facilities Management Strategic Planning Session – Second Quarter FY 2016 GOAL #2 – Create a Reliable and Sustainable Physical Infrastructure Objective: 2.2: Improve Informal Project Design and Construction Process Lead: Design Services Balanced Scorecard Category: Customer
30
Tactic 2.2.1: 95% of All Construction Projects Meet Scheduled Beneficial Occupancy Date (BOD) Measure: Percentage (Number of Construction Projects completed on or before delivery date divided by total number of project completed.)
Lead -
Design
Services
QUARTERLY
REVIEWNo. Of Projects
Projects
Occupied by
scheduled date
Projects not
Occupied by
scheduled date
Percent
FY11 224 200 24 89.3%
FY12 240 231 9 96.3%
FY13 139 134 5 96.4%
FY14 221 211 10 95.5%
FY15 216 206 10 95.4%
FY16 46 45 1 97.8%
Q 1 19 18 1 94.7%
Q 2 27 27 0 100.0%
Q 3 0 0 0 0.0%
Q 4 0 0 0 0.0%
FY16 STATUS 46 45 1 97.8%
95% of All Construction Projects Meet Scheduled
Beneficial Occupancy Date (BOD)
89.3% 96.3% 96.4% 95.5% 95.4% 97.8% 94.7%100.0%
97.8%
95%
85%
FY11 FY12 FY13 FY14 FY15 FY16 Q 1 Q 2 Q 3 Q 4 FY16
STATUS
GOAL ALERT
Annual
Goal
95.0%
Annual
Status
97.8%
2nd Q
Status
100.0%

GOAL #2 - Create a Reliable and Sustainable Physical Infrastructure Objective 2.3: Develop a Comprehensive Capital Renewal/Deferred Maintenance (CRDM) Program Tactic 2.3.1: Refine FCI tracking method to illustrate changes over time (by quarter) and use this information as a tool for recommending projects to improve campus FCI by 5% NLT July 2016.
31
STATUS
ACTION PLAN
o Continue to update CRDM data (ongoing)
o Integrate feedback from users of map and master list (ongoing)
o Update FCI tracker by building to capture FCAP changes and project completions to calculate movement in FCI (ongoing)
o Provide status and recommendations to attain a 5% improvement (July 2016)
Lead
Facilities
Planning
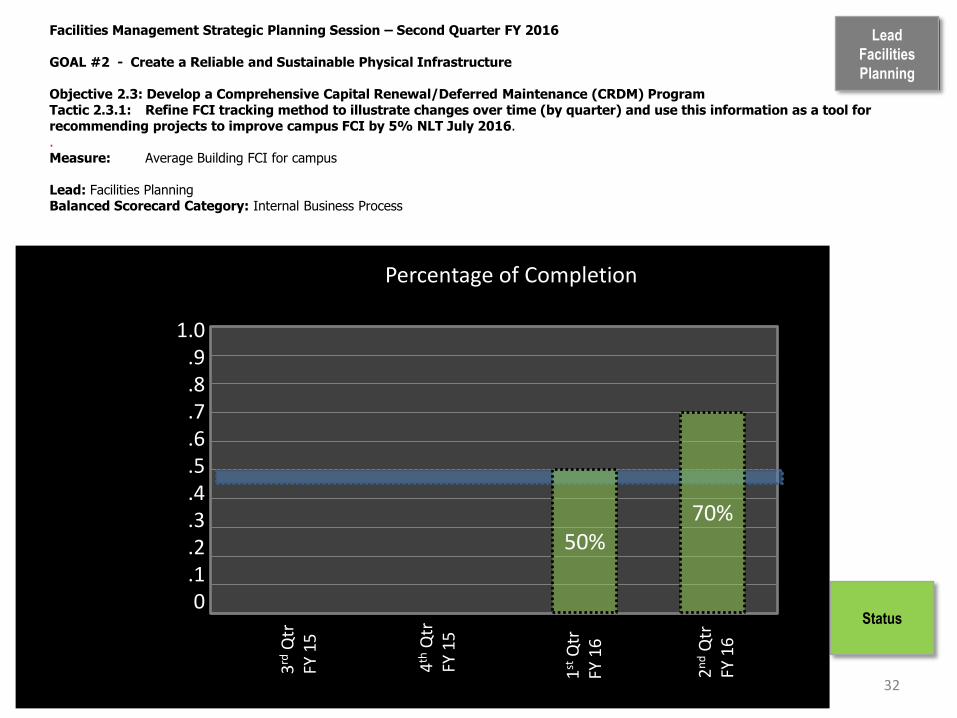
Facilities Management Strategic Planning Session – Second Quarter FY 2016 GOAL #2 - Create a Reliable and Sustainable Physical Infrastructure Objective 2.3: Develop a Comprehensive Capital Renewal/Deferred Maintenance (CRDM) Program Tactic 2.3.1: Refine FCI tracking method to illustrate changes over time (by quarter) and use this information as a tool for recommending projects to improve campus FCI by 5% NLT July 2016. . Measure: Average Building FCI for campus Lead: Facilities Planning Balanced Scorecard Category: Internal Business Process
Lead
Facilities
Planning
32
Status
Percentage of Completion 3
rd Q
tr
FY 1
5
1.0 .9 .8 .7 .6 .5 .4 .3 .2 .1 0
4th
Qtr
FY
15
50%
2n
d Q
tr
FY 1
6
1st
Qtr
FY
16
70%
GOAL #2 - Create a Reliable and Sustainable Physical Infrastructure Objective 2.5: Improve the Capital Planning and Design Process Tactic 2.5.1: Develop Lifecycle cost analysis and funding process for capital projects (Action Plan only)
33
STATUS
ACTION PLAN
o Sustain current process of completing Operating Budget sheets
for new projects
o Complete studies related to future Capital projects, Friday Settlement Issue, Light Rail Circulation Study, and Craver and Mary Alexander Road Intersection Sector Study - future building site cost analysis (proposed Science site)
Lead
Facilities
Planning
Lead
Capital
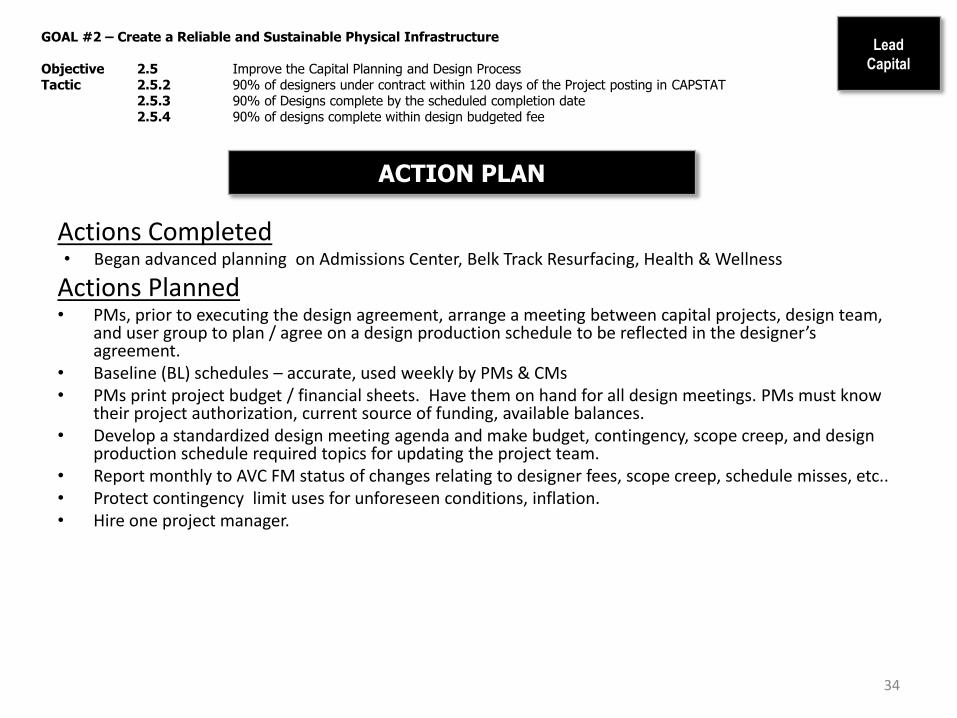
GOAL #2 – Create a Reliable and Sustainable Physical Infrastructure Objective 2.5 Improve the Capital Planning and Design Process Tactic 2.5.2 90% of designers under contract within 120 days of the Project posting in CAPSTAT 2.5.3 90% of Designs complete by the scheduled completion date 2.5.4 90% of designs complete within design budgeted fee ACTION PLAN
Actions Completed • Began advanced planning on Admissions Center, Belk Track Resurfacing, Health & Wellness
Actions Planned • PMs, prior to executing the design agreement, arrange a meeting between capital projects, design team,
and user group to plan / agree on a design production schedule to be reflected in the designer’s agreement.
• Baseline (BL) schedules – accurate, used weekly by PMs & CMs • PMs print project budget / financial sheets. Have them on hand for all design meetings. PMs must know
their project authorization, current source of funding, available balances. • Develop a standardized design meeting agenda and make budget, contingency, scope creep, and design
production schedule required topics for updating the project team. • Report monthly to AVC FM status of changes relating to designer fees, scope creep, schedule misses, etc.. • Protect contingency limit uses for unforeseen conditions, inflation. • Hire one project manager.
34
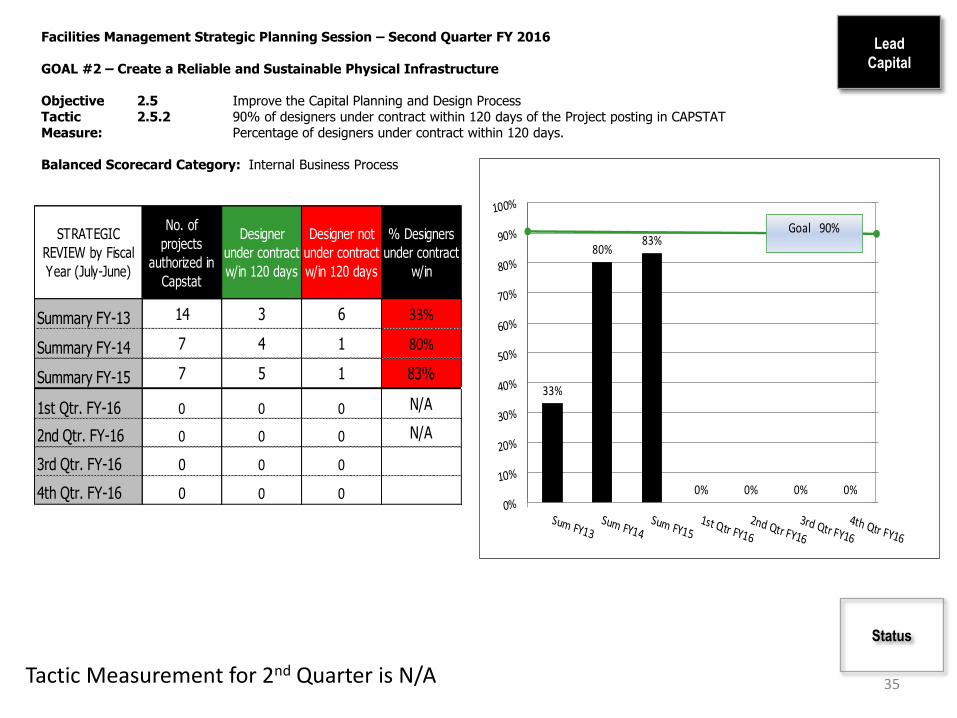
Facilities Management Strategic Planning Session – Second Quarter FY 2016 GOAL #2 – Create a Reliable and Sustainable Physical Infrastructure Objective 2.5 Improve the Capital Planning and Design Process Tactic 2.5.2 90% of designers under contract within 120 days of the Project posting in CAPSTAT Measure: Percentage of designers under contract within 120 days. Balanced Scorecard Category: Internal Business Process
Lead
Capital
35 Tactic Measurement for 2nd Quarter is N/A
Status
STRATEGIC
REVIEW by Fiscal
Year (July-June)
No. of
projects
authorized in
Capstat
Designer
under contract
w/in 120 days
Designer not
under contract
w/in 120 days
% Designers
under contract
w/in
Summary FY-13 14 3 6 33%
Summary FY-14 7 4 1 80%
Summary FY-15 7 5 1 83%
1st Qtr. FY-16 0 0 0 N/A
2nd Qtr. FY-16 0 0 0 N/A
3rd Qtr. FY-16 0 0 0 0%
4th Qtr. FY-16 0 0 0 0%
33%
80%83%
0% 0% 0% 0%
Goal 90%
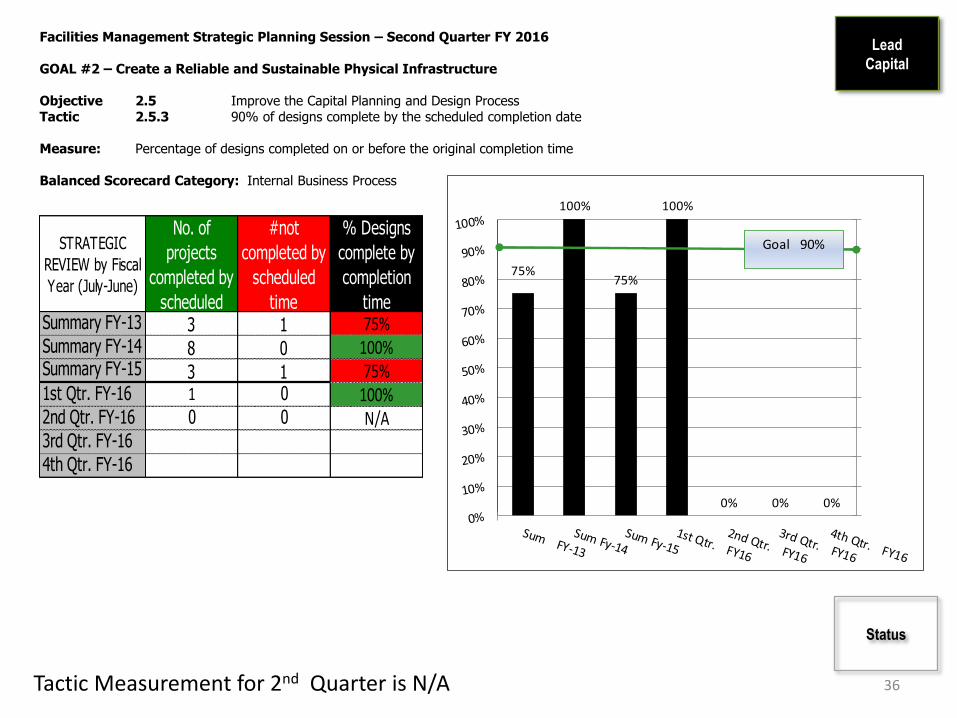
Facilities Management Strategic Planning Session – Second Quarter FY 2016 GOAL #2 – Create a Reliable and Sustainable Physical Infrastructure Objective 2.5 Improve the Capital Planning and Design Process Tactic 2.5.3 90% of designs complete by the scheduled completion date Measure: Percentage of designs completed on or before the original completion time Balanced Scorecard Category: Internal Business Process
Lead
Capital
36 Tactic Measurement for 2nd Quarter is N/A
Status
STRATEGIC
REVIEW by Fiscal
Year (July-June)
No. of
projects
completed by
scheduled
#not
completed by
scheduled
time
% Designs
complete by
completion
timeSummary FY-13 3 1 75%Summary FY-14 8 0 100%Summary FY-15 3 1 75%1st Qtr. FY-16 1 0 100%2nd Qtr. FY-16 0 0 N/A3rd Qtr. FY-16 4th Qtr. FY-16
75%
100%
75%
100%
0% 0% 0%
Goal 90%
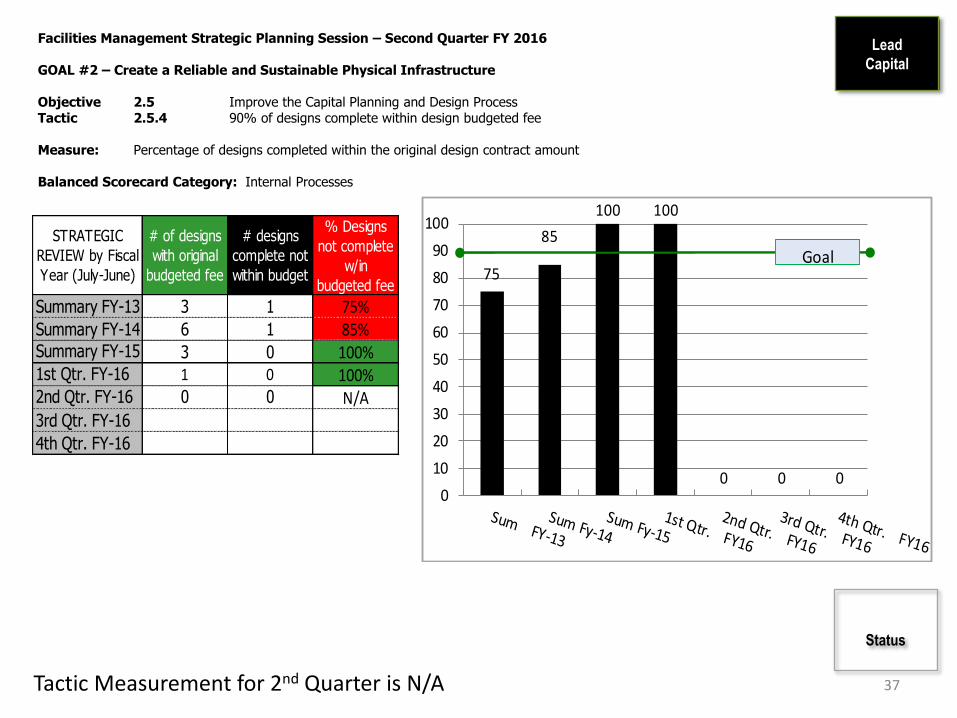
Facilities Management Strategic Planning Session – Second Quarter FY 2016 GOAL #2 – Create a Reliable and Sustainable Physical Infrastructure Objective 2.5 Improve the Capital Planning and Design Process Tactic 2.5.4 90% of designs complete within design budgeted fee Measure: Percentage of designs completed within the original design contract amount Balanced Scorecard Category: Internal Processes
Lead
Capital
37
Status
Tactic Measurement for 2nd Quarter is N/A
STRATEGIC
REVIEW by Fiscal
Year (July-June)
# of designs
with original
budgeted fee
# designs
complete not
within budget
% Designs
not complete
w/in
budgeted fee
Summary FY-13 3 1 75%Summary FY-14 6 1 85%Summary FY-15 3 0 100%1st Qtr. FY-16 1 0 100%2nd Qtr. FY-16 0 0 N/A3rd Qtr. FY-16
4th Qtr. FY-16
75
85
100 100
0 0 00
10
20
30
40
50
60
70
80
90
100
Goal
Lead
Capital
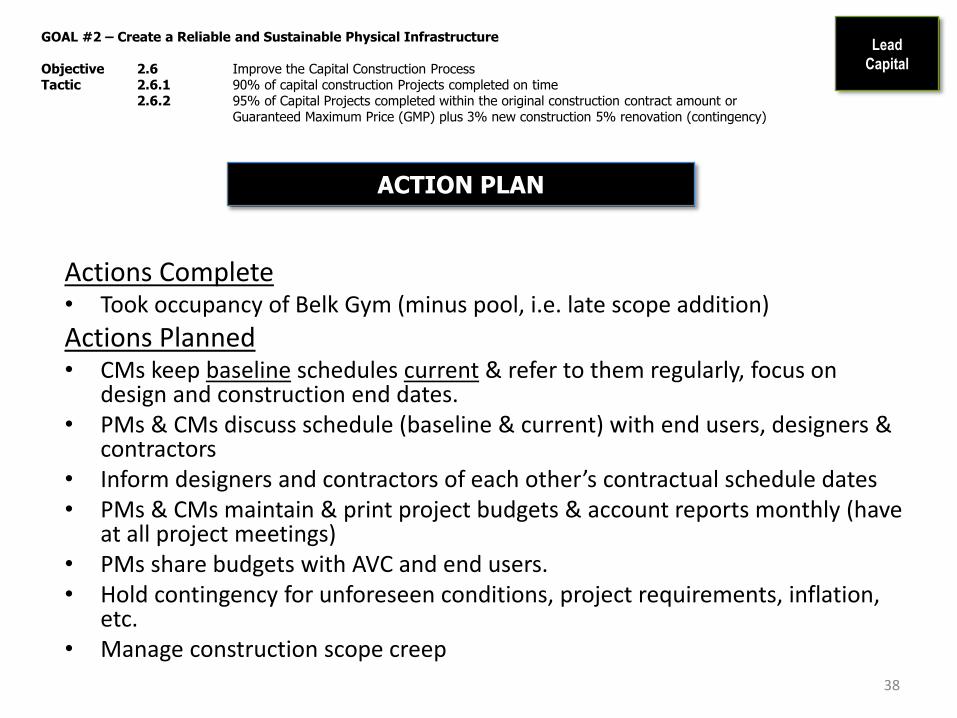
GOAL #2 – Create a Reliable and Sustainable Physical Infrastructure Objective 2.6 Improve the Capital Construction Process Tactic 2.6.1 90% of capital construction Projects completed on time 2.6.2 95% of Capital Projects completed within the original construction contract amount or Guaranteed Maximum Price (GMP) plus 3% new construction 5% renovation (contingency)
ACTION PLAN
Actions Complete • Took occupancy of Belk Gym (minus pool, i.e. late scope addition)
Actions Planned • CMs keep baseline schedules current & refer to them regularly, focus on
design and construction end dates. • PMs & CMs discuss schedule (baseline & current) with end users, designers &
contractors • Inform designers and contractors of each other’s contractual schedule dates • PMs & CMs maintain & print project budgets & account reports monthly (have
at all project meetings) • PMs share budgets with AVC and end users. • Hold contingency for unforeseen conditions, project requirements, inflation,
etc. • Manage construction scope creep
38

Facilities Management Strategic Planning Session – Second Quarter FY 2016 GOAL #2 – Create a Reliable and Sustainable Physical Infrastructure Objective 2.6 Improve the Capital Construction Process Tactic 2.6.1 90% of capital construction Projects completed on time Measure: Percentage of construction projects completed on or before the contract completion date (CCD) Balanced Scorecard Category: Customer Perspective
Lead
Capital
39 Tactic Measurement for 2nd Quarter is 0%
Status
STRATEGIC
REVIEW by Fiscal
Year (July-June)
# completed
on schedule
not
completed on
schedule
% completed
on time
Summary FY-13 1 2 33%Summary FY-14 6 3 67%Summary FY-15 5 3 63%1st Qtr. FY-16 1 3 25%2nd Qtr. FY-16 0 1 0%3rd Qtr. FY-16 4th Qtr. FY-16
33%
67%63%
25%
0% 0% 0%
Goal 90%
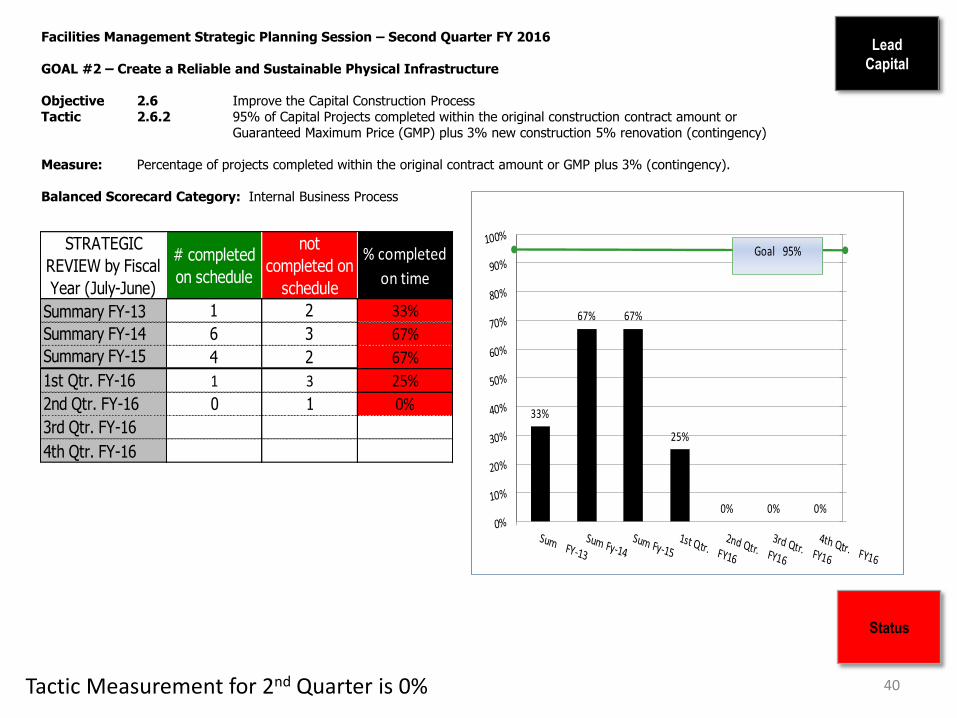
Facilities Management Strategic Planning Session – Second Quarter FY 2016 GOAL #2 – Create a Reliable and Sustainable Physical Infrastructure Objective 2.6 Improve the Capital Construction Process Tactic 2.6.2 95% of Capital Projects completed within the original construction contract amount or Guaranteed Maximum Price (GMP) plus 3% new construction 5% renovation (contingency) Measure: Percentage of projects completed within the original contract amount or GMP plus 3% (contingency). Balanced Scorecard Category: Internal Business Process
Lead
Capital
40
Status
Tactic Measurement for 2nd Quarter is 0%
33%
67% 67%
25%
0% 0% 0%
Goal 95%STRATEGIC
REVIEW by Fiscal
Year (July-June)
# completed
on schedule
not
completed on
schedule
% completed
on time
Summary FY-13 1 2 33%
Summary FY-14 6 3 67%Summary FY-15 4 2 67%
1st Qtr. FY-16 1 3 25%
2nd Qtr. FY-16 0 1 0%
3rd Qtr. FY-16
4th Qtr. FY-16

GOAL #3
Foster a Customer Focused Organization
“People don’t want to
communicate with an
organization or a computer.
They want to talk to a real, live,
responsive, responsible person
who will listen and help them
get satisfaction.”
- Theo Michelson, State Farm
Insurance

GOAL #3 Foster a Customer Focused Organization Objective 3.1: Continuously improve customer service/satisfaction Lead: Facilities Management Wide Balanced Scorecard Category: Customer Perspective
42
Lead
FBO
ACTION PLAN FOR IMPROVEMENT
Customer Satisfaction Survey
• Will contact Urban Institute for survey administration calendar; UI will assign team member to administer survey; 5 month timeline required; Projected survey administration in Fall 2016 (FY 17).
Publicity/Public Relations:
• Campus Construction Reports*: Goal to prepare and distribute approx. every six weeks. Last one sent 12/21/15
• News Releases: Write and distribute through several media channels. Continual
CID projects near completion, Lizotte appointed STAR tech advisor, 2015 Power Partner award, etc.
• Publicity documentation and analytics*: Will contact Cindy Tribucher and report annually.
Internal Communications:
• Intranet and Web Site Content review and user feedback. (note: level 0 security information) FIS and WAG meetings to be reinstated;
• Regularly scheduled communications meetings with BES and Operations
Bimonthly meetings for both with the first scheduled for January 22
Tactic 3.1.1: Achieve overall customer satisfaction of 93% (proposed) for FM services. Measure: Annual Customer Survey results: Percentage of customers selecting “fair, good or very good” with the statement: “Overall I am satisfied with <the service> I received from Facilities Management”

GOAL #3 – Foster a Customer Focused Organization Objective: 3.1: Continuously improve customer service/satisfaction Tactic: 3.1.2: Decrease the Number of Hot/Cold Calls by 20% Tactic: 3.1.4: 90% of Reactive Work Request Customers are satisfied or very satisfied
ACTION PLAN
43
Lead
F. O.
Actions Planned
1. Continue to work with customers; educate them on the UNCC Temperature Control Policy and monitor requests for accuracy.
2. Continue to develop BAS Controls section and cross-train with Zones.
3. Continue to include Energy Manager in Bi-Weekly Operations’ meetings.
4. Continue daily monitoring of building temperatures within Zones.
5. Develop Utilities Team (focus on BAS Team; retro commissioning and Utility Manager) December 2015 6. Working w Capital; Retro-commissioning 3 buildings (Cameron, McEniry, Smith) 7. Continue to improve condensate return for main Steam Plant 8. Working with Capital; Mechanical Systems Upgrade Project (Kennedy)
Actions Completed
1. Implemented daily monitoring of temperature using BAS and field verification. Continue to develop controls section and cross-train with Zones.
2. Adjusted Customer Satisfaction Survey. 3. Updated temperature policy

Facilities Management Strategic Planning Session – Second Quarter FY 2016
GOAL #3 – Foster a Customer Focused Organization Objective: 3.1: Continuously improve customer service/satisfaction Tactic: 3.1.2: Decrease the Number of Hot/Cold Calls by 20% Measure: Number of Hot/Cold Calls submitted on work requests Lead: Facilities Operations Balance Scorecard Category: Customer Perspective
44
Lead
F. O.
5
25
45
65
85
105
125
145
165
185
205
FY15Annual Average
1st Qtr FY16 2nd Qtr FY16 3rd Qtr FY16 4th Qtr FY16
TooHot85
TooHot121
Too Hot54
TooCold96
TooCold55 Too
Cold 35
Total181
Total176
Total 89
Decrease the Number of Hot/Cold Calls
Goal = DecreaseNumber by 20%(145 Total)
STATUS
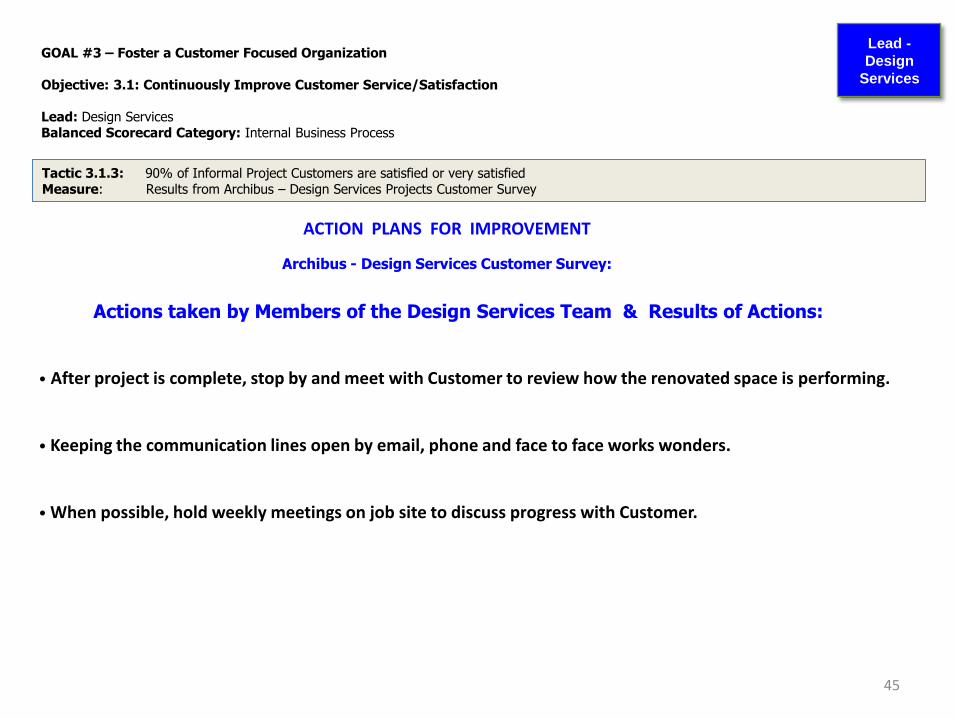
Actions taken by Members of the Design Services Team & Results of Actions: • After project is complete, stop by and meet with Customer to review how the renovated space is performing.
• Keeping the communication lines open by email, phone and face to face works wonders. • When possible, hold weekly meetings on job site to discuss progress with Customer.
GOAL #3 – Foster a Customer Focused Organization Objective: 3.1: Continuously Improve Customer Service/Satisfaction Lead: Design Services Balanced Scorecard Category: Internal Business Process
45
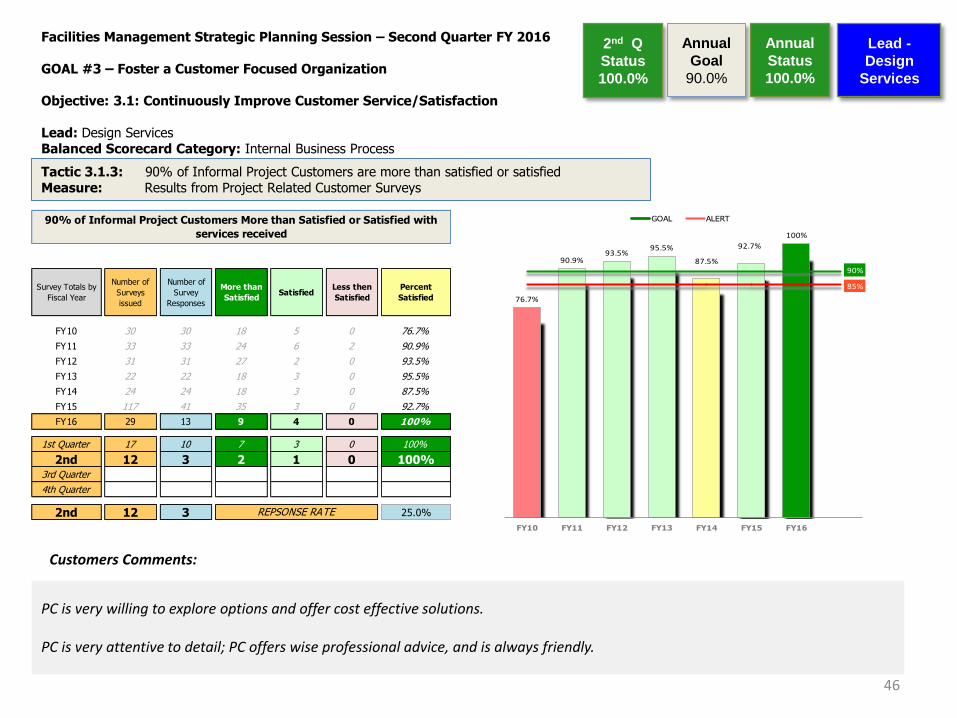
Tactic 3.1.3: 90% of Informal Project Customers are satisfied or very satisfied Measure: Results from Archibus – Design Services Projects Customer Survey
ACTION PLANS FOR IMPROVEMENT
Archibus - Design Services Customer Survey:
Lead -
Design
Services
76.7%
90.9%93.5%
95.5%
87.5%
92.7%
100%
90%
85%
FY10 FY11 FY12 FY13 FY14 FY15 FY16
GOAL ALERT
Facilities Management Strategic Planning Session – Second Quarter FY 2016 GOAL #3 – Foster a Customer Focused Organization Objective: 3.1: Continuously Improve Customer Service/Satisfaction Lead: Design Services Balanced Scorecard Category: Internal Business Process
46
Customers Comments:
PC is very willing to explore options and offer cost effective solutions. PC is very attentive to detail; PC offers wise professional advice, and is always friendly.
Tactic 3.1.3: 90% of Informal Project Customers are more than satisfied or satisfied Measure: Results from Project Related Customer Surveys
Lead -
Design
Services
Annual
Goal
90.0%
Annual
Status
100.0%
Survey Totals by
Fiscal Year
Number of
Surveys
issued
Number of
Survey
Responses
More than
Satisfied Satisfied
Less then
Satisfied
Percent
Satisfied
FY10 30 30 18 5 0 76.7%
FY11 33 33 24 6 2 90.9%
FY12 31 31 27 2 0 93.5%
FY13 22 22 18 3 0 95.5%
FY14 24 24 18 3 0 87.5%
FY15 117 41 35 3 0 92.7%
FY16 29 13 9 4 0 100%
1st Quarter 17 10 7 3 0 100%
2nd 12 3 2 1 0 100%3rd Quarter
4th Quarter
2nd 12 3 25.0%
90% of Informal Project Customers More than Satisfied or Satisfied with
services received
REPSONSE RATE
2nd Q
Status
100.0%
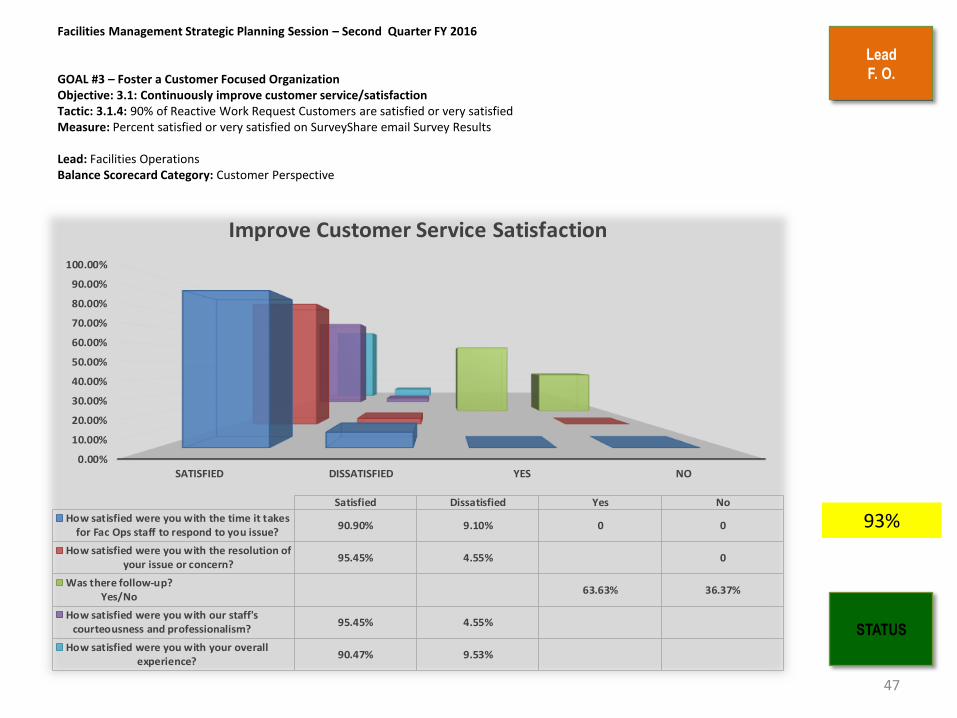
Facilities Management Strategic Planning Session – Second Quarter FY 2016 GOAL #3 – Foster a Customer Focused Organization Objective: 3.1: Continuously improve customer service/satisfaction Tactic: 3.1.4: 90% of Reactive Work Request Customers are satisfied or very satisfied Measure: Percent satisfied or very satisfied on SurveyShare email Survey Results Lead: Facilities Operations Balance Scorecard Category: Customer Perspective
Lead
F. O.
STATUS
47
0.00%
10.00%
20.00%
30.00%
40.00%
50.00%
60.00%
70.00%
80.00%
90.00%
100.00%
SATISFIED DISSATISFIED YES NO
Satisfied Dissatisfied Yes No
How satisfied were you with the time it takesfor Fac Ops staff to respond to you issue?
90.90% 9.10% 0 0
How satisfied were you with the resolution ofyour issue or concern?
95.45% 4.55% 0
Was there follow-up?Yes/No
63.63% 36.37%
How satisfied were you with our staff'scourteousness and professionalism?
95.45% 4.55%
How satisfied were you with your overallexperience?
90.47% 9.53%
Improve Customer Service Satisfaction
93%

GOAL #3 Foster a Customer Focused Organization Objective 3.1: Continuously improve customer service/satisfactio Lead: Facilities Business Office - Communications Balanced Scorecard Category: Customer Perspective
48
Lead
FBO
Customer Communication Initiatives (interrelated):
• Launch 2nd customer feedback interviews Late Fall 2016, Early Spring 2017
• External Marketing Campaign*: “Creating A Campus of Distinction”
Signage This launched in February, 2015, and meetings with BES and FO to be scheduled.
Solicit feedback/input from Directors Meetings to be scheduled to discuss potential expansion
• Customer Facing technology Meeting to be held February 9
Communication plans and user testing assistance with Campus Map and CRDM Report.
Special Projects: • Traffic communications committee (joint partnership with U. Communications):
Request guidance from AVC
ACTION PLAN FOR IMPROVEMENT
Tactic 3.1.5: Build brand awareness Measure: Action Plan Only
GOAL #4
Recruit, Develop, and Retain Quality Employees
"All growth depends upon activity.
There is no development
physically or intellectually without
effort, and effort means work."
-- Calvin Coolidge,
30th U.S. president

GOAL #4 Recruit, Develop and Retain Quality Employees Objective 4.1: Recruit a Qualified Workforce in a Timely Fashion Lead: Facilities Business Office Balanced Scorecard Category: Innovation & Learning
50
Lead
FBO
1. Increase the pool of qualified applicants and ensure a qualified, diverse applicant pool. As appropriate through
June 30, 2016
2. Timely and efficient processing position management actions. As appropriate through June 30, 2016
3. Ensure FM maintains current on budgeted positions. As appropriate through June 30, 2016
4. Mandatory Targeted Selection for Supervisors. Ongoing
5. Updated Interview Guides. Ongoing.
ACTION PLAN FOR IMPROVEMENT
Tactic 4.1.1: Vacancy time of no longer than 80 calendar days – Nonexempt Vacancy time of no longer than 120 calendar days - Exempt Tactic 4.1.2: Reduce Number of Employees Terminated During Probationary Period to less than 5%

Facilities Management Strategic Planning Session – Second Quarter 2016 GOAL #4 Recruit, Develop and Retain Quality Employees Objective 4.1: Recruit a Qualified Workforce in a Timely Fashion Lead: Facilities Business Office Balanced Scorecard Category: Innovation & Learning
Lead
FBO
51
0
0.5
1
1.5
2
2.5
3
BES BoilerRoom
FBO Grounds HighVoltage
Recycling DesignServices
FBO
Nonexempt Exempt
2
1
2
1
2
1
2
1 1
FM New Hires/ Promotions per Department 2nd Quarter FY 2016
New Hires Promotions
0
1
2
3
4
5
6
7
8
9
10
Nonexempt Exempt
8
1
3
1
FM New Hire/ Promotion 2nd Quarter FY 2016
New Hire Promotion
New Hires = 9
Promotions = 4
Tactic 4.1.1: Vacancy time of no longer than 80 calendar days – Nonexempt Vacancy time of no longer than 120 calendar days - Exempt Measure: Days needed to fill vacant positions
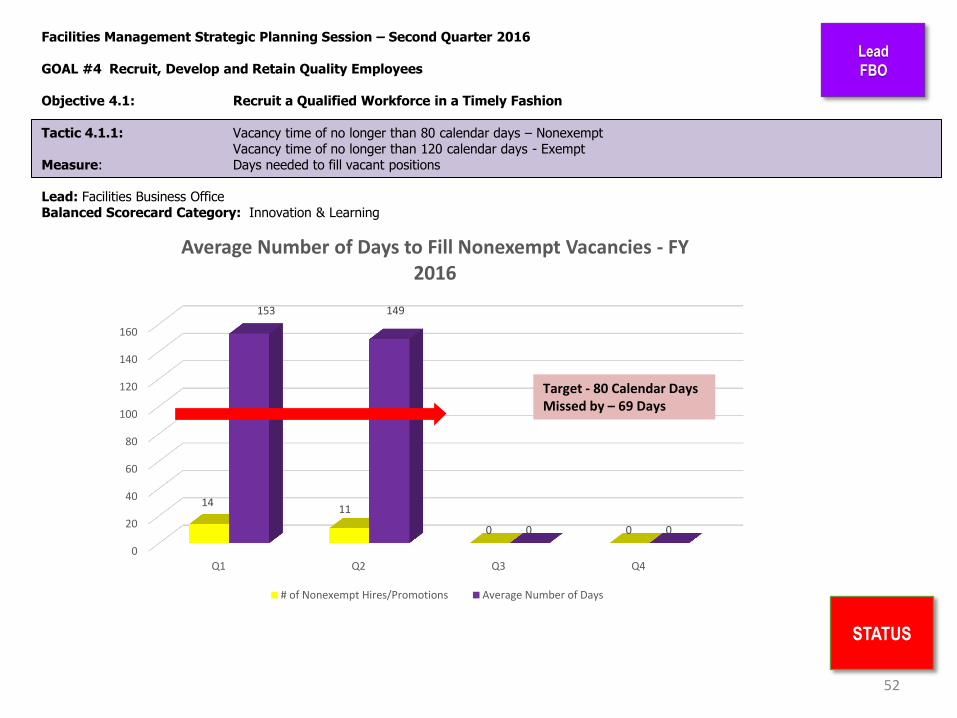
Facilities Management Strategic Planning Session – Second Quarter 2016 GOAL #4 Recruit, Develop and Retain Quality Employees Objective 4.1: Recruit a Qualified Workforce in a Timely Fashion Lead: Facilities Business Office Balanced Scorecard Category: Innovation & Learning
52
STATUS
Lead
FBO
0
20
40
60
80
100
120
140
160
Q1 Q2 Q3 Q4
14 11
0 0
153 149
0 0
Average Number of Days to Fill Nonexempt Vacancies - FY 2016
# of Nonexempt Hires/Promotions Average Number of Days
Target - 80 Calendar Days Missed by – 69 Days
Tactic 4.1.1: Vacancy time of no longer than 80 calendar days – Nonexempt Vacancy time of no longer than 120 calendar days - Exempt Measure: Days needed to fill vacant positions
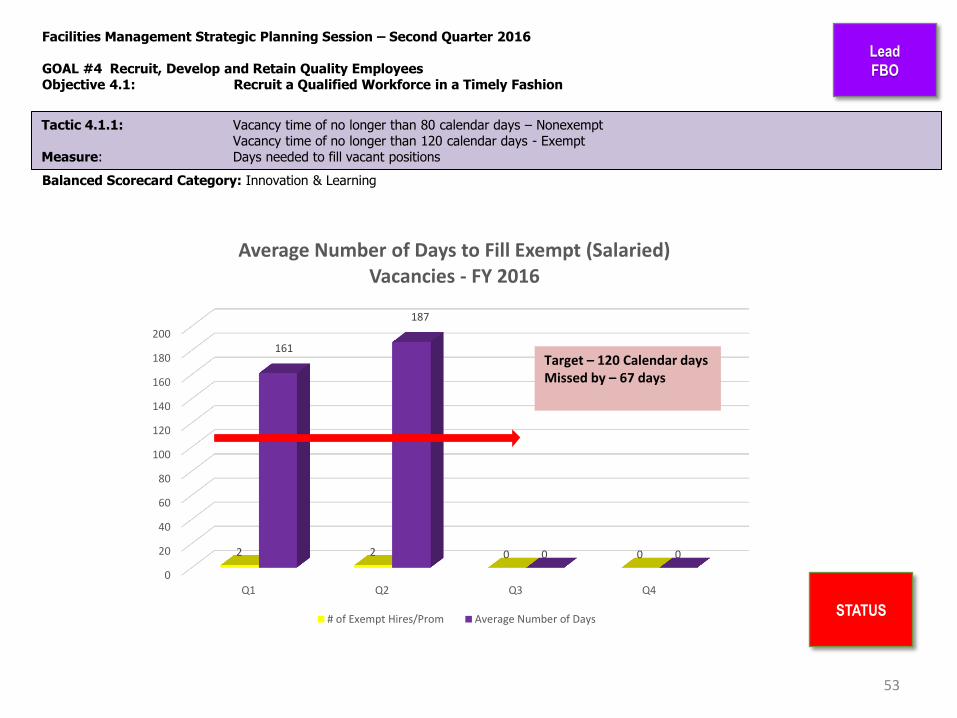
Facilities Management Strategic Planning Session – Second Quarter 2016 GOAL #4 Recruit, Develop and Retain Quality Employees Objective 4.1: Recruit a Qualified Workforce in a Timely Fashion Lead: Facilities Business Office Balanced Scorecard Category: Innovation & Learning
53
Lead
FBO
STATUS
0
20
40
60
80
100
120
140
160
180
200
Q1 Q2 Q3 Q4
2 2 0 0
161
187
0 0
Average Number of Days to Fill Exempt (Salaried) Vacancies - FY 2016
# of Exempt Hires/Prom Average Number of Days
Target – 120 Calendar days Missed by – 67 days
Tactic 4.1.1: Vacancy time of no longer than 80 calendar days – Nonexempt Vacancy time of no longer than 120 calendar days - Exempt Measure: Days needed to fill vacant positions
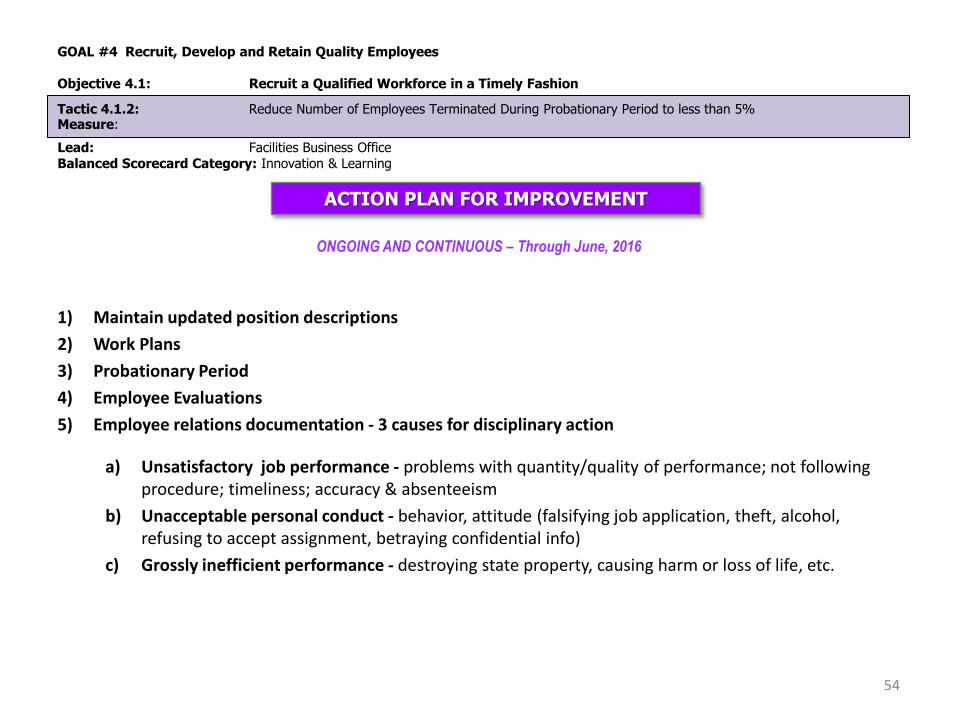
GOAL #4 Recruit, Develop and Retain Quality Employees Objective 4.1: Recruit a Qualified Workforce in a Timely Fashion Lead: Facilities Business Office Balanced Scorecard Category: Innovation & Learning
ONGOING AND CONTINUOUS – Through June, 2016
1) Maintain updated position descriptions
2) Work Plans
3) Probationary Period
4) Employee Evaluations
5) Employee relations documentation - 3 causes for disciplinary action
a) Unsatisfactory job performance - problems with quantity/quality of performance; not following procedure; timeliness; accuracy & absenteeism
b) Unacceptable personal conduct - behavior, attitude (falsifying job application, theft, alcohol, refusing to accept assignment, betraying confidential info)
c) Grossly inefficient performance - destroying state property, causing harm or loss of life, etc.
54
ACTION PLAN FOR IMPROVEMENT
Tactic 4.1.2: Reduce Number of Employees Terminated During Probationary Period to less than 5% Measure:

Facilities Management Strategic Planning Session - Second Quarter 2016 GOAL #4 Recruit, Develop and Retain Quality Employees Objective 4.1: Recruit a Qualified Workforce in a Timely Fashion Lead: Facilities Business Office Balanced Scorecard Category: Innovation & Learning
Lead
FBO
55
Status
0
0.5
1
1.5
2
2.5
3
3.5
4
4.5
5
BES Grounds Recycling BES
Qtr 1 Qtr 2 Qtr 3 Qtr 4
1 1 1 1 1
Separations by Department During Probation Nonexempt FY 2016
Resignation Retirement Termination Death
0
0.5
1
1.5
2
2.5
3
3.5
4
4.5
5
None None None None
Qtr 1 Qtr 2 Qtr 3 Qtr 4
Separations by Department During Probation (Salaried) Exempt FY 2016
Resignation Retirement Termination Death
Turnover Rate 1st Quarter = .36% 2nd Quarter = .54%
Tactic 4.1.2: Reduce Number of Employees Terminated During Probationary Period to less than 5% Measure: Percent Employees Separated before end of probationary period.

Facilities Management Strategic Planning Session – Second Quarter 2016 GOAL #4 Recruit, Develop and Retain Quality Employees Objective 4.1: Recruit a Qualified Workforce in a Timely Fashion Lead: Facilities Business Office Balanced Scorecard Category: Innovation & Learning
56
0
1
2
3
4
5
6
7
8
BES FBO Grounds HighVoltage
Lock Shop Recycling BES FaciliitesPlanning
Zone 4
Qtr 1 Qtr 2
4
1 1 1 1 1
2
1 1 1
4
1 1
Separations FY 2016 Nonexempt
Resignation
Retirement
Termination
Death
Resignations = 2 Retirement = 2 Terminations = 4 Death = 1
Tactic 4.1.2: Reduce Number of Employees Terminated During Probationary Period to less than 5% Measure: Percent Employees Terminated before end of probationary period
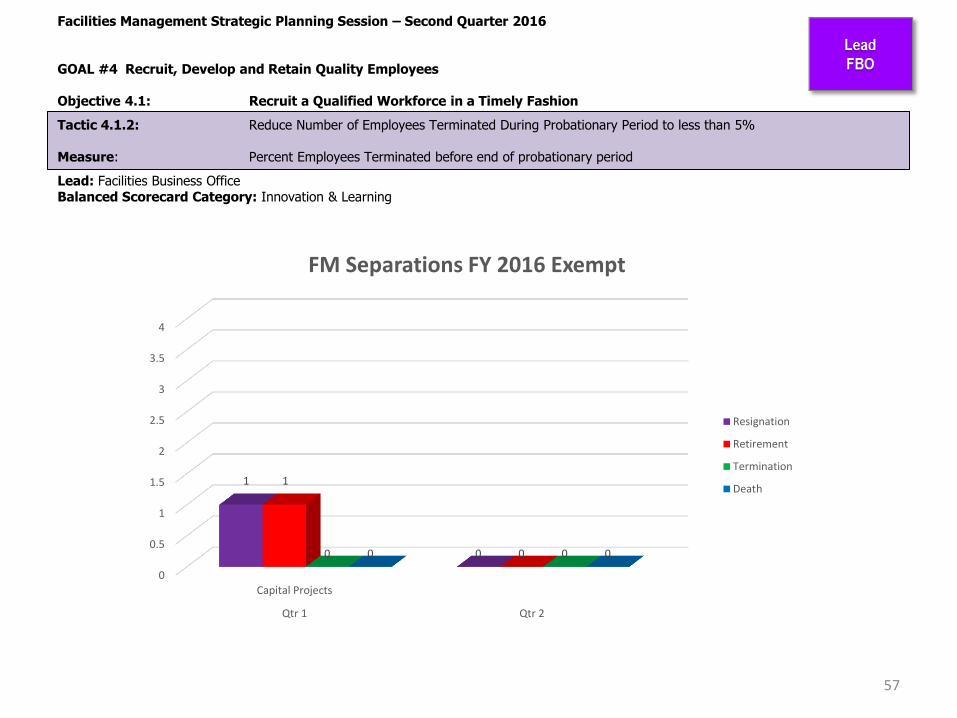
Facilities Management Strategic Planning Session – Second Quarter 2016 GOAL #4 Recruit, Develop and Retain Quality Employees Objective 4.1: Recruit a Qualified Workforce in a Timely Fashion Lead: Facilities Business Office Balanced Scorecard Category: Innovation & Learning
57
0
0.5
1
1.5
2
2.5
3
3.5
4
Capital Projects
Qtr 1 Qtr 2
1
0
1
0 0 0 0 0
FM Separations FY 2016 Exempt
Resignation
Retirement
Termination
Death
Tactic 4.1.2: Reduce Number of Employees Terminated During Probationary Period to less than 5% Measure: Percent Employees Terminated before end of probationary period

GOAL #4 Recruit, Develop and Retain Quality Employees Objective 4.2: Improve Workforce Development Lead: Facilities Business Office Balanced Scorecard Category: Internal Business Process, Learning and Growth
58
Lead
FBO
Action: Increase training opportunities available to FM Employees Planned/Completed
FM ACADEMY
Technical
– Electrical Trouble Shooting & Preventive Maintenance March 2016
– Pump Repair & Maintenance May 2016
Safety
– Supervisor Safety Talks Monthly
– Winter Preparedness Expo (Dec 2015) Completed
Leadership
– APPA Leadership Academy – Level II Feb 2016
– APPA Leadership Academy – Level III March 2016
– APPA Supervisor Toolkit June 2016
– NEO redesign June 2016
– Cultural IQ Training TBD
Externally Driven Initiatives
– Niner Talent “Workplan” training Jan 2016
– Kronos training As needed
ACTION PLAN FOR IMPROVEMENT
Tactic 4.2.1: Increase Supervisor/Manager Training to 40 hours/year Tactic 4.2.2: Increase Employee Training to 20 hours/year

Facilities Management Strategic Planning Session – Second Quarter 2016 GOAL #4 Recruit, Develop and Retain Quality Employees Objective 4.2: Improve Workforce Development Lead: Facilities Business Office Balanced Scorecard Category: Internal Business Process, Learning and Growth
59
Lead
FBO
Annual Target
0
400
800
1200
1600
2000
Q1Q2
Q3Q4
FY 16 Training Hours for Supervisors & Managers by Quarter
Training Hours by QTR
YTD Training Hours
Training Hours
228 hrs
FY 2016 Target - 1,960 hrs
2nd Qtr. Target – 490 hrs -----------------------------
Actual YTD 335 hrs (17 %)
Actual 2nd Qtr. 228 hrs (47 %) 107 hrs
ANNUAL
Tactic 4.2.1: Increase Supervisor/Manager Training to 40 hours/year Measure: Average Hours of Training completed by Supervisors and Managers
Facilities Management Strategic Planning Session – Second Quarter 2016 GOAL #4 Recruit, Develop and Retain Quality Employees Objective 4.2: Improve Workforce Development Lead: Facilities Business Office Balanced Scorecard Category: Internal Business Process. Learning and Growth
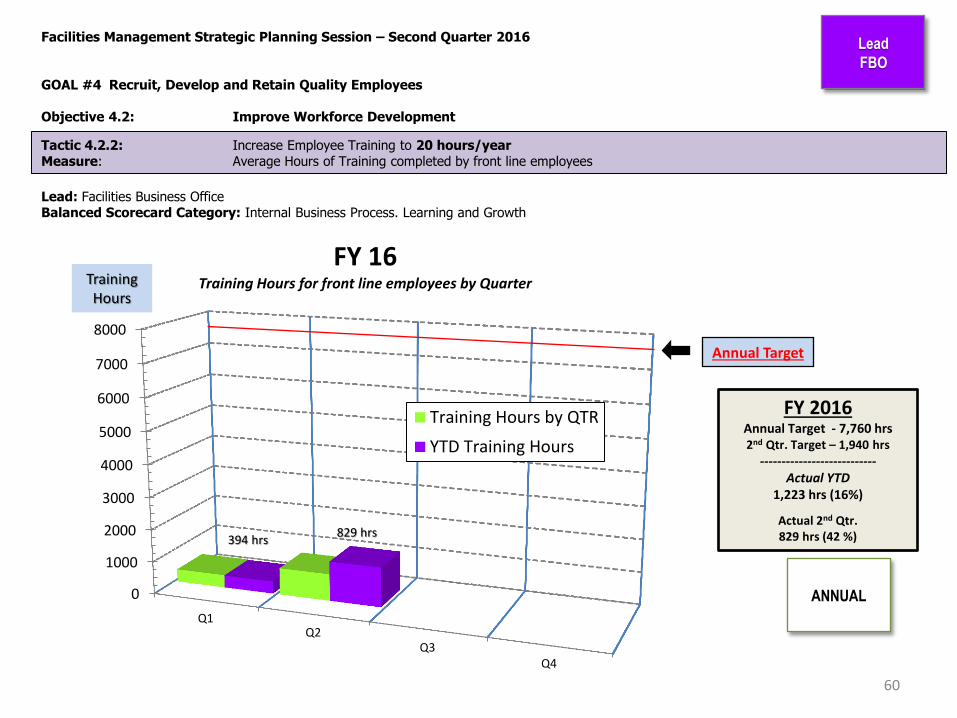
60
Lead
FBO
Annual Target
0
1000
2000
3000
4000
5000
6000
7000
8000
Q1Q2
Q3Q4
FY 16 Training Hours for front line employees by Quarter
Training Hours by QTR
YTD Training Hours
394 hrs 829 hrs
FY 2016 Annual Target - 7,760 hrs 2nd Qtr. Target – 1,940 hrs
--------------------------- Actual YTD
1,223 hrs (16%)
Actual 2nd Qtr. 829 hrs (42 %)
ANNUAL
Training Hours
Tactic 4.2.2: Increase Employee Training to 20 hours/year Measure: Average Hours of Training completed by front line employees
GOAL #4 Recruit, Develop and Retain Quality Employees Objective 4.3: Create and Maintain a Quality Work Environment Lead: Facilities Business Office Balanced Scorecard Category: Customer Perspective
Survey Logistics:
• Update survey instrument based on feedback from employees (add progress bar, investigate adding a comment box after each section or field for employees to provide feedback, etc.) – TBD (based upon UI availability)
• Discuss survey administration feasibility with Urban Institute and obtain potential scheduling timeframes – January 2016;
• Next survey date TBD.
61
Lead
FBO
ACTION PLAN FOR IMPROVEMENT
Tactic 4.3.1: 90% of Employees satisfied or very satisfied working in FM Tactic 4.3.2: 87% of Employees satisfied or very satisfied in each unit of FM
GOAL #4 Recruit, Develop and Retain Quality Employees Objective 4.4: Improve Employee Safety Lead: Facilities Business Office Balanced Scorecard Category: Innovation and Learning Perspective
62
Lead
FM Wide
Activities to Foster “Safety Mindset” • Supervisor Safety Talks (SST) Monthly • Twelve month SST topics calendar posted for 2016 • 6th Annual FM Safety Fair Annual • 8th Annual FM Safety Slogan Contest Annual
Safety Training
• “Safety Training Needs Assessment” sent to new employees & their supervisor Ongoing
• “EHS Safety Check List” sent to Directors Oct 2015
• List Safety training topics/links on FM Learning & Development web page Oct 2015
• Communicate EH&S training schedule to FM Ongoing
ACTION PLAN
Tactic 4.4.1: Reduce the number of reportable accidents by 20% Tactic 4.4.2: 98% of Mandatory Compliance Training completed annually Measure: Percent of employees completing mandatory compliance training
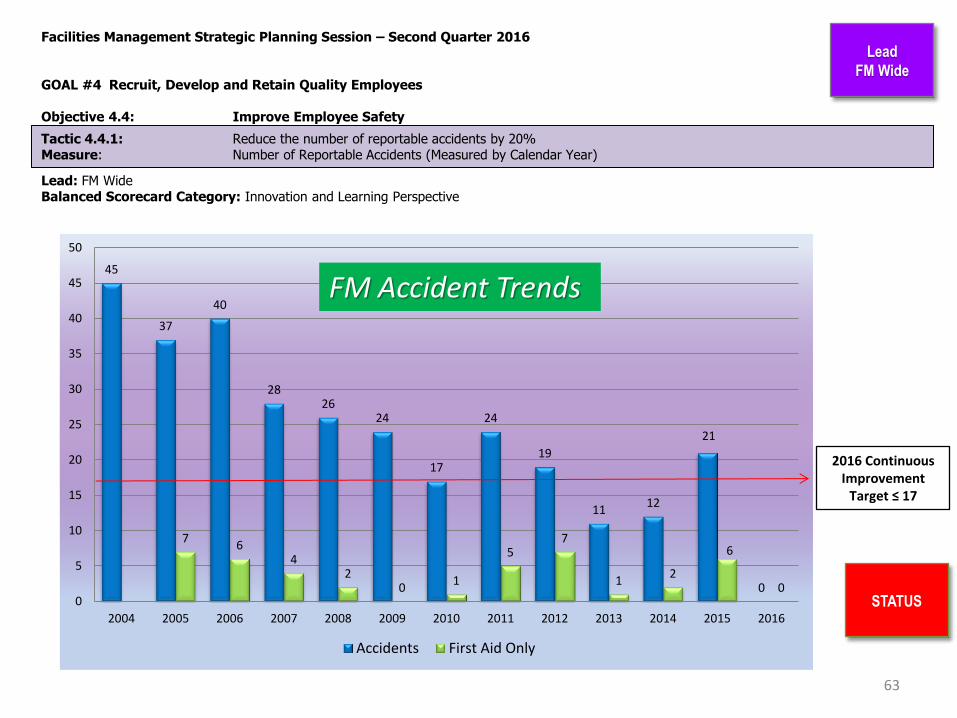
Facilities Management Strategic Planning Session – Second Quarter 2016 GOAL #4 Recruit, Develop and Retain Quality Employees Objective 4.4: Improve Employee Safety Lead: FM Wide Balanced Scorecard Category: Innovation and Learning Perspective
2016 Continuous Improvement
Target ≤ 17
STATUS
Lead
FM Wide
63
45
37
40
28 26
24
17
24
19
11 12
21
0
7 6
4 2
0 1
5 7
1 2
6
0 0
5
10
15
20
25
30
35
40
45
50
2004 2005 2006 2007 2008 2009 2010 2011 2012 2013 2014 2015 2016
Accidents First Aid Only
FM Accident Trends
Tactic 4.4.1: Reduce the number of reportable accidents by 20% Measure: Number of Reportable Accidents (Measured by Calendar Year)

GOAL #4 Recruit, Develop and Retain Quality Employees Objective 4.4: Improve Employee Safety Lead: FM Wide Balanced Scorecard Category: Innovation and Learning Perspective
64
Lead
FM Wide
Action Item _ Target Date
Safety Training FY16 YTD – 881 hours • Safety Training Taskforce (Collaborative initiative with EH&S) Ongoing
• Winter Preparedness Expo Dec 2015
• Safety related activities
• FM Safety Committee meeting Bi-monthly • Supervisor Safety Talks (12-month calendar posted to website) Monthly
• Safety Slogan Contest - “Safety Pays In Many Ways” July 2016
• Accident/Incident Totals (CY15) • Accidents - 21 2015 CY • Minor incidents – 6 2015 CY
ACTION PLAN FOR IMPROVEMENT
Tactic 4.4.1: Reduce the number of reportable accidents by 20% Tactic 4.4.2: 98% of Mandatory Compliance Training completed annually

GOAL #4 Recruit, Develop and Retain Quality Employees Objective 4.5: Improve Workforce Performance (Action Plan Only) Lead: Facilities Business Office Balanced Scorecard Category: Innovation and Learning Perspective
65
Lead
F. O.
Lead
FM Wide
FM Academy
• Web Content Development, working with NiCole Lynch, FM Communications Officer, Ongoing
for updates on Learning & Development webpage.
– Online training evaluation form posted to FM website
– Supervisor Safety Talk (SST) topics 2016 calendar published
– Commonly used FM Acronyms listing (to be published Feb 2016)
– Training vendor sourcing & selection (as needed/as funded)
– Updates to website on upcoming L & D events
Leadership
• Hosting APPA leadership workshops onsite. Leadership Academy Level I completed May 2015.
– APPA Leadership Academy (Level II) Feb 2016
– APPA Leadership Academy (Level III) Mar/Apr 2016
– APPA Supervisor Toolkit June 2016
Technical
• Working with Materials Management on RFP process to secure onsite training providers.
– Electrical Troubleshooting & Preventive Maintenance Mar 2016
– Pump Repair & Maintenance Apr/May 2016
Action Item Target Date
ACTION PLAN FOR IMPROVEMENT

GOAL #5
Promote Good Stewardship
"The more positive you are
when you think and work
toward your goals, the faster
you achieve them.”
-- Brian Tracy, Speaker, Author,
Consultant

GOAL #5 Promote Good Stewardship Objective 5.1: Promote Fiscal Responsibility Lead: Facilities Business Office Balanced Scorecard Category: Financial Perspective
Finance/Budget: • FY 16 Call for Divisional one-time funding completed on time; Total FM request $2.8M; Received to date = $1M • Develop allocation method for training budgets; • Holding Budget Meetings for BES and FO Departments monthly with director and quarterly with respective
leadership teams; Mid-year budget reviews with FO and BES leadership teams scheduled for January 2016; • Reinstitute capital project budget meetings with Capital team; Meetings began October 2015; Next meetings to be
scheduled for January 21, 2016; • INTERSCOPE training and refreshers provided/completed as needed; additional training provided to Materials
Management for quarterly HUB report in October – will be repeated in January 2016; • Budget Memo and Instructions draft prepared for submission to AVC in late January 2016; Package distribution to
be completed during week of January 18th; Training course on how to complete the spreadsheet under consideration.
• NEW: Management Process for projects managed by FO – Growing area of concern regarding budget management and tracking of expenses for larger dollar (capitalized – over $5K) projects done by FO.
Supplemental Grant/Award Funding: • Search for grant and award possibilities for Facilities Management organizations. For those grants requiring
“matching funds”, ensure buy-in from AVC prior to submitting proposals – thru June 2016; Currently on hold due to absence of Grants Management/Procurement specialist until February 2016;
67
Lead
FBO
ACTION PLAN FOR IMPROVEMENT
Tactic 5.1.1: 100% of financial accounts within budget Tactic 5.1.2: Increase Supplemental Funding to the Department by 10% annually Tactic 5.1.3: Achieve Administrative cost/GSF ± 5% of APPA Average for Peer Institutions
GOAL #5 Promote Good Stewardship Objective 5.1: Promote Fiscal Responsibility Lead: Facilities Business Office Balanced Scorecard Category: Financial Perspective
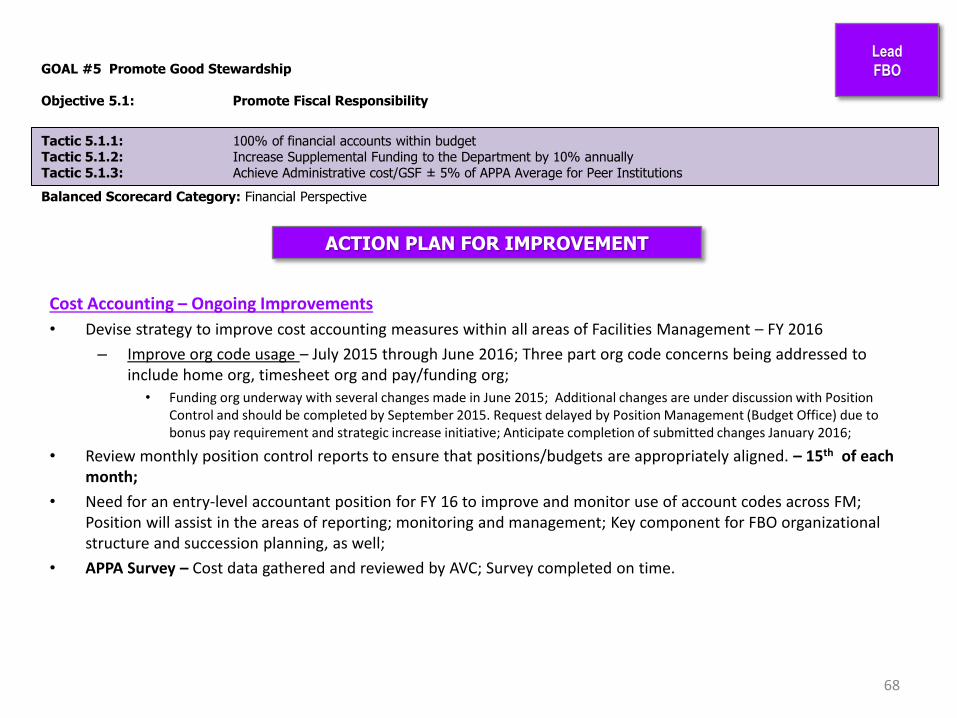
Cost Accounting – Ongoing Improvements
• Devise strategy to improve cost accounting measures within all areas of Facilities Management – FY 2016
– Improve org code usage – July 2015 through June 2016; Three part org code concerns being addressed to include home org, timesheet org and pay/funding org;
• Funding org underway with several changes made in June 2015; Additional changes are under discussion with Position Control and should be completed by September 2015. Request delayed by Position Management (Budget Office) due to bonus pay requirement and strategic increase initiative; Anticipate completion of submitted changes January 2016;
• Review monthly position control reports to ensure that positions/budgets are appropriately aligned. – 15th of each month;
• Need for an entry-level accountant position for FY 16 to improve and monitor use of account codes across FM; Position will assist in the areas of reporting; monitoring and management; Key component for FBO organizational structure and succession planning, as well;
• APPA Survey – Cost data gathered and reviewed by AVC; Survey completed on time.
68
Lead
FBO
ACTION PLAN FOR IMPROVEMENT
Tactic 5.1.1: 100% of financial accounts within budget Tactic 5.1.2: Increase Supplemental Funding to the Department by 10% annually Tactic 5.1.3: Achieve Administrative cost/GSF ± 5% of APPA Average for Peer Institutions

Facilities Management Strategic Planning Session – Second Quarter 2016 GOAL #5 Promote Good Stewardship Objective 5.1: Promote Fiscal Responsibility Lead: Facilities Business Office Balanced Scorecard Category: Financial Perspective
69
Lead
F. O.
ANNUAL
Lead
FBO
Tactic 5.1.2: Increase Supplemental Funding to the Department by 10% annually Measure: Percent increase in supplemental funding

GOAL #5 Promote Good Stewardship Objective 5.1: Promote Fiscal Responsibility Lead: Facilities Business Office Balanced Scorecard Category: Financial Perspective
70
Lead
FBO
FY 15 APPA Survey: • Cost Data collection for FY 15 survey: Complete - December 2015;
• Beta version available: Tentatively February 2016;
• Actual results available: Tentatively March 2016;
• Presentation of comparative findings for UNC Charlotte Administrative cost/ GSF : Tentatively April 2016 SP session.
FY 15 NACUBO Key Facilities Metrics Survey: • Data collection for FY 15 survey completed and submitted on time;
• Actual results available: Tentatively March 2016; • Review of data and next step determination is outstanding; AVC guidance needed.
ACTION PLAN FOR IMPROVEMENT
Tactic 5.1.3: Achieve Administrative cost/GSF ± 5% of APPA Average for Peer Institutions Measure: Administrative cost/GSF from annual APPA Facilities Performance Indicators Report (APPA Benchmark)
GOAL #6 –Promote Good Stewardship- Second Quarter FY 2016
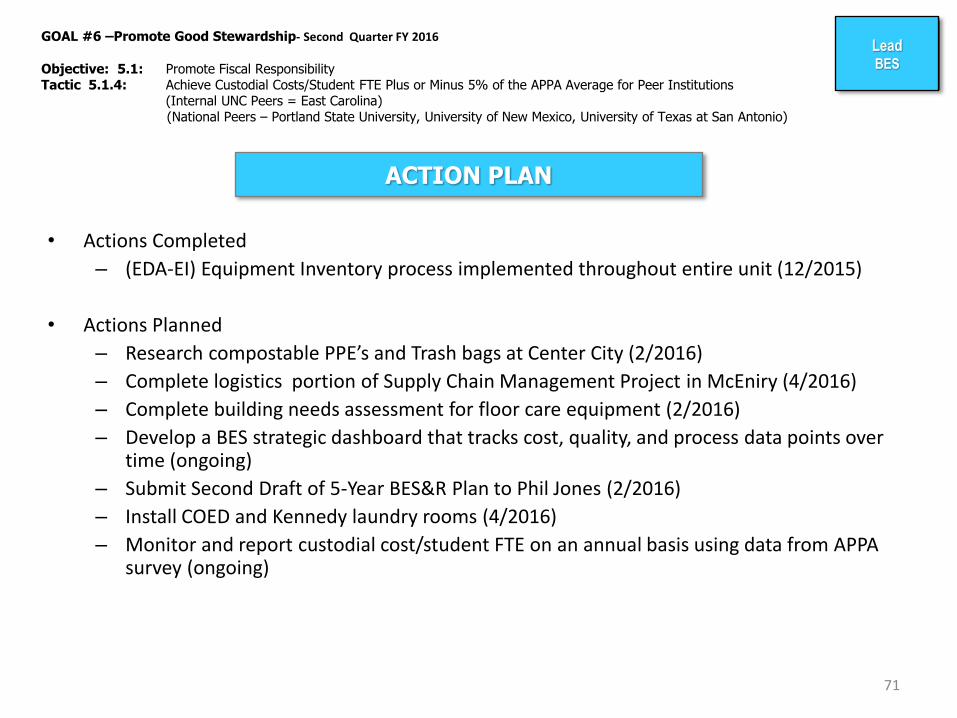
Objective: 5.1: Promote Fiscal Responsibility Tactic 5.1.4: Achieve Custodial Costs/Student FTE Plus or Minus 5% of the APPA Average for Peer Institutions (Internal UNC Peers = East Carolina) (National Peers – Portland State University, University of New Mexico, University of Texas at San Antonio)
ACTION PLAN
• Actions Completed
– (EDA-EI) Equipment Inventory process implemented throughout entire unit (12/2015)
• Actions Planned
– Research compostable PPE’s and Trash bags at Center City (2/2016)
– Complete logistics portion of Supply Chain Management Project in McEniry (4/2016)
– Complete building needs assessment for floor care equipment (2/2016)
– Develop a BES strategic dashboard that tracks cost, quality, and process data points over time (ongoing)
– Submit Second Draft of 5-Year BES&R Plan to Phil Jones (2/2016)
– Install COED and Kennedy laundry rooms (4/2016)
– Monitor and report custodial cost/student FTE on an annual basis using data from APPA survey (ongoing)
71
Lead BES
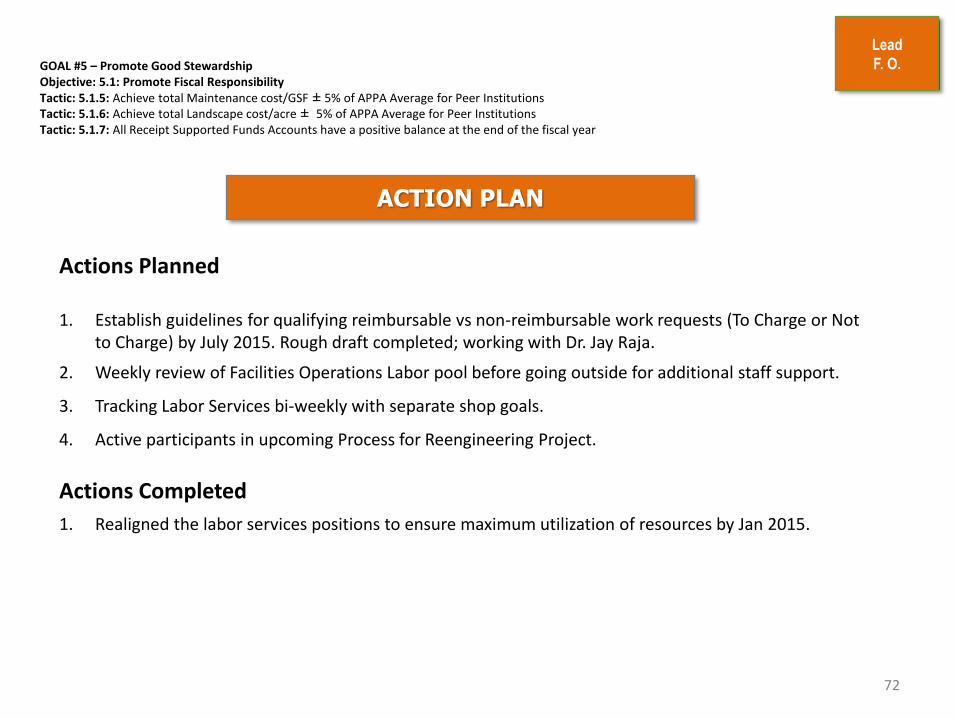
GOAL #5 – Promote Good Stewardship Objective: 5.1: Promote Fiscal Responsibility Tactic: 5.1.5: Achieve total Maintenance cost/GSF ± 5% of APPA Average for Peer Institutions Tactic: 5.1.6: Achieve total Landscape cost/acre ± 5% of APPA Average for Peer Institutions Tactic: 5.1.7: All Receipt Supported Funds Accounts have a positive balance at the end of the fiscal year
ACTION PLAN
72
Lead
F. O.
Actions Planned 1. Establish guidelines for qualifying reimbursable vs non-reimbursable work requests (To Charge or Not
to Charge) by July 2015. Rough draft completed; working with Dr. Jay Raja.
2. Weekly review of Facilities Operations Labor pool before going outside for additional staff support.
3. Tracking Labor Services bi-weekly with separate shop goals.
4. Active participants in upcoming Process for Reengineering Project.
Actions Completed
1. Realigned the labor services positions to ensure maximum utilization of resources by Jan 2015.
Facilities Management Strategic Planning Session – Second Quarter FY 2016
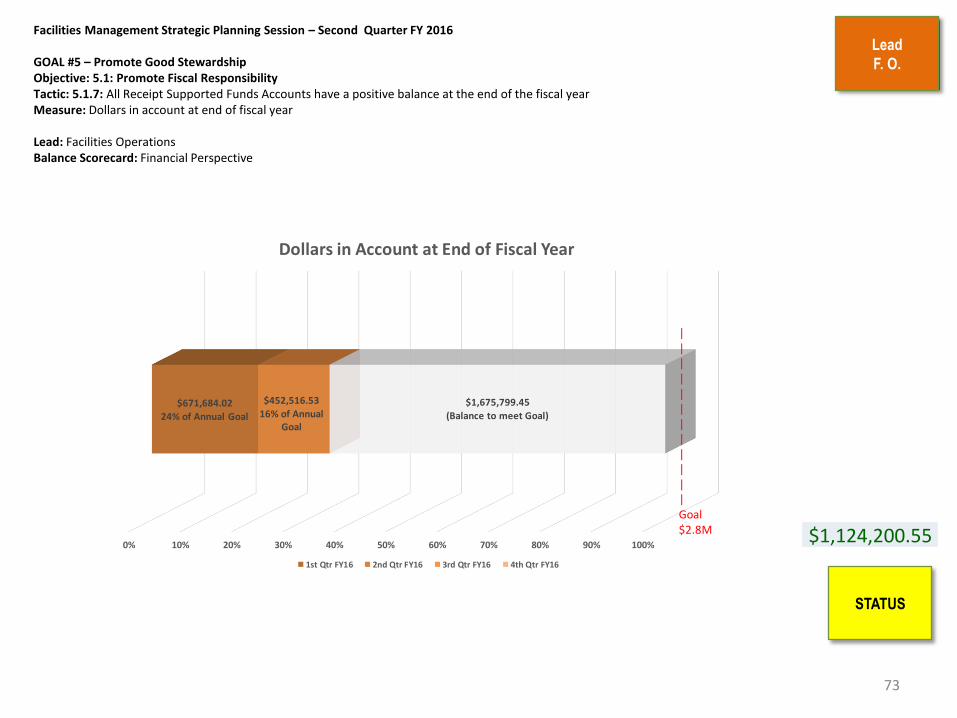
GOAL #5 – Promote Good Stewardship Objective: 5.1: Promote Fiscal Responsibility Tactic: 5.1.7: All Receipt Supported Funds Accounts have a positive balance at the end of the fiscal year Measure: Dollars in account at end of fiscal year Lead: Facilities Operations Balance Scorecard: Financial Perspective
73
Lead
F. O.
STATUS
0% 10% 20% 30% 40% 50% 60% 70% 80% 90% 100%
$671,684.02
24% of Annual Goal
$452,516.53
16% of AnnualGoal
$1,675,799.45
(Balance to meet Goal)
Dollars in Account at End of Fiscal Year
1st Qtr FY16 2nd Qtr FY16 3rd Qtr FY16 4th Qtr FY16
||||||||||||Goal$2.8M $1,124,200.55
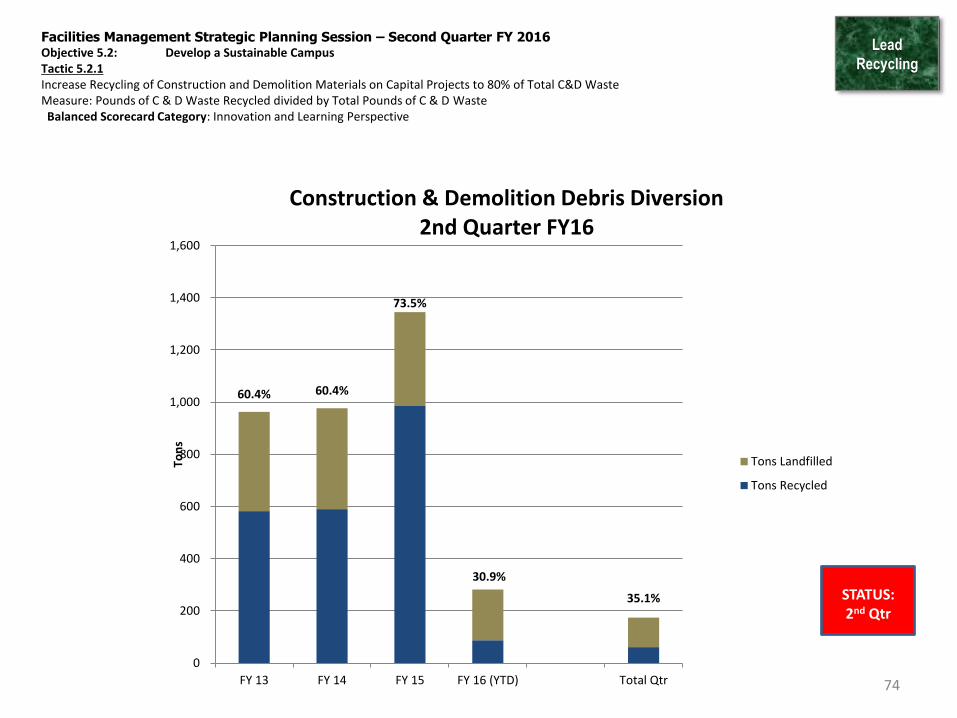
Facilities Management Strategic Planning Session – Second Quarter FY 2016 Objective 5.2: Develop a Sustainable Campus Tactic 5.2.1 Increase Recycling of Construction and Demolition Materials on Capital Projects to 80% of Total C&D Waste Measure: Pounds of C & D Waste Recycled divided by Total Pounds of C & D Waste Balanced Scorecard Category: Innovation and Learning Perspective
Lead
Recycling
74
STATUS: 2nd Qtr
60.4% 60.4%
73.5%
30.9%
35.1%
0
200
400
600
800
1,000
1,200
1,400
1,600
FY 13 FY 14 FY 15 FY 16 (YTD) Total Qtr
Ton
s
Construction & Demolition Debris Diversion 2nd Quarter FY16
Tons Landfilled
Tons Recycled

Facilities Management Strategic Planning Session – Second Quarter FY 2016 Tactic 5.2.2 Increase Percent of Solid Waste Diversion on Campus to 45% by 2020 Measure: Pounds of Solid Waste Recycled, composted and reused Annually divided by Total Solid Waste Balanced Scorecard Category: Innovation and Learning Perspective
Lead
Recycling
75
*Notable increase in 4th quarter due to a Grounds project in May that removed tons of dirt from campus.

Lead
Recycling
GOAL #5 – Promote Good Stewardship- Objective 5.2 Develop a Sustainable Campus Objective 5.2.2 Increase Percent of Solid Waste diversion on Campus to 45% by 2018
ACTION PLAN
• Waste Reduction and Recycling
Actions Complete • Continuing work with HRL to increase recycling rates in residence halls.
• Continuing training new C&D Coordinator.
• Football season was completed (average ~76% recycling from stadium).
• Trash hauling driver was changed; working on getting him trained and on board.
3rd Quarter Actions Planned • Continue planning building for hazardous/universal waste storage (with Grounds and Design)
• Increase social media presence – Twitter, Facebook, Instagram.
• Plan for Spring Campus Cleanup, Tree Planting, and Earth Day activities. (with Grounds and Sustainability)
• Continue to conduct Waste audits for campus to determine amount of recyclables in waste stream – ON HOLD (space constraints and scheduling)
• Conduct waste audits in housing quads where there are no recycling bins (continue working with HRL to pair up all trash and recycling bins) – ON HOLD (space constraints and scheduling)
• Departmental training - waste audits on our Recycling roll-offs at ReCommunity (February 8 and 15)
• Increase education component – beginning with Chartwell’s dining halls (SoVi and Crown Commons).
76
GOAL #5 – Promote Good Stewardship Objective: 5.2: Develop a Sustainable Campus Tactic 5.2.3: Achieve silver rating on the Sustainability Tracking and Reporting System (STARS) NLT end of FY 16. Measure: STARS points to achieve silver rating Lead: Facilities Planning Balanced Scorecard Category: Innovation and Learning Perspective
77
ACTION PLAN
o Assess additional actions for achieving STARS Silver (completed – documentation actions only).
o Uploading information to STARS Website with help from Planning Temp
o Submit for rating by end of fiscal year (ideally April for Earth Month).
Lead
Facilities
Planning
STATUS
Lead
Facilities
Planning
78
Percentage of Completion
1.10 Silver Rating 1.0
.9
.8
.7
.6
.5
.4
.3
.2
.1
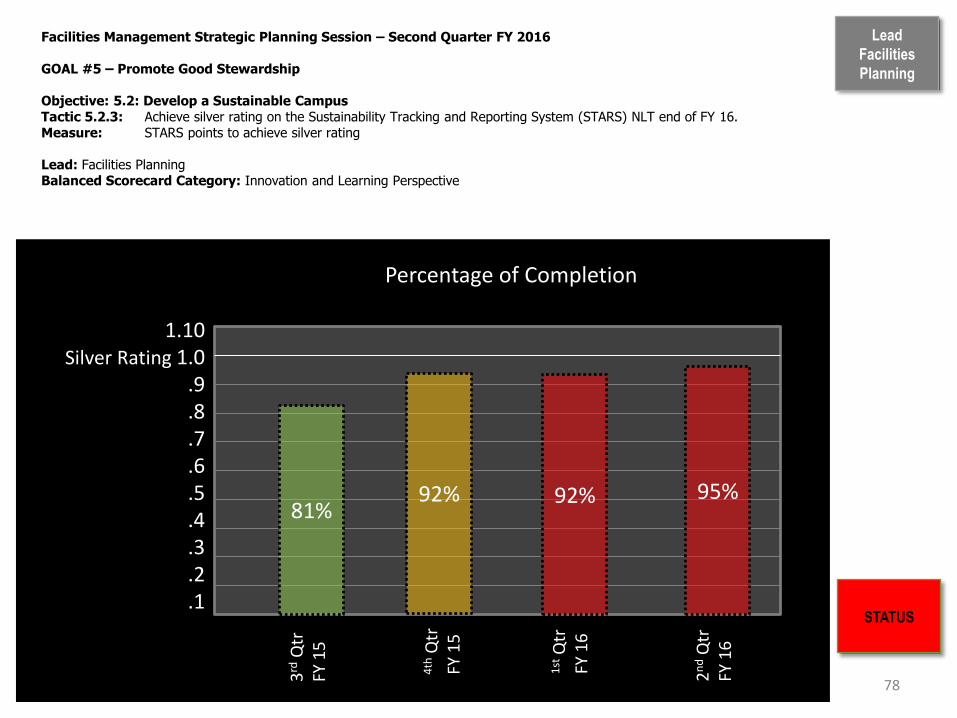
Facilities Management Strategic Planning Session – Second Quarter FY 2016 GOAL #5 – Promote Good Stewardship Objective: 5.2: Develop a Sustainable Campus Tactic 5.2.3: Achieve silver rating on the Sustainability Tracking and Reporting System (STARS) NLT end of FY 16. Measure: STARS points to achieve silver rating Lead: Facilities Planning Balanced Scorecard Category: Innovation and Learning Perspective
STATUS
1st
Qtr
FY
16
81%
4th
Qtr
FY
15
95% 92%
2n
d Q
tr
FY 1
6
3rd
Qtr
FY
15
92%
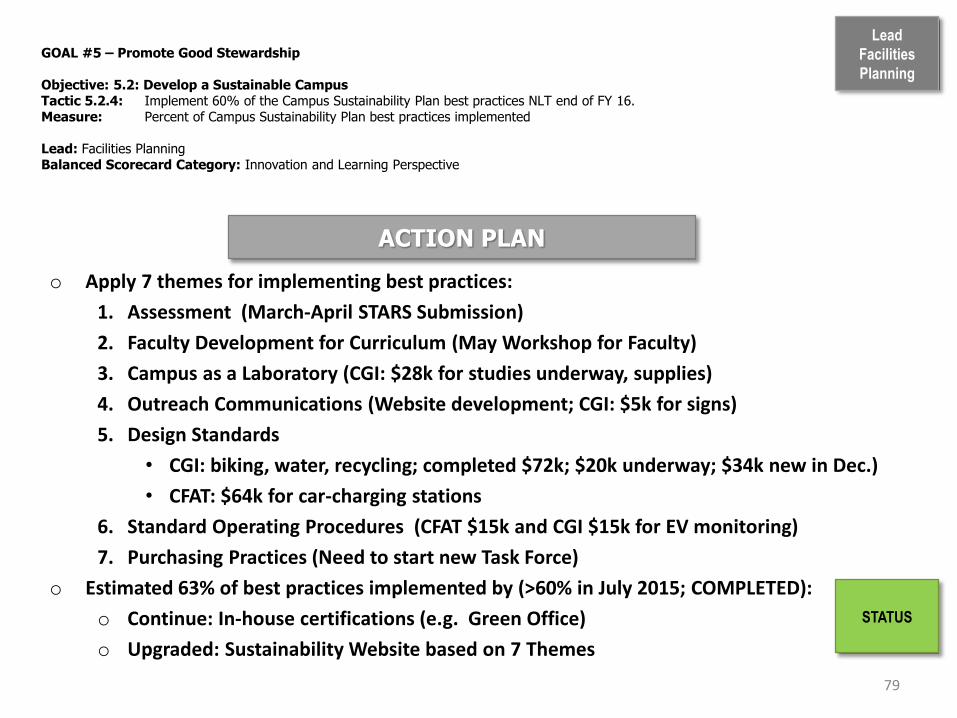
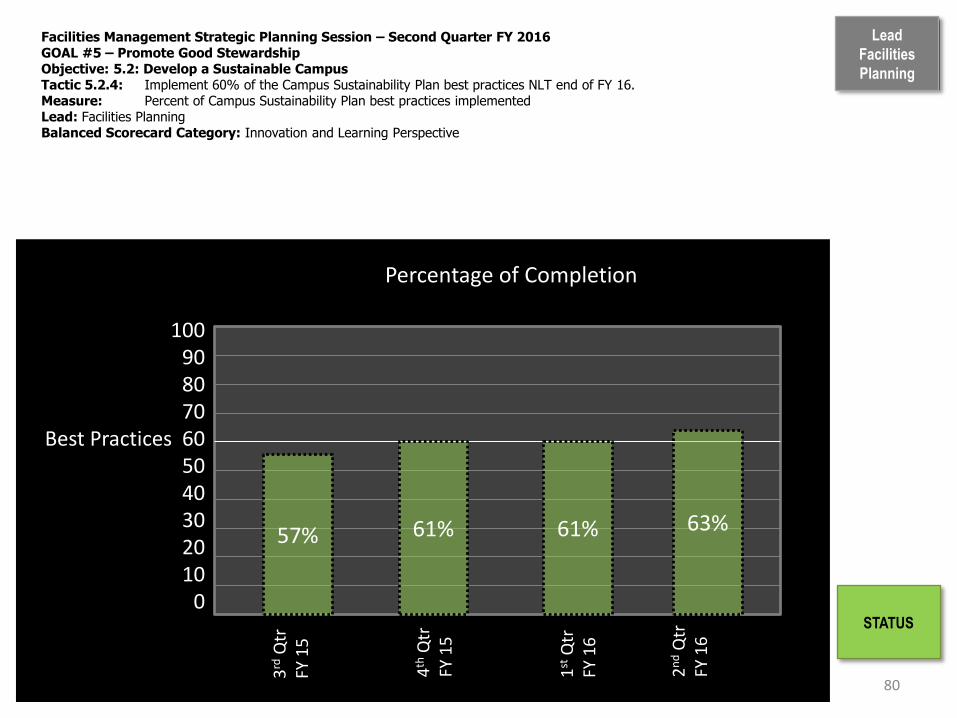
GOAL #5 – Promote Good Stewardship Objective: 5.2: Develop a Sustainable Campus Tactic 5.2.4: Implement 60% of the Campus Sustainability Plan best practices NLT end of FY 16. Measure: Percent of Campus Sustainability Plan best practices implemented Lead: Facilities Planning Balanced Scorecard Category: Innovation and Learning Perspective
79
ACTION PLAN
o Apply 7 themes for implementing best practices:
1. Assessment (March-April STARS Submission)
2. Faculty Development for Curriculum (May Workshop for Faculty)
3. Campus as a Laboratory (CGI: $28k for studies underway, supplies)
4. Outreach Communications (Website development; CGI: $5k for signs)
5. Design Standards
• CGI: biking, water, recycling; completed $72k; $20k underway; $34k new in Dec.)
• CFAT: $64k for car-charging stations
6. Standard Operating Procedures (CFAT $15k and CGI $15k for EV monitoring)
7. Purchasing Practices (Need to start new Task Force)
o Estimated 63% of best practices implemented by (>60% in July 2015; COMPLETED):
o Continue: In-house certifications (e.g. Green Office)
o Upgraded: Sustainability Website based on 7 Themes
Lead
Facilities
Planning
STATUS
Lead
Facilities
Planning
80
Percentage of Completion
2n
d Q
tr
FY 1
6
100 90 80 70
Best Practices 60 50 40 30 20 10
0
Facilities Management Strategic Planning Session – Second Quarter FY 2016 GOAL #5 – Promote Good Stewardship Objective: 5.2: Develop a Sustainable Campus Tactic 5.2.4: Implement 60% of the Campus Sustainability Plan best practices NLT end of FY 16. Measure: Percent of Campus Sustainability Plan best practices implemented Lead: Facilities Planning Balanced Scorecard Category: Innovation and Learning Perspective
STATUS
4th
Qtr
FY
15
61%
1st
Qtr
FY
16
3rd
Qtr
FY
15
57% 61% 63%

Lead
Capital
GOAL #5 – Promote Good Stewardship Objective 5.3 Conserve Natural Resources Tactics 5.3.1 Decrease Energy Usage 30% by FY2015
ACTIONS TO REDUCE CAMPUS ENERGY USAGE
81
• Continue retro-commissioning program
• Cameron, McEniry, & Smith started
• Exterior Lighting upgrades to LED
• Street light replacements - Complete
• Replacing building mounted HID’s
• Pedestrian Lights to be replaced as funds become available –
start with campus core.
• New Goal of 40% reduction by 2025
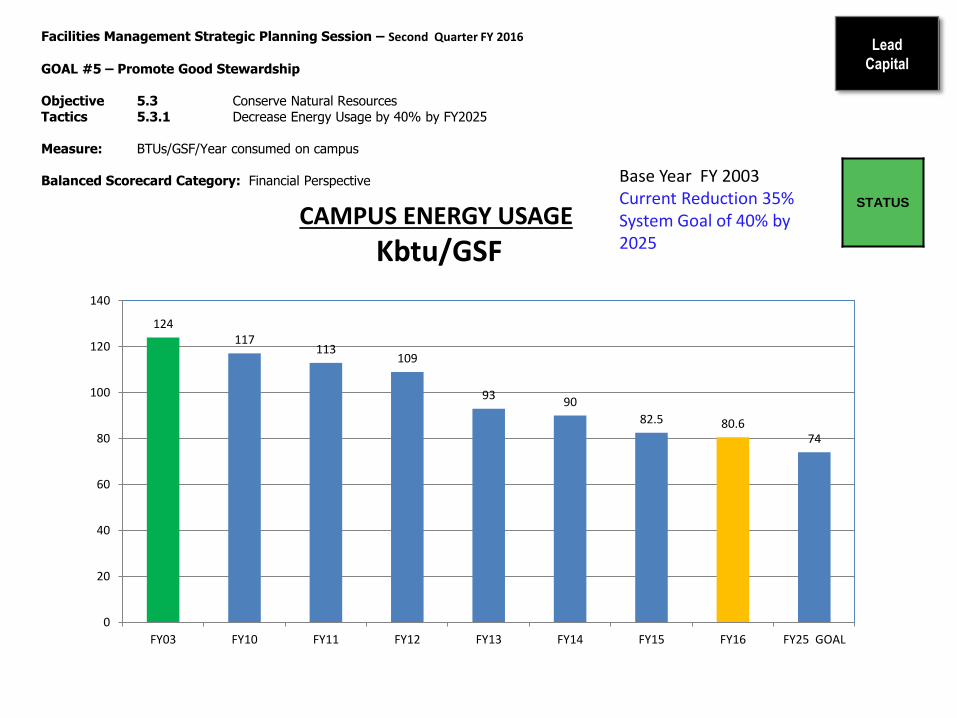
Facilities Management Strategic Planning Session – Second Quarter FY 2016
GOAL #5 – Promote Good Stewardship Objective 5.3 Conserve Natural Resources Tactics 5.3.1 Decrease Energy Usage by 40% by FY2025 Measure: BTUs/GSF/Year consumed on campus
Balanced Scorecard Category: Financial Perspective
Lead
Capital
STATUS
CAMPUS ENERGY USAGE
Kbtu/GSF
Base Year FY 2003 Current Reduction 35% System Goal of 40% by 2025
124 117
113 109
93 90
82.5 80.6 74
0
20
40
60
80
100
120
140
FY03 FY10 FY11 FY12 FY13 FY14 FY15 FY16 FY25 GOAL

Facilities Management Strategic Planning Session – Second Quarter FY 2016
GOAL #5 – Promote Good Stewardship Objective 5.3 Conserve Natural Resources Tactics 5.3.2 Decrease Water Usage by 20% by FY2010 Measure: Gallons/GSF/Year consumed on campus
Balanced Scorecard Category: Financial Perspective
Lead
Capital
83
STATUS
Still need to reduce water usage to help preserve valuable resources
Goal 43 Gal/GSF
Actual 21 Gal/GSF
54
40
36 36
32 34
29
32
43
34 34
24
19 21
-
10
20
30
40
50
60
FY03 FY04 FY05 FY06 FY07 FY08 FY09 FY10 GOAL FY11 FY12 FY13 FY14 FY15
Lead
Capital GOAL #5 – Promote Good Stewardship Objective 5.4: Improve Historically Underutilized Businesses (HUB) Participation Tactic 5.4.1: 12% HUB participation on 80% of Capital Projects Tactic 5.4.2: 5% African American Participation on Capital Projects
ACTION PLAN
Establish project specific participation goals for single prime projects 20% goal for Elm, Maple, Pine Renovation
Challenge GCs to obtain 25% or better participation on CMAR projects
Review GFE documentation for compliance before 1st tier subcontracts are awarded on CMAR projects
Work with internal/external groups to identify skilled HUB contractors
Work with GA/SCO/DOA to ensure HUB information is accurately reflected in InterscopePlus
Work with SCO to revise new Prequalification Policy
Conduct Construction Meet & Greet March 10, 2016
84
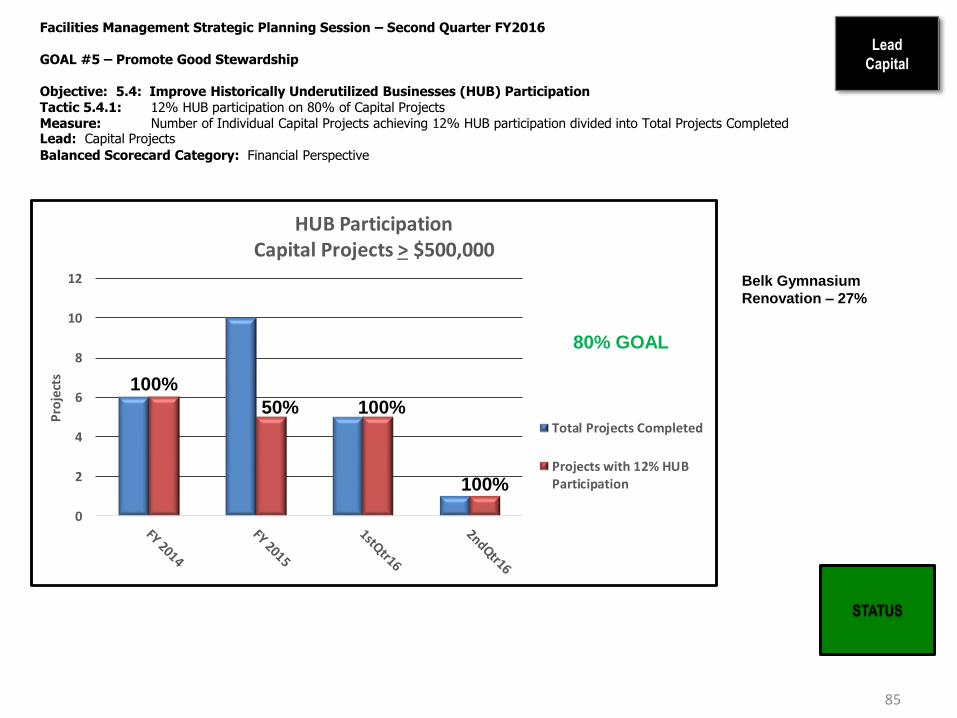
Facilities Management Strategic Planning Session – Second Quarter FY2016 GOAL #5 – Promote Good Stewardship Objective: 5.4: Improve Historically Underutilized Businesses (HUB) Participation Tactic 5.4.1: 12% HUB participation on 80% of Capital Projects Measure: Number of Individual Capital Projects achieving 12% HUB participation divided into Total Projects Completed Lead: Capital Projects
Balanced Scorecard Category: Financial Perspective
Lead
Capital
85
STATUS
Belk Gymnasium
Renovation – 27%
0
2
4
6
8
10
12
Pro
ject
s
HUB Participation Capital Projects > $500,000
Total Projects Completed
Projects with 12% HUBParticipation
80% GOAL
100%
50% 100%
100%
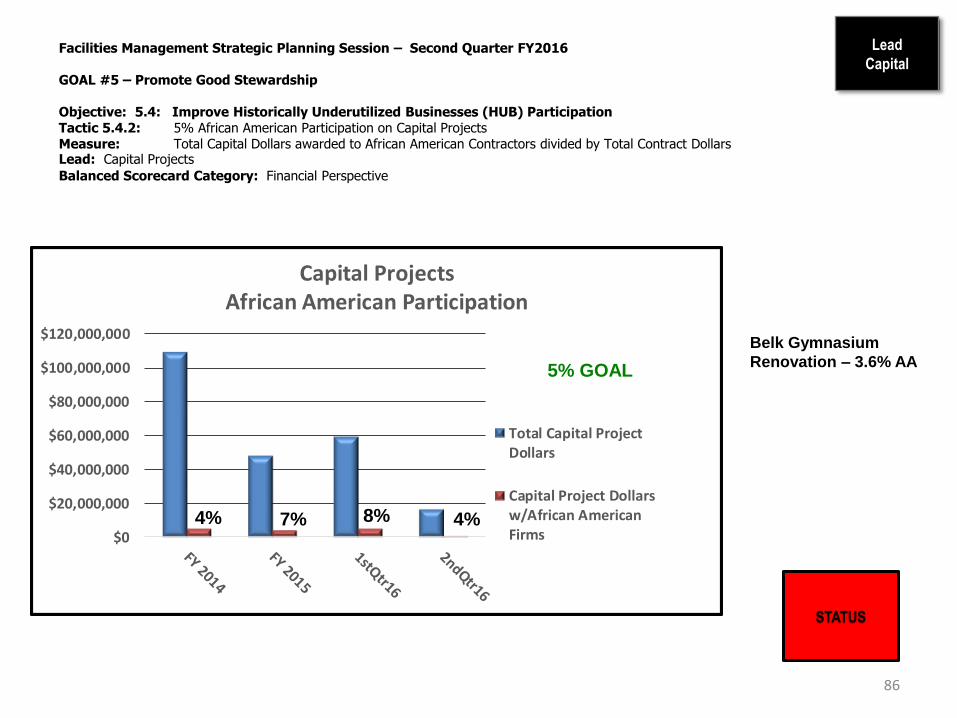
Facilities Management Strategic Planning Session – Second Quarter FY2016 GOAL #5 – Promote Good Stewardship Objective: 5.4: Improve Historically Underutilized Businesses (HUB) Participation Tactic 5.4.2: 5% African American Participation on Capital Projects Measure: Total Capital Dollars awarded to African American Contractors divided by Total Contract Dollars Lead: Capital Projects
Balanced Scorecard Category: Financial Perspective
Lead
Capital
86
STATUS
Belk Gymnasium
Renovation – 3.6% AA
$0
$20,000,000
$40,000,000
$60,000,000
$80,000,000
$100,000,000
$120,000,000
Capital Projects African American Participation
Total Capital ProjectDollars
Capital Project Dollarsw/African AmericanFirms
5% GOAL
4% 7% 8% 4%

Facilities Management Strategic Planning Session – Second Quarter FY2016 GOAL #5 – Promote Good Stewardship Objective: 5.4: Improve Historically Underutilized Businesses (HUB) Participation Tactic 5.4.3: 15% overall HUB participation on Informal contracts $30,000 and above Measure: Total Informal Contract Dollars awarded to HUB Contractors divided by Total Contract Dollars Lead: Capital Projects Balanced Scorecard Category: Financial Perspective
Lead
Capital
87
STATUS
$0
$1,000,000
$2,000,000
$3,000,000
$4,000,000
$5,000,000
$6,000,000
HUB Participation Informal Projects > $30,000
Total Informal ProjectDollars
Informal ProjectDollars w/HUB Firms
39%
52%
100% 96%
15% GOAL

GOAL #5 – Promote Good Stewardship Objective: 5.4: Improve Historically Underutilized Business (HUB) Participation Lead: Design Services Balanced Scorecard Category: Internal Business Process
88
Tactic 5.4.4: 13% overall HUB participation on informal projects below $30,000 including 3% African American Measure: Total Percentage of HUB participation on all Informal Projects below $30,000 (Construction only) divided by Total Contracts Tactic 5.4.5: 3% African American participation on Informal projects below $30,000 Measure: Total African American contract dollars (Construction only) divided by Total Contract Dollars
Design Services’ HUB participation improvement is currently focused on expanding our outreach to new African American contractors & vendors.
All Coordinators are encouraged to reach out to new vendors for work on our Under $30K projects
ACTION PLANS FOR IMPROVEMENT
ONGOING IMPROVEMENTS
NEW IMPROVEMENTS
Design Team continue to review and discuss HUB contractors and vendors at our Design Services weekly meetings.
Design Services and Facilities Information Systems are working to improve HUB reporting of contractors & vendors via ARCHIBUS Strategic Quarterly Reports.
Lead -
Design
Services
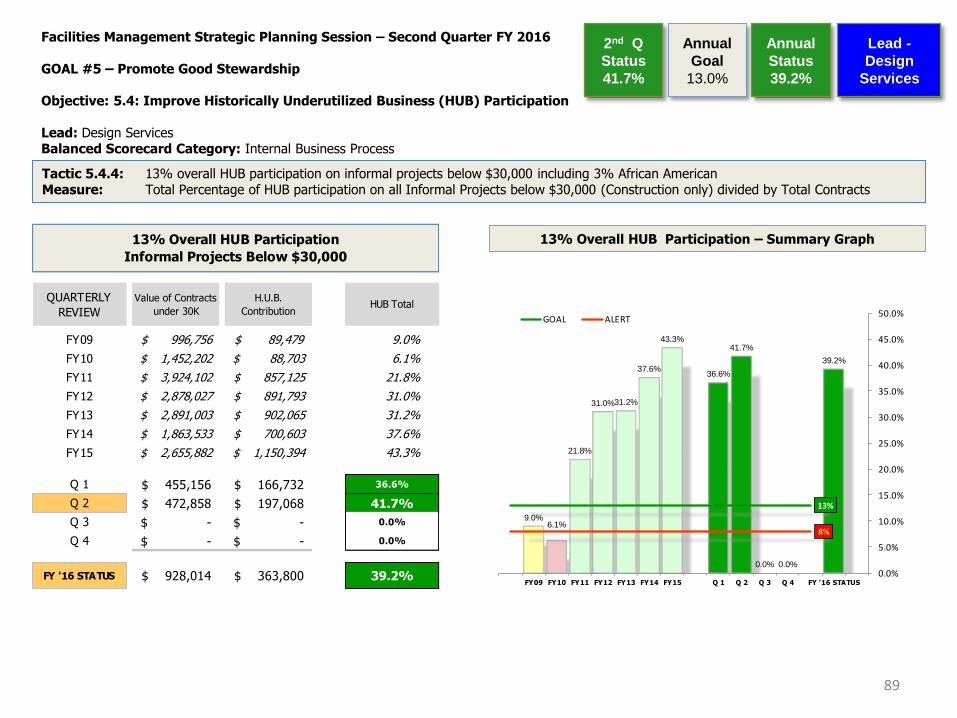
9.0%6.1%
21.8%
31.0%31.2%
37.6%
43.3%
36.6%
41.7%
0.0% 0.0%
39.2%
13%
8%
0.0%
5.0%
10.0%
15.0%
20.0%
25.0%
30.0%
35.0%
40.0%
45.0%
50.0%
FY09 FY10 FY11 FY12 FY13 FY14 FY15 Q 1 Q 2 Q 3 Q 4 FY '16 STATUS
GOAL ALERT
QUARTERLY
REVIEW
Value of Contracts
under 30K
H.U.B.
ContributionHUB Total
FY09 $ 996,756 $ 89,479 9.0%
FY10 1,452,202$ 88,703$ 6.1%
FY11 3,924,102$ 857,125$ 21.8%
FY12 2,878,027$ 891,793$ 31.0%
FY13 2,891,003$ 902,065$ 31.2%
FY14 1,863,533$ 700,603$ 37.6%
FY15 2,655,882$ 1,150,394$ 43.3%
Q 1 455,156$ 166,732$ 36.6%
Q 2 472,858$ 197,068$ 41.7%
Q 3 -$ -$ 0.0%
Q 4 -$ -$ 0.0%
FY '16 STATUS 928,014$ 363,800$ 39.2%
13% Overall HUB Participation
Informal Projects Below $30,000
Facilities Management Strategic Planning Session – Second Quarter FY 2016 GOAL #5 – Promote Good Stewardship Objective: 5.4: Improve Historically Underutilized Business (HUB) Participation Lead: Design Services Balanced Scorecard Category: Internal Business Process
89
Tactic 5.4.4: 13% overall HUB participation on informal projects below $30,000 including 3% African American Measure: Total Percentage of HUB participation on all Informal Projects below $30,000 (Construction only) divided by Total Contracts
Lead -
Design
Services
13% Overall HUB Participation – Summary Graph
Annual
Goal
13.0%
Annual
Status
39.2%
2nd Q
Status
41.7%
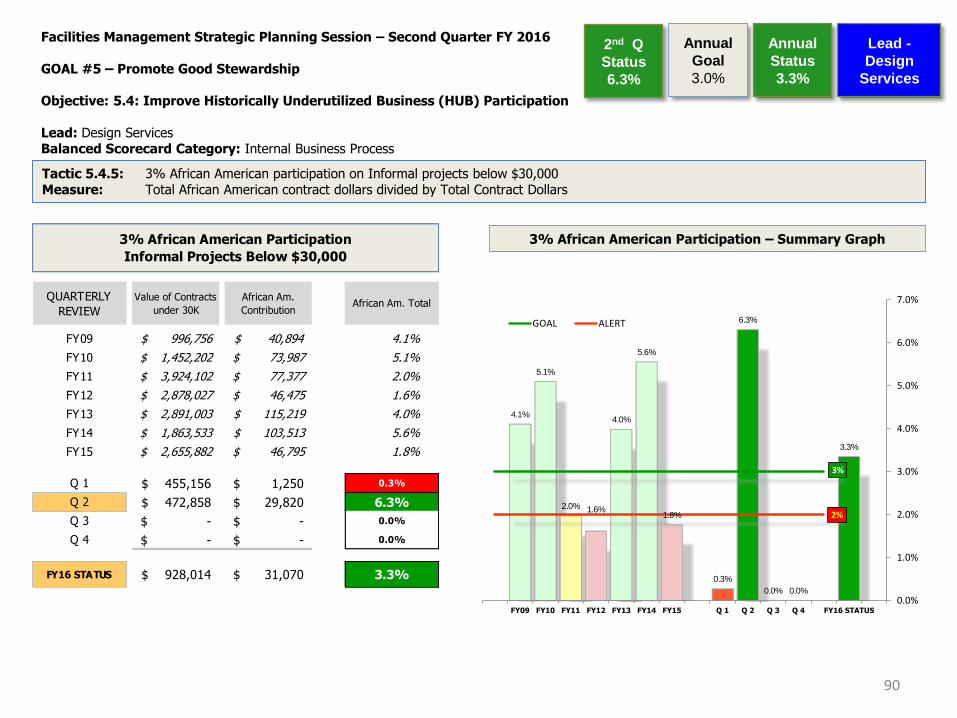
Facilities Management Strategic Planning Session – Second Quarter FY 2016 GOAL #5 – Promote Good Stewardship Objective: 5.4: Improve Historically Underutilized Business (HUB) Participation Lead: Design Services Balanced Scorecard Category: Internal Business Process
90
Lead -
Design
Services
3% African American Participation – Summary Graph
Tactic 5.4.5: 3% African American participation on Informal projects below $30,000 Measure: Total African American contract dollars divided by Total Contract Dollars
QUARTERLY
REVIEW
Value of Contracts
under 30K
African Am.
ContributionAfrican Am. Total
FY09 $ 996,756 $ 40,894 4.1%
FY10 1,452,202$ 73,987$ 5.1%
FY11 3,924,102$ 77,377$ 2.0%
FY12 2,878,027$ 46,475$ 1.6%
FY13 2,891,003$ 115,219$ 4.0%
FY14 1,863,533$ 103,513$ 5.6%
FY15 2,655,882$ 46,795$ 1.8%
Q 1 455,156$ 1,250$ 0.3%
Q 2 472,858$ 29,820$ 6.3%
Q 3 -$ -$ 0.0%
Q 4 -$ -$ 0.0%
FY16 STATUS 928,014$ 31,070$ 3.3%
3% African American Participation
Informal Projects Below $30,000
Annual
Goal
3.0%
Annual
Status
3.3%
2nd Q
Status
6.3%
4.1%
5.1%
2.0% 1.6%
4.0%
5.6%
1.8%
0.3%
6.3%
0.0% 0.0%
3.3%
3%
2%
0.0%
1.0%
2.0%
3.0%
4.0%
5.0%
6.0%
7.0%
FY09 FY10 FY11 FY12 FY13 FY14 FY15 Q 1 Q 2 Q 3 Q 4 FY16 STATUS
GOAL ALERT