Issues in Nonmarket Accounting: Pollution Accounting in Theory and Practice

U.S. Department of the InteriorU.S. Geological Survey
Open File Report 2016–1178
Prepared in cooperation with the Bureau of Land Management’s Socioeconomics Program and National Operations Center
Facilitating the Inclusion of Nonmarket Values in Bureau of Land Management Planning and Project Assessments—Final Report

Facilitating the Inclusion of Nonmarket Values in Bureau of Land Management Planning and Project Assessments— Final Report
By Chris Huber and Leslie Richardson
Prepared in cooperation with the Bureau of Land Management’s Socioeconomics Program and National Operations Center
Open-File Report 2016-1178
U.S. Department of the InteriorU.S. Geological Survey
U.S. Department of the InteriorSALLY JEWELL, Secretary
U.S. Geological SurveySuzette M. Kimball, Director
U.S. Geological Survey, Reston, Virginia: 2016
For more information on the USGS—the Federal source for science about the Earth, its natural and living resources, natural hazards, and the environment—visit http://www.usgs.gov or call 1–888–ASK–USGS.
For an overview of USGS information products, including maps, imagery, and publications, visit http://store.usgs.gov/.
Any use of trade, firm, or product names is for descriptive purposes only and does not imply endorsement by the U.S. Government.
Although this information product, for the most part, is in the public domain, it also may contain copyrighted materials as noted in the text. Permission to reproduce copyrighted items must be secured from the copyright owner.
Suggested citation: Huber, Chris, and Richardson, Leslie, 2016, Facilitating the inclusion of nonmarket values in Bureau of Land Manage-ment planning and project assessments—Final report: U.S. Geological Survey Open-File Report 2016-1178, 79 p., http://dx.doi.org/10.3133/ofr20161178.
ISSN 2331-1258 (online)

iii
Acknowledgments
The authors would like to thank Josh Sidon with the Bureau of Land Management’s (BLM’s) National Operations Center, and Rebecca Moore and Rob Winthrop with the BLM’s Socioeco-nomics Program for their input and contributions to this report. The authors also acknowledge the support of John Loomis at Colorado State University and Randy Rosenberger at Oregon State University. Special thanks are given to the BLM field staff at each of the four pilot sites, including Marietta Eaton, Dave Kiel, Brad Higdon, and Zack Pratt, for their willingness to volun-tarily engage in this study, and for their thoughtful and constructive comments on the practical application of nonmarket valuation. The authors would also like to acknowledge Kawa Ng with the U.S. Forest Service and Brian Quay with the U.S. Geological Survey for their constructive reviews of the paper.
Contents
Acknowledgments ........................................................................................................................................iiiExecutive Summary .......................................................................................................................................1Objective..........................................................................................................................................................1Methods...........................................................................................................................................................2
Pilot Site Identification .........................................................................................................................2Initial Document Describing Nonmarket Values Associated With Each Pilot Site ....................3Web-Based Presentation and Meeting ............................................................................................3In-Person Meeting ................................................................................................................................6Projects...................................................................................................................................................7
Canyons of the Ancients National Monument ........................................................................7Red Cliffs and Beaver Dam Wash National Conservation Areas ........................................8Taos Field Office ...........................................................................................................................8Tuscarora Field Office .................................................................................................................8
Benefit Transfer Toolkit ........................................................................................................................8Nonmarket Valuation Reference for Field Staff .............................................................................16
Limitations of the Four Pilot Site Projects ................................................................................................16Lessons Learned and Future Research ...................................................................................................21A Unique Example of a Primary Study Conducted for BLM ..................................................................23Conclusions...................................................................................................................................................23References Cited..........................................................................................................................................24Appendix 1. Correspondence Used in Pilot Site Selection—Example From the Red Cliffs
and Beaver Dam Wash National Conservation Areas .............................................................28Appendix 2. Review of Nonmarket Valuation Studies Focused on Cultural, Archaeological,
and Historic Sites ...........................................................................................................................29Appendix 3. Nonmarket Values Associated With Each Pilot Site .......................................................32Appendix 4. Example of Presentation Used for the Web-Based Presentation and Meeting.........47Appendix 5. Example of Presentation Used for the In-Person Meeting ............................................52Appendix 6. Nonmarket Valuation Reference ........................................................................................65
iv
Figures
1. Screen shot of the Benefit Transfer Toolkit homepage ........................................................10 2. Screen shot of the “Full Dataset” tab for hunting in the Benefit Transfer Toolkit ...........11 3. Screen shot of the “Individual Studies” tab for hunting in the Benefit Transfer
Toolkit ............................................................................................................................................12 4. Screen shot of the “Average Values” tab for hunting in the Benefit Transfer T
oolkit ..............................................................................................................................................13 6-1. Diagram showing the components of total economic value ...............................................66 6-2. Timeline showing issuance dates of guidance on nonmarket valuation used for
Bureau of Land Management planning (BLM, Bureau of Land Management; IM, Instruction Memorandum) ........................................................................................................67
6-3. Illustration of an example contingent valuation question with a payment card format (BLM, Bureau of Land Management) .........................................................................69
6-4. Diagram showing benefit transfer approaches. Source: Adapted from Rosenberger and Loomis (2001) .......................................................................................................................70
6-5. Map of regions used for average values ................................................................................74 6-6. Illustration showing an example of a meta-regression function transfer for hunting ....75
Tables 1. Table used to facilitate discussion of resources, resource uses, and nonmarket
values associated with the pilot sites .......................................................................................4 2. Summary of pilot site information ..............................................................................................5 3. Number of studies and observations included in the Benefit Transfer Toolkit ..................9 4. Explanatory variables tested in meta-regression models ...................................................14 5. Meta-regression function for hunting .....................................................................................17 6. Meta-regression function for wildlife viewing ......................................................................18 7. Meta-regression function for fishing ......................................................................................19 8. Meta-regression function for trail use ....................................................................................20 3-1. Identifying resources with nonmarket values at the Canyons of the Ancients
National Monument ....................................................................................................................34 3-2. Identifying resources with nonmarket values at the Red Cliffs National
Conservation Area ......................................................................................................................36 3-3. Identifying resources with nonmarket values at the Beaver Dam Wash National
Conservation Area ......................................................................................................................39 3-4. Identifying resources with nonmarket values at the Taos Field Office .............................41 3-5. Identifying resources with nonmarket values at the Tuscarora Field Office ....................44 3-6. Wild horse herd sizes in Herd Management Areas managed by the Tuscarora
Field Office ...................................................................................................................................45 6-1. Average benefits per person per visit and total annual benefits for select Bureau
of Land Management recreational sites .................................................................................69 6-2. Descriptive statistics on per person per day use values for recreational activities ......71 6-3. Descriptive statistics on per person/per household values for the preservation of
threatened, endangered, and rare species ............................................................................72 6-4. Descriptive statistics on per person per day use values for recreational activities
by region .......................................................................................................................................74 6-5. Components of total economic value held for resources and uses provided by
Bureau of Land Management-managed lands ......................................................................77
Facilitating the Inclusion of Nonmarket Values in Bureau of Land Management Planning and Project Assessments—Final ReportBy Chris Huber1 and Leslie Richardson2
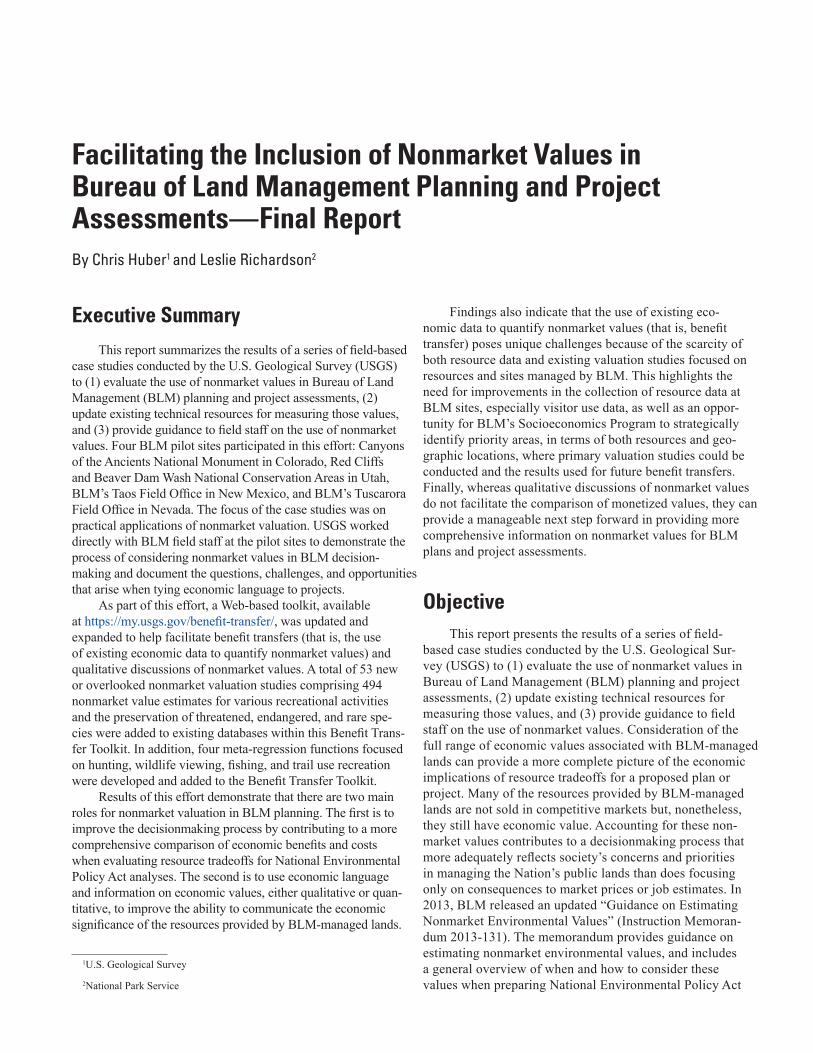
Executive SummaryThis report summarizes the results of a series of field-based
case studies conducted by the U.S. Geological Survey (USGS) to (1) evaluate the use of nonmarket values in Bureau of Land Management (BLM) planning and project assessments, (2) update existing technical resources for measuring those values, and (3) provide guidance to field staff on the use of nonmarket values. Four BLM pilot sites participated in this effort: Canyons of the Ancients National Monument in Colorado, Red Cliffs and Beaver Dam Wash National Conservation Areas in Utah, BLM’s Taos Field Office in New Mexico, and BLM’s Tuscarora Field Office in Nevada. The focus of the case studies was on practical applications of nonmarket valuation. USGS worked directly with BLM field staff at the pilot sites to demonstrate the process of considering nonmarket values in BLM decision-making and document the questions, challenges, and opportunities that arise when tying economic language to projects.
As part of this effort, a Web-based toolkit, available at https://my.usgs.gov/benefit-transfer/, was updated and expanded to help facilitate benefit transfers (that is, the use of existing economic data to quantify nonmarket values) and qualitative discussions of nonmarket values. A total of 53 new or overlooked nonmarket valuation studies comprising 494 nonmarket value estimates for various recreational activities and the preservation of threatened, endangered, and rare spe-cies were added to existing databases within this Benefit Trans-fer Toolkit. In addition, four meta-regression functions focused on hunting, wildlife viewing, fishing, and trail use recreation were developed and added to the Benefit Transfer Toolkit.
Results of this effort demonstrate that there are two main roles for nonmarket valuation in BLM planning. The first is to improve the decisionmaking process by contributing to a more comprehensive comparison of economic benefits and costs when evaluating resource tradeoffs for National Environmental Policy Act analyses. The second is to use economic language and information on economic values, either qualitative or quan-titative, to improve the ability to communicate the economic significance of the resources provided by BLM-managed lands.
1U.S. Geological Survey
2National Park Service
Findings also indicate that the use of existing eco-nomic data to quantify nonmarket values (that is, benefit transfer) poses unique challenges because of the scarcity of both resource data and existing valuation studies focused on resources and sites managed by BLM. This highlights the need for improvements in the collection of resource data at BLM sites, especially visitor use data, as well as an oppor-tunity for BLM’s Socioeconomics Program to strategically identify priority areas, in terms of both resources and geo-graphic locations, where primary valuation studies could be conducted and the results used for future benefit transfers. Finally, whereas qualitative discussions of nonmarket values do not facilitate the comparison of monetized values, they can provide a manageable next step forward in providing more comprehensive information on nonmarket values for BLM plans and project assessments.
ObjectiveThis report presents the results of a series of field-
based case studies conducted by the U.S. Geological Sur-vey (USGS) to (1) evaluate the use of nonmarket values in Bureau of Land Management (BLM) planning and project assessments, (2) update existing technical resources for measuring those values, and (3) provide guidance to field staff on the use of nonmarket values. Consideration of the full range of economic values associated with BLM-managed lands can provide a more complete picture of the economic implications of resource tradeoffs for a proposed plan or project. Many of the resources provided by BLM-managed lands are not sold in competitive markets but, nonetheless, they still have economic value. Accounting for these non-market values contributes to a decisionmaking process that more adequately reflects society’s concerns and priorities in managing the Nation’s public lands than does focusing only on consequences to market prices or job estimates. In 2013, BLM released an updated “Guidance on Estimating Nonmarket Environmental Values” (Instruction Memoran-dum 2013-131). The memorandum provides guidance on estimating nonmarket environmental values, and includes a general overview of when and how to consider these values when preparing National Environmental Policy Act

2 Inclusion of Nonmarket Values in BLM Planning and Project Assessments, Final Report
(NEPA) analyses for resource management planning and other decisionmaking (Bureau of Land Management, 2013a). However, methods of nonmarket valuation are complex, and BLM has very little practical field experience using this type of information. To support the guidance, BLM collaborated with the USGS to evaluate the use of nonmarket values in BLM planning and project assessments, focusing on practical applications of framing this information for decisionmaking. Five specific objectives were identified for this effort:
• Target three to five BLM field offices to be used as pilot sites to demonstrate the incorporation of non-market values in resource management plans (RMPs), project environmental impact statements, and/or proj-ect environmental assessments;
• Conduct a literature review to determine available literature quantifying nonmarket values for resources provided by BLM-managed lands;
• Work directly with field staff at each pilot site to dem-onstrate the process of considering nonmarket values in BLM decisionmaking and document the questions, challenges, and opportunities that arise when tying economic language to issues that the field offices were working through;
• Update and expand a Web-based toolkit based on secondary data of nonmarket values to facilitate the use of benefit transfer methods (that is, using existing economic data to quantify nonmarket values) in BLM planning and project assessments; and
• Document the results for BLM field staff.
Although this effort focused on pilot sites, the general framework and lessons learned are applicable for all BLM offices and programs. This report describes the methods used in this study, as well as lessons learned and suggested areas for future research.
MethodsThe approach to applying nonmarket values in BLM
decisionmaking is outlined in this Methods section. First, BLM field offices willing to participate in this study were identified. After conducting a review of the relevant non-market valuation literature, USGS worked directly with field staff at each pilot site to demonstrate the process of considering nonmarket values in BLM decisionmaking. Next, USGS updated and expanded a Web-based nonmar-ket valuation toolkit using existing data and studies to support the use of benefit transfer methods in BLM plan-ning and project assessments. Lastly, USGS documented questions, challenges, and opportunities that arose when tying economic language to issues facing the participating field offices.
Pilot Site Identification
This project began with the identification of four BLM offices to serve as participating pilot sites in this effort. Vari-ous criteria for targeting specific sites were considered. For example, personnel working in BLM’s National Conservation Lands program had expressed interest in methods for quantify-ing nonmarket values on their units, so one goal was to target a unit within that system. In addition, targeting a site that had participated in BLM’s pilot test of the Forest Service National Visitor Use Monitoring (NVUM) Program was seen as a ben-eficial way to include a pilot site that would potentially have comprehensive visitor use data. Other considerations included identifying BLM offices that regularly evaluate resource tradeoffs, such as motorized recreation compared to nonmotor-ized recreation, and recreational uses compared to extractive uses, such as oil and gas development. The process of identi-fying the pilot sites involved contacting possible participants by email and telephone. Sometimes written materials were mailed to possible participants. The written materials included a description of the goals of the project, an explanation of how it could benefit the participating office, and the anticipated time commitment. The written correspondence that was used in the pilot site selection process for the Red Cliffs and Beaver Dam Wash National Conservation Areas (NCAs) is provided in appendix 1.
Four pilot sites were selected for participation in the study: 1. Canyons of the Ancients National Monument—
Established under Presidential Proclamation 7317, Can-yons of the Ancients National Monument encompasses 170,965 acres of BLM-managed lands in the Four Corners region of southwestern Colorado. Canyons of the Ancients National Monument is part of the National Conservation Lands program and BLM manages the area to protect the cultural and natural assets at the land-scape level. Before this site was selected as a pilot site, a review of existing nonmarket valuation studies focus-ing on archaeological, cultural, and historical sites was conducted to determine the feasibility of using benefit transfer methods at this site. A summary of these studies is provided in appendix 2.
2. Red Cliffs and Beaver Dam Wash NCAs—Located in southwestern Utah within the administrative boundary of BLM’s St. George Field Office, both NCAs were established primarily to protect habitat for the threat-ened Mojave Desert tortoise (Gopherus agassizii). Both NCAs contain a unique geologic history and provide a wide range of recreational opportunities for the public.
3. Taos Field Office—BLM’s Taos Field Office manages a wide range of resources, uses, and land designations, and spans across approximately 15.5 million acres of mixed ownership in northern New Mexico. Within the Taos Field Office administrative boundary is the 242,455-acre Rio Grande Del Norte National Monument

Methods 3
that was established by Presidential proclamation under the authority granted by the Antiquities Act of 1906. In 2006 and 2009, BLM piloted a survey to collect more robust recreation data using the NVUM framework. Taos was one of six BLM offices selected for that pilot study (Bureau of Land Management, 2009b).
4. Tuscarora Field Office—BLM’s Tuscarora Field Office manages approximately 3.1 million acres of land in northeastern Nevada. This field office exemplifies multiple-use management, and contains wilderness study areas, herd management areas, cultural and archaeologi-cal resources, wildlife habitat, recreational opportunities, gold mining, and livestock grazing.
Initial Document Describing Nonmarket Values Associated With Each Pilot Site
Once the participating pilot sites were identified, a point of contact for each site was confirmed. This individual served as the main coordinator between USGS economists and BLM field staff at each site. The point of contact provided vari-ous documents, such as recent RMPs, scoping reports, fact sheets, and NEPA planning documents, to familiarize USGS with the resource uses, environmental and ecosystem services, and planning issues specific to the site. After reviewing these documents, the major resources and resource uses specific to each site were summarized in a table that served as a start-ing point for discussions with field staff on the connection between the resource or resource use and nonmarket economic values. An example of the table developed for the Taos Field Office is provided in table 1. Next, USGS economists tied each resource or resource use to the component of total eco-nomic value likely derived from the resource or resource use (that is, either use values or passive use values). The purpose of this step was to introduce field staff to the terminology associated with nonmarket valuation. In other words, instead of talking generally about the existence of nonmarket values, this information helped to facilitate a more detailed discus-sion about why these values exist. For example, in the case of recreational hunting, people derive an economic value from the direct use of the wildlife resource (that is, a use value) but, in the case of threatened and endangered species, people may derive an economic value simply from the preservation of these species (that is, a passive use value).
Next, a “Magnitude of value” column was added to the table to highlight the scale, or relative importance, of each resource or resource use with an associated nonmarket value. It was anticipated that this information would be used to start a dialogue with field staff regarding what they perceived as being important resources on their land unit with respect to nonmarket values. Finally, a “Risk/vulnerability/sensitivity” column was added to the table, which would be used later in discussions of how each resource or resource use and its associated nonmarket value might be expected to change in response to actions taken under a specific plan or project.
A major component of this overall effort was to educate field staff about the concept of nonmarket economic values. Many field offices do not currently include this type of infor-mation in economic analyses associated with plans or projects and may be unfamiliar with the general concept of nonmarket valuation. However, it is likely that BLM planners and manag-ers will be encouraged to develop more information about these values because of recent guidance such as BLM’s 2013 instruction memorandum on nonmarket valuation and a Presi-dential memorandum issued in 2015 on incorporating ecosys-tem services into federal decisionmaking (Executive Memo-randum M-16-01—“Incorporating Ecosystem Services Into Federal Decision Making,” available at https://www.white-house.gov/sites/default/files/omb/memoranda/2016/m-16-01.pdf). Even if field staff contract out their socioeconomic analyses, having a basic understanding of nonmarket valua-tion could help facilitate discussions with economists that they collaborate with, as well as the general public. The types of information shown in table 1 were developed for each site and used to educate field staff about potential nonmarket values specific to their land unit, engage resource specialists, facili-tate questions, and identify points of clarification. In addition, the information helped the team of USGS economists and BLM field staff identify the types of data needed to monetize nonmarket values associated with changes to various resources and resource uses.
The information also provided the foundation for a draft document developed for each pilot site that included (1) a summary of the motivations and objectives for the consid-eration of nonmarket values in BLM planning and project assessments, (2) the specific goals of the case studies, (3) an explanation of nonmarket valuation, and (4) a qualitative description of nonmarket values associated with the resources and resource uses at each site. The document served as a starting point to tie the resource uses and issues at each pilot site to economic concepts and terms that are regularly used in nonmarket valuation literature. The point of contact at each pilot site reviewed the draft document and sent it to a relevant group of resource specialists for input, mainly clarifications of the major resource issues at the sites. These documents are provided in appendix 3.
Web-Based Presentation and Meeting
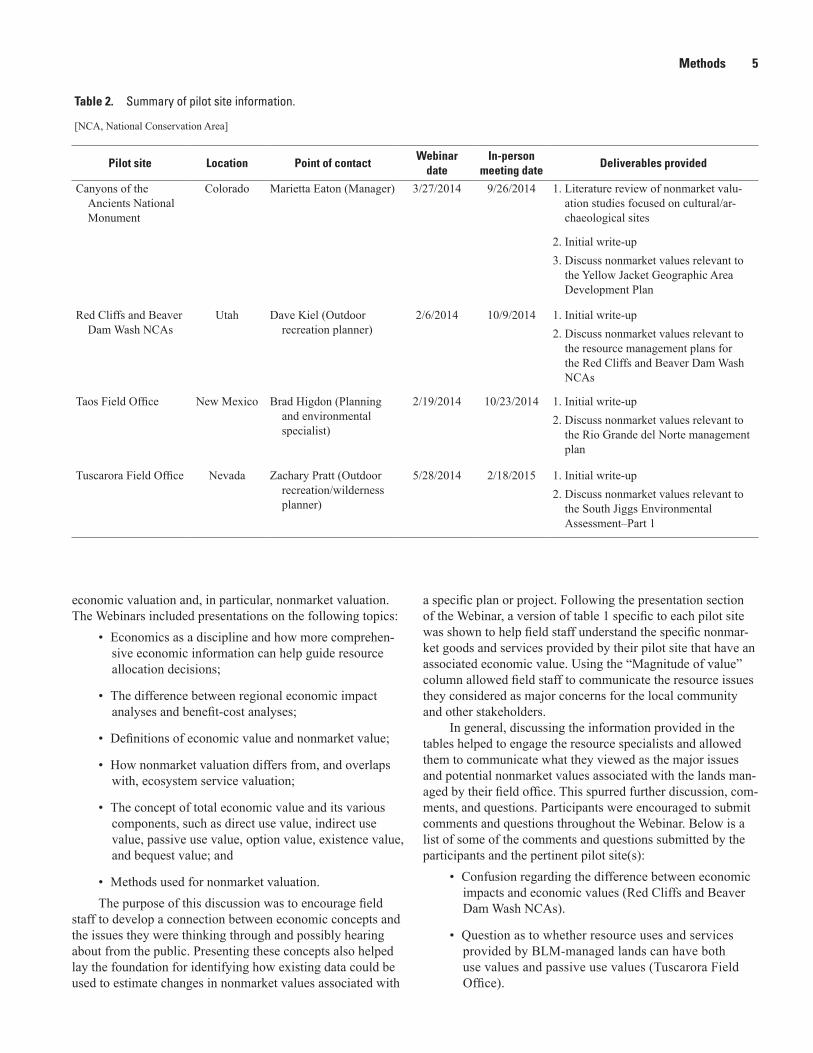
After receiving feedback on the written document, USGS worked with the point of contact at each pilot site to schedule a Web-based presentation and meeting. The point of contact was asked to encourage participation by as many avail-able resource specialists from their office as possible. These Webinars took place between February 2014 and May 2014. Table 2 summarizes the location, point of contact, and Webi-nar date for each pilot site. The table also provides the dates of subsequent in-person meetings and a list of the deliverables provided to each pilot site.
One major purpose of the Webinars was to familiar-ize field staff with various concepts and terms relevant to

4 Inclusion of Nonmarket Values in BLM Planning and Project Assessments, Final Report
Table 1. Table used to facilitate discussion of resources, resource uses, and nonmarket values associated with the pilot sites.
[This example is the version developed for the Taos Field Office. WSA, wilderness study area; BLM, Bureau of Land Management]
Taos Field Office
Importance in project(s)
Resources and uses1 Use valuesPassive use
valuesMagnitude of
value2
Risk/ vulnerability/
sensitivity3
Threatened, endangered, and rare species–Southwestern willow flycatcher, bald eagle, ferruginous hawks, Gunnison prairie dog, Santa Fe cholla, gramma-grass cactus, cutthroat trout, golden eagle, peregrine falcon, raptor species and their nesting sites
● High
Biomass utilization–Collection of special forest products and fuel- wood collection ● Low
Wildlife–Bighorn sheep, pronghorn antelope, mule deer, elk, moun-tain lion, bobcat, river otters, black bear, coyote, grey fox, beaver, muskrat, rabbits, collard lizard, bullfrog, rattlesnake, bats, hum-mingbirds, sandhill crane, heron, and 133 species of birds
● Moderate
Wilderness and wilderness study areas–Sabinoso Wilderness (16,030 acres), San Antonio WSA (7,371 acres), and Rio Chama WSA (11,128 acres)
● High
Special Designations and protected areas–Rio Grande Del Norte Na-tional Monument, Rio Chama (32 miles), Red River (4 miles), Rio Grande (68 miles), and a Rio Grande study segment (7 miles)
● High
Historic trails–El Camino Real de Tierra Adentro National Historic Trail (41 miles), Old Spanish National Historic Trail ● Low
Recreation–Boating, sightseeing, camping, biking, swimming, horse-back riding, interpretation, fishing, picnicking, wildlife viewing, whitewater rafting and kayaking
● High
Archaeological–Historic sites in the Galisteo Basin, Native American rock art, Spanish colonial settlements, Ward Ranch, La Cieneguilla Petroglyphs, Posi Pueblo
● Moderate
Paleontological and geological–Rio Grande Rift, Rio Grande Gorge, Taos Plateau volcanic field, fossils ● Low
Education and research–Ecological, wildlife, plants, paleontological, archaeological, geological ● Low to Moderate
1List of resources and uses is not exhaustive and may require input from BLM staff.2Anticipated or expected size of associated nonmarket value (that is, high, moderate, or low).3Likelihood of changes to nonmarket value from management decisions or by changes in the resource; this information will be populated later with the assis-
tance of BLM resource specialists.
Methods 5
economic valuation and, in particular, nonmarket valuation. The Webinars included presentations on the following topics:
• Economics as a discipline and how more comprehen-sive economic information can help guide resource allocation decisions;
• The difference between regional economic impact analyses and benefit-cost analyses;
• Definitions of economic value and nonmarket value;
• How nonmarket valuation differs from, and overlaps with, ecosystem service valuation;
• The concept of total economic value and its various components, such as direct use value, indirect use value, passive use value, option value, existence value, and bequest value; and
• Methods used for nonmarket valuation.The purpose of this discussion was to encourage field
staff to develop a connection between economic concepts and the issues they were thinking through and possibly hearing about from the public. Presenting these concepts also helped lay the foundation for identifying how existing data could be used to estimate changes in nonmarket values associated with
a specific plan or project. Following the presentation section of the Webinar, a version of table 1 specific to each pilot site was shown to help field staff understand the specific nonmar-ket goods and services provided by their pilot site that have an associated economic value. Using the “Magnitude of value” column allowed field staff to communicate the resource issues they considered as major concerns for the local community and other stakeholders.
In general, discussing the information provided in the tables helped to engage the resource specialists and allowed them to communicate what they viewed as the major issues and potential nonmarket values associated with the lands man-aged by their field office. This spurred further discussion, com-ments, and questions. Participants were encouraged to submit comments and questions throughout the Webinar. Below is a list of some of the comments and questions submitted by the participants and the pertinent pilot site(s):
• Confusion regarding the difference between economic impacts and economic values (Red Cliffs and Beaver Dam Wash NCAs).
• Question as to whether resource uses and services provided by BLM-managed lands can have both use values and passive use values (Tuscarora Field Office).
Table 2. Summary of pilot site information.
[NCA, National Conservation Area]
Pilot site Location Point of contactWebinar
dateIn-person
meeting dateDeliverables provided
Canyons of the Ancients National Monument
Colorado Marietta Eaton (Manager) 3/27/2014 9/26/2014 1. Literature review of nonmarket valu-ation studies focused on cultural/ar-chaeological sites
2. Initial write-up3. Discuss nonmarket values relevant to
the Yellow Jacket Geographic Area Development Plan
Red Cliffs and Beaver Dam Wash NCAs
Utah Dave Kiel (Outdoor recreation planner)
2/6/2014 10/9/2014 1. Initial write-up2. Discuss nonmarket values relevant to
the resource management plans for the Red Cliffs and Beaver Dam Wash NCAs
Taos Field Office New Mexico Brad Higdon (Planning and environmental specialist)
2/19/2014 10/23/2014 1. Initial write-up2. Discuss nonmarket values relevant to
the Rio Grande del Norte management plan
Tuscarora Field Office Nevada Zachary Pratt (Outdoor recreation/wilderness planner)
5/28/2014 2/18/2015 1. Initial write-up2. Discuss nonmarket values relevant to
the South Jiggs Environmental Assessment–Part 1
6 Inclusion of Nonmarket Values in BLM Planning and Project Assessments, Final Report
• Confusion as to how something like biomass utiliza-tion, which has a market value, could also have a nonmarket value (Taos Field Office).
• Question about whether habitat stamps purchased by hunters and anglers is a market value that captures the economic value of these activities (Taos Field Office).
• Question about whether donations to nonprofit orga-nizations represent a nonmarket value (Red Cliffs and Beaver Dam Wash NCAs).
• Clarification as to whether nonmarket values are relevant not only to BLM-managed lands, but also to heritage centers that hold collections inside a building (Canyons of the Ancients National Monument).
• Discussion about whether resources such as archaeo-logical and geological resources that have passive use values can also contribute to use values, thereby demonstrating interconnectedness (Red Cliffs and Beaver Dam Wash NCAs and Canyons of the Ancients National Monument).
• Enabling legislation establishing the NCAs aligns with the concept of nonmarket values. The language desig-nating the NCAs preserves resources with nonmarket values but is based upon noneconomic justifications. Therefore, when considering nonmarket values of BLM-managed lands, enabling legislation can provide the foundation to better understand, identify, and connect important resources and resource uses with nonmarket values (Red Cliffs and Beaver Dam Wash NCAs).
The Webinars provided an initial step in familiarizing field staff with concepts, identifying challenges, and starting the process of developing effective terminology for incorpo-rating nonmarket values into planning. Participation in the Webinars varied considerably across the sites; the Taos Field Office had the greatest number with 15 participants and the Tuscarora Field Office had the least with 4 participants. An example of the presentation used in the Webinars is provided in appendix 4.
Following the completion of the Webinars, USGS con-tinued to work with the point of contact at each site to identify a project of interest that would serve as an example of how more comprehensive information on nonmarket values can be incorporated into BLM’s economic analyses. The criteria for selection were relatively informal, but the goal was to iden-tify a project that was current, involved resource tradeoffs, and could be informed by the inclusion of nonmarket values. USGS collaborated with various resource specialists and contractors at each of the pilot sites to develop a discussion of nonmarket values for each identified project. Economic infor-mation was limited to existing data, with the goal of applying benefit transfer methods or qualitative descriptions for non-market valuation. The projects of focus were the Yellow Jacket Geographic Area Development Plan (GADP) (Canyons of the Ancients National Monument), the RMPs for the Red Cliffs
and Beaver Dam Wash NCAs, the management plan for the Rio Grande del Norte National Monument (Taos Field Office), and the environmental assessment for the Part I term permit renewal for the South Jiggs Complex (Tuscarora Field Office).
In-Person Meeting
After USGS began work on the specific projects, an in-person meeting was scheduled with each of the pilot sites. Similar to the Webinar, the point of contact at each site was encouraged to set a time that would result in attendance and participation of the largest number of resource specialists within the field office as possible. The purpose was to reach out to staff with diverse backgrounds and areas of expertise to obtain different perspectives and a range of feedback regard-ing the usefulness of information on nonmarket values. These meetings took place from September 2014 to February 2015 (table 2).
One purpose of this in-person meeting was to expand upon the information that was presented in the Webinar. A more detailed overview of the concept of economic value was presented, along with definitions of consumer surplus and producer surplus, and BLM-specific examples dem-onstrating the difference between economic values and economic impacts. Because economic impacts are regularly included in economic analyses of BLM plans and projects, many field staff are familiar with this economic concept. As BLM moves towards the inclusion of more information on economic values, in addition to economic impacts, it is criti-cal that field staff understand the difference between the two concepts.
An overview of the history of nonmarket valuation in BLM planning was then presented, followed by a discussion of BLM’s Instruction Memorandum 2013-131—“Guidance on Estimating Nonmarket Environmental Values.” Next, a detailed description of nonmarket valuation methods was given, followed by examples specific to BLM. For example, following a discussion of stated preference methods, an example of a contingent valuation study conducted by Loo-mis (2001) and included in BLM’s Pinedale Field Office’s “Final Environmental Impact Statement for the Snake River Resource Management Plan” (Bureau of Land Management, 2003b) was presented. This study, commissioned by BLM in 1999, estimated the nonmarket benefits associated with various recreational activities (commercial rafting, private rafting, and hiking) supported by BLM-managed lands along the Snake River in Jackson Hole, Wyoming, as well as the nonmarket values associated with four management strate-gies being considered in the planning process. Next, follow-ing a discussion of revealed preference methods, two travel cost studies conducted on BLM sites by Loomis (2006) and Loomis and others (2005) were presented. Although examples of primary nonmarket valuation studies specific to BLM-managed lands are limited, discussing the few that could be identified provided a good opportunity to presentpractical applications of nonmarket valuation in BLM
Methods 7
planning and demonstrate how this type of information can help inform decisionmaking.
A discussion of benefit transfer methods for nonmarket valuation was followed by a presentation of a beta version of a Web-based toolkit being developed as part of this effort; the toolkit is discussed in more detail in the “Benefit Transfer Toolkit” section of this report. This discussion and presentation helped to familiarize field staff with the process of using exist-ing data to monetize nonmarket values. In addition, a descrip-tion of qualitative approaches to nonmarket valuation was fol-lowed by examples from specific BLM projects. The presented examples included the “Proposed Taos Resource Management Plan and Final Environmental Impact Statement” (Bureau of Land Management, 2011), the “King Range National Conserva-tion Area Proposed Resource Management Plan and Final Envi-ronmental Impact Statement” (Bureau of Land Management, 2004), and the “West Tavaputs Plateau Natural Gas Full Field Development Plan, Final Environmental Impact Statement” (Bureau of Land Management, 2010b). The presented examples helped demonstrate how information, terminology, and relevant literature on nonmarket values can be included in plans and projects, and possibly used to respond to public comments, even when values are not monetized. The second half of the in-person meeting was spent discussing the previously identified project of interest and talking through the resources and associ-ated economic values that could potentially be impacted by the management actions under consideration. The purpose of this discussion was to gather detailed information about anticipated changes to nonmarket goods and services and the availability of relevant data that could be used to quantify those changes.
In general, the in-person meetings provided the opportu-nity for USGS to coordinate with BLM field staff on terminol-ogy and overall framing of the discussion about nonmarket values associated with BLM-managed lands. An example of the importance of terminology came from an archaeologist at Canyons of the Ancients National Monument who recommended using the phrase “economic benefit” as opposed to “economic value” when discussing nonmarket values held for archaeologi-cal resources, because “economic value” could imply that the resource has monetary worth and could result in an increase in theft of these resources. Field staff were encouraged to be candid regarding any limitations and challenges with the concepts presented. Each of the participants in the meetings were positive about the concept of nonmarket valuation and overall, managers, planners, and other field staff were engaged and provided helpful feedback regarding how the inclusion of information on nonmar-ket values could be useful in their planning and decisionmaking. For example, participants representing the Red Cliffs and Beaver Dam Wash NCAs noted that they found it challenging to explain the economic benefits of the lands they manage to county officials and the public, and they regularly receive comments on the economic section of their planning documents. Given the enabling legislation emphasizing conservation and preservation of natural and cultural resources, BLM staff at these NCAs have relatively fewer competing uses to consider in planning com-pared to other BLM field offices. Field staff pointed out that, by
including more information on nonmarket economic values in their projects, they could better explain, in economic terms, the importance of conserving the lands they manage, and could bet-ter demonstrate national support for threatened and endangered species preservation. Field staff also felt that this type of infor-mation could possibly help them to make decisions regarding tradeoffs between recreational use and preservation of habitat for threatened and endangered species. Field staff at the Tuscarora Field Office pointed out that BLM has a tendency to focus on grazing and energy development benefits only, and information on nonmarket values could help to provide a more balanced perspective in planning. Field staff at Canyons of the Ancients National Monument noted that their projects often highlight the jobs and tax revenue generated from carbon dioxide (CO2) production within the monument. BLM field staff concluded that more information about the nonmarket economic benefits pro-vided by archaeological resources would be a helpful addition to their planning and decisionmaking. Field staff may have already been thinking about the concept of nonmarket values, but were simply using different terminology and noneconomic terms. The meeting at the Tuscarora Field Office had the greatest number of participants, more than 20, while the other 3 meetings each had approximately 10 participants. An example of the presentation used for the in-person meetings is provided in appendix 5.
Projects
Following the completion of the in-person meetings, USGS continued to work with resource specialists at each pilot site to draft a discussion on nonmarket values for their respective project. These discussions were qualitative in nature because of the inability to estimate quantifiable changes to resources. For example, recreation planners were not able to estimate expected changes in the number of recreation days by activity for the action alternatives. This exemplifies the need for continued improvements in the collection of visitor use data for BLM-managed lands. Regardless, qualitative discussions serve the important purpose of defining the effects of manage-ment actions on human well-being using economic terms, and can help in the development of a relative ranking of plan alter-natives based on societal preferences. The following sections provide a summary of the approach taken for each pilot site.
Canyons of the Ancients National Monument
USGS provided input to BLM field staff and BLM’s contractor, Ecosphere Environmental Services, to prepare a discussion on nonmarket values for the draft environmental assessment being prepared for the Yellow Jacket GADP. The purpose of this GADP was to analyze activities associated with the proposed alternative of enhancing CO2 production in the area through a series of infrastructure improvement proj-ects. The report section on nonmarket values focused on those resources that were expected to be impacted under a proposed alternative of the GADP that addressed traditional Native

8 Inclusion of Nonmarket Values in BLM Planning and Project Assessments, Final Report
American uses, cultural and historical resources, big game hunting, noise, and visual resources.
Red Cliffs and Beaver Dam Wash National Conservation Areas
The RMPs for the Red Cliffs and Beaver Dam Wash NCAs served as the planning efforts of interest. A 2012 socio-economic baseline report contained a discussion on nonmarket values relevant to the NCAs (Bureau of Land Management, 2012d). USGS provided input to economists at BLM and the consulting firm Booz Allen Hamilton who evaluated the expected effects of the RMP management alternatives on the identified nonmarket values associated with wildlife habitat and populations; designated wilderness areas; geological, his-torical, and cultural resources; outdoor recreation; and habitat for the threatened Mojave Desert tortoise.
Taos Field OfficeUSGS worked with field staff to develop a comprehensive
qualitative discussion of nonmarket values associated with resources under the No Action alternative in the management plan for Rio Grande Del Norte National Monument. The Rio Grande Del Norte National Monument was designated under Presidential proclamation to preserve the cultural, prehistoric, and historic legacy of the region; and to maintain the diverse array of natural and scientific resources contained in this land-scape for the benefit of all Americans. The potentially affected nonmarket values within the management plan included those associated with outdoor recreation, livestock grazing, and col-lection of noncommercial firewood and pine nuts.
Tuscarora Field OfficeThe environmental assessment of the South Jiggs Com-
plex, Part 1, Term Permit Renewal was selected as the project for this pilot site. The document is an approval plan for renewal of a livestock grazing permit for allotments in a portion of the South Jiggs Complex. The USGS worked with field staff to identify and understand the effects to nonmarket values under the No Action alternative, as well as the action alternatives. Potentially affected nonmarket values included those associated with livestock grazing, outdoor recreation, areas with wilderness characteristics, vegetation communities, and riparian areas.
Benefit Transfer Toolkit
BLM field offices often lack the necessary resources to collect original data for socioeconomic analyses. As a result, one major component of this effort was the development of a Web-based tool that facilitates the use of existing data (that is, benefit transfer methods) to monetize nonmarket values. USGS worked with Dr. John Loomis at Colorado State University, Dr. Randy Rosenberger at Oregon State University, and USGS
Web developers to create the Benefit Transfer Toolkit (Toolkit), which is available at https://my.usgs.gov/benefit-transfer/. The Toolkit builds upon existing nonmarket valuation tools, includ-ing Colorado State University’s Benefit Transfer and Use Esti-mating Model Toolkit (http://dare.agsci.colostate.edu/outreach/tools/) and Oregon State University’s Recreation Use Values Database (http://recvaluation.forestry.oregonstate.edu/).
Based on reviews of planning documents and discussions with the point of contact and resource specialists at each pilot site, USGS identified the major resources provided by BLM-managed lands that have been well studied in the nonmarket valuation literature and for which benefit transfer can be used. The identified resources consisted of a wide range of recre-ational activities, as well as the preservation of threatened, endangered, and rare species. Once these resources were identified, a comprehensive literature review was conducted to identify all relevant studies that had used stated or revealed preference methods to quantify a measure of nonmarket economic value for each resource. Economic value is defined as consumer surplus, or net willingness to pay. The focus was on those studies that were newer (2006 through 2014) or overlooked in previous databases. Studies that were conducted outside of the United States, as well as those that were deemed not methodologically sound, were excluded. For recreational activities, the studies of focus were those that had monetized a “per person per day value,” or a value that could be con-verted to such using information provided in the study. These “per person per day activity” units can be conceptualized as being independent of the number of hours spent pursuing the recreational activity within a single day. In total, 53 studies with 494 individual value estimates were added to the existing databases within the Toolkit. Table 3 documents the number of new and total studies and the number of new and total obser-vations that were added to the Toolkit for each resource.
After the studies were identified, detailed information about each was coded into a Microsoft Excel spreadsheet. For consistency with existing databases, studies were first coded using the same master coding sheet as Oregon State Univer-sity’s Recreation Use Values Database, which consists of more than 70 fields, most of which are numerical, and an associated code sheet. The main categories of fields include the study refer-ence, study location, details about the activity or resource being valued, site characteristics, methodology used, the economic benefit estimate, original units used to report the estimate, and the benefit estimate converted to 2014 dollars using the Con-sumer Price Index. To eliminate the need for users to refer to a detailed code sheet, numerical fields were then narrowed down and recoded with text. The “Full Dataset,” “Individual Studies,” and “Average Values” tabs are provided for each recreation use, and are accessed by clicking on a recreation use located on the Toolkit’s homepage. The “Full Dataset” tabs for recreation uses contain 30 fields, while the “Individual Studies” tab contains a subset of information about each study, including the study reference, resource location, primary species if applicable, and the economic value estimate in 2014 dollars. Similarly, by clicking on the threatened, endangered, and rare species link on
Methods 9
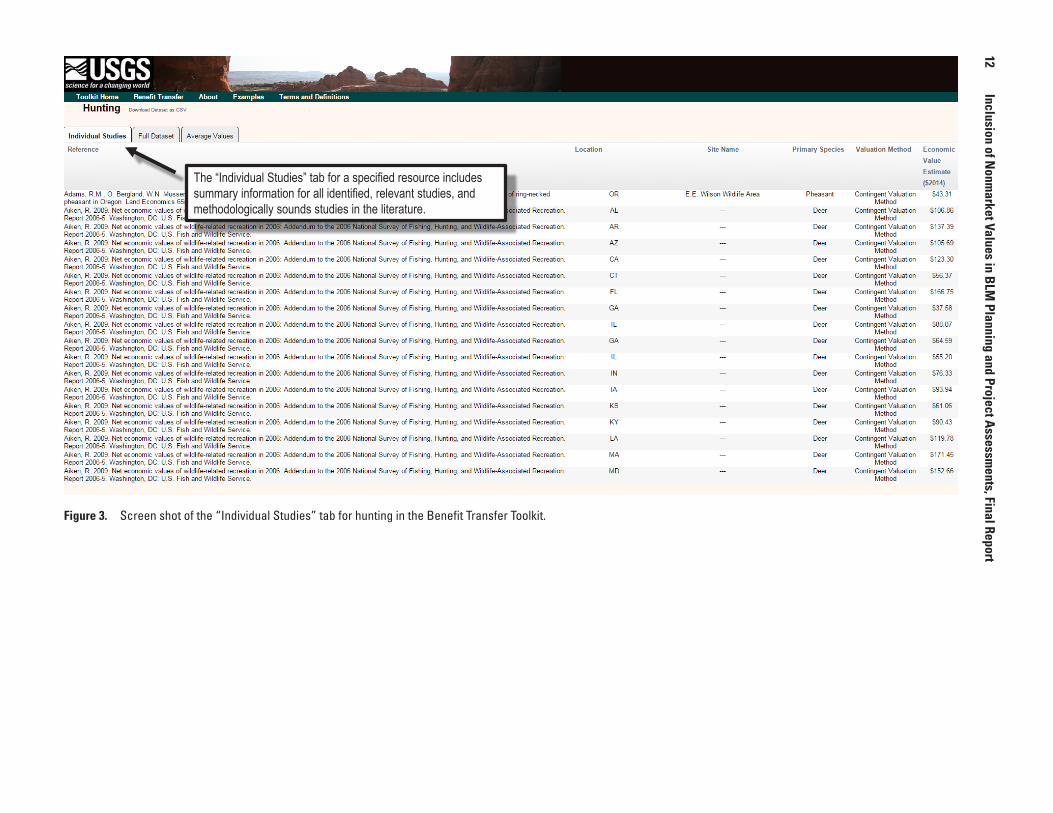
the home page, a “Full Dataset” tab containing 18 fields and an “Individual Studies” tab are provided, which are drawn from Richardson and Loomis (2009). Screen shots of the Toolkit Web site are shown in figures 1–3.
For each recreational activity listed in table 3, the Tool-kit includes an “Average Values” tab that provides an average economic benefit estimate by geographic region and, in some cases, by additional stratification For example, the “Average Values” tab for hunting provides average values by region as well as by hunting type (that is, big game, small game, and waterfowl). Studies that were conducted in multiple regions, or were national in scope, are included in a multiple-areas category in the average values table (fig. 4). The information provided in the “Individual Studies,” “Full Dataset,” and “Average Values” tabs can be used for single-point estimate benefit transfers and average value transfers. Toolkit users have the option to down-load these data as a comma-separated values (CSV) file.
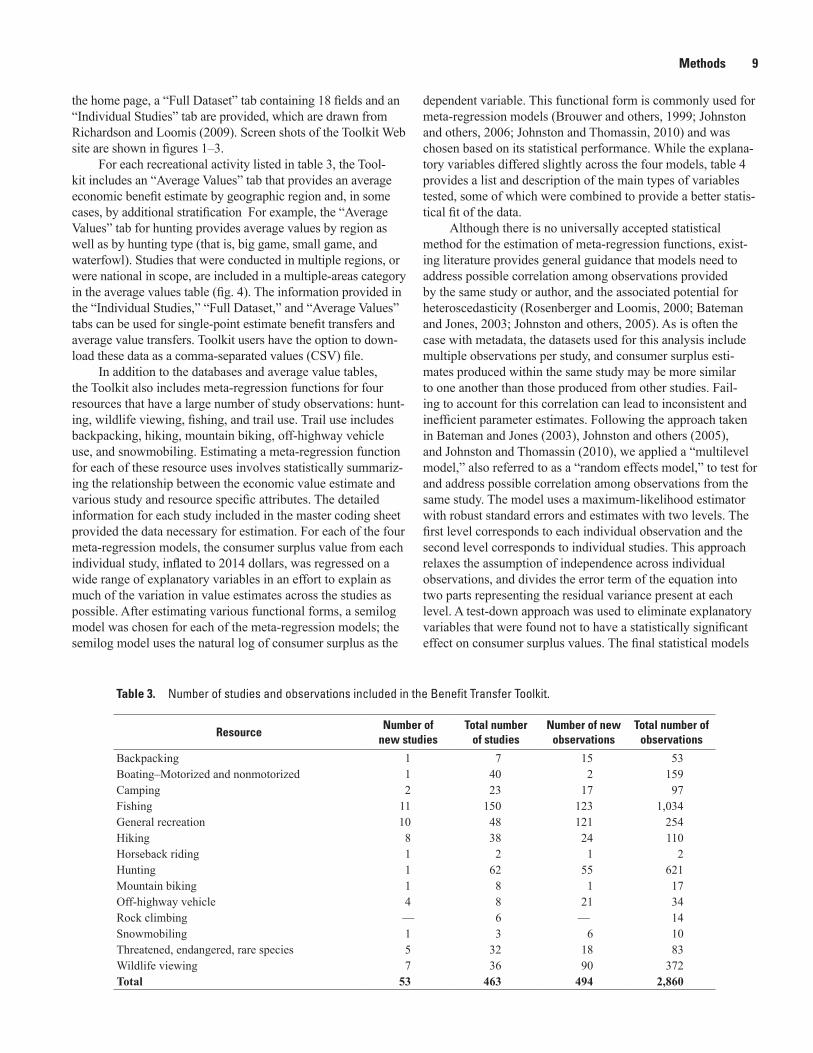
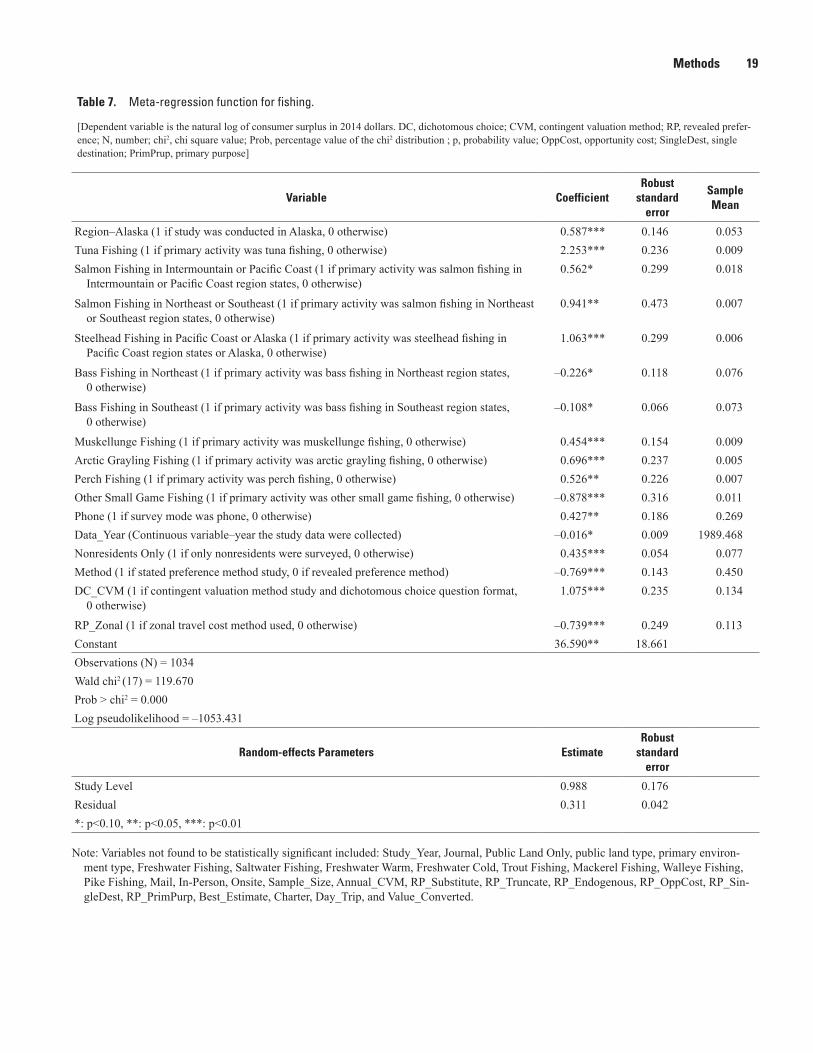
In addition to the databases and average value tables, the Toolkit also includes meta-regression functions for four resources that have a large number of study observations: hunt-ing, wildlife viewing, fishing, and trail use. Trail use includes backpacking, hiking, mountain biking, off-highway vehicle use, and snowmobiling. Estimating a meta-regression function for each of these resource uses involves statistically summariz-ing the relationship between the economic value estimate and various study and resource specific attributes. The detailed information for each study included in the master coding sheet provided the data necessary for estimation. For each of the four meta-regression models, the consumer surplus value from each individual study, inflated to 2014 dollars, was regressed on a wide range of explanatory variables in an effort to explain as much of the variation in value estimates across the studies as possible. After estimating various functional forms, a semilog model was chosen for each of the meta-regression models; the semilog model uses the natural log of consumer surplus as the
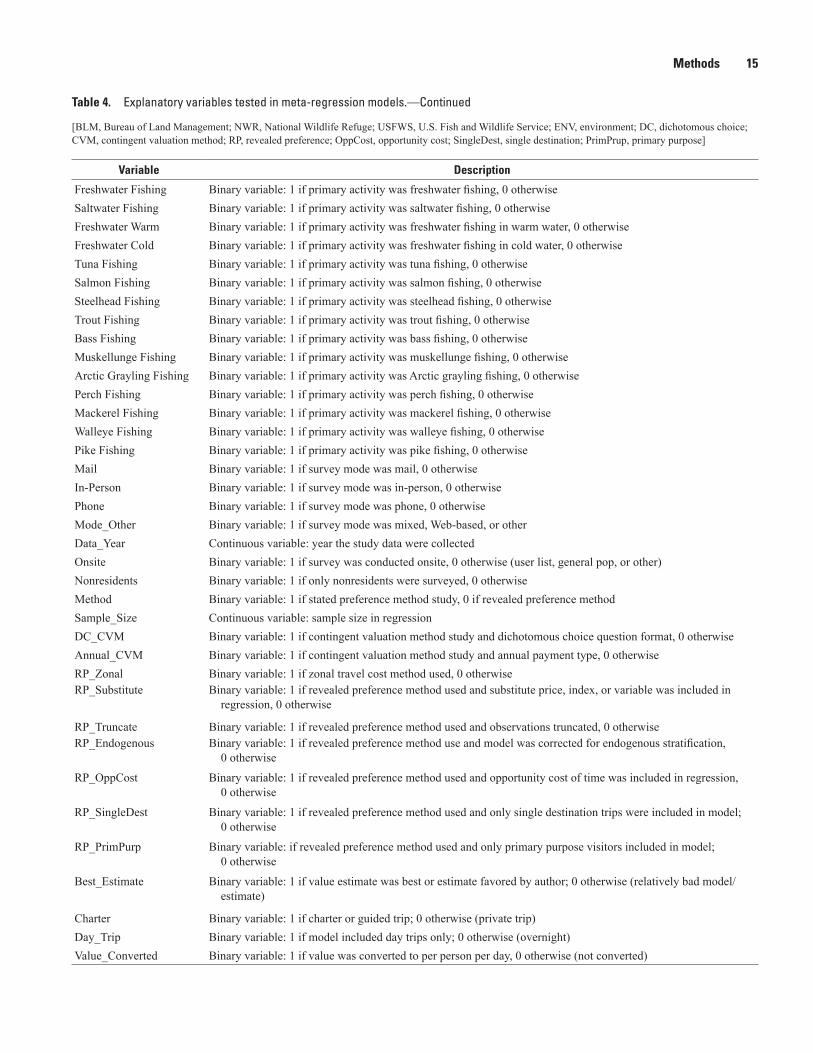
dependent variable. This functional form is commonly used for meta-regression models (Brouwer and others, 1999; Johnston and others, 2006; Johnston and Thomassin, 2010) and was chosen based on its statistical performance. While the explana-tory variables differed slightly across the four models, table 4 provides a list and description of the main types of variables tested, some of which were combined to provide a better statis-tical fit of the data.
Although there is no universally accepted statistical method for the estimation of meta-regression functions, exist-ing literature provides general guidance that models need to address possible correlation among observations provided by the same study or author, and the associated potential for heteroscedasticity (Rosenberger and Loomis, 2000; Bateman and Jones, 2003; Johnston and others, 2005). As is often the case with metadata, the datasets used for this analysis include multiple observations per study, and consumer surplus esti-mates produced within the same study may be more similar to one another than those produced from other studies. Fail-ing to account for this correlation can lead to inconsistent and inefficient parameter estimates. Following the approach taken in Bateman and Jones (2003), Johnston and others (2005), and Johnston and Thomassin (2010), we applied a “multilevel model,” also referred to as a “random effects model,” to test for and address possible correlation among observations from the same study. The model uses a maximum-likelihood estimator with robust standard errors and estimates with two levels. The first level corresponds to each individual observation and the second level corresponds to individual studies. This approach relaxes the assumption of independence across individual observations, and divides the error term of the equation into two parts representing the residual variance present at each level. A test-down approach was used to eliminate explanatory variables that were found not to have a statistically significant effect on consumer surplus values. The final statistical models
Table 3. Number of studies and observations included in the Benefit Transfer Toolkit.
ResourceNumber of
new studiesTotal number
of studiesNumber of new
observationsTotal number of
observations
Backpacking 1 7 15 53Boating–Motorized and nonmotorized 1 40 2 159Camping 2 23 17 97Fishing 11 150 123 1,034General recreation 10 48 121 254Hiking 8 38 24 110Horseback riding 1 2 1 2Hunting 1 62 55 621Mountain biking 1 8 1 17Off-highway vehicle 4 8 21 34Rock climbing — 6 — 14Snowmobiling 1 3 6 10Threatened, endangered, rare species 5 32 18 83Wildlife viewing 7 36 90 372Total 53 463 494 2,860

10 Inclusion of Nonmarket Values in BLM Planning and Project Assessments, Final Report
Users can navigate from the homepage of the Toolkit to instructions on conducting a benefit transfer, information on background and development of the Toolkit, examples of benefit transfer in the literature, and a list of technical terms and definitions.
Meta-data for recreational activities and threatened,endangered, and rare species. These tables can be used forpoint estimate benefit transfers.
Figure 1. Screen shot of the Benefit Transfer Toolkit homepage.

Methods
11
The “Full Dataset” tab contains the same information asthe “Individual Studies” tab, but also includes much more detailed and technical information about each study in the database for a specific resource.
Figure 2. Screen shot of the “Full Dataset” tab for hunting in the Benefit Transfer Toolkit.
12
Inclusion of Nonm
arket Values in BLM
Planning and Project Assessm
ents, Final Report
Figure 3. Screen shot of the “Individual Studies” tab for hunting in the Benefit Transfer Toolkit.
The “Individual Studies” tab for a specified resource includes summary information for all identified, relevant studies, and methodologically sounds studies in the literature.

Methods
13
Figure 4. Screen shot of the “Average Values” tab for hunting in the Benefit Transfer Toolkit.
For recreational activities, the “Average Values” tab contains a table of estimated average economic values by region and activity type based on the full database of studies.
The “Average Values” tab also includes a map of the United States that shows the regional configurations that are used for calculating the average values table.

14 Inclusion of Nonmarket Values in BLM Planning and Project Assessments, Final Report
Table 4. Explanatory variables tested in meta-regression models.—Continued
[BLM, Bureau of Land Management; NWR, National Wildlife Refuge; USFWS, U.S. Fish and Wildlife Service; ENV, environment; DC, dichotomous choice; CVM, contingent valuation method; RP, revealed preference; OppCost, opportunity cost; SingleDest, single destination; PrimPrup, primary purpose]
Variable Description
Study_Year Continuous variable: year the study was publishedJournal Binary variable: 1 if document type is journal, 0 otherwiseRegion–Alaska Binary variable: 1 if study was conducted in Alaska, 0 otherwiseRegion–Pacific Coast Binary variable: 1 if study was conducted in Pacific Coast region states (see figure 1), 0 otherwiseRegion–Intermountain Binary variable: 1 if study was conducted in Intermountain region states (see figure 1), 0 otherwiseRegion–Northeast Binary variable: 1 if study was conducted in Northeast region states (see figure 1), 0 otherwiseRegion–Southeast Binary variable: 1 if study was conducted in Southeast region states (see figure 1), 0 otherwiseRegion–Multiple Areas Binary variable: 1 if study was conducted in multiple regions or nationwide, 0 otherwisePublic Land Only Binary variable: 1 if activity was on public land only, 0 otherwise (mix, all private, tribal, not specified)BLM Binary variable: 1 if public land only type is Bureau of Land Management lands; 0 otherwiseNational Forest Binary variable: 1 if public land only type is National Forest Service lands; 0 otherwiseNWR Binary variable: 1 if public land only type is a National Wildlife Refuge (USFWS); 0 otherwiseNational Park Binary variable: 1 if public land only type is National Park Service lands; 0 otherwiseState Forest Binary variable: 1 if public land only type is state forest; 0 otherwiseState Park Binary variable: 1 if public land only type is a state park; 0 otherwiseEnv_Water Binary variable: 1 if primary environment type is water, 0 otherwiseEnv_Forest Binary variable: 1 if primary environment type is forested (woodland biome, taiga biome), 0 otherwiseEnv_Ocean Binary variable: 1 if primary environment type is an ocean, 0 otherwiseEnv_Lake_Reservoir Binary variable: 1 if primary environment type is a lake or reservoir, 0 otherwiseEnv_Estuary_Bay Binary variable: 1 if primary environment type is an estuary or bay, 0 otherwiseEnv_River_Stream Binary variable: 1 if primary environment type is a river or stream, 0 otherwiseWilderness Area Binary variable: 1 if primary environment type is a wilderness area, 0 otherwiseGreat_Lake Binary variable: 1 if primary environment type is a Great Lake, 0 otherwiseBirdwatching Binary variable: 1 if primary activity was birdwatching, 0 otherwiseCharismatic Megafauna Binary variable: 1 if primary activity was viewing a primary charimsatic megafauna species, 0 otherwiseGeneral Wildlife Viewing Binary variable: 1 if primary activity was viewing various wildlife species (not one primary), 0 otherwiseBig Game Hunting Binary variable: 1 if primary activity was big game hunting, 0 otherwiseSmall Game Hunting Binary variable: 1 if primary activity was small game hunting, 0 otherwiseWaterfowl Hunting Binary variable: 1 if primary activity was waterfowl hunting, 0 otherwiseDeer Hunting Binary variable: 1 if primary activity was deer hunting, 0 otherwiseElk Hunting Binary variable: 1 if primary activity was elk hunting, 0 otherwiseMoose Hunting Binary variable: 1 if primary activity was moose hunting, 0 otherwiseMountain Goat Hunting Binary variable: 1 if primary activity was mountain goat hunting, 0 otherwiseBear Hunting Binary variable: 1 if primary activity was bear hunting, 0 otherwiseAntelope Hunting Binary variable: 1 if primary activity was antelope hunting, 0 otherwisePheasant Hunting Binary variable: 1 if primary activity was pheasant hunting, 0 otherwiseGrouse Hunting Binary variable: 1 if primary activity was grouse hunting, 0 otherwiseRabbit Hunting Binary variable: 1 if primary activity was rabbit hunting, 0 otherwiseHiking Binary variable: 1 if primary activity was hiking, 0 otherwiseBackpacking Binary variable: 1 if primary activity was backpacking, 0 otherwiseMountain Biking Binary variable: 1 if primary activity was mountain biking, 0 otherwiseOff-Highway Vehicle Binary variable: 1 if primary activity was off-highway vehicle use, 0 otherwiseSnowmobiling Binary variable: 1 if primary activity was snowmobiling, 0 otherwise
Methods 15
Table 4. Explanatory variables tested in meta-regression models.—Continued
[BLM, Bureau of Land Management; NWR, National Wildlife Refuge; USFWS, U.S. Fish and Wildlife Service; ENV, environment; DC, dichotomous choice; CVM, contingent valuation method; RP, revealed preference; OppCost, opportunity cost; SingleDest, single destination; PrimPrup, primary purpose]
Variable Description
Freshwater Fishing Binary variable: 1 if primary activity was freshwater fishing, 0 otherwiseSaltwater Fishing Binary variable: 1 if primary activity was saltwater fishing, 0 otherwiseFreshwater Warm Binary variable: 1 if primary activity was freshwater fishing in warm water, 0 otherwiseFreshwater Cold Binary variable: 1 if primary activity was freshwater fishing in cold water, 0 otherwiseTuna Fishing Binary variable: 1 if primary activity was tuna fishing, 0 otherwiseSalmon Fishing Binary variable: 1 if primary activity was salmon fishing, 0 otherwiseSteelhead Fishing Binary variable: 1 if primary activity was steelhead fishing, 0 otherwiseTrout Fishing Binary variable: 1 if primary activity was trout fishing, 0 otherwiseBass Fishing Binary variable: 1 if primary activity was bass fishing, 0 otherwiseMuskellunge Fishing Binary variable: 1 if primary activity was muskellunge fishing, 0 otherwiseArctic Grayling Fishing Binary variable: 1 if primary activity was Arctic grayling fishing, 0 otherwisePerch Fishing Binary variable: 1 if primary activity was perch fishing, 0 otherwiseMackerel Fishing Binary variable: 1 if primary activity was mackerel fishing, 0 otherwiseWalleye Fishing Binary variable: 1 if primary activity was walleye fishing, 0 otherwisePike Fishing Binary variable: 1 if primary activity was pike fishing, 0 otherwiseMail Binary variable: 1 if survey mode was mail, 0 otherwiseIn-Person Binary variable: 1 if survey mode was in-person, 0 otherwisePhone Binary variable: 1 if survey mode was phone, 0 otherwiseMode_Other Binary variable: 1 if survey mode was mixed, Web-based, or otherData_Year Continuous variable: year the study data were collectedOnsite Binary variable: 1 if survey was conducted onsite, 0 otherwise (user list, general pop, or other)Nonresidents Binary variable: 1 if only nonresidents were surveyed, 0 otherwiseMethod Binary variable: 1 if stated preference method study, 0 if revealed preference methodSample_Size Continuous variable: sample size in regressionDC_CVM Binary variable: 1 if contingent valuation method study and dichotomous choice question format, 0 otherwiseAnnual_CVM Binary variable: 1 if contingent valuation method study and annual payment type, 0 otherwiseRP_Zonal Binary variable: 1 if zonal travel cost method used, 0 otherwiseRP_Substitute Binary variable: 1 if revealed preference method used and substitute price, index, or variable was included in
regression, 0 otherwise
RP_Truncate Binary variable: 1 if revealed preference method used and observations truncated, 0 otherwiseRP_Endogenous Binary variable: 1 if revealed preference method use and model was corrected for endogenous stratification,
0 otherwise
RP_OppCost Binary variable: 1 if revealed preference method used and opportunity cost of time was included in regression, 0 otherwise
RP_SingleDest Binary variable: 1 if revealed preference method used and only single destination trips were included in model; 0 otherwise
RP_PrimPurp Binary variable: if revealed preference method used and only primary purpose visitors included in model; 0 otherwise
Best_Estimate Binary variable: 1 if value estimate was best or estimate favored by author; 0 otherwise (relatively bad model/estimate)
Charter Binary variable: 1 if charter or guided trip; 0 otherwise (private trip)Day_Trip Binary variable: 1 if model included day trips only; 0 otherwise (overnight)Value_Converted Binary variable: 1 if value was converted to per person per day, 0 otherwise (not converted)
16 Inclusion of Nonmarket Values in BLM Planning and Project Assessments, Final Report
used to determine where major gaps in the literature exist, allowing primary studies focused on particular locations and resources to be prioritized.
Nonmarket Valuation Reference for Field Staff
In addition to the main deliverables provided to each pilot site (appendixes 2 and 3) and the Toolkit, USGS also produced an interim report for BLM’s Socioeconomics Program and a nonmarket valuation reference for BLM field staff. The non-market valuation reference, provided in appendix 6, includes an overview of the case studies; a description of nonmarket valuation and its history and relevance in BLM planning; a discussion of the main approaches to benefit transfer, includ-ing BLM-specific examples; an overview of the Toolkit; and guidance for preparing qualitative descriptions of nonmarket values. It is anticipated that the nonmarket valuation reference, or sections of it, will be made available to BLM field staff.
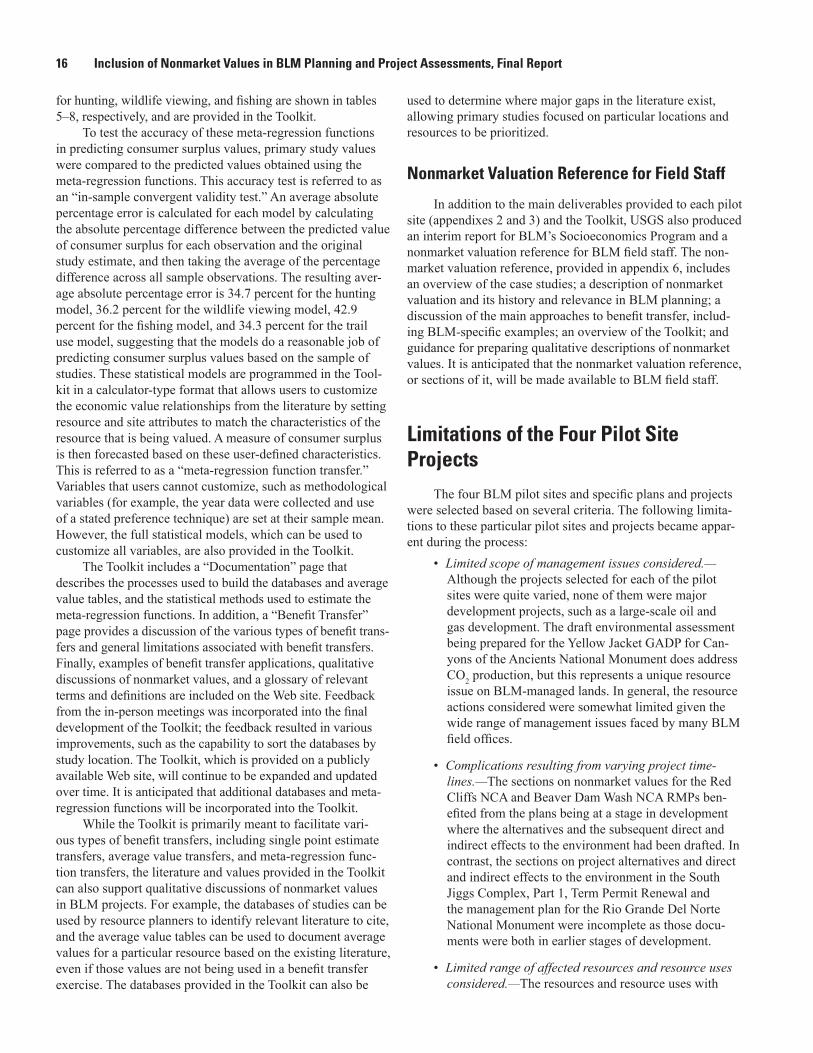
Limitations of the Four Pilot Site Projects
The four BLM pilot sites and specific plans and projects were selected based on several criteria. The following limita-tions to these particular pilot sites and projects became appar-ent during the process:
• Limited scope of management issues considered.—Although the projects selected for each of the pilot sites were quite varied, none of them were major development projects, such as a large-scale oil and gas development. The draft environmental assessment being prepared for the Yellow Jacket GADP for Can-yons of the Ancients National Monument does address CO2 production, but this represents a unique resource issue on BLM-managed lands. In general, the resource actions considered were somewhat limited given the wide range of management issues faced by many BLM field offices.
• Complications resulting from varying project time-lines.—The sections on nonmarket values for the Red Cliffs NCA and Beaver Dam Wash NCA RMPs ben-efited from the plans being at a stage in development where the alternatives and the subsequent direct and indirect effects to the environment had been drafted. In contrast, the sections on project alternatives and direct and indirect effects to the environment in the South Jiggs Complex, Part 1, Term Permit Renewal and the management plan for the Rio Grande Del Norte National Monument were incomplete as those docu-ments were both in earlier stages of development.
• Limited range of affected resources and resource uses considered.—The resources and resource uses with
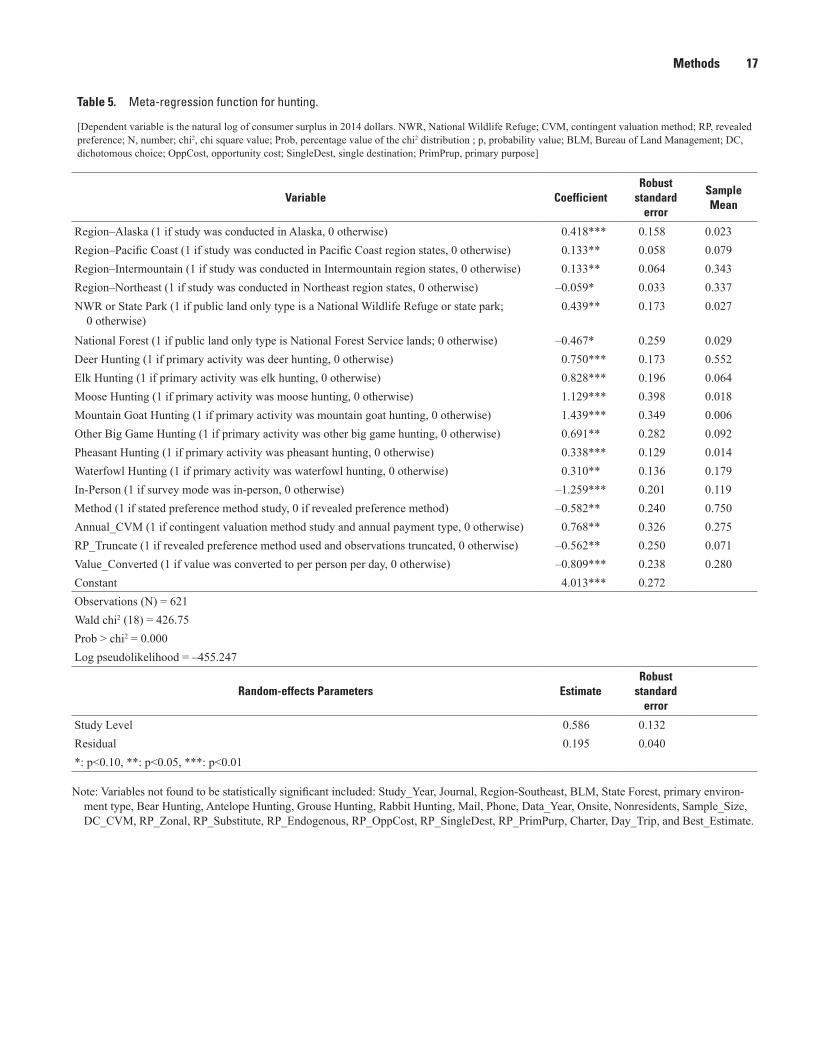
for hunting, wildlife viewing, and fishing are shown in tables 5–8, respectively, and are provided in the Toolkit.
To test the accuracy of these meta-regression functions in predicting consumer surplus values, primary study values were compared to the predicted values obtained using the meta-regression functions. This accuracy test is referred to as an “in-sample convergent validity test.” An average absolute percentage error is calculated for each model by calculating the absolute percentage difference between the predicted value of consumer surplus for each observation and the original study estimate, and then taking the average of the percentage difference across all sample observations. The resulting aver-age absolute percentage error is 34.7 percent for the hunting model, 36.2 percent for the wildlife viewing model, 42.9 percent for the fishing model, and 34.3 percent for the trail use model, suggesting that the models do a reasonable job of predicting consumer surplus values based on the sample of studies. These statistical models are programmed in the Tool-kit in a calculator-type format that allows users to customize the economic value relationships from the literature by setting resource and site attributes to match the characteristics of the resource that is being valued. A measure of consumer surplus is then forecasted based on these user-defined characteristics. This is referred to as a “meta-regression function transfer.” Variables that users cannot customize, such as methodological variables (for example, the year data were collected and use of a stated preference technique) are set at their sample mean. However, the full statistical models, which can be used to customize all variables, are also provided in the Toolkit.
The Toolkit includes a “Documentation” page that describes the processes used to build the databases and average value tables, and the statistical methods used to estimate the meta-regression functions. In addition, a “Benefit Transfer” page provides a discussion of the various types of benefit trans-fers and general limitations associated with benefit transfers. Finally, examples of benefit transfer applications, qualitative discussions of nonmarket values, and a glossary of relevant terms and definitions are included on the Web site. Feedback from the in-person meetings was incorporated into the final development of the Toolkit; the feedback resulted in various improvements, such as the capability to sort the databases by study location. The Toolkit, which is provided on a publicly available Web site, will continue to be expanded and updated over time. It is anticipated that additional databases and meta-regression functions will be incorporated into the Toolkit.
While the Toolkit is primarily meant to facilitate vari-ous types of benefit transfers, including single point estimate transfers, average value transfers, and meta-regression func-tion transfers, the literature and values provided in the Toolkit can also support qualitative discussions of nonmarket values in BLM projects. For example, the databases of studies can be used by resource planners to identify relevant literature to cite, and the average value tables can be used to document average values for a particular resource based on the existing literature, even if those values are not being used in a benefit transfer exercise. The databases provided in the Toolkit can also be
Methods 17
Table 5. Meta-regression function for hunting.
[Dependent variable is the natural log of consumer surplus in 2014 dollars. NWR, National Wildlife Refuge; CVM, contingent valuation method; RP, revealed preference; N, number; chi2, chi square value; Prob, percentage value of the chi2 distribution ; p, probability value; BLM, Bureau of Land Management; DC, dichotomous choice; OppCost, opportunity cost; SingleDest, single destination; PrimPrup, primary purpose]
Variable CoefficientRobust
standard error
Sample Mean
Region–Alaska (1 if study was conducted in Alaska, 0 otherwise) 0.418*** 0.158 0.023Region–Pacific Coast (1 if study was conducted in Pacific Coast region states, 0 otherwise) 0.133** 0.058 0.079Region–Intermountain (1 if study was conducted in Intermountain region states, 0 otherwise) 0.133** 0.064 0.343Region–Northeast (1 if study was conducted in Northeast region states, 0 otherwise) –0.059* 0.033 0.337NWR or State Park (1 if public land only type is a National Wildlife Refuge or state park;
0 otherwise)0.439** 0.173 0.027
National Forest (1 if public land only type is National Forest Service lands; 0 otherwise) –0.467* 0.259 0.029Deer Hunting (1 if primary activity was deer hunting, 0 otherwise) 0.750*** 0.173 0.552Elk Hunting (1 if primary activity was elk hunting, 0 otherwise) 0.828*** 0.196 0.064Moose Hunting (1 if primary activity was moose hunting, 0 otherwise) 1.129*** 0.398 0.018Mountain Goat Hunting (1 if primary activity was mountain goat hunting, 0 otherwise) 1.439*** 0.349 0.006Other Big Game Hunting (1 if primary activity was other big game hunting, 0 otherwise) 0.691** 0.282 0.092Pheasant Hunting (1 if primary activity was pheasant hunting, 0 otherwise) 0.338*** 0.129 0.014Waterfowl Hunting (1 if primary activity was waterfowl hunting, 0 otherwise) 0.310** 0.136 0.179In-Person (1 if survey mode was in-person, 0 otherwise) –1.259*** 0.201 0.119Method (1 if stated preference method study, 0 if revealed preference method) –0.582** 0.240 0.750Annual_CVM (1 if contingent valuation method study and annual payment type, 0 otherwise) 0.768** 0.326 0.275RP_Truncate (1 if revealed preference method used and observations truncated, 0 otherwise) –0.562** 0.250 0.071Value_Converted (1 if value was converted to per person per day, 0 otherwise) –0.809*** 0.238 0.280Constant 4.013*** 0.272Observations (N) = 621Wald chi2 (18) = 426.75Prob > chi2 = 0.000Log pseudolikelihood = –455.247
Random-effects Parameters EstimateRobust
standard error
Study Level 0.586 0.132Residual 0.195 0.040*: p<0.10, **: p<0.05, ***: p<0.01
Note: Variables not found to be statistically significant included: Study_Year, Journal, Region-Southeast, BLM, State Forest, primary environ-ment type, Bear Hunting, Antelope Hunting, Grouse Hunting, Rabbit Hunting, Mail, Phone, Data_Year, Onsite, Nonresidents, Sample_Size, DC_CVM, RP_Zonal, RP_Substitute, RP_Endogenous, RP_OppCost, RP_SingleDest, RP_PrimPurp, Charter, Day_Trip, and Best_Estimate.

18 Inclusion of Nonmarket Values in BLM Planning and Project Assessments, Final Report
Table 6. Meta-regression function for wildlife viewing.
[Dependent variable is the natural log of consumer surplus in 2014 dollars. DC, dichotomous choice; CVM, contingent valuation method; RP, revealed prefer-ence; N, number; chi2, chi square value; Prob, percentage value of the chi2 distribution ; p, probability value; OppCost, opportunity cost; SingleDest, single destination; PrimPrup, primary purpose]
Variable CoefficientRobust
standard error
Sample mean
Region–Alaska (1 if study was conducted in Alaska, 0 otherwise) 0.717*** 0.240 0.035Region–Pacific Coast (1 if study was conducted in Pacific Coast region states, 0 otherwise) 0.588*** 0.134 0.094Region–Intermountain (1 if study was conducted in Intermountain region states, 0 otherwise) 0.479*** 0.143 0.231Region–Northeast (1 if study was conducted in Northeast region states, 0 otherwise) 0.297* 0.154 0.344Region–Southeast (1 if study was conducted in Southeast region states, 0 otherwise) 0.376** 0.157 0.228Public Land Only (1 if activity was on public land only, 0 otherwise) –0.741*** 0.247 0.263Birdwatching (1 if primary activity was birdwatching, 0 otherwise) –1.446*** 0.307 0.056General Wildlife Viewing (1 if primary activity was viewing various wildlife species,
0 otherwise)–1.460*** 0.330 0.909
Nonresidents (1 if only nonresidents were surveyed, 0 otherwise) 0.929*** 0.213 0.185Method (1 if stated preference method study, 0 if revealed preference method) –1.108*** 0.303 0.890DC_CVM (1 if contingent valuation method study and dichotomous choice question format,
0 otherwise)–0.323** 0.151 0.218
RP_Truncate (1 if revealed preference method used and observations truncated, 0 otherwise) –0.772*** 0.147 0.027Constant 5.755*** 0.391Observations (N) = 372Wald chi2 (12) = 1235.510Prob > chi2 = 0.000Log pseudolikelihood = –280.304
Random-effects parameters EstimateRobust
standard error
Study Level 0.458 0.106Residual 0.217 0.027*: p<0.10, **: p<0.05, ***: p<0.01
Note: Variables not found to be statistically significant included: Study_Year, Journal, public land type, primary environment type, Mail, In-Person, Phone, Data_Year, Onsite, Sample_Size, Annual_CVM, RP_Zonal, RP_Substitute, RP_Endogenous, RP_OppCost, RP_SingleDest, RP_PrimPurp, Best_Estimate, Charter, Day_Trip, and Value_Converted.
Methods 19
Table 7. Meta-regression function for fishing.
[Dependent variable is the natural log of consumer surplus in 2014 dollars. DC, dichotomous choice; CVM, contingent valuation method; RP, revealed prefer-ence; N, number; chi2, chi square value; Prob, percentage value of the chi2 distribution ; p, probability value; OppCost, opportunity cost; SingleDest, single destination; PrimPrup, primary purpose]
Variable CoefficientRobust
standard error
Sample Mean
Region–Alaska (1 if study was conducted in Alaska, 0 otherwise) 0.587*** 0.146 0.053Tuna Fishing (1 if primary activity was tuna fishing, 0 otherwise) 2.253*** 0.236 0.009Salmon Fishing in Intermountain or Pacific Coast (1 if primary activity was salmon fishing in
Intermountain or Pacific Coast region states, 0 otherwise)0.562* 0.299 0.018
Salmon Fishing in Northeast or Southeast (1 if primary activity was salmon fishing in Northeast or Southeast region states, 0 otherwise)
0.941** 0.473 0.007
Steelhead Fishing in Pacific Coast or Alaska (1 if primary activity was steelhead fishing in Pacific Coast region states or Alaska, 0 otherwise)
1.063*** 0.299 0.006
Bass Fishing in Northeast (1 if primary activity was bass fishing in Northeast region states, 0 otherwise)
–0.226* 0.118 0.076
Bass Fishing in Southeast (1 if primary activity was bass fishing in Southeast region states, 0 otherwise)
–0.108* 0.066 0.073
Muskellunge Fishing (1 if primary activity was muskellunge fishing, 0 otherwise) 0.454*** 0.154 0.009Arctic Grayling Fishing (1 if primary activity was arctic grayling fishing, 0 otherwise) 0.696*** 0.237 0.005Perch Fishing (1 if primary activity was perch fishing, 0 otherwise) 0.526** 0.226 0.007Other Small Game Fishing (1 if primary activity was other small game fishing, 0 otherwise) –0.878*** 0.316 0.011Phone (1 if survey mode was phone, 0 otherwise) 0.427** 0.186 0.269Data_Year (Continuous variable–year the study data were collected) –0.016* 0.009 1989.468Nonresidents Only (1 if only nonresidents were surveyed, 0 otherwise) 0.435*** 0.054 0.077Method (1 if stated preference method study, 0 if revealed preference method) –0.769*** 0.143 0.450DC_CVM (1 if contingent valuation method study and dichotomous choice question format,
0 otherwise)1.075*** 0.235 0.134
RP_Zonal (1 if zonal travel cost method used, 0 otherwise) –0.739*** 0.249 0.113Constant 36.590** 18.661Observations (N) = 1034Wald chi2 (17) = 119.670Prob > chi2 = 0.000Log pseudolikelihood = –1053.431
Random-effects Parameters EstimateRobust
standard error
Study Level 0.988 0.176Residual 0.311 0.042*: p<0.10, **: p<0.05, ***: p<0.01
Note: Variables not found to be statistically significant included: Study_Year, Journal, Public Land Only, public land type, primary environ-ment type, Freshwater Fishing, Saltwater Fishing, Freshwater Warm, Freshwater Cold, Trout Fishing, Mackerel Fishing, Walleye Fishing, Pike Fishing, Mail, In-Person, Onsite, Sample_Size, Annual_CVM, RP_Substitute, RP_Truncate, RP_Endogenous, RP_OppCost, RP_Sin-gleDest, RP_PrimPurp, Best_Estimate, Charter, Day_Trip, and Value_Converted.
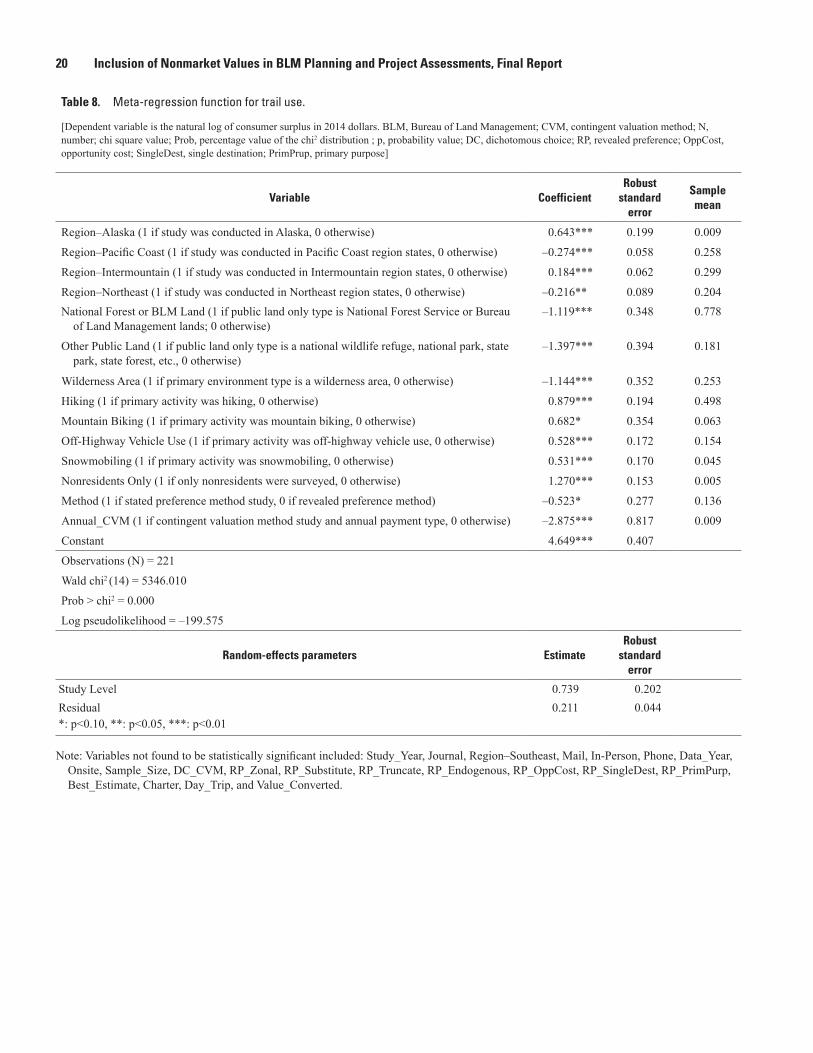
20 Inclusion of Nonmarket Values in BLM Planning and Project Assessments, Final Report
Table 8. Meta-regression function for trail use.
[Dependent variable is the natural log of consumer surplus in 2014 dollars. BLM, Bureau of Land Management; CVM, contingent valuation method; N, number; chi square value; Prob, percentage value of the chi2 distribution ; p, probability value; DC, dichotomous choice; RP, revealed preference; OppCost, opportunity cost; SingleDest, single destination; PrimPrup, primary purpose]
Variable CoefficientRobust
standard error
Sample mean
Region–Alaska (1 if study was conducted in Alaska, 0 otherwise) 0.643*** 0.199 0.009
Region–Pacific Coast (1 if study was conducted in Pacific Coast region states, 0 otherwise) –0.274*** 0.058 0.258
Region–Intermountain (1 if study was conducted in Intermountain region states, 0 otherwise) 0.184*** 0.062 0.299
Region–Northeast (1 if study was conducted in Northeast region states, 0 otherwise) –0.216** 0.089 0.204National Forest or BLM Land (1 if public land only type is National Forest Service or Bureau
of Land Management lands; 0 otherwise)–1.119*** 0.348 0.778
Other Public Land (1 if public land only type is a national wildlife refuge, national park, state park, state forest, etc., 0 otherwise)
–1.397*** 0.394 0.181
Wilderness Area (1 if primary environment type is a wilderness area, 0 otherwise) –1.144*** 0.352 0.253
Hiking (1 if primary activity was hiking, 0 otherwise) 0.879*** 0.194 0.498
Mountain Biking (1 if primary activity was mountain biking, 0 otherwise) 0.682* 0.354 0.063
Off-Highway Vehicle Use (1 if primary activity was off-highway vehicle use, 0 otherwise) 0.528*** 0.172 0.154
Snowmobiling (1 if primary activity was snowmobiling, 0 otherwise) 0.531*** 0.170 0.045
Nonresidents Only (1 if only nonresidents were surveyed, 0 otherwise) 1.270*** 0.153 0.005
Method (1 if stated preference method study, 0 if revealed preference method) –0.523* 0.277 0.136
Annual_CVM (1 if contingent valuation method study and annual payment type, 0 otherwise) –2.875*** 0.817 0.009
Constant 4.649*** 0.407
Observations (N) = 221
Wald chi2 (14) = 5346.010
Prob > chi2 = 0.000
Log pseudolikelihood = –199.575
Random-effects parameters EstimateRobust
standard error
Study Level 0.739 0.202Residual 0.211 0.044*: p<0.10, **: p<0.05, ***: p<0.01
Note: Variables not found to be statistically significant included: Study_Year, Journal, Region–Southeast, Mail, In-Person, Phone, Data_Year, Onsite, Sample_Size, DC_CVM, RP_Zonal, RP_Substitute, RP_Truncate, RP_Endogenous, RP_OppCost, RP_SingleDest, RP_PrimPurp, Best_Estimate, Charter, Day_Trip, and Value_Converted.
Lessons Learned and Future Research 21
associated nonmarket values that were identified as potentially being impacted by the action alternatives in the projects at each pilot site were somewhat limited. For example, nonmarket values associated with air quality or water quality were not included in the dis-cussion of nonmarket values for any of the pilot sites. The limited range of affected resources and resource uses that were evaluated may be because of the limited types of projects that were evaluated (for example, the lack of a major oil and gas development project), or that the tables of resource uses developed for each pilot site (example provided in table 1) did not include an exhaustive list of all potentially affected resources and resource uses. In the Yellow Jacket GADP (Can-yons of the Ancients National Monument), the effect on air quality from CO2 development was considered. However, because air quality impacts must be miti-gated at the site, the planning team determined that the air quality would not be affected. Regardless, it is important to highlight the fact that nonmarket values derived from indirect resource uses, such as climate regulation from greenhouse gas exchanges, or air or water quality effects, were not included in any of the project analyses.
• Data limitations.—Given the scope of this effort, the consideration of nonmarket values was limited to the use of existing data. Because primary data were not collected, considerable data limitations were encoun-tered and, ultimately, the section on nonmarket values included in the economic analysis for each pilot site project was qualitative in nature. Using existing data to monetize nonmarket values associated with a manage-ment action typically requires two pieces of informa-tion: (1) an estimate of quantity for expected resource changes (for example, visitation changes, wildlife population changes, changes in greenhouse gas emis-sions), and (2) an estimate of economic value for that quantity. This effort faced constraints in the availability of both resource data and valuation data. For example, it became apparent during the study that many BLM offices do not have a sufficient baseline of visitor use data, and are often unable to provide estimates of the expected changes in visitor use days for different recre-ational activities that would occur as a result of a new management action. This presents a major obstacle to using benefit transfer methods. Even if economic value estimates for various recreational activities are widely available and summarized in the Toolkit or another resource, nonmarket values cannot be monetized without quantified changes in visitor use days. Fur-ther, identifying the major resource issues at the pilot sites and reviewing the valuation literature revealed that there is limited valuation data for many resources and resource issues unique to BLM-managed lands. For example, there is little existing information on the
nonmarket values derived from cultural and archaeo-logical sites (see appendix 2), which are resources that are common to many of the lands managed by BLM. Despite these data limitations, the overall process and qualitative discussions on nonmarket values allowed for additional connections to be made between resource changes and economic values, and resulted in the production of valuable information that would not have been possible without the study.
Lessons Learned and Future ResearchIn addition to the limitations of the four pilot sites, many
lessons were learned and areas for future research became apparent during this effort. Although BLM’s Socioeconomics Program can address some of these tasks, others are beyond the reach of that program alone and will depend on the efforts of individual field offices. The tasks requiring greater efforts are listed below.
• Importance of clarity and coordination.—Monetizing the value of nonmarket goods and services associ-ated with BLM-managed lands requires considerable input and data from a wide range of resource special-ists. As a result, it is important to clarify early on in a project exactly what information is needed to ensure that economic values can be monetized. For example, various resource specialists will need to quantify how resources and resource uses will change under different action alternatives, which may require a change in how resource programs consider their analyses. Along those lines, it is important to have the full interdisciplinary team, including the economist or other social scientist conducting the socioeconomic analysis, involved in discussions throughout the planning or project assess-ment process.
• Primary data collection is necessary.—A substantial limitation of this effort was the lack of available data necessary for monetizing nonmarket values. Successfully incorporating nonmarket values into BLM planning and project assessments will require an investment in primary data collection in two focus areas:
1. Data necessary to quantify resource changes—To conduct any sort of ecosystem service or nonmarket valuation analysis, BLM needs sufficient data to estimate quantified changes in nonmarket resources, including recreation days, wildlife populations, and air quality, for each of the action alternatives. Con-tinued improvements in the collection of visitor use and other resource data is needed.
2. Economic valuation data—There are considerable gaps in the existing nonmarket valuation literature.

22 Inclusion of Nonmarket Values in BLM Planning and Project Assessments, Final Report
Primary studies could be targeted in such a way as to ensure that the results would be useful for all BLM offices and programs; that is, the value estimates could be used for benefit transfers. In general, only a handful of nonmarket valuation studies have ever been conducted specifically for BLM-managed lands and resources. It would be worthwhile for BLM’s Socioeconomics Program to strategically identify priority areas, in terms of both resources and geographic locations, where primary studies could be conducted and the results used for future benefit transfers. In addition, some field offices regularly conduct short, often one or two page, visi-tor satisfaction surveys. While limited in the number of questions that can be included, incorporating even one nonmarket valuation question could be a cost-effective way to obtain additional information on consumer surplus values associated with BLM-managed lands. A contingent valuation question that asks visitors how much more they would be willing to pay for their trip if prices for gas, hotels, and other necessities increase would be a relatively simple addition to such surveys.
• Economic values for both marketed and nonmarketed goods and services can be considered together.—Although the focus of this effort was on the economic valuation of nonmarket goods and services, for which consumers are the primary recipient of economic value, some of the resources and resource uses on BLM-managed lands are commodities that are traded in national or international markets. Both consumers and producers may derive an economic value from a change in the quantity of a marketed output, and the effects on both consumer and producer surplus can be estimated to determine the economic benefits associ-ated with a change in production. Often, the change in the supply of a marketed commodity resulting from a management action is relatively small and does not affect the market price, meaning there is no change in consumer surplus. Thus, the net economic benefits of producing a marketed output is determined by pro-ducer surplus, which is equal to total revenue (market price x quantity) minus the costs of production of that marketed good (Loomis, 2002). Producer surplus pro-vides a measure of economic value that can be directly compared to the economic value of nonmarket goods and services, which is important because resource allocation decisions on BLM-managed lands may involve comparing the economic value of both market and nonmarket goods and services. A comprehensive economic analysis included in a BLM plan or project assessment would consider economic values derived from both marketed and nonmarketed resources and resource uses, as well as regional economic impacts from recreation or commodity production. Providing
additional training to field staff on economic terminol-ogy and concepts could be beneficial if more compre-hensive economic analyses are desired. For example, an important but often misunderstood concept is that regional economic impact analyses are not capturing economic values as measured by consumer and pro-ducer surplus. Economic impacts and economic values are measures that cannot be added together or com-pared to one another, whereas economic values derived from marketed goods and services can be added or compared to economic values derived from nonmar-keted goods and services.
• Importance of data repositories.—Repositories of exist-ing nonmarket valuation studies and value estimates, such as those included in the Toolkit, are useful for reasons other than their intended purpose of facilitating benefit transfers. Methods of nonmarket valuation and the economic theory behind those methods can be com-plex, but providing easily accessible examples of stud-ies can help to educate field staff on how this type of information is used. Databases of existing studies can provide literature reviews for qualitative discussions of nonmarket values, as well as information on the aver-age values held for a particular resource in a particular geographic region. Further, easy access to the existing literature can help a user determine where major gaps exist and that information can be used to prioritize pri-mary studies focused on specific geographic locations or resources. Keeping such repositories current would be beneficial for BLM and other agencies that often rely on the use of existing data.
• Differing approaches to nonmarket valuation and their tradeoffs.—As highlighted in BLM’s instruction memorandum on nonmarket valuation (Bureau of Land Management, 2013a), there are three main approaches to the consideration of nonmarket values: conducting primary studies, using benefit transfer, and describ-ing values qualitatively. General conclusions drawn from the results of this effort regarding each of these approaches are summarized below.
1. Conducting a primary study for the site and resource in question—Primary studies of nonmarket valuation will always provide the most accurate monetized economic value estimate for a nonmarket good or service, but primary studies require a substantial investment of time and funding. Therefore, primary studies may be best suited for management issues that are highly contentious or are expected to affect unique resources for which there are limited avail-able valuation data. Primary studies may also be well suited for estimating values associated with management actions that result in larger landscape scale changes or substantial changes to the quality of a resource or resource use. Finally, primary studies

Conclusions 23
may be used in cases where the increased accuracy of the value estimate resulting from primary data collec-tion (compared to using existing data) could possibly influence the outcome of a management decision.
2. Using value estimates from primary studies already completed for similar sites and resources (benefit transfer)—Given the cost and time necessary for conducting primary studies, existing nonmarket value estimates are often relied upon. Benefit transfer is a second-best approach that results in decreased validity of value estimates compared to primary methods of nonmarket valuation. How-ever, for resources and resource uses that have been relatively well studied in the nonmarket valuation literature, benefit transfers can provide a useful mea-sure of economic value. The validity and credibility of transferred value estimates can be improved if the extensive guidelines and recommendations on performing benefit transfers in the existing literature are followed. Benefit transfers may be best suited to analyses of management actions that are expected to affect one or just a few well-studied nonmar-ket goods or services. For example, if an action is expected to positively impact recreational off-highway vehicle use at the expense of recreational hiking, there may be sufficient secondary data to estimate and compare the affected nonmarket values derived from these resource uses. However, in situ-ations where many nonmarket goods or services are expected to be affected, it will likely be difficult to identify relevant values for each affected resource in the existing literature, and attempting to piece together values for these different resources could result in double counting.
3. Describing values qualitatively—Given the required investments for primary studies and the limitations associated with benefit transfer methods, qualita-tive descriptions of nonmarket values could be a useful method for consistently considering this type of information in BLM planning. Although qualita-tive discussions do not allow for comparisons of monetized economic value estimates, they provide an effective means to communicate the range of eco-nomic values associated with BLM-managed lands. These descriptions can take many different forms. For resources such as recreational opportunities or the preservation of threatened and endangered species that have been well studied in the nonmarket valua-tion literature, individual studies and value estimates can be used to provide context regarding the exis-tence of these values, even if they are not included in a benefit transfer exercise. Similarly, a range of exist-ing values, or measure of central tendency of values, for a particular resource can also be provided. For resources that have been less frequently studied in the
nonmarket valuation literature, such as cultural and archaeological resources, discussions can be based on the types of nonmarket economic values commonly held for these resources and how their nonmarket economic values might be expected to change for each action alternative. Qualitative descriptions of nonmarket values for unique resources can also be used to supplement benefit transfers of values for well-studied resources such as recreational opportu-nities. Based on feedback from managers, planners, and field staff at the pilot sites, qualitative discussions of nonmarket values could be a practical and helpful addition to BLM plans and project assessments.
A Unique Example of a Primary Study Conducted for BLM
Primary studies are flexible and can be applied to a wide range of nonmarket goods and services. For example, the con-tingent valuation study performed by Loomis (2001) used both household and visitor surveys to supplement the standard pub-lic involvement process for the Snake River RMP. The results were used to quantify economic values for entire management strategies being considered by BLM’s Pinedale Field Office, an approach that ultimately helped inform the selection of the pro-posed alternative. The Loomis (2001) study was distinctive in that it estimated total economic value specific to an RMP. The more common approach is to piece together the total economic value by summing values derived from individual resources and resource uses that are expected to be affected. The Loomis (2001) approach and the piecing together approach are quite different and, although both may be useful for decisionmaking, they both have disadvantages. The piecing together approach may over count values and, if existing data are used, transfer errors are likely. The RMP-specific approach may limit the ability to transfer the information learned depending on survey design. These disadvantages may be considered when prioritiz-ing primary studies. If there is a highly contentious manage-ment plan for a specific field office that would be informed by the consideration of nonmarket values, conducting an RMP-specific analysis similar to Loomis (2001) could be worthwhile. However, if a series of primary studies are being strategically targeted, by BLM’s Socioeconomics Program for example, with the goal of obtaining transferable results that could be used across BLM sites and offices, an RMP-specific approach would not be the best approach to use.
ConclusionsThis report summarizes the results of a series of field-
based case studies conducted by the U.S. Geological Survey (USGS) to evaluate the practical use of nonmarket values in Bureau of Land Management (BLM) planning and project

24 Inclusion of Nonmarket Values in BLM Planning and Project Assessments, Final Report
assessments, update the Benefit Transfer Toolkit for measur-ing those values, and provide guidance to field staff. The four BLM pilot sites that participated in this effort include Canyons of the Ancients National Monument in Colorado, Red Cliffs and Beaver Dam Wash National Conservation Areas in Utah, the Taos Field Office in New Mexico, and the Tuscarora Field Office in Nevada. USGS worked directly with BLM field staff at each pilot site to demonstrate the process of considering nonmarket values in BLM decisionmaking and document the questions, challenges, and opportunities that arise when tying economic language to projects.
Results of this effort demonstrate that there are two main roles for nonmarket valuation in BLM planning. The first is to improve the decisionmaking process by contributing to a more comprehensive comparison of economic benefits and costs when evaluating resource tradeoffs for National Envi-ronmental Policy Act analyses. The second is to use economic language and information on economic values, either qualita-tive or quantitative, to improve the ability to communicate the economic significance of the resources provided by BLM-managed lands. In general, the managers, planners, and other field staff involved in this effort were supportive of the concept of nonmarket valuation, and field staff at each of the pilot sites identified different ways in which more information on nonmarket values would be most helpful in their planning and decisionmaking. In many cases, field staff were already aware of the nonmarket benefits associated with BLM-man-aged lands, but were not familiar with the economic concepts and terms common to the discipline. In other cases, field staff knew that resources would be affected by different manage-ment actions, but did not take the next step to tie these changes to nonmarket values. The more frequently field staff are exposed to concepts of economic valuation, the more effective they can be in using consistent and clear terminology to frame economic discussions relevant to their decisionmaking.
We also found that the use of existing economic data to quantify nonmarket values poses unique challenges because of the scarcity of both resource data and existing valuation studies focused on resources and sites managed by BLM. These chal-lenges highlight the need for improvements in the collection of resource data at BLM sites, especially visitor use data, as well as an opportunity for BLM’s Socioeconomics Program to strategically identify priority areas, in terms of both resources and geographic locations, where primary valuation studies could be conducted and the results used for future benefit transfers. Finally, a practical consideration, and one highlighted in BLM’s 2013 “Guidance on Estimating Nonmarket Environmental Val-ues,” is that it will rarely, if ever, be possible to assess all of the potential benefits and costs of a management action. Although many resources and resource uses with associated economic values could be affected, in practice, assessments of economic effects may be limited to selecting key economic activities and carefully consider the benefits and costs, including nonmarket benefits, of the proposed alternatives. In addition, focusing on differences in changes to nonmarket values between action alternatives can aid in highlighting resource tradeoffs.
References Cited
Bateman, I.J., Brouwer, R., Ferrini, S., Schaafsma, M., Barton, D.N., Dubgaard, A., Hasler, B., Hime, S., Liekens, I., Navrud, S., De Nocker, L., Ščeponavičiūtė, R., and Semėnienė, D., 2011, Making benefit transfers work—Deriving and testing principles for value transfers for similar and dissimilar sites using a case study of the non-market benefits of water quality improvements across Europe: Environmental and Resource Economics, v. 50, no. 3, p. 365–387.
Bateman, I.J., and Jones, A.P., 2003, Contrasting conventional with multi-level modeling approaches to meta-analysis—Expectation consistency in U.K. woodland recreation values: Land Economics, v. 79, no. 2, p. 235–258.
Boyd, James, and Krupnick, Alan, 2009, The definition and choice of environmental commodities for nonmarket valu-ation: Washington, D.C., Resources for the Future, Discus-sion Paper RFF-DP 09-35, 57 p.
Boyle, K.J., and Bergstrom, J.C., 1992, Benefit transfer stud-ies—Myths, pragmatism, and idealism: Water Resources Research, v. 28, no. 3, p. 657–663.
Brouwer, R., Langford, I.H., Bateman, I.J., Crowards, T.C., and Turner, R.K., 1999, A meta-analysis of wetland contin-gent valuation studies: Regional Environmental Change, v. 1, no. 1, p. 47–57.
Bureau of Land Management, 1983, Wilson Reservoir Rec-reation Area management plan: U.S. Department of the Interior, Bureau of Land Management, 104 p.
Bureau of Land Management, 1986, Proposed resource management plan and final environmental impact state-ment, Elko Resource Area: U.S. Department of the Interior, Bureau of Land Management, 85 p.
Bureau of Land Management, 1988, Recreation area manage-ment plan, Zunino/Jiggs Reservoir: U.S. Department of the Interior, Bureau of Land Management, 96 p.
Bureau of Land Management, 1999, South Fork Humboldt River interdisciplinary management plan and environmen-tal assessment: U.S. Department of the Interior, Bureau of Land Management, 176 p.
Bureau of Land Management, 2000, The Rio Grande Corridor final plan: U.S. Department of the Interior, Bureau of Land Management, BLM/NM/PL00-003-1220, 105 p.
Bureau of Land Management, 2003a, Approved Elko resource management plan wild horse amendment and decision record: U.S. Department of the Interior, Bureau of Land Management, 9 p.

References Cited 25
Bureau of Land Management, 2003b, Final environmental impact statement for the Snake River resource management plan: U.S. Department of the Interior, Bureau of Land Man-agement, accessed May 29, 2013, at http://www.blm.gov/wy/st/en/programs/Planning/rmps/SnakeRiver/feis.html.
Bureau of Land Management, 2004, King Range National Conservation Area proposed resource management plan and final environmental impact statement: U.S. Depart-ment of the Interior, Bureau of Land Management, accessed May 29, 2013, at http://www.blm.gov/ca/st/en/fo/arcata/kingrange/planning/king_range_plan.html.
Bureau of Land Management, 2005a, BLM social science guideline 2—Model scope of work for socio-economic analysis in resource management plans, Version 1.5: U.S. Department of the Interior, Bureau of Land Management, 18 p.
Bureau of Land Management, 2005b, Land use planning handbook: U.S. Department of the Interior, Bureau of Land Management, Handbook H-1601-1, 163 p.
Bureau of Land Management, 2006, Taos Valley Overlook project plan and Orilla Verde Recreation Area manage-ment plan amendment—Environmental assessment: U.S. Department of the Interior, Bureau of Land Management, NM-220-06-013, 37 p.
Bureau of Land Management, 2009a, Beaver Dam Wash National Conservation Area FY 2009 annual manager’s report: U.S. Department of the Interior, Bureau of Land Management, 8 p.
Bureau of Land Management, 2009b, National visitor use monitoring results, pilot test—Comparison of Hassayampa, Deschutes, and Taos Field Offices: U.S. Department of the Interior, Bureau of Land Management.
Bureau of Land Management, 2009c, Red Cliffs National Conservation Area FY 2009 annual manager’s report: U.S. Department of the Interior, Bureau of Land Management, 12 p.
Bureau of Land Management, 2010a, Canyons of the Ancients National Monument—Record of decision and resource management plan: U.S. Department of the Interior, Bureau of Land Management, 357 p.
Bureau of Land Management, 2010b, West Tavaputs Plateau natural gas full field development plan—Final environ-mental impact statement: U.S. Department of the Interior, Bureau of Land Management, UT-070-05-055, 58 p., accessed March 12, 2013, at http://www.oilandgasbmps.org/docs/UT37-WestTavaputsROD.pdf.
Bureau of Land Management, 2011, Proposed Taos resource management plan and final environmental impact statement: U.S. Department of the Interior, Bureau of Land Manage-ment, BLM/NM/PL-12-01-1610, 531 p., accessed March 12, 2013, at http://www.blm.gov/pgdata/etc/medialib/blm/nm/field_offices/taos/taos_planning/taos_proposed_rmp.Par.3539.File.dat/Volume%20I%20Final.pdf.
Bureau of Land Management, 2012a, Conducting wilderness characteristics inventory on BLM lands: U.S. Department of the Interior, Bureau of Land Management, 32 p., accessed May 29, 2013, at http://www.blm.gov/style/medialib/blm/co/field_offices/white_river_field/LWC.Par.28971.File.dat/6310.pdf.
Bureau of Land Management, 2012b, Environmental assess-ment for the Galisteo Basin Archaeological Sites Protection Act general management plan: U.S. Department of the Inte-rior, Bureau of Land Management, DOI-BLM-NM-F020-2012-OO30-EA, 115 p.
Bureau of Land Management, 2012c, Galisteo Basin Archaeo-logical Sites Protection Act general management plan: U.S. Department of the Interior, Bureau of Land Management, 125 p.
Bureau of Land Management, 2012d, Socioeconomic baseline report for the resource management plans for the Beaver Dam and Red Cliffs National Conservation Areas and the amendment to the St. George Field Office resource man-agement plan and the associated environmental impact statement: U.S. Department of the Interior, Bureau of Land Management, 110 p.
Bureau of Land Management, 2012e, Taos resource manage-ment plan: U.S. Department of the Interior, Bureau of Land Management, BLM/NM/PL-12-09-1610, 209 p.
Bureau of Land Management, 2013a, Guidance on estimating nonmarket environmental values: U.S. Department of the Interior, Bureau of Land Management, BLM Instruction Memorandum No. 2013-131, 1 p., accessed September 12, 2013, at http://www.blm.gov/wo/st/en/info/regulations/Instruction_Memos_and_Bulletins/national_instruc-tion/2013/IM_2013-131__Ch1.print.html.
Bureau of Land Management, 2013b, Canyons of the Ancients National Monument—History and process: U.S. Depart-ment of the Interior, Bureau of Land Management, 1 p., accessed August 9, 2013, at http://www.blm.gov/co/st/en/nm/canm/canm_background0.print.html#history.
Bureau of Land Management, 2013c, Proposed Sabinoso Wil-derness management plan and environmental assessment: U.S. Department of the Interior, Bureau of Land Manage-ment, DOI-BLM-NM-F020-2012-0003, 45 p.

26 Inclusion of Nonmarket Values in BLM Planning and Project Assessments, Final Report
Bureau of Land Management, 2013d, Rio Grande del Norte National Monument: U.S. Department of the Interior, Bureau of Land Management, 1 p., accessed September 9, 2013, at http://www.blm.gov/nm/st/en/prog/blm_special_areas/national_monuments/rio_grande_del_norte.html.
Bureau of Land Management, 2013e, Rio Grande del Norte National Monument factsheet: U.S. Department of the Inte-rior, Bureau of Land Management, 2 p., accessed September 9, 2013, at http://www.blm.gov/pgdata/etc/medialib/blm/nm/programs/blm_special_areas/national_monuments/rio_grande_del_norte.Par.56248.File.dat/RGDN%20Fact%20SheetFeb23-FINAL%20WO%20approved.pdf.
Champ, P.A., Boyle, K.J., and Brown, T.C., eds., 2003, A primer on nonmarket valuation—The economics of non-market goods and resources: Dordrecht, Netherlands, Kluwer Academic Publishers, 576 p.
Colorado Parks and Wildlife, 2013, McElmo–Natural Areas Information: Colorado Parks and Wildlife, accessed August 28, 2013, at http://cpw.state.co.us/aboutus/Pages/CNAP-Info.aspx.
Cordell, H.K., Bergstrom, J.C., and Bowker, J.M., 2005, The multiple values of wilderness: State College, Pa., Venture Publishing, p. 1–6.
Culver, N., and Slivka, J., 2011, Scoping comments—Battle Mountain resource management plan revision: Wilder-ness Society, 46 p., accessed September 9, 2013, at http://wilderness.org/files/Battle%20Mountain%20RMP%20%20TWS%20Scoping%20Comments.pdf.
Elko Convention & Visitors Authority, 2014, Off highway vehicle trails: Elko Convention & Visitors Authority, accessed September 11, 2013, at http://www.exploreelko.com/recreation/summer/off_highway_vehicle_trials.php.
Freeman III, A.M., 2003, Economic valuation—What and why, in Champ, P.A., Boyle, K.J., and Brown, T.C., eds., A primer on nonmarket valuation—The economics of non-market goods and resources: Dordrecht, Netherlands, Kluwer Academic Publishers, p. 1–26.
Hanceford, P., Bahr, S., Skroch, M., Tuell, C., and Meachum, C., 2011, Draft resource management plan and environmen-tal impact statement for the Lower Sonoran Field Office and the Sonoran Desert National Monument: Wilderness Society, Sierra Club, Arizona Wilderness Coalition, Center for Biological Diversity, and Friends of Saddle Mountain, accessed September 9, 2013, at http://wilderness.org/sites/default/files/SDNM%20LSFO%20Draft%20RMP%20Com-ments.pdf.
Johnston, R.J., Besedin, E.Y., Iovanna, R., Miller, C.J., Wardwell, R.F., and Ranson, M.H., 2005, Systematic varia-tion in willingness to pay for aquatic resource improvements and implications for benefit transfer—A meta-analysis: Cana-dian Journal of Agricultural Economics, v. 53, p. 221–248.
Johnston, R.J., Ranson, M.H., Besedin, E.Y., and Helm, E.C., 2006, What determines willingness to pay per fish?—A meta-analysis of recreational fishing values: Marine Resource Economics, v. 21, no. 1, p. 1–32.
Johnston, R.J., and Thomassin, P.J., 2010, Willingness to pay for water quality improvements in the United States and Canada—Considering possibilities for international meta-analysis and benefit transfer: Agricultural and Resource Economics Review, v. 39, no. 1, p. 114–131.
Loomis, J.B., 1984, Economic efficiency vs. distributive equity—BLM’s use of economic analysis in fact and fiction: Western Journal of Agricultural Economics, v. 9, no. 1, p. 207–213.
Loomis, J.B., 2000, Economic values of wilderness recreation and passive use—What we think we know at the beginning of the 21st century, in Proceedings of the Wilderness Sci-ence in a Time of Change Conference, Volume 2—Wilder-ness within the context of larger systems, Missoula, Mont., 1999: Ogden, Utah, U.S. Department of Agriculture, Forest Service, Rocky Mountain Research Station, p. 23–27.
Loomis, J.B., 2001, Final Snake River contingent value methodology study report: Bureau of Land Management Wyoming State Office, 55 p., accessed June 27, 2013, at http://www.blm.gov/wy/st/en/programs/Planning/rmps/SnakeRiver/feis.html.
Loomis, J.B., 2002, Integrated public lands management—Principles and applications to national forests, parks, wild-life refuges, and BLM lands, (2d ed.): New York, Columbia University Press, 594 p.
Loomis, J.B., 2006, Estimating recreation use, expenditures and economic benefits at Little Snake River Resource Area using visitor data and travel cost method: Colorado State Univer-sity, Department of Agricultural and Resource Economics.
Loomis, J.B., Doyle, W., Goldhor-Wilcock, A., and Allen, R., 2005, Estimating recreation benefits at selected BLM recreation sites using the travel cost method and testing for transferability between BLM recreation sites: Colorado State University, Department of Agricultural and Resource Economics.
Musgrave, R., 1959, The theory of public finance—A study in public economy: New York, McGraw-Hill, 628 p.
National Research Council, 2013, Using science to improve the BLM Wild Horse and Burro Program—A way forward: Washington, D.C., The National Academies Press, 384 p.
Nevada Department of Wildlife, 2013, Greater sage-grouse hab-itat categorization revised white paper: Nevada Department of Wildlife, 9 p., accessed March 18, 2014, at http://www.ndow.org/uploadedFiles/ndoworg/Content/Nevada_Wildlife/Sage_Grouse/Sage-Grouse-Habitat-Categorization.pdf.
References Cited 27
Pope, C.A., and Jones, J.W., 1990, Value of wilderness desig-nation in Utah: Journal of Environmental Management, v. 30, no. 2, p. 157–174.
Pratt, Zachary; Anderson, Ayla; Moore, Jeffrey; and Potts, Blaine, 2013, Condition of roads, ways, and primitive routes in Tuscarora Field Office Wilderness Study Areas: Depart-ment of the Interior, Bureau of Land Management, 192 p.
Richards, M.T., King, D.A., Daniel, T.C., and Brown, T.C., 1990, The lack of an expected relationship between travel cost and contingent value estimates of forest recreation value: Leisure Sciences, v. 12, no. 3, p. 303.
Richardson, Leslie, and Loomis, J.B., 2009, The total eco-nomic value of threatened, endangered and rare species—An updated meta-analysis: Ecological Economics, v. 68, no. 5, p. 1535–1548.
Rosenberger, R.S., and Loomis, J.B., 2000, Using meta-analysis for benefit transfer—In-sample convergent validity tests of an outdoor recreation database: Water Resources Research, v. 36, no. 4, p. 1097–1107.
Rosenberger, R.S., and Loomis, J.B., 2001, Benefit transfer of outdoor recreation use studies—A technical document sup-porting the Forest Service Strategic Plan (2000 revision): USDA Forest Service, Rocky Mountain Research Station, General Technical Report RMRS-GTR-72, 59 p.
Rosenberger, R.S., and Loomis, J.B., 2003, Benefit transfer, in Champ, P.A., Boyle, K.J., and Brown, T.C., eds., A primer on nonmarket valuation—The economics of non-market goods and resources: Dordrecht, Netherlands, Kluwer Aca-demic Publishers, p. 395–444.
Sedjo, R.A., 1999, Marion Clawson’s contribution to forestry: Washington, D.C., Resources for the Future, Discussion Paper 99-33, 11 p.
U.S. Environmental Protection Agency, 2008, Transmittal letter and detailed comments on the BLM western Oregon plan revision draft environmental impact statement: EPA Region 10, Ref: 91-0079-BLM, 28 p., accessed March 20, 2014, at http://www.blm.gov/or/plans/wopr/files/EPA_Comments.pdf.
Washington County HCP Administration, 2000, Red Cliffs Desert Reserve Public Use Plan: Washington County Com-mission, 65 p., accessed August 8, 2016, at http://www.redcliffsdesertreserve.com/wp-content/uploads/2006/02/PUP-Final.pdf.
Wilderness Society; Colorado Environmental Coalition; Center for Native Ecosystems; Colorado Mountain Club; National Wildlife Federation; Biodiversity Conservation Alliance; Natural Resources Defense Council; American Rivers; Rocky Mountain Recreation Initiative; Wilderness Workshop; Great Old Broads for Wilderness; High Country Citizens’ Alliance; Southern Rockies Ecosystem Project; Center for Water Advocacy; Sierra Club, Rocky Mountain Chapter; Colorado Wild; Western Colorado Congress; San Juan Citizens Alliance, 2008, Comments on the BLM Little Snake draft resource management plan/environmen-tal impact statement: Wilderness Society, 132 p., accessed March 20, 2014, at http://wilderness.org/sites/default/files/Little-Snake-Field-Office-Draft-RMP-Comments.pdf.
Wilson, M.A., and Hoehn, J.P., eds., 2006, Environmental ben-efits transfer—Methods, applications and new directions—Benefits transfer special issue: Ecological Economics, v. 60, no. 2, p. 335–482.
28 Inclusion of Nonmarket Values in BLM Planning and Project Assessments, Final Report
Appendix 1. Correspondence Used in Pilot Site Selection—Example From the Red Cliffs and Beaver Dam Wash National Conservation Areas
How Will Participating as a Pilot Site Benefit You?
By considering the range of nonmarket values associated with the Red Cliffs NCA [National Conservation Area], a more holistic picture of the economic implications of resource trad-eoffs can be established for staff and planners. Using existing data and benefit transfer methods, the nonmarket values held by the public for some of the resource uses and environmental and ecosystem services provided by the NCA can be estimated and potentially incorporated into projects. For instance, it may be possible to use information from existing studies to mon-etize the value of hiking, mountain biking, backpacking, rock climbing, wildlife viewing, and various hunting opportunities. Existing data can potentially be used to estimate the value held for the threatened Mojave Desert Tortoise and general ter-restrial habitats. It may not be possible to estimate nonmarket values for several of the resources provided by the Red Cliffs NCA in this pilot study. Specifically, the nonmarket values of paleontological and archaeological resources will not be estimated given the lack of existing data and uniqueness of the sites. However, values from these resources can still be quali-tatively described in how they relate to the preservation of Red Cliffs NCA. This same qualitative description can be used in describing the existence values associated with the NCA at a more broadly defined societal level given the uniqueness of the geology and biology found here.
In addition to monetizing nonmarket values to inform the projects for Red Cliffs NCA, another goal of this project is to familiarize your staff with the whole process of non-market valuation, including some of the economic concepts, guidelines, and challenges that underlie it. In addition, we will coordinate with your staff to document this process, including both the successes and challenges that arise when estimating and incorporating nonmarket values in planning and decision-making. This information will be used to help BLM improve its guidance for nonmarket valuation throughout the agency, guidance that can continue to be used by the staff at your office and many others.
We recognize that the St. George Field office will be simultaneously conducting projects for other parts of their management area (i.e. Beaver Dam Wash NCA). It is antici-pated that the nonmarket values estimated for Red Cliffs NCA, and the process used to arrive at those values, can be used to inform related projects taking place in nearby areas, given the similarity of several resource uses (i.e. protected wilderness, threatened and endangered species populations, and hunting).
This information can also be used to inform the development of recreation facilities and trails being proposed in the Beaver Dam Wash NCA Management Plan.
What is the Time Commitment?We understand the major constraints on staff availability
at the moment, but are confident that the benefits of participat-ing as a pilot site will outweigh the costs associated with com-mitting staff time. If you decide to participate, we would first need to coordinate with the staff at your office over the next few months and have them provide planning documents and information to familiarize us with the resource uses, environ-mental and ecosystem services, and planning issues specific to Red Cliffs NCA. We would like to use this time to engage your staff and allow them to communicate what they view as some of the nonmarket benefits associated with Red Cliffs NCA. This will allow us to document the iterative process of framing information for nonmarket valuation. This exercise will require a few conference calls and/or Webinars.
Next, we will identify resource specialists that can pro-vide us with data and feedback on how certain resource uses and ecosystem services are expected to change with different management alternatives, doing our best to fit into the RMP’s [resource management plan’s] schedule. This will involve a series of conference calls, and could require a total of 1-3 days of certain resource specialist’s time, most likely spread out over the course of a few months. Lastly, there would be an in-person meeting where we would work with your staff to demonstrate how an existing Web-based toolkit can be used to estimate nonmarket values. This exercise would require about one full-day or two half-days of staff time, with some potential follow-up through Webinars or phone calls.

Appendix 2 29
Appendix 2. Review of Nonmarket Valuation Studies Focused on Cultural, Archaeological, and Historic Sites
IntroductionThere is very little existing literature quantifying the
nonmarket value of archeological sites in the United States. This is consistent with the findings of past literature reviews on this topic. In this document, we summarize the few studies that have quantified these values, as well as those studies that have quantified the value of other cultural and historic sites in the United States and those that have valued archeological and other cultural and historic sites internationally.
Because archeological sites are unique and location specific and there are so few existing studies valuing such sites in the United States, as of 2016, benefit transfer is not a reliable method to quantify the nonmarket economic benefits provided by Bureau of Land Management (BLM) archeologi-cal sites in general. There are not enough studies to create a database, or estimate a meta-regression function to facilitate benefit function transfers, in the Benefit Transfer Toolkit. That said, the Loomis and others (2005) study, which is described in greater detail in the “Summary of Nonmarket Valuation Studies” section of this report, does monetize the benefits of recreational opportunities associated with a few cultural BLM sites, including Canyons of the Ancients National Monument, the Anasazi Heritage Center, and Yaquina Head Lighthouse. The average per person per trip value of $19 reported in this study could be used as an estimate of the benefits of recre-ational opportunities provided by the cultural sites of Canyons of the Ancients National Monument and the Anasazi Heritage Center. In Loomis and others (2005), the authors note that the existing literature provides almost no benefit estimates for cultural sites. Unfortunately, Loomis and others (2005) is the only study identified in our literature review that could be used for benefit transfer purposes in this context.
Therefore, Canyons of the Ancients National Monument and other BLM land units where cultural and archaeological sites provide the majority of nonmarket benefits may not be a good choice for pilot study locations for this nonmarket valua-tion project. Additional original studies applying survey-based methods, such as the travel cost method or contingent valua-tion method, need to be conducted before the benefit transfer method (that is, the use of existing data) can be used as a fea-sible approach to monetize nonmarket values associated with these sites. As a less expensive alternative to survey-based methods, researchers could potentially use existing BLM data to estimate a zonal travel cost model to quantify the benefits of recreational opportunities associated with primarily cultural/archeological sites. However, that approach is beyond the scope of this study.
Summary of Nonmarket Valuation Studies
Boxall, P.C., Englin, Jeffrey, and Adamowicz, W.L., 2003,Valuing aboriginal artifacts—A combined revealed-stated preference approach: Journal of Environmental Economics and Management, v. 45, no. 2, p. 213–230.
This paper examines the value of unique aboriginal cultural resources using joint revealed and stated preference methods. The empirical application involves the discovery of aboriginal rock paintings along wilderness canoe routes in eastern Manitoba, Canada. This study of wilderness recreational trips questioned canoeists to see if they would change their site choices in response to the presence of either pristine or degraded rock paintings. The mean willingness to pay (WTP) for the presence of pristine paintings on two different canoe routes were approximately $61 and $77 per trip, respectively. Results also showed that vandalized pictographs were valued substantially less than non-damaged pictographs.
Chambers, C.M., Chambers, P.E., and Whitehead, J.C., 1998, Contingent valuation of quasi-public goods—Validity, reliability, and application to valuing an his-toric site: Public Finance Review, v. 26, p. 137–154.
This paper uses the contingent valuation method to estimate the WTP to preserve the historic Ste. Genevieve Academy in Missouri. Results indicate that the Academy has a nonmarket economic benefit ranging from $860,000 to $1,100,000 to Missouri residents.
Kling, R.W., Revier, C.F., and Sable, K., 2004, Estimat-ing the public good value of preserving a local historic landmark—The role of non-substitutability and citizen information: Urban Studies, v. 41, no. 10, p. 2025–2041.
The contingent valuation method is used to estimate the WTP to restore and preserve the historic North-ern Hotel in Fort Collins, Colorado. Results show town residents are willing to pay a higher amount than the outlay of costs required for the hotel’s reha-bilitation project. Thus, the restoration project was shown to be economically rational.
Appendix 2
30 Inclusion of Nonmarket Values in BLM Planning and Project Assessments, Final Report
Loomis, J., Doyle, W., Goldhor-Wilcock, A., and Allen, R., 2005, Estimating recreation benefits at selected BLM recreation sites using the travel cost method and testing for transferability between BLM recreation sites: Colo-rado State University, Department of Agricultural and Resource Economics, Working Paper.
This study used visitor data from select BLM sites and a travel cost model to estimate the benefits of recreational opportunities. The researchers collected survey data through a “simple systematic sample of recreation users” at each recreational site, includ-ing the Anasazi Heritage Center and Canyons of the Ancients National Monument. These two sites are independent of one another, but the researchers decided to group their data for the analysis because visitors often visit both sites on the same trip because of their proximity. Their results estimated an average benefit of $19 per person per visit for the Anasazi Heritage Center and Canyons of the Ancients National Monument. Of the 250 usable surveys, 66 percent of respondents said that educa-tion was the primary recreational activity and 56 percent said sightseeing was the secondary activ-ity. For the two combined sites, the estimated total visitor use was 120,650 per year, resulting in an estimated total annual benefit of $2.3 million.
Melstrom, R.T., 2014, Valuing historic battlefields—An application of the travel cost method to three American Civil War battlefields: Journal of Cultural Economics, v. 1, no. 14, p. 223–236.
Visitor trip data gathered from the Visitor Services Project at the University of Idaho’s Park Studies Unit were used to estimate the consumer surplus (that is, the net willingness to pay) of visiting three American Civil War battle sites. Using visitor count data, Melstrom (2014) employs the travel cost method to estimate individual willingness to pay per trip to Stones River National Battlefield, Monocacy National Battlefield, and Fort Donelson National Military Park to be $25, $8, and $9, respectively.
Mourato, Susana; Ozdemiroglu, Ece; Hett, Tannis; and Atkinson, Giles, 2004, Pricing cultural heritage—A new approach to managing ancient resources: World Eco-nomics, v. 5, no., 3, p. 95–113.
This study used a payment card to estimate the visitation values for access to Machu Picchu Citadel and the Inca Trail. Results found a mean WTP per visitor for access to the Citadel and the Inca Trail to be approximately $40 and $56, respectively.
Navrud, Ståle, and Ready, R.C., eds., 2002, Valuing cul-tural heritage—Applying environmental valuating tech-niques to historic buildings, monuments and artifacts: Cheltenham, United Kingdom, Edward Elgar, 280 p.
A brief overview of the methods available to esti-mate the nonmarket values of cultural and heritage goods and services is first presented in this book. This introduction is followed by 12 valuation case studies, which include cathedrals in Europe, Stone-henge, Roman archaeological sites, pictographs in Canada, and reduced acid deposition to marble monuments in Washington, D.C.
Noonan, D.S., 2003, Contingent valuation and cultural resources—A meta-analytic review of the literature: Journal of Cultural Economics, v. 27, n. 3, p.159–176.
This paper compiles and analyzes cultural valuation studies that were performed prior to 2002. Although this paper presents the results of a meta-analysis of the cultural valuation literature, the author of the paper strongly cautions against the use of the meta-function as a means to conduct a benefit transfer (see pg. 164 for a detailed explanation). Ultimately, this paper provides foundational background on the literature and methods used in valuing cultural resources up to 2002.
Poor, P.J., and Smith, J.M., 2004, Travel cost of a cultural heritage site—The case of historic St. Mary’s City of Maryland: Journal of Cultural Economics, v. 28, no. 3, p. 219–229.
The travel cost method is used to estimate the benefits derived from visiting St. Mary’s City in Maryland. This National Historic Landmark consists of more than 200 archaeological sites dating from the 17th century colonial era. They estimated the use value for this site to range from $8 to $19 per visitor per day.
Provins, Allan; Pearce, David; Ozdemiroglu, Ece; Mou-rato, Susana; and Morse-Jones, Sian, 2008, Valuation of the historic environment—The scope for using economic valuation evidence in the appraisal of heritage-related projects: Progress in Planning, v. 69, n. 4, p. 131–175.
This paper provides an overview of what methods are used to estimate the nonmarket values of cultural goods and services. This paper goes into substantial detail outlining the methods to estimate nonmar-ket values using the benefit transfer method. After providing a current account of the literature related to cultural goods and services valuation, Provins and others (2008) demonstrate the use of the benefit transfer method to estimate the nonmarket values of restoring a small historic town in north Wales. The authors conclude the paper by discussing the limita-tions of the benefit transfer method with respect to estimating the values of cultural and heritage goods. The authors identify two complications when considering the use of benefit transfer in the context

Appendix 2 31
of valuing cultural resources: 1) such resources are highly heterogeneous due to contextual factors, historical significance, and overall uniqueness; and 2) there is a limited pool of existing studies to draw value estimates from for the analysis. Gen-eral recommendations argue for the inclusion of at least a qualitative discussion of nonmarket values, particularly with respect to passive use or nonuse values, for cultural and heritage goods when unable to quantify such values.
Riganti, Patrizia, and Scarpa, Riccardo, 1998, Categorical nesting and information effects of WTP estimates for the conservation of cultural heritage in Campi Flegei, in Bishop, R.C., and Romana, D., eds., Environmental resource valuation—Applications of the contingent valu-ation methods in Italy: Boston, Springer US, p. 246–259.
This study estimated the value of conserving Campi Flegei archaeological park in Napoli, Italy, using a dichotomous choice contingent valuation method format. They found that residents had a mean WTP of $29 per person per year to protect and conserve the archaeological park.
Rolfe, John, and Windle, Jill, 2003, Valuing the protection of aboriginal cultural heritage sites: Economic Record, v. 79, Special Issue, p. S85–S95.
This study assesses values held for protect-ing Aboriginal cultural heritage sites in central Queensland, Australia. A choice experiment method was employed to estimate nonuse values for protect-ing cultural heritage sites facing water resource allo-cation decisions and irrigation development. Results suggest that there may be substantial differences between indigenous and general population groups for the preferred management of balancing environ-mental and cultural resources.
Whitehead, J.C., and Finney, S.S., 2003, Willingness to pay for submerged maritime cultural resources: Journal of Cultural Economics, v. 27, no. 3-4, p. 231–240.
This paper considers the nonmarket values gener-ated by shipwrecks as submerged maritime cultural resources off the coast of North Carolina. Specifi-cally, this paper estimates how much visitors are willing to pay to maintain shipwrecks in their pris-tine state. This study finds that households are will-ing to pay approximately $35 as a one-time increase in State taxes for their preservation.
Appendix 2
32 Inclusion of Nonmarket Values in BLM Planning and Project Assessments, Final Report
Appendix 3. Nonmarket Values Associated With Each Pilot Site
Motivations and ObjectivesLands managed by the Bureau of Land Management
(BLM) contain a wide range of natural resources. Some of these resources are actively used, such as minerals for energy generation or manufacturing, grasslands for livestock graz-ing, and water bodies and trails for recreation. Other resources provide environmental services, such as habitat for wildlife, marshes for flood control, and forests for air purification. Public ownership of natural resources assigns the Federal Government responsibility for managing these resources in the best interest of the American public. However, resource management and allocation decisions under the principles of multiple use and sustained yield can prove to be difficult when varying uses or interests compete during the planning process. For example, managing mineral extraction and timber harvest-ing alongside habitat preservation and recreation on adjacent or the same land units can be challenging.
The consideration of economic impacts and values is an important tool that can be used to evaluate resource tradeoffs for BLM-managed lands. Historically, the role of economics in BLM projects has generally focused on the market impacts of resource uses (such as mineral extraction, livestock graz-ing, timber production, and recreation). However, these market impacts do not reflect all of the values that members of the public hold for all resource uses and environmental services. Nonmarket environmental values (or simply, nonmarket values) reveal the benefits individuals attribute to outdoor experiences, uses of natural resources, or the existence of particular eco-logical conditions that do not involve traditionally understood market transactions and, therefore, lack prices.3 A concern raised in reviews of BLM’s resource management plans (RMPs) by various nonprofit organizations, academic institutions, and other federal agencies, has been the omission of nonmarket values in the planning process (see Loomis, 1984; U.S. Environmental Protection Agency, 2008;Wilderness Society and others, 2008; Culver and Slivka, 2011; Hanceford and others, 2011). The consideration of nonmarket values could lead to more informed
3Note that confusion can arise regarding the difference between ecosystem service values and nonmarket values. A recently released BLM instruction memorandum explains that “Ecosystem goods and services include a range of human benefits resulting from appropriate ecosystem structure and function, such as flood control from intact wetlands and carbon sequestration from healthy forests. Some involve commodities sold in markets, for example, timber production. Others, such as wetlands protection and carbon sequestra-tion, do not commonly involve markets, and thus reflect nonmarket values” (Bureau of Land Management, 2013a, p. 2). There is a link between these two concepts in that nonmarket values are captured within the ecosystem goods and services framework, but evaluating nonmarket values does not require an ecosystem services approach.
decisionmaking by creating a more holistic picture of the eco-nomic implications of resource tradeoffs.
One of the goals of this pilot study is to create a dialogue between BLM field staff and economists at the U.S. Geological Survey (USGS) and Colorado State University to document the process of identifying, communicating, and possibly quantifying nonmarket economic values associated with the natural resources that BLM is tasked with managing. The approach that will best suit this process is iterative in nature in that concepts will first be presented, discussion and clarification will follow, and ultimately the team will narrow in on terminology that will be useful in the current collaborative USGS–BLM pilot project. Project office staff are encouraged to ask questions, collaborate on developing appropriate terminology, and flag topics and terminology that are not clear. It is hoped that this will in turn ignite a conversation to identify and clarify how nonmarket valuation can be used in describing and monetizing the natural resources that BLM field offices are tasked with managing. Ideally, BLM will provide the terminology developed, lessons learned, and limitations identified in this pilot project to other BLM field offices to use as a guide in their respective planning processes. Simply put, the objective is to develop terminology that is both consistent within the field of nonmarket valuation and that is useful for field staff when con-sidering the nonmarket values associated with their planning pro-cesses. The purpose of this current document is to introduce BLM field office staff to some of the economic concepts and terms that are regularly used in the nonmarket valuation literature.
Nonmarket ValuationNonmarket values associated with BLM-managed lands
exist for a variety of reasons. Some goods and services provided by BLM-managed lands have characteristics that make it difficult for them to be traded on private markets, meaning their value is not reflected in the marketplace. Examples include wildlife habi-tat, wilderness areas, pristine view sheds, and starry night skies. Sometimes an activity that takes place on these lands imposes an external cost or benefit on members of society that is not accounted for in the market price of that activity. For example, air pollution from oil and gas development may negatively impact public health in nearby communities but this external cost is not reflected in the market price of oil and gas. Nonmarket values exist because there are resource uses and environmental services provided by BLM-managed lands with economic values that, for one reason or another, are not fully reflected by market prices.
Accounting for the full range of economic values, both market and nonmarket, associated with the management of BLM-managed lands can lead to more informed and efficient decisions. From an economic standpoint, the concept of efficiency has to do
Appendix 3 33
with maximizing the total benefits received by the public. One often cited role of government is to promote economic efficiency in the use of resources to obtain maximal benefit for society (Mus-grave, 1959), thus providing a major economic rationale for con-tinued public land ownership. Nonmarket valuation is discussed in several BLM documents (Bureau of Land Management, 2005a, b), and an updated BLM instruction memorandum that provides guidance on estimating nonmarket values was recently released (Bureau of Land Management, 2013a). Included in this memoran-dum is a discussion of how information on nonmarket values can support resource management decisions within BLM.
Nonmarket values capture a wide range of benefits or costs, including those associated with the direct use of a resource (for example, the benefits received from hiking in a wilderness), as well as those associated with indirect uses of a resource (for example, flood prevention provided by a wetland). These are collectively referred to as “use values.” Nonmarket values also include what are referred to as “passive use values,” or “nonuse values,” which include the benefits provided by leaving a natural resource in a particular condition for future generations (bequest value) or the benefits provided by know-ing that a resource exists in a particular condition (existence value). Not all nonmarket values are associated with the natural environment. For example, some members of the public may value archaeological, cultural, and historic sites found on BLM-managed lands (Bureau of Land Management, 2013a).
While nonmarket values are just as real and important to consider as market values, they can be difficult to estimate. One challenge that arises when attempting to estimate the nonmarket values associated with a particular BLM-managed land unit or resource has to do with the spatial variation of the person who is demanding and valuing the resource. With market goods, a relatively clear chain between the supplier and consumer exists. However, as illustrated in the “Nonmarket Values Associated with the Canyons of the Ancients National Monument” section of this report, the consumption of a nonmarket good or service might be through direct use, indirect use, or passive use. As a result, there are more decisions to make regarding the public’s interest in an analysis of nonmarket values compared to an analysis of market values. It is anticipated that many of the challenges associated with estimating nonmarket values will be discussed throughout this pilot study. Again, the purpose of the study is to introduce the concepts of nonmarket valuation as they relate to BLM land units and resources in particular.
Nonmarket Values Associated With the Canyons of the Ancients National Monument
Table 3-1 summarizes the resources and uses that are man-aged by the Bureau of Land Management (BLM) at Canyons of the Ancients National Monument (Monument). The list of resources and uses is not exhaustive, and may require updating with the help of BLM staff. Within table 3-1, the U.S. Geological Survey has identified whether the resource or use reflects a use value or passive use value, and thus helps distinguish between the two broad categories of nonmarket values. Table 3-1 also
contains an “Importance in project(s)” section, which, through a nonmarket economic lens, attempts to describe both the “Mag-nitude of value” and the “Risk/vulnerability/sensitivity” of the value. The “Magnitude of value” column shows an initial attempt to identify the relative size of potential nonmarket values (that is, the importance of the resource to the land unit), while “Risk/vul-nerability/sensitivity” is a placeholder that will be used to indicate the likelihood of changes to the nonmarket value from manage-ment decisions or changes to the resource. Both elements in the “Importance in project(s)” section are meant to spur discussion, and assistance from BLM field staff will be needed to complete the section fully.
The Monument encompasses 178,000 acres of BLM-managed lands in the Four Corners region of southwestern Colorado (Bureau of Land Management, 2010a). This land-scape lies within the Colorado Plateau Province and exhibits the varied topography, geology, soil, flora, and fauna of the region. The Monument is managed by BLM as part of the National Conservation Lands program, which is intended to protect cultural and natural assets at the landscape level instead of as fragmented and isolated parcels of land.
The Monument contains three wilderness study areas (WSAs) totaling 25,549 acres and another 5,223 acres managed as land with wilderness characteristics. The three WSAs and the areas with wilderness characteristics provide opportunities for members of the public who hold use values for solitude, natural quiet, and primitive recreational experiences. Other individuals may place a use value on wildlife viewing, educational oppor-tunities, and opportunities for exploration within these areas. Nonmarket passive use values may be held by some people for the wilderness areas and areas with wilderness characteristics, namely existence values (value in knowing the areas will exist in a particular condition) and bequest values (value from know-ing the areas will exist for future generations).
Many nonmarket values may be derived from habitat and the various species found in the Monument. The vegeta-tion communities in the Monument include desert scrub, salt desert, riparian zones, pinyon-juniper woodlands, mountain shrub, and sagebrush. Important habitat can be found for the Mesa Verde nightsnake (Hypsiglena torquata loreala), long-nosed leopard lizard (Gambelia wislizenii), twin-spotted spiny lizard (Sceloporus magister bimaculosus), peregrine falcons (Falco peregrinus), golden eagles (Aquila chrysaetos), American kestrels (Falco sparverius), northern harriers (Cir-cus cyaneus), and red-tailed hawks (Buteo jamaicensis). Other species include black bear (Ursus americanus), mountain lion (Puma concolor), elk (Cervus canadensis), deer, rabbits, squir-rels, bats, and foxes. The 427-acre McElmo Research Natural Area has been referred to as a “hotspot” of snake, lizard, and amphibian biodiversity (Colorado Parks and Wildlife, 2013). Populations of these various species contribute to use values some people hold for recreational opportunities such as hunt-ing, wildlife viewing, educational experiences, and research. Nonmarket passive use values may be derived by some people from the protection and preservation of important habitat for threatened, endangered, and BLM-sensitive species, such
Appendix 3

34 Inclusion of Nonmarket Values in BLM Planning and Project Assessments, Final Report
Table 3-1. Identifying resources with nonmarket values at the Canyons of the Ancients National Monument.
[WSA, Wilderness Study Area; BLM, Bureau of Land Management]
Canyons of the Ancients National Monument
Importance in project(s)
Resources and uses1 Use valuesPassive use
valuesMagnitude of
value2
Risk/ vulnerability/
sensitivity3
Threatened, endangered, and rare species–Mexican spotted owl, bald eagles, southwestern willow flycatcher, Gunnison sage-grouse
● High
Plant communities–Desert scrub, salt desert, ripar-ian zones, pinyon-juniper woodlands, mountain shrub, sagebrush
● High
Wildlife–Mesa Verde nightsnake, long-nosed leopard lizard, twin-spotted spiny lizard, per-egrine falcons, golden eagles, American kestrels, northern harriers, red-tailed hawks, black bear, mountain lion, elk, deer, rabbits, squirrels, bats, foxes, snakes, lizards, amphibians
● Moderate
Geological–Located in the Paradox Basin, and mostly contains sedimentary rocks from the Cretaceous age; some rock date from the Jurassic age, geological formations
● Low
Wilderness study areas and areas with wilderness characteristics–Three WSAs totaling 25,549 acres; 5,223 additional acres are managed as hav-ing wilderness characteristics
● Moderate
Recreation–Primitive wilderness experiences, hik-ing, photography, viewing archaeological sites, horseback riding, backpacking, wildlife viewing, exploring, rock climbing, campfires, hunting
● Moderate
Archaeological–More than 6,355 recorded sites, but could be upwards of 30,000 sites in total; villages, kivas, cliffs dwellings, petroglyphs, artifacts from the Northern Ancestral Puebloan culture, Anasazi Heritage Center, Lowry Pueblo
● High
Paleontological–Dinosaur tracks and fossils ● LowEducation and research–Ecological, wildlife, plants,
paleontological, archaeological, geological ● Moderate to High
Biomass utilization–Collection of special forest products, pinyon pine nut collection ● Low
1List of resources and uses is not exhaustive and may require input from BLM staff.2Anticipated or expected size of associated nonmarket value (that is, high, moderate, or low).3Likelihood of changes to nonmarket value from management decisions or by changes in the resource; this information will be populated later with
the assistance of BLM resource specialists.
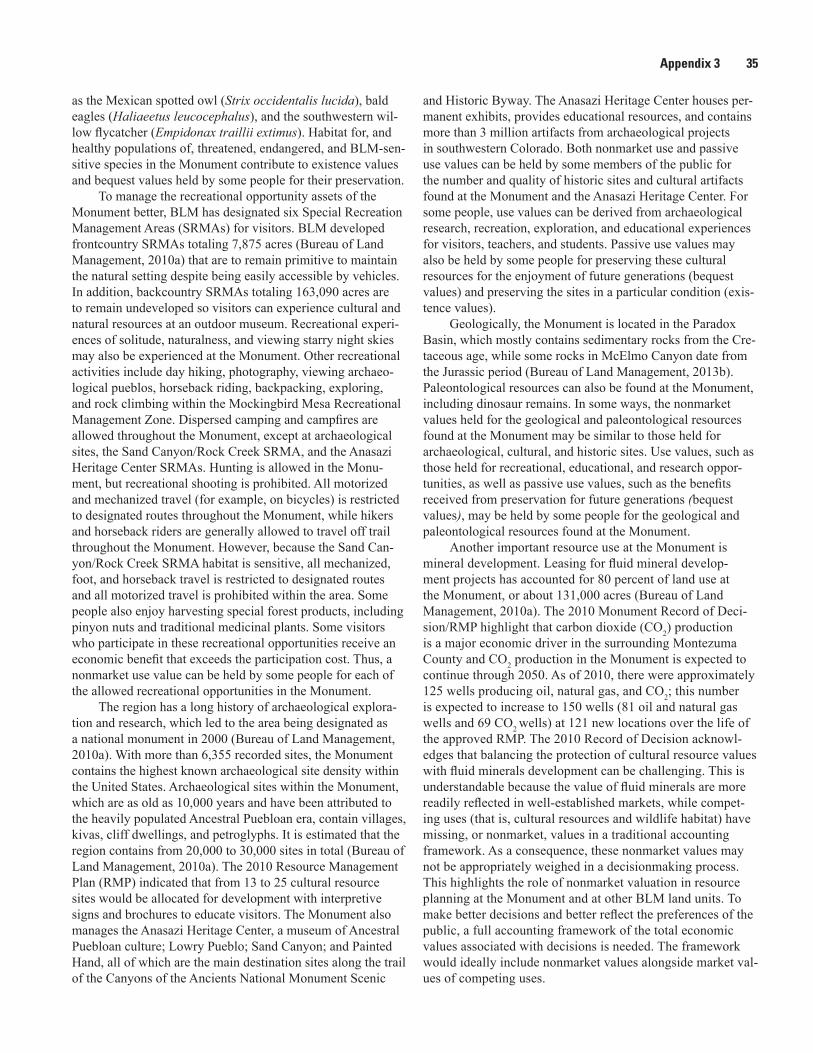
Appendix 3 35
as the Mexican spotted owl (Strix occidentalis lucida), bald eagles (Haliaeetus leucocephalus), and the southwestern wil-low flycatcher (Empidonax traillii extimus). Habitat for, and healthy populations of, threatened, endangered, and BLM-sen-sitive species in the Monument contribute to existence values and bequest values held by some people for their preservation.
To manage the recreational opportunity assets of the Monument better, BLM has designated six Special Recreation Management Areas (SRMAs) for visitors. BLM developed frontcountry SRMAs totaling 7,875 acres (Bureau of Land Management, 2010a) that are to remain primitive to maintain the natural setting despite being easily accessible by vehicles. In addition, backcountry SRMAs totaling 163,090 acres are to remain undeveloped so visitors can experience cultural and natural resources at an outdoor museum. Recreational experi-ences of solitude, naturalness, and viewing starry night skies may also be experienced at the Monument. Other recreational activities include day hiking, photography, viewing archaeo-logical pueblos, horseback riding, backpacking, exploring, and rock climbing within the Mockingbird Mesa Recreational Management Zone. Dispersed camping and campfires are allowed throughout the Monument, except at archaeological sites, the Sand Canyon/Rock Creek SRMA, and the Anasazi Heritage Center SRMAs. Hunting is allowed in the Monu-ment, but recreational shooting is prohibited. All motorized and mechanized travel (for example, on bicycles) is restricted to designated routes throughout the Monument, while hikers and horseback riders are generally allowed to travel off trail throughout the Monument. However, because the Sand Can-yon/Rock Creek SRMA habitat is sensitive, all mechanized, foot, and horseback travel is restricted to designated routes and all motorized travel is prohibited within the area. Some people also enjoy harvesting special forest products, including pinyon nuts and traditional medicinal plants. Some visitors who participate in these recreational opportunities receive an economic benefit that exceeds the participation cost. Thus, a nonmarket use value can be held by some people for each of the allowed recreational opportunities in the Monument.
The region has a long history of archaeological explora-tion and research, which led to the area being designated as a national monument in 2000 (Bureau of Land Management, 2010a). With more than 6,355 recorded sites, the Monument contains the highest known archaeological site density within the United States. Archaeological sites within the Monument, which are as old as 10,000 years and have been attributed to the heavily populated Ancestral Puebloan era, contain villages, kivas, cliff dwellings, and petroglyphs. It is estimated that the region contains from 20,000 to 30,000 sites in total (Bureau of Land Management, 2010a). The 2010 Resource Management Plan (RMP) indicated that from 13 to 25 cultural resource sites would be allocated for development with interpretive signs and brochures to educate visitors. The Monument also manages the Anasazi Heritage Center, a museum of Ancestral Puebloan culture; Lowry Pueblo; Sand Canyon; and Painted Hand, all of which are the main destination sites along the trail of the Canyons of the Ancients National Monument Scenic
and Historic Byway. The Anasazi Heritage Center houses per-manent exhibits, provides educational resources, and contains more than 3 million artifacts from archaeological projects in southwestern Colorado. Both nonmarket use and passive use values can be held by some members of the public for the number and quality of historic sites and cultural artifacts found at the Monument and the Anasazi Heritage Center. For some people, use values can be derived from archaeological research, recreation, exploration, and educational experiences for visitors, teachers, and students. Passive use values may also be held by some people for preserving these cultural resources for the enjoyment of future generations (bequest values) and preserving the sites in a particular condition (exis-tence values).
Geologically, the Monument is located in the Paradox Basin, which mostly contains sedimentary rocks from the Cre-taceous age, while some rocks in McElmo Canyon date from the Jurassic period (Bureau of Land Management, 2013b). Paleontological resources can also be found at the Monument, including dinosaur remains. In some ways, the nonmarket values held for the geological and paleontological resources found at the Monument may be similar to those held for archaeological, cultural, and historic sites. Use values, such as those held for recreational, educational, and research oppor-tunities, as well as passive use values, such as the benefits received from preservation for future generations (bequest values), may be held by some people for the geological and paleontological resources found at the Monument.
Another important resource use at the Monument is mineral development. Leasing for fluid mineral develop-ment projects has accounted for 80 percent of land use at the Monument, or about 131,000 acres (Bureau of Land Management, 2010a). The 2010 Monument Record of Deci-sion/RMP highlight that carbon dioxide (CO2) production is a major economic driver in the surrounding Montezuma County and CO2 production in the Monument is expected to continue through 2050. As of 2010, there were approximately 125 wells producing oil, natural gas, and CO2; this number is expected to increase to 150 wells (81 oil and natural gas wells and 69 CO2 wells) at 121 new locations over the life of the approved RMP. The 2010 Record of Decision acknowl-edges that balancing the protection of cultural resource values with fluid minerals development can be challenging. This is understandable because the value of fluid minerals are more readily reflected in well-established markets, while compet-ing uses (that is, cultural resources and wildlife habitat) have missing, or nonmarket, values in a traditional accounting framework. As a consequence, these nonmarket values may not be appropriately weighed in a decisionmaking process. This highlights the role of nonmarket valuation in resource planning at the Monument and at other BLM land units. To make better decisions and better reflect the preferences of the public, a full accounting framework of the total economic values associated with decisions is needed. The framework would ideally include nonmarket values alongside market val-ues of competing uses.
Appendix 3
36 Inclusion of Nonmarket Values in BLM Planning and Project Assessments, Final Report
Another important use of the Monument is livestock graz-ing, which is allowed on approximately 98 percent of the land. The Monument recognizes the importance of livestock grazing to the local rural economy and to the preservation of the cul-tural heritage of the Western States (Bureau of Land Manage-ment, 2010a). However, BLM determined that permit numbers had exceeded the carrying capacity of the land and decided to reduce animal unit months (AUMs) from 8,492 to 6,437 AUMs in order to improve overall land health (Bureau of Land Management, 2010a). The 2010 RMP approved 23 allotments across 150,036 acres, a reduction of 5 allotments from the pre-vious plan, to further meet the goal of improved land health.
Nonmarket Values Associated With the Red Cliffs National Conservation Area
Table 3-2 summarizes the resources and uses that are managed by the Bureau of Land Management (BLM) at the Red Cliffs National Conservation Area (NCA).
The Red Cliffs NCA is located along the transition zone between the Colorado Plateau Province and the southern Basin and Range Provinces. As a result, the Red Cliffs NCA contains several rare plant and wildlife species, some of which are found nowhere else in the world (Bureau of Land Management, unpub. data, 2013). This includes managing and
Table 3-2. Identifying resources with nonmarket values at the Red Cliffs National Conservation Area.
[NCA, National Conservation Area; OHV, off-highway vehicle; BLM, Bureau of Land Management]
Red Cliffs NCA
Importance in project(s)
Resources and uses1 Use values
Passive use values
Magnitude of value2
Risk/ vulnerability/
sensitivity3
Threatened, endangered, and rare species–Mojave Desert tortoise, woundfin minnow, Virgin River chub, Shivwits milkvetch, bald eagle
● High
Plant species–Utah agave, banana yucca, scrub oak, single-leaf ash, pinyon pine, Utah juniper ● Low
Wildlife–Gila monster, mule deer, mountain lion, coyote, jackrabbit, cottontail rabbit, sidewinder rattlesnake, kit fox, Gambel’s quail, golden eagle, red-tailed hawks, western screech owls, peregrine falcons, Cooper’s hawks, sharp-shinned hawks, bobcat
● Moderate
Geological–Navajo Sandstone, Kayenta Formation, ancient volcanic activity with lava flows and extinct cinder cones ● Low
Wilderness and areas with wilderness characteristics (more than 21,000 acres in total)–Cottonwood Canyon Wilderness, Red Moun-tain Wilderness, and 1,662 acres with wilderness characteristics
● High
Recreation–Extensive trail system, hiking, equestrian, OHV, mountain biking, rock climbing at Turtle Wall, hunting, geocaching, camping, primitive recreation experiences, wildlife viewing
● High
Archaeological–The Orson Adams House and an Anasazi archaeologi-cal site ● Moderate
Paleontological–Dinosaur tracks and fossils ● Low
Education and research–Ecological, wildlife, plants, paleontological, archaeological, geological ● Moderate
1List of resources and uses is not exhaustive and may require input from BLM staff.2Anticipated or expected size of associated nonmarket value (that is, high, moderate, or low).3Likelihood of changes to nonmarket value from management decisions or by changes in the resource; this information will be populated later with the assis-
tance of BLM resource specialists.

Appendix 3 37
protecting habitat of the threatened Mojave Desert tortoise (Gopherus agassizii) and the northernmost populations of Gila monster (Heloderma suspectum). The Virgin River, Quail Creek, and Leeds Creek also provide habitat for threatened and endangered native fish of the Virgin River system, includ-ing the endangered woundfin minnow (Plagopterus argentissi-mus), the endangered Virgin River chub (Gila seminude), and the threatened Shiwvits milk-vetch (Astragalus ampullarioi-des). The Cottonwood Canyon and Red Mountain Wilderness Areas contain flora and fauna unique to the Mojave Desert and Colorado Plateau, including Utah agave (Agave utahen-sis), banana yucca (Yucca baccata), singleleaf ash (Fraxinus anomala), pinyon pine (Pinus edulis), Utah juniper (Juniperus osteosperma), mule deer (Odocoileus hemionus), mountain lion (Puma concolor), coyote (Canis latrans), jackrabbit, cot-tontail rabbits, sidewinder (Crotalus cerastes), kit fox (Vulpes macrotis), Gambel’s quail (Callipepla gambelii), golden eagle (Aquila chrysaetos), red-tailed hawk (Buteo jamaicensis), western screech owl (Megascops kennicottii), bald eagle (Haliaeetus leucocephalus), peregrine falcon (Falco pereg-rinus), Cooper’s hawk (Accipiter cooperii) , sharp-shinned hawk (Accipiter striatus), and bobcat (Lynx rufus) (Bureau of Land Management, 2009c, 2013c).
Many nonmarket values can be derived from species and habitat found in the Red Cliffs NCA. Healthy species populations contribute to use values some people hold for recreational opportunities such as hunting, wildlife viewing, educational experiences, and research. The Red Cliffs NCA also provides habitat for migratory birds, which can then con-tribute to the use value some people hold for hunting and wild-life viewing outside of the NCA’s boundary. Other nonmarket passive use values can be derived from the protection and preservation of important habitat for threatened and endan-gered species. The Red Cliffs NCA is a component of the Red Cliffs Desert Reserve, which was created primarily to protect and help recover populations of the Mojave Desert tortoise. Such an effort to protect the tortoise and other threatened and endangered species in the Red Cliffs NCA contributes to existence values (value in knowing the resource will exist in a particular condition) and bequest values (the benefits received from knowing the species will exist for future generations) held by some people for their preservation.
The Red Cliffs NCA has dedicated two wilderness areas to help better protect tortoise habitat and other natural features. The Cottonwood Canyon Wilderness, which is approximately 11,700 acres in size, not only provides habitat for many of the flora and fauna species found in the NCA, but also contains geologic features and recreational opportunities for visitors. The Cottonwood Canyon Wilderness is one of the most visited wild areas in southwestern Utah because the area is highly accessible to residents of nearby St. George (Bureau of Land Management, 2009c). The second wilderness area found in the NCA is an 8,300-acre portion of the 18,700-acre Red Mountain Wilderness located along the western edge of the NCA bound-ary. This wilderness area also contains habitat for wildlife species as well as panoramic views of the surrounding region,
which includes Zion National Park, Virgin River Gorge, and the Beaver Dam Mountains. The two wilderness areas provide the opportunity for visitors to experience primitive recreation, nighttime scenery viewing, the integration of the cultural and historical context of the region, and improved habitat for wildlife that rely on the natural patterns of light and dark. There are no developed trails in these two wilderness areas, but well-established primitive trails are used for hiking, rock climbing, and horseback riding access. All trailheads are located outside the two wilderness areas, where parking, informational kiosks, toilets, and equestrian facilities are available. In addition to these two designated wilderness areas, the Red Cliffs NCA also contains three units with wilderness characteristics totaling 1,662 acres (Bureau of Land Management, unpub. data, 2013). The NCA was evaluated in 2012 using guidelines from the “Conducting Wilderness Characteristics Inventory on BLM Lands” (Bureau of Land Management, 2012a). This inventory found that these three land units contained naturalness; out-standing opportunities for solitude; and outstanding opportuni-ties for primitive, unconfined recreation. The two wilderness areas and the areas with wilderness characteristics provide opportunities for use values held for solitude, natural quiet, and primitive recreational experiences. Individuals may also place a use value on wildlife viewing, educational, and exploration opportunities within these areas. Passive use values, namely bequest values and existence values, may also be held by some members of the public for the wilderness areas and areas with wilderness characteristics.
The Red Cliffs NCA contains unique geological, histori-cal, and cultural resources; each of which contains several nonmarket values that some members of the public may hold for such resources. The NCA contains Navajo Sandstone, which originally formed as Jurassic aeolian sand dunes (Bureau of Land Management, unpub. data, 2013), and the Kayenta Formation, which often accompanies Navajo Sand-stone in iconic images of the American West. The area also contains ancient volcanic activity that has left evidence of lava flows and extinct cinder cones. Because of the exten-sive exposure of the Jurassic Kayenta Formation and Navajo Sandstone, the Red Cliffs NCA is home to unique paleonto-logical features such as dinosaur tracks and fossils from the Early Jurassic period. The NCA also protects and preserves archaeological sites from human occupation dating back to the Archaic period. Near the Red Cliffs Recreation Area are the remnants of an Anasazi archaeological site and the Orson Adams House, a mid-19th century Mormon pioneer settle-ment that was recently restored (Bureau of Land Management, 2009c). The condition of the cultural resource sites within the NCA should be considered “good,” per the recommendations of BLM’s 2009 manager’s report (Bureau of Land Manage-ment, 2009a). Use values, such as those held for recreational and educational opportunities, as well as passive use values, such as the benefits received from preservation for future gen-erations (bequest values), may be held by some people for the geological, archaeological, and paleontological features found in the NCA.
Appendix 3

38 Inclusion of Nonmarket Values in BLM Planning and Project Assessments, Final Report
At the heart of the Red Cliffs NCA is an extensive trail system, consisting of 81 designated trails, 68 of which are either solely or collaboratively managed by BLM. In some areas, recreational opportunities may compete with wildlife habitat preservation. Therefore, to better coordinate habitat preservation with recreation and other uses, the Red Cliffs NCA is divided into two categorized zones, the upland and lowland zones, according to the “Red Cliffs Desert Reserve Public Use Plan” (Washington County HCP Administration, 2000). The upland zone is the less sensitive and more durable of the two, while the lowland zone is more sensitive and contains much of the habitat for the Mojave Desert tortoise (Bureau of Land Management, unpub. data, 2013). Nearly all recreational uses within the low-land zone are restricted to designated trails, while visitors in the upland zone are permitted to travel off trail. However, the draft environmental impact statement explains that the unmarked transition from lowland to upland zones has led to confusion about where certain activities are permitted (Bureau of Land Management, unpub. data, 2013).
Hiking is by far the most popular recreational use of the Red Cliffs NCA, but many of the trails within the NCA’s network can also be used by other nonmotorized activities, including horseback riding, interpretation, and mountain biking. However, with the expansion of nearby trails outside of the Red Cliffs NCA, mountain biking use within the NCA boundary appears to be in decline (Bureau of Land Manage-ment, unpub. data, 2013). Rock climbing, rappelling, and scrambling is the second most popular recreational use in the NCA, and is authorized in three locations within the NCA’s boundary: Snow Canyon State Park, Paradise Canyon, and Pioneer Park. Turtle Wall, located in Paradise Canyon, is the only site in the NCA managed by the BLM. Geocaching is allowed in the upland zones, but disallowed in the lowland zones. Hunting is allowed in the upland zone throughout the NCA and in the lowland zone on the east side of Cottonwood Road. Hunting is the only off-trail use allowed within the lowland zone of the NCA. Except for hunting, recreational shooting is disallowed in the NCA. Camping in the sensitive lowland zone is restricted to the 12-site campground with vehicle space in the Red Cliffs Recreation Area. Dispersed camping is allowed in the upland zone of the NCA, except for the Sandstone Mountain area where primitive camping is by permit only in the Sand Cove camping area. Motor vehicle travel is allowed in the NCA, but only on the six designated roads identified in the Red Cliffs Desert Reserve Public Use Plan as being suitable for such travel on BLM-administered land. Some visitors who participate in these recreational opportunities receive economic benefits above and beyond any costs actually paid to participate in them. Thus, a nonmarket use value can be held by some people for each of the allowed recreational opportunities in the NCA.
Since publication of the previous RMP in 1999, very little livestock grazing has occurred in the Red Cliffs NCA. As part of the 1994 recovery plan for the Mojave Desert tortoise, grazing was limited in much of the NCA. In addition, seven of the remaining allotments in the NCA were voluntarily
relinquished by the permit holders. As of 2016, there are three allotments still in existence in the NCA, but the allotments are difficult to access, so they have very little, if any, use through-out the year.
Nonmarket Values Associated With the Beaver Dam Wash National Conservation Area
Table 3-3 summarizes the resources and uses that are managed by the Bureau of Land Management (BLM) at the Beaver Dam Wash National Conservation Area (NCA).
The Beaver Dam Wash NCA is located west of the Red Cliffs NCA along an ecological transition zone between the Mojave Desert and the Great Basin. Straddling this transition zone contributes to the existence of unique flora and fauna found in the region, including blackbrush (Coleogyne ramo-sissima) and some of the northernmost stands of Joshua trees (Yucca brevifolia) (Bureau of Land Management, unpub. data, 2013). The NCA also provides habitat for the Mojave Desert tortoise (Gopherus agassizii), a federally listed threatened spe-cies, and for bats, reptiles, Gila monsters (Heloderma suspec-tum), endangered southwestern willow flycatchers (Empidonax traillii extimus), and raptors. Riparian vegetation along the stream channel of the Beaver Dam Wash provides important habitat for migratory birds and other wildlife such as the desert bighorn sheep (Ovis canadensis nelsoni).
Many nonmarket values may be held for habitat and the species populations managed by BLM at the Beaver Dam Wash NCA. Passive use values, such as existence values (valuing the existence of a resource) and bequest values (the benefits received from knowing the resource exists for future generations), might be derived from the existence of stands of Joshua trees, the threatened Mojave Desert tortoise, and the endangered southwestern willow flycatcher by some members of the public. Other nonmarket values associated with habitat and species populations are use values derived from hunting, wildlife viewing, and educational opportunities. The habitat for migratory birds also contributes to use values held by hunt-ers and wildlife observers that participate in these recreational activities outside of the Beaver Dam Wash NCA boundary.
Although it does not contain designated wilderness areas, the Beaver Dam Wash NCA maintains three units totaling 43,873 acres (or 69 percent) with the wilderness character-istics of naturalness, outstanding opportunities for solitude, and outstanding opportunities for primitive and unconfined recreation (Bureau of Land Management, unpub. data, 2013). The first land unit identified in the NCA to contain wilder-ness characteristics is the Beaver Dam Mountains South Unit. This land unit is characterized by rugged mountains rising out of gently sloping alluvial plains. There are no human-made features within the unit other than overgrown and infrequently used routes for travel. The second area with wilderness char-acteristics is the Joshua Tree Unit, which is also located in the Beaver Dam Mountains. The third area in the NCA with wilderness characteristics is the Beaver Dam Wash Unit.

Appendix 3 39
Both use and passive use nonmarket values can be derived from the three designated areas with wilderness char-acteristics. The use values some visitors may hold for these areas include the opportunity to experience primitive recre-ation and natural darkness and starry night skies, enhanced wildlife viewing opportunities, and the chance to experience solitude and natural quiet. The provisioning and protection of areas with wilderness characteristics also protect the bequest values that some people place on ensuring that future genera-tions will be able to experience nature in its undisturbed state. Preservation of the overall naturalness of the Beaver Dam Wash NCA and its areas with wilderness characteristics also contributes to potential existence values (value in knowing
the resource will exist in a particular condition) and bequest values held by some individuals.
Recreation is one of the primary uses of the Beaver Dam Wash NCA. Contrasting with the neighboring Red Cliffs NCA, the Beaver Dam Wash NCA currently has no developed recreational facilities, trailheads, or trails, but a management plan is being developed to address recreational uses and facil-ity needs (Bureau of Land Management, unpub. data, 2013). Rock climbing on the limestone formations of the Beaver Dam Mountains is the most popular recreational activity in the NCA. Other activities include dispersed camping, horseback riding, and hunting for birds, deer, and desert bighorn sheep. Motor vehicle and all-terrain vehicle travel are also very popular uses
Table 3-3. Identifying resources with nonmarket values at the Beaver Dam Wash National Conservation Area.
[NCA, National Conservation Area; OHV, off-highway vehicle; BLM, Bureau of Land Management]
Beaver Dam Wash NCA
Importance in project(s)
Resources and uses1 Use valuesPassive
use valuesMagnitude
of value2
Risk/ vulnerability/
sensitivity3
Threatened, endangered, and rare species–Mojave Desert tortoise, southwestern willow flycatcher ● High
Plant species–Blackbrush, Joshua trees ● Low
Wildlife–Migratory birds, bats, reptiles, Gila monster, raptors, desert bighorn sheep ● Moderate
Geological–1.7 billion year old Precambrian; oldest exposed rock in Utah ● Low
Areas with wilderness characteristics (43,873 acres)–Beaver Dam Mountains South, Joshua Tree, Beaver Dam Wash
● Moderate
Recreation–Dispersed camping, OHV use, rock climb-ing, horseback riding, hunting, primitive recreation, sightseeing, wildlife viewing, hiking, photography
● Moderate
Archaeological–19th century Euro-American historic sites, Arrowhead Trails Highway, Old Spanish Trail, and evidence of Archaic, Ancestral Puebloan, and Southern Paiute people
● Low
Paleontological–Fossils ● Low
Education and research–Ecological, wildlife, plants, paleontological, archaeological, geological ● Low
1List of resources and uses is not exhaustive and may require input from BLM staff.2Anticipated or expected size of associated nonmarket value (that is, high, moderate, or low).3Likelihood of changes to nonmarket value from management decisions or by changes in the resource; this information will be populated
later with the assistance of BLM resource specialists.
Appendix 3
40 Inclusion of Nonmarket Values in BLM Planning and Project Assessments, Final Report
of the NCA. Some visitors who participate in these recreational opportunities receive economic benefits above and beyond any costs actually paid to participate in them. Thus, a nonmarket use value can be held by some people for each of the allowed recreational opportunities in the NCA.
The Beaver Dam Wash NCA contains unique geological features, as well as important historical, cultural, and paleon-tological resources. Paleontological inventories have identified dinosaur tracks and fossilized remains throughout the NCA (Bureau of Land Management, unpub. data, 2013). Previous work has uncovered archaeological records of ancient people who once lived in the area, including evidence of Archaic, Ancestral Puebloan, and Southern Paiute occupancy and land use. The NCA also contains Euro-American historic sites from the 19th century, such as wagon roads and telegraph lines, and the Arrowhead Trails Highway, the first all-weather road connecting Los Angeles, Las Vegas, and Salt Lake City that was built in the early 20th century. Additionally, the Old Spanish Trail, a designated National Historic Trail, traverses the Beaver Dam Wash NCA. For some members of the public, nonmarket use values are derived from the educational and research opportunities derived from the geological, cultural, historical, and paleontological resources found at the NCA. Bequest values (through ensuring that future generations can experience them in an undisturbed fashion) and existence values (value in knowing the resource will exist in a particular condition) can be received by some individuals who place value on the protection of these unique resources.
Livestock grazing also occurs in the Beaver Dam Wash NCA. As of 2009, 14 permit holders were licensed to graze portions of 4 grazing allotments located within the boundary of the NCA (Bureau of Land Management, 2009a). Both use values and bequest values can be held by some members of the public for ranching and livestock grazing.
Nonmarket Values Associated With Lands Managed by the Taos Field Office
Table 3-4 summarizes the resources and uses that are managed by the Bureau of Land Management (BLM) at the Taos Field Office.
BLM’s Taos Field Office manages a wide range of resources, uses, and land designations, and provides an excel-lent example of multiple-use land management. The Taos Field Office’s planning area includes approximately 15.5 mil-lion acres of mixed ownership, and spans across Union, Mora, Colfax, San Miguel, Los Alamos, Harding, Taos, Rio Arriba, and Santa Fe counties in northeastern New Mexico (Bureau of Land Management, 2012e). Within the planning area, BLM manages nearly 595,000 acres of public land and 1.5 million acres of Federal subsurface mineral rights; however, more than 525,000 acres of subsurface rights are unavailable for leasing in order to protect sensitive resources. Specially designated areas managed by the Taos Field Office include more than 408,000 acres of Areas of Critical Environmental Concern
(ACEC); two Watchable Wildlife Areas; the 16,030-acre Sabinoso Wilderness; the 7,371-acre San Antonio Wilder-ness Study Area (WSA); and the 11,128-acre Rio Chama WSA. The Taos Field Office also manages the 242,555-acre Rio Grande Del Norte National Monument, which is part of BLM’s National Conservation Lands program (Bureau of Land Management, 2013e). The Taos Field Office manages 32 miles of the Rio Chama, 4 miles of the Red River, and 68 miles of the Rio Grande as Wild and Scenic Rivers; and an additional 7-mile portion of the Rio Grande as a Wild and Scenic River study segment (Bureau of Land Management, 2012e). The Taos Field Office is also tasked with managing the Wild Rivers Back Country Byway, and roughly 41 miles of the El Camino Real de Tierra Adentro and Old Spanish National Historic Trails.
The Sabinoso Wilderness and the two WSAs contribute to both use and passive use nonmarket values held by some members of the public. The Sabinoso Wilderness has a low potential for recreational use because of several factors, the most important of which is the lack of public access because the area is surrounded by privately owned land (Bureau of Land Management, 2013c). Some of the individuals who gain access to the Sabinoso Wilderness and the WSAs may hold nonmarket use values for the solitude, natural quiet, and scenery viewing provided by the areas. Primitive recreational experiences in these areas might include observing natural darkness and starry night skies, as well as opportunities for understanding the cultural importance of the historical context of the region. Individuals may also hold use values for activi-ties such as wildlife viewing and educational, research, and exploring opportunities. Some members of the public may also place passive use values on the Sabinoso Wilderness and the WSAs, namely bequest values (benefits received from pre-serving the areas for future generations) and existence values (enjoyment received from knowing the Sabinoso Wilderness and the WSAs are preserved in a particular condition).
The types of nonmarket values held for the Rio Chama, Red River, and Rio Grande Wild and Scenic Rivers and the Rio Grande study segment may be similar to those held by some people for the Sabinoso Wilderness and two WSAs. Nonmarket use values may be held by some individuals for primitive recreational opportunities, such as scenery viewing and camping. Use values might also be derived from other unique recreational experiences that are available, such as fishing, whitewater rafting, kayaking, boating, and shoreline-related activities. Some members of the public may also place passive use values on the Wild and Scenic Rivers and study segment, specifically bequest values and existence values.
Land managed by the Taos Field Office contains impor-tant riparian and terrestrial vegetative communities, which provide habitat for bird and wildlife populations. Bighorn sheep (Ovis canadensis), pronghorn (Antilocapra americana), mule deer (Odocoileus hemionus), and elk (Cervus canaden-sis) are among native populations in the region (Bureau of Land Management, 2006, 2012a). Mountain lions (Puma con-color), bobcats (Lynx rufus), river otters (Lontra canadensis),

Appendix 3 41
black bears (Ursus americanus), coyotes (Canis latrans), gray foxes (Urocyon cinereoargenteus), beavers, muskrats (Onda-tra zibethicus), rabbits, collared lizards (Crotaphytus collaris), bullfrogs (Lithobates catesbeianus), rattlesnakes, and bats can also be found in the region. The Orilla Verde Recreation Area provides habitat for at least 133 identified bird species, which is more than 29 percent of the number of bird species known
to live in New Mexico (Bureau of Land Management, 2006). The region is also part of the Central Flyway, which is used as a migration corridor for American avocets (Recurvirostra americana), hummingbirds, sandhill cranes (Grus canaden-sis), and herons (Bureau of Land Management, 2013e). The area is also home to federally threatened or endangered spe-cies such as the southwestern willow flycatcher (Empidonax
Table 3-4. Identifying resources with nonmarket values at the Taos Field Office.
[WSA, Wilderness Study Area; BLM, Bureau of Land Management]
Taos Field Office
Importance in project(s)
Resources and uses1 Use valuesPassive
use valuesMagnitude
of value2
Risk/ vulnerability/
sensitivity3
Threatened, endangered, and rare species–Southwestern willow flycatcher, bald eagle, ferruginous hawks, Gunnison prairie dog, Santa Fe cholla, gramma grass cactus, cutthroat trout, golden eagle, peregrine falcon, raptor species and their nesting sites
● High
Biomass utilization–Collection of special forest products and fuel wood collection ● Low
Wildlife–Bighorn sheep, pronghorn antelope, mule deer, elk, mountain lion, bobcat, river otters, black bear, coyote, grey fox, beaver, muskrat, rabbits, collard lizard, bullfrog, rattlesnake, bats, hummingbirds, sandhill crane, heron, and 133 species of birds
● Moderate
Wilderness and wilderness study areas–Sabinoso Wilderness (16,030 acres), San Antonio WSA (7,371 acres), and Rio Chama WSA (11,128 acres)
● High
Special Designations and protected areas–Rio Grande Del Norte National Monument, Rio Chama (32 miles), Red River (4 miles), Rio Grande (68 miles), and a Rio Grande study segment (7 miles)
● High
Historic trails–El Camino Real de Tierra Adentro National Historic Trail (41 miles), Old Spanish National Historic Trail
● Low
Recreation–Boating, sightseeing, camping, biking, swimming, horseback riding, interpretation, fishing, picnicking, wildlife viewing, whitewater rafting, and kayaking
● High
Archaeological–Historic sites in the Galisteo Basin, Na-tive American rock art, Spanish colonial settlements, Ward Ranch, La Cieneguilla Petroglyphs, Posi Pueblo
● Moderate
Paleontological and geological–Rio Grande Rift, Rio Grande Gorge, Taos Plateau volcanic field, fossils ● Low
Education and research–Ecological, wildlife, plants, paleontological, archaeological, geological ● Low to Moderate
1List of resources and uses is not exhaustive and may require input from BLM staff.2Anticipated or expected size of associated nonmarket value (that is, high, moderate, or low).3Likelihood of changes to nonmarket value from management decisions or by changes in the resource; this information will be populated later with the assis-
tance of BLM resource specialists.
Appendix 3

42 Inclusion of Nonmarket Values in BLM Planning and Project Assessments, Final Report
traillii extimus), bald eagle (Haliaeetus leucocephalus), ferruginous hawk (Buteo regalis), and Gunnison’s prairie dog (Cynomys gunnisoni).
The Taos Field Office has developed a series of manage-ment actions aimed at improving bird and wildlife habitat on BLM-administered lands. BLM plans to work with the New Mexico Division of Game and Fish to improve 5 miles of habitat along the Rio Agua Caliente for the Rio Grande cutthroat trout (Oncorhynchus clarkii virginalis), which is listed by BLM as a sensitive species (Bureau of Land Man-agement, 2012e). Sensitive plant species, such as Santa Fe cholla (Cylindropuntia X viridiflora) and grama-grass cactus (Sclerocactus papyracanthus), will be monitored and protected from surface disturbing activities such as roads (Bureau of Land Management, 2012e). Surface disturbing activities near sites where golden eagles (Aquila chrysaetos), peregrine fal-cons (Falco peregrinus), and other raptors are active and nest will also require a buffer. BLM plans to assess the potential impacts to wildlife populations and habitat from wind and solar energy development. The Taos Field Office has addition-ally planned to protect and improve approximately 50,000 acres of big game ranges in the Taos Plateau and Chama planning units through low-density road transportation plans, vegetation treatments, and improved water availability.
Many different nonmarket values may be held by some members of the public for bird and wildlife populations, including those that are considered threatened, endangered, or BLM-sensitive species. Healthy species populations contribute to use values some people hold for recreational opportunities such as hunting, wildlife viewing, educational experiences, and research. Other members of the public may never actu-ally visit the region, but may still experience enjoyment from knowing that habitat for bird and wildlife populations, includ-ing those that are listed as threatened or endangered, is pro-tected. This is an example of an existence value, which reflects the value that some people place on simply knowing that a resource exists in a particular condition. Another passive use value that may be derived from bird and wildlife populations found at the Taos Field Office is bequest value, which reflects the benefits that some people receive from knowing that bird and wildlife populations will exist for future generations.
Many important cultural and archaeological resources can be found on lands administered by the Taos Field Office. More than 4,500 acres of State, private, and BLM-administered land in the Galisteo Basin contain 24 historic sites, as identi-fied in the Galisteo Basin Archaeological Sites Protection Act (Bureau of Land Management, 2012b, c, e). These sites include the largest ruins of Pueblo Indian settlements in the United States, Native American rock art, and Spanish colonial settlements. The Galisteo Basin Archaeological Sites Protec-tion Act sites administered by the Taos Field Office are open to the public for interpretation, as are the Ward Ranch, the La Cieneguilla Petroglyphs site, and the Posi Pueblo. Additional heritage tourism projects will be developed to allow for better visitor interpretation and protection of cultural resources in the Ojo Caliente ACEC and the La Cienega ACEC. The Taos
Field Office also contains sections of the El Camino Real de Tierra Adentro National Historic Trail and the Old Spanish National Historic Trail, both of which provide interpreta-tion, recreational, and educational opportunities to visitors. BLM plans to continue to work with the Taos Archaeological Society and the Mesa Prieta Petroglyph Project on projects related to petroglyph recording, mapping, and inventory. A variety of nonmarket values may be held by some members of the public for these sites. Use values, such as those associ-ated with opportunities for archaeological research, exploring, and recreational and educational experiences, are derived by some people for the protected cultural sites and artifacts found at the Rio Grande Del Norte National Monument. For some members of the public, passive use values may be derived from preserving these cultural resources for future generations (bequest values) and preserving the sites in a particular condi-tion without ever using them (existence values).
Lands managed by the Taos Field Office contain impor-tant paleontological and geological resources. There are a number of areas found in the region that contain noteworthy occurrences of fossils, most notably the Sombrillo ACEC, which is managed specifically for the protection of paleon-tological resources, and the Sabinoso Wilderness, which has been rated as having a high probability of containing important fossils (Bureau of Land Management, 2013c). Important geo-logical resources, such as the Rio Grande Rift, the Rio Grande Gorge, and the Taos Plateau volcanic field can be found in the Rio Grande del Norte National Monument (Bureau of Land Management, 2013d). Use values associated with recreational, educational, and research opportunities in the Rio Grande del Norte National Monument, as well as passive use values for the area’s geological and paleontological resources, may be held by some members of the public.
A wide range of recreational opportunities can be found on lands managed by the Taos Field Office, including boat-ing, sightseeing, camping, biking, swimming, horseback riding, and interpretation. Some visitors who participate in these recreational opportunities receive an economic benefit above and beyond any costs actually paid to participate in them. Thus, a nonmarket use value is held by some people for each of the permitted recreational opportunities. To help better manage the recreational opportunity offerings, the Taos Field Office maintains 11 Special Recreation Management Areas (SRMAs) totaling 185,539 acres, and plans to create 10 additional Extensive Recreation Management Areas totaling 409,150 acres (Bureau of Land Management, 2012e). The SRMAs were established to meet demands for recreational opportunities and required more structure, planning, and maintenance relative to the Extensive Recreation Management Areas, which have more dispersed recreational activities and custodial management (Bureau of Land Management, 2012e). The Santa Cruz Lake SRMA, which is routinely used by local residents for fishing, picnicking, swimming, boating, and hik-ing, includes developed campgrounds, picnic shelters, and toi-lets. The Wild Rivers SRMA provides visitors the opportunity to engage in hiking, camping, sightseeing, swimming, boating,

Appendix 3 43
and bicycling in an easily accessible frontcountry setting. The Wild Rivers SRMA also contains a visitor center that provides opportunities for public interpretation and educational and recreational experiences (Bureau of Land Management, 2000). The Orilla Verde SRMA contains the other visitor center man-aged by the Taos Field Office, the Rio Grande Gorge Visitor Center. This visitor center provides displays and videos on rec-reational opportunities, history, and resources found at the Rio Grande Gorge. The Orilla Verde SRMA provides opportunities for visitors to camp, picnic, boat, fish, hike, and view wildlife, and includes developed campgrounds with restrooms, water, and electricity hookups (Bureau of Land Management, 2006). Currently, the Rio Grande del Norte National Monument contains renowned trout fishing along the tributaries and main stem of the Rio Grande (Bureau of Land Management, 2012e, 2013e). The 2012 Resource Management Plan anticipates that, in general, there may be a future increase in demand for fishing and hunting opportunities on land managed by the Taos Field Office (Bureau of Land Management, 2012e). The Rio Grande del Norte National Monument also contains world class whitewater rafting and kayaking opportunities through the scenic Rio Grande Gorge. Taos Valley Overlook also contains outstanding scenery viewing of the Rio Grande Gorge, as well as the Taos Valley and nearby Sangre de Cristo Mountains (Bureau of Land Management, 2006). The Taos Junction Bridge is also a popular site to gain access to a wide range of recreational opportunities, including boating, swim-ming, sightseeing, hiking, fishing, and camping.
Livestock grazing and biomass utilization are important resource uses of lands managed by the Taos Field Office. Of the 595,000 acres of public land managed by the Taos Field Office, approximately 8 percent (49,000 acres) disallows grazing entirely to better protect sensitive environmental resources. The Taos Field Office also manages 2,000 acres per year for biomass utilization to help improve forest health, and will allow firewood collection in locations not susceptible to erosion or where firewood collection will not compete with other uses. For some people, nonmarket values may be held for livestock grazing and biomass utilization, particularly with respect to cultural importance and subsistence (use values).
Nonmarket Values Associated With Lands Managed by the Tuscarora Field Office
Table 3-5 summarizes the resources and uses that are managed by the Bureau of Land Management (BLM) at the Tuscarora Field Office.
The Tuscarora Field Office manages six wilderness study areas (WSAs) totaling 96,471 acres: Cedar Ridge, Red Spring, Rough Hills, Little Humboldt, Owyhee Canyon, and South Fork Owyhee River (Pratt and others, 2013). These six WSAs are managed as part of BLM’s National Conserva-tion Lands program, which is designed to “conserve, protect, and restore nationally significant landscapes and places that have outstanding cultural, ecological, and scientific values for the benefit of current and future generations” (Public Law
111-11). These WSAs, along with all of the land managed by the Tuscarora Field Office, contain an interdependent web of ecological functions and resources, which together contribute to many different nonmarket endpoints for which the public may care. For example, people may enjoy the six WSAs for the chance to experience solitude and other primitive recre-ational experiences, which represent nonmarket use values. Other use values may be derived from viewing wildlife or hunting, which serve as endpoints to the provisioning of qual-ity habitat provided by the WSAs. Other people may enjoy the fact that these areas are being protected for future generations (bequest value); while others may place a value on knowing these areas are protected in their current state even though they may never make any use of them (existence value).
Many nonmarket values can be held by members of the public for bird and wildlife populations, including those that are considered threatened, sensitive, or protected species. Healthy species’ populations contribute to use values that are held by some people for recreational opportunities, such as hunting, wildlife viewing, shed-antler hunting, educational experiences, and research. These lands also provide habitat for migratory birds, which can then contribute to the use value some people hold for hunting and wildlife viewing beyond the Tuscarora Field Office’s jurisdiction. Other nonmarket passive use values can be derived from the protection and preservation of important habitat for BLM and State of Nevada sensi-tive species, such as redband trout (Oncorhynchus mykiss), Lahontan cutthroat trout (Oncorhynchus clarkii henshawi), greater sage-grouse (Centrocercus urophasianus), pygmy rabbit (Brachylagus idahoensis), pale Townsend’s big-eared bat (Corynorhinus townsendii pallescens), Pacific Townsend’s big-eared bat (Corynorhinus townsendii townsendii), western small-footed myotis (Myotis ciliolabrum), long-eared myotis (Myotis evotis), long-legged myotis (Myotis volans), ferru-ginous hawk (Buteo regalis), golden eagle (Aquila chrysae-tos), Swainson’s hawk (Buteo swainsoni), and the California floater (Anodonta californiensis) (Bureau of Land Manage-ment, 1999). Greater sage-grouse in particular may be an important species of interest for the Tuscarora Field Office, primarily because of the presence of suitable habitat for the species in the region. The State of Nevada compiled the best available data related to greater sage-grouse populations and habitat, and disseminated the information in a user-friendly map (http://www.ndow.org/uploadedFiles/ndoworg/Content/public_documents/Nevada_Wildlife/NDOW%20SG%20Habi-tat%20Categorization%20-%20Dec%202012.pdf). This map provides a color-coded scale that spatially identifies a range of suitable habitat for greater sage-grouse in Nevada. Based on this map, the area of land managed by the Tuscarora Field Office appears to contain large swaths of both “important” and “essential/irreplaceable” habitat for the greater sage-grouse (Nevada Department of Wildlife, 2013). Efforts to manage habitat and promote healthy populations of protected and sensitive species in the Tuscarora Field Office, such as greater sage-grouse, contribute to existence values (value in knowing the resource will exist in a particular condition) and bequest Appendix 3

44 Inclusion of Nonmarket Values in BLM Planning and Project Assessments, Final Report
values (the benefits received from knowing the species will exist for future generations) held by some people for species’ preservation.
Recreational activities contribute to use values that many people derive from the land managed by the Tuscarora Field Office (Bureau of Land Management, 1986). Nonmarket valuation has been used previously to estimate the changes in average use value benefits from recreational experiences for different proposed alternatives for the South Fork Humboldt
River (Bureau of Land Management, 1999). To help better manage the demand for recreational opportunities, five Special Recreation Management Areas (SRMAs) were identified in the 1986 Resource Management Plan (RPM) for the Tuscarora Field Office, which was previously nested and managed under the BLM Elko District (Bureau of Land Management, 1986). All other land managed by the Elko District, as of 1986, was designated as dispersed recreation. Some of the recreational opportunities available to the public include trout and bass
Table 3-5. Identifying resources with nonmarket values at the Tuscarora Field Office.
[OHV, off-highway vehicle; BLM, Bureau of Land Management]
Tuscarora Field Office
Resources and uses1 Use valuesPassive
use values2
Importance in project(s)
Magnitude of value3
Risk/ vulnerability/
sensitivity4
Protected and sensitive species and habitat–Greater sage-grouse, Lahontan cutthroat trout, redband trout, pygmy rabbit, pale Townsend’s big-eared bat, Pacific Townsend’s big-eared bat, western small-footed myotis, long-eared myotis, long-legged Myotis, ferruginous hawk, golden eagle, Swainson’s hawk, California floater, bald eagle
● High
Wildlife–Mule deer, pronghorn antelope, elk, migratory birds, fish species ● Moderate
Biomass utilization and subsistence uses–Rock collec-tion, firewood collection, pine nut harvest, Christmas tree harvest
● Low
Wild horses–Four herds with a total population of 1,505 ● High
Wilderness study areas (96,471acres)–Cedar Ridge, Red Spring, Rough Hills, Little Humboldt, Owyhee Canyon, and South Fork Owyhee River
● Moderate
Recreation–Wildlife viewing, hunting, wild horse viewing, antler shed hunting, OHV use, mountain biking, camping, primitive recreation experiences, fishing, rocky climbing, snowmobiling, hiking, mountain biking, motorized boating
● Moderate
Archaeological–South Fork Rock Shelters, hundreds of archaeological sites, abandoned mines, old villages, line shacks
● Moderate
Education and research–California Trail Interpretive Center, ecological, wildlife, plants, archaeological, geological
● Low
1List of resources and uses is not exhaustive and may require input from BLM staff.2Many of the resources people place a passive use value on can also contribute to the magnitude of use values held for recreation, education, and research
opportunities at the Tuscarora Field Office.3Anticipated or expected size of associated nonmarket value (that is, high, moderate, or low).4Likelihood of changes to nonmarket value from management decisions or by changes in the resource; this information will be populated later with the
assistance of BLM resource specialists.
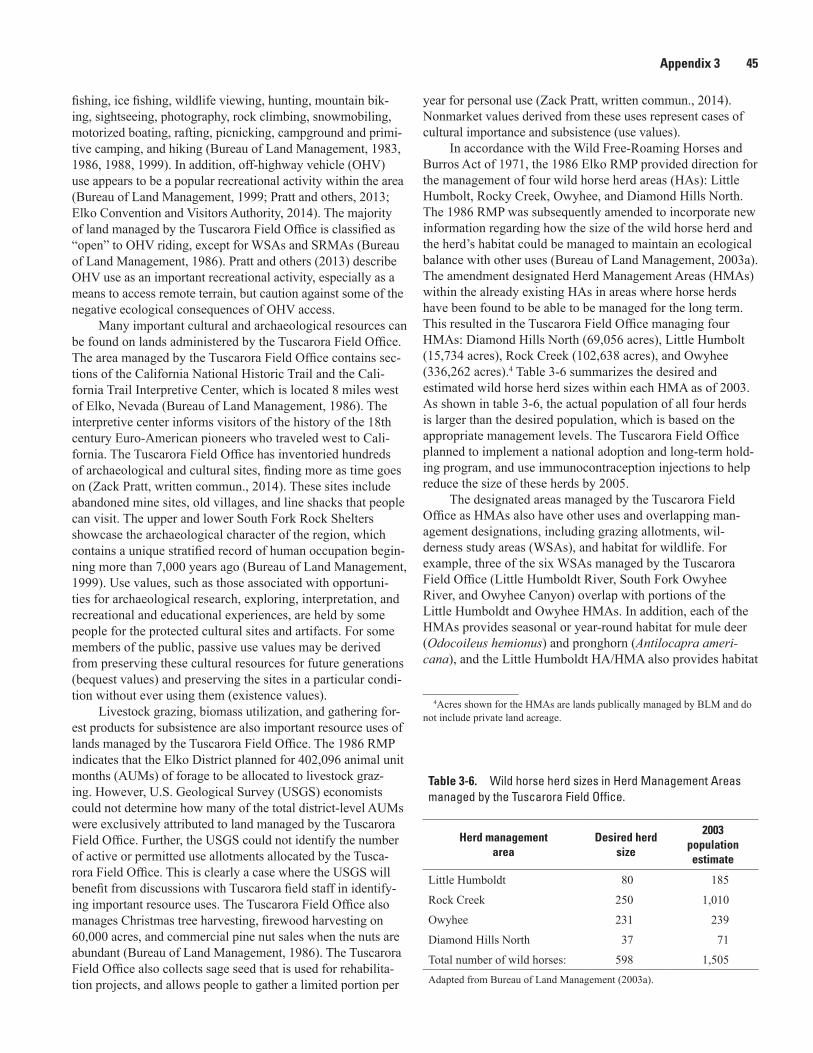
Appendix 3 45
fishing, ice fishing, wildlife viewing, hunting, mountain bik-ing, sightseeing, photography, rock climbing, snowmobiling, motorized boating, rafting, picnicking, campground and primi-tive camping, and hiking (Bureau of Land Management, 1983, 1986, 1988, 1999). In addition, off-highway vehicle (OHV) use appears to be a popular recreational activity within the area (Bureau of Land Management, 1999; Pratt and others, 2013; Elko Convention and Visitors Authority, 2014). The majority of land managed by the Tuscarora Field Office is classified as “open” to OHV riding, except for WSAs and SRMAs (Bureau of Land Management, 1986). Pratt and others (2013) describe OHV use as an important recreational activity, especially as a means to access remote terrain, but caution against some of the negative ecological consequences of OHV access.
Many important cultural and archaeological resources can be found on lands administered by the Tuscarora Field Office. The area managed by the Tuscarora Field Office contains sec-tions of the California National Historic Trail and the Cali-fornia Trail Interpretive Center, which is located 8 miles west of Elko, Nevada (Bureau of Land Management, 1986). The interpretive center informs visitors of the history of the 18th century Euro-American pioneers who traveled west to Cali-fornia. The Tuscarora Field Office has inventoried hundreds of archaeological and cultural sites, finding more as time goes on (Zack Pratt, written commun., 2014). These sites include abandoned mine sites, old villages, and line shacks that people can visit. The upper and lower South Fork Rock Shelters showcase the archaeological character of the region, which contains a unique stratified record of human occupation begin-ning more than 7,000 years ago (Bureau of Land Management, 1999). Use values, such as those associated with opportuni-ties for archaeological research, exploring, interpretation, and recreational and educational experiences, are held by some people for the protected cultural sites and artifacts. For some members of the public, passive use values may be derived from preserving these cultural resources for future generations (bequest values) and preserving the sites in a particular condi-tion without ever using them (existence values).
Livestock grazing, biomass utilization, and gathering for-est products for subsistence are also important resource uses of lands managed by the Tuscarora Field Office. The 1986 RMP indicates that the Elko District planned for 402,096 animal unit months (AUMs) of forage to be allocated to livestock graz-ing. However, U.S. Geological Survey (USGS) economists could not determine how many of the total district-level AUMs were exclusively attributed to land managed by the Tuscarora Field Office. Further, the USGS could not identify the number of active or permitted use allotments allocated by the Tusca-rora Field Office. This is clearly a case where the USGS will benefit from discussions with Tuscarora field staff in identify-ing important resource uses. The Tuscarora Field Office also manages Christmas tree harvesting, firewood harvesting on 60,000 acres, and commercial pine nut sales when the nuts are abundant (Bureau of Land Management, 1986). The Tuscarora Field Office also collects sage seed that is used for rehabilita-tion projects, and allows people to gather a limited portion per
year for personal use (Zack Pratt, written commun., 2014). Nonmarket values derived from these uses represent cases of cultural importance and subsistence (use values).
In accordance with the Wild Free-Roaming Horses and Burros Act of 1971, the 1986 Elko RMP provided direction for the management of four wild horse herd areas (HAs): Little Humbolt, Rocky Creek, Owyhee, and Diamond Hills North. The 1986 RMP was subsequently amended to incorporate new information regarding how the size of the wild horse herd and the herd’s habitat could be managed to maintain an ecological balance with other uses (Bureau of Land Management, 2003a). The amendment designated Herd Management Areas (HMAs) within the already existing HAs in areas where horse herds have been found to be able to be managed for the long term. This resulted in the Tuscarora Field Office managing four HMAs: Diamond Hills North (69,056 acres), Little Humbolt (15,734 acres), Rock Creek (102,638 acres), and Owyhee (336,262 acres).4 Table 3-6 summarizes the desired and estimated wild horse herd sizes within each HMA as of 2003. As shown in table 3-6, the actual population of all four herds is larger than the desired population, which is based on the appropriate management levels. The Tuscarora Field Office planned to implement a national adoption and long-term hold-ing program, and use immunocontraception injections to help reduce the size of these herds by 2005.
The designated areas managed by the Tuscarora Field Office as HMAs also have other uses and overlapping man-agement designations, including grazing allotments, wil-derness study areas (WSAs), and habitat for wildlife. For example, three of the six WSAs managed by the Tuscarora Field Office (Little Humboldt River, South Fork Owyhee River, and Owyhee Canyon) overlap with portions of the Little Humboldt and Owyhee HMAs. In addition, each of the HMAs provides seasonal or year-round habitat for mule deer (Odocoileus hemionus) and pronghorn (Antilocapra ameri-cana), and the Little Humboldt HA/HMA also provides habitat
4Acres shown for the HMAs are lands publically managed by BLM and do not include private land acreage.
Table 3-6. Wild horse herd sizes in Herd Management Areas managed by the Tuscarora Field Office.
Herd managementarea
Desired herd size
2003 population estimate
Little Humboldt 80 185
Rock Creek 250 1,010
Owyhee 231 239
Diamond Hills North 37 71
Total number of wild horses: 598 1,505Adapted from Bureau of Land Management (2003a).
Appendix 3
46 Inclusion of Nonmarket Values in BLM Planning and Project Assessments, Final Report
for bighorn sheep (Ovis canadensis) and supports populations of the Lahontan cutthroat trout, a federally threatened species. The Rock Creek HA/HMA has also been identified as con-taining streams where Lahontan cutthroat trout and redband trout populations thrive. Wild horses provide an example of a resource from which people can derive many different nonmarket benefits or costs. A 2013 report from the National Research Council scientifically evaluated BLM’s management of wild horses and burros, and concluded that unsustainable population growth needs to be addressed in order to maintain an overall healthy ecosystem (National Research Council, 2013). Ecological degradation from uncontrolled population growth results in nonmarket economic costs to society. The matter becomes more complicated because the wild horses and burros themselves are valued by some members of the public for their aesthetic values (use values) and cultural importance that maintain a link to the heritage of the American West (exis-tence and bequest values).

Appendix 4 47
Appendix 4. Example of Presentation Used for the Web-Based Presentation and Meeting
Appendix 4

48
Inclusion of Nonm
arket Values in BLM
Planning and Project Assessm
ents, Final Report
10/28/2016
1
FacilitatingtheInclusionofNonmarketValuesinBLMPlanningandProjectAssessments‐TaosFieldOffice
LeslieRichardson&ChrisHuber‐ USGSFortCollinsScienceCenterJoshSidon– BLMNationalOperationsCenterRebeccaMoore– BLMWashingtonOffice
MotivationsandObjectives BLMmanagedlandscontainawiderangeofnatural
resourcesthathaveconsiderablesocialandeconomicvaluetolocalcommunitiesandsocietyasawhole
Tradeoffshavetobemadetobalanceshiftingandoftencompetingdemandsplacedonourpubliclands
Understandingtheeconomicvaluethatthepublicplacesonscarceresourcescanhelpinformdecisionsinvolvingtheirallocation
“Economicsisthesciencewhichstudieshumanbehaviorasarelationshipbetweenendsandscarcemeanswhichhave
alternativeuses”(Robbins,1935)
MotivationsandObjectives The[economic]valueofresourcegoodstradedinamarketcanbe
obtainedfrominformationonthequantitysoldandmarketprice;however,marketsdonotexistforsomeresources,suchasrecreationalopportunitiesandenvironmentalservices.Measuringtheirvalueisimportant,sincewithoutthesevalueestimates,theseresourcesmaybeimplicitlyundervaluedanddecisionsregardingtheirusemaynotaccuratelyreflecttheirtruevaluetosociety.
~TaosProposedRMPandFinalEIS,2011
Nonmarketenvironmentalvalues(orsimply“nonmarketvalues”)revealthebenefitsindividualsattributetoexperiencesoftheenvironment,usesofnaturalresources,ortheexistenceofparticularecologicalconditionsthatdonotinvolvemarkettransactions,andthereforelackprices.
~BLMInstructionMemorandum2013‐131
MotivationsandObjectives
RegionalEconomicImpactAnalysis
• Jobs!Jobs!Jobs!• Focusesonlocalincomeandemploymentchanges
• Reflectsdirectspendingandpublicuseandindirectormultipliereffects
• Fromanationalviewpoint,atransferofeconomicactivity:gains(losses)inonecountyoffsetbylosses(gains)inothercounties
TypesofEconomicAnalysisBenefit‐CostAnalysis
• Considersthefullrangeofeconomicbenefitsandcoststosociety
• Benefitstousers(consumerandproducersurplus)
• Costsarespendingandopportunitycosts
• Economicefficiencygoalistomaximizenetbenefits(TB‐TC)
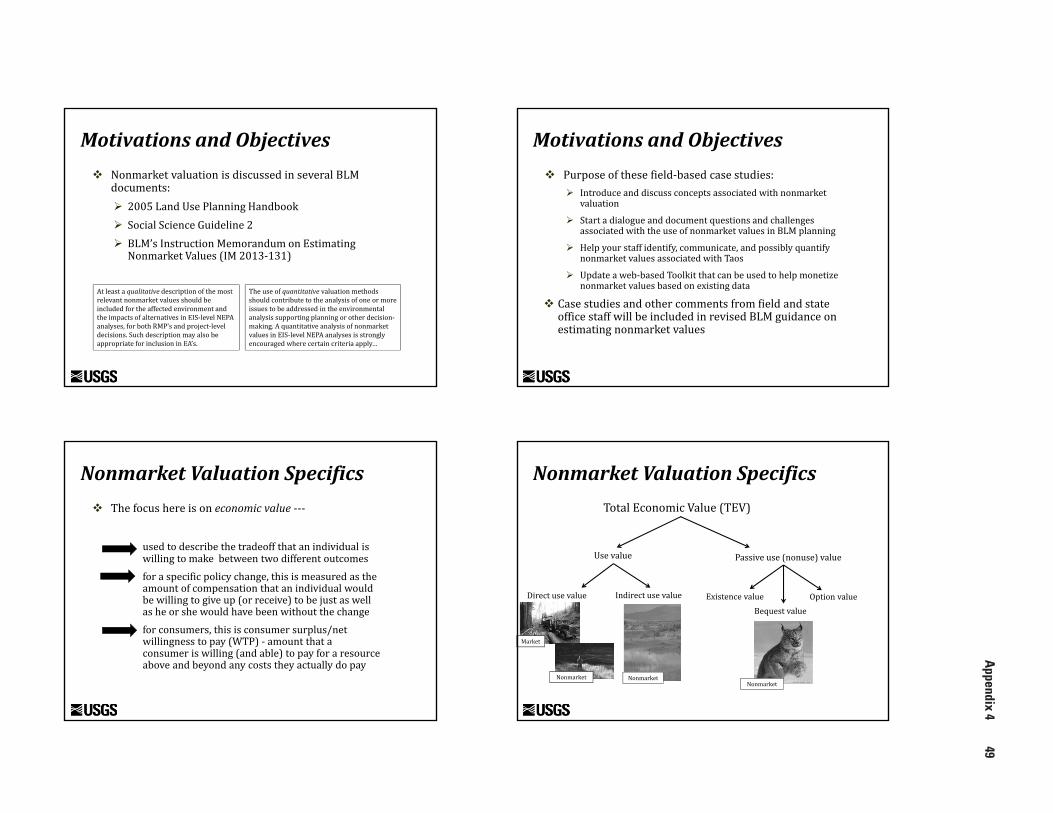
Appendix 4
4910/28/2016
2
MotivationsandObjectives NonmarketvaluationisdiscussedinseveralBLM
documents: 2005LandUsePlanningHandbook SocialScienceGuideline2 BLM’sInstructionMemorandumonEstimatingNonmarketValues(IM2013‐131)
Atleastaqualitative descriptionofthemostrelevantnonmarketvaluesshouldbeincludedfortheaffectedenvironmentandtheimpactsofalternativesinEIS‐levelNEPAanalyses,forbothRMP’sandproject‐leveldecisions.SuchdescriptionmayalsobeappropriateforinclusioninEA’s.
Theuseofquantitative valuationmethodsshouldcontributetotheanalysisofoneormoreissuestobeaddressedintheenvironmentalanalysissupportingplanningorotherdecision‐making.AquantitativeanalysisofnonmarketvaluesinEIS‐levelNEPAanalysesisstronglyencouragedwherecertaincriteriaapply…
MotivationsandObjectives Purposeofthesefield‐basedcasestudies:
Introduceanddiscussconceptsassociatedwithnonmarketvaluation
StartadialogueanddocumentquestionsandchallengesassociatedwiththeuseofnonmarketvaluesinBLMplanning
Helpyourstaffidentify,communicate,andpossiblyquantifynonmarketvaluesassociatedwithTaos
Updateaweb‐basedToolkitthatcanbeusedtohelpmonetizenonmarketvaluesbasedonexistingdata
CasestudiesandothercommentsfromfieldandstateofficestaffwillbeincludedinrevisedBLMguidanceonestimatingnonmarketvalues
NonmarketValuationSpecifics Thefocushereisoneconomicvalue‐‐‐
usedtodescribethetradeoffthatanindividualiswillingtomakebetweentwodifferentoutcomesforaspecificpolicychange,thisismeasuredastheamountofcompensationthatanindividualwouldbewillingtogiveup(orreceive)tobejustaswellasheorshewouldhavebeenwithoutthechangeforconsumers,thisisconsumersurplus/netwillingnesstopay(WTP)‐ amountthataconsumeriswilling(andable)topayforaresourceaboveandbeyondanycoststheyactuallydopay
NonmarketValuationSpecificsTotalEconomicValue(TEV)
Usevalue Passiveuse(nonuse)value
Directusevalue Indirectusevalue Existencevalue OptionvalueBequestvalue
Market
Nonmarket NonmarketNonmarket

50
Inclusion of Nonm
arket Values in BLM
Planning and Project Assessm
ents, Final Report
10/28/2016
3
NonmarketValuationSpecifics
“Federalagencieswithresponsibilitiesrelatingtoecosystemsandtheirservices(e.g.,EPA,NOAA,DOI,USDA)shouldbetaskedwithusingbestavailabletechniquesto
developvaluationsfortheecosystemservicesaffectedbytheirdecision‐makingandfactoringtheresultsintoanalysesthatinformtheirmajorplanningandmanagement
decisions.”– PCAST,2011
Howdononmarketvaluesrelatetoecosystemservicevalues? Ecosystemgoodsandservicesincludearangeofhuman
benefitsresultingfromappropriateecosystemstructureandfunction,suchasfloodcontrolfromintactwetlandsandcarbonsequestrationfromhealthyforests.Someinvolvecommoditiessoldinmarkets.Othersdonotcommonlyinvolvemarkets,andthusreflectnonmarketvalues.
~BLM,IM2013‐131
NonmarketValuationSpecifics Methodsusedtoestimatenonmarketvalues:
1)Primary(new)research
2)Secondary/existingdata
Existingdatabasesandtools,suchastheBenefitTransferToolkit,canhelpfacilitatebenefittransfers
RevealedPreferenceMethods‐ drawstatisticalinferencesonvaluesbasedonactualchoicespeoplemakewithinmarkets
StatedPreferenceMethods‐ relyonanswerstocarefullywordedsurveyquestions.Thoseanswers‐‐intheformofmonetaryamounts,choices,ratings,orotherindicationsofpreference‐‐arescaledfollowinganappropriatemodelofpreferencetoyieldameasureofeconomicvalue
BenefitTransferMethods– useofexistingnonmarketvalueestimatesorfunctions
NonmarketValuationSpecifics Challengesassociatedwiththeuseofnonmarket
valuationinBLMplanningdoexist
However,therearemanyopportunitiesfordescribingnonmarketvaluesinBLMplanning(BLM,IM2013‐131): Selectivelyconsidernonmarketvalues
Focusonthedifferenceinchangestononmarketvaluesbetweenactionalternatives
Valuescanbedescribedqualitativelyorquantitatively
NonmarketValuesAssociatedwithTaos TaosProposedRMPandFinalEIS,2011
“Theeconomicanalysisassessestheeconomiceffectsofthedirectuseofresourcesintermsofjobsandincome.Thistypeofanalysisdoesnotincludeothertypesofeconomicvalueoftenreferredtoasnonmarketvalues,whicharediscussedinsection3.4.10.Nonmarketvaluesareimportanttothewelfareofvisitors,arearesidents,andothercommunitiesinsideandoutsidetheplanningarea.”
DiscussesnonmarketvaluesqualitativelyinChapters2,3,and4
“Whileuseandnonusevaluesexistfortheplanningarea,evaluationisnotalwaysfeasibleduringtheplanningprocess.Thisdoesnotprecludetheirconsiderationintheplanningprocess,however.”
AgoalofthisUSGS‐BLMpilotprojectistotaketheanalysisofnonmarketvaluesafewstepsfurther,anddocumenttheprocessofdoingso

Appendix 4
5110/28/2016
4
NonmarketValuesAssociatedwithTaos
1:Listofresourcesandusesisnotexhaustive,andmayrequireinputfromBLMstaff.2:Anticipatedorexpectedsizeofassociatednonmarketvalue‐ (e.g.high,moderate,orlow)3:Likelihoodofchangestononmarketvaluefrommanagementdecisionsorbychangesintheresource;thisinformationwillbe populatedlaterwiththeassistanceofBLMresourcespecialists.
TaosFieldOffice Importanceinplanningeffort(s):
ResourcesandUses1: Usevalues: Passiveusevalues: Magnitudeofvalue:2Risk/vulnerability/
sensitivity:3
Threatened,endangered,andrarespecies‐ southwesternwillowflycatcher,baldeagle,ferruginoushawks,Gunnisonprairiedog,SantaFecholla,gramma grasscactus,cutthroattrout,goldeneagle,peregrinefalcon,raptorspeciesandtheirnestingsites
High
Biomassutilization ‐ collectionofspecialforestproductsandfuelwoodcollection Low
Wildlife‐bighornsheep,pronghornantelope,muledeer,elk,mountainlion,bobcat,riverotters,blackbear,coyote,greyfox,beaver,muskrat,rabbits,collardlizard,bullfrog,rattlesnake,bats,hummingbirds,sandhill crane,heron,and133speciesofbirds
Moderate
Wildernessandwildernessstudyareas(WSA) ‐ SabinosoWilderness(16,030acres),SanAntonioWSA(7,371acres),andRioChamaWSA(11,128acres)
High
SpecialDesignationsandprotectedareas‐RioGrandeDelNorteNationalMonument,RioChama(32miles),RedRiver(4miles),RioGrande(68miles),andaRioGrandestudysegment(7miles)
High
Historictrails‐ ElCaminoRealdeTierraAdentroNationalHistoricTrail(41miles),OldSpanishNationalHistoricTrail Low
Recreation‐ boating,sightseeing,camping,biking,swimming,horsebackriding,interpretation,fishing,picnicking,wildlifeviewing,whitewaterraftingandkayaking
High
Archaeological‐ historicsitesintheGalisteoBasin,NativeAmericanrockart,Spanishcolonialsettlements,WardRanch,LaCieneguillaPetroglyphs,PosiPueblo
Moderate
Paleontologicalandgeological‐ RioGrandeRift,RioGrandeGorge,TaosPlateauvolcanicfield,fossils Low
Educationandresearch ‐ ecological,wildlife,plants,paleontological,archaeological,geological LowtoModerate
NextSteps… UpdatetheBenefitTransferToolkit(next6months) Workwithyourstafftoobtaindataregardinghowcertain
resourceusesandenvironmentalservicesareexpectedtochangewithmanagementundertheapprovedRMP
ComeouttoyourfieldofficethisfalltodiscusstheToolkit;nonmarketvaluesassociatedwithTaos;challengesandopportunitiesassociatedwiththeuseofnonmarketvaluesinBLMplanning
Workwithyourstafftodeveloplanguagethateffectivelycommunicatesnonmarketvalueconceptsinplanningdocumentsandlearnhowtoincorporatetheseconceptsintolandmanagementplanningtoassistdecision‐making
ReferencesBagstad,K.J.,D.Semmens,R.Winthrop,D.Jaworski,andJ.Larson.2012.Ecosystemservicesvaluationtosupportdecisionmakingonpubliclands:AcasestudyfortheSanPedroRiver,Arizona.USGSScientificInvestigationsReport2012‐5251.[Link]
BLM.2005.BLMSocialScienceGuideline2– ModelScopeofWorkforSocio‐economicAnalysisinResourceManagementPlans.Version1.5
BLM.2005.H‐1601‐1– LandUsePlanningHandbook.
BLM.2012.SocioeconomicBaselineReportfortheRMP’sfortheRedCliffsandBeaverDamWashNationalConservationAreas.
BLM.2013.InstructionMemorandumNo.2013‐131.GuidanceonEstimatingNonmarketEnvironmentalValues.
Robbins,L.1932.Anessayonthenatureandsignificanceofeconomicscience.London:Macmillan.

52 Inclusion of Nonmarket Values in BLM Planning and Project Assessments, Final Report
Appendix 5. Example of Presentation Used for the In-Person Meeting
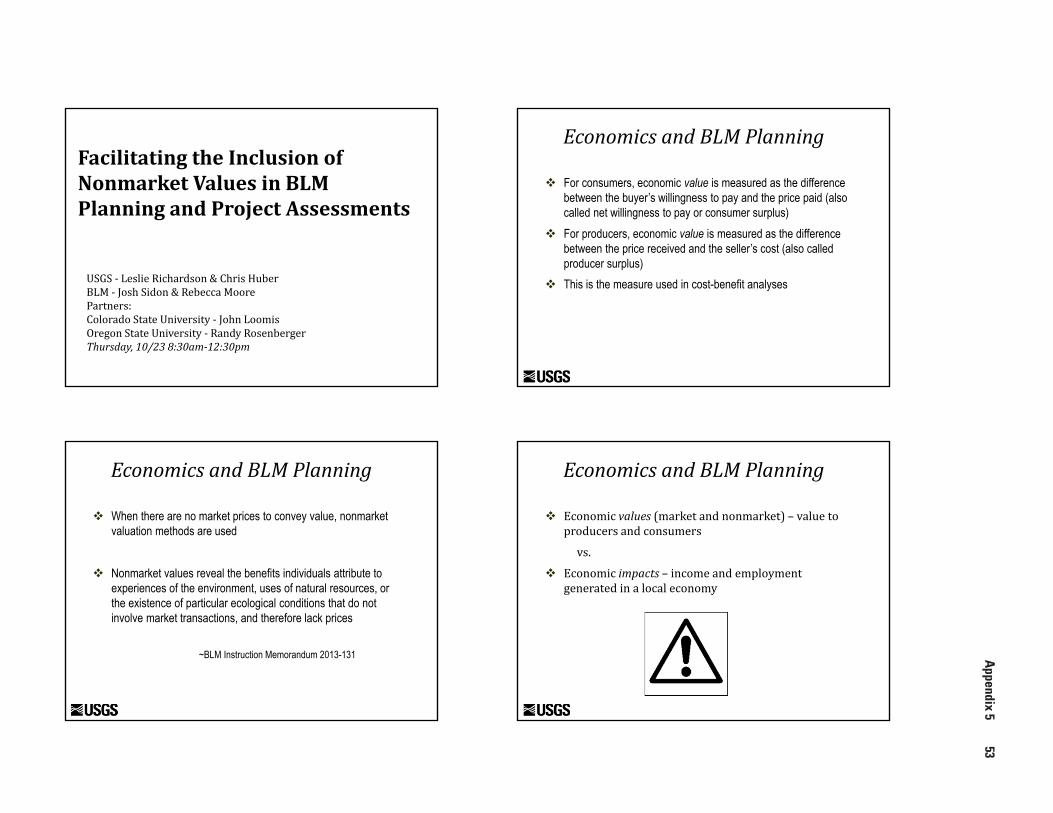
Appendix 5
53
Appendix 5
10/28/2016
1
FacilitatingtheInclusionofNonmarketValuesinBLMPlanningandProjectAssessments
USGS‐ LeslieRichardson&ChrisHuberBLM ‐ JoshSidon&RebeccaMoorePartners:ColoradoStateUniversity‐ JohnLoomisOregonStateUniversity‐ RandyRosenbergerThursday,10/238:30am‐12:30pm
EconomicsandBLMPlanning
For consumers, economic value is measured as the difference between the buyer’s willingness to pay and the price paid (also called net willingness to pay or consumer surplus)
For producers, economic value is measured as the difference between the price received and the seller’s cost (also called producer surplus)
This is the measure used in cost-benefit analyses
EconomicsandBLMPlanning
When there are no market prices to convey value, nonmarket valuation methods are used
Nonmarket values reveal the benefits individuals attribute to experiences of the environment, uses of natural resources, or the existence of particular ecological conditions that do not involve market transactions, and therefore lack prices
~BLM Instruction Memorandum 2013-131
EconomicsandBLMPlanning
Economicvalues (marketandnonmarket)– valuetoproducersandconsumers
vs.
Economicimpacts– incomeandemploymentgeneratedinalocaleconomy
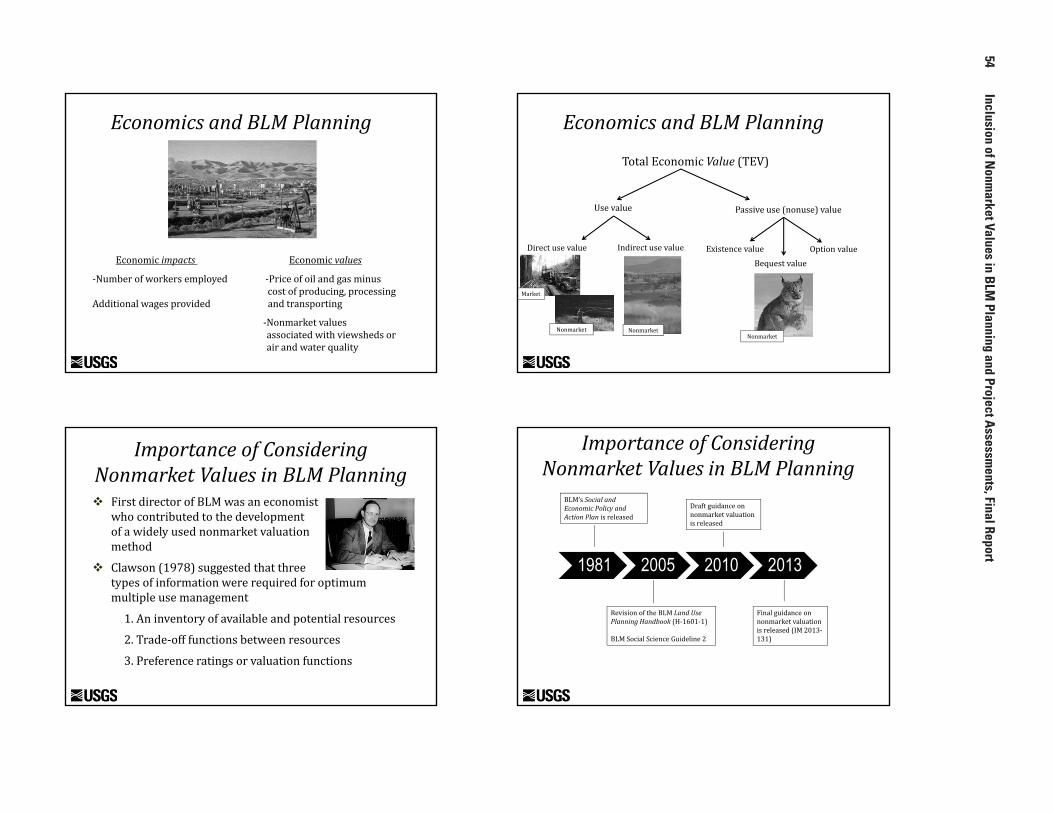
54
Inclusion of Nonm
arket Values in BLM
Planning and Project Assessm
ents, Final Report
10/28/2016
2
EconomicsandBLMPlanning
Economicimpacts Economicvalues
‐Numberofworkersemployed ‐Priceofoilandgasminuscostofproducing,processing
Additionalwagesprovided andtransporting
‐Nonmarketvaluesassociatedwithviewsheds orairandwaterquality
EconomicsandBLMPlanning
TotalEconomicValue (TEV)
Usevalue
Directusevalue Indirectusevalue
Passiveuse(nonuse)value
ExistencevalueBequestvalue
Optionvalue
NonmarketNonmarket
Market
Nonmarket
ImportanceofConsideringNonmarketValuesinBLMPlanning FirstdirectorofBLMwasaneconomist
whocontributedtothedevelopmentofawidelyusednonmarketvaluationmethod
Clawson(1978)suggestedthatthreetypesofinformationwererequiredforoptimummultipleusemanagement
1.Aninventoryofavailableandpotentialresources
2.Trade‐offfunctionsbetweenresources
3.Preferenceratingsorvaluationfunctions
ImportanceofConsideringNonmarketValuesinBLMPlanning
BLM’sSocialandEconomicPolicyandActionPlan isreleased
RevisionoftheBLMLandUsePlanningHandbook(H‐1601‐1)
BLMSocialScienceGuideline2
1981 2005 2010 2013
Draftguidanceonnonmarketvaluationisreleased
Finalguidanceonnonmarketvaluationisreleased(IM2013‐131)

Appendix 5
5510/28/2016
3
ImportanceofConsideringNonmarketValuesinBLMPlanning“TheDraftRMP/EISdoesnotaccountforthenon‐marketvaluesassociatedwithundevelopedwildlands.Non‐marketvalueshavebeenmeasuredandquantifiedfordecades.Thereisawell‐establishedbodyofeconomicresearchonthemeasurementofnon‐marketvalues,andthephysicalchanges(decreasesinthesourceofthesevalues)broughtaboutbyoilandgasdevelopmentandmotorizedrecreationareveryeasytomeasurequantitatively.Oneofthemostimportantpurposesofpubliclandsistheprovisionofpublicgoods.Non‐marketgoodsoftenfallintothecategoryofpublicgoods.Thesearethingslikeopportunitiesforsolitude,outdoorrecreation,cleanair,cleanwater,thepreservationofwildernessandotherundevelopedareasthatwouldbeunderprovidedifleftentirelytomarketforces.TheBLMhasaninherentresponsibilitytoseethatthesepublicgoodsareprovidedandinquantitiesthatmeetthedemand,notjustoflocalresidents,butofeveryU.S.citizen.Thisanalysisisespeciallyimportantwhenconsideringtheprotectionoflandswithwildernesscharacteristicssincetheselandsproducebenefitsandvaluesthatareseldomcapturedintheexistingmarketstructure….”
~NonprofitgroupscommentonDraftRMP/EISfortheSonoranDesertNationalMonumentandLowerSonoranFieldOffice,2011
ImportanceofConsideringNonmarketValuesinBLMPlanning“Changesinnonmarketvaluesarenotwelldescribedorquantifiedintheanalysis.Thesevaluesaffecttheeconomicwell‐being,health,andresiliencyoflocalcommunities.Asanexample,cleandrinkingwaterisavaluablecommodityproducedbyBLMforests.TherearedozensofdrinkingwatersystemsfedinpartbyBLMlands(p.I‐1120).BLMmanagementintheseareasisofkeyeconomicimportancebecauseasforestcoverdecreasesinaSourceWaterProtectionArea,treatmentcostsgenerallyincrease.”
~USEPAcommentonDraftEISfortheRevisionoftheRMP’softheWesternOregonBLMDistrictsofSalem,Eugene,Roseburg,CoosBay,andMedford,andtheKlamathFallsResourceAreaoftheLakeviewDistrict,2008
ImportanceofConsideringNonmarketValuesinBLMPlanning“…alimitationofinput/outputeconomicanalysisandvisitorusefiguresliesinthesimplefactthattheIOmodelisonlyconcernedwithusefiguresofnonresidents.TheBLMrecreationprogramisoftengearedtosupplylocalcustomerdemandwhereasanIOmodelandthevisitorusedatasupportingitdoesnotrecognizeeconomicbenefitsaccruedasaresultofrecreationenhancementstosupportlocalcommunityresidents.Anon‐marketanalysistechnique(suchasContingentValuationMethod)isfarsuperiortocapturingthetrueeconomiccontributionofrecreationmanagement.BasedontimeanddataconstraintsthisplanwilluseanIOmodeltocalculatetheeconomicbenefitsofrecreation,thereforevisitorusedatainsupportofthisanalysiswillonlybecompiledfornonresidentvisitors.”
‐LanderFieldOfficeDraftRMP/EIS,2011
ImportanceofConsideringNonmarketValuesinBLMPlanning Comprehensiveinformationontheeconomiceffects
ofamanagementactioncanhelpagenciesmakeinformeddecisionsregardingthemanagementandallocationofscarceresources
Consideringnonmarketeconomicvaluesprovidesamorecompleteaccountofthehumanbenefitsandcostsofproposedactionsthanmarketdataalone
TherehavebeenexamplesofnonmarketvaluesincludedinBLMplanningefforts,buttheseareisolatedexamples

56
Inclusion of Nonm
arket Values in BLM
Planning and Project Assessm
ents, Final Report
10/28/2016
4
NonmarketValuationMethods
Nonmarketvaluescanbedescribed:
1.Quantitatively($)byconductingaprimary(new)study
2.Quantitatively($)byapplyingexistingdatafromcompletednonmarketvaluationstudy(referredtoasbenefittransfer)
3.Qualitatively
NonmarketValuationMethods–PrimaryStudies
RevealedPreferenceMethods Drawstatisticalinferencesonvaluesbasedonactualchoices
peoplemakewithinmarkets(Boyle,2003)
Travelcostmodelsarecommonlyusedtoestimatenonmarketvaluesforrecreationactivities
Source: Loomis, 2005
NonmarketValuationMethods–PrimaryStudies
RevealedPreferenceMethods Loomis,J.,W.Doyle,A.Goldhor‐Wilcock,andR.Allen.2005.
EstimatingRecreationBenefitsatSelectedBLMRecreationSitesUsingtheTravelCostMethodandTestingforTransferabilityBetweenBLMRecreationSites‐ usedthetravelcostmethodtoestimaterecreationbenefitsatarangeofBLMsites
Table E-1 Recreation Benefits per Person per Visit and Total Annual Consumer Surplus.
Site Name State Completed Estimated Average Surveys Visitor Use Benefits Annual Benefits
Steese NCA AK 66 10,495 $48 $503,760Anasazi Center/Canyons of Ancients CO 250 120,650 $19 $2,292,350Mackay Reservoir ID 125 12,152 $53 $644,056Wild Rivers Rec Area NM 132 256,503 $20 $5,130,060Cavitt Creek Falls OR 140 4,500 $37 $166,500Clay Creek &Whittaker Creek OR 84 16,810 $42 $706,020Gerber& Topsy Rec Sites OR 139 4,200 $67 $281,400Yaquina Head Natural Area OR 420 328,964 $7 $2,302,748Upper Green River SRMA WY 126 9,805 $44 $431,420
NonmarketValuationMethods–PrimaryStudies
RevealedPreferenceMethods Loomis,J.2006.EstimatingRecreationUse,
ExpendituresandEconomicBenefitsatLittleSnakeRiverResourceAreaUsingVisitorDataandTravelCostMethod ‐ usedthetravelcostmethodtoestimaterecreationbenefitsatsiteswithintheLittleSnakeRiverResourceArea
Resultsshowthat,onaverage,visitorstotheSandwash area(OHV/ATVuse)receiveaneteconomicbenefitof$29perday,andvisitorstootherareasintheLittleSnakeRiverResourceArea(non‐motorizedrecreationuse)receiveanetbenefitof$8pervisitorday
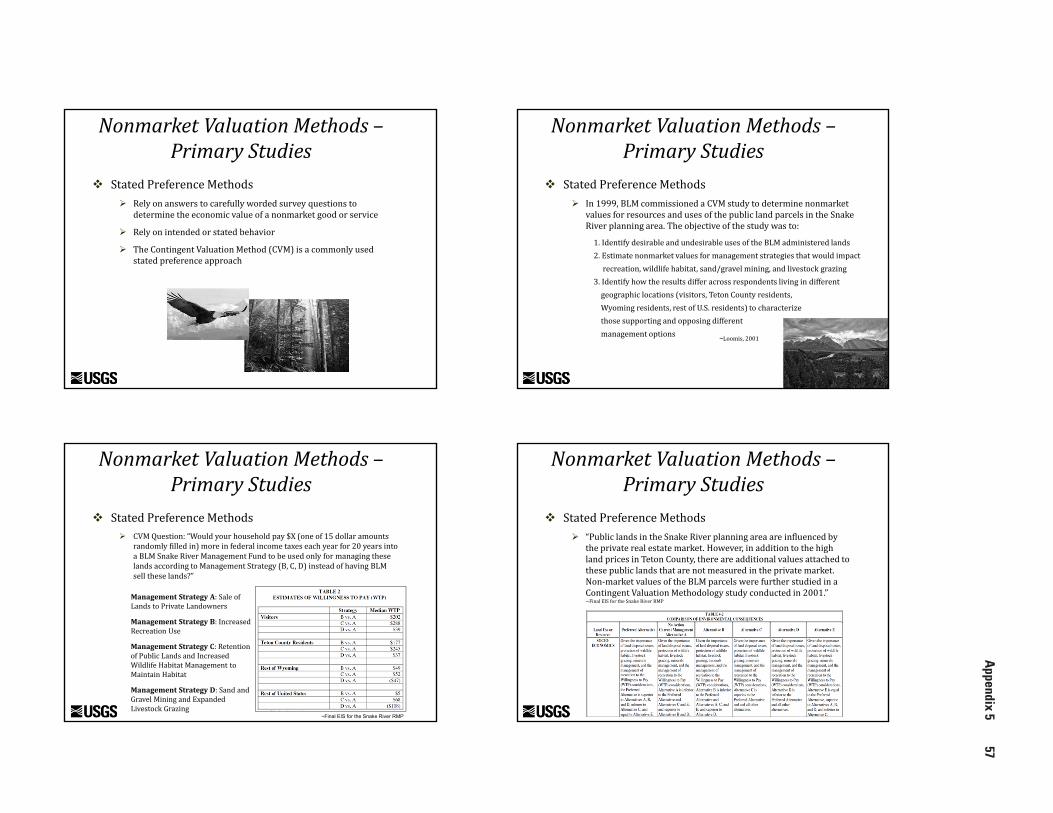
Appendix 5
5710/28/2016
5
NonmarketValuationMethods–PrimaryStudies
StatedPreferenceMethods Relyonanswerstocarefullywordedsurveyquestionsto
determinetheeconomicvalueofanonmarketgoodorservice
Relyonintendedorstatedbehavior
TheContingentValuationMethod(CVM)isacommonlyusedstatedpreferenceapproach
NonmarketValuationMethods–PrimaryStudies
StatedPreferenceMethods In1999,BLMcommissionedaCVMstudytodeterminenonmarket
valuesforresourcesandusesofthepubliclandparcelsintheSnakeRiverplanningarea.Theobjectiveofthestudywasto:
1.IdentifydesirableandundesirableusesoftheBLMadministeredlands2.Estimatenonmarketvaluesformanagementstrategiesthatwouldimpactrecreation,wildlifehabitat,sand/gravelmining,andlivestockgrazing
3.Identifyhowtheresultsdifferacrossrespondentslivingindifferentgeographiclocations(visitors,TetonCountyresidents,Wyomingresidents,restofU.S.residents)tocharacterizethosesupportingandopposingdifferentmanagementoptions ~Loomis,2001
NonmarketValuationMethods–PrimaryStudies
StatedPreferenceMethods CVMQuestion:“Wouldyourhouseholdpay$X(oneof15dollaramounts
randomlyfilledin)moreinfederalincometaxeseachyearfor20yearsintoaBLMSnakeRiverManagementFundtobeusedonlyformanagingtheselandsaccordingtoManagementStrategy(B,C,D)insteadofhavingBLMselltheselands?”
ManagementStrategyA:SaleofLandstoPrivateLandowners
ManagementStrategyB:IncreasedRecreationUse
ManagementStrategyC:RetentionofPublicLandsandIncreasedWildlifeHabitatManagementtoMaintainHabitat
ManagementStrategyD:SandandGravelMiningandExpandedLivestockGrazing
~Final EIS for the Snake River RMP
NonmarketValuationMethods–PrimaryStudies
StatedPreferenceMethods “PubliclandsintheSnakeRiverplanningareaareinfluencedby
theprivaterealestatemarket.However,inadditiontothehighlandpricesinTetonCounty,thereareadditionalvaluesattachedtothesepubliclandsthatarenotmeasuredintheprivatemarket.Non‐marketvaluesoftheBLMparcelswerefurtherstudiedinaContingentValuationMethodologystudyconductedin2001.”~FinalEISfortheSnakeRiverRMP
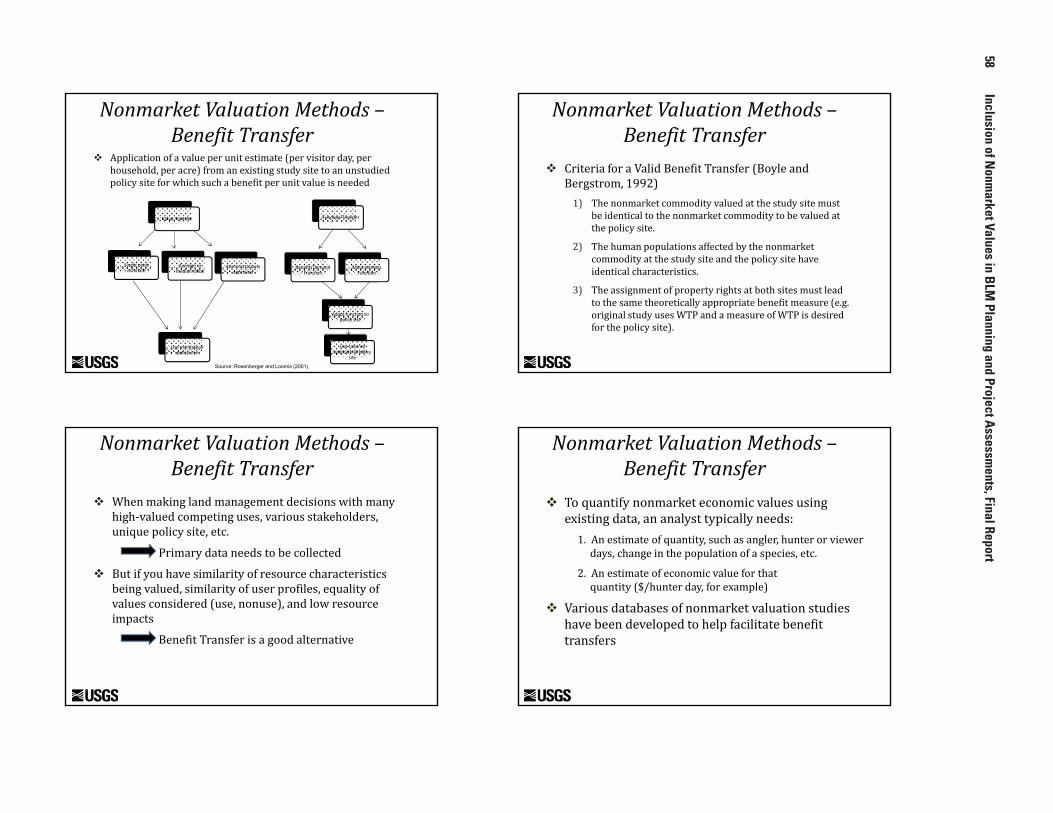
58
Inclusion of Nonm
arket Values in BLM
Planning and Project Assessm
ents, Final Report
10/28/2016
6
NonmarketValuationMethods–BenefitTransfer
Applicationofavalueperunitestimate(pervisitorday,perhousehold,peracre)fromanexistingstudysitetoanunstudiedpolicysiteforwhichsuchabenefitperunitvalueisneeded
Value Transfer
Single point estimate
Average or median value
Administratively approved
Use estimate at policy site
Function Transfer
Benefit/Demand Function
Meta‐analysisFunction
Adapt function to policy site
Use tailored estimate at policy
site
Source: Rosenberger and Loomis (2001)
NonmarketValuationMethods–BenefitTransfer
CriteriaforaValidBenefitTransfer(BoyleandBergstrom,1992)1) Thenonmarketcommodityvaluedatthestudysitemust
beidenticaltothenonmarketcommoditytobevaluedatthepolicysite.
2) Thehumanpopulationsaffectedbythenonmarketcommodityatthestudysiteandthepolicysitehaveidenticalcharacteristics.
3) Theassignmentofpropertyrightsatbothsitesmustleadtothesametheoreticallyappropriatebenefitmeasure(e.g.originalstudyusesWTPandameasureofWTPisdesiredforthepolicysite).
NonmarketValuationMethods–BenefitTransfer
Whenmakinglandmanagementdecisionswithmanyhigh‐valuedcompetinguses,variousstakeholders,uniquepolicysite,etc.
Primarydataneedstobecollected
Butifyouhavesimilarityofresourcecharacteristicsbeingvalued,similarityofuserprofiles,equalityofvaluesconsidered(use,nonuse),andlowresourceimpacts
BenefitTransferisagoodalternative
NonmarketValuationMethods–BenefitTransfer
Toquantifynonmarketeconomicvaluesusingexistingdata,ananalysttypicallyneeds:1.Anestimateofquantity,suchasangler,hunterorviewerdays,changeinthepopulationofaspecies,etc.
2.Anestimateofeconomicvalueforthatquantity($/hunterday,forexample)
Variousdatabasesofnonmarketvaluationstudieshavebeendevelopedtohelpfacilitatebenefittransfers

Appendix 5
5910/28/2016
7
NonmarketValuationMethods–BenefitTransfer
BLM‐USGSEcosystemServicesValuationPilot– Phase1Findings(Bagstad etal.,2012):Whileappreciatingthepotentialpitfallsofvaluetransfer,itcancertainlybeusefulfordecision‐makinginBLM,particularlyiffunctionsareincorporatedintowell‐documented,userfriendlyspreadsheetsliketheBenefitTransferToolkit.SupportforkeepingthisToolkituptodateandincorporatingadditionaltransferfunctionsfromtheliteratureintoasimilarframeworkwouldbeworthwhileforBLMandotheragenciestoconsider.
BenefitTransferToolkit
Provides users a means to estimate nonmarket values for various recreation activities and T&E species based on:
Single Point Estimate Transfer
Average Value Transfer
Meta‐Regression Function Transfer
Value Transfer
Single Point Estimate
Average or Median Value
Administratively Approved
Use Estimate at Policy Site
Function Transfer
Benefit/Demand Function
Meta‐analysisFunction
Adapt Function to Policy Site
Use Tailored Estimate at Policy
Site
TheBenefitTransferToolkit
Methodology &Limitations
Examples in Planning
Home WelcometoTheBenefitTransferToolkit….
ValueTransferOptions(selectone): Camping Fishing GeneralRecreation Hiking Hunting Off‐HighwayVehicle(OHV) MountainBiking WildlifeViewing RockClimbing Kayaking,Boating,andCanoeing Threatened&EndangeredSpecies
FunctionTransferOptions(selectone): RecreationalTrailUse Hunting Fishing WildlifeViewing Threatened&EndangeredSpecies……
FAQs
Contact the help desk
Go to Value Transfer
Go to Function Transfer

60
Inclusion of Nonm
arket Values in BLM
Planning and Project Assessm
ents, Final Report
10/28/2016
8
TheBenefitTransferToolkitValueTransfer
Methodology& Limitations
Examples in Planning
Home
FAQs
Contact the help desk
Average values Individualstudies
Full dataset
Reference Location Site Name ValuationMethod
Economic Value
Estimate(2013$)
Units
Daniels, S.E. 1987. Marginal cost pricing and the efficient provision of public recreation. Journal of Leisure Research 19(1):22-34.
MT Seeley Lake Travel Cost Method $37.92
Per Person Per Day
Findeis, J.L. and E.L. Michalson. 1984. The demand for and value of outdoor recreation in the TargheeNational Forest, Idaho. Bulletin No. 627. Moscow, ID: Agricultural Experiment Station, University of Idaho.
ID Targhee National Forest
Travel Cost Method $47.68 Per Person Per
Day
………………
Camping
TheBenefitTransferToolkitValueTransfer
TheBenefitTransferToolkitValueTransfer
Methodology& Limitations
Examples in Planning
Home
FAQs
Contact the help desk
Average values Individualstudies
Full dataset
Reference Location Landownership& Type
Wilderness Name Survey Type
Year Data Were
Collected
Daniels, S.E. 1987. Marginal cost pricing and the efficient provision of public recreation. Journal of Leisure Research 19(1):22-34.
MT National Forest --- Mail 1984
Findeis, J.L. and E.L. Michalson. 1984. The demand for and value of outdoor recreation in the TargheeNational Forest, Idaho. Bulletin No. 627. Moscow, ID: Agricultural Experiment Station, University of Idaho.
ID National Forest --- Mixed Modes 1974
………………
Camping
TheBenefitTransferToolkitValueTransfer

Appendix 5
6110/28/2016
9
TheBenefitTransferToolkitValueTransfer
Methodology& Limitations
Examples in Planning
Home
FAQs
Contact the help desk
StepsforaSinglePointEstimateTransfer
1.Identifytheresourcesaffectedbyaproposedactionoralternative.2.Translateresourceimpactstochangesinrecreationaluse.3.Estimaterecreationusechanges.4.Searchthespreadsheetdataforrelevantstudysites.5.Assessrelevanceandapplicabilityofstudysitedata.6.Selectabenefitmeasurefromasinglerelevantstudyorarangeofbenefitmeasuresifmorethanonestudyisrelevant.7.Multiplybenefitmeasurebytotalchangeinrecreationuse.
~RosenbergerandLoomis,2001
TheBenefitTransferToolkitValueTransfer
Methodology& Limitations
Examples in Planning
Home
FAQs
Contact the help desk
StepsforanAverageValueTransfer
1.Identifytheresourcesaffectedbyaproposedaction.2.Translateresourceimpactstochangesinrecreationaluse.3.Estimaterecreationusechanges.4.Searchthespreadsheetforrelevantstudysites.5.Assessrelevanceandapplicabilityofstudysitedata.6.Useaverage‐valueprovidedforthatactivityinthatregion,orcalculateanaverageofasubsetofapplicablestudyvalues.7.Multiplybenefitvaluebytotalchangeinrecreationuse.
~RosenbergerandLoomis,2001
TheBenefitTransferToolkitValueTransfer
Methodology& Limitations
Examples in Planning
Home
FAQs
Contact the help desk
Average values Individualstudies
Full dataset
Alaska Pacific Coast Intermountain Northeast Southeast Multiple Areas
N Mean N Mean N Mean N Mean N Mean N Mean
1 $14.39 10 $28.65 52 $21.75 15 $23.95 12 $19.44 7 $16.04
Camping
TheBenefitTransferToolkitValueTransfer
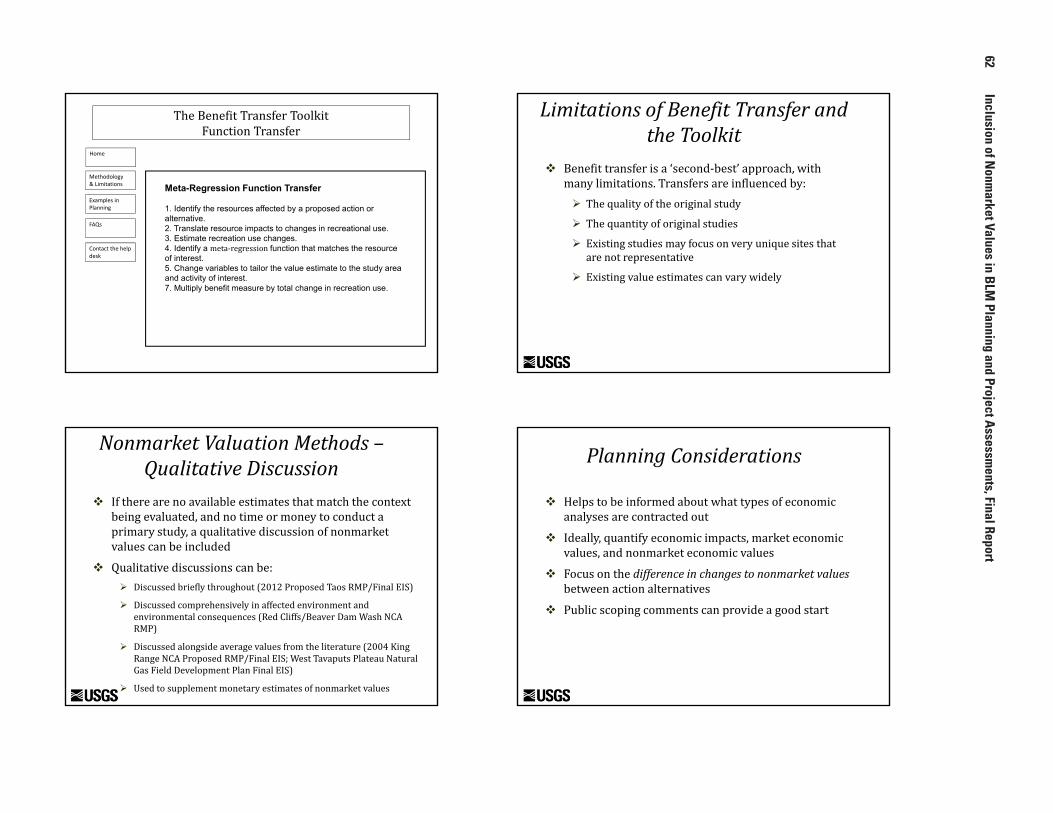
62
Inclusion of Nonm
arket Values in BLM
Planning and Project Assessm
ents, Final Report
10/28/2016
10
TheBenefitTransferToolkitFunctionTransfer
Methodology& Limitations
Examples in Planning
Home
FAQs
Contact the help desk
Meta-Regression Function Transfer
1. Identify the resources affected by a proposed action or alternative.2. Translate resource impacts to changes in recreational use.3. Estimate recreation use changes.4. Identify a meta‐regression function that matches the resource of interest.5. Change variables to tailor the value estimate to the study area and activity of interest.7. Multiply benefit measure by total change in recreation use.
LimitationsofBenefitTransferandtheToolkit
Benefittransferisa‘second‐best’approach,withmanylimitations.Transfersareinfluencedby: Thequalityoftheoriginalstudy
Thequantityoforiginalstudies
Existingstudiesmayfocusonveryuniquesitesthatarenotrepresentative
Existingvalueestimatescanvarywidely
NonmarketValuationMethods–QualitativeDiscussion
Iftherearenoavailableestimatesthatmatchthecontextbeingevaluated,andnotimeormoneytoconductaprimarystudy,aqualitativediscussionofnonmarketvaluescanbeincluded
Qualitativediscussionscanbe: Discussedbrieflythroughout(2012ProposedTaosRMP/FinalEIS)
Discussedcomprehensivelyinaffectedenvironmentandenvironmentalconsequences(RedCliffs/BeaverDamWashNCARMP)
Discussedalongsideaveragevaluesfromtheliterature(2004KingRangeNCAProposedRMP/FinalEIS;WestTavaputsPlateauNaturalGasFieldDevelopmentPlanFinalEIS)
Usedtosupplementmonetaryestimatesofnonmarketvalues
PlanningConsiderations
Helpstobeinformedaboutwhattypesofeconomicanalysesarecontractedout
Ideally,quantifyeconomicimpacts,marketeconomicvalues,andnonmarketeconomicvalues
Focusonthedifferenceinchangestononmarketvaluesbetweenactionalternatives
Publicscopingcommentscanprovideagoodstart
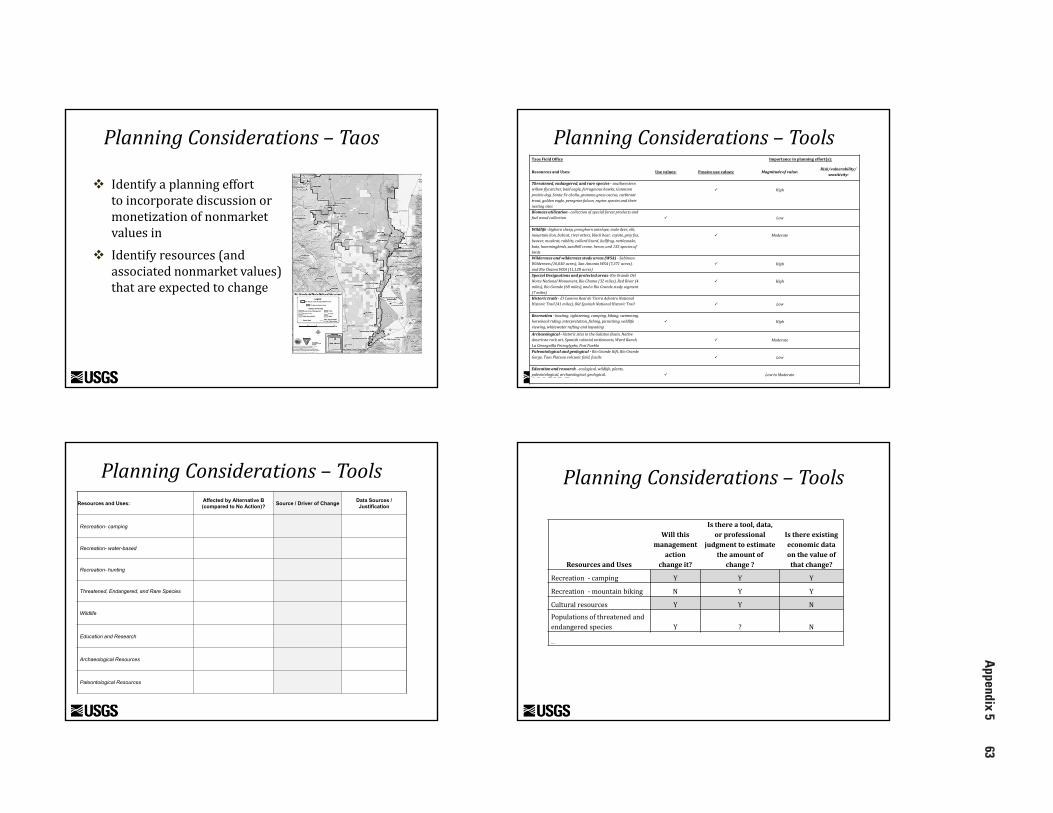
Appendix 5
6310/28/2016
11
PlanningConsiderations– Taos
Identifyaplanningefforttoincorporatediscussionormonetizationofnonmarketvaluesin
Identifyresources(andassociatednonmarketvalues)thatareexpectedtochange
PlanningConsiderations– ToolsTaosFieldOffice Importanceinplanningeffort(s):
ResourcesandUses: Usevalues: Passiveusevalues: Magnitudeofvalue:Risk/vulnerability/
sensitivity:
Threatened,endangered,andrarespecies‐ southwesternwillowflycatcher,baldeagle,ferruginoushawks,Gunnisonprairiedog,SantaFecholla,gramma grasscactus,cutthroattrout,goldeneagle,peregrinefalcon,raptorspeciesandtheirnestingsites
High
Biomassutilization ‐ collectionofspecialforestproductsandfuelwoodcollection Low
Wildlife‐bighornsheep,pronghornantelope,muledeer,elk,mountainlion,bobcat,riverotters,blackbear,coyote,greyfox,beaver,muskrat,rabbits,collardlizard,bullfrog,rattlesnake,bats,hummingbirds,sandhill crane,heron,and133speciesofbirds
Moderate
Wildernessandwildernessstudyareas(WSA) ‐ SabinosoWilderness(16,030acres),SanAntonioWSA(7,371acres),andRioChamaWSA(11,128acres)
High
SpecialDesignationsandprotectedareas‐RioGrandeDelNorteNationalMonument,RioChama(32miles),RedRiver(4miles),RioGrande(68miles),andaRioGrandestudysegment(7miles)
High
Historictrails‐ ElCaminoRealdeTierraAdentroNationalHistoricTrail(41miles),OldSpanishNationalHistoricTrail Low
Recreation‐ boating,sightseeing,camping,biking,swimming,horsebackriding,interpretation,fishing,picnicking,wildlifeviewing,whitewaterraftingandkayaking
High
Archaeological‐ historicsitesintheGalisteoBasin,NativeAmericanrockart,Spanishcolonialsettlements,WardRanch,LaCieneguillaPetroglyphs,PosiPueblo
Moderate
Paleontologicalandgeological‐ RioGrandeRift,RioGrandeGorge,TaosPlateauvolcanicfield,fossils Low
Educationandresearch ‐ ecological,wildlife,plants,paleontological,archaeological,geological, LowtoModerate
PlanningConsiderations– ToolsResources and Uses: Affected by Alternative B
(compared to No Action)? Source / Driver of Change Data Sources / Justification
Recreation- camping
Recreation- water-based
Recreation- hunting
Threatened, Endangered, and Rare Species
Wildlife
Education and Research
Archaeological Resources
Paleontological Resources
ResourcesandUses
Willthismanagement
actionchangeit?
Isthereatool,data,orprofessional
judgmenttoestimatetheamountofchange ?
Isthereexistingeconomicdataonthevalueofthatchange?
Recreation‐ camping Y Y Y
Recreation‐ mountainbiking N Y Y
Cultural resources Y Y N
Populationsofthreatenedandendangeredspecies Y ? N
…
PlanningConsiderations– Tools

64
Inclusion of Nonm
arket Values in BLM
Planning and Project Assessm
ents, Final Report
10/28/2016
12
Feedback Doyouthinktheinclusionofmorecomprehensiveinformation
abouteconomicvalues(includingnonmarketvalues)couldhelpyourdecision‐makingprocess?
CouldthetablespresentedserveasausefulwaytocommunicatethevalueofBLMmanagedlandsineconomicterms?
Doyouthinkthetablespresentedprovideaclearwaytoconnectmanagementactionstochangesinresourcesandassociatednonmarketvalues?
Werethetablespresentedsomethingyouthinkwouldbeusefultoincludeinfutureplanningdocuments?
Whatwouldyouchangeaboutthetables?
Whattypesofinformationorexamplespresentedhelpedyouunderstandtheconceptsassociatedwithnonmarketvaluation?
References• Bagstad,K.J.,Semmens,D.,Winthrop,R.,Jordahl ,D.andJ.Larson.2012. Ecosystem
servicesvaluationtosupportdecision‐makingonpubliclands‐ AcasestudyoftheSanPedroRiverWatershed,Arizona.U.S.GeologicalSurveyScientificInvestigationsReport2012–5251,93p.
• BLM.2013.Guidanceonestimatingnonmarketenvironmentalvalues.InstructionMemorandumNo.2013‐131.
• Boyle,K.J.2003.Contingentvaluationinpractice.In:Champ,P.A.,K.J.Boyle,andT.C.Brown(eds).APrimeronNonmarketValuation.KluwerAcademic.
• Boyle,K.J.andJ.C.Bergstrom.1992.Benefittransferstudies:myths,pragmatism,andidealism.WaterResourcesResearch28:657‐664.
• Clawson,M.1978.Theconceptofmultipleuseforestry.EnvironmentalLaw8:281‐308.
• Loomis,J.2001.FinalSnakeRivercontingentvaluemethodologystudyreport.PreparedforBLM,WyomingStateOffice.
• Rosenberger,R.S.,Loomis,J.B.,2001.Benefittransferofoutdoorrecreationusestudies:AtechnicaldocumentsupportingtheForestServiceStrategicPlan(2000revision).GeneralTechnicalReportRMRS‐GTR‐72.FortCollins,CO:USDAForestService,RockyMountainResearchStation.

Appendix 6 65
Appendix 6. Nonmarket Valuation Reference
OverviewThe consideration of economic values beyond just those
reflected in market transactions can support Bureau of Land Management (BLM) management decisions by highlighting resource tradeoffs and contributing to a more complete picture of the economic effects of a proposed action. In 2013, BLM’s Socioeconomics Program released an updated instruction mem-orandum that provides general guidance describing when and how to consider nonmarket economic values when preparing National Environmental Policy Act (NEPA) analyses for BLM’s resource management planning and other decisionmaking. To support this guidance, BLM’s Socioeconomics Program part-nered with economists at the U.S. Geological Survey (USGS) to conduct a series of field-based case studies to (1) evaluate the use of nonmarket values in BLM management decisions, (2) update existing technical resources for measuring those values, and (3) provide guidance to field staff on the use of nonmarket values. These case studies were conducted with BLM staff at Canyons of the Ancients National Monument (Monument), the Red Cliffs and Beaver Dam Wash National Conservation Areas (NCAs), the Taos Field Office, and the Tuscarora Field Office. The focus of these case studies was on practical applications in the field and, although pilot sites were used, the results are applicable across BLM offices and programs.
The purpose here is to discuss the basic concepts and relevance of nonmarket valuation for BLM land management, and walk through the three main approaches to measuring such values, focusing on BLM-specific examples and guid-ance. An overview of a Web-based tool is included, as well as a glossary of terms and definitions relevant to the topic of nonmarket valuation.
What is Nonmarket Valuation and How is it Relevant to BLM Land Management?
Living in a world of scarcity, we are forced to make man-agement choices about natural systems that may require sub-stantial tradeoffs, leading us to “compare what is gained from an activity with what is sacrificed by undertaking that activity” (Freeman, 2003, p. 1–2). Economics provides a tool that enables an objective comparison between different outcomes by reveal-ing the monetized economic value of the resources being con-sidered. Although well-functioning competitive markets can be relied upon to capture societal preferences for some resources through market prices, other resources have characteristics that make it difficult for them to be traded in private markets, meaning they lack associated prices. However, the absence of a market price does not equate to the absence of an economic value. For BLM, the value of nonmarket resources reflects the
Differing Types of Value
When discussing nonmarket values, it is important to remember that nonmarket values are economic values, and nonmarket values represent just one of many ways to define and measure value associated with BLM-managed lands. There are sociocultural and noneconomic methods that can be used to express other types of value that the public may hold for various aspects of BLM-managed lands.
Economic Value Versus Economic Impacts
There is an important distinction between the concept of economic value, which reflects the societal- or national-level net economic benefits provided by a resource, and economic impacts, which capture the economic activity generated or supported in a specific geographic area and are typically measured in terms of jobs, personal income, or economic output. Historically, BLM decisionmaking has focused on estimating the economic impacts associated with commod-ity production and recreation. On the other hand, economic values, including nonmarket values, reflect the benefits (or costs) to the user or producer of a good or service. Economic impacts and economic values are measuring two different things, and cannot be directly compared or added together.
Ecosystem Services and Nonmarket Values
The 2013 BLM instruction memorandum on nonmarket values explains that “Ecosystem goods and services include a range of human benefits resulting from appropriate ecosys-tem structure and function, such as flood control from intact wetlands and carbon sequestration from healthy forests. Some involve commodities sold in markets, for example, timber production. Others, such as wetlands protection and carbon sequestration, do not commonly involve markets, and thus reflect nonmarket values” (Bureau of Land Management, 2013a, p. 2). There is a link between these two concepts in that nonmarket values are captured within an ecosystem goods and services framework, but evaluating nonmarket values does not require an ecosystem services approach.
benefits individuals attribute to experiences of the environment, uses of natural resources, or the existence of particular ecologi-cal conditions (Bureau of Land Management, 2013a). Examples of resources and resource uses with an associated nonmarket value include recreational activities, the preservation of wildlife habitat or species, pristine viewsheds, and starry night skies.
Appendix 6

66 Inclusion of Nonmarket Values in BLM Planning and Project Assessments, Final Report
Direct use value
Value derived from the
direct use of a resource,
such as outdoor
recreation, mineral
production, and timber
harvest
Indirect use value
Value derived from the
indirect use of a resource,
such as flood prevention,
water purification, and
climate regulation
Total economic value
Option value
Value derived from the
preservation of a resource
for potential future use
Bequest value
Value derived from
preserving a resource in a
particular condition for
future generations
Existence value
Value derived from the
existence of a resource in
a particular condition
Use value Passive use value
Figure 6-1. Diagram showing the components of total economic value.
There also are cases where activities that take place on BLM-managed land impose an external, or hidden, nonmarket cost on members of society that is not accounted for in the market price of that activity. For example, while air pollution from oil and gas development may negatively impact public health in nearby communities, this external cost is not reflected in the market price of oil and gas. It is important to note that not all nonmarket values are associated with the natural environment; for example, some members of the public may derive nonmarket values from archaeological, cultural, and historic sites or artifacts located on BLM-managed lands or housed in museums (Bureau of Land Management, 2013a).
Accounting for the full range of economic values derived from both marketed and nonmarketed goods and services from BLM-managed lands can lead to better informed and more economically efficient decisions. Economic efficiency relies on comparing the benefits and costs of an action in order to maximize the net benefits to society. In the context of BLM planning, the different types of economic value that can be derived from a resource can be summarized within a total economic value framework (fig. 6-1). Total economic value is divided into two components: (1) use value, and (2) passive use value. Use value can be further divided into direct use and indirect use values. Direct use values for some BLM resources, such as mineral development, are expressed in the
marketplace. This value can often be estimated by subtract-ing the costs of production from the revenue received for the resource (Bureau of Land Management, 2013a; Loomis, 2002). Other direct use values are not expressed in the market-place and, therefore, are nonmarket in nature. One example is outdoor recreational activities where visitors directly use the public lands but pay nothing or a very small subsidized fee to gain access to a recreational site. Both producers and con-sumers can derive an economic value from the direct use of a resource. Other types of use values are those derived from the indirect use of a resource. Examples include flood prevention provided by a wetland, water purification, and climate regula-tion. In these cases, people are indirectly using the resources provided by the environment. These indirect use values typi-cally reflect nonmarket values.
In addition to use values (both direct and indirect), people may place an economic value on a resource even if they do not use that resource. These values are referred to as “passive use values,” or sometimes “nonuse values.” For example, some individuals place a value on knowing that a resource exists in a particular condition regardless of any use, which is referred to as “existence value.” In addition, some individuals may place a value on leaving a resource in a particular condition for future generations, referred to as “bequest value.” Another type of passive use value is the desire to preserve a resource

Appendix 6 67
for future use, which is considered an “option value.” Passive use reflects nonmarket values only.
There are cases when nonmarket values represent a rela-tively large proportion of the total economic value associated with a land management decision, and if they are unaccounted for or underrepresented, the selected management alternative may not adequately reflect the American public’s priorities in land management. This is a concern that has been raised in reviews of BLM’s resource management plans (RMPs) by various nonprofit organizations, academic institutions, and other federal agencies (see Loomis, 1984; U.S. Environmen-tal Protection Agency, 2008; Wilderness Society and others, 2008; Culver and Slivka, 2011; Hanceford and others, 2011). The consideration of nonmarket values can help inform decisionmaking by creating a more complete picture of the economic implications of resource tradeoffs.
BLM policy regarding the use of nonmarket values was first addressed in 1981 when the agency issued its “Social and Economic Policy and Action Plan,” which called for BLM to consider the nonmarket values of all goods and services pro-duced on BLM-managed lands. However, at that time, very few socioeconomic analyses in BLM projects addressed nonmarket values. By 2005, BLM’s “Land Use Planning Handbook” was revised to clarify that BLM should consider the significance of nonmarket values associated with BLM-managed resources and activities when formulating management alternatives.5 However, this document provided limited detail for field staff and managers on methods for, and guidance on, nonmarket valuation. There was also a social science guideline document
5The 2005 BLM “Land Use Planning Handbook” is available at http://www.blm.gov/pgdata/etc/medialib/blm/ak/aktest/planning/planning_general.Par.65225.File.dat/blm_lup_handbook.pdf.
revised in 2005 that outlined a model scope of work for socio-economic analyses, including nonmarket valuation.6 In 2010, BLM released draft guidance on estimating nonmarket values,7 followed by a final guidance document in 2013.8 The primary purpose of this current nonmarket valuation reference is to support these existing guidance documents. A timeline showing dates of issuance of BLM’s guidance on nonmarket valuation is presented in figure 6-2.
How Are Nonmarket Values Estimated?
As discussed in BLM’s 2013 instruction memorandum on estimating nonmarket values, it will rarely, if ever, be possible to assess all of the potential benefits and costs of an action. In practice, assessments of economic effects will likely describe key economic activity and, to the extent pos-sible, consider the benefits and costs, including nonmarket benefits, associated with the proposed alternatives. In addi-tion, the differences in changes to nonmarket values between
6The “Model Scope of Work for Socio-Economic Analysis in Resource Management Plans” is available at http://www.ntc.blm.gov/krc/uploads/74/Model%20Scope%20of%20Work%20ver.%201.5%209-21-05.pdf.
7The 2010 draft guidance “Guidance on Estimating Nonmarket Environ-mental Values” is available at http://www.blm.gov/wo/st/en/info/regulations/Instruction_Memos_and_Bulletins/national_instruction/2010/IM_2010-061.print.html.
8The 2013 guidance titled “Guidance on Estimating Nonmarket Environ-mental Values” (Instruction Memorandum 2013-131) is available at http://www.blm.gov/wo/st/en/info/regulations/Instruction_Memos_and_Bulletins/national_instruction/2013/IM_2013-131__Ch1.html.
Figure 6-2. Timeline showing issuance dates of guidance on nonmarket valuation used for Bureau of Land Management planning (BLM, Bureau of Land Management; IM, Instruction Memorandum).
Appendix 6

68 Inclusion of Nonmarket Values in BLM Planning and Project Assessments, Final Report
action alternatives can be used to highlight tradeoffs in the decisionmaking process (Bureau of Land Management, 2013a). There are several ways in which nonmarket values can be considered in management decisions. Nonmarket values can be described (1) quantitatively by conducting a primary (new) study, (2) quantitatively by applying existing data from completed nonmarket valuation studies (referred to as “benefit transfer”), or (3) qualitatively. The following sections will discuss these approaches, including examples of each, as well as a discussion of a Web-based toolkit that can be used to assist with the second and third approaches.
Primary Methods of Nonmarket Valuation
Conducting an original study is the most accurate approach to quantifying and characterizing nonmarket values for a specific situation. Such studies often rely on surveys of visitors to BLM-managed lands or of the general public. These studies, which require approval from the Office of Management and Budget (OMB), generally either use stated preference methods or revealed preference methods. BLM’s instruction memorandum on estimating nonmarket values provides a brief overview of these methods, and more detailed information about each method can be found in Champ and others (2003). While very few original nonmarket valuation studies have been conducted specifically for BLM, this report discusses three relevant examples.
In 1999, a nonmarket valuation study was commissioned by BLM’s Pinedale Field Office in Wyoming; the details of the study are provided in Loomis (2001). The Pinedale Field Office was developing a RMP and wanted to quantify eco-nomic nonmarket values associated with alternative ways of managing, selling, or trading scattered tracts of BLM-managed lands along the Snake River in Jackson Hole, Wyoming. To supplement the traditional public involvement process and gather the desired information, a survey was developed using a stated preference technique known as the contingent valuation method. This method relies on answers to carefully worded survey questions depicting a hypothetical market to determine a measure of value. The survey included questions that were designed to capture nonmarket values held for individual rec-reational activities in the area, as well as the public’s prefer-ences and values held for entire management strategies. This study was distinctive in that it took an RMP-specific approach to determine the total economic value for management strate-gies that could affect various resources and resource uses. After describing four management strategies that differed in terms of landownership and management of resources (recreation, livestock grazing, gravel mining, wildlife habitat), all survey respondents were asked the following contingent valuation question:
Would your household pay $X increase in federal income taxes each year for 20 years into a BLM Snake River Man-agement Fund to be used only for manag-ing these lands according to Management
Strategy (B,C,D) instead of having BLM sell these lands?
Management Strategy A was the No Action alternative of selling the lands to private landowners. The $X was ran-domly filled in with one of 15 dollar amounts ($2, $3, $5, $7, $10, $15, $20, $30, $40, $50, $70, $90, $125, $175, $295) and each management strategy was presented in a different question. That is, one question asked about management strategy B (increased recreation use), another C (retention of public lands and increased wildlife habitat management to maintain habitat), and another D (sand and gravel mining and expanded livestock grazing). To identify how the results might differ across respondents living in different geographic locations, the survey was administered to four groups: visitors, Teton County residents, residents in the rest of Wyoming, and residents in the rest of the United States. The results indicated a preference and highest economic value towards management strategy C, which focused on increased wildlife habitat. This result ultimately helped inform the selection of the proposed alternative. Visitors were asked an additional contingent valuation question designed to capture the economic value of hiking and rafting opportunities in the area. The economic benefits associated with these activities averaged $30 per person per day, including $47 per person per day for commercial rafting, $72 for private rafting, and $22 for hiking.
Stated preference methods of nonmarket valuation are quite flexible and can be used to quantify nonmarket values associated with particular resource uses on BLM-managed lands, or as shown in this example, to capture economic values associated with entire management strategies being consid-ered. As noted by Loomis (2001), surveys provide an effective way for BLM to reach out to the public, rather than requiring the public to come to BLM’s meeting locations, which can be inconvenient for occasional visitors and residents living in States outside of where the site is located.
Unlike stated preference methods, which can be used to estimate both use and passive use nonmarket values, revealed preference approaches can only be used to estimate non-market values associated with the use of a resource. These methods infer values by observing an individual’s behavior in related markets. A commonly used revealed preference technique is the travel cost method, which was developed in part by one of BLM’s first directors, Marion Clawson (Sedjo, 1999). The general approach is to estimate a demand func-tion based on the number of trips taken to a particular rec-reational site and the time and travel cost expenses required to reach that site. A measure of economic benefits is then calculated from the statistically estimated demand curve. Loomis and others (2005) applied this method to various BLM recreational sites, including cultural/historical areas, campgrounds, natural areas, and recreational sites at several national monuments. Onsite visitor surveys were conducted in 2003 to gather the necessary data. Average per person per visit benefits, inflated to 2014 dollars, ranged from $9 to $86 at the different sites (table 6-1).

Appendix 6 69
The travel cost method was also applied to estimate benefits from recreational opportunities at sites within BLM’s Little Snake River Resource Area (Loomis, 2006). Results show that in the Sand Wash Basin, which is predominantly used for off-highway vehicle use, visitors receive an aver-age net benefit of $28.70 per day. Visitors to other areas in the Little Snake River Resource Area receive an average net benefit per visitor day of about $8.33 for nonmotorized recre-ational uses (Loomis, 2006).
The time and budget necessary to conduct such primary studies can be high (Bureau of Land Management, 2013). However, the added time and expense required for a primary study does not mean that these methods should be avoided by the BLM. The decision to conduct a primary nonmarket valu-ation study can benefit by being made early in the planning or project assessment process, given the amount of time required for the OMB survey approval process. A potentially cost-effec-tive approach to acquiring more information about nonmarket economic benefits associated with BLM-managed lands is to
include valuation questions on visitor satisfaction surveys. These questions can be designed to take up limited space. For example, a contingent valuation question with a payment card format, as shown in figure 6-3, could be used.
Benefit Transfer
The benefit transfer method relies on secondary data, and is used to estimate nonmarket economic values by transferring available information from original studies already completed.
Table 6-1. Average benefits per person per visit and total annual benefits for select Bureau of Land Management recreational sites.
Site name StateCompleted
surveysEstimated visitor use
Average benefits ($2014)
Annual benefits
Steese National Conservation Area Alaska 66 10,495 $62 $503,760
Anasazi Center/Canyons of Ancients Colorado 250 120,650 $24 $2,292,350
Mackay Reservoir Idaho 125 12,152 $68 $644,056
Wild Rivers Recreational Area New Mexico 132 256,503 $26 $5,130,060
Cavitt Creek Falls Oregon 140 4,500 $48 $166,500
Clay Creek &Whittaker Creek Oregon 84 16,810 $54 $706,020
Gerber & Topsy Recreation Sites Oregon 139 4,200 $86 $281,400
Yaquina Head Natural Area Oregon 420 328,964 $9 $2,302,748
Upper Green River Special Recreation Management Area
Wyoming 126 9,805 $57 $431,420
As you know, some of the costs of travel such gasoline, hotels, and rental cars often increase. If your total trip cost were to increase, what is the maximum extra amount you would be willing to pay for this most recent trip to this BLM site? (Please circle the highest dollar amount).
$0 $5 $10 $20 $30 $50 $75 $100 $125 $150 $200
Figure 6-3. Illustration of an example contingent valuation question with a payment card format (BLM, Bureau of Land Management).
Benefit transfer is a colloquial term adopted by economics that means the use of existing data or information in settings other than that for which the data or information were originally collected.
~Rosenberger and Loomis (2003)
Appendix 6

70 Inclusion of Nonmarket Values in BLM Planning and Project Assessments, Final Report
The benefit transfer method provides a practical approach to evaluating the nonmarket economic effects of management actions when primary research is not feasible because of time or budget constraints, or not justified because the resource impacts are expected to be minor. Loomis and others (2005) note that the average benefit estimates shown in table 6-1 could be useful for BLM to identify the economically opti-mum mix of multiple uses when revising RMPs for the studied sites, or possibly for nearby sites. Using these values in a context other than that for which they were originally esti-mated is an example of a benefit transfer. The source(s) of the available economic information is typically referred to as the “study site,” and the context that this information is used in is referred to as the “policy site.” As shown in figure 6-4, there are two main approaches to benefit transfer: value transfer and function transfer.
In a value transfer, a single point estimate, range of mul-tiple point estimates, or measure of central tendency from mul-tiple point estimates (for example, an average value), is trans-ferred from the original study site(s) where primary research was conducted to a policy site with similar characteristics that is being evaluated. For example, the nonmarket economic value of a management action that would result in increased access to recreational deer hunting on BLM-managed lands could be quantified using benefit transfer by multiplying the expected number of additional visitor use days of deer hunting by a value per day of recreational hunting identified in the existing literature. Ideally, in searching for a value in the existing literature, the analyst would attempt to identify a previously conducted study with very similar characteristics to the context being evaluated (for example, same species being hunted, similar location). In addition, some agencies have
administratively approved value estimates that can be used for value transfers.
In a function transfer, a statistical function based on the existing literature is used to implement the transfer of a benefit measure. Function transfers can be based on a benefit or demand function from a single study in the existing litera-ture, or on a meta-regression function, which summarizes the value estimates reported in multiple studies in a statistical function. The function is adapted to match the characteris-tics of the policy site that is being evaluated, and then used to forecast a nonmarket value estimate for the policy site. Rosenberger and Loomis (2003) provide a detailed descrip-tion of these different transfer approaches, which are also discussed in more detail in the “Summary of Nonmarket Valuation Studies Focused on Cultural, Archaeological, and Historic Sites” section of this report.
Although only a limited number of original studies have been conducted specifically for BLM-managed lands, it is often possible to find existing studies for sites that match the characteristics of the policy site being evaluated for resources that have been well studied in the nonmarket valuation literature, such as recreational activities. There are three main criteria to follow for a benefit transfer (Boyle and Bergstrom, 1992):
1. The nonmarket commodity valued at the study site and policy site are identical;
2. The populations affected by the nonmarket commodity at the study and policy sites have identical character-istics; and
Figure 6-4. Diagram showing benefit transfer approaches. Source: Adapted from Rosenberger and Loomis (2001).
Value transfer Function transfer
Single point or multiple point estimate(s)
Measure of central tendency
Administratively approved estimate
Benefit or demand function
Meta-regression function
Use estimate at policy site
Adapt function to policy site
Use tailored estimate at policy
site
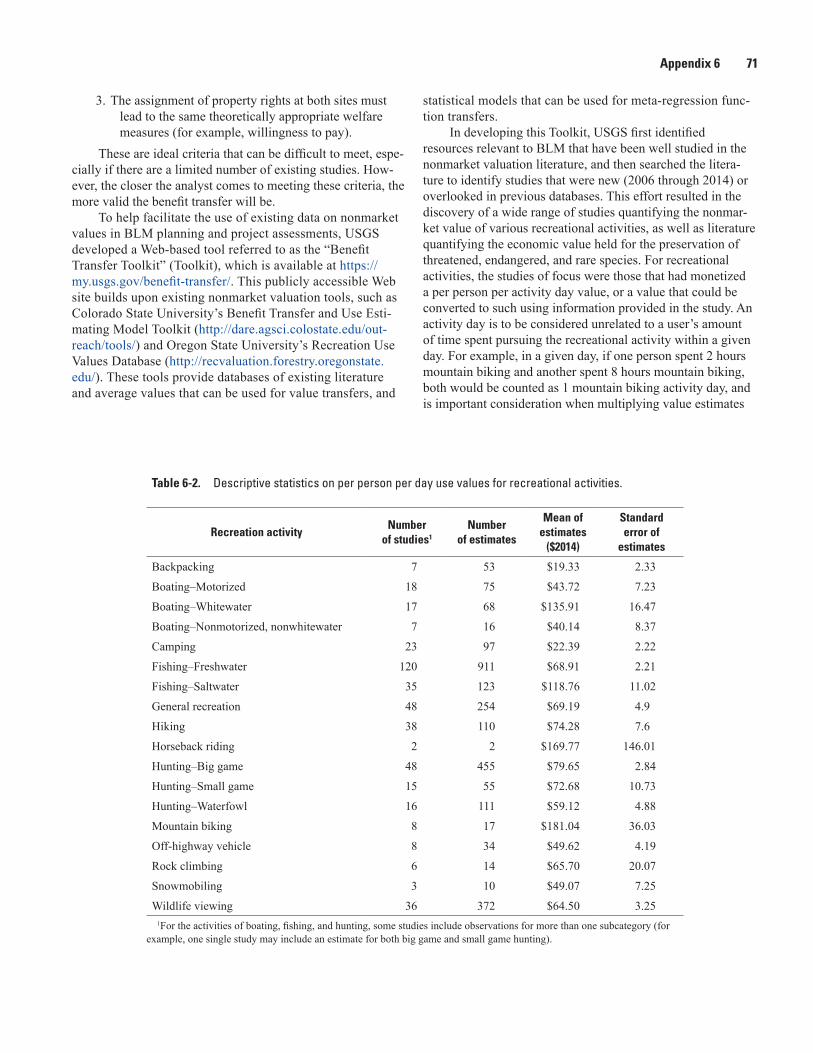
Appendix 6 71
3. The assignment of property rights at both sites must lead to the same theoretically appropriate welfare measures (for example, willingness to pay).
These are ideal criteria that can be difficult to meet, espe-cially if there are a limited number of existing studies. How-ever, the closer the analyst comes to meeting these criteria, the more valid the benefit transfer will be.
To help facilitate the use of existing data on nonmarket values in BLM planning and project assessments, USGS developed a Web-based tool referred to as the “Benefit Transfer Toolkit” (Toolkit), which is available at https://my.usgs.gov/benefit-transfer/. This publicly accessible Web site builds upon existing nonmarket valuation tools, such as Colorado State University’s Benefit Transfer and Use Esti-mating Model Toolkit (http://dare.agsci.colostate.edu/out-reach/tools/) and Oregon State University’s Recreation Use Values Database (http://recvaluation.forestry.oregonstate.edu/). These tools provide databases of existing literature and average values that can be used for value transfers, and
statistical models that can be used for meta-regression func-tion transfers.
In developing this Toolkit, USGS first identified resources relevant to BLM that have been well studied in the nonmarket valuation literature, and then searched the litera-ture to identify studies that were new (2006 through 2014) or overlooked in previous databases. This effort resulted in the discovery of a wide range of studies quantifying the nonmar-ket value of various recreational activities, as well as literature quantifying the economic value held for the preservation of threatened, endangered, and rare species. For recreational activities, the studies of focus were those that had monetized a per person per activity day value, or a value that could be converted to such using information provided in the study. An activity day is to be considered unrelated to a user’s amount of time spent pursuing the recreational activity within a given day. For example, in a given day, if one person spent 2 hours mountain biking and another spent 8 hours mountain biking, both would be counted as 1 mountain biking activity day, and is important consideration when multiplying value estimates
Table 6-2. Descriptive statistics on per person per day use values for recreational activities.
Recreation activityNumber
of studies1
Number of estimates
Mean of estimates
($2014)
Standard error of
estimates
Backpacking 7 53 $19.33 2.33
Boating–Motorized 18 75 $43.72 7.23
Boating–Whitewater 17 68 $135.91 16.47
Boating–Nonmotorized, nonwhitewater 7 16 $40.14 8.37
Camping 23 97 $22.39 2.22
Fishing–Freshwater 120 911 $68.91 2.21
Fishing–Saltwater 35 123 $118.76 11.02
General recreation 48 254 $69.19 4.9
Hiking 38 110 $74.28 7.6
Horseback riding 2 2 $169.77 146.01
Hunting–Big game 48 455 $79.65 2.84
Hunting–Small game 15 55 $72.68 10.73
Hunting–Waterfowl 16 111 $59.12 4.88
Mountain biking 8 17 $181.04 36.03
Off-highway vehicle 8 34 $49.62 4.19
Rock climbing 6 14 $65.70 20.07
Snowmobiling 3 10 $49.07 7.25
Wildlife viewing 36 372 $64.50 3.251For the activities of boating, fishing, and hunting, some studies include observations for more than one subcategory (for
example, one single study may include an estimate for both big game and small game hunting).
Appendix 6

72 Inclusion of Nonmarket Values in BLM Planning and Project Assessments, Final Report
Table 6-3. Descriptive statistics on per person/per household values for the preservation of threatened, endangered, and rare species.
SpeciesNumber of
studiesNumber of estimates
Mean of estimates
($2014)
Standard error of
estimates
Studies reporting annual value1
Bald eagle 2 3 $39.63 7.82
Bighorn sheep 1 1 $19.95 ---
Bottlenose dolphin 1 1 $40.40 ---
Colorado squawfish 1 1 $14.33 ---
Florida manatee 1 1 $13.70 ---
Gray whale 2 5 $41.87 5.27
Loggerhead sea turtle 1 1 $22.32 ---
Northern elephant seal 1 1 $41.67 ---
Red-cockaded woodpecker 1 3 $17.93 2.41
Riverside fairy shrimp 1 1 $33.22 ---
Salmon/steelhead 4 18 $96.05 11.35
Sea otter 1 1 $47.28 ---
Silvery minnow 1 1 $44.63 ---
Spotted owl (Mexican and Northern) 4 4 $92.92 21.56
Steller sea lion 2 12 $112.86 18.13
Striped shiner 1 1 $9.48 ---
Various fish species in Washington State 1 5 $284.47 36.7
Whooping crane 1 2 $65.96 14.86
Wild turkey 1 2 $15.95 2.38
Studies reporting lump sum value1
Arctic grayling 1 2 $27.19 3.89
Bald eagle 1 2 $349.14 61.51
Gray wolf 5 8 $57.39 21.91
Grizzly bear 1 3 $69.33 3.84
Hawaiian monk seal 1 1 $196.56 ---
Humpback whale 1 1 $285.12 ---
Peregrine falcon 1 1 $38.04 ---
Shortnose sturgeon 1 1 $39.28 ---1These studies varied in terms of the specific type of change in the species being valued; for instance, some valued
percentage gains in the population of a particular species, whereas others provide a value associated with ensuring that a particular species does not go extinct. Details about each individual study are provided in the Benefit Transfer Toolkit databases.

Appendix 6 73
with predicted changes in recreation use days. It is anticipated that additional resources will be added to the Toolkit over time, and data and modeling improvements will continue to be made. Table 6-2 provides descriptive statistics for each of the recreational activities currently included in the Toolkit, and table 6-3 provides descriptive statistics for studies valuing the preservation of threatened, endangered, and rare species included in the Toolkit.
Point Estimate TransferFrom the home page of the Toolkit, users can click on
any of the recreational activities or “Threatened, Endangered,
“General Recreation” database in the Toolkit can be searched to identify a study conducted in a similar geographic location to the study site. The databases can be sorted alphabetically by location to simplify this process. In this example, the closest match would likely be the Loomis and others (2005) travel cost study. The economic benefit estimate of $24.45 for the Monu-ment reported in this study could then be multiplied by the estimated change in recreation use days to determine a measure of the total economic benefit of changes in recreational oppor-tunities resulting from the management action.
However, because very few primary studies have been conducted on BLM-managed lands specifically, users of the Toolkit will rarely be able to identify such a close match. For example, BLM’s St. George Field Office is evaluating a man-agement action that will result in changes to camping opportuni-ties within the Red Cliffs Recreation Area and a recreation plan-ner determines that the action will result in 120 fewer visitor use days of camping annually. In searching the existing “Camping” database in the Toolkit, the planner finds that no primary studies valuing camping opportunities have been conducted in the Red Cliffs Recreation Area or even in the State of Utah. In this case, the user would search for a study with the closest geographic location and similar population characteristics. The planner may determine that the study conducted by Richards and others (1990) in the Coconino National Forest in northern Arizona provides the closest match. Because this study reports value estimates for various campgrounds in the forest, the user could then determine which campground has the most similar char-acteristics to the Red Cliffs Recreation Area campground, and then transfer the value estimate for that particular campground. As demonstrated by this example, benefit transfers often require judgment on the part of the analyst to determine which studies in the existing literature provide the closest match to the policy site being evaluated. While the databases provided in the Toolkit can help facilitate transfers of nonmarket values by summariz-ing existing studies and value estimates, they also can be viewed
Steps for a Point Estimate Transfer
1. Identify the resources affected by the action.
2. Measure resource changes (for example, recreational use).
3. Search the literature for relevant study sites.
4. Assess relevance and applicability of study site data.
5. Select a benefit measure from a single relevant study or a range of benefit measures if more than one study is relevant.
6. Multiply the benefit measure(s) by total change in resource (for example, recreation use days).
~Adapted from Rosenberger and Loomis (2001)
and Rare Species” to be taken to a page where a “Full Dataset” tab can be accessed. “Full Dataset” provides detailed informa-tion about each of the studies referenced in tables 6-2 and 6-3, including the study reference, study location, details about the activity or resource being valued, site characteristics, method-ology used, and the economic benefit estimate in 2014 dollars. Databases can be sorted alphabetically by author, location, and valuation method; and numerically by data year and economic value estimate. A subset of this information is provided in an “Individual Studies” tab.
Users can first check these databases to determine whether an existing study can be located that matches the characteristics (for example, recreational activity, species, geographic loca-tion) of the policy site being evaluated. If a match is found, the user can simply transfer the point estimate of economic benefits, adjusted for inflation if necessary, from that study to the policy site study. This is referred to as a “point estimate transfer.” For example, suppose a management action at the Monument is determined to impact general recreation visits to the site instead of one specific activity such as fishing or hunt-ing. First, the expected change in recreation use days resulting from the action must be quantified. Once this is determined, the
Steps for an Average Value Transfer
1. Identify the resources affected by the action.
2. Measure resource changes (for example, recreational use).
3. Search the literature for relevant study sites.
4. Assess the relevance and applicability of existing study site data.
5. Use the average value provided in tables 6-2 or 6-3 for that region/species, or use an average of a subset of study estimates.
6. Multiply the benefit measure by total change in resource (for example, recreation use days)
~Adapted from Rosenberger and Loomis (2001)
Appendix 6

74 Inclusion of Nonmarket Values in BLM Planning and Project Assessments, Final Report
as a screening tool. Once a study is identified as a possible source for the benefit transfer, the user is strongly encouraged to review the original study to determine whether it provides a close enough match to the context being evaluated.
Figure 6-5. Map of regions used for average values.
Table 6-4. Descriptive statistics on per person per day use values for recreational activities by region.
[N, number]
Resource UseAlaska Pacific Coast Intermountain Northeast Southeast Multiple Areas
N Mean N Mean N Mean N Mean N Mean N Mean
Backpacking --- --- 3 $24.75 5 $28.93 34 $11.19 7 $42.37 4 $32.16
Boating–Motorized 1 $433.36 2 $21.97 15 $34.49 15 $100.07 14 $23.02 28 $16.46
Boating–Whitewater --- --- 9 $39.30 33 $156.91 4 $42.94 22 $160.84 --- ---
Boating–Nonmotorized, nonwhitewater --- --- --- --- 5 $32.44 5 $17.83 3 $85.73 3 $44.59
Camping 1 $14.62 10 $29.11 52 $22.11 15 $24.34 12 $19.75 7 $16.30
Fishing–Freshwater 48 $130.00 58 $71.35 260 $78.83 350 $56.31 159 $61.25 36 $68.33
Fishing–Saltwater 7 $224.61 33 $141.15 --- --- 17 $62.36 54 $115.77 12 $88.83
General recreation 2 $40.66 59 $44.34 76 $53.45 34 $126.54 62 $74.52 21 $90.11
Hiking 2 $159.61 50 $50.30 33 $95.96 7 $59.49 14 $100.82 4 $85.38
Horseback riding --- --- --- --- --- --- --- --- 1 $315.78 1 $23.76
Hunting–Big game 14 $81.84 36 $83.80 152 $87.07 160 $70.14 78 $75.71 15 $114.35
Hunting–Small game --- --- 4 $183.65 32 $64.90 10 $38.06 1 $194.76 8 $76.32
Hunting–Waterfowl --- --- 9 $53.16 29 $55.85 39 $39.60 26 $67.91 8 $144.30
Mountain biking --- --- --- --- 15 $196.15 --- --- 2 $67.67 --- ---
Off-highway vehicle --- --- 3 $43.90 11 $61.80 3 $49.81 13 $35.88 4 $64.90
Rock climbing --- --- --- --- 6 $37.60 1 $65.53 3 $192.92 4 $12.49
Snowmobiling --- --- 1 $58.38 5 $40.31 1 $74.63 --- --- 3 $52.03
Wildlife viewing 13 $83.05 35 $94.02 86 $66.13 128 $61.84 85 $60.66 25 $34.53
Average Value TransferIn addition to the “Full Dataset” and “Individual Studies”
tabs, the Toolkit also provides an “Average Values” tab for each recreational activity, which summarizes average values by region (fig. 6-5), and in the case of boating, fishing, and hunting, by other groupings as well. These values are shown in table 6-4. The multiple-areas region includes studies that were conducted at a national scale or in more than one of the regions shown in figure 6-5. If the user cannot find a close match between the specific location of an existing study in the Toolkit and the policy site, an average value for the relevant geographic region may be used. The use of the average value is referred to as an “average value transfer.” For example, if the user needs a value for backpacking in the State of Utah, but finds no studies conducted in Utah in the Toolkit database, the user may choose to use the average value of $28.93 for backpacking in the Intermountain region (see table 6-4). When transferring a regional average value, the user may want to evaluate the number of observations used to generate that esti-mate. If there are only a few observations, the user is encour-aged to look in the “Individual Studies” database to determine whether the location of the studies included in the average value estimate provide a close enough match to the policy site being evaluated.

Appendix 6 75
Alternatively, in searching the databases in the Toolkit, the user may find multiple studies conducted in the county or State of interest. In this case, the user may want to create their own average value based on this subset of studies and transfer that benefit estimate. The same logic applies to the resource of interest. For example, if the user needs a value for big game hunting in Colorado, and there are multiple studies valuing both deer and elk (Cervus canadensis), they could transfer an average value based on those studies.
Meta-Regression Function Transfer
If Toolkit users cannot find an existing study that matches their policy site, and cannot identify or estimate an aver-age value that would be representative, another option is to conduct a function transfer based on a meta-regression model. These statistical functions analyze the relationship between the economic value estimate and various study and resource specific attributes based on the full dataset of studies valuing a particular resource. The Toolkit includes meta-regression functions for hunting, wildlife viewing, fishing, and trail
use. Trail use includes the activities of backpacking, hiking, mountain biking, off-highway vehicle use, and snowmobil-ing. The meta-regression functions can be accessed from the Toolkit’s “Benefit Transfer” page. When the user clicks on one of these activities, they are taken to a calculator-type tool that prompts them to select resource and site characteristics of the resource that is being valued. A measure of consumer surplus is then forecast based on these user-defined characteristics. This is referred to as a “meta-regression function transfer.” An example for hunting is shown in figure 6-6, where the user has checked a series of boxes to reflect the need for a value of moose hunting on BLM-managed lands in the intermountain region. Users can find details about the underlying statistical models, as well as a description of the methods used to esti-mate these models, in the Toolkit.
Benefit transfers based on meta-regression functions have several advantages over other types of transfers because they (1) are based on information from a large number of studies; (2) control for methodological differences across studies; and (3) allow the user to adapt the statistical func-tion, and thus the forecasted benefit measure, to the charac-teristics of the policy site. However, there are disadvantages
Figure 6-6. Illustration showing an example of a meta-regression function transfer for hunting.
Appendix 6

76 Inclusion of Nonmarket Values in BLM Planning and Project Assessments, Final Report
because there is often a limited number of studies upon which these functions are based. As a result, site attributes are often provided at an aggregated scale, such as the site’s geographic region being represented by a larger regional area as shown in figure 6-5. If the analyst can identify a single study in the Toolkit databases that closely matches the characteris-tics of the policy site being evaluated (for example, moose hunting in southwest Colorado on BLM-managed lands), a transfer based on the value estimate provided in that study would likely result in a more valid transfer than using the hunting meta-regression function. Indeed, previous research has shown that value transfers may be more appropriate for transfers between relatively similar sites, whereas function transfers generally yield lower errors for transfers between less similar sites (Bateman and others, 2011).
In general, benefit transfer offers a practical, time-effective, and cost-effective approach to estimating nonmarket values. However, it is important to keep in mind that this is a second-best approach to valuation, and there are many factors that can affect the reliability and validity of benefit transfers. For example, even if the criteria for a valid transfer are met, the transferred value can only be as accurate as the origi-nal study or studies upon which it is based. In other words, the quality of the original study can affect the quality of the benefit transfer process. In addition, while some nonmarket resources such as recreational fishing have been relatively well studied, there are still many gaps in the existing nonmarket valuation literature for many resources and geographic loca-tions. With limited existing data, it can become quite difficult to identify an existing study site on which to base a transfer. There is an abundance of literature dedicated to the topic of benefit transfer that readers may refer to for more informa-tion, including a 2006 special issue of the journal Ecological Economics (Wilson and Hoehn, 2006).
Qualitative Descriptions
In addition to performing primary studies and using ben-efit transfer, qualitative descriptions of nonmarket values can be used to develop information on nonmarket values for BLM planning and project assessments. Qualitative descriptions
may be relevant when primary studies are not feasible and benefit transfer is not an option because of the lack of existing value estimates or the inability to quantify resource changes. Often, language from legislation, such as the Federal Land Policy and Management Act of 1976 (Public Law 94-579) and the Omnibus Public Land Management Act of 2009 (Public Law 111-11), can provide a starting point to a discussion of nonmarket values associated with BLM-managed lands. This is especially true for land units within the National Conser-vation Lands system, such as NCAs, wilderness areas, and national monuments.
The first major step to developing a qualitative descrip-tion of nonmarket values is to identify which resources and resource uses could be affected by a particular management action. These resources and resource uses can then be nar-rowed down to those that will likely have an associated non-market value. While this determination will require input from an economist or other social scientist, generally, any nonmar-ket resource that provides an understood benefit to people is a source of economic value. Next, a discussion of nonmarket values derived from these resources under baseline conditions can be described using the total economic value framework (see fig. 6-1). Although this explanation may require knowl-edge of economic theory and nonmarket valuation, table 6-5 provides a list of some of the nonmarket resources and uses provided by BLM-managed lands and indicates whether they provide use values or passive use values.
When visitors come to BLM-managed lands for recre-ational opportunities, they are directly using a resource and, therefore, nonmarket use values are often derived from these recreational opportunities. Collecting forest products, such as firewood and pine nuts, for subsistence is another direct use of BLM-managed lands. Some members of the general public may also derive passive use values from geological, archaeological, and paleontological resources. They may place an economic value on knowing that these resources are maintained in a particular condition even if they never plan to see or use them (existence value), or they may place a value
Steps for a Meta-Regression Function Transfer
1. Identify the resources affected by the action.
2. Measure resource changes (for example, recreational use).
3. Adapt meta-regression analysis function to policy site characteristics and forecast benefit measure.
4. Multiply the tailored benefit measure by total change in resource (for example, recreation use days).
~Adapted from Rosenberger and Loomis (2001)
Steps to Preparing a Qualitative Description of Nonmarket Values
1. Identify the resources and uses affected by the action, focusing on those that likely have an associated nonmar-ket value.
2. Discuss the components of total economic value held for these resources, supporting this discussion with existing literature and examples of value estimates.
3. Determine the direction and magnitude of the expected change to each resource and resource use.
4. Qualitatively discuss the potential changes to nonmar-ket values based on the direction and magnitude of the expected change to each resource.
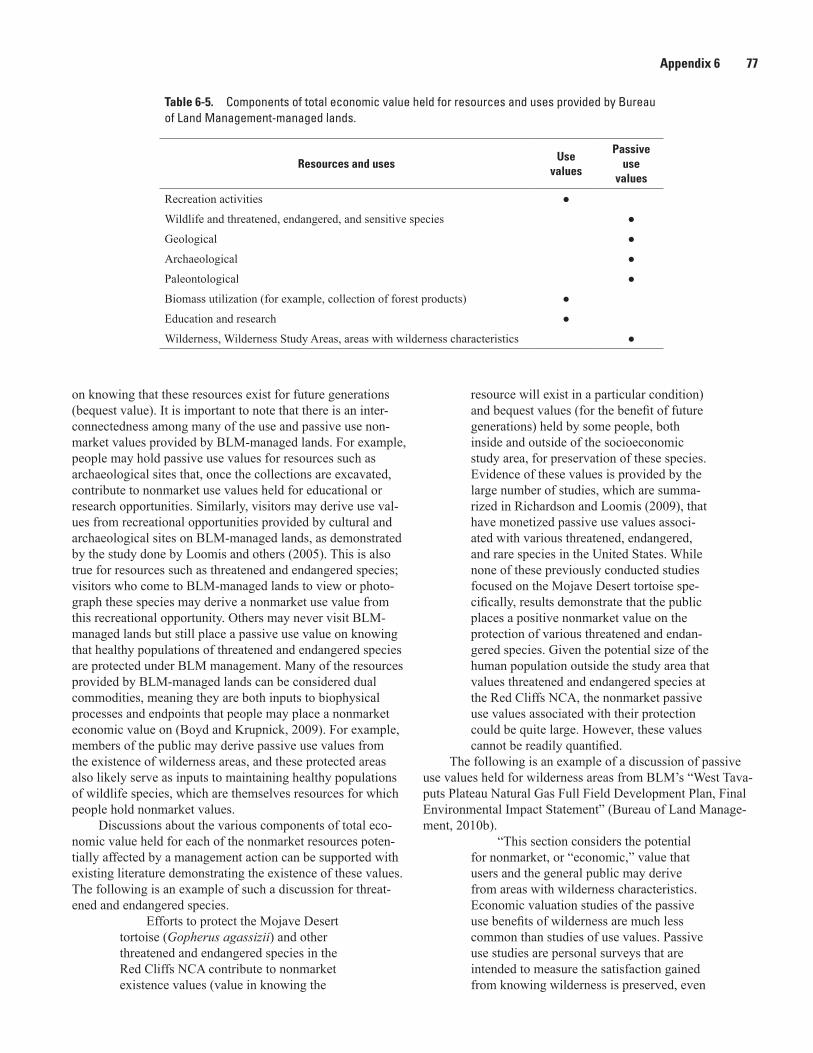
Appendix 6 77
on knowing that these resources exist for future generations (bequest value). It is important to note that there is an inter-connectedness among many of the use and passive use non-market values provided by BLM-managed lands. For example, people may hold passive use values for resources such as archaeological sites that, once the collections are excavated, contribute to nonmarket use values held for educational or research opportunities. Similarly, visitors may derive use val-ues from recreational opportunities provided by cultural and archaeological sites on BLM-managed lands, as demonstrated by the study done by Loomis and others (2005). This is also true for resources such as threatened and endangered species; visitors who come to BLM-managed lands to view or photo-graph these species may derive a nonmarket use value from this recreational opportunity. Others may never visit BLM-managed lands but still place a passive use value on knowing that healthy populations of threatened and endangered species are protected under BLM management. Many of the resources provided by BLM-managed lands can be considered dual commodities, meaning they are both inputs to biophysical processes and endpoints that people may place a nonmarket economic value on (Boyd and Krupnick, 2009). For example, members of the public may derive passive use values from the existence of wilderness areas, and these protected areas also likely serve as inputs to maintaining healthy populations of wildlife species, which are themselves resources for which people hold nonmarket values.
Discussions about the various components of total eco-nomic value held for each of the nonmarket resources poten-tially affected by a management action can be supported with existing literature demonstrating the existence of these values. The following is an example of such a discussion for threat-ened and endangered species.
Efforts to protect the Mojave Desert tortoise (Gopherus agassizii) and other threatened and endangered species in the Red Cliffs NCA contribute to nonmarket existence values (value in knowing the
resource will exist in a particular condition) and bequest values (for the benefit of future generations) held by some people, both inside and outside of the socioeconomic study area, for preservation of these species. Evidence of these values is provided by the large number of studies, which are summa-rized in Richardson and Loomis (2009), that have monetized passive use values associ-ated with various threatened, endangered, and rare species in the United States. While none of these previously conducted studies focused on the Mojave Desert tortoise spe-cifically, results demonstrate that the public places a positive nonmarket value on the protection of various threatened and endan-gered species. Given the potential size of the human population outside the study area that values threatened and endangered species at the Red Cliffs NCA, the nonmarket passive use values associated with their protection could be quite large. However, these values cannot be readily quantified.
The following is an example of a discussion of passive use values held for wilderness areas from BLM’s “West Tava-puts Plateau Natural Gas Full Field Development Plan, Final Environmental Impact Statement” (Bureau of Land Manage-ment, 2010b).
“This section considers the potential for nonmarket, or “economic,” value that users and the general public may derive from areas with wilderness characteristics. Economic valuation studies of the passive use benefits of wilderness are much less common than studies of use values. Passive use studies are personal surveys that are intended to measure the satisfaction gained from knowing wilderness is preserved, even
Table 6-5. Components of total economic value held for resources and uses provided by Bureau of Land Management-managed lands.
Resources and usesUse
values
Passive use
values
Recreation activities ●
Wildlife and threatened, endangered, and sensitive species ●
Geological ●
Archaeological ●
Paleontological ●
Biomass utilization (for example, collection of forest products) ●
Education and research ●
Wilderness, Wilderness Study Areas, areas with wilderness characteristics ●
Appendix 6
78 Inclusion of Nonmarket Values in BLM Planning and Project Assessments, Final Report
if an individual does not visit or ever plan[s] to visit the area. Passive use benefits for wilderness may be thought of as the satis-faction of knowing that the option exists to visit a wilderness, that a wilderness will be available for use in the future, and that a wilderness simply exists (Cordell et al. 2005). People who live where wilderness is rare, or even nonexistent, may put a very high value on it while people who live close to wilderness areas (Utah) may put a lower value on it. The economic values estimated by these studies can be in hundreds of dol-lars per acre when the entire population of the United States is counted in the estimate (Loomis 2000).
One valuation study associated with Utah wilderness was conducted more than 15 years ago by surveying Utah residents. The economic value to Utah residents of preserving all designated wilderness areas in Utah—2.7 million acres at the time—was a total of $72 per household per year in 2006 dollars after adjusting for inflation (Pope and Jones 1990). A comparable national estimate of annual willingness to pay for passive use benefits from all designated wilderness is $75 per household per year in 2006 dollars. The national estimate combined informa-tion from eight studies published from 1984 to 1996 (the Utah study among them) with an average household response rate of 50 percent. The annual per household benefit of $75 applied to the relevant population (1/2 of all households, or 54.5 million at the time of the analysis) yielded a value of $38.50 per acre in 2006 dollars for the entire United States’ designated-wilderness system (Cordell et al. 2005).”
Because recreational activities have been relatively well studied in the nonmarket valuation literature, there are often enough available studies to document average values for a particular recreational opportunity. Average nonmarket values for various recreational activities can be developed either by using an average value for a particular region (table 6-4) or creating a customized average value based on values for the locations that are most similar to the planning site. Nonmarket valuation literature for various recreational activities, as well as for the preservation of threatened and endangered species, can be found in the Toolkit; studies for other resources can be identified through search engines such as Google Scholar by searching for the resource of interest and terms such as “non-market values,” “willingness to pay,” or “consumer surplus.”
Next, documentation of the direction and magnitude of the expected change to the resource can help frame a discussion on how these nonmarket values might be expected to change from
a particular management action or alternative in the planning process. For example, the change may be categorized as a low, medium, or high increase or decrease. This determination can then be used to discuss qualitatively the expected direction and magnitude of changes to the associated nonmarket values derived from each resource. The following is an example of this type of discussion from the “Proposed Taos Resource Manage-ment Plan and Final Environmental Impact Statement.”
“ACECs [Areas of Critical Environ-mental Concern] and land to be managed for wilderness characteristics may attract new residents and tourists to the area, which would then contribute to area economic activity. In addition, these designations would further maintain and perhaps enhance nonmarket values associated with natural amenities protected on these lands. Under Alternative C, a few more acres would be recommended for ACEC designation within the Galisteo Basin ACEC in order protect the 24 existing Galisteo Basin Protection Act sites and any new congressionally desig-nated sites, as defined in the Act. However, fewer ACEC acres and less VRM [Visual Resource Management] class I acres would be designated than under Alternatives A or B. Therefore, it is likely that Alternative C would ensure more protection of nonmarket values and natural amenities than the no action alternative, but less than the other action alternatives” (Bureau of Land Man-agement, 2011, p. 478–479).
Although qualitative descriptions of nonmarket values do not allow for dollar to dollar comparisons of economic values, they serve the important purposes of (1) framing the potential effects of a management action on human well-being using economic terminology, which helps BLM field staff more effectively explain the objectives of resource management activities; and (2) informing tradeoffs of alternatives based on the public’s preferences. Qualitative discussions of nonmarket values can also be used to supplement benefit transfer meth-ods. For example, in an analysis of economic effects for NEPA analyses, benefit transfer could be used to monetize the value of well-studied nonmarket resource uses, such as recreational activities, and a qualitative discussion of nonmarket values for unique resources such as archaeological sites, wilderness areas, or wild horses and burros, could also be included. How-ever, it is important to note that monetizing some values while only qualitatively identifying others could cause confusion or misinterpretation if readers focus only on the monetized estimates to draw conclusions.

Appendix 6 79
Terms and Definitions
• Average value transfer—A benefit transfer based on the use of an average economic value estimate or some other measure of central tendency obtained from sev-eral relevant primary studies in the existing literature.
• Benefit transfer—The adaptation and use of economic benefit estimates or other information derived from original stated and revealed preference studies in another context. The source(s) of the available economic information is typically referred to as the “study site,” and the context that this information is used in is referred to as the “policy site.”
• Economic benefits (value)—Measured as the amount of money (or other goods and services) that an indi-vidual is willing to give up to obtain a particular good or service. Willingness to pay above and beyond any costs paid for the good or service (for example, entrance fees, travel costs) reflects consumer sur-plus, or net willingness to pay. This is the standard measure of benefits used in economic efficiency or benefit-cost analyses.
• Ecosystem services—Socially valued outcomes result-ing from ecosystem functions. Examples include clean water, harvesting of animals or plants, flood control provided by an intact wetland, and climate regulation resulting from carbon sequestration. Some ecosystem services are commodities sold in markets, such as commercially harvested fish, and others are nonmarket goods and services.
• Function transfer—A benefit transfer based on the use of a statistical model that relates economic benefit estimates with methodological and study site char-acteristics. Transfers can be based on a benefit or demand function, or a meta-regression function.
• Meta-regression function transfer—A benefit trans-fer based on the use of a meta-regression function that statistically analyzes the relationship between economic value estimates and various study- and resource-specific attributes across all applicable primary studies in the existing literature. This rela-tionship is customized to match the characteristics of the policy site for which a value is needed, and a value estimate is forecast based on these user-defined characteristics.
• Nonmarket values—The economic benefits derived from goods and services that are not traded in con-ventional markets.
• Passive use value—Also referred to as “nonuse value,” passive use value reflects nonmarket values that are not associated with the actual use of a resource. This can include the value individuals place on ensuring the availability of a resource for future generations (bequest value), or the value placed on simply know-ing that a resource exists in a particular condition (existence value).
• Point estimate transfer—A benefit transfer based on the use of an economic value estimate from a single relevant primary study in the existing literature.
• Revealed preference methods—Used to estimate non-market use values based on choices that individuals make within related markets. Common approaches include the travel cost method, hedonic pricing method, and the defensive behavior method.
• Stated preference methods—Used to estimate non-market values based on answers to carefully worded survey questions depicting a hypothetical market scenario. Common approaches include the contingent valuation method and attribute-based methods (for example, choice experiments). These methods can be used to estimate both use and passive use values.
• Total economic value—The sum of use (both market and nonmarket) and passive use values for a particu-lar resource.
• Use value—Value derived from the direct use of a resource, such as recreation, or the indirect use of a resource, such as flood control provided by a wetland.
• Value transfer—A benefit transfer based on the use of a single point estimate, a measure of central tendency (for example, an average value), or an administra-tively approved economic value estimate.
Appendix 6


Huber and Richardson—Inclusion of N
onmarket Values in B
LM Planning and Project A
ssessments, Final Report—
Open File Report 2016–1178
ISSN 2331-1258 (online)http://dx.doi.org/10.3133/ofr20161178