Fabrication of metal matrix composite by semi-solid powder ...
177
Graduate eses and Dissertations Iowa State University Capstones, eses and Dissertations 2011 Fabrication of metal matrix composite by semi- solid powder processing Yufeng Wu Iowa State University Follow this and additional works at: hps://lib.dr.iastate.edu/etd Part of the Mechanical Engineering Commons is Dissertation is brought to you for free and open access by the Iowa State University Capstones, eses and Dissertations at Iowa State University Digital Repository. It has been accepted for inclusion in Graduate eses and Dissertations by an authorized administrator of Iowa State University Digital Repository. For more information, please contact [email protected]. Recommended Citation Wu, Yufeng, "Fabrication of metal matrix composite by semi-solid powder processing" (2011). Graduate eses and Dissertations. 10428. hps://lib.dr.iastate.edu/etd/10428
Transcript of Fabrication of metal matrix composite by semi-solid powder ...

Graduate Theses and Dissertations Iowa State University Capstones, Theses andDissertations
2011
Fabrication of metal matrix composite by semi-solid powder processingYufeng WuIowa State University
Follow this and additional works at: https://lib.dr.iastate.edu/etd
Part of the Mechanical Engineering Commons
This Dissertation is brought to you for free and open access by the Iowa State University Capstones, Theses and Dissertations at Iowa State UniversityDigital Repository. It has been accepted for inclusion in Graduate Theses and Dissertations by an authorized administrator of Iowa State UniversityDigital Repository. For more information, please contact [email protected].
Recommended CitationWu, Yufeng, "Fabrication of metal matrix composite by semi-solid powder processing" (2011). Graduate Theses and Dissertations.10428.https://lib.dr.iastate.edu/etd/10428

Fabrication of metal matrix composite by semi-solid powder processing
by
Yufeng Wu
A dissertation submitted to the graduate faculty
in partial fulfillment of the requirements for the degree of
DOCTOR OF PHILOSOPHY
Major: Mechanical Engineering
Program of Study Committee:
Gap-Yong Kim, Major Professor
Alan Russell
Iver Anderson
Pranav Shrotriya
Xinwei Wang
Iowa State University
Ames, Iowa
2011
Copyright © Yufeng Wu, 2011. All rights reserved.

ii
TABLE OF CONTENTS
LIST OF FIGURES .......................................................................................................... v
LIST OF TABLES ........................................................................................................... xi
ACKNOWLEDGEMENTS .......................................................................................... xiii
ABSTRACT .................................................................................................................... xiv
CHAPTER 1 INTRODUCTION ..................................................................................... 1
1.1 MOTIVATION .............................................................................................................. 1 1.2 RESEARCH FRAMEWORK AND OBJECTIVES ................................................................ 6
1.2.1 Compaction Behavior of Al6061 powder in the semi-solid state ....................... 7 1.2.2 Densification behavior of Al6061 and SiC binary powder mixture in semi-
solid state ..................................................................................................................... 8
1.2.3 Fabrication of Al6061 Composite with High SiC Particle Loading by Semi-
solid Powder Processing ............................................................................................. 8 1.2.4 Mechanical Alloying of Carbon Nanotube and Al6061 Powder for Metal-
CNT Composite............................................................................................................ 8
1.2.5 Carbon Nanotube Reinforced Aluminum Composite Fabricated by Semi-
solid Powder Processing ............................................................................................. 9 1.3 DISSERTATION ORGANIZATION .................................................................................. 9
CHAPTER 2 COMPACTION BEHAVIOR OF AL6061 POWDER IN THE
SEMI-SOLID STATE .................................................................................................... 11
2.1 INTRODUCTION ......................................................................................................... 11 2.2 THEORETICAL BACKGROUND ................................................................................... 13 2.3 EXPERIMENTAL PROCEDURE .................................................................................... 17
2.4 RESULTS ................................................................................................................... 21 2.4.1 Estimating Yield of Al6061 in the Semi-solid Region ....................................... 21 2.4.2 Liquid-phase Formation in Al6061 Particles in the Semi-solid State .............. 23 2.4.3 Compaction Curve ............................................................................................ 25
2.4.4 Density and Stress Distribution ........................................................................ 31 2.5 CONCLUSION ............................................................................................................ 33
CHAPTER 3 DENSIFICATION BEHAVIOR OF AL6061 AND SIC BINARY
POWDER MIXTURE IN SEMI-SOLID STATE ........................................................ 35
3.1 INTRODUCTION ......................................................................................................... 35
3.2 EXPERIMENTAL PROCEDURE ..................................................................................... 38 3.3 RESULTS ................................................................................................................... 43

iii
3.3.1 Initial density of the powder mixture ................................................................ 43 3.3.2 Compaction curves ........................................................................................... 44 3.3.3 Reinforcement factor KR ................................................................................... 46
3.3.4 Liquid factor KL ................................................................................................ 48 3.3.5 Compaction of the powder mixture at high liquid fraction region ................... 51
3.4 CONCLUSION ............................................................................................................ 53
CHAPTER 4 FABRICATION OF AL6061 COMPOSITE WITH HIGH SIC
PARTICLE LOADING BY SEMI-SOLID POWDER PROCESSING .................... 54
4.1 INTRODUCTION ......................................................................................................... 54 4.2 EXPERIMENTAL PROCEDURES .................................................................................. 56 4.3 RESULTS AND DISCUSSION ....................................................................................... 60
4.3.1 SiC Loading Limit ............................................................................................. 61 4.3.2 Microstructure .................................................................................................. 65 4.3.3 Hardness ........................................................................................................... 67 4.3.4 Fracture Surface ............................................................................................... 70
4.3.5 Formation of Al4C3 ........................................................................................... 72 4.4 CONCLUSION ............................................................................................................ 73
CHAPTER 5 MECHANICAL ALLOYING OF CARBON NANOTUBE AND
AL6061 POWDER FOR METAL-CNT COMPOSITE .............................................. 76
5.1 NOMENCLATURE ...................................................................................................... 76 5.2 INTRODUCTION ......................................................................................................... 78 5.3 EXPERIMENTAL PROCEDURE .................................................................................... 79 5.4 THEORETICAL ANALYSIS .......................................................................................... 81
5.4.1 Dispersion of CNTs .......................................................................................... 82
5.4.2 Welding and Fracturing of Particles with CNTs .............................................. 83 5.4.3 Deformation of Particles .................................................................................. 87 5.4.4 Determination of k ............................................................................................ 89
5.5 RESULTS ................................................................................................................... 91
5.5.1 Surface CNT Length Distribution (Φs(l,t)) ....................................................... 91 5.5.2 CNT Dispersion (d) .......................................................................................... 96 5.5.3 Nominal Area (Ab), Surface Area (As) and Embedded Area (Ae) ..................... 98 5.5.4 Overall CNT Length Distribution (Φ(l,t)) ...................................................... 101
5.6 CONCLUSION .......................................................................................................... 105
CHAPTER 6 CARBON NANOTUBE REINFORCED ALUMINUM
COMPOSITE FABRICATED BY SEMI-SOLID POWDER PROCESSING ....... 107
6.1 INTRODUCTION ....................................................................................................... 107
6.2 EXPERIMENTAL PROCEDURE .................................................................................. 110

iv
6.3 RESULTS AND DISCUSSION ..................................................................................... 114 6.3.1 Mechanically Alloyed Powders ...................................................................... 114 6.3.2 Compression Behavior of Al6061-CNT Powder ............................................ 118
6.3.3 Microstructure ................................................................................................ 120 6.3.4 Hardness ......................................................................................................... 125 6.3.5 Bend Test ........................................................................................................ 126 6.3.6 Fracture Surface ............................................................................................. 128
6.3.7 Compositional Analysis .................................................................................. 132 6.3.8 Prediction of the Material Strength ................................................................ 134
6.4 CONCLUSION .......................................................................................................... 136
CHAPTER 7 SUMMARY AND CONTRIBUTIONS ............................................... 139
7.1 SUMMARY .............................................................................................................. 139 7.1.1 Modeling of Semi-solid Powder Processing for a Closed-die Compaction ... 140 7.1.2 Densification behavior of Al6061 and SiC binary powder mixture in semi-
solid state ................................................................................................................. 141
7.1.3 Fabrication of Al6061 Composite with High SiC Particle Loading by Semi-
solid Powder Processing ......................................................................................... 141 7.1.4 Mechanical Alloying of Carbon Nanotube and Al6061 Powder for Metal-
CNT Composite........................................................................................................ 142
7.1.5 Carbon Nanotube Reinforced Aluminum Composite Fabricated by Semi-
solid Powder Processing ......................................................................................... 143 7.2 SCIENTIFIC CONTRIBUTIONS ................................................................................... 145 7.3 ACKNOWLEDGEMENTS ........................................................................................... 146
BIBLIOGRAPHY ......................................................................................................... 147

v
LIST OF FIGURES
Fig. 1.1: Global MMC consumption outlook by application/segment (2004-2013)
(BCC_Research 2009) ........................................................................................................ 3
Fig. 1.2: Schematic overview of the production processes about MMCs (Montanari,
Tagliaferri et al. 2009) ........................................................................................................ 4
Fig. 1.3: Schematics of the SPP .......................................................................................... 5
Fig. 2.1: Schematics of die compaction of semi-solid powder ......................................... 14
Fig. 2.2: Yield surface of Shima-Oyane model ................................................................ 15
Fig. 2.3: Experimental setup for semi-solid powder processing ....................................... 18
Fig. 2.4: Heating profile used in the experiments at 600°C .............................................. 20
Fig. 2.5: Solid fraction of Al6061 at different temperature (data obtained from
ThermoCalc 3.1) ............................................................................................................... 21
Fig. 2.6: Yield strength (σy_ssm) of Al6061 above 550°C. .............................................. 23
Fig. 2.7: Microscopy images for Al6061 particles. (a) and (c) back-scatter images of
original Al6061 particles; (b) optical image of original Al6061 particles (polished and
etched); (e) and (f) Al6061 particle heated to 620°C; (g) and (h) Al6061 particle
heated to 641°C. ................................................................................................................ 24
Fig. 2.8: Experimental and modeling results for semi-solid powder compaction from
550°C to 630°C ................................................................................................................. 26
Fig. 2.9: Normalized experimental and modeling results for semi-solid powder
compaction ........................................................................................................................ 27
Fig. 2.10: Experimental results for semi-solid powder compaction from 638°C to
645°C. ............................................................................................................................... 28

vi
Fig. 2.11: Illustration of various stages in powder compaction of an alloy material in
semi-solid regime: (a) powder compact at room temperature; (b)–(d) powder compact
at semi-solid state; (d) and (e) densification of the powder compact ............................... 31
Fig. 2.12: Relative density distribution within the powder compact fabricated and
predicted at 600°C. ........................................................................................................... 32
Fig. 2.13: Density changing rate at different position for different compaction pressure
at 620°C. ........................................................................................................................... 33
Fig. 3.1: Experimental setup for semi-solid powder processing ....................................... 40
Fig. 3.2: Liquid fraction of Al6061 (fL) at different temperature ...................................... 40
Fig. 3.3: Heating profile used in the experiments at 600°C .............................................. 41
Fig. 3.4: Initial density of the powder mixture with different SiC volume fraction ......... 44
Fig. 3.5: Compaction curves for (a) Al6061-10 vol% SiC at different liquid fraction
and (b) Al6061-SiC at fL=0.261 with different SiC volume fraction ................................ 45
Fig. 3.6: KR values with different Al6061 liquid fraction with (a) <30%SiC and
(b)>30%SiC ...................................................................................................................... 47
Fig. 3.7: Compaction curves for (a) Al6061-10 vol% SiC at different temperature and
(b) Al6061-SiC at 638°C with different SiC volume fraction .......................................... 49
Fig. 3.8: KL vs. relative density for powder mixture compacted with different liquid
fraction with 10vol% SiC; fL0=0 ....................................................................................... 50
Fig. 3.9: KL values at different Al6061 liquid fraction for various SiC volume fraction . 51
Fig. 3.10: Relative density of the Al6061-50vol.%SiC composite and liquid squeezing
out amount during compaction. Compaction pressure was 150 MPa for all
compactions. ..................................................................................................................... 52

vii
Fig. 4.1: Various processing routes of semi-solid powder processing ............................. 55
Fig. 4.2: Experiment setup for semi-solid powder forming .............................................. 58
Fig. 4.3: Heating curve used in the experiment ................................................................ 60
Fig. 4.4: Al6061-SiC compaction mechanism .................................................................. 62
Fig. 4.5: Compaction curves of Al6061-SiC and SiC-only powders at 640 ˚C ................ 62
Fig. 4.6: Maximum SiC vol% loading versus compaction pressure for SiC particle
sizes of 10 and 65 m. ...................................................................................................... 64
Fig. 4.7: Microstructure images of composites with 45.8 and 66.3 vol% SiC.
Experimental conditions are: (a) 100 MPa, Al6061(S)-45.8% SiC(L); (b) 100 MPa,
Al6061(S)-45.8% SiC(S); (c) 100 MPa, Al60061(L)- 45.8% SiC(S); (d) 50 MPa,
Al6061(S)-66.3% SiC(L); (e) 50 MPa, Al6061(S)- 66.3% SiC(S); and (f) 100 MPa,
Al6061(L)- 66.3% SiC(S). Note that (b) and (c) are optical images; (a), (d),(e) and (f)
are SEM images. ............................................................................................................... 66
Fig. 4.8: Distribution of Al6061 and SiC (45.8%) powders after blending: (a)
Al6061(S) with SiC(S); (b) Al6061(S) with SiC(L); and (c) Al6061(L) with SiC(S) ..... 66
Fig. 4.9: SEM images showing the polished composite surface: (a) Al6061(S)-45.8%
SiC (L), 100 MPa; (b) Al6061(S)-45.8% SiC (S), 100 MPa; ........................................... 67
Fig. 4.10: Microhardness test results: (a) Hardness of sample with 45.8 vol.% SiC;
and (b) comparison of hardness at different process settings ........................................... 69
Fig. 4.11: SEM images of fracture surfaces of Al6061-SiC composite. Experiment
conditions are: (a) 100 MPa, Al6061(S)-45.8% SiC(L); (b) 100 MPa, Al6061(S)-
45.8% SiC(S); (c) 100 MPa, Al60061 (L)-45.8% SiC(S); (d) 50 MPa, Al6061(S)-

viii
66.3% SiC(L); (e) 50 MPa, Al6061(S)- 66.3% SiC(S); and (f) 100 MPa, Al6061(L)-
66.3% SiC(S); ................................................................................................................... 71
Fig. 4.12: X-ray diffraction spectra of (a) blended Al6061 and SiC powders, and (b)
Al6061-SiC composite (Al6061(L)-45.8% SiC(S), 50 MPa). The arrows indicate
peaks for Si and Al4C3 if they existed. .............................................................................. 73
Fig. 5.1: Schematics of particles in mechanical alloying process..................................... 82
Fig. 5.2: Flow chart for mathematical calculation of CNT length .................................... 85
Fig. 5.3: Schematics of: (a)-(c) welding and (d) fracturing of particles; the dark area
indicated the nominal area of the particles. ...................................................................... 88
Fig. 5.4: CNT morphology with different mechanical alloying time ............................... 93
Fig. 5.5: As received CNT and Al6061-CNT powders mechanically alloyed for 10
mins. .................................................................................................................................. 94
Fig. 5.6: (a) CNT length distribution at mechanical alloying time 10 mins and (b) the
surface CNT length distribution at different mechanical alloying times .......................... 95
Fig. 5.7: SEM images of the polished surface of the Al6061-CNT samples .................... 97
Fig. 5.8: The dispersion d and computed k value during mechanical alloying ................. 98
Fig. 5.9: (a) Al6061-CNT powders mechanically alloyed for 30 mins, (b)-(d) three
types of the approximation geometries and (e) optical image of Al6061-CNT
composite with powders mechanically alloyed for 3 mins ............................................. 100
Fig. 5.10: Flow chart of the computing code .................................................................. 103
Fig. 5.11: (a) Probability function for overall CNT length distribution at different
mechanical alloying time, (b) average overall CNT length, average surface CNT
length and embedded CNT fraction ................................................................................ 105

ix
Fig. 6.1: Comparison of conventional semi-solid forming and semi-solid powder
processing ....................................................................................................................... 109
Fig. 6.2: Experiment setup for semi-solid powder processing........................................ 112
Fig. 6.3: Heating and compression profiles used in the experiment ............................... 112
Fig. 6.4: CNTs and mechanically alloyed Al6061 powder and CNTs: (a) and (b) are
images of as-received CNTs; (c)−(g) are Al6061 powder and CNTs mechanically
alloyed for (c) 10 minutes, (d) 0.5 hr, (e) 1 hr, (f) 2 hrs and (g) 3 hrs, respectively. ...... 115
Fig. 6.5: Al6061 powder mechanical alloyed for: (a) 0.5 hr and (b) 3 hrs. .................... 117
Fig. 6.6: Densification of Al6061-CNT powder during pre-compaction and
consolidation at 640C .................................................................................................... 119
Fig. 6.7: Cross sectional view of (a) the original spherical particle and (b) flattened
particle after deformation ................................................................................................ 119
Fig. 6.8: SEM microstructure images (high magnification) of the Al6061-CNT
samples with powders mechanically alloyed for (a) and (b) 0.5 hr, (c) 2 hrs and (d) 3
hrs. T=640C. ................................................................................................................. 121
Fig. 6.9: SEM microstructure images (low magnification) of the Al6061-CNT
composites with powders mechanically alloyed for (a) 0.5 hr, (b) 1 hr, (c) 2 hrs and
(d) 3 hrs, respectively. T=640C. Circles are CNT clusters, while the pores are
revealed by deep etching process. ................................................................................... 122
Fig. 6.10: Measured dark area fraction in Al6061-CNT and Al6061 samples at
different mechanical alloying time. T=640C ................................................................ 123

x
Fig. 6.11: Micrographs of the etched sample: (a) and (b) are optical images of the
Al6061-CNT 600C composite and Al6061-CNT 640C composite, respectively.
Powder mechanical alloying time: 3 hrs. ........................................................................ 124
Fig. 6.12: Comparison of fabricated composite hardness with different processing
temperature. Powders were mechanically alloyed for 3 hrs. ......................................... 126
Fig. 6.13: Three point bending test results for the Al6061 and Al6061-CNT
composites with different mechanical alloying time. ..................................................... 128
Fig. 6.14: Fracture surfaces of the samples: (a) and (b) are Al6061-CNT composite
mechanically alloyed for 0.5 hr; (c) and (d) are Al6061-CNT composite mechanically
alloyed for 3 hrs. T=640C. ........................................................................................... 129
Fig. 6.15: SEM images of the fracture surfaces: (a) and (b) Al6061-CNT 620C
composite; and (c) and (d) Al6061-CNT 600C composite. Powder mechanical
alloying time: 3 hrs. ........................................................................................................ 131
Fig. 6.16: Al6061-CNT powders mechanically alloyed for 3 hours............................... 132
Fig. 6.17: XRD patterns of the mechanically alloyed particle and synthesized
composite. Data obtained with high energy X-ray diffraction in Argonne National
Lab. ................................................................................................................................. 133
Fig. 6.18: Yield strength obtained with experiments and prediction for Al6061 with
no CNT content and Al6061-CNT composite. ............................................................... 136
xi
LIST OF TABLES
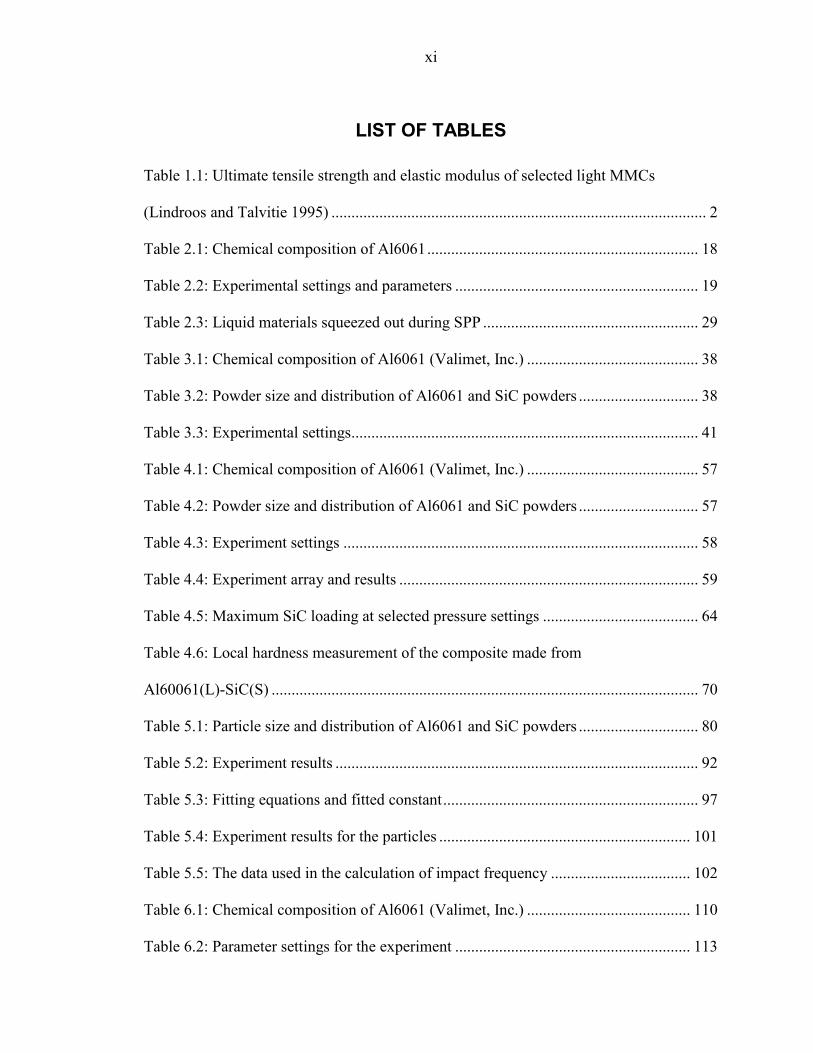
Table 1.1: Ultimate tensile strength and elastic modulus of selected light MMCs
(Lindroos and Talvitie 1995) .............................................................................................. 2
Table 2.1: Chemical composition of Al6061 .................................................................... 18
Table 2.2: Experimental settings and parameters ............................................................. 19
Table 2.3: Liquid materials squeezed out during SPP ...................................................... 29
Table 3.1: Chemical composition of Al6061 (Valimet, Inc.) ........................................... 38
Table 3.2: Powder size and distribution of Al6061 and SiC powders .............................. 38
Table 3.3: Experimental settings....................................................................................... 41
Table 4.1: Chemical composition of Al6061 (Valimet, Inc.) ........................................... 57
Table 4.2: Powder size and distribution of Al6061 and SiC powders .............................. 57
Table 4.3: Experiment settings ......................................................................................... 58
Table 4.4: Experiment array and results ........................................................................... 59
Table 4.5: Maximum SiC loading at selected pressure settings ....................................... 64
Table 4.6: Local hardness measurement of the composite made from
Al60061(L)-SiC(S) ........................................................................................................... 70
Table 5.1: Particle size and distribution of Al6061 and SiC powders .............................. 80
Table 5.2: Experiment results ........................................................................................... 92
Table 5.3: Fitting equations and fitted constant ................................................................ 97
Table 5.4: Experiment results for the particles ............................................................... 101
Table 5.5: The data used in the calculation of impact frequency ................................... 102
Table 6.1: Chemical composition of Al6061 (Valimet, Inc.) ......................................... 110
Table 6.2: Parameter settings for the experiment ........................................................... 113

xii
Table 6.3: Powder particle sizes, grain sizes, and average hardnesses of the
composites....................................................................................................................... 117
Table 6.4: Measured densities at different consolidation temperatures .......................... 124

xiii
ACKNOWLEDGEMENTS
I would like to take this opportunity to express my thanks to those who helped me
with various aspects of conducting research and the writing of this thesis. First and
foremost, thank Dr. Gap-Yong Kim for his guidance, patience and support throughout
this research and the writing of this thesis. I would also like to thank my committee
members, Dr. Alan Russell, Dr. Iver Anderson, Dr. Pranav Shrotriya and Dr. Xinwei
Wang, for their efforts and contribution to this work. Finally, I would thank my parents,
Zhengzhong Wu and Baolian Cheng, and my wife Jing Ren for their invaluable supports
and help in my study in the United State.

xiv
ABSTRACT
Various metal matrix composites (MMCs) are widely used in the automotive,
aerospace and electrical industries due to their capability and flexibility in improving the
mechanical, thermal and electrical properties of a component. However, current
manufacturing technologies may suffer from insufficient process stability and reliability
and inadequate economic efficiency and may not be able to satisfy the increasing
demands placed on MMCs. Semi-solid powder processing (SPP), a technology that
combines traditional powder metallurgy and semi-solid forming methods, has potential to
produce MMCs with low cost and high efficiency. In this work, the analytical study and
experimental investigation of SPP on the fabrication of MMCs were explored. An
analytical model was developed to understand the deformation mechanism of the powder
compact in the semi-solid state. The densification behavior of the Al6061 and SiC
powder mixtures was investigated with different liquid fractions and SiC volume
fractions. The limits of SPP were analyzed in terms of reinforcement phase loading and
its impact on the composite microstructure. To explore adoption of new materials,
carbon nanotube (CNT) was investigated as a reinforcing material in aluminum matrix
using SPP. The process was successfully modeled for the mono-phase powder (Al6061)
compaction and the density and density distribution were predicted. The deformation
mechanism at low and high liquid fractions was discussed. In addition, the compaction
behavior of the ceramic-metal powder mixture was understood, and the SiC loading limit
was identified by parametric study. For the fabrication of CNT reinforced Al6061
composite, the mechanical alloying of Al6061-CNT powders was first investigated. A
mathematical model was developed to predict the CNT length change during the

xv
mechanical alloying process. The effects of mechanical alloying time and processing
temperature during SPP were studied on the mechanical, microstructural and
compositional properties of the Al6061-CNT composites. A shear lag model was applied
to predict the mechanical property (hardness) of the composite. This work demonstrated
the promising potential of SPP in the fabrication of particle/fiber (nanotube) reinforced
MMCs.

1
CHAPTER 1 INTRODUCTION
1.1 Motivation
Metal matrix composites (MMCs) have been widely studied because of their
ability to enhance the mechanical, thermal or electrical properties of the matrix by
incorporating micro or nano size fibers or particles. MMCs have been applied in various
fields for their flexibility in property customization based on specific requirements
(Kaczmar, Pietrzak et al. 2000). As shown in Table 1.1, by adding various fiber and
particle materials, the strength of the composites can be significantly improved (by up to
420%) compared with the matrix phase. The specific strength and specific modulus of
the materials can reach a value of 650 MPa/(Mg/m3) and 120 GPa/(Mg/m
3), respectively.

2
Table 1.1: Ultimate tensile strength and elastic modulus of selected light MMCs
(Lindroos and Talvitie 1995)
Matrix Reinforcement
Vol.
fraction
(%)
Tensile strength Elastic modulus
Value
(MPa)
Improvement
(%)
Specific
strength
(MPa/(Mg/m3))
Value
(GPa)
Improvement
(%)
Specific
modulus
(GPa/(Mg/m3))
Al2024 boron fiber 60 1500 275 644 270 269 116
Al2024 Al2O3 50 450 12.5 135 175 139 53
Al6061 SiC fiber 50 1500 383 507 205 197 69
Al6061 SiC whisker 15 480 55 173 100 45 36
Al6061 SiC particle 15 370 19 133 100 45 36
Mg graphite fiber 40 560 124 230 230 411 115
Mg SiC fiber 50 1300 420 520 230 411 93
The MMC market has been growing significantly in the past 10 years because of
the extraordinary properties of the MMCs. Fig. 1.1 shows the global consumption of
MMCs in different market sectors. An annual consumption growth rate of 5.9% is
expected till 2013, and the total consumption will increase from 4.4 million kilograms in
2008 to 5.9 million in 2013. The increasing growth of the MMC market requires
sophisticated and advanced technologies to mass produce MMCs at a low cost and with
high efficiency. Although there have been more development activities in MMC,
insufficient process stability and reliability, and inadequate economic efficiency still
challenge the MMC manufacturing industry (Kainer 2006).

3
Fig. 1.1: Global MMC consumption outlook by application/segment (2004-2013)
(BCC_Research 2009)
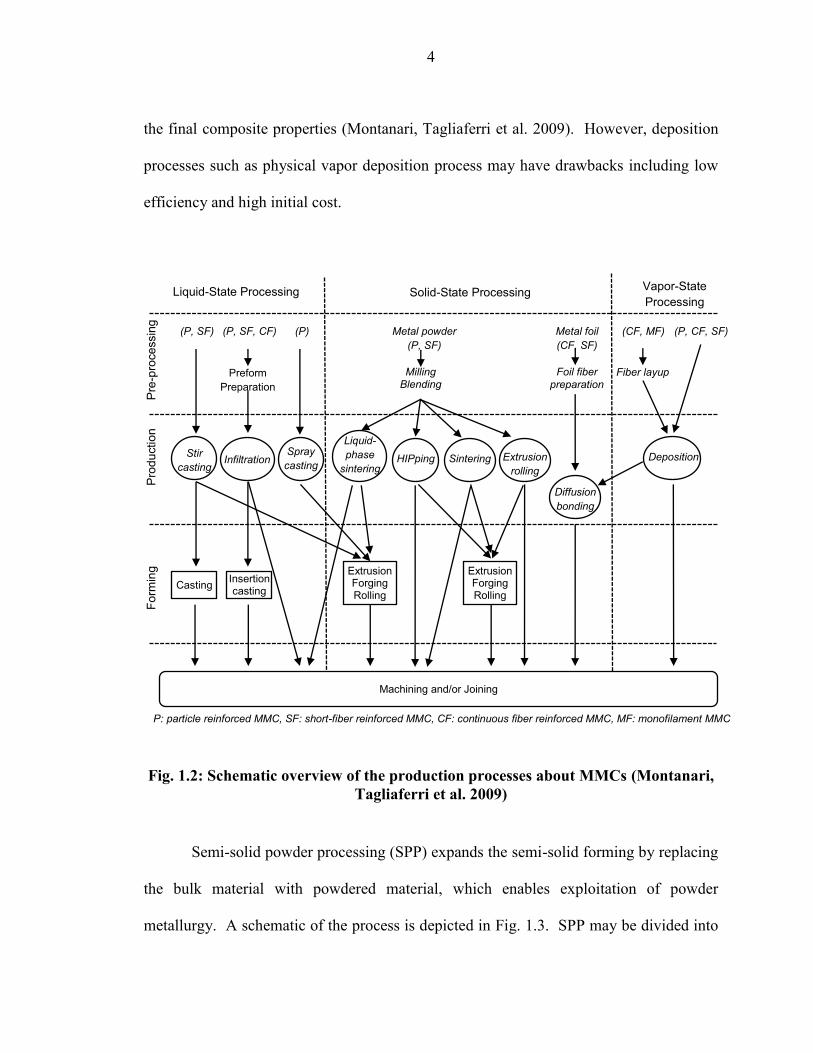
Various technologies were developed for the fabrication of MMCs. As shown in
Fig. 1.2, the processing technology can be divided into three categories, i.e. solid-state
processing, liquid-state processing and vapor-state processing (Montanari, Tagliaferri et
al. 2009). Processing MMCs in the liquid-state (i.e. casting and infiltration) was able to
achieve high relative density. However, post-processing may be required to reduce
distortion and shrinkage of the parts. Solid-state processing of MMC, including HIPing
and sintering, is typically capable of controlling composition accurately. Nevertheless,
they often suffer from sintering imbalance and require a complex green compact
(Kawasaki 1997). One of the major advantages of vapor-state processing is to achieve a
well-bonded fiber/particle-matrix interface without generating reactions that may degrade
0
500
1000
1500
2000
2500
3000
3500
20042005
20062007
20082013
Co
nsu
mp
tio
n (
×10
3 k
g)
Year
Ground transportation
Electronics/thermal management
Aerospace
Industrial
Cosumer products
4
the final composite properties (Montanari, Tagliaferri et al. 2009). However, deposition
processes such as physical vapor deposition process may have drawbacks including low
efficiency and high initial cost.
Fig. 1.2: Schematic overview of the production processes about MMCs (Montanari,
Tagliaferri et al. 2009)
Semi-solid powder processing (SPP) expands the semi-solid forming by replacing
the bulk material with powdered material, which enables exploitation of powder
metallurgy. A schematic of the process is depicted in Fig. 1.3. SPP may be divided into
Liquid-State Processing Solid-State Processing Vapor-State
Processing
Pre
-pro
ce
ssin
g
(P, SF) (P, SF, CF) (P)
Preform
Preparation
Metal powder
(P, SF)
Metal foil
(CF, SF)
(CF, MF) (P, CF, SF)
Milling Blending
Foil fiber
preparation Fiber layup
Stir
casting Infiltration
Spray
casting
Liquid-
phase
sintering HIPping Sintering Extrusion
rolling
Diffusion
bonding
Deposition
Pro
du
ctio
n
Casting Insertion casting
Extrusion Forging Rolling
Extrusion Forging Rolling
Fo
rmin
g
Machining and/or Joining
P: particle reinforced MMC, SF: short-fiber reinforced MMC, CF: continuous fiber reinforced MMC, MF: monofilament MMC

5
four steps: powder mixing, pre-compaction at room temperature, material heat-up and
densification. SPP has been applied to produce net-shaped MMCs with low
reinforcement loading (< 30%). Previous work has demonstrated the potential to produce
composites with high efficiency, low cost and good compositional control with promising
microstructure. However, no work was found in the theoretical analysis of the SPP
technology, the compaction behavior of metal-ceramic powder mixtures during SPP, the
fabrication of high ceramic loading reinforcement MMCs, or the nanotube reinforced
MMCs.
Fig. 1.3: Schematics of the SPP
The motivation of this research is to lay a fundamental foundation that will allow
a scientific approach needed to characterize the SPP and to assess the potentials of SPP in
the fabrication of MMCs. Most importantly, limited research was found in the analytical
study of the powder compaction with the presence of liquid-phase and the knowledge gap
in understanding the theoretical basis of SPP needs to be filled. The compaction behavior
of the metal-ceramic powder mixture in the semi-solid state is not understood. In

6
addition, the reinforcement loading limit of the MMCs during SPP was not fully studied
and understanding the potential of SPP on the fabrication of particle reinforced MMC are
necessary. For the fabrication of CNT reinforced MMCs, the dispersing of CNT was
challenging, and mechanical alloying was usually utilized to disperse the CNTs.
However, mechanical alloying of metal-CNT powders was not well understood, and the
damage to CNT during mechanical alloying needs to be revealed. Also, parametric study
of SPP on the metal-CNT composite should be carried out to obtain a more sophisticated
knowledge of SPP on the fabrication of nanotube reinforced MMCs.
1.2 Research Framework and Objectives
The goal of the study is to theoretically understand the deformation mechanism of
the powders in the semi-solid state and to investigate the potential of SPP in the
fabrication of particle and fiber (nanotube) reinforced MMCs. The objectives of the
study are the following:
1) Understand the compaction behavior of powder compacts in the semi-solid
state and model the relative density and stress responses during SPP for closed-die
compaction.
2) Understand the densification behavior of metal and ceramic powder mixtures
in the semi-solid state and reveal the effects of ceramic volume fraction and metal liquid
fraction on the compaction behavior.

7
3) Study the compaction behavior of SiC reinforced metal composite, identify the
particle reinforcement loading limit during SPP, and examine the mechanical properties
and compositions of the high volume SiC loading reinforced Al6061 composite
processed by SPP with different parameters.
4) Analyze the mechanical alloying of Al6061-CNT powders for a better
understanding of the change of CNT morphology during mechanical alloying.
5) Understand the effects of processing temperature and mechanical alloying time
during SPP on the microstructural, mechanical and compositional properties of the
Al6061-CNT composite.
The following subsections describe the framework of the work to achieve the
above objectives.
1.2.1 Compaction Behavior of Al6061 powder in the semi-solid state
This section focused on the theoretical analysis of the SPP during the closed-die
compaction process. Shima-Oyane’s model was utilized to study the pressure-density
response and density distribution in the compaction direction during the semi-solid
powder compaction process with relative low liquid fraction. Al6061 powder
compaction experiments in the semi-solid region were carried out to verify the modeling
results. The effects of temperature (liquid fraction) on the modeling parameters were
analyzed.

8
1.2.2 Densification behavior of Al6061 and SiC binary powder mixture in semi-solid
state
The densification behavior of metal-ceramic powder mixtures in the semi-solid
state was examined. Al6061 with various SiC volume fractions (0%-60%) were
compacted at temperatures from the 550°C to 660°C (Al6061 liquid fraction from 0%-
100%). The effects of SiC volume fraction and Al6061 liquid fraction on the
densification behavior of the powder mixture were experimentally investigated.
1.2.3 Fabrication of Al6061 Composite with High SiC Particle Loading by Semi-
solid Powder Processing
Aluminum alloys reinforced with SiC particles have been studied extensively for
their favorable properties in structural and thermal applications. However, there has been
only limited research that investigated the loading limit of a reinforcement phase of a
MMC. The objective of this study is to assess the potential of SPP in the fabrication of
high volume fraction SiC particle reinforced Al6061 composite. The compaction and
synthesis mechanism of the composite by SPP was discussed based on reinforcement
phase compaction behavior and processing parameters.
1.2.4 Mechanical Alloying of Carbon Nanotube and Al6061 Powder for Metal-CNT
Composite
Mechanical alloying was widely used to break down the CNT agglomeration in
the metal matrix. However, due to the challenges in collecting the CNTs for
measurement, quantitative study of CNT breakage has been difficult. In this study, the
CNTs with Al6061 powder were mechanically alloyed with high energy milling

9
equipment. A mathematical model has been developed to predict the overall CNT length
distribution during mechanical alloying process. The effects of mechanical alloying time
and welding and fracturing of particles on the CNT length and length distribution were
investigated.
1.2.5 Carbon Nanotube Reinforced Aluminum Composite Fabricated by Semi-solid
Powder Processing
High strength and high thermal and electronic conductivities make CNTs an ideal
reinforcing material for composites. In metal composites, however, progress has been
rather slow due primarily to challenges associated with CNT dispersion and high
temperature processing used in the synthesis of metal composites. In this section, carbon
nanotube (CNT) reinforced aluminum alloy 6061 (Al6061) composite was synthesized by
SPP. The effects of the processing temperature and mechanical alloying time on the
powder morphology, microstructure, hardness, flexural strength, fracture surface and
composition of the Al6061-CNT composite were investigated. A modified shear lag
model was used to predict the strength of Al6061-CNT at different mechanical alloying
times.
1.3 Dissertation Organization
The remainder of the dissertation is divided into six chapters. In Chapter 2, the
compaction behavior of powders in the semi-solid state was analyzed, and the pressure-
density relationship was modeled by extending application of the Shima-Oyane model to
10
the semi-solid region with relatively low liquid fraction. In Chapter 3, densification
behavior of Al6061 and SiC powder mixtures was studied. The effects of SiC fraction
and Al6061 liquid fraction on the compaction behavior were examined. In Chapter 4,
high volume SiC fraction reinforced Al6061 composites were fabricated by SPP. The
effects of process parameters on the microstructures, properties and the compositions of
the samples were examined. Chapter 5 investigated the mechanical alloying of Al6061-
CNT powders. A mathematical model was developed to predict the CNT length during
mechanical alloying. In Chapter 6, CNT reinforced Al6061 composites were processed
with SPP. The effects of fabrication temperature and mechanical alloying time on the
composite were investigated. A summary and contribution of this research are presented
in Chapter 7.

11
CHAPTER 2 COMPACTION BEHAVIOR OF AL6061 POWDER IN
THE SEMI-SOLID STATE
2.1 Introduction
SPP attracted increasing interest in recent years. SPP combines the benefits of the
semi-solid forming and powder metallurgy (Steinhoff, Weidig et al. 2004; Kim, Koc et al.
2007; Kim, Ni et al. 2007). The flexibility of powder mixing enables the advantage of
tailoring material properties (El Wakil 1992; Luo, Cheng et al. 2006; Wu, Kim et al.
2010b). The unique rheological characteristic of the semi-solid flow allows forming of
complex geometries. It can also minimize post processing steps typically required in
powder metallurgy routes. SPP has been successfully applied to process alloy systems
materials such as Al-Ti (Yasue 2000; Wen 2001) and Al-Mg (Young and Clyne 1986a),
and composite materials including Al-SiC (Guo and Tsao 2000; Chen, Yang et al. 2004;
Wu 2009; Wu, Kim et al. 2010a; Wu, Kim et al. 2011) and Al-CNT. Wu et al. also
demonstrated the effectiveness of semi-solid powder flow in filling the micro-scale
features for applications in micro/meso-manufacturing (Wu, Kim et al. 2010b).
Models have been developed to predict and understand the semi-solid forming
and powder compaction behavior. In general, the modeling approach for semi-solid
forming depends on the amount of solid phrase (or liquid-phase) in the material (Ilegbusi
and Ballas 1999). When the solid fraction is high (>0.5), the material can be regarded as
a viscoplastic porous medium saturated with liquid (Kim, Koc et al. 2007). At low solid

12
fractions, the solid-phase is treated as agglomerations within the slurry system, and the
degree of agglomeration is then characterized by processing parameters like strain rate
(Kumar, Martin et al. 1994). Several constitutive models have been developed to
describe the powder compaction process. Drucker-Prager cap model is one of the most
widely used powder compaction models (Brewin, Coube et al. 2008). It is capable of
providing an accurate prediction of density evolution based on the pressure applied (Lee
and Kim 2002). To determine the parameters used in this model, however, a triaxial
compression experiment is needed, which is delicate and requires sophisticated
equipment (Brewin, Coube et al. 2008). The parameters are likely to vary as the
temperature is changed. Fleck et al. (Fleck, Kuhn et al. 1992) developed a yield criterion
for powder compacts based on the particle strain energy analysis, enabling a direct
application of the constitutive equations to the powder compaction process. Shima and
Oyane (Shima and Oyane 1976) proposed a plastic yield criterion for porous metallic
structures fabricated by sintering process. This model has been successfully applied to
both room (Shima and Oyane 1976) and high temperature powder compaction processes
(Kang and Jung 1999). However, no study was found that extended into the semi-solid
regime to model the powder compaction in the presence of liquid-phase.
In this work, the compaction behavior of metallic alloy powder in the semi-solid
regime was studied. Al6061 powders were compacted at temperatures below the melting
point (550°C) to the semi-solid range (645°C). The SPP was modeled for the first time
by extending Shima-Oyane’s model for the prediction of compaction of powders with a
relatively low liquid fraction (<20 vol%). The effects of temperature (or liquid fraction)

13
on the parameters of the model were analyzed. The friction between the powder and die
was modeled to obtain a more accurate density prediction. The predicted overall density
and density distribution along the compaction direction were compared with experimental
findings. In addition, the powder compaction behavior with high liquid fraction (>20
vol%) was experimentally analyzed.
2.2 Theoretical Background
An alloy material in semi-solid state is partly melted between the solidus and
liquidus temperatures, and therefore, both solid and liquid-phases coexist. The liquid
fraction of the material can be defined as:
(2.1)
where, Vs and Vl are the volumes of the solid and liquid-phases, respectively. The
relative density of the powder compact D, i.e. the volume fraction of the semi-solid
mixture in the powder compact, can be obtained through:
(2.2)
where, Vp is the volume of the pores.
As shown in Fig. 2.1, the semi-solid skeleton (i.e., the matrix phase consisting of
solid and liquid-phases) and the pores bear the load applied to the powder compact. The

14
stress component acting on the powder compact can be separated into the semi-solid
skeleton and the pores as:
(2.3)
where, σijt is the total stress applied to the semi-solid powder compact; σij
ssm and σij
pore are
the stress components taken by the semi-solid skeleton and the pores, respectively;
Fig. 2.1: Schematics of die compaction of semi-solid powder
Although the Shima-Oyane yield model was originally developed for sintered
porous metals, the model has shown to predict the behavior of cold powder compaction
process quite successfully (Lee and Kim 2002). At elevated temperatures when the
material becomes mushy, the porous material will behave very similar to interlinked
porous structure for which the original Shima-Oyane yield criterion was developed. If
the liquid-phase is uniformly distributed in the semi-solid skeleton during the compaction
process, one can apply the Shima-Oyane model to evaluate the stress required to deform
Punch
Die
Particle in semisolid state
Air/pore
σzzt
15
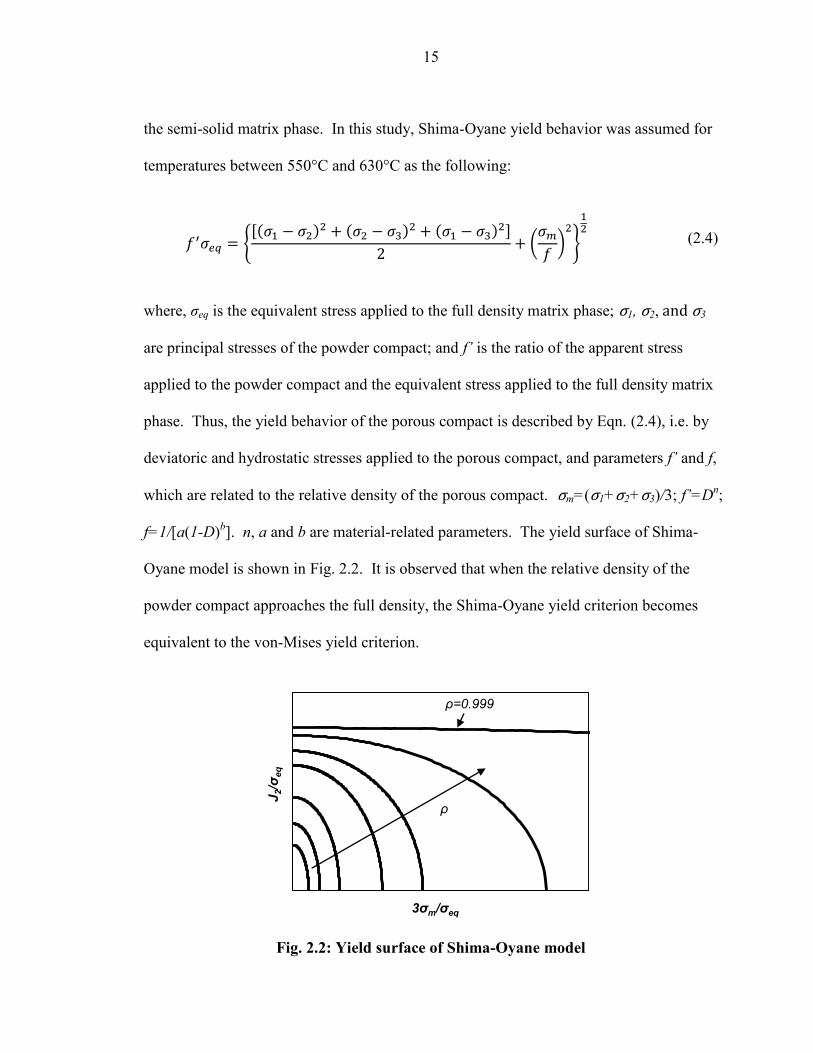
the semi-solid matrix phase. In this study, Shima-Oyane yield behavior was assumed for
temperatures between 550°C and 630°C as the following:
{[( )
( ) ( )
]
(
)
}
(2.4)
where, σeq is the equivalent stress applied to the full density matrix phase; σ1, σ2, and σ3
are principal stresses of the powder compact; and f’ is the ratio of the apparent stress
applied to the powder compact and the equivalent stress applied to the full density matrix
phase. Thus, the yield behavior of the porous compact is described by Eqn. (2.4), i.e. by
deviatoric and hydrostatic stresses applied to the porous compact, and parameters f’ and f,
which are related to the relative density of the porous compact. σm=(σ1+σ2+σ3)/3; f’=Dn;
f=1/[a(1-D)b]. n, a and b are material-related parameters. The yield surface of Shima-
Oyane model is shown in Fig. 2.2. It is observed that when the relative density of the
powder compact approaches the full density, the Shima-Oyane yield criterion becomes
equivalent to the von-Mises yield criterion.
Fig. 2.2: Yield surface of Shima-Oyane model
J2/σ
eq
3σm/σeq
ρ
ρ=0.999
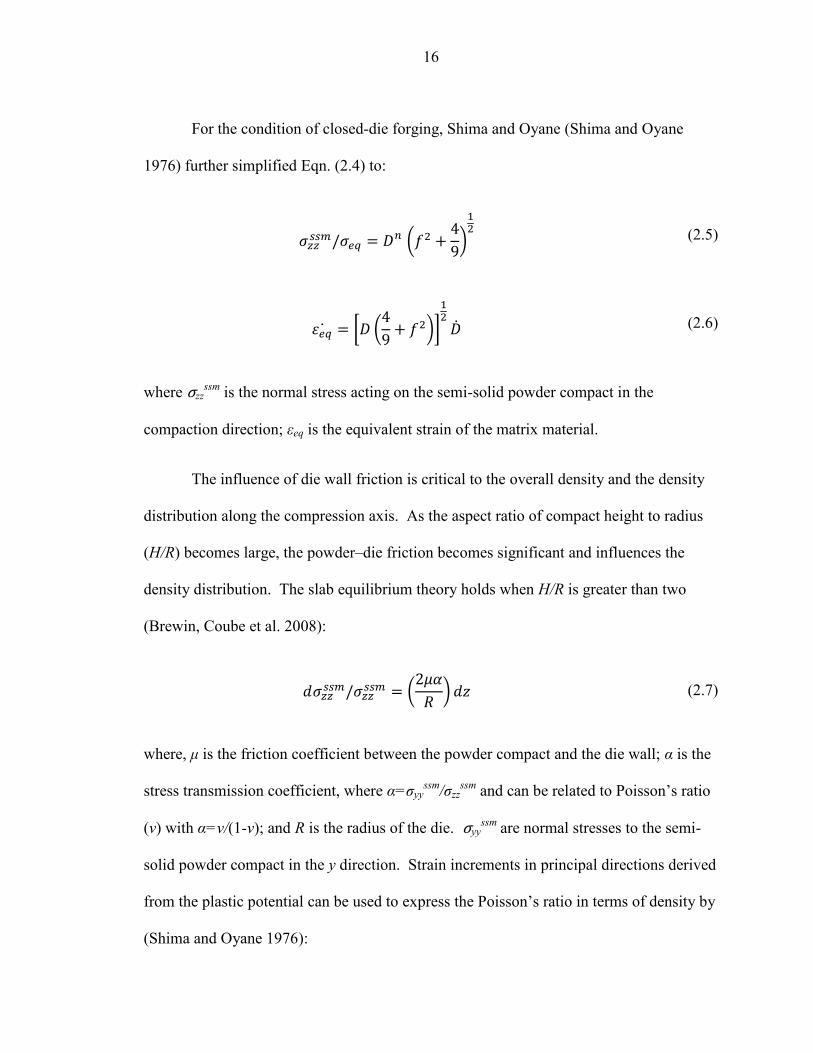
16
For the condition of closed-die forging, Shima and Oyane (Shima and Oyane
1976) further simplified Eqn. (2.4) to:
(
)
(2.5)
[ (
)]
(2.6)
where σzzssm
is the normal stress acting on the semi-solid powder compact in the
compaction direction; εeq is the equivalent strain of the matrix material.
The influence of die wall friction is critical to the overall density and the density
distribution along the compression axis. As the aspect ratio of compact height to radius
(H/R) becomes large, the powder–die friction becomes significant and influences the
density distribution. The slab equilibrium theory holds when H/R is greater than two
(Brewin, Coube et al. 2008):
(
) (2.7)
where, μ is the friction coefficient between the powder compact and the die wall; α is the
stress transmission coefficient, where α=σyyssm
/σzzssm
and can be related to Poisson’s ratio
(v) with α=v/(1-v); and R is the radius of the die. σyyssm are normal stresses to the semi-
solid powder compact in the y direction. Strain increments in principal directions derived
from the plastic potential can be used to express the Poisson’s ratio in terms of density by
(Shima and Oyane 1976):

17
(
)
(2.8)
Following a similar procedure suggest by Kang et al. (Kang and Jung 1999), the
stress taken by the pore can be calculated as σijpore
=δijpgfg, where, ij is Kronecker delta;
pg is the hydrostatic pressure of pores; and fg is the volume fraction of the porosity. The
hydrostatic pressure within the pores enclosed by the solid-liquid mixture can be
estimated from (Svoboda, Riedel et al. 1996):
(2.9)
where, pex is the external gas pressure (i.e., the atmospheric pressure); fgcl is the pore close
porosity (typically, fgcl is 0.125 (Svoboda, Riedel et al. 1996)).
Therefore, the overall stress required to compress the semi-solid powder compact
can be evaluated with Eqn. (2.3), where the stress component acting on the semi-solid
matrix phase and pores are calculated by Eqns. (2.5) and (2.9), respectively. The stress
distribution along the compaction direction is obtained by Eqn. (2.7).
2.3 Experimental Procedure
Gas atomized Al6061 powder was used for the closed-die compaction to verify
the developed analytical approach. The mean size of the Al6061 powder (Valimet, Inc.)
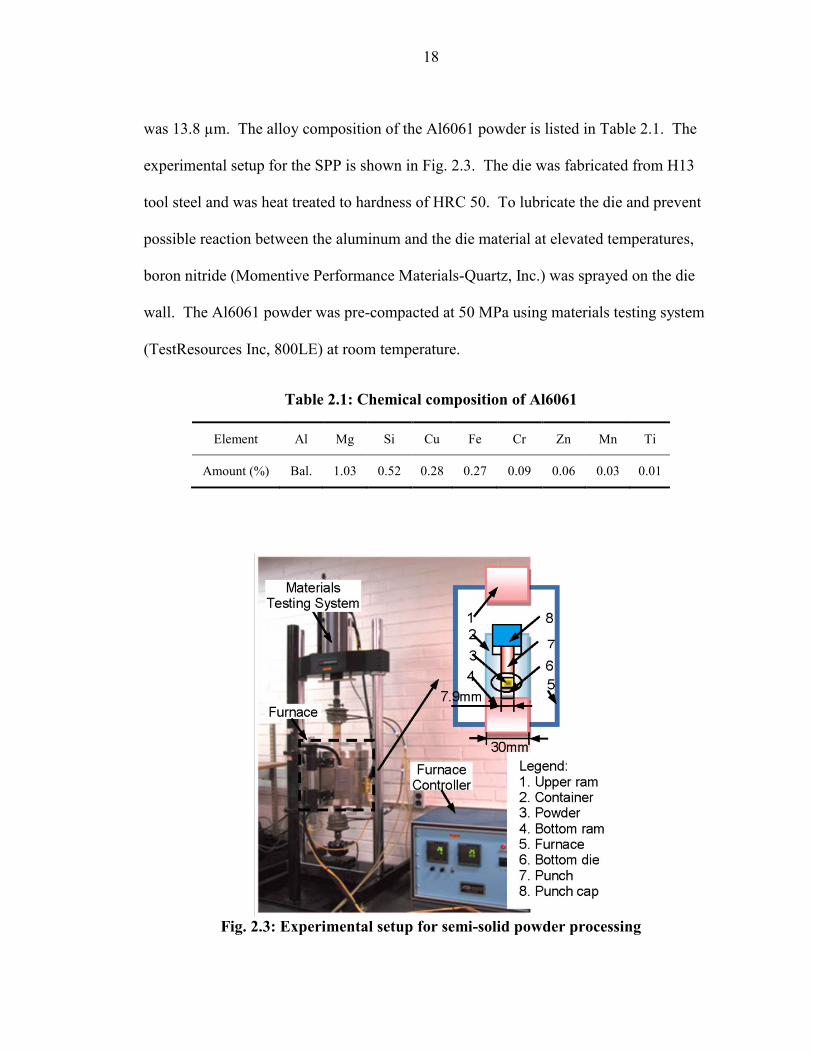
18
was 13.8 µm. The alloy composition of the Al6061 powder is listed in Table 2.1. The
experimental setup for the SPP is shown in Fig. 2.3. The die was fabricated from H13
tool steel and was heat treated to hardness of HRC 50. To lubricate the die and prevent
possible reaction between the aluminum and the die material at elevated temperatures,
boron nitride (Momentive Performance Materials-Quartz, Inc.) was sprayed on the die
wall. The Al6061 powder was pre-compacted at 50 MPa using materials testing system
(TestResources Inc, 800LE) at room temperature.
Table 2.1: Chemical composition of Al6061
Element Al Mg Si Cu Fe Cr Zn Mn Ti
Amount (%) Bal. 1.03 0.52 0.28 0.27 0.09 0.06 0.03 0.01
Fig. 2.3: Experimental setup for semi-solid powder processing

19
At elevated temperatures, pressure was applied for densification of the powder
compact. The experimental conditions and model parameters are summarized in Table
2.2. Eight temperature settings ranging from 550°C to 645°C, with liquid fraction in the
range of 0–41.8%, were used in the experiments. The liquid fractions at different
temperatures were obtained from ThermoCalc and verified with experimental results of
differential scanning calorimetry analysis conducted by Kim and Kang et al. (2007). The
temperature profiles for the experiments at 600°C settings are shown in Fig. 2.4, and
other temperature profiles are similar. After heating the pre-compact to the target
temperature, a constant punch velocity of 0.01 mm/s was applied. Maximum pressure
applied varied from 15 MPa through 50 MPa to analyze the effect of friction on the
relative density distribution according to Eqn. (2.7).
Table 2.2: Experimental settings and parameters
Temperature
Liquid
fraction (%)
(2007)
Compaction
pressure
(MPa)
Friction
coefficient used
in model
Model parameters
a b n
550°C 0.00 50 0.55 2.1 0.5 2.6
580°C 3.88 50 0.55 2.1 0.5 2.6
600°C 7.30 35 0.55 2.1 0.5 2.6
620°C 12.40 20 0.55 2.6 0.4 2.6
630°C 17.85 20 0.55 2.6 0.4 2.6
638°C 26.22 15 0.55 2.6 0.4 2.6
641°C 31.50 15 0.55 2.6 0.4 2.6
645°C 41.80 15 0.55 2.6 0.4 2.6

20
Fig. 2.4: Heating profile used in the experiments at 600°C
The density of the samples was calculated from measured mass and volume. The
samples were weighed with a precision balance (Sartorius GD503, accuracy 0.0001g).
The volume of the samples was calculated by measuring the diameter and height with a
micrometer. Four measurements were taken at different locations of the sample, and the
average value was used. Archimedes’s method was not used because of the existence of
large amount of open pores observed at lower densities. Samples were cut with a
diamond saw and polished for optical inspection using a scanning electron microscope
(JEOL JSM-606LV). Keller’s etchant was used to etch the Al6061 samples for 20
seconds.
0
100
200
300
400
500
600
700
800
0 20 40 60
Tem
pera
ture
(°C
)
Time (min)
Material temperature
Furnace temperature

21
2.4 Results
The yield response of Al6061 in the semi-solid state was first discussed. The
relative density during SPP was modeled and the results were compared with the
experimental measurements for processing temperatures between 550°C and 645°C.
Finally, compaction behavior of semi-solid powder and model limits were analyzed.
2.4.1 Estimating Yield of Al6061 in the Semi-solid Region
Lou et al. (2002) carried out compression tests with Al6061 rods in the semi-solid
region from 550°C to 610°C. As shown in Fig. 2.5, the solid fraction of Al6061
dramatically decreases after 620°C, and thus, a direct extrapolation of Lou’s data will
lead to an overestimation of the yield of Al6061 beyond 620°C when a significant
amount of liquid-phase is present. On the other hand, the solid-phase of the material will
follow the temperature dependency. Therefore, we assumed that the solid-phase yield
strength may be extrapolated to obtain the yield of the solid-liquid mixture above 610°C.
Fig. 2.5: Solid fraction of Al6061 at different temperature (data obtained from
ThermoCalc 3.1)
0
0.1
0.2
0.3
0.4
0.5
0.6
0.7
0.8
0.9
1
550 570 590 610 630 650
So
lid
fra
cti
on
Temperature (°C)

22
According to Gunasekera et al. (Gunasekera 1993; Gunasekera and Zhou 1997),
the yield strength of material in the semi-solid state is related to the solid-phase yield
strength through the following equation:
(2.10)
where δ is a parameter, function of liquid fraction (fl) in the form of δ=1-βflk. β=1.26 and
k=2/3. The relation agrees well with experimental measurements up to liquid fraction of
0.4. Therefore, the solid-phase strength was calculated from Eqn. (2.10) using Lou’s data
and extrapolated. The fitted results are presented in Eqn. (2.11). Finally, the yield
properties of the semi-solid matrix for any temperature above 550°C, σy_ssm, can be
calculated from Eqns. (2.10) and (2.11). The comparison of fitted results and
experimental data from Ref (Lou, Huang et al. 2002) is shown in Fig. 2.6.
(2.11a)
(2.11b)
where is the strain rate, σy is the yield stress (MPa) and T is temperature in the unit
of °C.

23
Fig. 2.6: Yield strength (σy_ssm) of Al6061 above 550°C.
2.4.2 Liquid-phase Formation in Al6061 Particles in the Semi-solid State
The microstructures and the morphologies of the original Al6061 particles,
Al6061 particles heated to 620°C or 641°C and cooled to room temperature are shown in
Fig. 2.7. In the back-scatter mode, the white dots (or streak marks) and agglomerations
were found to be a combination of Mg (1.3-2 wt.%), Si (1.2-4 wt.%), Fe (4-10 wt.%), Cu
(~0.5 wt.%), Cr (~0.5 wt.%) and Al (bal.) according to the EDX results obtained from
multiple positions with large white agglomerations. The solidification patterns were
shown in Fig. 2.7(a) and (b). The alloy elements were uniformly distributed in the whole
particle. After heating up to 620°C and cooling to room temperature, the alloy elements
slightly agglomerated (Fig. 2.7(d)). The alloy elements further agglomerated into large
white spots as shown in Fig. 2.7(f).

24
Fig. 2.7: Microscopy images for Al6061 particles. (a) and (c) back-scatter images of
original Al6061 particles; (b) optical image of original Al6061 particles (polished
and etched); (e) and (f) Al6061 particle heated to 620°C; (g) and (h) Al6061 particle
heated to 641°C.
The melting of the particle will most likely occur along solidification patterns.
From the Fig. 2.7(a) and (b), the melting may start both inside and on the surface of the
(a)
(d)
(f)
(c)
(e)
(g)
10 µm
(b)
Irregular solid arms
Liquid pocket

25
particles at 620°C. When the temperature approached to 641°C, the melting significantly
increased at the surface of the Al6061 particle. Liquid pockets formed and resulted in
irregular solid arms. This is captured in Fig. 2.7(g) where large number of liquid pockets
or channels on the particle surfaces formed at 641°C. These geometries (dark pockets or
channels) were not observed at lower temperature (Fig. 2.7(c) and (e)).
2.4.3 Compaction Curve
The prediction of relative density with the model matched the results for temperature
ranges from 550°C to 630°C at which the liquid fraction of Al6061 was from 0 to 0.18, as shown
in Fig. 2.8. Since the powder was pre-compacted at room temperature at 50 MPa, it
would require a finite amount of pressure to initiate the deformation of the powder
compact. As shown in Fig. 2.8, Shima-Oyane model was able to capture the initial
pressure required to deform the pre-compacted powder in the semi-solid state. The
parameters used in the model are listed in Table 2.2.

26
Fig. 2.8: Experimental and modeling results for semi-solid powder compaction from
550°C to 630°C
In the model, the parameters, a and b, were different for temperatures below and
above 600°C. It was speculated that the structural deformation property changed when
high amount of liquid-phase was present. When the liquid fraction is low, the liquid
material is isolated within the particle during deformation. On the other hand, at higher
liquid-phase content, the liquid-phase may form a connected network leading to change
in the structural response of the compact. This can be captured by changing the structural
parameters, a and b.
As shown Fig. 2.9, when the pressure (P) was normalized by the pressure required
to obtain a relative density of 0.95 (PD=0.95), the compaction curves collapse into a single
curve for temperatures between 550°C and 630°C. This indicated that the overall
0.6
0.65
0.7
0.75
0.8
0.85
0.9
0.95
1
0 5 10 15 20 25 30 35 40 45 50
Rela
tiv
e d
en
sit
y
Pressure (MPa)
T=630⁰C_Model
T=630⁰C_Exp
T=620⁰C_Model
T=620⁰C_Exp
T=600⁰C_Model
T=600⁰C_Exp
T=580⁰C_Model
T=580⁰C_Exp
T=550⁰C_Model
T=550⁰C_Exp
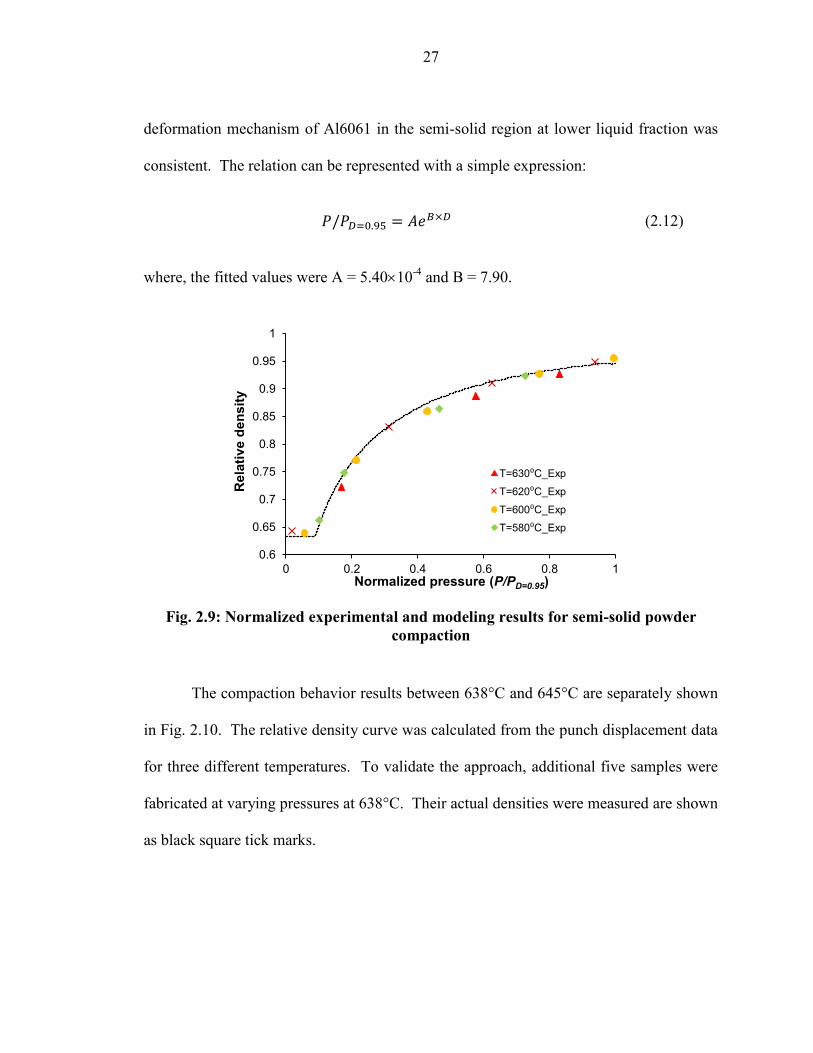
27
deformation mechanism of Al6061 in the semi-solid region at lower liquid fraction was
consistent. The relation can be represented with a simple expression:
(2.12)
where, the fitted values were A = 5.4010-4
and B = 7.90.
Fig. 2.9: Normalized experimental and modeling results for semi-solid powder
compaction
The compaction behavior results between 638°C and 645°C are separately shown
in Fig. 2.10. The relative density curve was calculated from the punch displacement data
for three different temperatures. To validate the approach, additional five samples were
fabricated at varying pressures at 638°C. Their actual densities were measured are shown
as black square tick marks.
0.6
0.65
0.7
0.75
0.8
0.85
0.9
0.95
1
0 0.2 0.4 0.6 0.8 1
Rela
tiv
e d
en
sit
y
Normalized pressure (P/PD=0.95)
T=630⁰C_Exp
T=620⁰C_Exp
T=600⁰C_Exp
T=580⁰C_Exp

28
Fig. 2.10: Experimental results for semi-solid powder compaction from 638°C to
645°C.
It was quite obvious that the model failed to predict the density change in these
high temperature ranges. As shown in Fig. 2.10, the relative density–compaction
pressure curves were similar to each other for temperatures between 638°C to 645°C,
although the liquid fraction varied from 26% to 42%. It was noted that the liquid-phase
escaped during the compaction process for temperatures above 630°C as summarized in
Table 2.3. Excessive amount of liquid material squeezed out during the initial stage of
compaction, and the resultant material content (i.e., the liquid fraction in the leftover
material) was similar in these three. Consequently, similar pressure–density curves were
observed for temperatures between 638°C and 645°C in spite of the significantly
different initial liquid content.
0.55
0.6
0.65
0.7
0.75
0.8
0.85
0.9
0.95
1
0 2 4 6 8 10 12 14 16
Rela
tiv
e d
en
sit
y
Pressure (MPa)
T=638⁰C_Exp
T=638⁰C
T=638⁰C_Model
T=641⁰C
T=641⁰C_Model
T=645⁰C
T=645⁰C_Model A
B
C

29
Table 2.3: Liquid materials squeezed out during SPP
Temperature
Compaction
pressure
(MPa)
Liquid
squeezed out
(g/0.9g)
Original liquid
fraction (%)
Liquid fraction
in leftover
material (%)
550°C-620°C Varies 0 0 0
630°C 15 0.008 17.85 17.11
638°C
2 0.055
26.22
21.42
3 0.052 21.70
5 0.055 21.42
7.5 0.065 20.40
15 0.063 20.67
641°C 15 0.112 31.50 21.76
645°C 15 0.165 41.80 28.73
The characteristic of the curve shape was different from those at lower
temperatures because of the agglomeration of liquid materials. An apparent change of
stress–density response was observed at location A. At high liquid-phase content,
irregular solid-phase morphology was formed as shown in Fig. 2.7(g). The interlocking
of the irregular solid arms may have result in strengthening of the material causing a
sudden change in the densification behavior.
A schematic of powder compaction of Al6061 at low and high liquid fractions is
illustrated in Fig. 2.11. The compaction behavior of the powder compact in the semi-
solid state can be summarized as the following:

30
1) When the liquid fraction is below 10%, an isolated liquid-phase formation is
observed throughout the particle (see Fig. 2.11(b)). Shima-Oyane model is
capable of predicting the compaction behavior in the semi-solid state.
2) When the liquid fraction is between 10% and 20%, some of the liquid-phase
within the particle may form a network (Fig. 2.11(c)). The material structural
parameters, i.e. a and b, in the Shima-Oyane model need to be corrected to
account for liquid-phase effect on the powder compaction behavior.
3) When the liquid fraction is higher than 20%, the compaction mechanism deviated
from that of Shima-Oyane model because of the squeeze out of the liquid-phase
and the formation of solid-phase with irregular morphology. The Shima-Oyane
model is no longer applicable in this region.

31
Fig. 2.11: Illustration of various stages in powder compaction of an alloy material in
semi-solid regime: (a) powder compact at room temperature; (b)–(d) powder
compact at semi-solid state; (d) and (e) densification of the powder compact
2.4.4 Density and Stress Distribution
Relative density distribution at 600°C is presented in Fig. 2.12. The top of the
sample was contacting the moving punch, and the bottom of the sample was in contact
with the stationary die. As expected, the relative density of the sample decreased from
the top of the sample to the bottom. The model predicted the density distribution
reasonably well.

32
(a)
Fig. 2.12: Relative density distribution within the powder compact fabricated and
predicted at 600°C.
The rate change of relative density (dD/dt, where t is time) at different powder
compact location during the compaction process at 620°C is shown in Fig. 2.13. Relative
density rate showed a contrasting behavior at the top and bottom surfaces as the pressure
was applied. In the beginning, the densification immediately started near the top surface
where the powder was in contact with the moving punch, while densification is minimal
near the bottom of the compact. As the pressure is applied to the powder compact, the
densification progressed through the bottom of the compact. In the late stage of the
compaction process, the density increasing rate at the bottom was higher than that at the
top.
0.8
0.82
0.84
0.86
0.88
0.9
0.92
0.94
0.96
0.98
1
0 0.2 0.4 0.6 0.8 1
Re
lati
ve
de
ns
ity
Position
20 MPa_Exp
20 MPa_Model
35 Mpa_Exp
35 MPa_Model
Top Bottom

33
Fig. 2.13: Density changing rate at different position for different compaction
pressure at 620°C.
2.5 Conclusion
The compaction behavior of Al6061 powder in the semi-solid temperature range
with liquid content up to 42% was studied. The Shima-Oyane model was successful at
capturing the compaction behavior of semi-solid powder when the liquid fraction was
relative low (<20%). When liquid fraction was above 10%, the material structural
response changed, which resulted in adjusting of the material structural parameters, a and
b. As the liquid content increased to higher than 20%, the model prediction deviated
from the experimental measurements. Microstructural analysis showed that the liquid-
phase was no longer uniformly distributed within the particle, but rather agglomerated
into liquid pockets. Liquid-phase squeeze out and interlocking of irregular solid-phase
may have resulted in changes in the compaction behavior. It was also discovered that all
the normalized pressure–relative density curves in temperature ranges between 580°C
Pressure (MPa)
Position
dD/dt
Top
Bottom

34
and 620°C merged into a single curve and can be expressed with a simple exponential
expression. The effects of die wall–powder friction on the relative density distribution
along the compaction direction were also successfully predicted by the model.

35
CHAPTER 3 DENSIFICATION BEHAVIOR OF AL6061 AND SIC
BINARY POWDER MIXTURE IN SEMI-SOLID STATE
3.1 Introduction
Semi-solid powder processing (SPP) combines the benefits of the semi-solid
forming and powder metallurgy (Steinhoff, Weidig et al. 2004; Kim, Koc et al. 2007;
Kim, Ni et al. 2007). It allows the flexibility of mixing various powders for tailored
composite properties (El Wakil 1992; Luo, Cheng et al. 2006; Wu, Kim et al. 2010b) and
minimizes post processing steps typically required in powder metallurgy routes. Fully
densified composites and components can be fabricated with relatively low pressure.
Composite materials including Al-SiC (Guo and Tsao 2000; Chen, Yang et al. 2004; Wu
2009; Wu, Kim et al. 2010a; Wu, Kim et al. 2011) and Al-CNT (Wu and Kim 2011a)
have been successfully fabricated by semi-solid powder processing, which have
demonstrated a promising potential of SPP as a viable metal matrix composite
manufacturing process.
The compaction of powder mixtures has been investigated for decades. Lange et
al. (Lange, Atteraas et al. 1991) investigated cold compaction of aluminum and steel
particles and speculated that the steel formed local network when the volume fraction
was larger than 20 vol%. Hafizpour et al. (Hafizpour 2008) examined the compaction
behavior of Al+SiC powder mixtures with variation of SiC particle size by Heckel
equation (Denny 2002), Panelli equation (Panelli and Ambrozio Filho 2001), and

36
Cooper-Eaton equation (Cooper and Eaton 1962). The results showed that the
compaction pressure increased as the particle size of SiC decreased. Compaction of
powder mixture with up to 60% hard phase reinforcement was also investigated, and
mechanical properties of the pressed parts were studied (Martin, Lame et al. 2000).
Theoretical models were proposed by Storakers et al. (Storåkers, Fleck et al. 1999),
Bouvard (Bouvard 1993), and Kim et al. (Kim, Cho et al. 2000) to predict the
compaction behavior of powder mixtures at room temperature. However, little research
was found on the compaction behavior of powder mixtures at elevated temperatures
involving liquid-phase, i.e., semi-solid or mushy state.
In Storakers’s model, a reinforcement factor KR was proposed to describe the
increase of stress required to compact the powder mixture containing hard and soft
particles compared with that required for the monolithic soft phase particles at room
temperature (Storåkers, Fleck et al. 1999). Assuming that the powder mixture and the
monolithic powder are subjected to the same strain history, , the macroscopic stress in
the powder mixture, , is related to the macroscopic stress of the monolithic soft
powder, . For a closed-die compaction the following relationship can be established
according to Storakers (1999):
(3.1)
(3.2)

37
where D0 and D are the initial relative density and relative density of the powder compact,
respectively; and z is the compaction direction. If the hard phase is assumed rigid
compare with the soft phase, KR is only a function of the hard phase volume fraction and
initial powder mixture and soft phase densities as the following:
(3.3)
where and
are the initial density of the powder mixture compact and monolithic
soft phase powder compact, respectively. The hard phase volume fraction can be
calculated by:
(3.4)
where Vh and Vs are the volumes of the hard phase and soft phase materials, respectively.
Eqn. (3.3), however, is only applicable when particle size distribution is small and hard
phase volume fraction is smaller than 30% as explained in the work by (Sridhar and
Fleck 2000) for Al+SiC powder mixture. The percolation of hard phase particles was not
considered.
In this work, the compaction behavior of Al6061 and SiC powder mixtures in the
semi-solid state was investigated. Al6061 with various SiC volume fractions (0%-60%)
were compacted at temperatures involving Al6061 solid-phase (550°C), semi-solid range
(550°C-650°C), and complete liquid-phase (660°C). The effects of SiC volume fraction

38
and Al6061 liquid fraction on the densification behavior of the powder mixture were
experimentally investigated.
3.2 Experimental procedure
Al6061 powder (Valimet, Inc.) and SiC particles (AEE Inc.) were used to study
the compaction of powder mixture in the semi-solid state. The composition of Al6061
particle is listed in Table 3.1, and the size of the Al6061 and SiC particles are
summarized in Table 3.2. Al6061 and SiC particles were mixed by SPEX 8000M
mixer/miller for one hour at 1200 rpm.
Table 3.1: Chemical composition of Al6061 (Valimet, Inc.)
Element Cr Cu Fe Mg Mn Si Ti Zn Al
Amount (%) 0.09 0.28 0.27 1.03 0.03 0.52 0.01 0.06 Bal.
Table 3.2: Powder size and distribution of Al6061 and SiC powders
Powder type Powder Size
(µm)
Size Distribution (µm)
d90 d50 d10
Al6061 5-23 22.97 13.82 5.67
SiC 10

39
The experimental setup for the SPP is shown in Fig. 3.1. The die was fabricated
from H13 tool steel and was heat treated to hardness of HRC 50. Boron nitride
(Momentive Performance Materials-Quartz, Inc.) was sprayed on the wall to lubricate the
die and prevent possible reaction between the aluminum and the die material at elevated
temperatures. The powders were heated to target temperatures ranging from 550°C to
670°C in a tubular furnace (Applied Test System Inc). The liquid fractions of Al6061 (fL)
at different temperatures are shown in Fig. 3.2. The data were obtained from
ThermoCalc and verified with experimental results of differential scanning calorimetry
analysis conducted by Kim and Kang et al. (2007). The temperature profiles for the
experiments at 600°C settings are shown in Fig. 3.3, and other temperature profiles are
alike. Pressure was applied after the powders achieved the target temperature using
materials testing system (TestResources Inc, 800LE). The detailed experimental settings
are listed in Table 3.3.

40
Fig. 3.1: Experimental setup for semi-solid powder processing
Fig. 3.2: Liquid fraction of Al6061 (fL) at different temperature
0
0.1
0.2
0.3
0.4
0.5
0.6
0.7
0.8
0.9
1
550 570 590 610 630 650
Liq
uid
fra
cti
on
(f L
)
Temperature (°C)

41
Fig. 3.3: Heating profile used in the experiments at 600°C
Table 3.3: Experimental settings
Experiment
number
Temperature
(°C)
Liquid fraction in
Al6061 (%) (2007)
SiC vol.
fraction (%)
Overall liquid
fraction (%)
Compaction
pressure (MPa)
1 550 0.00 0 0.00 150
2 580 3.88 0 3.88 150
3 600 7.30 0 7.30 150
4 620 12.40 0 12.40 75
5 630 17.85 0 17.85 75
6 638 26.22 0 26.22 35
7 550 0.00 10 0 150
8 580 3.88 10 3.49 150
9 600 7.30 10 6.57 150
10 620 12.40 10 11.16 100
11 630 17.85 10 16.07 100
12 638 26.22 10 23.60 50
13 645 41.80 10 37.62 35
14 550 0.00 20 0 150
15 580 3.88 20 3.10 150
16 600 7.30 20 5.84 150
17 620 12.40 20 9.92 150
0
100
200
300
400
500
600
700
800
0 10 20 30 40 50 60
Tem
pera
ture
(°C
)
Time (mins)
Material temperature
Furnace temperature

42
Table 3.3: Experimental settings (continued)
Experiment
number
Temperature
(°C)
Liquid fraction in
Al6061 (%) (2007)
SiC vol.
fraction (%)
Overall liquid
fraction (%)
Compaction
pressure (MPa)
18 630 17.85 20 14.28 150
19 638 26.22 20 21.00 100
20 550 0.00 40 0 150
21 580 3.88 40 2.32 150
22 620 12.40 40 7.44 150
23 638 26.22 40 15.73 150
24 550 0.00 50 0 150
25 580 3.88 50 1.94 150
26 620 12.40 50 6.20 150
27 630 17.85 50 8.93 150
28 638 26.22 50 13.11 150
29 645 41.80 50 20.90 150
30 648 56.30 50 28.15 150
31 651 73.50 50 36.75 150
32 660 100 50 50.00 150
33 550 0.00 60 0 150
34 580 3.88 60 1.55 150
35 620 12.40 60 4.96 150
36 638 26.22 60 10.48 150
The density of the samples was calculated from measured mass and volume. The
samples were weighed on a precision balance (Sartorius GD503, accuracy 0.0001g). The
volume of the samples was calculated by measuring the diameter and height with a
micrometer. Four measurements were taken at different locations of the sample, and the
average value was used. Archimedes’s method was not used because of the existence of
large amount of open pores observed at lower densities.

43
3.3 Results
The initial density of the powder mixture was first examined. Compaction curves
of the powder mixture with different Al6061 liquid fraction and SiC volume fraction was
discussed. The reinforcement factor KR was obtained for different SiC volume fractions
with different Al6061 liquid fraction. Liquid factor KL was proposed and investigated for
the compaction of powder mixtures at different liquid fractions.
3.3.1 Initial density of the powder mixture
The initial density of the powder mixture is shown in Fig. 3.4. The initial density
of the powder mixture is important for the calculation of KR and was estimated through
the compaction curves and the density of the final parts. The results show that the initial
density of the powder mixture decreased as the SiC volume fraction increased. A linear
relation can be used to describe the initial relative density of powder mixture with
different SiC volume fractions:
(3.5)
where fsic is the volume fraction of SiC powder as calculated by Eqn. (3.4).
when fSiC=0.

44
Fig. 3.4: Initial density of the powder mixture with different SiC volume fraction
3.3.2 Compaction curves
The compaction curves for the Al6061-SiC with different SiC volume fraction
and temperature are shown in Fig. 3.5. Apparently, higher pressure was required for the
compaction of powder mixture with lower temperature and higher SiC volume fraction.
When the volume fraction of SiC increased, the compaction pressure increased
significantly because of the percolation of SiC particles (Fig. 3.5(b)).
0.3
0.35
0.4
0.45
0.5
0.55
0.6
0 0.1 0.2 0.3 0.4 0.5 0.6
Init
ial
rela
tiv
e d
en
sit
y D
0
SiC volume fraction fSiC

45
(a)
(b)
Fig. 3.5: Compaction curves for (a) Al6061-10 vol% SiC at different liquid fraction
and (b) Al6061-SiC at fL=0.261 with different SiC volume fraction
0
20
40
60
80
100
120
140
160
0.5 0.6 0.7 0.8 0.9 1
Pre
ssu
re (
MP
a)
Relative density D
Al6061-10%SiC, fL=0
Al6061-10%SiC, fL=0.0288
Al6061-10%SiC, fL=0.124
Al6061-10%SiC, fL=0.261
Al6061-10%SiC, fL=0.418°C
0
20
40
60
80
100
120
140
160
0.3 0.5 0.7 0.9
Pre
ssu
re (
MP
a)
Relative density D
Al6061, fL=0.261
Al6061-10%SiC, fL=0.261
Al6061-20%SiC, fL=0.261
Al6061-40%SiC, fL=0.261
Al6061-50%SiC, fL=0.261
Al6061-60%SiC, fL=0.261

46
3.3.3 Reinforcement factor KR
The effect of SiC volume fraction and liquid fraction was investigated by
analyzing the evolution of KR computed by Eqn. (3.1) from the experiments. As shown
in Fig. 3.6(a), within the region of fL <10% or fL >10%, KR values were similar when SiC
fraction is fixed and smaller than 30%. The KR values for fL>10% were higher than those
for fL<10%. This is possibly because the connectivity of liquid-phase in the Al6061
particles changed as the liquid fraction increased. When the liquid fraction in Al6061 is
low (<10%), the liquid-phase is enclosed in the Al6061 particles. At higher liquid
fraction (>10%), the liquid-phase interconnected and may flow freely within the powder
compact (Wu and Kim 2011b).
(a)
0
0.5
1
1.5
2
2.5
3
3.5
4
0.2 0.25 0.3 0.35 0.4
KR
Macroscopic strain (εzz)
10%SiC fL=0 20%SiC fL=0
10%SiC fL=0.0288 20%SiC fL=0.0288
10%SiC fL=0.0731 20%SiC fL=0.0731
10%SiC fL=0.124 20%SiC fL=0.124
10%SiC fL=0.178 20%SiC fL=0.178
10%SiC fL=0.261 20%SiC fL=0.261
20%SiC, fL>0.1
10%SiC, fL>0.1
20%SiC, fL<0.1 10%SiC, fL<0.1

47
(b)
Fig. 3.6: KR values with different Al6061 liquid fraction with (a) <30%SiC and
(b)>30%SiC
When the SiC fraction is higher than 30%, the starting KR value was determined
by the liquid fraction, i.e., the higher the liquid content the higher the initial KR (Fig.
3.6(b)). At low liquid fraction (fL<10%), the KR values increased as the powder mixture
underwent compaction. As the liquid fraction increased, the KR values showed more
fluctuation with less increasing behavior. The fluctuation of the KR for high liquid-phase
content (fL=0.261) related to liquid-phase squeeze out phenomenon observed by (Wu and
Kim 2011b).
The effect of SiC volume fraction on KR values can also be observed from Fig. 3.6.
Higher SiC volume typically resulted in higher KR values (Fig. 3.6(a) and Fig. 3.6(b) at
1
2
3
4
5
6
7
0.2 0.25 0.3 0.35 0.4
KR
Macroscopic strain (εzz)
40%SiC fL=0 50%SiC fL=0 60%SiC fL=0
40%SiC fL=0.0288 50%SiC fL=0.0288 60%SiC fL=0.0288
40%SiC fL=0.124 50%SiC fL=0.124 60%SiC fL=0.124
40%SiC fL=0.261 50%SiC fL=0.261
fL=0.261, fSiC>0.3
fL=0.124, fSiC>0.3
fL=0-0.03, fSiC>0.3

48
higher strain). Distinct KR curves were observed for SiC fraction below and above 30%
(compare Fig. 3.6(a) and Fig. 3.6(b)). For powder mixture with low SiC content, the
reinforcing particles were isolated by the Al6061 powders, and therefore, the deformation
of Al6061 particles dominated the compaction behavior (Storåkers, Fleck et al. 1999).
As the SiC volume fraction is increased above 30%, the strengthening effect from the SiC
particles became more significant with increasing strain. As the densification of the
powder mixture progresses, the SiC particles started to interact and the percolation of SiC
particles is increased, which significantly increases the compaction.
3.3.4 Liquid factor KL
The normalized compaction curves with 10vol.% and 60vol.%SiC at different
liquid fractions are shown in Fig. 3.7. The curves were normalized by the compaction
pressure at relative density of 0.95 and 0.68 for 10vol.% and 60vol.% SiC volume
fraction, respectively. The compaction curves collapse into a single curve for all Al6061
liquid fractions. This indicated that when the SiC volume fraction was the same, the
compaction behaviors of the powder mixture with various Al6061 liquid fractions were
similar.

49
(a)
(b)
Fig. 3.7: Compaction curves for (a) Al6061-10 vol% SiC at different temperature
and (b) Al6061-SiC at 638°C with different SiC volume fraction
A factor KL can be defined as the ratio of the compaction pressure for the two
powder mixtures containing the same amount of SiC subjected to the same strain history
but with different Al6061 liquid fraction, fL and fL0 (at T and T0).
0
0.5
1
1.5
2
2.5
3
3.5
0.5 0.6 0.7 0.8 0.9 1
P/P
D=
0.9
5
Relative density
Al6061-10%SiC, fL=0
Al6061-10%SiC, fL=0.0288
Al6061-10%SiC, fL=0.124
Al6061-10%SiC, fL=0.261
Al6061-10%SiC, fL=0.418°C
0
0.5
1
1.5
2
2.5
0.3 0.4 0.5 0.6 0.7 0.8
P/P
D=
0.6
8
Relative density
Al6061-60SiC, fL=0
Al6061-60vol% SiC, fL=0.0288
Al6061-60vol% SiC, fL=0.261
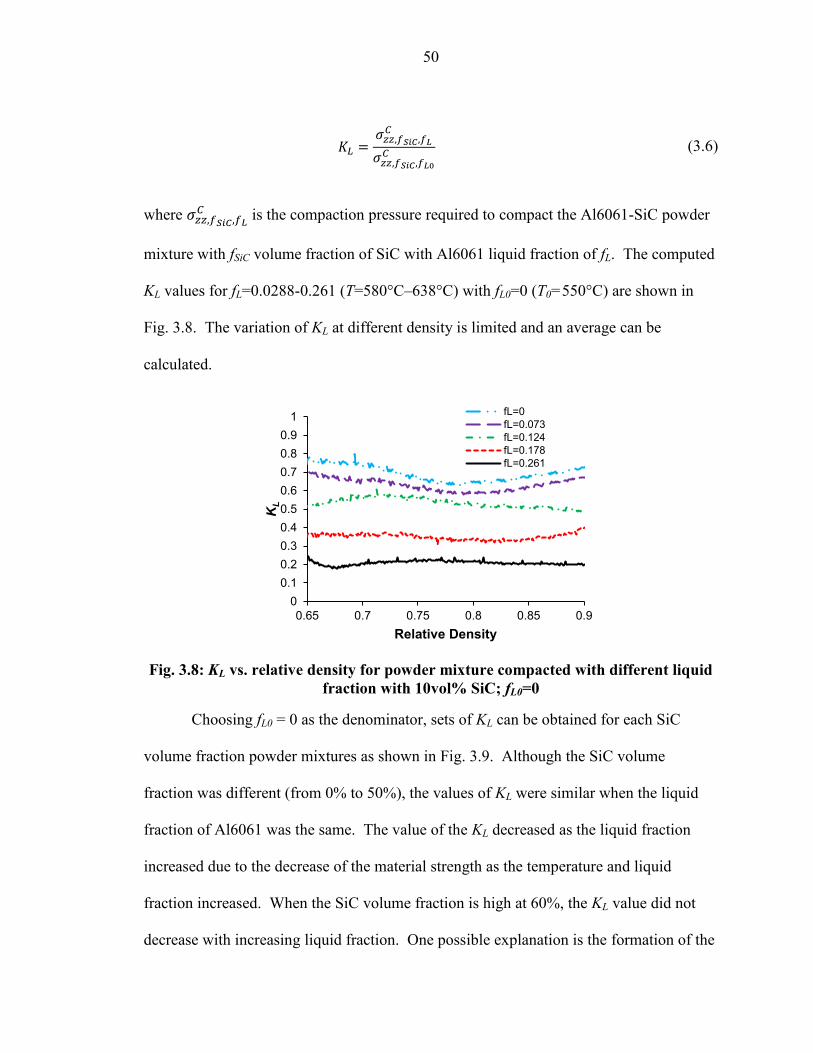
50
(3.6)
where
is the compaction pressure required to compact the Al6061-SiC powder
mixture with fSiC volume fraction of SiC with Al6061 liquid fraction of fL. The computed
KL values for fL=0.0288-0.261 (T=580°C–638°C) with fL0=0 (T0=550°C) are shown in
Fig. 3.8. The variation of KL at different density is limited and an average can be
calculated.
Fig. 3.8: KL vs. relative density for powder mixture compacted with different liquid
fraction with 10vol% SiC; fL0=0
Choosing fL0 = 0 as the denominator, sets of KL can be obtained for each SiC
volume fraction powder mixtures as shown in Fig. 3.9. Although the SiC volume
fraction was different (from 0% to 50%), the values of KL were similar when the liquid
fraction of Al6061 was the same. The value of the KL decreased as the liquid fraction
increased due to the decrease of the material strength as the temperature and liquid
fraction increased. When the SiC volume fraction is high at 60%, the KL value did not
decrease with increasing liquid fraction. One possible explanation is the formation of the
0
0.1
0.2
0.3
0.4
0.5
0.6
0.7
0.8
0.9
1
0.65 0.7 0.75 0.8 0.85 0.9
KL
Relative Density
fL=0
fL=0.073
fL=0.124
fL=0.178
fL=0.261

51
skeleton structure by the SiC particles, which provided significant resistance during the
compaction. Exponential expression was used to fit the experimental data using Eqn.
(3.7) to calculate KL:
( ) (3.7)
Fig. 3.9: KL values at different Al6061 liquid fraction for various SiC volume
fraction
3.3.5 Compaction of the powder mixture at high liquid fraction region
The relative density of the Al6061-50vol.%SiC composites compacted with
different Al6061 liquid fraction is shown in Fig. 3.10. The compaction pressures for all
the experiments were 150 MPa. When the liquid fraction in Al6061 was below 50%, the
final relative density of the composites increased as the liquid fraction of Al6061
increased. The addition of liquid significantly assisted the densification of the powder
0
0.2
0.4
0.6
0.8
1
0 0.1 0.2 0.3 0.4 0.5
KL
Liquid fraction of Al6061
Al6061-10% SiC
Al6061-20% SiC
Al6061-40% SiC
Al6061-50% SiC
Al6061-60% SiC

52
mixture, and near full density can be obtained. However, lower densities were obtained
when the liquid fraction of Al6061 was larger than 50%. A large amount of liquid was
squeezed out during the compaction.
Fig. 3.10: Relative density of the Al6061-50vol.%SiC composite and liquid squeezing
out amount during compaction. Compaction pressure was 150 MPa for all
compactions.
Fabrication of high volume fraction SiC reinforced metal composites by
compacting powders in the semi-solid state has advantages compared with casting,
infiltration and powder metallurgy routes. High composite density can be obtained with
relative low pressure at relative low temperature by compacting powder mixture in the
semi-solid state. Pressureless infiltration was restricted by a limited infiltration distance,
and relative high porosity was obtained (e.g. 7% for Al-60SiC (Candan, Ahlatci et al.
2001)). High density can be obtained by squeeze casting process (to 99% for Al-(50-
60)SiC (Lee, Jeon et al. 2000; Lee and Hong 2003); however, multistep processing
0
0.1
0.2
0.3
0.4
0.5
0.2
0.3
0.4
0.5
0.6
0.7
0.8
0.9
1
0 0.2 0.4 0.6 0.8 1
Sq
ueezed
ou
t L
iqu
id (
g)
Fin
al
Rela
tiv
e D
en
sit
y
Liquid Fraction of Al6061
Final Density
Liquid Squeeze Out

53
(preform preparation and infiltration) and high temperature were required. For hot
pressing and sintering process, long high temperature holding time and ceramic particle
percolation will result in relative high material porosity and manufacturing cost (Watari
1997; Lin 1999).
3.4 Conclusion
The compaction behavior of Al6061-SiC powder mixture with 0-60vol.%
reinforcement involving Al6061 liquid-phase was investigated. The temperature ranged
from 550°C to 660°C where the liquid fraction of Al6061 ranged from 0 to 100%. The
effects of the Al6061 liquid fraction and SiC volume fraction on the compaction behavior
were investigated. The reinforcement factor KR was significantly affected by the Al6061
liquid fraction and the SiC volume fraction. When the SiC volume fraction was low
(<30%), the reinforcement factor KR was similar across all liquid fraction range, while KR
was higher when fL was greater than 10%. When the SiC volume fraction is high (>30%),
the Al6061 liquid fraction determined the starting value of KR. The liquid factor KL
decreased as the liquid fraction of Al6061 increased up to 30%. The variation of KL for
different SiC volume fraction at the same liquid content was small, and therefore, the KL
can be expressed with a simple equation only function of on the liquid fraction of Al6061.

54
CHAPTER 4 FABRICATION OF AL6061 COMPOSITE WITH HIGH
SIC PARTICLE LOADING BY SEMI-SOLID POWDER
PROCESSING
4.1 Introduction
SPP combines the advantages of powder metallurgy and semi-solid forming
(Spencer, Mehrabian et al. 1972; Backman 1977; Kumar, Martin et al. 1993; Lee 1997;
Steinhoff, Weidig et al. 2004; Kim, Koc et al. 2007; Kim, Ni et al. 2007). In contrast to
traditional bulk semi-solid forming, the process enables the mixing of various powders
for improved properties and eliminates post-processing steps required for powder
metallurgy routes. A summary of various processing routes of SPP investigated by other
researchers is shown in Fig. 4.1 (Young and Clyne 1986a; Young and Clyne 1986b; El
Wakil 1992; Zu and Luo 2001; Hamilton, Zhu et al. 2003; Chen, Yang et al. 2004; Chen,
Yang et al. 2005b; Chen, Yang et al. 2005a; Luo, Cheng et al. 2005; Luo, Cheng et al.
2006). In general, four basic steps are involved in SPP: powder preparation, powder
precompaction, heating and semi-solid forming. SPP has been applied to produce net-
shaped MMCs with low reinforcement loading (<30%). Previous work has demonstrated
the potential to produce composites with high efficiency, low cost and good
compositional control with promising microstructures (Yasue 2000; Wen 2001;
Wildgoose, Banks et al. 2006; Wu, Kim et al. 2010b).

55
Fig. 4.1: Various processing routes of semi-solid powder processing
Although it has been more than 20 years since the introduction of SPP, no in-
depth research has been conducted concerning high reinforcement loading conditions
above 45 vol.%. Metals reinforced with high reinforcement loading are very attractive
due to the modified properties such as high modulus and strength, low coefficient of
thermal expansion, and improved thermal conductivity (Ibrahim, Mohamed et al. 1991;
Fan 1998; Miserez, Muller et al. 2004). Methods including infiltration (Kouzeli, Weber
et al. 2001; Prater 2006; Zhang, Qu et al. 2008), casting (Qin, Chen et al. 1999; Jeong,
Seo et al. 2005; Pham, Yoon et al. 2007), and powder metallurgy (Cerit, Karamis et al.
2008) have been investigated to fabricate MMC reinforced with high ceramic loadings.
Several limitations were discussed as to the fabrication of high ceramic loading MMCs,
such as difficulty in compositional control in casting, sintering balance (Kawasaki 1997)
Powder
Cold Pressing
Semi-solid Forming
Preheating in Furnace
Degassing and Sealing
Net-Shape Parts
(Wakil, 1992)
(Yong et al., 1986;
Hamilton et al., 2003)
(Zu and Luo, 2002)
Hot Pressing
(Chen et al., 2005)
Degassing in Vacuum
Hot Canned Powder
Compact
Induction Coil Preheating

56
and ceramic powder percolation (Watari 1997; Lin 1999) in powder metallurgy, and
closed and half closed pore problems in infiltration casting (Corbin 1999; Pech-Canul
2002; Pech-Canul, Parras-Medecigo et al. 2002; Cho, Choi et al. 2004; Song, Park et al.
2007).
In this study, a matrix phase of Al6061 reinforced by silicon carbide (SiC)
particles was used to understand the synthesis of composites with reinforcement loadings
above 45 vol.% by SPP. Theoretical SiC loading limit of the SPP has been proposed and
discussed. In addition, effects of processing parameters, which include SiC loading,
applied pressure and matrix-reinforcement particle size, on microstructure and hardness
have been studied.
4.2 Experimental Procedures
The Al6061 powders and SiC particles were prepared by blending in a powder
mixer (SPEX 8000M) for eight minutes. The chemical composition of Al6061 powders
obtained from Valimet Inc. is shown in Table 4.1. The size and distribution of Al6061
and SiC particles (AEE Inc.) are summarized in Table 4.2. The experimental setup for
heating and compression is shown in Fig. 4.2. The die and powders were heated in the
furnace (Applied Test System Inc), while the load and movement of upper ram were
controlled and measured by the materials testing system (TestResources Inc, 800LE).
After weighing and pouring the blended powder mixture, the die set was placed in the
furnace. Once the material was heated to 640 °C, the upper ram moved down at a

57
designed velocity and compressed the semi-solid powder compact. Experimental
conditions are summarized in Table 4.3.
Table 4.1: Chemical composition of Al6061 (Valimet, Inc.)
Element Cr Cu Fe Mg Mn Si Ti Zn Al
Amount (%) 0.09 0.28 0.27 1.03 0.03 0.52 0.01 0.06 Bal.
Table 4.2: Powder size and distribution of Al6061 and SiC powders
Powder type Powder Size (µm) Size Distribution (µm)
d90 d50 d10
Al6061(L) 44 - 105 99.77 66.06 44.65
Al6061(S) 5-23 22.97 13.82 5.67
SiC(L) 65
SiC(S) 10

58
Fig. 4.2: Experiment setup for semi-solid powder forming
Table 4.3: Experiment settings
Parameter Settings
Forming Pressure (MPa) 50, 100
Pressure Holding Time (s) 30
SiC Loading (vol%) 45.8, 55.9, 66.3
Punch Velocity (mm/s) 0.065
Operating Temperature (°C) 640
Liquid Fraction of Al6061 0.3
Powder Size Listed in Table 4.2
Experiments were performed to understand the effects of matrix and
reinforcement particle size, reinforcement loading, and applied pressure on the
microstructure and mechanical properties (see Table 4.4). Runs No. 16–18 were

59
performed to test the compaction curve of Al6061-only and SiC-only particles at elevated
temperatures. The microstructures of the samples were observed with an optical
microscope (Zeiss, Axiovert 200M) and scanning electron microscope (JEOL JSM-
606LV). Hardnesses of samples were measured by LECO LM247AT Micro Hardness
Tester after appropriate polishing procedure. A Siemens D-500 X-ray diffraction system
was used to obtain the X-ray diffraction pattern of the powder and composite samples.
Table 4.4: Experiment array and results
Run
No.
SiC
vol%
SiC size
(µm)
Al6061
size (µm)
P
(MPa)
Hardness
(HV)
Density
(g/cm3)
Theoretical
Density (g/cm3)
Relative
Density
1 45.8 65 14 50 151 2.74 2.93 0.935
2 55.9 65 14 50 95 2.79 2.98 0.937
3 66.3 65 14 50 95 2.67 3.03 0.879
4 45.8 65 14 100 150 2.92 2.93 0.998
5 55.9 65 14 100 146 2.85 2.98 0.958
6 66.3 65 14 100 127 2.72 3.03 0.896
7 45.8 12.5 14 50 153 2.73 2.93 0.932
8 55.9 12.5 14 50 86 2.61 2.98 0.874
9 66.3 12.5 14 50 42 2.44 3.03 0.803
10 45.8 12.5 14 100 176 2.78 2.93 0.969
11 55.9 12.5 14 100 155 2.71 2.98 0.898
12 66.3 12.5 14 100 67 2.42 3.03 0.833
13 45.8 12.5 66 100 157 2.84 2.93 0.950
14 55.9 12.5 66 100 135 2.68 2.98 0.909
15 66.3 12.5 66 100 47 2.53 3.03 0.797
16 0 0 66 50 47 2.74 2.71
17 100 12.5
18 100 65

60
A separate experiment was performed to verify the actual temperature of the
powder inside the die assembly during the forming process. To reduce the overall
heating time, the heating curve as shown in Fig. 4.3 was used. The powder inside the die
reached target temperature of 640 °C after 60 minutes of heating, and all the experiments
were conducted 65 minutes after the start of heating.
Fig. 4.3: Heating curve used in the experiment
4.3 Results and Discussion
The compaction curves of SPP are analyzed to understand the synthesis
mechanism of Al6061-SiC composite and the SiC loading limit. Then, effects of
processing parameters on the composite microstructure, hardness and fracture surface are
discussed. In addition, presence of aluminum carbide (Al4C3) is checked with X-ray
diffraction analysis.
0
100
200
300
400
500
600
700
800
0 20 40 60
Tem
pera
ture
(˚C
)
Time (min)
Actual Powder Temperature
Furnace Set Point
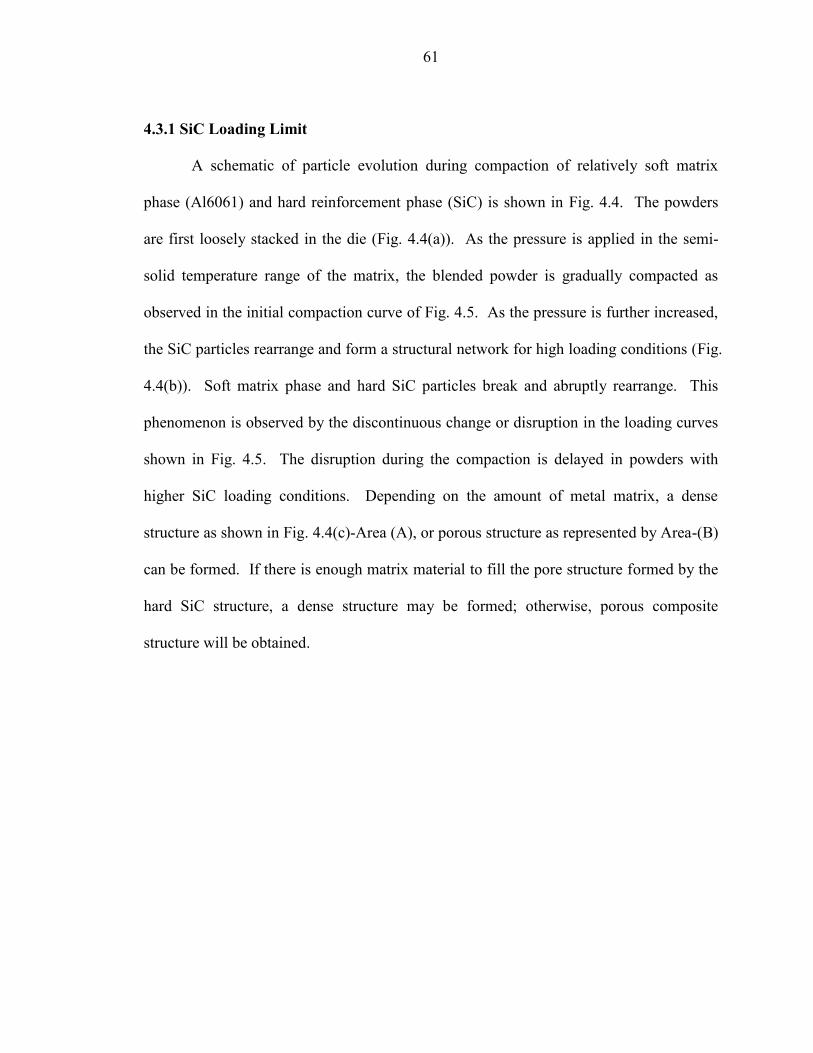
61
4.3.1 SiC Loading Limit
A schematic of particle evolution during compaction of relatively soft matrix
phase (Al6061) and hard reinforcement phase (SiC) is shown in Fig. 4.4. The powders
are first loosely stacked in the die (Fig. 4.4(a)). As the pressure is applied in the semi-
solid temperature range of the matrix, the blended powder is gradually compacted as
observed in the initial compaction curve of Fig. 4.5. As the pressure is further increased,
the SiC particles rearrange and form a structural network for high loading conditions (Fig.
4.4(b)). Soft matrix phase and hard SiC particles break and abruptly rearrange. This
phenomenon is observed by the discontinuous change or disruption in the loading curves
shown in Fig. 4.5. The disruption during the compaction is delayed in powders with
higher SiC loading conditions. Depending on the amount of metal matrix, a dense
structure as shown in Fig. 4.4(c)-Area (A), or porous structure as represented by Area-(B)
can be formed. If there is enough matrix material to fill the pore structure formed by the
hard SiC structure, a dense structure may be formed; otherwise, porous composite
structure will be obtained.
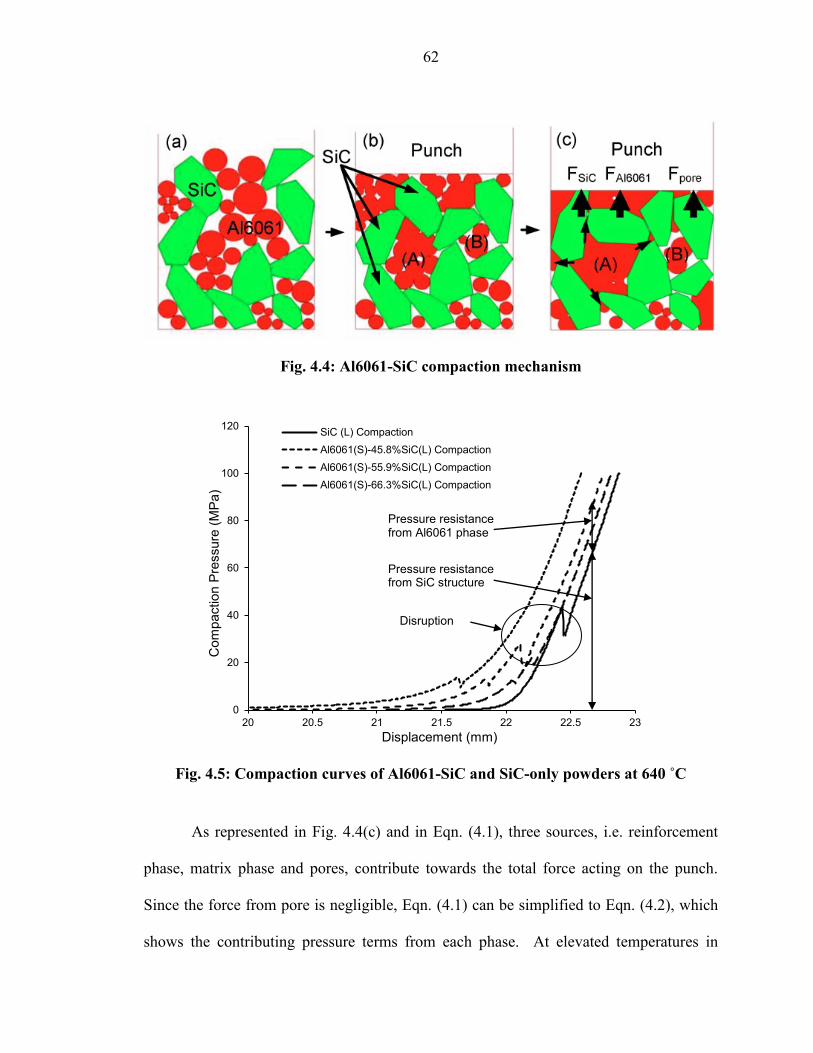
62
Fig. 4.4: Al6061-SiC compaction mechanism
Fig. 4.5: Compaction curves of Al6061-SiC and SiC-only powders at 640 ˚C
As represented in Fig. 4.4(c) and in Eqn. (4.1), three sources, i.e. reinforcement
phase, matrix phase and pores, contribute towards the total force acting on the punch.
Since the force from pore is negligible, Eqn. (4.1) can be simplified to Eqn. (4.2), which
shows the contributing pressure terms from each phase. At elevated temperatures in
0
20
40
60
80
100
120
20 20.5 21 21.5 22 22.5 23
Com
paction P
ressure
(M
Pa)
Displacement (mm)
SiC (L) Compaction
Al6061(S)-45.8%SiC(L) Compaction
Al6061(S)-55.9%SiC(L) Compaction
Al6061(S)-66.3%SiC(L) Compaction
Disruption
Pressure resistance from Al6061 phase
Pressure resistance from SiC structure

63
semi-solid regime, most of the load will be undertaken by the hard reinforcement phase
since the matrix phase is in the mushy state.
(4.1)
(4.2)
, and are the total compression force, total pressure and total area, respectively;
, and are the force undertaken by SiC phase, Al6061 phase and pores,
respectively; and are the pressure contribution from SiC phase and Al6061
phase, respectively. , and are the contact area between the punch and
each phase.
To understand the pressure contribution from each phase, a separate experiment
with SiC(L)-only compaction curve was compared with that of Al6061-SiC(L) in Fig. 4.5.
All the curves had the same SiC mass loading. Taking the Al6061-55.9% SiC(L) and
SiC-only compaction curves as an example, the SiC(L)-only compaction curve represents
the fractional amount of pressure applied by the hard SiC phase, while the difference
between the two curves is the pressure contribution from the soft matrix phase at a given
punch displacement. As the SiC loading increased, less loading support from Al6061
phase was observed during the compaction. This is observed by merging of the
compaction curves of higher SiC loaded powders to that of the SiC-only powder in Fig.
4.5. For a given total pressure, one can assume that the limit of SiC loading occurs when
there is no pressure contribution from the Al6061 phase. In other words, SiC-only
loading represents an ideal condition where there is no pressure contribution from the

64
matrix phase and the matrix phase is only filling the cavity created by the SiC structure.
Therefore, the maximum SiC loading volume applicable for the Al6061 composite can be
obtained from SiC-only curve in Fig. 4.5 by calculating the density at given displacement.
The resulting maximum loading curves for large and small SiC particles are shown in Fig.
4.6 and summarized in Table 4.5. It is interesting to note that one can achieve higher SiC
loading with larger SiC particle sizes for a given pressure. At 100 MPa, over 50 vol.%
loading of SiC can be achieved theoretically.
Fig. 4.6: Maximum SiC vol% loading versus compaction pressure for SiC particle
sizes of 10 and 65 m.
Table 4.5: Maximum SiC loading at selected pressure settings
Condition Maximum SiC loading
Pressure (MPa) SiC Size (µm) vol%
50
12.5 45
65 49
100
12.5 51
65 58
0.2
0.3
0.4
0.5
0.6
45 65 85 105
Maxim
um
SiC
loadin
g
Pressure (MPa)
SiC(S) maximum loading
SiC(L) maximum loading
50 MPa
100 MPa

65
4.3.2 Microstructure
The relative particle size of the matrix and reinforcement phases had significant
influence on the obtained microstructures. Microstructure images of composites with
loading conditions of 45.8 and 66.3 vol.% SiC are shown in Fig. 4.7. The composite with
45.8% SiC loading at higher pressure setting showed well-densified microstructures (Fig.
4.7(a), (b) and (c)), while pores were observed for samples fabricated with 66.3% SiC
loading (Fig. 4.7(d), (e) and (f)). A more uniform distribution of SiC was achieved when
larger SiC powder was used (Fig. 4.7(a) and (b)). When the Al6061 size is much larger
than the SiC particle, locally agglomerated Al6061 was observed (Fig. 4.7(c)). This can
be explained by the initial Al6061 and SiC particle distribution from the blending
procedure before compaction. As shown in Fig. 4.8(a), when the 10 µm SiC particles
were blended with similar size Al6061 particles (14 µm), the blending resulted in a
homogeneous mixture. Similarly, when smaller matrix phase particles (Al6061, 14 µm)
were blended with larger SiC particles (65 µm), a well-densified microstructure was
obtained. On the other hand, when 10 µm SiC particles were used, which was
substantially smaller than Al6061 particles, the SiC particles agglomerated and
surrounded the larger Al6061 powders (see Fig. 4.8(c)). With insufficient amount of
pressure, this resulted in large liquid Al6061 area (Fig. 4.7(c)) or microstructures with
poor bonding containing large pores (Fig. 4.7(f)). This also resulted in higher SiC
fractions in the rest of region like Area-(B) in Fig. 4.7(c) and caused the formation of
pores in these areas. Consequently, samples with lower relative density and inferior
structural integrity are likely to result from such conditions. This explains higher relative

66
density obtained for the samples with smaller Al6061 particles under the same pressure,
SiC size and reinforcement loading (see Table 4.4).
Fig. 4.7: Microstructure images of composites with 45.8 and 66.3 vol% SiC.
Experimental conditions are: (a) 100 MPa, Al6061(S)-45.8% SiC(L); (b) 100 MPa,
Al6061(S)-45.8% SiC(S); (c) 100 MPa, Al60061(L)- 45.8% SiC(S); (d) 50 MPa,
Al6061(S)-66.3% SiC(L); (e) 50 MPa, Al6061(S)- 66.3% SiC(S); and (f) 100 MPa,
Al6061(L)- 66.3% SiC(S). Note that (b) and (c) are optical images; (a), (d),(e) and (f)
are SEM images.
Fig. 4.8: Distribution of Al6061 and SiC (45.8%) powders after blending: (a)
Al6061(S) with SiC(S); (b) Al6061(S) with SiC(L); and (c) Al6061(L) with SiC(S)
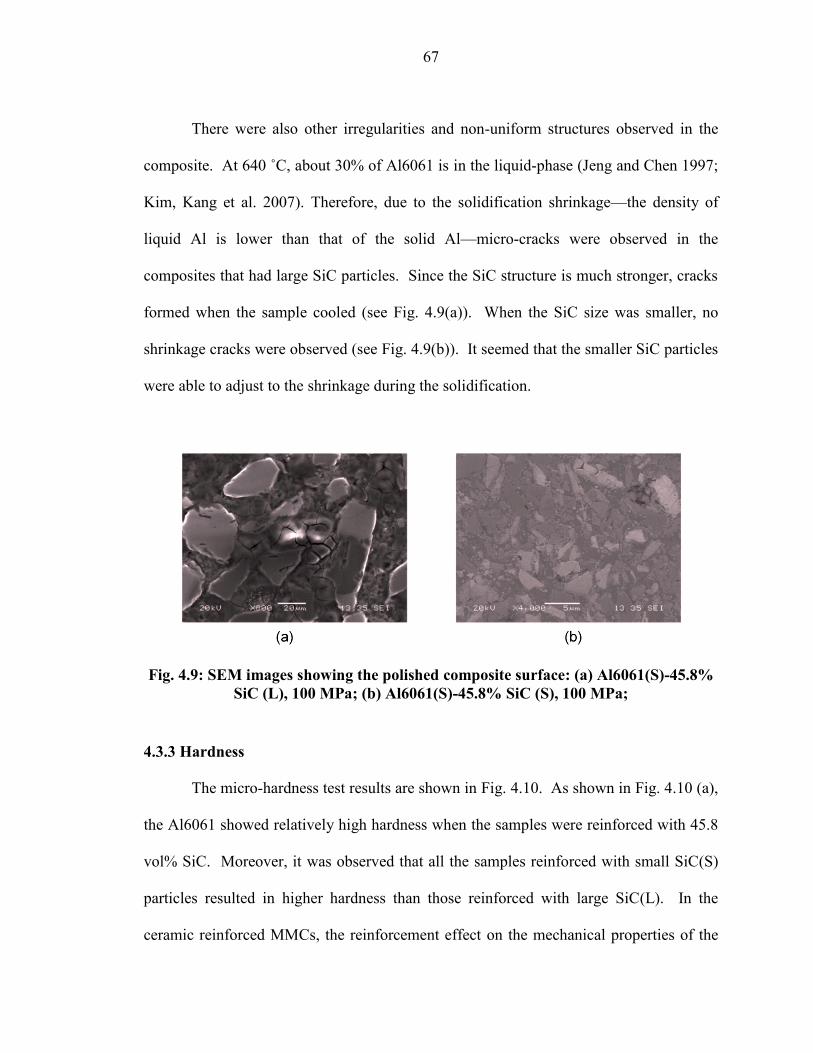
67
There were also other irregularities and non-uniform structures observed in the
composite. At 640 ˚C, about 30% of Al6061 is in the liquid-phase (Jeng and Chen 1997;
Kim, Kang et al. 2007). Therefore, due to the solidification shrinkage—the density of
liquid Al is lower than that of the solid Al—micro-cracks were observed in the
composites that had large SiC particles. Since the SiC structure is much stronger, cracks
formed when the sample cooled (see Fig. 4.9(a)). When the SiC size was smaller, no
shrinkage cracks were observed (see Fig. 4.9(b)). It seemed that the smaller SiC particles
were able to adjust to the shrinkage during the solidification.
Fig. 4.9: SEM images showing the polished composite surface: (a) Al6061(S)-45.8%
SiC (L), 100 MPa; (b) Al6061(S)-45.8% SiC (S), 100 MPa;
4.3.3 Hardness
The micro-hardness test results are shown in Fig. 4.10. As shown in Fig. 4.10 (a),
the Al6061 showed relatively high hardness when the samples were reinforced with 45.8
vol% SiC. Moreover, it was observed that all the samples reinforced with small SiC(S)
particles resulted in higher hardness than those reinforced with large SiC(L). In the
ceramic reinforced MMCs, the reinforcement effect on the mechanical properties of the

68
composite is influenced by the reinforcement phase geometry, the bonding strength
between the matrix and reinforcement phases, and the total contact area between the
phases (Ramakrishnan 1996; Chawla, Jones et al. 1998; Qin, Chen et al. 1999). When
SiC particle size is smaller, the contacting area between the ceramic and matrix phases is
much larger, which provides better strengthening effect. In addition, the small SiC
particles were able to penetrate into the Al6061 particle, creating fresh contact between
the Al6061 and SiC phase. Therefore, higher hardness was obtained for composites
reinforced with smaller SiC particles when compared with composites with larger SiC
particles having the same loading.

69
(a)
(b)
Fig. 4.10: Microhardness test results: (a) Hardness of sample with 45.8 vol.% SiC;
and (b) comparison of hardness at different process settings
In Fig. 4.10(b), increase in the hardness was observed when higher pressure was
applied. This is simply due to the higher relative density obtained with higher pressure.
Although the reinforcement loading increased, the hardness of the composite decreased.
Since 55.9 and 66.3% loadings were beyond the maximum loading limit of the composite
with small SiC(S) particles, decrease in the relative density, which indicated significant
pore formation, was observed. Because of the non-uniformly distributed SiC and Al6061
(see Fig. 4.7(c)), the samples fabricated with small SiC and large Al6061 powders have
lower hardness compared with those of small SiC and small Al6061. In addition, The
135
140
145
150
155
160
165
170
175
180
Al6061(S)SiC(L) 50
Mpa
Al6061(S)SiC(L)
100MPa
Al6061(S)SiC(S)50MPa
Al6061(S)SiC(S)
100MPa
Al6061(L)SiC(S)
100MPa
Hard
ness (
HV
)
Experiment Settings
0.8
0.82
0.84
0.86
0.88
0.9
0.92
0.94
0.96
0.98
1
0
20
40
60
80
100
120
140
160
180
200
45.8 50.8 55.8 60.8 65.8
Rela
tive D
ensity
Hard
ness (
HV
)
SiC vol%
Al6061(S) SiC(S) 50MPa
Al6061(S) SiC(S) 100MPa
Al6061(L) SiC(S) 100MPa
Al6061(S) SiC(S) 100MPa Relative Density
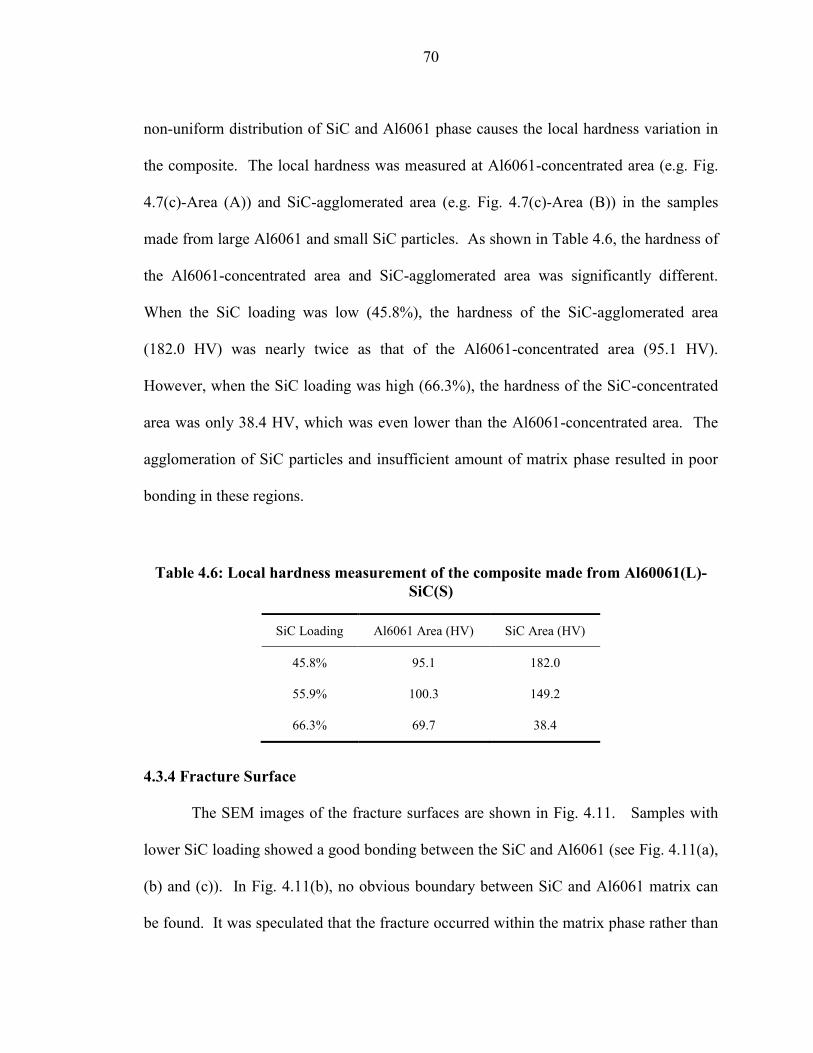
70
non-uniform distribution of SiC and Al6061 phase causes the local hardness variation in
the composite. The local hardness was measured at Al6061-concentrated area (e.g. Fig.
4.7(c)-Area (A)) and SiC-agglomerated area (e.g. Fig. 4.7(c)-Area (B)) in the samples
made from large Al6061 and small SiC particles. As shown in Table 4.6, the hardness of
the Al6061-concentrated area and SiC-agglomerated area was significantly different.
When the SiC loading was low (45.8%), the hardness of the SiC-agglomerated area
(182.0 HV) was nearly twice as that of the Al6061-concentrated area (95.1 HV).
However, when the SiC loading was high (66.3%), the hardness of the SiC-concentrated
area was only 38.4 HV, which was even lower than the Al6061-concentrated area. The
agglomeration of SiC particles and insufficient amount of matrix phase resulted in poor
bonding in these regions.
Table 4.6: Local hardness measurement of the composite made from Al60061(L)-
SiC(S)
SiC Loading Al6061 Area (HV) SiC Area (HV)
45.8% 95.1 182.0
55.9% 100.3 149.2
66.3% 69.7 38.4
4.3.4 Fracture Surface
The SEM images of the fracture surfaces are shown in Fig. 4.11. Samples with
lower SiC loading showed a good bonding between the SiC and Al6061 (see Fig. 4.11(a),
(b) and (c)). In Fig. 4.11(b), no obvious boundary between SiC and Al6061 matrix can
be found. It was speculated that the fracture occurred within the matrix phase rather than

71
the interface. However, when the SiC loading increased, there was not enough Al6061
phase to completely fill the porous network formed by the SiC phase (see Fig. 4.11(e)
and (f)). Therefore, the bonding between SiC and Al6061 became weaker as the SiC
increased beyond the maximum loading limit. In addition, the fracture surface of the
composite made from small SiC and large Al6061 particles exhibited distinct
characteristic due to the non-uniform distribution of the SiC phase. As shown in Fig.
4.11(c) and (f), the Al6061 areas showed ductile fracture surface, while the SiC-
agglomerated areas had less ductility.
Fig. 4.11: SEM images of fracture surfaces of Al6061-SiC composite. Experiment
conditions are: (a) 100 MPa, Al6061(S)-45.8% SiC(L); (b) 100 MPa, Al6061(S)-45.8%
SiC(S); (c) 100 MPa, Al60061 (L)-45.8% SiC(S); (d) 50 MPa, Al6061(S)- 66.3%
SiC(L); (e) 50 MPa, Al6061(S)- 66.3% SiC(S); and (f) 100 MPa, Al6061(L)- 66.3%
SiC(S);

72
4.3.5 Formation of Al4C3
SiC particles may react with liquid aluminum at high temperatures and form
Al4C3 via the reaction pathway in Eqn. (4.3) (Lee 1997; Fan 1998; Tham, Gupta et al.
2001). Due to the brittleness of Al4C3, its formation can significantly affect the
interfacial bonding strength between the Al6061 matrix and SiC reinforcement.
Therefore, the formation of aluminum carbide should be avoided during the fabrication
process. X-ray diffraction (XRD) measurements were conducted on blended Al6061 and
SiC powders (Fig. 4.12(a)) and fabricated Al6061-SiC composites (Fig. 4.12(b)). As
shown in Fig. 4.12(b), only peaks induced by Al and SiC were found, which corresponds
to the XRD pattern obtained from the blended Al6061-SiC powders (Fig. 4.12(a)). No
obvious peaks for Si and Al4C3 (noted by the arrows in Fig. 4.12 (b)) were observed.
One of the reasons is that the temperature applied during the SPP is relatively low
compared with casting, which requires complete melting of the matrix phase. If Al4C3 is
at all present, the amount is smaller than what can be measured by conventional XRD
method (approximately 5 vol.%).
4Al(l)+3SiC(s)-- Al4C3(s)+3Si(s) (4.3)
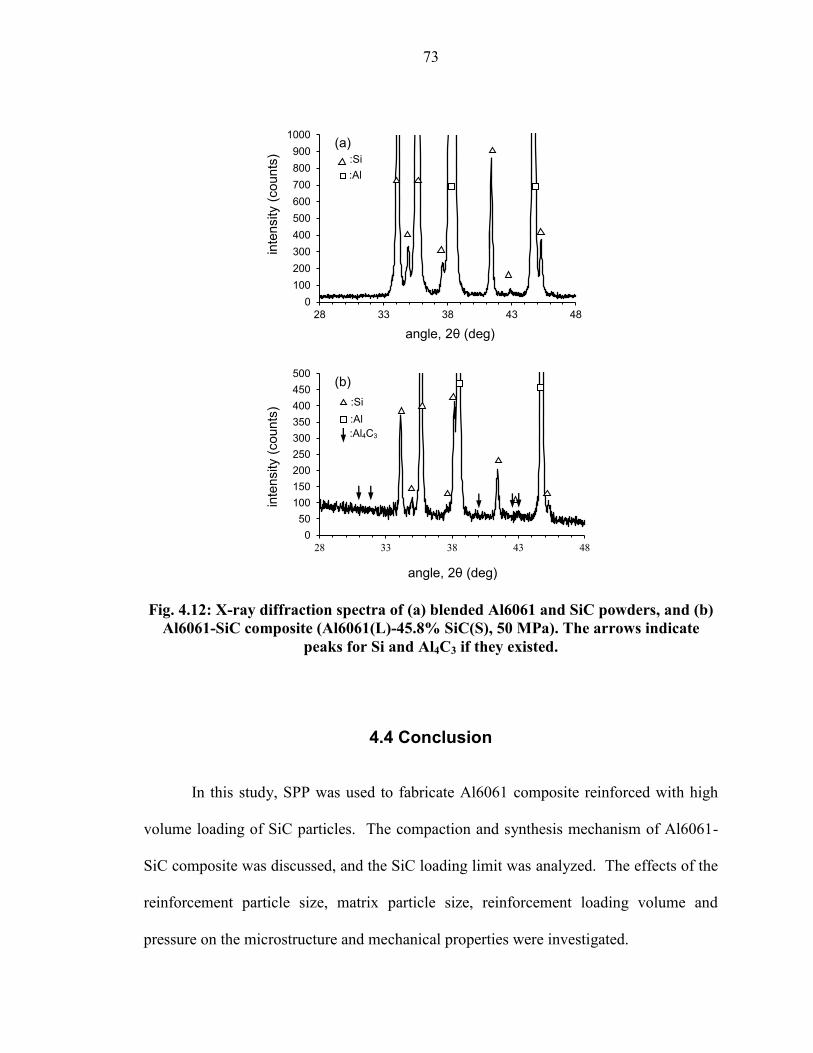
73
Fig. 4.12: X-ray diffraction spectra of (a) blended Al6061 and SiC powders, and (b)
Al6061-SiC composite (Al6061(L)-45.8% SiC(S), 50 MPa). The arrows indicate
peaks for Si and Al4C3 if they existed.
4.4 Conclusion
In this study, SPP was used to fabricate Al6061 composite reinforced with high
volume loading of SiC particles. The compaction and synthesis mechanism of Al6061-
SiC composite was discussed, and the SiC loading limit was analyzed. The effects of the
reinforcement particle size, matrix particle size, reinforcement loading volume and
pressure on the microstructure and mechanical properties were investigated.
0
100
200
300
400
500
600
700
800
900
1000
28 33 38 43 48
inte
nsity
(counts
)
angle, 2θ (deg)
(a)
0
50
100
150
200
250
300
350
400
450
500
28 33 38 43 48
inte
nsity (
counts
)
angle, 2θ (deg)
(b)
:Si
C :Al
:Al
:Si
C
:Al4C3
74
SPP of Al6061 composite for high loading SiC conditions had the following
characteristics. Since the compaction occurs in the semi-solid temperatures of the matrix
phase, the compaction pressure was mainly undertaken by the SiC skeleton structure.
Therefore, disruption of the powder structure was observed during the compaction. As
the compression progressed, the partially melted Al6061 phase filled the pores created by
the SiC structure. Moreover, a methodology was introduced to estimate the maximum
loading limit of SiC particles in Al6061 composite from SiC-only compaction tests.
Higher SiC loading limit was obtained for larger SiC particles and higher compaction
pressure. The relative size of the initial Al6061 and SiC particles had significant effect
on the microstructure, hardness and fracture surface of the composite. It required higher
pressure to compact the composite containing smaller SiC particles, which reduce the SiC
loading limit for a given pressure. In addition, non-uniform microstructure was obtained
when the reinforcement particles were smaller than those of the matrix phase. This
resulted in local variations in hardness and fracture surfaces. On the other hand, dense
composite with smaller SiC particles resulted in higher hardness and uniform
microstructures free of micro-cracks.
In this study, we have laid out a theoretical platform that can aid further
understanding of SPP for high reinforcement loading conditions. Moreover, the
composite structures obtained near the maximum loading limit demonstrated the
feasibility of using SPP for the fabrication of high ceramic loading composites. As
processing in the semi-solid regime combines the advantages of powder metallurgy and

75
forming, the process may provide new fabrication routes for near net-shape samples with
locally tailored microstructures.
76
CHAPTER 5 MECHANICAL ALLOYING OF CARBON NANOTUBE
AND AL6061 POWDER FOR METAL-CNT COMPOSITE
5.1 Nomenclature
a weight fraction of the agglomerated CNTs
Ab average nominal area of a single particle m2
Ab,t total nominal area of all particles m2
Ae net area embedded during mechanical alloying m2
Af area exposed due to fracturing m2
Aw area embedded due to welding m2
As exposed surface area of all the particles m2
d weight fraction of the dispersed CNTs
fe weight fraction of the total embedded CNTs
fe,d weight fraction of the embedded CNTs that are dispersed
fs weight fraction of the total surface CNTs
fs,d weight fraction of the surface CNTs that are dispersed
g normal distribution function of the CNT length
G cumulative distribution function of the CNT length
hc thickness of powder coating the milling balls m
Ib ball impaction frequency 1/s
k factor = ΔAf / ΔAw
l CNT length µm

77
lall average overall CNT length µm
le fraction of effective impact during ball milling
m average number of impacts required for a particle to be struck
once
nf number of particles fractured in a short time period, Δt
nt total number of particles during mechanical alloying
nw number of particles welded in a short time period, Δt
nΔt = nf + nw
Rb radius of the milling ball m
t time s
v ball impacting velocity m/s
Wa weight of agglomerated CNTs g
Wd weight of dispersed CNTs g
We weight of embedded CNTs g
We,d weight of embedded CNTs that are dispersed g
Ws weight of surface CNTs g
Ws,d weight of surface CNTs that are dispersed g
Wt weight of all CNTs g
a factor = As /( As+Ae)
change rate of parameter
γ a factor = Ab,t / As
Δ the change of parameter
Γ the frequency of effective impact 1/s

78
μ the mean of the normal distribution of CNT length µm
τ average time required to effectively impact all the particles s
ρb the density of the milling ball kg/m3
ρp the density of the powder kg/m3
σ2
the variance of the normal distribution of CNT length
( ) overall CNT length distribution at time t
( ) surface CNT length distribution at time t
( ) surface dispersed CNT length distribution at time t
( ) embedded CNT length distribution at time t
5.2 Introduction
The extraordinary properties of CNTs make them a potentially promising
reinforcement material for polymers and metals (Zhong, Cong et al. 2003). In the
fabrication of metal-CNT composites, dispersing the CNTs in the metallic matrix phase
has been one of the critical challenges (Noguchi, Magario et al. 2004; He, Zhao et al.
2007). One of the most widely used approaches has been mechanical alloying, which has
been shown to effectively disperse the CNTs in various metal-CNT composites (Liao,
Tan et al. ; Esawi and Morsi 2007; Morsi and Esawi 2007; Poirier, Gauvin et al. 2009;
Wang, Choi et al. 2009). The resultant composites were reinforced by both the CNTs and
the refinement of grains (Bakshi, Lahiri et al. 2010). However, the high energy input
during the mechanical alloying process often breaks the CNTs and introduces defects in
them (Bakshi, Lahiri et al. 2010). Sometimes the defect sites facilitate reactions between

79
the CNTs and the metallic phase, enhancing their bonding characteristics (Perez-
Bustamante, Gomez-Esparz et al. 2009; Poirier, Gauvin et al. 2009). On the other hand,
shortening CNTs by breakage may diminish the effectiveness of adding CNTs as a
reinforcement phase. Studies on CNT breakage during mechanical alloying reported
findings ranging from minimal breakage (Deng, Zhang et al. 2007; Esawi and Morsi
2007) to severe damage (Zhou, Zhang et al. 2007; Poirier, Gauvin et al. 2009). Due to
the challenges in extracting and measuring the nanoscale dimensions of CNTs, no
quantitative study on CNT breakage during mechanical alloying has been reported.
In this study, Al6061 powder and 1.0 wt.% CNTs were mechanically alloyed to
analyze the CNT breakage. The CNTs on the particle surface were collected, and the
CNT length and distribution were measured for different mechanical alloying durations.
Because of the difficulty in collecting the CNTs embedded inside the particles, a
mathematical model was developed to predict the overall CNT length and distribution
during the mechanical alloying process.
5.3 Experimental Procedure
Al6061 particles (Valimet Inc.) and multi-walled CNTs from NanoLab® were
used. The Al6061 particle and CNT information are summarized in Table 5.1. Two 12.7
mm diameter zirconia balls and the mixture of 2.97 g of Al6061 powder and 0.03 g of
CNTs were placed in a 60 ml zirconia jar for mechanical alloying. The powders were
mechanically alloyed in a high-energy SPEX 8000M mixer at a rotational speed of 1200

80
rpm for 3, 10, 20, 30, 40 and 60 mins, respectively. After the powders were mechanically
alloyed, 40 ml of alcohol (99.9%) was introduced, and the powder-alcohol mixture was
ultrasonicated for one hour. The CNTs detached from the Al6061 particle surface and
floated in the alcohol solution. Several drops of the CNT-alcohol solution were separated
and diluted until the CNTs dispersed under ultrasonic vibration. One or two droplets of
the diluted alcohol-CNT solution were placed on an aluminum foil and dried naturally.
The CNTs dispersed uniformly on the aluminum foil, and the morphology of the CNTs
was analyzed. For the synthesis of Al6061-CNT composite, a semi-solid powder
processing technique was employed. The composite was formed at 640ºC at which
temperature the liquid fraction of Al6061 was about 30% (Kim, Kang et al. 2007). A
pressure of 50 MPa was held for 30 minutes for consolidation of the composite. The
detailed processing conditions can be found in the next Chapter. The morphology of the
mechanically alloyed powders, the CNTs on the aluminum foil, and the microstructures
of the composites were examined by scanning electron microscopy (JEOL JSM-606LV)
and optical microscopy (Zeiss, Axiovert 200M). The lengths of CNTs were measured
with software ImageJ by estimating the curves as segmented lines.
Table 5.1: Particle size and distribution of Al6061 and SiC powders
Constituent Size (µm) Size Distribution (µm)
d90 d50 d10
Al6061 5-23 22.97 13.82 5.67
Multi-walled CNT 20-50 nm in diameter, 5 µm in length

81
5.4 Theoretical Analysis
A mathematical model was developed to predict the overall CNT length during
the alloying process. The overall CNT length was obtained by considering the effects of
particle welding and fracturing on the CNT length evolution process. With the collected
experimental data, including the surface CNT length and length distribution, particle
surface area, and embedded area, the overall CNT length can be predicted. A schematic
of the ball milling process for CNT and metallic powder is illustrated in Fig. 5.1. Five
assumptions have been postulated as the following:
(i) Only the dispersed CNTs can be embedded during the mechanical alloying
process. Agglomerated CNTs will prevent the bonding between the metal particles
(Wang, Choi et al. 2009). Therefore, it is unlikely that the agglomerated CNTs can be
embedded, or it will be released soon after embedding.
(ii) The length distribution of the dispersed CNTs on particle surface (Φs,d) is
assumed to be similar to that of all the CNTs (dispersed and agglomerated) on the particle
surface (Φs). It is difficult to experimentally measure the length distribution of dispersed
CNTs separately from that of all the CNT on the particle surface. Theoretically, the
CNTs on the surface, dispersed or agglomerated, experience the same amount of energy
input from mechanical alloying in given amount of time. Thus, the length reductions are
assumed to be similar to all CNTs on the surface:
( ) ( ) (5.1)

82
(iii) The exposed CNTs and embedded CNTs are uniformly distributed on the
surface area and embedded area, respectively.
(iv) The particles are uniformly deformed during the mechanical alloying process.
(v) During a single welding or fracturing event, only two particles are involved—
a single particle is fractured into two, and two particles are welded into a single particle.
The details will be discussed in the subsequent sections.
Fig. 5.1: Schematics of particles in mechanical alloying process.
5.4.1 Dispersion of CNTs
The fraction of agglomerated CNTs over all the CNTs in the composite is defined
as a:
(5.2)
where and are the weights of agglomerated CNTs and all CNTs in the composite,
respectively. Then, the dispersion, d, is defined as:
CNT agglomeration
Al6061 particle
Deform
Welding
Welding
Fracturing
Surface area As
Surface area As
Embedded area Ae Embedded area Ae
Surface area As
CNT agglomeration
Dispersed CNTs
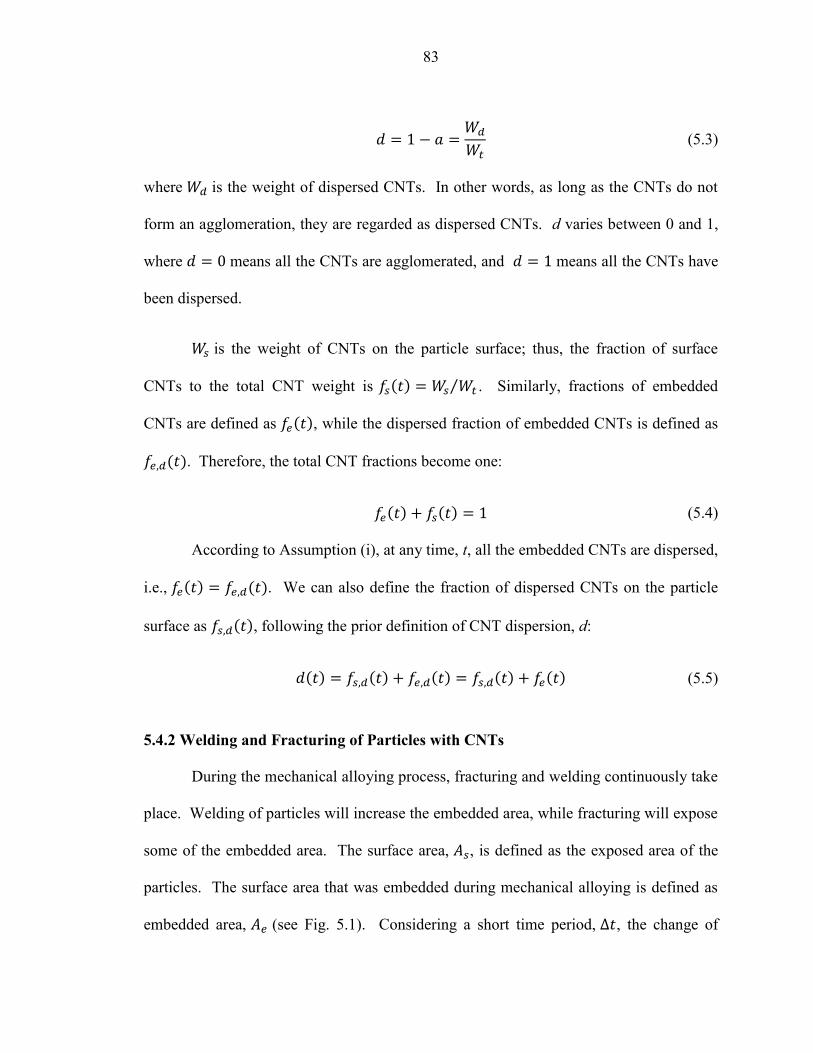
83
(5.3)
where is the weight of dispersed CNTs. In other words, as long as the CNTs do not
form an agglomeration, they are regarded as dispersed CNTs. d varies between 0 and 1,
where means all the CNTs are agglomerated, and means all the CNTs have
been dispersed.
is the weight of CNTs on the particle surface; thus, the fraction of surface
CNTs to the total CNT weight is ( ) ⁄ . Similarly, fractions of embedded
CNTs are defined as ( ), while the dispersed fraction of embedded CNTs is defined as
( ). Therefore, the total CNT fractions become one:
( ) ( ) (5.4)
According to Assumption (i), at any time, t, all the embedded CNTs are dispersed,
i.e., ( ) ( ). We can also define the fraction of dispersed CNTs on the particle
surface as ( ), following the prior definition of CNT dispersion, d:
( ) ( ) ( ) ( ) ( ) (5.5)
5.4.2 Welding and Fracturing of Particles with CNTs
During the mechanical alloying process, fracturing and welding continuously take
place. Welding of particles will increase the embedded area, while fracturing will expose
some of the embedded area. The surface area, , is defined as the exposed area of the
particles. The surface area that was embedded during mechanical alloying is defined as
embedded area, (see Fig. 5.1). Considering a short time period, , the change of

84
embedded surface area due to welding is ( ), and the exposed surface area due to
fracturing is ( ). Then, the net change of embedded area can be calculated as:
( ) ( ) ( ) (5.6)
A positive ( ) means that particles are becoming larger due to overall welding,
and a negative value suggests that the fracturing of particles is dominating.
A flow chart summarizing the overall CNT length calculation procedure is shown
in Fig. 5.2. With Assumption (iii), the change of embedded CNT weight in a short time
period can be obtained by:
( ) ( )
( )
( ) ( )
( )
( ) (5.7)
where Ws,d(t) is the weight of dispersed CNTs on the particle surfaces. The first term in
the right hand side of Eqn. (5.7) is the contribution from the dispersed CNTs from the
surface, and the second term is the loss of the CNTs from fracturing. Consequently, the
fraction change of embedded CNTs that are dispersed can be presented in the following
form:
( )
( )
( )
( ) ( )
( )
( ) ( ) (5.8)

85
Fig. 5.2: Flow chart for mathematical calculation of CNT length
Statistically, given two probability density functions p1(x) and p2(x) and weights
w1 and w2 such that w1>0, w2>0 and w1+ w2=1, the mixture distribution of p1(x) and p2(x),
f(x), can be calculated as (Everitt and Hand 1981):
Embedded CNTs
Surface area change due to fracturing
Surface area change due to welding
Embedded surface area
due to welding
Exposed surface area
due to fracturing
Eqn. 5.21
Embedded surface area
due to welding
Exposed surface area
due to fracturing
Eqn. 5.6
Total surface area change
Combine Eqn. 5.6, 5.18, 5.20 and 5.21
Assumption (iii)
CNTs exposed
CNTs newly embedded
Eqn. 5.8
Eqn. 5.13
All the CNTs
Eqn. 5.15
Eqn. 5.22
Welded or fractured particles
Eqn. 5.20
Net change of embedded
area
CNTs originally
embedded
Eqn. 5.18
Surface CNTs
Calculated value
Experimentally measured value
k
Eqn. 5.19

86
( ) ( ) ( ) (5.9)
Therefore, the embedded CNT length distribution at t+Δt can be represented by
the mixture distribution of CNTs newly welded from the surface and leftover CNTs
originally embedded inside the particle. The weights were calculated through the amount
of newly welded CNTs from the surface (i.e. ΔAw(t)fs,d(t)/As(t)) and leftover CNTs
originally embedded inside the particle (i.e. fe(t)-ΔAf(t)fe(t)/Ae(t)). Thus, with Eqn. (5.1)
we have:
( )
( ) ( )
( )
( ) ( ) ( )
( ) ( )
( ) ( )
( )
( )
( )
( ) ( )
( ) ( ) ( )
( ) ( )
( ) ( )
( )
(5.10)
As summarized in section 4.3, ( ) can be determined:
( )
( ) ( )
( ) ( ) (5.11)
where ( ) ( ) ( ( ) ( )).
A factor k is introduced to simplify Eqn. (5.8) and is defined as:
( )
( ) (5.12)
Based on Eqns. (5.4), (5.6), (5.8), (5.11) and (5.12), the rate of ( ) can be
derived as the following:
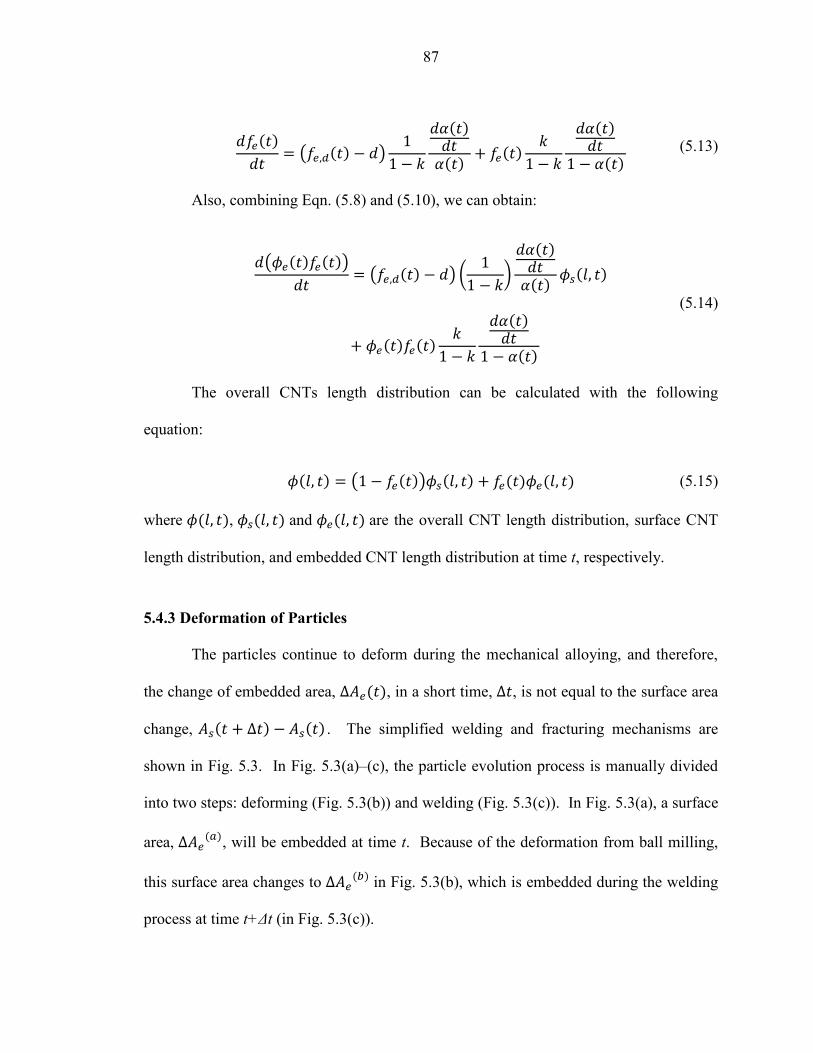
87
( )
( ( ) )
( )
( ) ( )
( )
( )
(5.13)
Also, combining Eqn. (5.8) and (5.10), we can obtain:
( ( ) ( ))
( ( ) ) (
)
( )
( ) ( )
( ) ( )
( )
( )
(5.14)
The overall CNTs length distribution can be calculated with the following
equation:
( ) ( ( )) ( ) ( ) ( ) (5.15)
where ( ), ( ) and ( ) are the overall CNT length distribution, surface CNT
length distribution, and embedded CNT length distribution at time t, respectively.
5.4.3 Deformation of Particles
The particles continue to deform during the mechanical alloying, and therefore,
the change of embedded area, ( ), in a short time, , is not equal to the surface area
change, ( ) ( ) . The simplified welding and fracturing mechanisms are
shown in Fig. 5.3. In Fig. 5.3(a)–(c), the particle evolution process is manually divided
into two steps: deforming (Fig. 5.3(b)) and welding (Fig. 5.3(c)). In Fig. 5.3(a), a surface
area, ( )
, will be embedded at time t. Because of the deformation from ball milling,
this surface area changes to ( )
in Fig. 5.3(b), which is embedded during the welding
process at time t+Δt (in Fig. 5.3(c)).
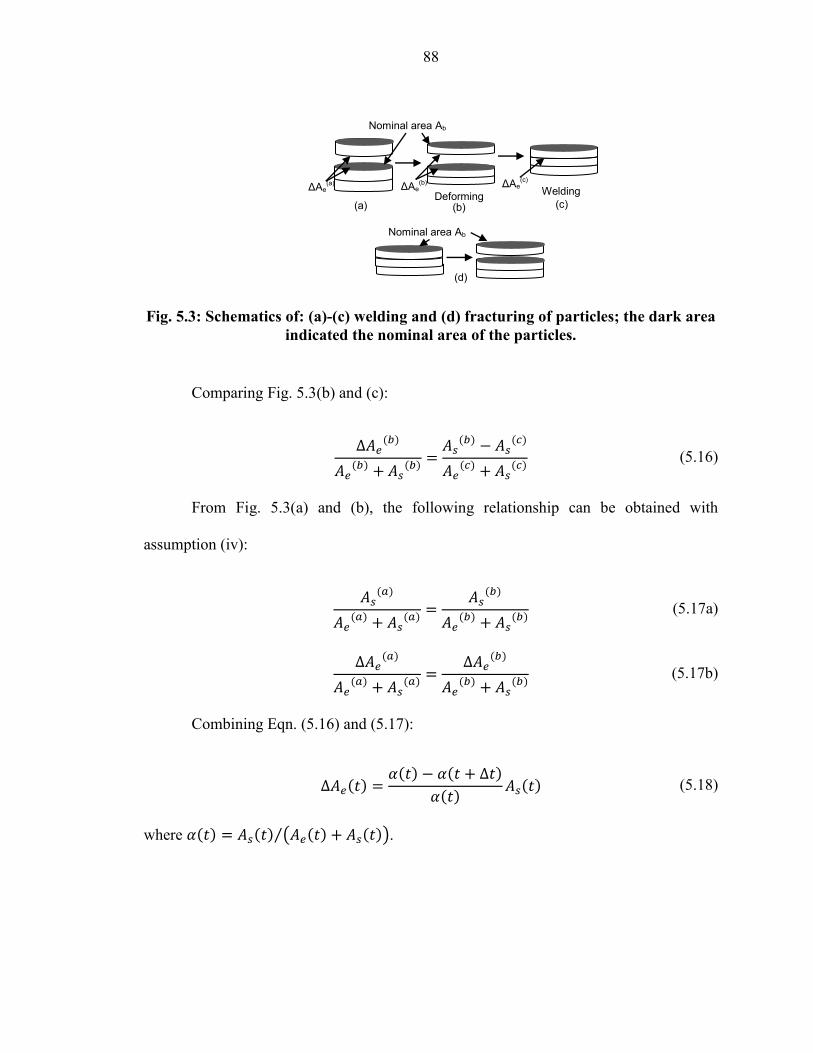
88
Fig. 5.3: Schematics of: (a)-(c) welding and (d) fracturing of particles; the dark area
indicated the nominal area of the particles.
Comparing Fig. 5.3(b) and (c):
( )
( )
( )
( )
( )
( )
( ) (5.16)
From Fig. 5.3(a) and (b), the following relationship can be obtained with
assumption (iv):
( )
( )
( )
( )
( )
( ) (5.17a)
( )
( )
( )
( )
( )
( ) (5.17b)
Combining Eqn. (5.16) and (5.17):
( )
( ) ( )
( ) ( ) (5.18)
where ( ) ( ) ( ( ) ( ))⁄ .
Welding
(b)
(d)
Nominal area Ab
Deforming
Nominal area Ab
(a) (c)
ΔAe(a)
ΔAe(b)
ΔAe(c)

89
5.4.4 Determination of k
k in Eqn. (5.12) is the ratio of the welded area and fractured area during
mechanical alloying. The flow char to mathematically determine k was shown in Fig. 5.2.
First, a rule between the welding/fracturing of particles and the change of surface area is
established as shown in Eqn. (5.19). During a short time, , assume number of
particles welded, number of particles fractured, and is the total number
of particles are involved in fracturing and welding. According to Assumption (v) and as
indicated in Fig. 5.3, the change of embedded surface area due to welding is ( )
( ) (Eqn. (5.19a)), and exposed surface area due to fracturing is ( )
( ) (Eqn. (5.19b)), where ( ) is the average nominal area of single particle.
( ) ( ) (5.19a)
( ) ( ) (5.19b)
The number of particles involved in fracturing and welding in a short time period
is calculated as shown in Eqn. (5.20). The average time interval between effective
impacts involving all the particles can be defined as (Maurice and Courtney 1995a).
Therefore, ⁄ fraction of all the particles will be effectively impacted in a given unit
period of time. The total number of particles involved in welding or fracturing can be
obtained by Eqn. (5.20a) and τ can be determined according to (Maurice and Courtney
1995a) in Eqn. (5.20b).
(5.20a)
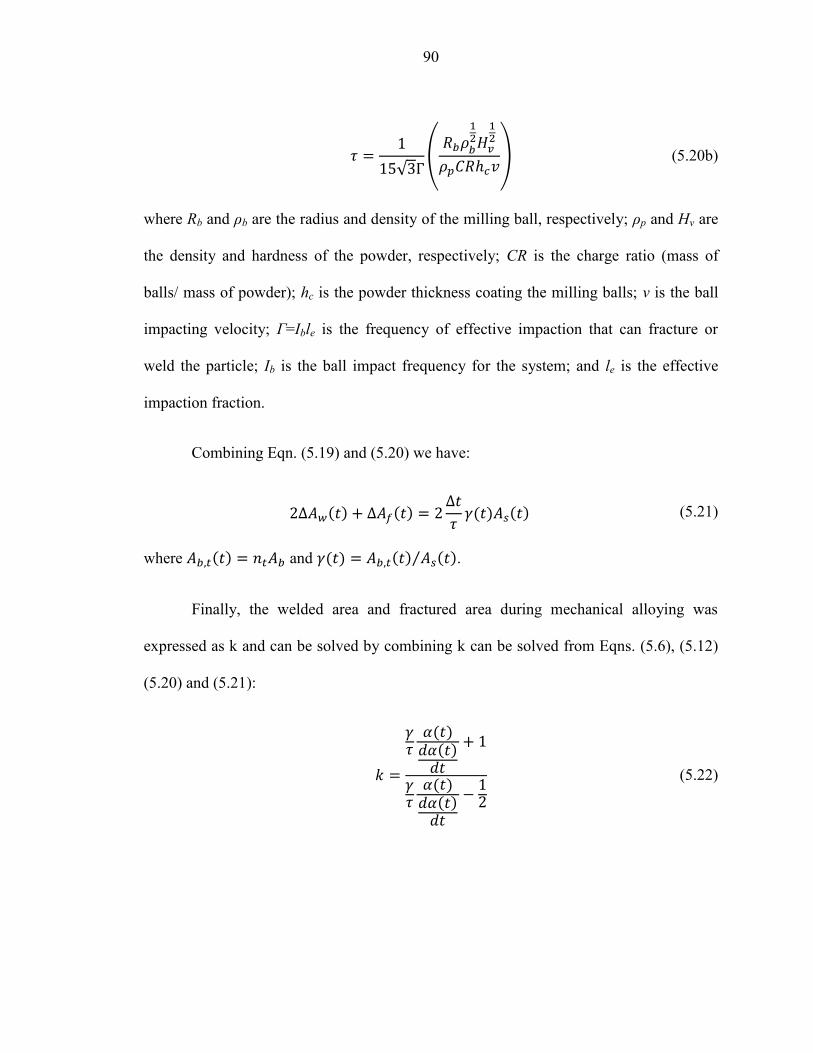
90
√ (
) (5.20b)
where Rb and ρb are the radius and density of the milling ball, respectively; ρp and Hv are
the density and hardness of the powder, respectively; CR is the charge ratio (mass of
balls/ mass of powder); hc is the powder thickness coating the milling balls; v is the ball
impacting velocity; Γ=Ible is the frequency of effective impaction that can fracture or
weld the particle; Ib is the ball impact frequency for the system; and le is the effective
impaction fraction.
Combining Eqn. (5.19) and (5.20) we have:
( ) ( )
( ) ( ) (5.21)
where ( ) and ( ) ( ) ( )⁄ .
Finally, the welded area and fractured area during mechanical alloying was
expressed as k and can be solved by combining k can be solved from Eqns. (5.6), (5.12)
(5.20) and (5.21):
( ) ( )
( ) ( )
(5.22)

91
5.5 Results
The results of theoretical analysis are provided in this section. The surface CNT
length, length distribution, surface area, nominal area and embedded area were examined.
In addition, experimentally measured parameters are presented. CNT dispersion was
analyzed through optical image analysis from the fabricated composite.
5.5.1 Surface CNT Length Distribution (Φs(l,t))
The CNTs collected from the particle surface at different mechanical alloying
times are shown in Fig. 5.4. The measured CNT length information is summarized in
Table 5.2. It was difficult to precisely measure the length of as-received CNTs due to the
highly curved nature in 3D space. The measurements are accurate for CNTs
mechanically alloyed for 3 minutes, 10 minutes, 30 minutes and 1 hour, since they are
laid on an Al foil. The 2D images reflect the correct lengths of the CNTs. As expected,
the length of CNTs on the particle surface decreased as the mechanical alloying time
increased. The average CNT length decreased from the original length of 4.24 µm to
1.69 µm in the first ten minutes, and then slowly decreased to 0.85 µm after one hour. As
shown in Fig. 5.5, as-received CNTs form spherical agglomerates prior to the mechanical
alloying process. These CNT spherical structures were crushed into dense CNT layers in
the first ten minutes of mechanical alloying, which damaged the CNTs. The sudden
change of CNT length in the first 10 minutes indicated that the CNTs were severely
damaged when the CNT spherical structures were crushed.

92
Table 5.2: Experiment results
MA time
(t, min)
Number of CNTs
measured
Average length (μ,
µm)
CNT length variance
(σ2, µm
2)
Agglomeration area
fraction (Aa)
0 45 4.24 2.21 N/A
3 62 1.97 1.25 1.625
10 53 1.69 0.91 1.58
20 41 1.36 0.61 1.23
30 49 1.28 0.58 0.55
40 48 1.02 0.66 0.055
60 43 0.85 0.64 0.017
93
Fig. 5.4: CNT morphology with different mechanical alloying time

94
Fig. 5.5: As received CNT and Al6061-CNT powders mechanically alloyed for 10
mins.
As shown in Fig. 5.6(a), a normal distribution was utilized to fit the histogram of
the measured CNT lengths. The fitted mean (µ) and variance (σ2) at different mechanical
alloying times are listed in Table 5.2. The surface CNT length distribution, ( ), may
be obtained as:
( )
( ) ( ) (5.23)
where l is the length of a single CNT, ( ) is the fitted normal distribution
with mean of and variance of ; ( ) is the value of cumulative distribution
function of normal distribution ( ) at The fitted surface CNT length
distributions at different mechanical alloying times are shown in Fig. 5.6(b). As the
average length of the CNT length decreased, the CNT length variance also decreased
during mechanical alloying.
as-received 10 min

95
(a)
(b)
Fig. 5.6: (a) CNT length distribution at mechanical alloying time 10 mins and (b) the
surface CNT length distribution at different mechanical alloying times
0 1 2 3 4 50
0.05
0.1
0.15
0.2
0.25
0.3
0.35
0.4
0.45
0.5
Data
Density
MA_10_min data
Fit_MA_10 min
0
0.1
0.2
0.3
0.4
0.5
0.6
0.7
0.8
0 2 4 6 8 10
Pro
babili
ty d
ensity
CNT length l (µm)
0 min
3 mins
10 mins
20 mins
30 mins
40 mins
60 mins

96
5.5.2 CNT Dispersion (d)
The SEM images of the fabricated Al6061-CNT samples are shown in Fig. 5.7.
The CNT agglomerations were shown as black areas in the SEM. The fraction of CNT
agglomeration area over the total image area was measured by software ImageJ and is
listed in Table 5.2 as Aa. In the first 10 minutes, the CNT de-clustering was very slow
due to rupturing of CNT spherical structure. After the CNT-metal powder was
mechanically alloyed for 40 minutes, CNT agglomerated area was rarely observed. Since
the agglomerated CNT weight fraction can be obtained from the images (
), the dispersion can be written as , where is the CNT
agglomeration area when no CNT is dispersed. The dispersion, d, can be fitted with the
equation shown in Table 5.3, and the result is shown in Fig. 5.8.

97
Fig. 5.7: SEM images of the polished surface of the Al6061-CNT samples
Table 5.3: Fitting equations and fitted constant
Parameter Equation format Constant value
R2
C1 C2 C3 C4
148.6 -0.192 0.9982
1.038 -0.059 0.9642
2.341 -0.914 1.899 -0.014 0.9984
1.417 -0.309 0.725 -0.003 0.9828
3 mins 10 mins
20 mins 40 mins
CNT agglomerations

98
Fig. 5.8: The dispersion d and computed k value during mechanical alloying
5.5.3 Nominal Area (Ab), Surface Area (As) and Embedded Area (Ae)
The SEM images of the particles mechanically alloyed for 30 mins are shown in
Fig. 5.9(a). Due to the complexity of the particle shapes, three simplified geometries as
shown in Fig. 5.9(b)-(d) were used to approximate the particle shape for the analysis.
Only a small amount of spherical particles (Fig. 5.9(d)) were found, and they were as-
received particles without any deformation (or with slight deformation). The dimensions,
D, H, L and W, can be directly measured from the SEM images. The particle layer
thickness, h, was estimated from the optical images of the etched samples, which clearly
showed the thickness of the merged layers within each particle (see Fig. 5.9(e)).
Therefore, the surface area (As) and embedded area (Ae) can be quantified. During
mechanical alloying, the deformed particles stack in layers. As shown in Fig. 5.9(a) and
(e), the surface area will be exposed or welded in the layers. Therefore, the nominal area
0
0.2
0.4
0.6
0.8
1
1.2
0
0.05
0.1
0.15
0.2
0.25
0.3
0.35
0.4
0.45
0 10 20 30 40 50 60
d v
alu
e
k v
alu
e
Mechanical alloying time t (mins)
k value
d value

99
was measured as the surface area of the layers, indicated in Fig. 5.9(a). The α and γ
based on the measured data are listed in Table 5.4. In addition, the volume of each
particle was estimated, and an equivalent particle diameter was calculated. The overall
particle thickness was also measured and the volume average strain of the particles was
calculated by Eqn. (5.24) (Wu and Kim 2011a). Both the equivalent particle diameter
and strain are listed in Table 5.4.
∫ [ √ (
√ )]
√
(5.24)
where D is the initial particle diameter; r is integrating parameter.

100
Fig. 5.9: (a) Al6061-CNT powders mechanically alloyed for 30 mins, (b)-(d) three
types of the approximation geometries and (e) optical image of Al6061-CNT
composite with powders mechanically alloyed for 3 mins
Layered particle
Sphere particle
Nominal area of the particles
Thickness of the layered particles
layers
200 µm
(e)
(a)
(b) (c) (d)
D H
W L
H
D h
h

101
Table 5.4: Experiment results for the particles
MA time
(t, min)
Surface
area/total
area (α)
Nominal
area/surface
area (γ)
Thickness of
layered
particles (h,
µm)
Thickness of
all the
particles
(µm)
Strain of
all the
particles
Equivalent
particle
diameter
(µm)
0 1 N/A N/A 9.38 N/A 13.8
3 N/A N/A 2.12 8.35 0.02 N/A
10 0.70 0.31 2.93 4.01 0.54 11.0
20 0.23 0.35 1.83 2.94 0.84 27.3
30 0.16 0.38 1.62 1.92 1.25 29.1
40 0.085 0.32 1.85 1.85 1.29 60.9
60 0.028 0.31 1.39 1.39 1.57 130.8
5.5.4 Overall CNT Length Distribution (Φ(l,t))
Finally, the overall CNT length distribution can be predicted from Eqn. (5.15). k
and τ can be calculated from Eqn. (5.22) and (5.20b). The parameters used to calculate τ
are listed in Table 5.5. ( ) , ( ) and can be obtained with experimentally
measured data. Since γ did not fluctuate much, a mean value of 0.334 was used. The
curve-fitting equations and parameter values are listed in Table 5.3. The final results
were computed by Matlab with an Euler explicit computational scheme. The flow chart
is shown in Fig. 5.10.

102
Table 5.5: The data used in the calculation of impact frequency
Parameter Material Value
Zirconia 6.35 mm
Zirconia 5680 kg/m3
Al6061 (T-O) 2700 kg/ m3
Al6061 (T-O) 165 MPa
4.06
120 µm (Maurice and Courtney 1995b)
Zirconia 18.7 m/s (Davis, Mcdermott et al. 1988)
320 (Davis, Mcdermott et al. 1988)
1.1% (Davis, Mcdermott et al. 1988)

103
Fig. 5.10: Flow chart of the computing code
The computed k value is shown in Fig. 5.8. The k value decreased immediately as
the mechanical alloying time passed. Initially, the agglomerated CNTs prohibited the
welding of particles. The welding mechanism seemed to dominate once the dispersion of
CNTs occurred.
The average surface CNT length (µ), average overall CNT length (lall), overall
CNT length distribution Φ(l,t), and weight fraction of the embedded CNTs (fe(t)) are
shown in Fig. 5.11. As shown in Fig. 5.11(a), the overall CNT length decreased
significantly in the first ten minutes, which was attributed to the crushing of the spherical
CNT agglomerates. In Fig. 5.11(b), the average surface CNT length (µ) and overall CNT
length (lall) coincided during the first 20 minutes of mechanical alloying. A smaller k
Start
Initial values: τ(t), fe(t), Φe(t)fe(t)
Obtain dfe(t)/dt with Eqn.(5.13);
d(Φe(t)fe(t))/dt with Eqn.(5.14)
Obtain k with Eqn. (5.22)
Obtain fe(t+Δt), Φe(t+Δt)fe(t+Δt)
Increment of Δt
Obtain Φ(t+ Δt) with Eqn.(5.15)
Stop
yes
no
t=t_set ?
t=t+Δt
Exp. Data: d(t), Φs(t),
γ, α(t)

104
value indicates a higher welding rate, providing protection for CNTs from further damage.
Initially, the high agglomeration of surface CNTs prevented the embedding of CNTs
inside the particles, since the welding rate was not much higher than the fracturing rate
indicated by the larger k value shown in Fig. 5.8. Consequently, less than 10% of the
CNTs were embedded, and therefore, the surface and overall CNT length were similar.
As the mechanical alloying time increased, more CNTs were dispersed and a low k value
was obtained, enhancing the welding process. Therefore, the surface CNT length became
shorter than the overall CNT length. The overall CNT length distribution and average
CNT length does not change after 60 minutes of mechanical alloying because over 85%
of the CNTs were embedded inside the particles protecting the CNTs from further
damage. Although welding of the particles is regarded as a negative factor for the
subsequent sintering process, it can provide protection of CNTs from further damage,
especially when long mechanical alloying time is applied.

105
(a)
(b)
Fig. 5.11: (a) Probability function for overall CNT length distribution at different
mechanical alloying time, (b) average overall CNT length, average surface CNT
length and embedded CNT fraction
5.6 Conclusion
The overall CNT length and length distribution during mechanical alloying were
predicted for the first time, and the effects of welding and fracturing of the CNTs and
aluminum particles were better understood. Experiments were conducted to assist the
0
0.1
0.2
0.3
0.4
0.5
0.6
0.7
0 2 4 6 8 10
Pro
bablit
y density
CNT length l (µm)
0 min
1 min
2 min
3 min
10 min
30 min
60 min
120 min
0
0.2
0.4
0.6
0.8
1
1.2
0
0.5
1
1.5
2
2.5
3
3.5
4
4.5
0 50 100
Em
bedded d
ispers
ed C
NT
fr
action f
e
CN
T length
(μ
m)
Mechanical alloying time t (mins)
Overall CNT average length
Surface CNT average length
Embedded CNT fraction
106
prediction of overall CNT length. The surface CNTs were successfully collected and
analyzed, and the dispersion of CNTs was studied. The CNT length decreased
significantly during mechanical alloying. Severe CNT length reduction occurred (from
4.24 μm to 1.69 μm) in the first several minutes due to the crushing of CNT
agglomeration balls. After that, the length of CNTs decreased slowly to 1.16 μm, and the
CNTs were dispersed in the following one hour. In addition, the welding/fracturing of
Al6061 particles and the dispersion of CNTs affected the overall CNT length. The
welding of metal particles surrounded the CNT with metal layer and protected CNTs
from further contact with the milling media. Therefore, limited CNT length reduction
occurred after one hour of mechanical alloying. Once the CNT dispersion took place, the
welding mechanism dominated the CNT+Al6061 mechanical alloying process due to the
ductile nature of Al6061. The model provided an insight into the breakage of CNTs
during the harsh ball milling operation, which has been a challenge for experimental
measurement. The work can provide useful information when evaluating the effects of
CNTs on mechanical, thermal and electrical properties.

107
CHAPTER 6 CARBON NANOTUBE REINFORCED ALUMINUM
COMPOSITE FABRICATED BY SEMI-SOLID POWDER
PROCESSING
6.1 Introduction
Incorporation of CNTs in polymer composites has been widely investigated since
the discovery of CNTs by Iijima in 1991 (Iijima 1991). High strength and high thermal
and electronic conductivities make CNTs an ideal reinforcing material for composites. In
metal composites, however, the progress has been rather slow primarily due to challenges
associated with CNT dispersion and high temperature processing used in the synthesis of
metal composites. Various fabrication methods, including sintering (Deng, Wang et al.
2007), hot extrusion (Xu, Wei et al. 1999), spark plasma sintering (Kwon, Estili et al.
2009), spark plasma extrusion (Morsi, Esawi et al. 2010), casting (Zhou, Zhang et al.
2007), equal channel angular pressing (Quang, Jeong et al. 2007) and friction stir
processing (Lim, Shibayanagi et al. 2009), have been investigated to incorporate CNTs
into the Al matrix. Each manufacturing method has its unique characteristics while also
having weaknesses.
One of the main challenges in the fabrication of metal-CNT composites is to
uniformly disperse the CNTs in the metal matrix (Noguchi, Magario et al. 2004; He,
Zhao et al. 2007). For powder-based manufacturing approaches, mechanical alloying has

108
been widely applied to break down the CNT clusters and homogeneously disperse them in
the metal matrix (Liao, Tan et al. ; Esawi and Morsi 2007; Li, Misra et al. 2009; Poirier,
Gauvin et al. 2009). Recently, Morsi et al. (Morsi and Esawi 2007) and Wang et al.
(Wang, Choi et al. 2009) investigated the effects of mechanical alloying time on the
evolution of blended aluminum-CNT composite powder. The size of particles increased,
and the dispersion of CNTs was achieved by the mechanical alloying process (Morsi and
Esawi 2007). However, no study was found that reported the effects of mechanical
alloying time on the microstructure and mechanical properties of the fabricated
composites.
In this study, SPP combined with mechanical alloying procedure was employed to
fabricate the CNT reinforced Al6061 composites. As shown in Fig. 6.1, SPP expands the
traditional semi-solid forming by replacing the bulk materials with powders (Wu, Kim et
al. 2010b). The semi-solid bulk forming requires break-down of the dendritic
microstructure in the feedstock alloy materials (Steinhoff, Weidig et al. 2004). SPP
combines the advantages of powder metallurgy and semi-solid forming. It exploits
unique material behavior of solid-liquid slurry, which helps the formation of intricate
shapes (Kumar, Martin et al. 1993). It also enables mixing of various particle or fiber
elements for improved composite properties and eliminates post-processing steps
required in powder metallurgy routes (Wu, Kim et al. 2010a). According to the SPP
experiments carried out by Chen and Yang et al. (2005b), four basic steps are generally
involved in SPP: powder preparation, powder pre-compaction, heating and semi-solid
forming. Previous studies have demonstrated the potential of SPP in fabricating various

109
metal composites, including Al-SiC (Guo and Tsao 2000), Al-Ti (Yasue 2000) and Al-
Mg (Young and Clyne 1986a), and in tailoring the composition of composite materials
effectively (Wu, Kim et al. 2010b).
Fig. 6.1: Comparison of conventional semi-solid forming and semi-solid powder
processing
This study presents an original work on the synthesis of CNT reinforced metal
composite by mechanical alloying followed by SPP. Al6061-CNT composites fabricated
using mechanical alloying times and processing temperature were studied. The
compaction behavior, microstructure, hardness, fracture surface, and composition of the
composites were examined and analyzed.

110
6.2 Experimental Procedure
Al6061 particles (Valimet Inc.) and multi-walled carbon nanotubes (MWCNTs)
(NanoLab Inc.) were used to make Al6061-1.0 wt.% CNT composite samples. The
Al6061 particles had mean particle size of 13.8 µm, and MWCNTs were 20–50 nm in
diameter and 5–20 µm in length. The chemical composition of Al6061 powders is shown
in Table 6.1. Esawi and Morsi (2007) mechanical alloyed the Al powder and CNT
mixture and demonstrated its effectiveness in dispersing the CNTs into the metal particles.
Table 6.1: Chemical composition of Al6061 (Valimet, Inc.)
Element Al Mg Si Cu Fe Cr Zn Mn Ti
Amount
(%) Bal. 1.03 0.52 0.28 0.27 0.09 0.06 0.03 0.01
The experimental setup is shown in Fig. 6.2. The die was fabricated from H13
tool steel and was heat treated to Rockwell hardness of HRC 50. The high temperature
boron nitride spray (Momentive Performance Materials-Quartz, Inc.) was used to coat
and lubricate the die wall to prevent the possible reaction between the Al and die material
at elevated temperatures. The powder mixture was pre-compacted under 100 MPa of
pressure, which was then heated in a furnace (Applied Test System Inc.). A 50 MPa of
pressure was applied near 580C at which temperature the Al6061 started to melt. The
pressure was held constant for 30 minutes while the material was heating up to the
control temperature settings. For SPP, the liquid content, which is largely determined by
the processing temperature, is one of the most important factors that influence the
111
composite manufacturability and property. Three temperature settings (600C, 620C
and 640C) were used in this study. The compression and heating profiles for the three
processing temperatures are shown in Fig. 6.3. The differential scanning calorimetry
analysis from Kim and Kang et al. (2007) showed that the liquid fractions of Al6061 at
600C, 620C and 640C were about 7.5%, 12.5% and 30.0%, respectively. Four
Al6061-1.0 wt.% CNT powder batches were prepared with mechanical alloying times of
0.5, 1, 2, and 3 hours. The reference samples for each alloying time were prepared under
the same conditions using only the Al6061 powder without any CNT. The experimental
settings are summarized in Table 6.2. The temperature was fixed at 640C when
studying the effects of mechanical alloying time on the composite, while mechanical
alloying time was fixed at 3 hour when temperature was varied. The experiments were
carried out under air atmosphere. The surface oxide layers are effectively broken down
because of the relative sliding and deformation of the particles by the externally applied
pressure during SPP (Xie, Hailat et al. 2007). The presence of liquid-phase helps to fill
in pores enabling high density structure. Relatively short exposure time with the
assistance of pressure and enclosed-die setup also helps to prevent excessive oxide
formation. It has also been reported that the Mg alloy element in Al6061 can eliminate
the surface oxides (Fuentes, Rodriguez et al. 2003) and improve the interfacial bonding
between Al particles by disrupting the oxide layer (Lumley, Sercombe et al. 1999).
Fogagnolo and Robert et al. (2006) and Xie and Hailat et al. (2007) reported that ceramic
reinforced Al6061 fabricated with pressure assisted sintering of Al6061 at atmospheric
environment obtained strong interfacial bonding between the Al6061 particles and
reinforcement phase.

112
Fig. 6.2: Experiment setup for semi-solid powder processing
Fig. 6.3: Heating and compression profiles used in the experiment
0
10
20
30
40
50
60
70
80
90
100
0
100
200
300
400
500
600
700
800
0.00 20.00 40.00 60.00
Pre
ssure
(M
Pa)
Tem
pera
ture
(˚C
)
Time (min)
Powder Temperature (for 640˚C) Powder Temperature (for 620˚C) Powder Temperature (for 600˚C) Pressure

113
Table 6.2: Parameter settings for the experiment
Parameter Settings
Forming Pressure (MPa) 50
Pressure Holding Time (min) 30
CNT Loading (wt.%) 1
Punch Velocity (mm/s) 0.065
Powder Mechanical Alloying Time (h) 0.5, 1, 2, 3
Operating Temperature (C) 600, 620, 640
Liquid Fraction of Al6061 0.075, 0.125, 0.300
The microstructures of the polished and etched samples were observed with an
optical microscope (Zeiss, Axiovert 200M) and scanning electron microscope (JEOL
JSM-606LV). Commercial software, ImageJ, was used to determine the relative density
of the composite by measuring the black area fraction in the optical image took from the
samples. Five images took from different locations were measured to obtain an average
relative density for the samples. The hardness of samples was measured by LECO
LM247AT Micro Hardness Tester after appropriate polishing procedure. A Siemens D-
500 X-ray diffraction system was used to obtain the X-ray diffraction (XRD) pattern of
the powder and composite samples. Bend test samples were polished to the dimension of
0.9 mm in thickness and 1.2 mm in width for the Al6061 and Al6061-CNT samples made
from different mechanical alloying times. The fracture surfaces were examined by
scanning electron microscope.

114
6.3 Results and Discussion
First, mechanically alloyed Al6061 particles and CNTs were examined. Then
compression behaviors of the Al6061-CNT particles during pre-compaction and
consolidation stages were analyzed. The microstructure, hardness, fracture surface and
the composition analysis were performed to understand the effects of liquid fraction on
the composite. Last, the material strength was predicted with a modified shear lag model.
6.3.1 Mechanically Alloyed Powders
SEM images of as-received CNTs and Al6061-CNT powders that were
mechanically alloyed for different times are shown in Fig. 6.4. As-received CNTs were
strongly entangled in roughly spherical agglomerates with diameters of 1–7 m (Fig.
6.4(a) and (b)). After 10 minutes of mechanical alloying, the CNT bundles were crushed
and attached to the Al6061 particle surface (Fig. 6.4(c)). The original spherical CNT
agglomerates was nearly absent in the powder. The dispersion of CNTs improved with
increasing mechanical alloying time (Fig. 6.4(d) and (e)), while the visible CNTs on the
Al6061 particle surfaces gradually decreased (Fig. 6.4(f)). After three hours of
mechanical alloying, CNTs could be rarely found on the surface (Fig. 6.4(g)). The
lengths of the CNTs on the surface of Al6061 particles decreased as the mechanical
alloying time increased. After one hour of mechanical alloying, the length of the CNTs
on the particle surfaces decreased to about 1.2 µm from the original length of over 5 µm.
It further decreased to less than 1 µm after three hours of mechanical alloying. This
observation was quite different from the work performed by Esawi et al. (Esawi and
Morsi 2007), which indicated that there was limited CNT breakage during mechanical

115
alloying. In their work, initial CNT structure may have been different from the spherical
agglomerates seen in this study, so the harsh initial crushing may have been avoided. It
was speculated that the severe CNT breakage observed in this study was due to the high-
energy mechanical alloying equipment used in this experiment and the initial crushing of
the spherical CNT agglomerates.
Fig. 6.4: CNTs and mechanically alloyed Al6061 powder and CNTs: (a) and (b) are
images of as-received CNTs; (c)−(g) are Al6061 powder and CNTs mechanically
alloyed for (c) 10 minutes, (d) 0.5 hr, (e) 1 hr, (f) 2 hrs and (g) 3 hrs, respectively.
From these observations, the mechanical dispersion of CNTs occurred in two
stages. First, the spherical agglomerates of as-received CNTs were crushed by colliding
with the milling balls. For the condition used in this study, this occurred in the first 30
minutes. Second, the crushed CNT clusters were dispersed into individual CNTs by the
shearing action of the Al6061 particles and the milling balls. The CNTs were well
dispersed after two hours of mechanical alloying. No agglomeration of CNTs was found
(a)
(b)
(c)
(g)
(d)
(e)
CNT clusters Crushed CNT clusters
Well dispersed CNTs Single CNTs
Single CNT partly covered by another Al6061
layer
(f)

116
on the surface of Al6061 particles (Fig. 6.4(f)). The clustered CNTs were typically
exposed on the surface of particles and prevented the metal particles from bonding to
each other. Thus, the CNT dispersion condition on the surface of Al6061 particles
reflected the overall dispersion status.
The change of particle size during mechanical alloying of the Al6061 and
Al6061+CNT powders was measured. The measurement results are summarized in Table
6.3. It was observed that the size of Al6061 particles increased from 13.8 µm to 620.1
µm during the first hour and then slightly decreased in the following two hours. In
mechanical alloying, cold-welding and fracturing are the two competing mechanisms that
govern the particle size (Morsi and Esawi 2007). In the beginning of mechanical alloying,
cold-welding dominated the process, and the ductile Al6061 particles agglomerated to
form larger particles (Fig. 6.5(a)). Similar observation was also reported in (Benjamin
1992). As the mechanical alloying process continued, the Al6061 particles hardened and
started to fracture (Benjamin and Volin 1974), which resulted in the decrease of particle
size. With further comminution, the surface temperature of the Al6061 particles
increased (Koch 1989), and the particle surfaces started to bond, forming a densified
structure (Fig. 6.5 (b)).

117
Table 6.3: Powder particle sizes, grain sizes, and average hardnesses of the
composites
Mechanical
alloying
time (hr)
Average powder
size (µm)
Grain size of the Al6061-CNT
composites
Average hardness of the composites
(HV)
Al6061
+CNT Al6061
W
(µm)
L
(µm) L/W
Area
(µm2)
Al6061 Al6061
-CNT
Hardness net
percent gain (%)
0.5 8.6 29.1 7.0 10.8 1.6 68.2 48.2 49.3 2.3
1 10.5 620.1 5.2 12.5 2.6 58.6 53.2 60.4 13.5
2 15.9 446.1 4.2 14.2 3.8 62.2 55.5 71.1 28.1
3 44.6 212.8 3.1 18.4 7.4 52.4 61.5 76.5 24.4
Fig. 6.5: Al6061 powder mechanical alloyed for: (a) 0.5 hr and (b) 3 hrs.
In contrast to the behavior of the reference Al6061-only powder, the size of
Al6061-CNT particles increased continuously as the mechanical alloying time increased
(see Table 6.3), which indicated that cold-welding dominated the mechanical alloying of
Al6061-CNT powders. It was also noted that the size of the Al6061-CNT particles was
much smaller than that of the Al6061-only powder under the same condition. It appears
that the CNTs acted as a grinding aid and inhibited the growth of particle size during
mechanical alloying (Wang, Choi et al. 2009).
(a) (b)

118
6.3.2 Compression Behavior of Al6061-CNT Powder
Fig. 6.6 shows the pre-compaction curve and the subsequent compression
behavior at elevated temperature for Al6061-CNT composite synthesized at 640C with
powder mechanically alloyed for 3 hrs. The relative density of the compact was
estimated from the punch displacement and total powder loaded, and is labeled in the
figure. During the pre-compaction at room temperature, the Al6061-CNT powder
achieved a relative density of 49.9%. The yield strength of the annealed Al6061 is about
55 MPa (Hatch 1984). However, the cold working during mechanical alloying
strengthens the material by continuously deforming the particles. The yield strength of
the mechanically alloyed particles can be estimated by Eqn. (6.1) (Maurice and Courtney
1994). The schematics of a particle before and after deformation are shown in Fig. 6.7.
The minimum volume-averaged plastic strain can be estimated by Eqn. (6.2).
n
y K (6.1)
∫ [ √ (
√ )]
√
(6.2)
K and n are strength coefficient and strain hardening exponent, respectively; D is the
initial particle diameter; and h is the particle thickness after deformation; r is integrating
parameter. The values of K and n were 224 MPa and 0.209 for annealed Al6061 (Hatch
1984). The particle diameter at the initial state was 9.4 µm. After three hours of
mechanical alloying, the particles were flattened and had an average thickness of 3.1 µm,
resulting in particle yield strength of 213 MPa. Therefore, the densification behavior of

119
mechanically alloyed Al6061-CNT powder during pre-compaction was mostly caused by
particle rearrangement than plastic deformation.
Fig. 6.6: Densification of Al6061-CNT powder during pre-compaction and
consolidation at 640C
Fig. 6.7: Cross sectional view of (a) the original spherical particle and (b) flattened
particle after deformation
As the compact was brought to the processing temperature, thermal expansion of
the system occurred and resulted in raising the punch. The punch displacement at the end
of the pre-compaction was 9.08 mm, while the initial contact at the elevated temperature
occurred at 8.07 mm. The Al6061-CNT powder achieved a relative density of 97.7% at
580C with 50 MPa of pressure due to the significant softening of the material. While
0
10
20
30
40
50
60
70
80
90
100
2 3 4 5 6 7 8 9 10 11 12 13
Pre
ssure
(M
Pa)
Displacement (mm)
Pre-compaction at roomtemperature
Compaction at elevatetemperature Holding
ρ=97.7%
ρ=49.9% d

120
maintaining the pressure at 50 MPa, more liquid-phase formed as the temperature
reached 640C. This resulted in full densification of the composite with relative density
above 99%.
6.3.3 Microstructure
The SEM images of polished and etched microstructures of the Al6061-CNT
samples with powders mechanically alloyed for different mechanical alloying time are
shown in Fig. 6.8. CNTs that had not been fully dispersed were observed in the Al6061-
CNT sample that had been mechanically alloyed for 0.5 hour (Fig. 6.8(a) and (b)). The
crushed CNT layers as observed in Fig. 6.8(c) resulted in CNT clustered areas. For the
Al6061-CNT composites that had been mechanically alloyed for two and three hours, no
obvious CNT agglomerations were observed, as shown in Fig. 6.8(c) and (d). The CNT
dispersion condition was also confirmed by the SEM images shown in Fig. 6.9(a)−(d). It
clearly showed that CNT clustering decreased with increasing mechanical alloying time.
No CNT cluster was observed in the samples that were mechanically alloyed for two and
three hours (Fig. 6.9(c)−(d)). In lower magnification SEM images, the CNT
agglomerated area and pores both showed up as dark spots. It was difficult to discern
whether a given dark spot was a pore or a CNT cluster without examining the higher
magnification image. The measured fractions of dark area for both Al6061-CNT and
Al6061-only samples are shown in Fig. 6.10. As mechanical alloying time increased to
two hours, the dark area of Al6061-CNT composite quickly approached that of the
Al6061-only composite. Therefore, the difference between the two curves indicates the
change of CNT clustered area fraction. As shown in the figure, the CNT clustered area

121
decreased significantly in the first two hours to a very low level. After two hours, the
agglomeration seemed to be minimal.
Fig. 6.8: SEM microstructure images (high magnification) of the Al6061-CNT
samples with powders mechanically alloyed for (a) and (b) 0.5 hr, (c) 2 hrs and (d) 3
hrs. T=640C.
(a)
(d) (c)
(b) 10 µm 1 µm
1 µm 1 µm
CNT clusters

122
Fig. 6.9: SEM microstructure images (low magnification) of the Al6061-CNT
composites with powders mechanically alloyed for (a) 0.5 hr, (b) 1 hr, (c) 2 hrs and
(d) 3 hrs, respectively. T=640C. Circles are CNT clusters, while the pores are
revealed by deep etching process.
(a)
(d)
(b)
(c)
Pores
Pore
Pore
Pores
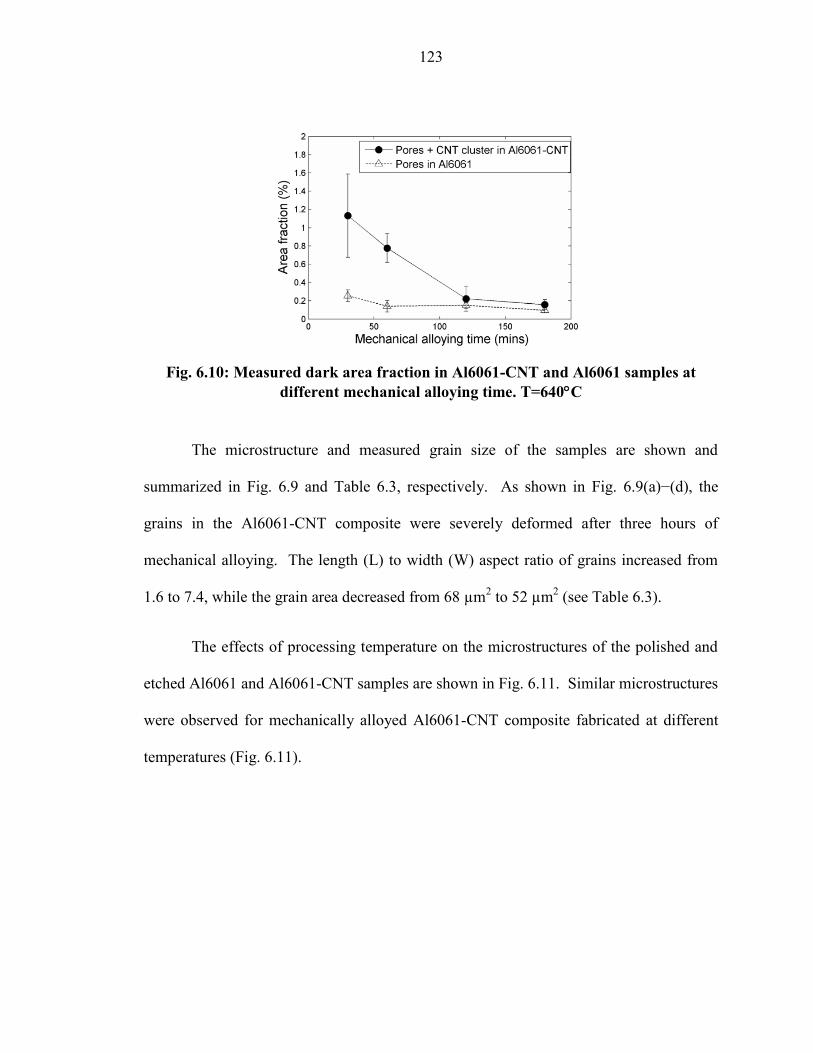
123
Fig. 6.10: Measured dark area fraction in Al6061-CNT and Al6061 samples at
different mechanical alloying time. T=640C
The microstructure and measured grain size of the samples are shown and
summarized in Fig. 6.9 and Table 6.3, respectively. As shown in Fig. 6.9(a)−(d), the
grains in the Al6061-CNT composite were severely deformed after three hours of
mechanical alloying. The length (L) to width (W) aspect ratio of grains increased from
1.6 to 7.4, while the grain area decreased from 68 µm2 to 52 µm
2 (see Table 6.3).
The effects of processing temperature on the microstructures of the polished and
etched Al6061 and Al6061-CNT samples are shown in Fig. 6.11. Similar microstructures
were observed for mechanically alloyed Al6061-CNT composite fabricated at different
temperatures (Fig. 6.11).

124
Fig. 6.11: Micrographs of the etched sample: (a) and (b) are optical images of the
Al6061-CNT 600C composite and Al6061-CNT 640C composite, respectively.
Powder mechanical alloying time: 3 hrs.
The measured relative densities of the composites processed with different
temperature are listed in Table 6.4. Commercial software, ImageJ, was used to measure
the porosity in the SEM images. For the Al6061-CNT composite fabricated at 620C and
640C, they achieved relative densities higher than 99.0%. Slightly lower density of 97.4%
was obtained for the composite fabricated at 600C because only a small amount of
liquid-phase (7.5%) was available during the consolidation process.
Table 6.4: Measured densities at different consolidation temperatures
Condition Relative Density (%)
Al6061 mechanically alloyed, 640C 99.5
Al6061-CNT, 600C 97.4
Al6061-CNT, 620C 99.3
Al6061-CNT, 640C 99.1
(a) (b)
20 µm 20 µm

125
6.3.4 Hardness
The measured average hardnesses of the composites with different mechanical
alloying time are summarized in Table 6.3. The hardness of the Al6061 and Al6061-
CNT composite increased as the mechanical alloying time increased. For the Al6061
sample, the dispersion strengthening may be the main reason for the hardness increase
(Benjamin 1980). For the Al6061-CNT composite, improved dispersion of CNTs by the
mechanical alloying further increased the hardness. Therefore, the net hardness increase
from CNT addition can be extracted by comparing the hardness of Al6061 sample and
Al6061-CNT composite samples. The net percent hardness improvement between the
two samples increased from 2% to 28% as the mechanical alloying time increased from
0.5 to 2 hours. When the powder was mechanically alloyed for three hours, the hardness
net percent gain was 24.4%, which was lower than the sample with two hours of
mechanical alloying. This may be due to the limited improvement of CNT dispersion
and continuous CNT breakage beyond two hours of mechanical alloying.
The hardness of the fabricated Al6061 and Al6061-CNT composites with
different processing temperature are shown in Fig. 6.12. When the operating temperature
was 620C, the hardness improvement of the Al6061-CNT composite over the Al6061
mechanical alloyed sample was the highest at 42.3%. The hardness of the Al6061-CNT
composite for 600C (83.3 HV) was close to that of Al6061-CNT composite synthesized
at 620C (87.5 HV). However, the hardness of Al6061-CNT composite fabricated at
640C was much lower (76.5 HV). Several factors may have contributed to the lower
hardness at 640C. Higher temperature may result in more formation and precipitation of

126
oxidation, spinal and Al4C3. The prismatic dislocations loops may be punched out
(Giannattasio, Senkader et al. 2004), lowing the strength of the composites. Another
factor may be excessive formation of Al4C3 at elevated temperatures. The presence of a
small amount of carbide at the interface of the CNT and matrix can improve the
interfacial bonding (Ci, Ryu et al. 2006), but excessive carbide formation can result in
overall degradation of the composite strength since the carbides have inferior properties
compared with the CNTs.
Fig. 6.12: Comparison of fabricated composite hardness with different processing
temperature. Powders were mechanically alloyed for 3 hrs.
6.3.5 Bend Test
The flexural strengths and strains from the bend tests were calculated by Eqn. (6.3)
and Eqn. (6.4). The bend test results for samples with different mechanical alloying time
are shown in Fig. 6.13. The ductility of the Al6061 decreased as the mechanical alloying
time increased, while the flexural strength of the Al6061 did not change with increasing
mechanical alloying time (Fig. 6.13(a)). As shown in Fig. 6.13(b), the flexural strength
40
45
50
55
60
65
70
75
80
85
90
95
0 1 2 3 4 5
Hard
ness (
HV
)
Experimental conditions
Al6061 Al6061 Mechanical
Alloyed
Al6061-CNT 600˚C
Al6061-CNT 620˚C
Al6061-CNT 640˚C
26.6
%
42.3
%
35.4
%
24.4
%

127
of the Al6061-CNT composite increased as the mechanical alloying time increased due to
the improved CNT dispersion. The addition of CNTs also resulted in decrease of the
ductility. When the mechanical alloying times were less than one hour, however, the
flexural strengths of Al6061-CNT composites were lower than those of the Al6061. The
agglomerated CNT network sites became fracture initiation points, which resulted in
decrease of the flexural strength.
(6.3)
(6.4)
where and are the flexural stress (MPa) and flexural strain, respectively; P is the
load (N); L is the support span (mm), b and d is the width and depth of the sample (mm),
respectively; and D is the deflection of the center of the sample (mm).
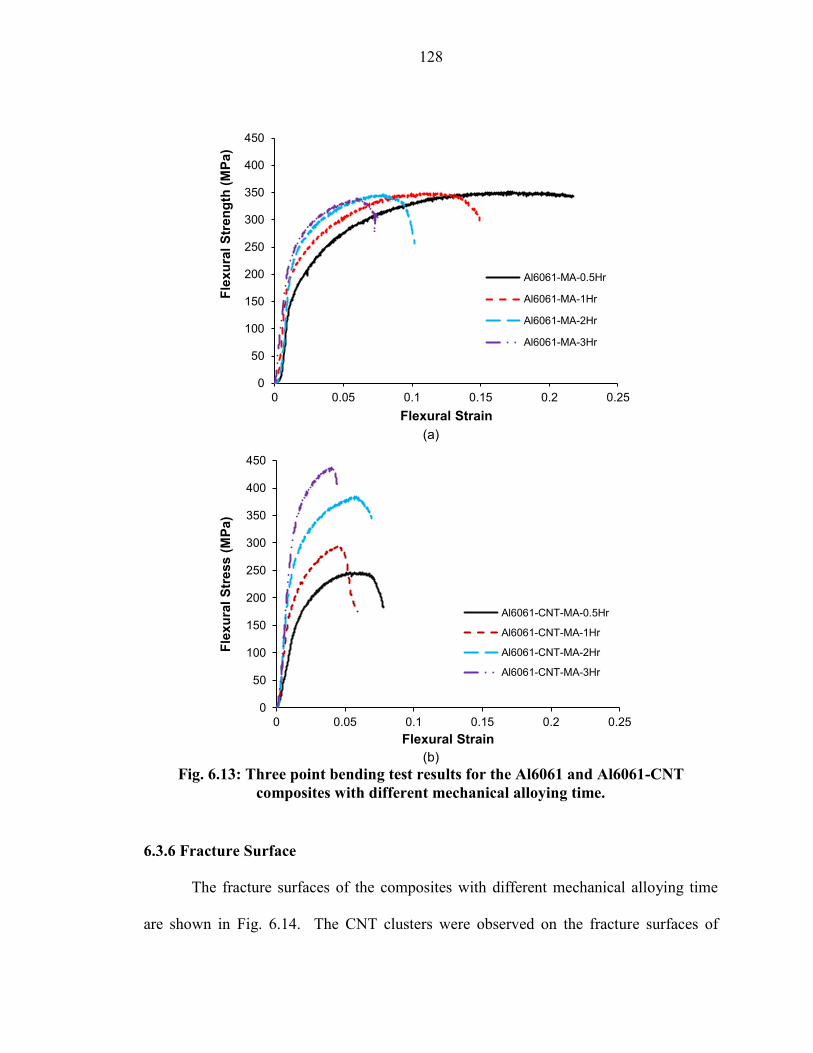
128
(a)
(b)
Fig. 6.13: Three point bending test results for the Al6061 and Al6061-CNT
composites with different mechanical alloying time.
6.3.6 Fracture Surface
The fracture surfaces of the composites with different mechanical alloying time
are shown in Fig. 6.14. The CNT clusters were observed on the fracture surfaces of
0
50
100
150
200
250
300
350
400
450
0 0.05 0.1 0.15 0.2 0.25
Fle
xu
ral
Str
en
gth
(M
Pa)
Flexural Strain
Al6061-MA-0.5Hr
Al6061-MA-1Hr
Al6061-MA-2Hr
Al6061-MA-3Hr
0
50
100
150
200
250
300
350
400
450
0 0.05 0.1 0.15 0.2 0.25
Fle
xu
ral
Str
ess (
MP
a)
Flexural Strain
Al6061-CNT-MA-0.5Hr
Al6061-CNT-MA-1Hr
Al6061-CNT-MA-2Hr
Al6061-CNT-MA-3Hr

129
Al6061-CNT sample that had been mechanically alloyed for 0.5 hour (Fig. 6.14(b)).
After three hours of mechanical alloying, the CNTs were well-dispersed, and single
CNTs were found on the fracture surfaces (Fig. 6.14(d)). Ductile fracture surfaces were
observed in the Al6061-CNT composite that have been mechanical alloyed for 0.5 hour
(Fig. 6.14(a)). However, after three hours of mechanical alloying, fracture surfaces
contained numerous flat regions (Fig. 6.14(c)).
Fig. 6.14: Fracture surfaces of the samples: (a) and (b) are Al6061-CNT composite
mechanically alloyed for 0.5 hr; (c) and (d) are Al6061-CNT composite mechanically
alloyed for 3 hrs. T=640C.
(a) (b)
(d) (c)
CNT clusters
Single CNTs
130
As shown in Fig. 6.15, layered fracture surfaces having flat regions were also
observed for composite processed with different temperatures. The thicknesses of these
regions in Fig. 6.15(a) and (b) were about 10 µm. As shown in Fig. 6.16, the thickness of
mechanically alloyed particles, which had flat surfaces, was around 10 µm. This
indicated that the observed layer in Fig. 6.15(b) corresponded to the mechanically alloyed
Al6061-CNT particles, and the composite fractured through these particle boundaries.
The flat areas were observed much more for Al6061-CNT composite processes at 600C,
and dispersed CNTs were found in these areas (see Fig. 6.15(c) and (d)). It confirmed the
effectiveness of CNT dispersion by mechanical alloying, but the dispersed CNTs still
remained close to the original particle surface rather than penetrating deep into the matrix
particle.

131
Fig. 6.15: SEM images of the fracture surfaces: (a) and (b) Al6061-CNT 620C
composite; and (c) and (d) Al6061-CNT 600C composite. Powder mechanical
alloying time: 3 hrs.
(b) (a)
(c) (d)
Flat area
Layers
Layers
10µm
Layers

132
Fig. 6.16: Al6061-CNT powders mechanically alloyed for 3 hours.
6.3.7 Compositional Analysis
As shown in Fig. 6.17, the XRD pattern of Al6061-CNT composite showed the
presence of spinel (Al2MgO4), aluminum carbide (Al4C3), carbon nanotubes, Mg2Si, and
aluminum. Aluminum oxide (Al2O3) may be present on the Al6061 particle surface or
formed during the heating process. During the synthesis, the surface oxide layer is
broken-down by applied pressure, while the Al2O3 is reduced by the reaction mechanism
in Eqn. (6.5) (Lumley, Sercombe et al. 1999). Sreekumar et al. studied the
thermodynamics and kinetics of the formation of Al2O3/ MgAl2O4/MgO in the Al-Mg-Si
system (Sreekumar, Ravi et al. 2008). The results showed that for the Mg and Si levels in
the Al6061, Al2MgO4 was preferred over either Al2O3 or MgO. Other studies also
showed that at Mg levels less than 4%, the formation of spinel was favored (Mcleod 1990;
Mcleod and Gabryel 1992; Lumley, Sercombe et al. 1999), while MgO was likely to
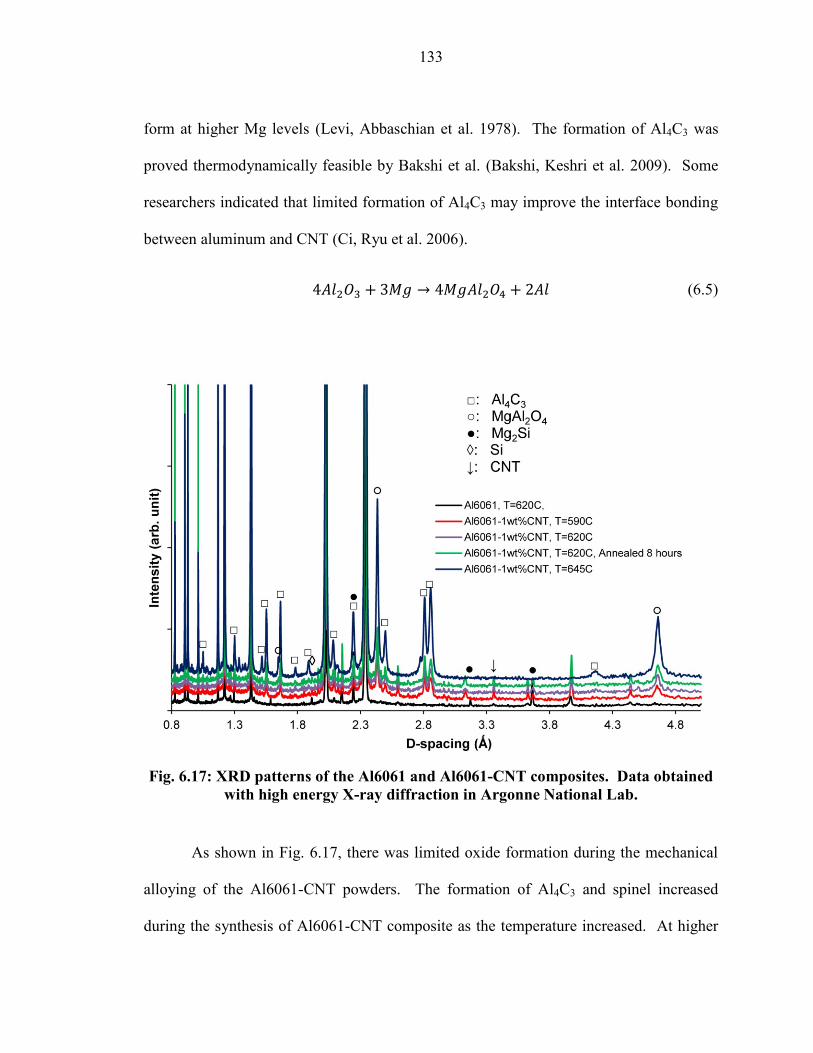
133
form at higher Mg levels (Levi, Abbaschian et al. 1978). The formation of Al4C3 was
proved thermodynamically feasible by Bakshi et al. (Bakshi, Keshri et al. 2009). Some
researchers indicated that limited formation of Al4C3 may improve the interface bonding
between aluminum and CNT (Ci, Ryu et al. 2006).
(6.5)
Fig. 6.17: XRD patterns of the Al6061 and Al6061-CNT composites. Data obtained
with high energy X-ray diffraction in Argonne National Lab.
As shown in Fig. 6.17, there was limited oxide formation during the mechanical
alloying of the Al6061-CNT powders. The formation of Al4C3 and spinel increased
during the synthesis of Al6061-CNT composite as the temperature increased. At higher

134
temperature (T=645˚C) the CNT was depleted for the formation of carbides in the
composites.
6.3.8 Prediction of the Material Strength
The strength of the material can be estimated with Eqn. (6.6) (Bakshi, Lahiri et al.
2010):
(6.6)
where, Vf and Vm are the volume fractions of the carbon nanotube and matrix,
respectively; σf and σm are strengths of the carbon nanotube and the matrix, respectively; l
is the length of the carbon nanotube; and lc is the critical length for the carbon nanotube.
Two underlying assumptions of this equation are that the CNTs are fully dispersed in the
composite and the bonding between the CNTs and the matrix is perfect. Thus, this
equation will typically over-predict the strength of a composite. In this work, a modified
equation was used:
(6.7)
where, two new parameters, the interfacial bonding coefficient (α) and the CNT
dispersion parameter (d), were introduced. The α parameter is primarily affected by the
interfacial bonding and reaction, which is difficult to measure; d ranges between 0 (no
dispersion) and 1 (complete dispersion). When CNTs are agglomerated, the fibers add no
strength to the overall composite strength. A value for d is estimated from Eqn. (6.8),
where the difference of dark area fraction in Al6061-CNT composite and Al6061 without
135
CNTs is assumed to correlate to the CNT dispersion state in the composite. The
following equation was used to predict CNT dispersion, d:
(6.8)
where, t is the mechanical alloying time; a=57.9 and b=0.054 are fitting parameters. The
length of CNT was observed to decrease as mechanical alloying progressed. The CNT
lengths were estimated to be 2.1, 1.7, 1.3, and 1.15 µm at mechanical alloying times of
0.5,1, 2, and 3 hours. The CNT lengths were calculated based on the measured surface
CNT lengths and CNT dispersion as described in Chapter 5. Assuming that the yield
strength (in MPa) of the material is about three times the hardness (in HV), predicted
yield strength is shown in Fig. 6.18. The experimental data agreed with the predicted
yield strength when an interfacial bonding coefficient of 0.58 was used.

136
Fig. 6.18: Yield strength obtained with experiments and prediction for Al6061 with
no CNT content and Al6061-CNT composite.
6.4 Conclusion
In this study, Al6061-1.0 wt.% CNT composite was successfully fabricated by
SPP for the first time. Mechanical alloying was utilized to break down the CNT clusters.
The effects of processing temperature during SPP and mechanical alloying time on the
microstructure, hardness, fracture surface and the composition of the Al6061-CNT
composite were investigated.
The mechanical alloying time determined the dispersion condition of CNTs and
significantly affected the microstructures and mechanical properties of the Al6061-CNT
composite. The length of CNTs decreased from more than 5 µm to less than 1 µm as the
mechanical alloying time increased to three hours due to the high-energy ball mill used in
150
170
190
210
230
250
270
290
310
330
350
0 50 100 150 200
Yie
ld s
trength
(M
Pa)
Mechanical alloying time (mins)
Strength of Al6061 with no CNTs
Strength of Al6061-CNT
Predicted strength: α=1
Predicted strength: α=0.58

137
the experiment. Insufficient mechanical alloying time (0.5 hr) produced agglomerated
CNTs on Al6061 particles. This resulted in non-uniform composite microstructure and
inferior composite strength. As the mechanical alloying time increased (1 hr to 2 hrs),
the CNT dispersion improved, and the resulting composite hardness increased. Adding
1.0 wt.% CNT increased the hardness by 28% when compared with the Al6061
composite without CNTs fabricated under the same condition. Most of the CNT
agglomerations were broken down in the first 2 hours; longer mechanical alloying time
(at 3 hrs) did not improve CNT dispersion and did not contribute to any further hardness
improvement. The resultant grain structure showed severe deformation from the
mechanical alloying process. Nevertheless, an improved dispersion of CNTs and
continuous CNT breakage provided more reaction sites between the CNTs and liquidus
matrix phase, forming Al4C3 and SiC during semi-solid powder processing. The ductility
of the composite also decreased as the mechanical alloying time increased. Moreover, a
modified shear lag model, which included the effects of interfacial bonding and CNT
dispersion, predicted the overall Al6061-CNT composite strength accurately.
Due to cold working from mechanical alloying, pre-compaction of Al6061-CNT
powder at 100 MPa resulted in the rearrangement of particles with relative density of
49.9%. Consolidation with liquid-phase existence at elevated temperatures yielded high
relative density composites above 99%. The highest hardness of 87.5 HV was obtained
from the Al6061-CNT composite consolidated at 620C. At lower temperature of 600C,
relatively lower density and weaker bonding between the matrix phase and CNTs were
obtained because of limited amount of the liquid-phase. The processing temperature also

138
influenced the fracture behavior of the composite. At 640C, ductile fracture surfaces
with dimples were observed; however, at lower temperatures fracture propagation was
more prominent through the original particle boundaries.
The Al6061-CNT specimens were harder than the Al6061 reference samples;
however, it is difficult to know how much of the additional hardness is attributable to the
reinforcing effect of the CNTs and how much may result from the presence of Al4C3, SiC,
spinel, and FeO. There are indications that an appreciable portion of the hardening effect
may have resulted from the presence of the CNTs: (i) the SEM photos show abundant
CNTs on the fracture surfaces, (ii) the aspect ratio of a CNT shortened to about 1 µm is
still 20 to 50, which is presumably large enough to achieve the critical fiber length for
optimal composite strengthening effect, and (iii) the large difference in coefficients of
thermal expansion between CNTs and the Al6061 combined with the SSP would be
expected to produce substantial concentrations of punch-out dislocations in the vicinity of
the CNTs. All three of these factors would promote CNT strengthening in the composite.

139
CHAPTER 7 SUMMARY AND CONTRIBUTIONS
In this section, the conclusions and contributions of the work carried out were
summarized. The major conclusions from each individual work were first introduced in
section 7.1 and the contributions were discussed in section 7.2.
7.1 Summary
In this work, the deformation mechanism of the powders in the semi-solid state
was understood and the potential of SPP on the synthesis of particle and fiber (nanotube)
reinforced MMCs were investigated. The compaction behavior of powder compact with
liquid-phase was analyzed, and the relative density during the compaction process was
modeled. Densification behavior of Al6061-SiC powder mixture in the semi-solid state
was investigated and effects of the SiC volume fraction and Al liquid fraction on the
consolidation behavior were understood. Parametric study was carried out to investigate
the particle reinforcement loading limit by SPP and to understand the compaction
behavior of the ceramic particle-metal powder compact in the semi-solid state. In order
to reveal the change of morphologies of CNTs during mechanical alloying, a
mathematical model was developed to study the effects of welding and fracturing and
CNT dispersion on the length change of CNTs. A set of experiments were performed to
investigate the processing temperature and mechanical alloying time on the synthesis of
CNT reinforced MMCs by SPP. The microstructures, mechanical properties, and
compositions of the Al6061-CNT composites were examined and discussed.
140
The conclusions of individual section are summarized as the following:
7.1.1 Modeling of Semi-solid Powder Processing for a Closed-die Compaction
In this work, the compaction behavior of metallic powders in the semi-solid state
was studied. The SPP at between 550°C and 630°C was modeled by Shima-Oyane
model when liquid fraction is relative low (<20%). In the model, friction effects during
the compaction process were considered. The relative density and the density
distribution in the axial direction were modeled and verified with experimental
results. The following conclusions can be drawn:
1. The relative density and density distribution in the axial direction during SPP
were can be successfully modeled when liquid fraction was low (<20%) and
the model matched the experimental results well.
2. Liquid fraction was able to affect the Poisson’s ratio and therefore the
parameters for the model have to be modified at different temperature.
3. When liquid fraction was high (>20%), the Shima-Oyane model was not
applicable. Four stages during SPP with high liquid fraction, i.e., liquid
material squeezing out, deforming of irregular solid arms, rupturing of trapped
liquid and densification, were identified and discussed.
4. The normalized pressure-relative density curves for temperature between
550°C and 630°C merged into a single one because the major supporting
phase is the solid and the deformation behavior of the solid-phase did not
change significantly.

141
7.1.2 Densification behavior of Al6061 and SiC binary powder mixture in semi-solid
state
The compaction behavior of Al6061-SiC powder mixture with 0-60 vol.% SiC
reinforcement at elevated temperatures involving liquid-phase were investigated. The
temperature ranged from 550°C to 660°C where the liquid fraction of Al6061 ranged
from 0 to 100%. The reinforcement factor KR and liquid factor KL was studied and the
following conclusions can be drawn:
1. The reinforcement factor KR was significantly affected by the Al6061 liquid
fraction and the SiC volume fraction. When the SiC volume fraction is low
(<30%), the reinforcement factor KR was similar across all liquid fraction
range, while KR was higher when fL>10% was greater than 10%.
2. When the SiC volume fraction was high (>30%), the Al6061 liquid fraction
determined the starting value of KR.
3. The temperature factor KT decreased as the liquid fraction of Al6061 increased
and it is only dependent on the liquid fraction of Al6061 (temperature).
7.1.3 Fabrication of Al6061 Composite with High SiC Particle Loading by Semi-
solid Powder Processing
In this work, high volume fraction SiC reinforced Al6061 composites were
fabricated with SPP. The compaction mechanism of the Al6061-SiC composite was
discussed and the SiC loading limit was also analyzed. The effects of the reinforcement
particle size, matrix particle size, reinforcement loading volume and pressure on the

142
microstructure and mechanical properties were investigated. Based on the result of the
parametric study, the following conclusions can be drawn.
1. SiC was the major phase that takes the compaction pressure. Al6061 phase
was pressed to fill in the pores created by the SiC structure.
2. The maximum SiC loading in Al6061 can be estimated with data from SiC-
only compaction tests. Higher SiC loading limit was obtained for larger SiC
particles and higher compaction pressure.
3. The relative size of the initial Al6061 and SiC particles had significant effect
on the microstructure, hardness and fracture surface of the composite. Non-
uniform microstructure was obtained when the reinforcement particles were
smaller than those of the matrix phase. This resulted in local variations in
hardness and fracture surfaces. On the other hand, dense composite with
smaller SiC particles resulted in higher hardness and uniform microstructures
free of micro-cracks.
7.1.4 Mechanical Alloying of Carbon Nanotube and Al6061 Powder for Metal-CNT
Composite
A mathematical model was developed to predict the overall CNT length and
length distribution during mechanical alloying for the first time, while experiments were
conducted to assist the prediction of overall CNT length. The effects of welding and
fracturing of the CNTs and aluminum particles were better understood. The findings of
this work can be concluded as the following:

143
1. The CNT length decreased significantly during mechanical alloying. Severe
CNT length reduction occurred (from 4.24 μm to 1.69 μm) in the first several
minutes due to the crushing of CNT agglomeration balls. After that, the
length of CNTs decreased slowly to 1.16 μm.
2. The welding and fracturing of Al6061 particles and the dispersion of CNTs
affected the overall CNT length. The model predicted that no further change
occurred in the overall CNT length during time greater than one hour of
mechanical alloying because most of the CNTs had already become embedded
within the particles and were thus protected from further milling media
impacts. A faster dispersion of CNTs and lower particle fracturing rate may
help preserve the original CNTs.
7.1.5 Carbon Nanotube Reinforced Aluminum Composite Fabricated by Semi-solid
Powder Processing
Al6061-1.0 wt.% CNT composite was fabricated by SPP in this work.
Mechanical alloying was utilized to break down the CNT clusters. The effects of
processing temperature during SPP and mechanical alloying time on the microstructure,
hardness, fracture surface and the composition of the Al6061-CNT composite were
investigated. Based on the parametric experimental work, we can draw the following
conclusions:
1. The mechanical alloying time determined the dispersion condition of CNTs
and significantly affected the microstructures and mechanical properties of the
Al6061-CNT composite. Longer mechanical alloying time produced better

144
CNT dispersion and hence a more uniform composite microstructure and
preferred composite strength.
2. The CNT agglomerates were mostly broken down in the first 2 hours and
longer mechanical alloying time (at 3 hrs) did not improve CNT dispersion
and did not contribute to any further hardness improvement. The resultant
grain structure showed severe deformation from the mechanical alloying
process.
3. An improved dispersion of CNTs and continuous CNT breakage provided
more reaction sites between the CNTs and liquidus matrix phase, forming
Al4C3 and SiC during semi-solid powder processing. The ductility of the
composite also decreased as the mechanical alloying time increased.
4. A modified shear lag model, which included the effects of interfacial bonding
and CNT dispersion, predicted the overall Al6061-CNT composite strength
accurately.
5. The highest hardness of 87.5 HV was obtained from the Al6061-CNT
composite consolidated at 620C. At 600C, relatively lower density and
weaker bonding was observed between the matrix phase and CNTs, and the
fracture propagation was more prominent through the original particle
boundaries.

145
7.2 Scientific Contributions
Major scientific contributions of the dissertation may be summarized as the
following:
1. The compaction behavior of metallic powder containing both solid and liquid-
phases was modeled for the first time. The model was able to effectively
capture the yielding of the semi-solid powder compact and accurately predict
the relative density change during the compaction process with relatively low
liquid fraction (<20%). The deformation mechanism of metal powder
compact during SPP with high liquid fraction (>20%) was understood.
2. The densification behaviors of SiC reinforced Al6061 powder compact in
semi-solid state was understood. The effects of volume fraction of SiC and
Al6061 liquid fraction on the densification behavior were revealed.
3. The reinforcement loading limit of the Al6061-SiC composite was identified.
High density composite with high SiC loading was successfully fabricated by
SPP, and the effects of experimental parameters on the samples were revealed.
4. A mathematical model was developed to predict the overall CNT length
during mechanical alloying and to understand the effects of welding and
fraction and CNT dispersion on the morphologies of the CNTs.
5. CNT reinforced Al6061 composites were successfully fabricated with SPP.
The effects of temperature and mechanical alloying time on the fabrication
process as well as the final composite were studied. The mechanical property
(hardness) of the composite was able to be predicted with a shear lag model.

146
7.3 Acknowledgements
I greatly appreciate the financial supports from National Science Foundation
under grant number CMMI-1030120 and from Ames Laboratory of US Department of
Energy under contract number DE-AC02-07CH11358.

147
BIBLIOGRAPHY
Backman, D. G. (1977). "Die thermal behavior in machine casting of partially solid high
temperature alloys." Metallurgical transactions. B, Process metallurgy, 8(3), pp.
471-477.
Bakshi, S. R., A. K. Keshri, et al. (2009). "Interface in carbon nanotube reinforced
aluminum silicon composites: Thermodynamic analysis and experimental
verification." Journal of Alloys and Compounds, 481(1-2), pp. 207-213.
Bakshi, S. R., D. Lahiri, et al. (2010). "Carbon nanotube reinforced metal matrix
composites - a review." International Materials Reviews, 55(1), pp. 41-64.
BCC_Research (2009). Metal matrix composites: the global market.
Benjamin, J. S. (1980). "Mechanical Alloying." Powder Metallurgy International, 12(1),
pp. 43-43.
Benjamin, J. S. (1992). "Fundamentals of Mechanical Alloying." Mechanical Alloying,
88, pp. 1-17.
Benjamin, J. S. and T. E. Volin (1974). "Mechanism of Mechanical Alloying."
Metallurgical Transactions, 5(8), pp. 1929-1934.
Bouvard, D. (1993). "Modelling the densification of powder composites by power law
creep." Acta Metallurgica Et Materialia, 41(5), pp. 1413-1420.
Brewin, P. R., O. Coube, et al. (2008). Modelling of powder die compaction. London,
Springer.
Candan, E., H. Ahlatci, et al. (2001). "Abrasive wear behaviour of Al–SiC composites
produced by pressure infiltration technique." Wear, 247(2), pp. 133-138.

148
Cerit, A. A., M. B. Karamis, et al. (2008). "Effect of Reinforcement Particle Size and
Volume Fraction on Wear Behaviour of Metal Matrix Composites." Journal of
the Balkan Tribological Association, 14(4), pp. 482-489.
Chawla, N., J. Jones, et al. (1998). "Effect of SiC volume fraction and particle size on the
fatigue resistance of a 2080 Al/SiC p composite." Metallurgical and Materials
Transactions A, 29(11), pp. 2843-2854.
Chen, C. M., C. C. Yang, et al. (2004). "Thixocasting of hypereutectic Al-25Si-2.5Cu-
1Mg-0.5Mn alloys using densified powder compacts." Materials Science and
Engineering A, 366(1), pp. 183-194.
Chen, C. M., C. C. Yang, et al. (2005a). "Dry sliding wear behaviors of Al-25Si-2.5Cu-
1Mg alloys prepared by powder thixocasting." Materials Science and Engineering
A, 397(1-2), pp. 178-189.
Chen, C. M., C. C. Yang, et al. (2005b). "A novel method for net-shape forming of
hypereutectic Al-Si alloys by thixocasting with powder preforms." Journal of
Materials Processing Technology, 167(1), pp. 103-109.
Cho, K.-M., I.-D. Choi, et al. (2004). "Thermal properties and fracture behavior of
compositionally graded Al-SiCp composites." Materials Science Forum, 449-
452(1), pp. 621-624.
Ci, L. J., Z. Y. Ryu, et al. (2006). "Investigation of the interfacial reaction between multi-
walled carbon nanotubes and aluminum." Acta Materialia, 54(20), pp. 5367-5375.
Cooper, A. R. and L. E. Eaton (1962). "Compaction Behavior of Several Ceramic
Powders." Journal of the American Ceramic Society, 45(3), pp. 97-101.

149
Corbin, S. F. (1999). "Functionally graded metal/ceramic composites by tape casting,
lamination and infiltration." Materials science & engineering. A, Structural
materials, 262(1), pp. 192-203.
Davis, R. M., B. Mcdermott, et al. (1988). "Mechanical Alloying of Brittle Materials."
Metallurgical Transactions a-Physical Metallurgy and Materials Science, 19(12),
pp. 2867-2874.
Deng, C. F., D. Z. Wang, et al. (2007). "Processing and properties of carbon nanotubes
reinforced aluminum composites." Materials Science and Engineering a-
Structural Materials Properties Microstructure and Processing, 444(1-2), pp.
138-145.
Deng, C. F., X. X. Zhang, et al. (2007). "Preparation and characterization of carbon
nanotubes/aluminum matrix composites." Materials Letters, 61(8-9), pp. 1725-
1728.
Denny, P. J. (2002). "Compaction equations: a comparison of the Heckel and Kawakita
equations." Powder Technology, 127(2), pp. 162-172.
El Wakil, S. D. (1992). "Extrusion of P/M composites in the semi-solid state."
International Journal of Powder Metallurgy, 28(2), pp. 175-182.
Esawi, A. and K. Morsi (2007). "Dispersion of carbon nanotubes (CNTs) in aluminum
powder." Composites Part A Applied Science and Manufacturing, 38(2), pp. 646-
650.
Everitt, B. and D. J. Hand (1981). Finite mixture distributions, Chapman and Hall.
Fan, T. (1998). "The interfacial reaction characteristics in SiC/Al composite above
liquidus during remelting." Materials science and engineering B, 257(2), pp. 281.

150
Fleck, N. A., L. T. Kuhn, et al. (1992). "Yielding of Metal-Powder Bonded by Isolated
Contacts." Journal of the Mechanics and Physics of Solids, 40(5), pp. 1139-1162.
Fogagnolo, J. B., M. H. Robert, et al. (2006). "Mechanically alloyed AlN particle-
reinforced Al-6061 matrix composites: Powder processing, consolidation and
mechanical strength and hardness of the as-extruded materials." Materials Science
and Engineering a-Structural Materials Properties Microstructure and
Processing, 426(1-2), pp. 85-94.
Fuentes, J. J., J. A. Rodriguez, et al. (2003). "Effect of Mg as sintering additive on the
consolidation of mechanically alloyed Al powder." Thermec'2003, Pts 1-5, 426-4,
pp. 4331-4336.
Giannattasio, A., S. Senkader, et al. (2004). "The role of prismatic dislocation loops in
the generation of glide dislocations in Cz-silicon." Computational Materials
Science, 30(1-2), pp. 131-136.
Gunasekera, J. S. (1993). "Development of a Constitutive Model for Mushy (Semisolid)
Materials." Proceedings of the Second International Conference on the Semi-
Solid Processing of Alloys and Composites, pp. 211-222.
Gunasekera, J. S. and Z. Z. Zhou (1997). "Mechanics of semi-solid material." Epd
Congress 1997, pp. 733-743.
Guo, M. L. T. and C. Y. A. Tsao (2000). "Tribological behavior of self-lubricating
aluminium/SiC/graphite hybrid composites synthesized by the semi-solid powder-
densification method." Composites Science and Technology, 60(1), pp. 65-74.
Hafizpour, H. R. (2008). "Investigation on compressibility of Al-SiC composite
powders." Powder Metallurgy, 51(3), pp. 217-223.

151
Hamilton, R. W., Z. Zhu, et al. (2003). "Direct semi-solid forming of a powder SiC-A1
PMMC: Flow analysis." Composites Part A: Applied Science and Manufacturing,
34(4), pp. 333-339.
Hatch, J. E. (1984). Aluminum: Properties and physical metallurgy. Metals Park, Ohio,
American Society for Metals.
He, C. N., N. Q. Zhao, et al. (2007). "An approach to obtaining homogeneously dispersed
carbon nanotubes in Al powders for preparing reinforced Al-matrix composites."
Advanced Materials, 19(8), pp. 1128-1132.
Ibrahim, I. A., F. A. Mohamed, et al. (1991). "Particulate reinforced metal matrix
composites — a review." Journal of Materials Science, 26(5), pp. 1137-1156.
Iijima, S. (1991). "Helical microtubules of graphitic carbon." Nature, 354(6348), pp. 56-
56.
Ilegbusi, O. J. and M. W. Ballas (1999). "A hybrid constitutive model for semi-solid
alloy slurries." Journal of Materials Processing & Manufacturing Science, 8(1),
pp. 18-33.
Jeng, S.-C. and S.-W. Chen (1997). "The solidification characteristics of 6061 and A356
aluminum alloys and their ceramic particle-reinforced composites." Acta
Materialia, 45(12), pp. 4887-4899.
Jeong, Y. G., M. H. Seo, et al. (2005). "Mechanical modelling of carbon nanotube
reinforced metal matrix composites." Metastable, Mechanically Alloyed and
Nanocrystalline Materials, 24-25, pp. 383-386.

152
Kaczmar, J. W., K. Pietrzak, et al. (2000). "The production and application of metal
matrix composite materials." Journal of Materials Processing Technology, 106(1-
3), pp. 58-67.
Kainer, K. U., Ed. (2006). Metal Matrix Composites. Custom-made Materials for
Automotive and Aerospace Engineering. Weinheim, WILEY.
Kang, C. G. and H. K. Jung (1999). "Finite element analysis with deformation behavior
modeling of globular microstructure in forming process of semi-solid materials."
International Journal of Mechanical Sciences, 41(12), pp. 1423-1445.
Kawasaki, A. (1997). "Concept and P/M fabrication of functionally gradient materials."
Ceramics international, 23(1), pp. 73-83.
Kim, G.-Y., M. Koc, et al. (2007). "Modeling of the semi-solid material behavior and
analysis of micro-/mesoscale feature forming." Journal of Manufacturing Science
and Engineering, Transactions of the ASME, 129(2), pp. 237-245.
Kim, G.-Y., J. Ni, et al. (2007). "An experimental investigation on semi-solid forming of
micro/meso-scale features." Journal of Manufacturing Science and Engineering,
Transactions of the ASME, 129(2), pp. 246-251.
Kim, K. T., J. H. Cho, et al. (2000). "Cold Compaction of Composite Powders." Journal
of Engineering Materials and Technology, 122(1), pp. 119-128.
Kim, W. Y., C. G. Kang, et al. (2007). "The effect of the solid fraction on rheological
behavior of wrought aluminum alloys in incremental compression experiments
with a closed die." Materials Science and Engineering: A, 447(1-2), pp. 1-10.
Koch, C. C. (1989). "Materials Synthesis by Mechanical Alloying." Annual Review of
Materials Science, 19(1), pp. 121-143.

153
Kouzeli, M., L. Weber, et al. (2001). "Influence of damage on the tensile behaviour of
pure aluminium reinforced with ≥ 40 vol. pct alumina particles." Acta
Materialia, 49(18), pp. 3699-3709.
Kumar, P., C. Martin, et al. (1993). "Shear rate thickening flow behavior of semisolid
slurries." Metallurgical and Materials Transactions A, 24(5), pp. 1107-1116.
Kumar, P., C. L. Martin, et al. (1994). "Constitutive Modeling and Characterization of the
Flow Behavior of Semisolid Metal Alloy Slurries .1. The Flow Response." Acta
Metallurgica Et Materialia, 42(11), pp. 3595-3602.
Kwon, H., M. Estili, et al. (2009). "Combination of hot extrusion and spark plasma
sintering for producing carbon nanotube reinforced aluminum matrix
composites." Carbon, 47(3), pp. 570-577.
Lange, F. F., L. Atteraas, et al. (1991). "Deformation consolidation of metal powders
containing steel inclusions." Acta Metallurgica Et Materialia, 39(2), pp. 209-219.
Lee, H. S. and S. H. Hong (2003). "Pressure infiltration casting process and
thermophysical properties of high volume fraction SiC p / Al metal matrix
composites." Materials Science and Technology, 19(8), pp. 1057-1064.
Lee, H. S., K. Y. Jeon, et al. (2000). "Fabrication process and thermal properties of
SiCp/Al metal matrix composites for electronic packaging applications." Journal
of Materials Science, 35(24), pp. 6231-6236.
Lee, J. C. (1997). "Effect of various processing methods on the interfacial reactions in
SiCp/2024 Al composites." Acta Materialia, 45(12), pp. 5303.
154
Lee, S. C. and K. T. Kim (2002). "Densification behavior of aluminum alloy powder
under cold compaction." International Journal of Mechanical Sciences, 44(7), pp.
1295-1308.
Levi, C. G., G. J. Abbaschian, et al. (1978). "Interface Interactions during Fabrication of
Aluminum Alloy-Alumina Fiber Composites." Metallurgical Transactions a-
Physical Metallurgy and Materials Science, 9(5), pp. 697-711.
Li, H. Q., A. Misra, et al. (2009). "Processing and characterization of nanostructured Cu-
carbon nanotube composites." Materials Science and Engineering a-Structural
Materials Properties Microstructure and Processing, 523(1-2), pp. 60-64.
Liao, J.-z., M.-J. Tan, et al. "Spark plasma sintered multi-wall carbon nanotube
reinforced aluminum matrix composites." Materials & Design, In Press,
Corrected Proof.
Lim, D. K., T. Shibayanagi, et al. (2009). "Synthesis of multi-walled CNT reinforced
aluminium alloy composite via friction stir processing." Materials Science and
Engineering A, 507(1-2), pp. 194-199.
Lin, C. Y. (1999). "Production of silicon carbide Al 2124 alloy functionally graded
materials by mechanical powder metallurgy technique." Powder metallurgy,
42(1), pp. 29-33.
Lindroos, V. K. and M. J. Talvitie (1995). "Recent advances in metal matrix composites."
Journal of Materials Processing Technology, 53(1-2), pp. 273-284.
Lou, B. Y., J. C. Huang, et al. (2002). "Flow behaviour of aluminium-based materials at
ultrahigh temperatures in the presence of a liquid phase." Materials Transactions,
43(3), pp. 501-509.

155
Lumley, R., T. Sercombe, et al. (1999). "Surface oxide and the role of magnesium during
the sintering of aluminum." Metallurgical and Materials Transactions A, 30(2),
pp. 457-463.
Luo, S.-J., Y.-S. Cheng, et al. (2006). "Pseudo-semi-solid thixoforging of cup shell with
Al/Al2O3." Transactions of Nonferrous Metals Society of China (English
Edition), 16(4), pp. 772-775.
Luo, S., Y. Cheng, et al. (2005). "Ceramics matrix composites thixoforming in pseudo-
semi-solid state and the preliminary experimental study." Chinese Journal of
Materials Research, 19(1), pp. 107-112.
Martin, C. L., O. Lame, et al. (2000). "Cohesion and dilatation of powder compacts
containing hard phase particles under highly deviatoric stress states." Mechanics
of Materials, 32(7), pp. 405-421.
Maurice, D. and T. H. Courtney (1994). "Modeling of Mechanical Alloying .1.
Deformation, Coalescence, and Fragmentation Mechanisms." Metallurgical and
Materials Transactions a-Physical Metallurgy and Materials Science, 25(1), pp.
147-158.
Maurice, D. and T. H. Courtney (1995a). "Modeling of Mechanical Alloying .2.
Development of Computational Modeling Programs." Metallurgical and
Materials Transactions a-Physical Metallurgy and Materials Science, 26(9), pp.
2431-2435.
Maurice, D. and T. H. Courtney (1995b). "Modeling of Mechanical Alloying .3.
Applications of Computational Programs." Metallurgical and Materials
Transactions a-Physical Metallurgy and Materials Science, 26(9), pp. 2437-2444.

156
Mcleod, A. D. (1990). "Kinetics of the Growth of Spinel, Mgal2o4, in Alumina-
Containing Aluminum-Magnesium Alloy Matrix Composites." Fabrication of
Particulates Reinforced Metal Composites, pp. 17-21.
Mcleod, A. D. and C. M. Gabryel (1992). "Kinetics of the Growth of Spinel, Mgal2o4, on
Alumina Particulate in Aluminum-Alloys Containing Magnesium." Metallurgical
Transactions a-Physical Metallurgy and Materials Science, 23(4), pp. 1279-1283.
Miserez, A., R. Muller, et al. (2004). "Particle reinforced metals of high ceramic content."
Materials Science and Engineering a-Structural Materials Properties
Microstructure and Processing, 387-89, pp. 822-831.
Montanari, R., V. Tagliaferri, et al. (2009). Metal matrix composite: structure and
technologies.
Morsi, K. and A. Esawi (2007). "Effect of mechanical alloying time and carbon nanotube
(CNT) content on the evolution of aluminum (Al)–CNT composite powders."
Journal of Materials Science, 42(13), pp. 4954-4959.
Morsi, K., A. M. K. Esawi, et al. (2010). "Spark plasma extrusion (SPE) of ball-milled
aluminum and carbon nanotube reinforced aluminum composite powders."
Composites Part a-Applied Science and Manufacturing, 41(2), pp. 322-326.
Noguchi, T., A. Magario, et al. (2004). "Carbon nanotube/aluminium composites with
uniform dispersion." Materials Transactions, 45(2), pp. 602-604.
Panelli, R. and F. Ambrozio Filho (2001). "A study of a new phenomenological
compacting equation." Powder Technology, 114(1-3), pp. 255-261.

157
Pech-Canul, M. I. (2002). "Effect of processing parameters on the production of bilayer-
graded Al/SiCp composites by pressureless infiltration." Materials letters, 56(4),
pp. 460-464.
Pech-Canul, M. I., E. E. Parras-Medecigo, et al. (2002). Effect of processing parameters
on the formation of composite-composite interfaces in bilayer Al/SiCp composites.
Conference Proceedings from Materials Solutions 2002: 203-208.
Perez-Bustamante, R., C. D. Gomez-Esparz, et al. (2009). "Microstructural and
mechanical characterization of Al-MWCNT composites produced by mechanical
milling." Materials Science and Engineering a-Structural Materials Properties
Microstructure and Processing, 502(1-2), pp. 159-163.
Pham, Q., S. C. Yoon, et al. (2007). "Multi-scale modelling scheme for carbon nanotube
reinforced metal matrix composites." Mechanical Behavior of Materials X, Pts
1and 2, 345-346, pp. 1261-1264.
Poirier, D., R. Gauvin, et al. (2009). "Structural characterization of a mechanically milled
carbon nanotube/aluminum mixture." Composites Part a-Applied Science and
Manufacturing, 40(9), pp. 1482-1489.
Prater, W. L. (2006). "Comparison of ceramic material effects on the flexural Weibull
statistics and fracture of high volume fraction particle reinforced aluminum."
Materials Science and Engineering a-Structural Materials Properties
Microstructure and Processing, 420(1-2), pp. 187-198.
Qin, S., C. Chen, et al. (1999). "The effect of particle shape on ductility of SiCp
reinforced 6061 Al matrix composites." Materials Science and Engineering A,
272, pp. 363-370.

158
Quang, P., Y. G. Jeong, et al. (2007). "Consolidation of 1 vol. % carbon nanotube
reinforced metal matrix nanocomposites via equal channel angular pressing."
Journal of Materials Processing Technology, 187, pp. 318-320.
Ramakrishnan, N. (1996). "An analytical study on strengthening of particulate reinforced
metal matrix composites." Acta Materialia, 44(1), pp. 69-77.
Shima, S. and M. Oyane (1976). "Plasticity Theory for Porous Metals." International
Journal of Mechanical Sciences, 18(6), pp. 285-291.
Song, D. H., Y. H. Park, et al. (2007). "Thermomechanical properties of functionally
graded Al-SiCp composites." Materials Science Forum, 534-536, pp. 1565-1568.
Spencer, D., R. Mehrabian, et al. (1972). "Rheological behavior of Sn-15 pct Pb in the
crystallization range." Metallurgical and Materials Transactions B, 3(7), pp.
1925-1932.
Sreekumar, V. M., K. R. Ravi, et al. (2008). "Thermodynamics and kinetics of the
formation of Al2O3/MgAl2O4/MgO in al-silica metal matrix composite."
Metallurgical and Materials Transactions a-Physical Metallurgy and Materials
Science, 39A(4), pp. 919-933.
Sridhar, I. and N. A. Fleck (2000). "Yield behaviour of cold compacted composite
powders." Acta Materialia, 48(13), pp. 3341-3352.
Steinhoff, K., U. Weidig, et al. (2004). "Micro semi-solid manufacturing - A new
technological approach towards miniaturisation." Steel Research International,
75(8-9), pp. 611-619.
Storåkers, B., N. A. Fleck, et al. (1999). "The viscoplastic compaction of composite
powders." Journal of the Mechanics and Physics of Solids, 47(4), pp. 785-815.
159
Svoboda, J., H. Riedel, et al. (1996). "A model for liquid phase sintering." Acta
Materialia, 44(8), pp. 3215-3226.
Tham, L. M., M. Gupta, et al. (2001). "Effect of limited matrix-reinforcement interfacial
reaction on enhancing the mechanical properties of aluminium-silicon carbide
composites." Acta Materialia, 49(16), pp. 3243-3253.
Wang, L., H. Choi, et al. (2009). "Mechanical alloying of multi-walled carbon nanotubes
and aluminium powders for the preparation of carbon/metal composites." Carbon,
47(15), pp. 3427-3433.
Watari, F. (1997). "Fabrication and properties of functionally graded dental implant."
Composites. Part B, Engineering, 28(1), pp. 5-11.
Wen, C. E. (2001). "Fabrication of TiAl by blended elemental powder semisolid
forming." Journal of Materials Science, 36(7), pp. 1741-1745.
Wildgoose, G. G., C. E. Banks, et al. (2006). "Chemically Modified Carbon Nanotubes
for Use in Electroanalysis." Microchimica Acta, 152(3), pp. 187-214.
Wu, Y. (2009). Fabrication of graded structures in SiC-reinforced metal matrix by
semisolid powder processing. Proceedings of the ASME International
Manufacturing Science and Engineering Conference 2009.
Wu, Y. and G.-Y. Kim (2011a). "Carbon nanotube reinforced aluminum composite
fabricated by semi-solid powder processing." Journal of Materials Processing
Technology, 211(8), pp. 1341-1347.
Wu, Y. and G.-Y. Kim (2011b). "Compaction behavior of Al6061 powder in the semi-
solid state." Powder Technology, 214(2), pp. 252-258.
160
Wu, Y., G.-Y. Kim, et al. (2010a). "Fabrication of Al6061 composite with high SiC
particle loading by semi-solid powder processing." Acta Materialia, 58(13), pp.
4389-4405.
Wu, Y., G.-Y. Kim, et al. (2010b). "Experimental Study on Viscosity and Phase
Segregation of Al--Si Powders in Microsemisolid Powder Forming." Journal of
Manufacturing Science and Engineering, Transactions of the ASME, 132(1), pp.
011003-011007.
Wu, Y., G.-Y. Kim, et al. (2011). "Effects of mechanical alloying on the Al6061-CNT
composite fabricated by semi-solid powder processing." Materials Science and
Engineering A, Submitted.
Xie, C. L., M. Hailat, et al. (2007). "Development of short fiber-reinforced NiTi/Al6061
composite." Journal of Engineering Materials and Technology-Transactions of
the Asme, 129(1), pp. 69-76.
Xu, C. L., B. Q. Wei, et al. (1999). "Fabrication of aluminum-carbon nanotube
composites and their electrical properties." Carbon, 37(5), pp. 855-858.
Yasue, K. (2000). "Elemental blended powders semisolid forming of Ti-Al based alloys."
Journal of Materials Science, 35(23), pp. 5927-5932.
Young, R. M. K. and T. W. Clyne (1986a). "A powder-based approach to semisolid
processing of metals for fabrication of die-castings and composites." Journal of
Materials Science, 21(3), pp. 1057-1069.
Young, R. M. K. and T. W. Clyne (1986b). "A powder mixing and preheating route to
slurry production for semisolid diecasting." Powder metallurgy, 29(3), pp. 195-
199.

161
Zhang, L., X. H. Qu, et al. (2008). "Thermo-physical and mechanical properties of high
volume fraction SiCp/Cu composites prepared by pressureless infiltration."
Materials Science and Engineering a-Structural Materials Properties
Microstructure and Processing, 489(1-2), pp. 285-293.
Zhong, R., H. Cong, et al. (2003). "Fabrication of nano-Al based composites reinforced
by single-walled carbon nanotubes." Carbon, 41(4), pp. 848-851.
Zhou, S. M., X. B. Zhang, et al. (2007). "Fabrication and tribological properties of carbon
nanotubes reinforced Al composites prepared by pressureless infiltration
technique." Composites Part a-Applied Science and Manufacturing, 38(2), pp.
301-306.
Zu, L. and S. Luo (2001). "Study on the powder mixing and semi-solid extrusion forming
process of SiCp/2024Al composites." Journal of Materials Processing
Technology, 114(3), pp. 189-193.