Fabrication of dissolved O2 metric uric acid biosensor using uricase epoxy resin biocomposite...
7
Analytica Chimica Acta 647 (2009) 195–201 Contents lists available at ScienceDirect Analytica Chimica Acta journal homepage: www.elsevier.com/locate/aca Fabrication of dissolved O 2 metric uric acid biosensor using uricase epoxy resin biocomposite membrane Jyoti Arora, Seep Nandwani, Manu Bhambi, C.S. Pundir ∗ Biochemistry Research Laboratory, Department of Biochemistry & Genetics Biochemistry, M.D. University, Rohtak 124001, Haryana, India article info Article history: Received 3 November 2008 Received in revised form 6 April 2009 Accepted 1 June 2009 Available online 7 June 2009 Keywords: Uric acid Biosensor Epoxy resin Uricase Dissolved O2 meter abstract Uricase purified from 20-day-old leaves of cowpea was immobilized on to epoxy resin membrane with 80% retention of initial activity of free enzyme and a conjugation yield of 0.056 mg/cm 2 . The uricase epoxy resin bioconjugate membrane was mounted over the sensing part of the combined electrode of ‘Aqualytic’ dissolved O 2 (DO) meter to construct a uric acid biosensor. The biosensor measures the depletion of dissolved O 2 during the oxidation of uric acid by immobilized uricase, which is directly proportional to uric acid concentration. The biosensor showed optimum response within 10–12 s at a pH 8.5 and 35 ◦ C. A linear relationship was found between uric acid concentration from 0.025 to 0.1mM and O 2 (mg/l) consumed. The biosensor was employed for measurement of uric acid in serum. The mean value of uric acid in serum was 4.92mg/dl in apparently healthy males and 3.11mg/dl in apparently healthy females. The mean analytic recoveries of added uric acid in reaction mixture (8.9 and 9.8 mg/dl) were 93.6 ± 2.34 and 87.18 ± 3.17% respectively. The within and between batch CVs were <6.5 and <5.0%, respectively. The serum uric acid values obtained by present method and standard enzymic colorimetric method, showed a good correlation (r = 0.996) and regression equation being y = 0.984x + 0.0674. Among the various metabolites tested only, glucose (11%), urea (38%), NaCl (25%) and cholesterol (13%) and ascorbic acid (56%) caused decrease, while, MgSO 4 and CaCl 2 had no effect on immobilized enzyme. The enzyme electrode showed only 32% decrease during its use for 100 times over a period of 60 days at 4 ◦ C. © 2009 Elsevier B.V. All rights reserved. 1. Introduction Uric acid is an end product of purine metabolism in human. A number of diseases and pathological disorders are related to the variations of uric acid concentration in body fluids (e.g. serum and urine), such as gout, arthritis [1], cardiovascular disease [2] and neurological diseases [3]. Consequently, uric acid determina- tion is of paramount importance in the diagnosis of the diseases caused by disorder of purine biosynthesis and catabolism. Vari- ous techniques such as colorimetric [4], electrochemical [5], HPLC [6,7], chemiluminescence [8] and fluorescence methods [9] have been reported for the analysis of uric acid. However, these meth- ods suffer from certain drawbacks such as time-consuming sample preparation and also oxidation of certain amounts of uric acid dur- ing the processing [4]. Since enzymes have an unique ability of molecular recognition, enzymatic colorimetric method improved the selectivity of uric acid determinations. So this method was chosen for routine clinical analysis [10,11]. Biosensors that employ ∗ Corresponding author at: Faculty of Life Sciences, Department of Biochemistry & Genetics Biochemistry, M.D. University, Rohtak 124001, Haryana, India. Tel.: +91 01262 292480 (O)/272012 (R); fax: +91 01262 294640. E-mail address: [email protected] (C.S. Pundir). immobilized enzyme (mostly oxidases), have been used for sim- ple, sensitive, specific and rapid analysis of metabolites [12–17]. The immobilization of an enzyme is essential to stabilize its activ- ity and get its reusability. Various immobilization methods such as adsorption, covalent bonding and entrapment have been employed to fabricate biosensors. Since 1970s, uric acid sensors have been developed employing uricase immobilized onto insoluble supports [18,19]. However, most researchers did not pay much attention to the methods of enzyme immobilization, as these could affect not only the sensitivity of the analysis, but also the shelf-life of the immobilized enzyme. Uricase has been immobilized on to various supports by different methods such as cellulose acetate membrane by adsorption [20], polyaniline film [7] and polypyrrole and polyani- line by physisorption [21] and chitosan membrane by crosslinking [22] polystyrene membrane by entrapment [23] and ZnO nano tetrapods [24]. Most of these immobilization methods were compli- cated and provided less stability, which limit the development and application of uric acid biosensors. We report herein a simple pro- cedure of immobilization of uricase (purified from cowpea leaves) onto ‘Araldite’ membrane and its application in construction of a uric acid biosensor. ‘Araldite’ membrane, composed of epoxy resins having epoxy groups on both sides of single epoxy resin, forming a highly crosslinked network, is long-lived and water-permeable. The membrane has advantages such as high affinity for enzyme, 0003-2670/$ – see front matter © 2009 Elsevier B.V. All rights reserved. doi:10.1016/j.aca.2009.06.001
-
Upload
jyoti-arora -
Category
Documents
-
view
218 -
download
0
Transcript of Fabrication of dissolved O2 metric uric acid biosensor using uricase epoxy resin biocomposite...

Fb
JB
a
ARRAA
KUBEUD
1
Ataatco[bopimtc
&T
0d
Analytica Chimica Acta 647 (2009) 195–201
Contents lists available at ScienceDirect
Analytica Chimica Acta
journa l homepage: www.e lsev ier .com/ locate /aca
abrication of dissolved O2 metric uric acid biosensor using uricase epoxy resiniocomposite membrane
yoti Arora, Seep Nandwani, Manu Bhambi, C.S. Pundir ∗
iochemistry Research Laboratory, Department of Biochemistry & Genetics Biochemistry, M.D. University, Rohtak 124001, Haryana, India
r t i c l e i n f o
rticle history:eceived 3 November 2008eceived in revised form 6 April 2009ccepted 1 June 2009vailable online 7 June 2009
eywords:ric acidiosensorpoxy resin
a b s t r a c t
Uricase purified from 20-day-old leaves of cowpea was immobilized on to epoxy resin membrane with80% retention of initial activity of free enzyme and a conjugation yield of 0.056 mg/cm2. The uricase epoxyresin bioconjugate membrane was mounted over the sensing part of the combined electrode of ‘Aqualytic’dissolved O2 (DO) meter to construct a uric acid biosensor. The biosensor measures the depletion ofdissolved O2 during the oxidation of uric acid by immobilized uricase, which is directly proportional to uricacid concentration. The biosensor showed optimum response within 10–12 s at a pH 8.5 and 35 ◦C. A linearrelationship was found between uric acid concentration from 0.025 to 0.1 mM and O2 (mg/l) consumed.The biosensor was employed for measurement of uric acid in serum. The mean value of uric acid inserum was 4.92 mg/dl in apparently healthy males and 3.11 mg/dl in apparently healthy females. The
ricaseissolved O2 meter
mean analytic recoveries of added uric acid in reaction mixture (8.9 and 9.8 mg/dl) were 93.6 ± 2.34 and87.18 ± 3.17% respectively. The within and between batch CVs were <6.5 and <5.0%, respectively. The serumuric acid values obtained by present method and standard enzymic colorimetric method, showed a goodcorrelation (r = 0.996) and regression equation being y = 0.984x + 0.0674. Among the various metabolitestested only, glucose (11%), urea (38%), NaCl (25%) and cholesterol (13%) and ascorbic acid (56%) causeddecrease, while, MgSO4 and CaCl2 had no effect on immobilized enzyme. The enzyme electrode showed
its u
only 32% decrease during. Introduction
Uric acid is an end product of purine metabolism in human.number of diseases and pathological disorders are related to
he variations of uric acid concentration in body fluids (e.g. serumnd urine), such as gout, arthritis [1], cardiovascular disease [2]nd neurological diseases [3]. Consequently, uric acid determina-ion is of paramount importance in the diagnosis of the diseasesaused by disorder of purine biosynthesis and catabolism. Vari-us techniques such as colorimetric [4], electrochemical [5], HPLC6,7], chemiluminescence [8] and fluorescence methods [9] haveeen reported for the analysis of uric acid. However, these meth-ds suffer from certain drawbacks such as time-consuming samplereparation and also oxidation of certain amounts of uric acid dur-
ng the processing [4]. Since enzymes have an unique ability ofolecular recognition, enzymatic colorimetric method improved
he selectivity of uric acid determinations. So this method washosen for routine clinical analysis [10,11]. Biosensors that employ
∗ Corresponding author at: Faculty of Life Sciences, Department of BiochemistryGenetics Biochemistry, M.D. University, Rohtak 124001, Haryana, India.
el.: +91 01262 292480 (O)/272012 (R); fax: +91 01262 294640.E-mail address: [email protected] (C.S. Pundir).
003-2670/$ – see front matter © 2009 Elsevier B.V. All rights reserved.oi:10.1016/j.aca.2009.06.001
se for 100 times over a period of 60 days at 4 ◦C.© 2009 Elsevier B.V. All rights reserved.
immobilized enzyme (mostly oxidases), have been used for sim-ple, sensitive, specific and rapid analysis of metabolites [12–17].The immobilization of an enzyme is essential to stabilize its activ-ity and get its reusability. Various immobilization methods such asadsorption, covalent bonding and entrapment have been employedto fabricate biosensors. Since 1970s, uric acid sensors have beendeveloped employing uricase immobilized onto insoluble supports[18,19]. However, most researchers did not pay much attention tothe methods of enzyme immobilization, as these could affect notonly the sensitivity of the analysis, but also the shelf-life of theimmobilized enzyme. Uricase has been immobilized on to varioussupports by different methods such as cellulose acetate membraneby adsorption [20], polyaniline film [7] and polypyrrole and polyani-line by physisorption [21] and chitosan membrane by crosslinking[22] polystyrene membrane by entrapment [23] and ZnO nanotetrapods [24]. Most of these immobilization methods were compli-cated and provided less stability, which limit the development andapplication of uric acid biosensors. We report herein a simple pro-cedure of immobilization of uricase (purified from cowpea leaves)
onto ‘Araldite’ membrane and its application in construction of auric acid biosensor. ‘Araldite’ membrane, composed of epoxy resinshaving epoxy groups on both sides of single epoxy resin, forminga highly crosslinked network, is long-lived and water-permeable.The membrane has advantages such as high affinity for enzyme,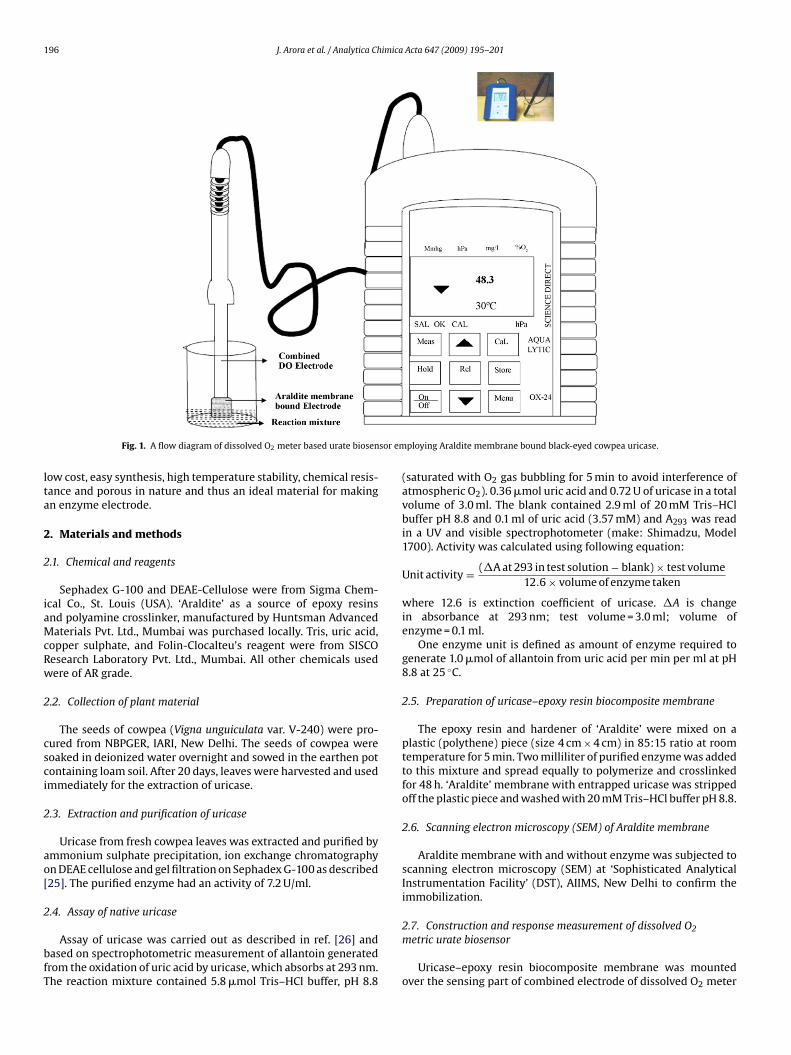
196 J. Arora et al. / Analytica Chimica Acta 647 (2009) 195–201
sor em
lta
2
2
iaMcRw
2
csci
2
ao[
2
bfT
Fig. 1. A flow diagram of dissolved O2 meter based urate biosen
ow cost, easy synthesis, high temperature stability, chemical resis-ance and porous in nature and thus an ideal material for makingn enzyme electrode.
. Materials and methods
.1. Chemical and reagents
Sephadex G-100 and DEAE-Cellulose were from Sigma Chem-cal Co., St. Louis (USA). ‘Araldite’ as a source of epoxy resinsnd polyamine crosslinker, manufactured by Huntsman Advancedaterials Pvt. Ltd., Mumbai was purchased locally. Tris, uric acid,
opper sulphate, and Folin-Clocalteu’s reagent were from SISCOesearch Laboratory Pvt. Ltd., Mumbai. All other chemicals usedere of AR grade.
.2. Collection of plant material
The seeds of cowpea (Vigna unguiculata var. V-240) were pro-ured from NBPGER, IARI, New Delhi. The seeds of cowpea wereoaked in deionized water overnight and sowed in the earthen potontaining loam soil. After 20 days, leaves were harvested and usedmmediately for the extraction of uricase.
.3. Extraction and purification of uricase
Uricase from fresh cowpea leaves was extracted and purified bymmonium sulphate precipitation, ion exchange chromatographyn DEAE cellulose and gel filtration on Sephadex G-100 as described25]. The purified enzyme had an activity of 7.2 U/ml.
.4. Assay of native uricase
Assay of uricase was carried out as described in ref. [26] andased on spectrophotometric measurement of allantoin generatedrom the oxidation of uric acid by uricase, which absorbs at 293 nm.he reaction mixture contained 5.8 �mol Tris–HCl buffer, pH 8.8
ploying Araldite membrane bound black-eyed cowpea uricase.
(saturated with O2 gas bubbling for 5 min to avoid interference ofatmospheric O2). 0.36 �mol uric acid and 0.72 U of uricase in a totalvolume of 3.0 ml. The blank contained 2.9 ml of 20 mM Tris–HClbuffer pH 8.8 and 0.1 ml of uric acid (3.57 mM) and A293 was readin a UV and visible spectrophotometer (make: Shimadzu, Model1700). Activity was calculated using following equation:
Unit activity = (�A at 293 in test solution − blank) × test volume12.6 × volume of enzyme taken
where 12.6 is extinction coefficient of uricase. �A is changein absorbance at 293 nm; test volume = 3.0 ml; volume ofenzyme = 0.1 ml.
One enzyme unit is defined as amount of enzyme required togenerate 1.0 �mol of allantoin from uric acid per min per ml at pH8.8 at 25 ◦C.
2.5. Preparation of uricase–epoxy resin biocomposite membrane
The epoxy resin and hardener of ‘Araldite’ were mixed on aplastic (polythene) piece (size 4 cm × 4 cm) in 85:15 ratio at roomtemperature for 5 min. Two milliliter of purified enzyme was addedto this mixture and spread equally to polymerize and crosslinkedfor 48 h. ‘Araldite’ membrane with entrapped uricase was strippedoff the plastic piece and washed with 20 mM Tris–HCl buffer pH 8.8.
2.6. Scanning electron microscopy (SEM) of Araldite membrane
Araldite membrane with and without enzyme was subjected toscanning electron microscopy (SEM) at ‘Sophisticated AnalyticalInstrumentation Facility’ (DST), AIIMS, New Delhi to confirm theimmobilization.
2.7. Construction and response measurement of dissolved O2metric urate biosensor
Uricase–epoxy resin biocomposite membrane was mountedover the sensing part of combined electrode of dissolved O2 meter
J. Arora et al. / Analytica Chimica
Fb
(twTaaad
ig. 2. Standard curve of uric acid concentration by biosensor using Araldite mem-rane bound black-eyed cowpea (Vigna unguiculata) uricase.
make: Aqualytic Germany, Model: 0x53) with a parafilm. The elec-rode was connected to main apparatus of O2 meter. To test thisorking enzyme electrode, it was immersed into 2.9 ml of 20 mM
ris–HCl buffer pH 8.8 (saturated with O2 to avoid the intake oftmospheric O2) in a 10-ml glass beaker. The meter was put onnd the reading displayed on the screen was read in terms of mg/lnd kept on hold. After adding 0.1 ml 1 mM uric acid solution, theissolved O2 content was measured again, till the reading became
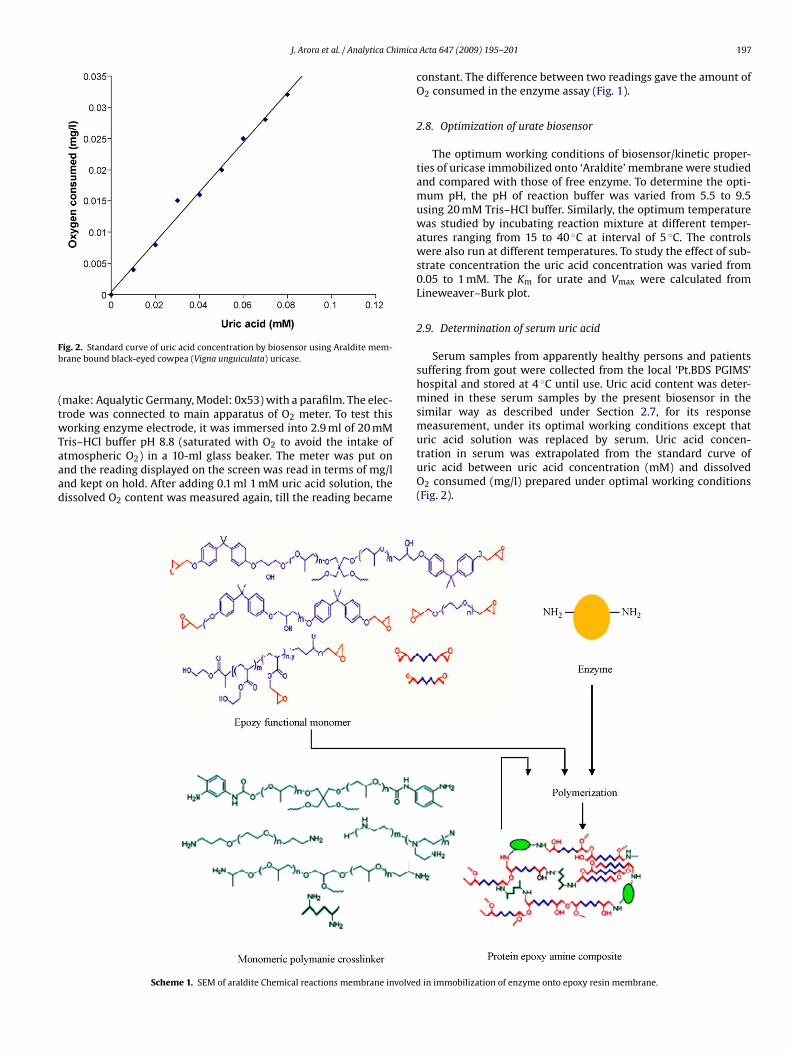
Scheme 1. SEM of araldite Chemical reactions membrane involved
Acta 647 (2009) 195–201 197
constant. The difference between two readings gave the amount ofO2 consumed in the enzyme assay (Fig. 1).
2.8. Optimization of urate biosensor
The optimum working conditions of biosensor/kinetic proper-ties of uricase immobilized onto ‘Araldite’ membrane were studiedand compared with those of free enzyme. To determine the opti-mum pH, the pH of reaction buffer was varied from 5.5 to 9.5using 20 mM Tris–HCl buffer. Similarly, the optimum temperaturewas studied by incubating reaction mixture at different temper-atures ranging from 15 to 40 ◦C at interval of 5 ◦C. The controlswere also run at different temperatures. To study the effect of sub-strate concentration the uric acid concentration was varied from0.05 to 1 mM. The Km for urate and Vmax were calculated fromLineweaver–Burk plot.
2.9. Determination of serum uric acid
Serum samples from apparently healthy persons and patientssuffering from gout were collected from the local ‘Pt.BDS PGIMS’hospital and stored at 4 ◦C until use. Uric acid content was deter-mined in these serum samples by the present biosensor in thesimilar way as described under Section 2.7, for its responsemeasurement, under its optimal working conditions except that
uric acid solution was replaced by serum. Uric acid concen-tration in serum was extrapolated from the standard curve ofuric acid between uric acid concentration (mM) and dissolvedO2 consumed (mg/l) prepared under optimal working conditions(Fig. 2).in immobilization of enzyme onto epoxy resin membrane.

198 J. Arora et al. / Analytica Chimica Acta 647 (2009) 195–201
Fig. 3. (a) SEM of Araldite membrane without enzyme at 2500×. (b) SEM of Aralditemembrane with enzyme at 2500×.
Fig. 4. Effect of pH on native/free and Araldite membrane bound black-eyed cowpea(Vigna unguiculata ) leaf uricase.
Fig. 5. Effect of incubation temperature on native/free and Araldite membranebound black-eyed cowpea (Vigna unguiculata) leaf uricase.
2.10. Reuse of immobilized uricase
To reuse the enzyme electrode, it was washed 3–4 times withreaction buffer, dried in between folds of tissue paper. The enzymeelectrode was stored in reaction buffer at 4 ◦C when not in use.
3. Results and discussion
3.1. Immobilization of cowpea leaf uricase onto ‘Araldite’membrane
Uricase purified from leaves of 20 days old seedlings ofblack-eyed cowpea. Cowpea has been immobilized onto ‘Araldite’membrane with 80% retention of initial activity of free enzymewith a conjugation yield of 0.056 mg/cm2. The –OH groups of epoxycontaining polymers react with bifunctional polyamine and –NH2groups of enzyme to form a network resulting into enzyme–epoxyamine resin composites. Scheme 1 represents the probable mech-anism of immobilization of enzyme onto epoxy resin membranewhich shows the covalent coupling of enzyme with the support[27,28].
3.2. Scanning electron microscopic (SEM) study of epoxy resinmembrane
The surface of ‘Araldite’ membrane without and with enzymewas observed under a scanning electron microscope. High reso-lution scanning electron micrographs of Araldite membrane withimmobilized enzyme had clusters along some beaded structureswhich were not observed in membrane without immobilizedenzyme (Fig. 3a and b) which might be due to the both chemi-cal coupling as well as adsorption of some enzyme. A change insurface morphology of membrane after immobilization process isan evidence of enzyme immobilization. The formation of clustersinstead of regular globular beaded structures might be due to highconcentration of uricase on the surface of Araldite membrane.
3.3. Construction of D.O. metric uric acid biosensor
A method is described for construction of a D.O. metric uricacid biosensor using ‘Araldite’ epoxy resin membrane bound uri-case.

imica Acta 647 (2009) 195–201 199
3
imr8p[aohppt[(lb[ocbaw0erfiubtateiimrasmd
utsp
3
st
3
4aecuas[
fkin
etic
par
amet
ers
ofU
rica
seaf
ter
imm
obil
izat
ion
onto
Ara
ldit
em
embr
ane
wit
hth
ose
rep
orte
don
oth
ersu
pp
orts
.
Bh
arga
vaet
al.[
4]Pu
nd
iran
dB
har
gava
[34]
Sush
ma
etal
.[38
]Pa
net
al.[
31]
Cet
eet
al.[
29]
Zhan
get
al.[
30]
Pres
ent
ePo
rcin
eliv
eru
rica
sePo
rcin
eliv
eru
rica
seR
ecom
bin
ant
bact
eria
lu
rica
sePi
gliv
erA
rthr
obac
ter
glob
iform
isA
rthr
obac
ter
glob
iform
isB
lack
-eye
dco
wp
eale
af
nA
lkyl
amin
egl
ass
bead
sA
ryla
min
egl
ass
bead
sA
lkyl
amin
egl
ass
bead
saf
fixe
don
ap
last
icst
rip
Poly
-o-a
min
oph
enol
-an
ilin
ePo
lypy
rrol
efi
lmEg
gsh
ellm
embr
ane
Ara
ldit
em
embr
ane
nG
luta
rald
ehyd
ecr
ossl
inki
ng
Glu
tara
ldeh
yde
cros
slin
kin
gG
luta
rald
ehyd
ecr
ossl
inki
ng
Entr
apm
ent
Glu
tara
ldeh
yde
cros
slin
kin
gG
luta
rald
ehyd
ecr
ossl
inki
ng
Hyd
roge
nbo
nd
ing
8.8
8.8
8.8
8.0
8.0
8.0
8.5
40◦ C
40◦ C
40◦ C
45◦ C
25◦ C
35◦ C
Not
rep
orte
dN
otre
por
ted
0.06
8�
mol
esH
2O
2/m
in/m
lN
otre
por
ted
7.1
×10
−2m
M/m
inN
otre
por
ted
0.08
mg/
l
Not
rep
orte
dN
otre
por
ted
0.15
mM
10.0
8m
mol
dm
−30.
44
mM
0.33
mM
0.17
mM
0.05
–0.2
5m
M10
–80
�g/
2.0
ml
0–4
8�
g/2
ml
0.0
01–0
.5m
mol
dm
−3(0
.1–5
.0)×
10−5
M4.
0–6.
40�
M0.
05–1
mM
it80
�g/
ml
5.0
mg/
0.1
ml
11.0
�g/
0.1
ml
Not
rep
orte
d5.
0×
10−7
M2
�M
4.25
�g/
ml
Col
orim
etri
cH
2O
2
esti
mat
ion
Col
orim
etri
cH
2O
2
esti
mat
ion
Col
orim
etri
cH
2O
2
esti
mat
ion
Dis
solv
edO
2
esti
mat
ion
Am
per
omet
ric
Dis
solv
edO
2es
tim
atio
nD
isso
lved
O2
esti
mat
ion
J. Arora et al. / Analytica Ch
.4. Kinetic optimization of uric acid biosensor
The optimum pH of immobilized uricase was pH 8.5, whichs higher than that of its free form (pH 8.5) (Fig. 4). The opti-
um pH of immobilized enzyme was comparable to previouseports, e.g. optimum pH of polypyrrole film bound uricase (pH.8) [29], egg shell membrane bound uricase (pH 8.0) [30], co-olymer of aniline and o-aminophenol bound uricase (pH 6.0)31] and polypyrrole–ferrocene film bound uricase (pH 8.0) [32],nd polyaniline bound Aspergillus niger uricase (pH 9.0) [20]. Theptimum temperature of immobilized uricase was 35 ◦C, which isigher than that of free enzymes (30 ◦C) (Fig. 5). The optimum tem-erature in present epoxy resin bound uricase was same as that ofolyaniline bound Bacillus fastidious uricase (35 ◦C) [33] but lowerhan that of alkylamine glass beads bound porcine liver uricase34], pig liver uricase immobilized on aniline and o-aminophenol45 ◦C; Pan et al. [31]), Arthrobacter globiformis uricase immobi-ized onto polypyrrole–ferrocenium film (55 ◦C; Cete et al. [32])ut higher than that of egg shell membrane bound uricase (30 ◦C)30] and polypyrrole film bound uricase (25 ◦C) [25]. The effectf uric acid on the biosensor response was studied in the con-entration range 0.05–1 mM. There was a hyperbolic relationshipetween biosensor response/immobilized uricase activity and uriccid concentration up to 0.6 mM (half of that of free form), afterhich it was constant. The decrease in Km of uricase from 0.80 to
.17 mM after immobilization revealed the increased affinity of thenzyme after immobilization. Km for uric acid for uricase epoxyesin biocomposite membrane was lower than that of polypyrrolelm bound uricase (Km = 0.44 mM) [30], egg shell membrane boundricase (Km = 0.33 mM) [29] and for polypyrrole–ferrocenium filmound uricase (0.4 mM); however, Vmax was increased from 0.02o 0.08 mg/l after immobilization. The change in kinetics of uricasefter immobilization might be due to many factors like conforma-ional change due to chemical modification of the enzyme, stericffects, partitioning effects due to electrostatic or hydrophobicnteractions between matrix and the low molecular weight speciesn solution causing modification of enzyme microenvironment and
ass transfer or bulk diffusional effects arising from diffusionalesistance to the transport of substrate from bulk solution to the cat-lytic sites as well as diffusion of reaction products back to the bulkolution [35]. A comparison of various kinetic properties of Aralditeembrane bound uricase with those of uricase immobilized onto
ifferent supports is summarized in Table 1.A simple, sensitive and rapid method for measurement of serum
rate was developed using the present biosensor. The method hashe advantage over other D.O. metric biosensors that it reads theample within 10–12 s and is portable. The following analyticalarameters were determined to evaluate the method.
.5. Linearity
Immobilized uricase showed a linear relationship between dis-olved O2 consumed (mg/l) and uric acid concentration from 0.025o 0.1 mM (Fig. 2).
.6. Minimum detection limit
The present biosensor has the minimum detection limit of.25 �g/ml, which is lower than some earlier methods such asutomated analysis using immobilized uricase (20 �g/ml) [36],nzymatic colorimetric method using free enzyme (25 �g/ml) [37],
olorimetric method using commercially available porcine liverricase (80 �g/ml) [4], colorimetric method using commerciallyvailable uricase (1.68 mg/dl) [38] but higher than few methodsuch as chemiluminiscence method using free enzyme (1 �g/ml)39], voltametric and colorimetric titration method (2.0 × 10⁻⁵ M) Table
1A
com
par
ison
o
Prop
erti
es
Sou
rce
ofu
rica
s
Sup
por
tfo
rim
mob
iliz
atio
Met
hod
ofim
mob
iliz
atio
Opt
imu
mp
HO
ptim
um
tem
per
atu
reV
max
Km
Wor
kin
gra
nge
Min
imu
md
etec
tion
lim
Mod
eof
mea
sure
men
t

200 J. Arora et al. / Analytica Chimica Acta 647 (2009) 195–201
Table 2Within and between assay coefficients of variation for determination of serum uricacid in the serum as measured by dissolved O2 metric biosensor based on Aralditemembrane bound black-eyed cowpea leaf uricase.
n Uric acid (mg/l) CV (%)
Within assay (6)4.28 4.47 ± 0.29 6.54.584.584.833.994.58
Between assay (6)3.413.10
[(
3
9c
3
mmsc(
3
ooe
Fob
nso
ru
sin
gu
rica
seep
oxy
resi
nbi
ocom
pos
ite
mem
bran
e.
ZnO
nan
orod
s(Z
ang
etal
.)[4
0]
Poly
anil
ine
(Kan
etal
.)[2
9]A
lkyl
affi
xed
onp
last
icst
rip
(Su
shm
aet
al.)
[32]
Co-
pol
ymer
ofo-
amin
op
hen
olan
ilin
e(P
anet
al.)
[27]
Eggs
hel
lm
embr
ane
(Zh
ang
etal
.)[2
6]
Ara
ldit
em
embr
ane
(pre
sen
tw
ork)
20d
ays
60d
ays
21d
ays
50d
ays
90d
ays
60d
ays
80.5
8250
8189
88
3.41 3.2 ± 0.16 5.02.413.103.41
36], oxygen metric method using commercial Arthrobactor uricase2.0 �M) [30].
.7. Recovery
The analytic recovery of added uric acid in serum at 8.9 and.8 mg/dl was 93.6 ± 2.34 and 87.18 ± 3.17%, respectively, which isomparable to the earlier reports [4,34,41].
.8. Precision
To study the reproducibility and reliability of the presentethod, the uric acid content in same serum sample was deter-ined six times a day (within batch) and after their one-week
torage at −20 ◦C (between batch). The within and between batchoefficient of variation (CVs) were <6.5 and <5.0%, respectivelyTable 2).
.9. Accuracy
To test the accuracy of method, uric acid values in serumbtained by the present method (y) were compared with thosebtained by standard enzymic colorimertric method using freenzyme. The serum uric acid values obtained by both the methods
ig. 6. Correlation between serum uric acid measured by standard enzymic col-rimetric method (x) and present method (y) employing dissolved oxygen metriciosensor based on Araldite membrane bound black-eyed cowpea leaf uricase. Ta
ble
3C
omp
aris
onof
stab
ilit
yof
uri
cac
idbi
osen
sor
wit
hth
ep
rese
nt
dis
solv
edO
2m
eter
base
dbi
ose
Sup
por
tfo
rim
mob
i-li
zati
on
Cel
lulo
seac
etat
e(G
ilm
arti
net
al.)
[18]
Ch
itos
anm
embr
ane
(Yao
etal
.)[3
9]Po
lyel
ectr
olyt
em
ult
i-la
yer
film
s(H
osh
iet
al.)
[13]
Tim
eof
stu
dy
7d
ays
7d
ays
30d
ays
%of
init
ial
resp
onse
8685
60
imica
mg
3
sc(gailac
3
biopsbho2pottb
3
ab
4
bps
[
[
[[[[
[[[[[[[[[[[[
[
[[
[
[[
[
[[
J. Arora et al. / Analytica Ch
atched with each other and showed a good correlation (r = 0.98),iving the following regression equation: y = 0.984x + 0.0674 (Fig. 6).
.10. Interference
The aqueous solution 0.1 ml each of following metabolites andalts were added in the reaction mixture each: glucose (5 mM),holesterol (3.87 mM), urea (2 mM), ascorbic acid (2 mM), NaCl24 mM), MgSO4 (8 mM) and CaCl2 (4 mM). Among these, NaCl (2%),lucose (11%), cholesterol (13%) and urea (38%) caused decrease inctivity; ascorbic acid caused maximum (56%) decrease in activ-ty while MgSO4 and CaCl2 had no effect on activity [4] observedesser, i.e. 2% decrease in activity by NaCl (2%) and glucose (2%) butlmost similar inhibition (60%) by ascorbic acid in the activity ofommercial uricase immobilized on alkylamine glass beads.
.11. Serum urate determination
The uric acid content in serum as measured by the presentiosensor was in the range 3.4–6.1 mg/dl with a mean of 4.92 mg/dl
n apparently healthy males (n = 6), 2.4–5.14 mg/dl with a meanf 3.11 mg/dl in apparently healthy females (n = 6). This is com-arable with normal accepted range of 3–7 mg/dl. The range oferum uric acid in healthy persons in present report is compara-le with some earlier reports, i.e. the serum uric acid in apparentlyealthy adult male was found in the range of 46 �g/ml with a meanf 21 ± 0.013 by radioisotopic method using soluble uricase [37],–8 mg/dl [42] and recombinant bacterial uricase immobilized tolastic strip affixed alkylamine glass beads (2.5–5 mg/dl with meanf 3.7 mg/dl) [32]. The gout patient serum uric acid ranged from 9.4o 13.6 mg/dl with mean of 10.4 mg/dl. This range is comparableo that of commercial uricase immobilized onto alkylamine glasseads (5.5–20 mg/dl) [4].
.12. Reusability and storage
The enzyme electrode showed only 32% loss of initial activityfter its 100 uses over a period of 60 days, when stored in reactionuffer at 4 ◦C (Table 3).
. Conclusion
The study has demonstrated that biosensor prepared by immo-ilization of uricase onto epoxy resin membrane provides aossibility to measure low concentration of uric acid with goodensitivity.
[[
[[
Acta 647 (2009) 195–201 201
References
[1] R.L. Wortmann, in: E. Braunwald, A.S. Fauci, D.L. Kasper, S.L. Hauser, D.L. Longo,J.L. Jameson (Eds.), Harrison’s Principles of Internal Medicine, 15th ed., McGraw-Hill, New York, 2001, p. 2268.
[2] U.M. Khosla, S. Zharikov, J.L. Finch, T. Nakagawa, C. Roncal, W. Mu, 3. Krotova,J.F. Baker, E. Krishnan, L. Chen, H.R. Schumacher, Am. J. Med. 118 (2005) 816.
[3] H.J. Moallem, G. Taningo, C.K. Jiang, R. Hishhorn, S. Fikrig, Clin. Immunol. 105(2002) 75.
[4] A.K. Bhargava, H. Lal, C.S. Pundir, J. Biochem. Biophys. Methods 39 (1999) 125.[5] F. Zhang, X. Wang, S. Ai, Z. Sun, Q. Wan, Z. Zhu, Y. Xian, L. Jin, Yamamoto, J. Wang,
T. Golden, P. Tuzhi, Anal. Chem. 59 (1987) 740–744.[6] M.L. Greenberg, M.S. Hershfield, Anal. Biochem. 176 (1989) 290.[7] D. Yao, A.G. Vlessidis, N.P. Evmiridis, Anal. Chim. Acta 478 (2003) 23.[8] J. Galban, Y. Andreu, M.J. Almenara, S. de Marcos, J.R. Castillo, Talanta 54 (2001)
847.[9] D. Yao, A.G. Vlessidis, N.P. Evmiridis, Anal. Chim. Acta 467 (2002) 133.10] G.F. Domagk, H.H. Schlicke, Anal. Biochem. 22 (1968) 219.
[11] S. Abraham John, J. Electroanal. Chem. 579 (2005) 249.12] Yuh-Shyong Yang, Yaw-Kuen Li, Tung-Kung Wu, Biosens. Bioelectron. 9 (2004)
1627.13] Hoshi Tomonori, Saiki Hidekazu, Anzai Jun-ichi, Talanta 61 (2003) 363.14] S. Uchiyama, F. Umesato, S. Suzuki, Anal. Chim. Acta 230 (1990) 195.15] M. Akyilmaz Erol, Kemal Sezginturk, Dinckaya Erhan, Talanta 61 (2003) 73.16] M. Nanjo, G.G. Guilbault, Anal. Chem. 46 (1974) 1769.
[17] Z.C. Chen, Y.O. Zhao, L.Y. Li, Dyn, Continuous Discrete and Impulsive System –Series B – Applications & Al, 2006, 2038.
18] T. Kawashima, G.A. Rechnitz, Anal. Chim. Acta 83 (1976) 9.19] M.A.T. Gilmartin, J.P. Hart, Analyst 119 (1994) 833.20] J. Kan, X. Pan, C. Chen, Biosens. Bioelectron. 19 (2004) 1635.21] F. Arslan, Sensors 8 (2008) 5492.22] D. Martinez-Perez, M.L. Ferrer, C.R. Mateo, Anal. Biochem. 322 (2003) 238.23] X.Y. Wang, T. Hagiwara, S. Uchiyama, Anal. Chim. 1 (2007) 41.24] X.H. Wang, Y.L. Yao, J. Zhang, Sens. Mater. 20 (2008) 111.25] K. Lucas, M.J. Boland, K.R. Schubert, Arch. Biochem. Biophys. 226 (1983) 190.26] B.A. Dilena, M.J. Peake, H.L. Pardue, J.W. Skoug, Clin. Chem. 32 (1986) 486.27] Iqbal Gill, Antonio Ballesteros, TIBTECH 18 (2000) 469.28] I.S. Gill, A. Ballesteros, Trends Biotechnol. 18 (2000) 282.29] S. Cete, A. Yasar, Arslam F, Artif. Cells Blood Substitutes Biotechnol. 34 (2006)
367.30] Y. Zhang, G. When, Y. Zhou, S. Shuang, C. Dong, M.M. Choi, Biosens. Bioelectron.
22 (2007) 1791.31] X. Pan, S. Zhou, C. Chen, J. Kan, Sens. Actuators B 113 (2006) 329.32] S. Cete, A. Yasar, F. Arslam, Artif. Cells Blood Substitutes Biotechnol. 35 (2007)
607.33] K. Arora, G. Sumana, V. Saxena, R.K. Gupta, J.V. Vakhan, M.K. Pandey, S. Chand,
B.D. Malhotra, Anal. Chim. Acta 594 (2007) 17.34] C.S. Pundir, A.K. Bhargava, Ind. J. Clin. Biochem. 18 (2003) 21.35] J.F. Kennedy, in: Alan Wiseman (Ed.), Handbook of Enzyme Biotechnology, John
Wiley and Sons, New York, 1975, p. 147.36] Y. Yasuda, T. Fusita, Y. Takakura, M. Hashida, H. Sezaki, Chem. Pharm. Bull.
(Tokyo) 30 (1990) 2053.37] J. Liu, G. Li, H. Lim, X. Zhou, Appl. Biochem. Biotechnol. 47 (1994) 57.38] Sushma, Rekha, V. Kumar, Suman, Pundir CS, Ind. J. Chem. Technol. 11 (2004)
764–768.39] J. Liu, J. Cruo, G. Li, Chin. J. Biotechnol. 11 (1995) 177–183.40] I.F. Abdullin, Y.N. Bakanina, E.N. Turora, G.K. Budnikov, J. Anal. Chem. 56 (2001)
453–456.41] L.G. Michael, S.H. Michael, Anal. Biochem. 176 (1989) 292–293.42] J.M. Zen, J.S. Tang, Anal. Chem. 67 (1995) 1892–1895.


![Oral uricase eliminates blood uric acid in the ...process called uricolysis [3]. Plasma UA concentration depends on the balance between UA generation and excretion, as well as purine](https://static.fdocuments.in/doc/165x107/5e875287cd8d6637e0520735/oral-uricase-eliminates-blood-uric-acid-in-the-process-called-uricolysis-3.jpg)


![Uric acid transporters BCRP and MRP4 involved in chickens ...biochemical analyzer (AU680, Beckman, USA). Serum uric acid was measured by a uricase method [25], cre-atinine was measured](https://static.fdocuments.in/doc/165x107/60bba3f1f48ced771c1cea59/uric-acid-transporters-bcrp-and-mrp4-involved-in-chickens-biochemical-analyzer.jpg)