FABRICATION AND CHARACTERISATION OF DYE SENSITISED...
82
FABRICATION AND CHARACTERISATION OF DYE SENSITISED SOLAR CELL OON YEN HAN A project report submitted in partial fulfilment of the requirements for the award of the degree of Bachelor (Hons.) of Materials and Manufacturing Engineering Faculty of Engineering and Science Universiti Tunku Abdul Rahman April 2011
Transcript of FABRICATION AND CHARACTERISATION OF DYE SENSITISED...

FABRICATION AND CHARACTERISATION OF DYE SENSITISED
SOLAR CELL
OON YEN HAN
A project report submitted in partial fulfilment of the
requirements for the award of the degree of
Bachelor (Hons.) of Materials and Manufacturing Engineering
Faculty of Engineering and Science
Universiti Tunku Abdul Rahman
April 2011

ii
FDECLARATION
I hereby declare that this project report is based on my original work except for
citations and quotations which have been duly acknowledged. I also declare that it
has not been previously and concurrently submitted for any other degree or award at
UTAR or other institutions.
Signature : _________________________
Name : Oon Yen Han
ID No. : 07 UEB 06019
Date : 16th May 2011
iii
APPROVAL FOR SUBMISSION
I certify that this project report entitled “FABRICATION AND
CHARACTERISATION OF DYE SENSITISED SOLAR CELL” was prepared
by OON YEN HAN has met the required standard for submission in partial
fulfilment of the requirements for the award of Bachelor (Hons.) of Materials and
Manufacturing Engineering at Universiti Tunku Abdul Rahman.
Approved by,
Signature : _________________________
Supervisor : Assistant Professor Dr. Khaw Chwin Chieh
Date : _________________________
iv
The copyright of this report belongs to the author under the terms of the
copyright Act 1987 as qualified by Intellectual Property Policy of Universiti Tunku
Abdul Rahman. Due acknowledgement shall always be made of the use of any
material contained in, or derived from, this report.
© 2011, Oon Yen Han. All right reserved.

v
Specially dedicated to
my beloved mother and father
vi
ACKNOWLEDGEMENTS
I would like to thank everyone who had contributed to the successful completion of
this project. I would like to express my gratitude to my research supervisor, Assistant
Professor Dr. Khaw Chwin Chieh and examiner Associate Professor Dr. Liang Meng
Suan for their invaluable advice, guidance and their enormous patience throughout
the development of the research.
In addition, I would also like to express my grateful appreciation to my
loving parents who had helped and given me encouragement when I faced problems
and bottlenecks. Additionally, I specially thank Ms. Shirley Law Sing Ling, Ms Li
Hui and Ms. Joey, whose invaluable help has made this project success.
vii
FABRICATION AND CHARACTERISATION OF DYE SENSITISED
SOLAR CELL
ABSTRACT
With the high energy consumption nowadays, the amount of fossil fuel is depleted
significantly. Scientists predicted that, with current consumption rate, reserved fossil
fuel will be used up in fifty years. This has brought to the attention of researchers for
finding the replacement for fossil fuel in near future and renewable energy such as
solar cell is the best choice. Therefore, the aim of this project is to increase the
efficiency of Dye-sensitised Solar Cell (DSSC) by studying the effect of different
electrolytes and additives have on its performance. By comparing ACN and MPN,
MPN is more stable but lower in efficiency due to higher iodine contains. The
efficiency of DSSC using quasi-solid MPN is lower than that of liquid MPN due to
the poor contact of the solid-state charge transport material with the dye-coated TiO2
surface. The addition of Guanidium Thiocyanate (GuSCN) in electrolyte suppresses
the recombination rate of DSSC, hence increase the Voc. Similar result is observed
with 4-tert-butylpyridine (TBP). TBP tends to shift the Fermi level of TiO2
negatively and hence increases the Voc. At the same time, the driving force of the
electron injection from LUMO to the conduction band of TiO2 reduced, hence, Jsc
decreases.
viii
TABLE OF CONTENTS
DECLARATION ii
APPROVAL FOR SUBMISSION iii
ACKNOWLEDGEMENTS vi
ABSTRACT vii
TABLE OF CONTENTS viii
LIST OF TABLES xi
LIST OF FIGURES xii
LIST OF SYMBOLS / ABBREVIATIONS xiv
LIST OF APPENDICES xvi
CHAPTER
1 INTRODUCTION 1
1.1 Background 1
1.2 Basic Concept of Dye-Sensitised Solar Cell 2
1.3 Advantages, Drawbacks and Applications 3
1.4 Aim and Objectives 4
1.5 Thesis Outline 5
2 LITERATURE REVIEW 6
2.1 Scheme of Dynamics for Dye-Sensitised Solar Cell 6
2.2 Metal Oxides – Nanocrystalline Titanium Oxide 9
2.2.1 Effect of Grain Size, Number of Layer and
Thickness 10
2.2.2 Effect of Anatase and Rutile Phase 13

ix
2.2.3 Sintering Time and Temperature 14
2.3 Dye Sensitizer 14
2.3.1 Single Layer Ru Complex 15
2.3.2 Bilayer Ru Complex 16
2.4 Electrolyte 17
2.4.1 Liquid Electrolytes 18
2.4.2 Gel Electrolytes 20
2.4.3 Comparison of Liquid and Gel Electrolytes 22
2.5 Counter Electrode 23
2.6 Alternative Device Approaches 24
2.6.1 Natural Dye 24
2.6.2 DSSC with TiO2 Nanotube 26
3 METHODOLOGY 27
3.1 Equipments 27
3.1.1 Scanning Electron Microscope 27
3.1.2 X-ray Diffractometer 30
3.1.3 I-V Tester 31
3.1.4 Ultraviolet Spectroscopy 32
3.2 Materials Used 33
3.3 Fabrication Processes 34
4 RESULTS AND DISCUSSION 38
4.1 Liquid MPN-based and ACN-based Electrolyte 38
4.1.1 Efficiency 38
4.1.2 Stability 40
4.2 Liquid and Quasi-solid MPN-based Electrolyte 45
4.3 Effect of Addictives on DSSC Performance 46
4.4 Comparison of the performance for 4 DSSCs 50
4.5 XRD Analysis 51
4.6 EDX 52
4.7 SEM 53

x
5 CONCLUSION AND RECOMMENDATIONS 55
5.1 Conclusion 55
5.2 Problem Encounter and Solution 56
5.2.1 Uneven Thickness 56
5.2.2 Glass Cutting Technique 57
5.2.3 Arc Lamp Power Supply Wire 57
5.3 Recommendation 58
REFERENCES 60
APPENDICES 64
xi
LIST OF TABLES
TABLE TITLE PAGE
4.1 Comparison of liquid MPN and ACN 39
4.2 Comparison of gel and liquid MPN 45
4.3 Comparison of the performance of ACN-based DSSC with
and without additives and with GuSCN 46
4.4 Comparison of the performance of ACN-based DSSC with
and without pyridine derivative (TBP) 47
4.5 I-V characteristic for sample A, B, C and D 50
4.6 Elements presented in TiO2 paste 52

xii
LIST OF FIGURES
FIGURE TITLE PAGE
2.1 Representation of a dye-sensitised TiO2 solar cell 7
3.1 Scanning Electron Microscope (SEM) 29
3.2 X-ray Diffractometer 31
3.3 I-V Tester 32
3.4 Ultraviolet Spectroscopy 33
3.5 Doctor blade technique (top view) 35
3.6 TiO2/FTO glass which is really for next step 35
3.7 Sensitising TiO2 film with N719. Picture in the right 36
shows the top view of the bottle
3.8 Weight applied during sealing 36
3.9 Electrolyte dripping and cell assembly 37
3.10 Flow chart for DSSC fabrication process 37
4.1 Photocurrent-voltage curve of liquid ACN and MPN 40
4.2 Jsc for ACN and MPN 41
4.3 EIS measurement over a period of time – Nyquist diagram
(Leonardi, 2010) 42
xiii
4.4 Voc for ACN and MPN 42
4.5 FF for ACN and MPN 43
4.6 Efficiency for ACN and MPN 44
4.7 Photocurrent-voltage curve of gel and liquid MPN 46
4.8 Photocurrent-voltage curve of ACN -based DSSC with and
without GuSCN 47
4.9 Photocurrent-voltage curve of ACN- based DSSC with and
without TBP 48
4.10 Schematic energy diagram for DSSC 49
4.11 XRD pattern of single and double layers of 20 nm TiO2 51
4.12 EDX result of TiO2 paste 52
4.13 SEM micrograph of crack at the TiO2 paste
(1300 x magnification) 53
4.14 SEM micrograph of the sample A (a) 3200 x magnification
(b) 5000 x magnification 53
4.15 SEM micrograph of Sample D shows good bonding form
between first and second layer of TiO2 (4200 x magnification)
(Liu, 2011) 54
5.1 TiO2-FTO glass which is heated at same temperature by using
the same hot plate at the same time 56
5.2 Path where glass broke due to poor cutting skill 57
5.3 I-V curve for DSSC using 2 wires 58

xiv
LIST OF SYMBOLS / ABBREVIATIONS
Isc short circuit current, mA
Jsc short circuit current density, mA cm-2
Voc open circuit voltage, mV
Vmax maximum voltage, mV
Imax maximum current, mA
Pmax maximum power, µW
η efficiency, %
FF fill factor
Ebg bandgap energy, eV
CB Conduction Band
DSSC Dye-Sensitised Solar Cell
EBSD Electron Backscatter Diffraction
EDX Energy-dispersive X-ray Spectroscopy
EIS Electrochemical Impedance Spectroscopy
IL Ionic Liquid
IPCE Incident Photon-to-current Conversion Efficiency
HOMO Highest Occupied Molecular Orbital
LUMO Lowest Unoccupied Molecular Orbital
MLCT Metal to Ligand Charge Transfer
SEM Scanning Electron Microscope
TEM Transmission Electron Microscopy
TPGE Thermoplastic Gel Electrolyte
TSGE Thermosetting Gel Electrolyte
VB Valance Band
XRD X-ray Diffraction
ACN acetonitrile
BMIBF4 1-butyl-3-methylimidazolium tetrafluoroborate

xv
Co cobalt
FTO fluorine-doped tin oxide
I2 iodide
ITO tin-doped indium oxide
GuSCN guanidinium thiococynate
MPN methoxypropionitrile
MPTiO2 mesoporous titanium oxide
NBB 1- butyl-1H-benzimidazole
NMP N-methyl-2-pyrrolidone
PAA-PEG polyacrylic acid-polyethylene glycol
PMII 1M 1-propyl-3-methylimidazolium iodide
PMMA poly(methyl methacrylate)
PVdF-HFP Poly(vinylidenrflouride-co-hexaflouropropylene
Ru ruthenium
TBP tert-bytylpuridin
TiO2 titanium oxide

xvi
LIST OF APPENDICES
APPENDIX TITLE PAGE
A Tables 64

CHAPTER 1
1 INTRODUCTION
1.1 Background
The availability of energy sources has a great impact on the quality of human life. In
current world, energy consumption already excess 400 exajoule. With increase in
world population and the rising of energy demand in developing countries, the world
energy consumption is expected to further augment. Besides, it also enhances the
depletion of fossil fuel reserve and lead to exacerbation of the environmental
pollution. Disastrous environmental pollution arising from all too frequent oil spills
and climatic consequence of the green house effect caused by the combustion of
fossil fuels has heightened public concern. If renewable energy resources cannot be
provided in near future, quality of human life is threatened (Gr tzel, 2005).
There are several alternative energy sources have been developed including
those related to health and environmental concerns (air pollution and carbon dioxide
emission), as well as economical and political perspectives. After concerning all
these aspects, solar energy can be considered as the most important energy source.
This is due to the facts that solar energy is abundant, clean, safe, and allows energy
generation in remote areas. The idea of converting sun light to electric power has
obsessed human being for many centuries. Our dream is to capture the energy that is
freely available from sunlight and turn it into electricity which is the valuable and
strategically important asset. Recently, although the efficiency of the solar power is
2
low, however it is a starting point toward our dream. Researches which are
continuously carry out currently or in future will make our dream come true.
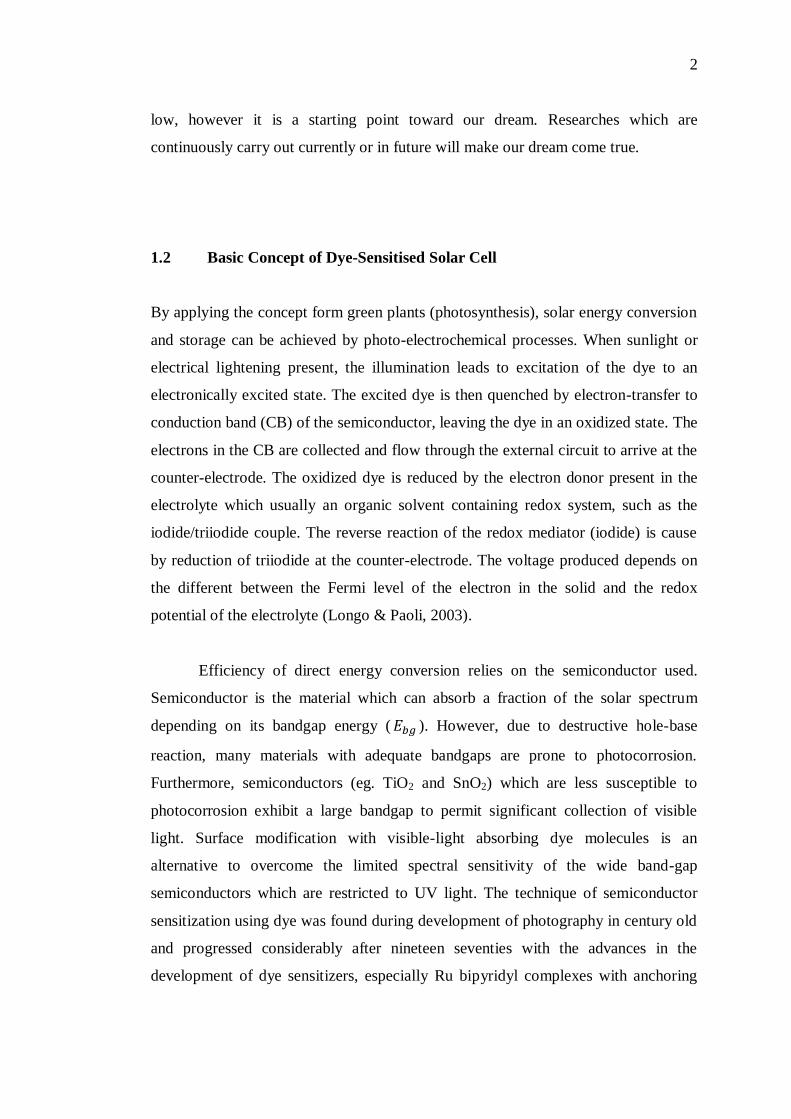
1.2 Basic Concept of Dye-Sensitised Solar Cell
By applying the concept form green plants (photosynthesis), solar energy conversion
and storage can be achieved by photo-electrochemical processes. When sunlight or
electrical lightening present, the illumination leads to excitation of the dye to an
electronically excited state. The excited dye is then quenched by electron-transfer to
conduction band (CB) of the semiconductor, leaving the dye in an oxidized state. The
electrons in the CB are collected and flow through the external circuit to arrive at the
counter-electrode. The oxidized dye is reduced by the electron donor present in the
electrolyte which usually an organic solvent containing redox system, such as the
iodide/triiodide couple. The reverse reaction of the redox mediator (iodide) is cause
by reduction of triiodide at the counter-electrode. The voltage produced depends on
the different between the Fermi level of the electron in the solid and the redox
potential of the electrolyte (Longo & Paoli, 2003).
Efficiency of direct energy conversion relies on the semiconductor used.
Semiconductor is the material which can absorb a fraction of the solar spectrum
depending on its bandgap energy ( ). However, due to destructive hole-base
reaction, many materials with adequate bandgaps are prone to photocorrosion.
Furthermore, semiconductors (eg. TiO2 and SnO2) which are less susceptible to
photocorrosion exhibit a large bandgap to permit significant collection of visible
light. Surface modification with visible-light absorbing dye molecules is an
alternative to overcome the limited spectral sensitivity of the wide band-gap
semiconductors which are restricted to UV light. The technique of semiconductor
sensitization using dye was found during development of photography in century old
and progressed considerably after nineteen seventies with the advances in the
development of dye sensitizers, especially Ru bipyridyl complexes with anchoring
3
groups to attach them to the semiconductor surface. More recently, it is applied in
solar energy conversion (Longo & Paoli, 2003).
1.3 Advantages, Drawbacks and Applications
DSSC has the efficiency of 11% and this has makes it attractive as a replacement for
existing technologies in “low density” application like rooftop solar collectors.
Besides, mechanical robustness and light weight of glass-less collector is a major
advantage. However, they may not be suitable for large-scale deployments where
higher cost higher efficiency cells are often used. They might suitable for some of
these roles even with small increase in the DSSC conversion efficiency (U.S.
Department of Energy Office of Basic Energy Science, 2005).
In traditional cell, the electron is “promoted” within the original crystal. This
will lead to low production rates. The high-energy electron in the silicon could re-
combine with its own hole while producing photon and resulting no current
generation. Besides, it is quite easy for an electron generated in another molecule to
hit a hole left behind in a previous photoexcitation. For DSSC, the process of
injecting an electron directly into TiO2 is qualitatively different from traditional cell.
The process of injection does not introduce a hole in the TiO2, only extra electron. In
this process, there is also some possibility that the electron will recombine back to
the dye, but the rate at which occurs is quite slow compare to the rate that dye
regains an electron from the surrounding electrolyte and electron transfer from the
platinum coated electrode to species in the electrolyte is necessarily very fast (Kr ger,
2003).
In comparison with traditional cells, DSSC can even work in low-light
conditions, thus it is able to work under cloudy skies and non-direct sunlight. While
for traditional cells, it would suffer a “cutout” at some lower limit of illumination,
which cause low charge mobility and recombination will becomes a major issues.
4
For indoor application, such as collecting energy for small devices from the light in
the house, the cutoff will be very low as well (Petch, 2004).
A practical advantage which share by DSSC and most of the thin-film
technologies is the cell‟s mechanical robustness which leads to higher efficiency in
higher temperature indirectly. Due to unstable of the traditional silicon cells, they are
normally encasing in a glass box similar to greenhouse with a metal backing for
strength. As temperature increase, this system suffers from decreasing in efficiency
as the cells heat up internally. When same condition applies to DSSC, it was able to
operate at lower internal temperature due to its structure. DSSC are normally built
with only a thin layer of conducting plastic on the front layer, this allow them to
radiate away heat much easier.
The main drawback for DSSC is the liquid electrolyte used. This proposes a
temperature stability problem. For example, at low temperature, the electrolyte will
freeze and resulted in ending production and potentially causing physical damage.
While in high temperature application, the liquid will expand and making the panels
sealing a serious problem. Another disadvantage is the solution of electrolyte
solution. It contains volatile organic solvents and must be carefully sealed. Due to
leakage and the fact that solvents permeate plastics, large-scale outdoor application
and integration into flexible structure have precluded (ScienceDaily, 2008).
1.4 Aim and Objectives
The aim of this thesis is to increase the efficiency of DSSC by alter the materials
used in the solar cell.
The objectives of this project are shown below:
1. To study the effect of additives in the electrolyte have on the performance of
DSSC.
2. To study the effect of solvent of electrolyte has on the performance of DSSC.
5
By increase the efficiency, we hope that fossil fuel will be replaced solar cell in the
near future so that our precious environment can be protected.
1.5 Thesis Outline
This report is subdivided into 5 different chapters, generally:
1. Chapter 1
In this chapter, background of DSSC will be introduced and the aims and
objectives are described.
2. Chapter 2
This chapter describe in detail about the DSSC and factors that will affect its
performance. Literatures on the TiO2 DSSC are reported.
3. Chapter 3
In this chapter, the experiment methods and equipment used in this work are
discussed. Furthermore, the materials used for fabrication of DSSC as well as
the procedure used will be presents.
4. Chapter 4
This chapter included the result of the FYP, which included DSSC
characterisation through SEM, XRD and IV test. The results will then be
analyzed and discussed further in detail by comparing with the results
obtained by other researchers.
5. Chapter 5
The last chapter will gives the conclusion to this FYP and provides
recommendations for future work.
6
CHAPTER 2
2 LITERATURE REVIEW
Characteristics of metal oxides, dyes and electrolytes are essential to determine the
conversion efficiency of DSSC. Therefore, in this chapter, effect of metal oxides,
dyes, and electrolytes on performance of DSSC will be discussed in detail. In section
2.2, single-, double- and multilayer oxides, and the effect of various sizes and
thickness of metal oxides on DSSC efficiency will be discussed. Section 2.3 covered
the effect of different dyes, such as Ru complex, and bilayer dye on DSSC
performance. While in section 2.4, characteristics of liquid and quasi-solid
electrolyte will be discussed. Besides, the effect of additives in the electrolyte will be
considered.
2.1 Scheme of Dynamics for Dye-Sensitised Solar Cell
In earlier state of photo-electrochemical cells development, only single crystals or
flat electrodes of polycrystalline films of SnO2 (tin oxide) or TiO2 (titanium oxide)
were used. However, the light harvesting efficiency was extremely small and the
efficiencies of the solar cells were lesser than 1%. The efficiency was enhanced at
the beginning of nineteen nineties, in Lausanne, Switzerland, in the laboratories of
Gr tzel with replacing the planar semiconductor electrode with a porous film of
nanocrystalline TiO2 particles deposited onto a conducting glass electrode. The light
harvesting efficiency and the overall efficiency for solar energy conversion increased

7
by an order of magnitude (around 10%) attributable to the huge surface area of the
nanocrystalline TiO2 film. A schematic representation of a nonacrystalline dye
sensitised TiO2 solar cell is depicted in Figure 2.1.
Figure 2.1: Representation of a dye-sensitised TiO2 solar cell
excitation (2.1)
injection (2.2)
recombination (2.3)
relaxation (2.4)
regeneration of dye (2.5)
dark current (2.6)
The relative energy levels and the kinetics of electron transfer processes at
the liquid junction of the sensitised semiconductor | electrolyte interface determine
the efficiency of a DSSC in the energy conversion process. For efficient operation of
the solar cell, there are few criteria must be fulfilled. The criteria are listed as below.
1. The electron injection must be faster than the decay of the dye excited state.
2. Rate of re-reduction of the oxidized sensitizer (dye cation) by the electron
donor in the electrolyte (Equation 2.4) must be higher than the rate of back
reactions. Back reactions included the reaction of the injected electrons with
8
the dye cation (Equation 2.3) and reaction of injected electrons with electron
acceptor in the electrolyte (Equation 2.6).
3. The kinetics of the reaction at the counter-electrode must also guarantee the
fast regeneration of charge mediator (Equation 2.5) otherwise this reaction
could become rate limiting in the overall cell performance.
For DSSC consisted of nanocrystalline TiO2 and Ru bipyridyl complexes
(dye), it has fast charge injection process which usually in femtosecond time domain.
In contrast, the electron back reaction (Equation 2.3) is much slower, usually in
several microseconds or longer. The difference in these 2 processes (forward and
reverse electron transfer rate) allows the efficient processing of the reduction of the
dye cation by iodide and the percolation of the injected electrons in the TiO2 film to
arrive at the back contact (counter-electrode).
The dye regeneration rate reaction which represented by Equation 2.4 is
essential for the efficient of the cell since it affects the relative amount of electrons
that leave the semiconductor and contribute to photocurrent. Base on some
experiment, there are suggestion regarding the mechanism for of re-reduction of the
oxidized dye by iodide. They proposed that, re-reduction of the oxidized dye
involves the formation of I2 radial on the surface of the oxide and then followed by
disproportion. The reaction can be represented by Equation 2.7 and 2.8.
(2.7)
(2.8)
Depends on the nature and concentration of the cation in electrolyte, this pathway
can be preferred if iodide ions were adsorbed on the surface. For the injected
electrode, besides dye cation, it will also react with triiodide (Equation 2.6). This
reaction (“dark current”) is the main loss mechanism for the DSSC and it might
happen by means of traps and intermediate reactions (Longo & Paoli, 2003).
9
2.2 Metal Oxides – Nanocrystalline Titanium Oxide
When choosing semiconductor for DSSC application, there are few factors which
must be considered. First requirement related to the relative energy levels at the
semiconductor | sensitizer interface. The CB (conduction band) edge of the
semiconductor must in the location which allows charge injection from the exited-
state of the dye. Secondly, morphological and structural characteristics of the
semiconductor film must be considered as its play a very important role in the
processes for the solar cell operation. This is due to the fact that semiconductor
nanoparticles exhibit a large number of traps (band gap localized states) and it can
present distinct Fermi Levels. This will definitely affect the kinetics for charge
transfer and recombination at the semiconductor | sensitizer interface. Besides, a
suitable degree of porosity is also an important factor. The structure of the pores
must guarantee the regeneration of the oxidized dye by permit the penetration of the
electrolyte containing the redox couple, and permit an effective mass transport of
electroactive species by diffusion. Moreover, the interconnected particles must
exhibit in the porous film to allow the percolation of injected electrons. Fifth factor is
regarding the crystallinity of the particles as it tends to influence the injection of
electron and their transport through the network of particles in the film. Lastly, the
thickness of the film must be well design since increasing the film thickness also
increase the probability for dark current which is main loss mechanism in a
nanocrystalline TiO2 DSSC (Equation 2.6). There is an optimal TiO2 film thickness
in which the cell produces the maximum photocurrent.
Besides factors that mentioned, the characteristic of the transparent electrode
used as substrate will also affect the properties of porous TiO2 films. Usually, glass
electrodes are coated with a thin conductive layer of fluorine-doped tin oxide (FTO)
or tin-doped indium oxide (ITO). These electrodes have sheet resistivity of 10-20
and it is quite transparent in the visible region. However, as glass-ITO
electrons undergo heat treatment, electrodes resistivity can increase considerably
which cause an increase in the series resistance, decrease DSSC performance. When
glass-FTO electrons are heated to the same temperature as glass-ITO electrons, this

10
effect is not observed. Therefore, transparent based on FTO are more adequate for
the application in DSSC than ITO electrodes.
Compare to cells prepared by tin oxide (SnO2) and zinc oxide (ZnO), cells
prepared with TiO2 in anatase crystalline form exhibit higher performance. TiO2 is a
wide bandgap semiconductor ( ), non-toxic and inert compound, an
inexpensive and readily available material (Longo & Paoli, 2003).
2.2.1 Effect of Grain Size, Number of Layer and Thickness
Size of TiO2 tends to affect the efficiency of the DSSC. Hence, the characteristics of
DSSC with single layer TiO2 with different sizes were studied. This aspect has
studied by Ngamsinlapasathian, Sreethawong, Suzuki and Yoshikawa in year 2004.
In their study, cells are made from nanocrystalline mesoporous TiO2 with grain size
of 10 to 15 nm (MP-TiO2) and commercial P25 titania with grain size of 30 to 60 nm.
Their results show that, cell with MP-TiO2 has much higher short-circuit
photocurrent density (Jsc) than P25 cell. Furthermore, it also has higher incident
photon-to-current conversion efficiency (IPCE) in the region between 400 and
475nm. This is due to its anatase phase, high surface area, and mesoporous structure.
On the other hand, IPCE is lower in red region compare to thick P25, and when
thickness increases, Jsc decreases noticeably.
Nanoparticles TiO2 is able to increase the area of TiO2 film and propose IPCE
than large particles. However it was unable to absorb red light through light
scattering due to insufficient film thickness. Besides, although thick TiO2 film are
preferable to support large amount of dye to obtaining higher cell performance, thick
film tends to crack because of film shrinkage, increases tendency for recombination
between electrons injected from the excited dye to conduction band of TiO2 and
ion in the electrolyte, and hence, reduces efficiency. Therefore combination of
various size of TiO2 is recommended as nanoparticles are essential for increase
11
surface area, and hence, amount of dye, while large particles (scattering particles) are
needed to enhance absorption of red light and prevent film shrinkage. It is
impracticable to increase surface area and light scattering due to their inversely
proportional relationship. For all researches mentioned below, N719 is used as dye.
In 2008, a study proposes the relationship between size of scattering particles
and the corresponding efficiency. The main nano-TiO2 layer is anatase particle with
20nm diameter. Thickness of the main-layer is 7 µm (1L) and 14 µm (2L)
respectively. The scattering rutile TiO2 particles consist of particles size of 0.3 µm
(G1) and 0.5 µm (G2). The efficiency (η) for 1L, 1L+G1, 1L+G2, 2L, 2L+G1 and
2L+G2 are 7.55%, 8.94%, 8.78%, 8.60%, 9.09% and 9.15%. Similar with research
done by Z. S. Wang et al., their result show that, smaller scattering particles exhibit
better scattering efficiency then large scattering particles. However, this is only
applicable to main layer with thickness of 7 µm. For main layer with thickness of 14
µm, there is no significant size-dependent scattering efficiency due to reduced
quantity of transmitted light (Koo et al., 2008).
The thick film can also be fabricated by blend MP-TiO2 with P25 (MP-TiO2 +
P25). The P25 is able to increase the thickness and hence, lead to higher absorbed in
red region. The IPCE around 70% was achieved at wavelength of 530nm. Besides, it
converts incident light to current efficiently in the region from 400 to 750 nm.
Furthermore, it also helps to prevent film cracking. However, the photocurrent was
not high enough to get high cell efficiency. Ngamsinlapasathian et al. (2004)
discovered that, cell performance can be improved by using double-layered MP
TiO2/P25 TiO2 electrode. In their research, single layer electrode consists of MP-
TiO2 + P25. Double layer cell consists of MP-TiO2 + P25 as top layer, transparent
MP-TiO2 layer as intermediate layer and substrate. They concluded that, double layer
cell has higher dye absorption due to high surface area of MP-TiO2 (double layer cell
has more MP-TiO2). Besides, it also able to increase light scattering and lead to
greater light harvesting efficiency. Solar conversion efficiency up to 8.1% was
obtained for double layer cell.

12
In May 2004, Z. S. Wang et al. found that, multilayer structure is superior to
the mono- and double-layer structure. In their research, TiO2 photoelectrodes with
seven different structures was design and investigated. There are four types of paste
used. Firstly, paste N with 100 wt% 23nm TiO2 nanoparticles. Secondly, paste M‟
which consists of 60 wt% 23nm TiO2 nanoparticles and 40 wt% 50nm TiO2
nanoparticles. Thirdly, paste M which consists of 60 wt% 23nm TiO2 nanoparticles
and 40 wt% 100nm TiO2 nanoparticles. Lastly, paste S with 100 wt% 100nm TiO2
nanoparticles. The structure types are N, M, NS, NM, NMS, NM‟MS and NM‟MS
with anti-reflection layer.
For solar cell with N and M paste, M has higher efficiency. Efficiency for N
and M are 7.62% and 8.37% respectively. By comparing these structures, it is clear
that a suitable combination of nanoparticles and scattering particles is necessary to
improve cell performance. However, it was not able to reach maximum as it
subjected to back-scattering which is due to the large particles near the conducting
glass results unavoidably in light loss. The back-scattering effect can be reduces or
suppress by double layer film (NS and NM). Efficiency for NS and NM are 8.95%
and 9.22% respectively. NM has higher efficiency due to increase in amount of
small particles and resulted in increase of dye absorption. As compare to monolayer,
double layer is better in term of back-scattering suppression, but above 620 nm, its
light-scattering effect is not as efficient as structure M. A better result should be
obtained when scattering centres are gradually increased since the path-depth length
of light increases with wavelength. As a result, multilayer structure was developed.
DSSC with structure of NM‟MS yielded a higher efficiency than NMS, which is
9.81%. This is due to its large surface concentration of dye and the suitable light-
scattering centre gradient. When a thin layer of anti-reflection layer is added, the
greatest efficiency is obtained. Efficiency for NM‟MS with anti-reflection layer is
10.23%.
Wang, Kawauchi, Kashima, and Arakawa (2004) proposed that, the optimal
thickness of TiO2 nanoparticles fall in the range of 15-18µm. Base on their study, the
dye build up dominates the photocurrent generation below 18 µm and resulting in an
increase in Jsc. when the thickness is more than 18 µm, recombination plays a key
13
role in the performance. In contrast to Jsc, Voc decrease linearly with increase in film
thickness due to charge recombination and mass transport limitation in the thinker
film. Furthermore, when thickness increases, series resistance grows quickly. The
redox species and electrons migrate in a long path length to complete the circuit are
the key factor that lead to increase in series resistance. By taking into account of both
Jsc and Voc, the efficiency of solar cell increase with thickness until 16 µm and follow
by reduction.
2.2.2 Effect of Anatase and Rutile Phase
Microstructure of metal oxides (main layer) is believed to affect the conversion
efficiency of DSSC. This was proven Ngamsinlapasathian et al. Their result shows
anatase phase is essential for main layer of the metal oxide. This is partly due to the
difference in the flat-band potential of anatase and rutile as the anatase conduction
band is 0.2 V more negative than rutile. Therefore, if the same redox mediator is
employed, a larger maximum photovoltage can be obtained on anatase than on rutile.
Besides, short-circuit photocurrent of rutile is 30% lower than anatase due to lesser
amount of adsorded dye as a result of smaller surface area per unit volume compared
with the anatase (G. H. Li et al., 2009).
For scattering particles, the different in refractive index between anatase and
rutile scattering particles tend to influence the scattering efficiency. Hence, the
effects of crystal phase of scattering particles on photovoltaic performance are
investigated. Ultraviolet-visible spectroscopy (UV-Vis) reflectance spectra show that,
rutile scattering particle has higher reflectance than anatase in almost the whole
wavelength region. This causes slightly higher Jsc for rutile scattering particle film
than for anatase scattering particle film. Thus, rutile particles-based scattering layer
has better scattering efficiency compare to anatase-base scattering layer (Koo et al.,
2008).
14
2.2.3 Sintering Time and Temperature
One of factors that affect the DSSC‟s efficiency is the sintering temperature.
Ngamsinlapasathian et al. (2004) found that, the high efficiency was obtained when
the cell sintered at 500˚C for 1h (single layer) and 450˚C for 2h (double layer). The
result obtained shows that, further increase in Jsc was noticed when the sintering
temperature was increased. This is because increase in sintering temperature tends to
result in better crystallinity which is favourable for anchoring the geometry of the
dye and hence leading to faster electron transport. However, the longer the sintering
time at high temperature was, the more the resistivity of conducting glass. The
increase in resistivity caused series resistance in the cell increases and thus the Voc
and FF reduce. Therefore, the electrodes should be sintered at optimum sintering
temperature to obtain high Jsc due to higher crystallinity and complete elimination of
the organic surfactant in the pores. At the same time, the cell should sinter at
optimum sintering time to minimize resistivity.
2.3 Dye Sensitizer
The dye sensitizer is acting as molecular electron pump in the DSSC. It is function
by absorbs the visible light, follow by pump an electron into semiconductor and then
accepts electron from the redox couple in the electrolyte. This is a repeat cycle. In
order to be suit for DSSC application, the dye must present in certain characteristics
to ensure efficiency in the charge injection and regeneration process. Firstly, it must
have a strong absorption in the visible range. Secondly, it must have high stability
and reversibility in the oxidized, ground and excited states. Lastly, it must also have
a suitable redox potential in relation to the semiconductor conduction band edge and
redox charge mediator in the electrolyte. In this section, characteristics of Ru
Complex dye will be discussed (Longo & Paoli, 2003).

15
2.3.1 Single Layer Ru Complex
The dye sensitizer is acting as molecular electron pump in the DSSC. It is function
by absorbs the visible light, follow by pump an electron into semiconductor and then
accepts an electron from the redox couple in the electrolyte. This is a repeat cycle. In
order to be suit for DSSC application, the dye must present in certain characteristics
as listed in below to ensure efficiency in the charge injection and regeneration
process (Longo & Paoli, 2003).
1. It must has a strong absorption in the visible range.
2. It must has high stability and reversibility in the oxidized, ground and excited
states
3. A suitable redox potential in relation to the semiconductor conduction band
edge and redox charge mediator in the electrolyte
The most efficient sensitizers are based on bipyridyl complexes of transition
metals, mainly ruthenium (Ru) (II). This is because generally Ru complexes show a
strong and broad absorption band in the visible range due to metal to ligand charge
transfer (MLCT) leading to excited states with long lifetimes. Besides, oxidized
Ru(II) complex has long-term chemical stability. Using amphidentate ligands, for
example, CN- or -SCN, chelation of the metal which will lead to some tuning of
spectral response can take place. By altering peripheral groups (axial ligand or chain
substitution), the tendency of the dye to aggregate on solution or on the surface can
be affected. Additionally, the choice of anchoring groups of the dye also has a curial
effect in the performance of the DSSC. Normally, the bipyridyl rings with anchoring
substituent groups at 4,4‟-positions are employed in order to ensure the molecular
organization of the dye on the oxide surface, as well as to promote electronic
coupling of the donor levels of the dye with the acceptor levels of the semiconductor.
Carboxylic or phosphonic acids are the preferred anchoring groups for dye used in
solar cells because they react spontaneously with the surface hydroxylic group of the
oxide surface to form the corresponding esters which is the linkages that exhibit good
stability. Last but not least, the selection of counterions and the degree of protonation
which are related to the solubility of the dye in organic or aqueous solvents are also
16
included in the molecular design of the photosensitizers. Numerous research groups
started to tune the electronic and optical properties by exchanging one or more of the
ligands with using N3 as reference. Five different approaches included substituting
the chromophore of the dye, change protonation level of N3, extending the π-system,
develop amphiphilic dyes with alkyl chains (two of the four carboxlic groups were
replaced by long alkyl chains) and using different anchoring groups (Dye Sensitized
Solar Cell, n.d.).
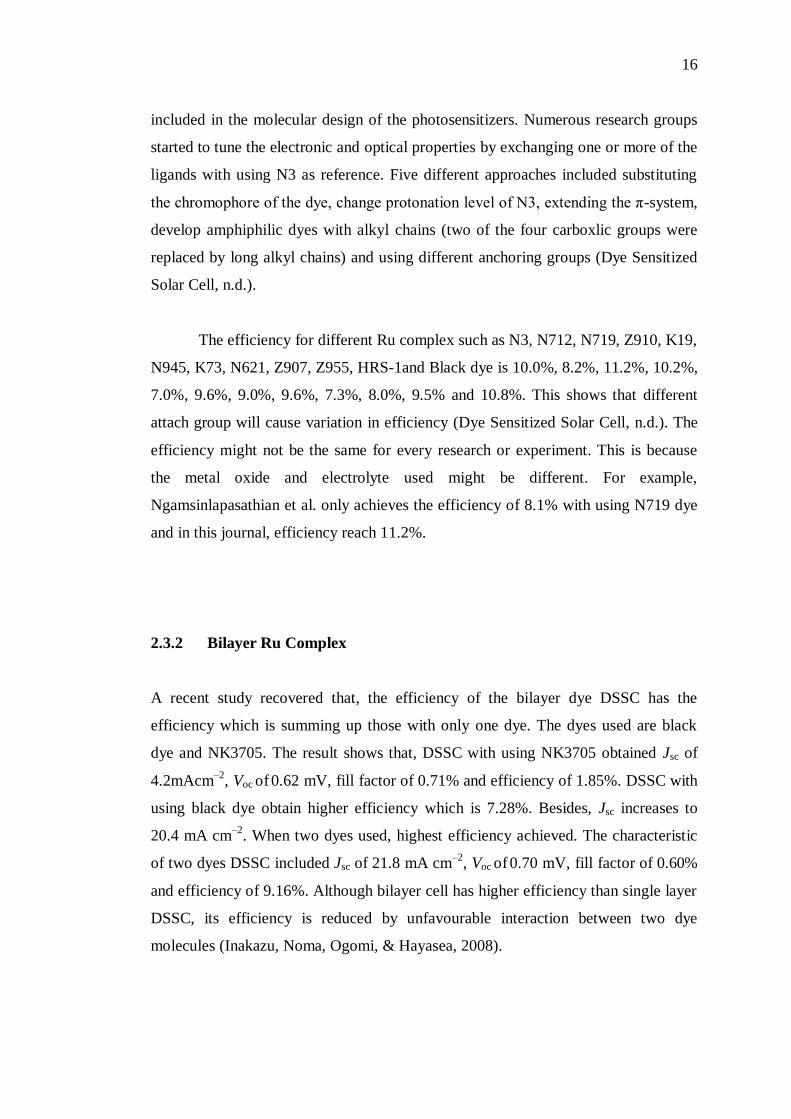
The efficiency for different Ru complex such as N3, N712, N719, Z910, K19,
N945, K73, N621, Z907, Z955, HRS-1and Black dye is 10.0%, 8.2%, 11.2%, 10.2%,
7.0%, 9.6%, 9.0%, 9.6%, 7.3%, 8.0%, 9.5% and 10.8%. This shows that different
attach group will cause variation in efficiency (Dye Sensitized Solar Cell, n.d.). The
efficiency might not be the same for every research or experiment. This is because
the metal oxide and electrolyte used might be different. For example,
Ngamsinlapasathian et al. only achieves the efficiency of 8.1% with using N719 dye
and in this journal, efficiency reach 11.2%.
2.3.2 Bilayer Ru Complex
A recent study recovered that, the efficiency of the bilayer dye DSSC has the
efficiency which is summing up those with only one dye. The dyes used are black
dye and NK3705. The result shows that, DSSC with using NK3705 obtained Jsc of
4.2mAcm–2
, Voc of 0.62 mV, fill factor of 0.71% and efficiency of 1.85%. DSSC with
using black dye obtain higher efficiency which is 7.28%. Besides, Jsc increases to
20.4 mA cm–2
. When two dyes used, highest efficiency achieved. The characteristic
of two dyes DSSC included Jsc of 21.8 mA cm–2
, Voc of 0.70 mV, fill factor of 0.60%
and efficiency of 9.16%. Although bilayer cell has higher efficiency than single layer
DSSC, its efficiency is reduced by unfavourable interaction between two dye
molecules (Inakazu, Noma, Ogomi, & Hayasea, 2008).
17
2.4 Electrolyte
For stable operation of the DCCS, the redox couple in the electrolyte plays in
importance role which it must carry the charge between the photoelectrode and the
counter-electrode for dye regeneration. After the injection of electron, the oxidized
dye must be reduced by the electron donor in the electrolyte as soon as possible.
Therefore, the selection of charge mediator must consider its redox potential, which
must be suitable for dye regeneration. Furthermore, the redox couple must be able to
reverse fully and should not absorb visible light. Lastly, the solvent should permit the
rapid diffusion of charge carries, at the same time, not causing desorption of the dye
from oxide surface. The properties of redox couple will affect several processes in
DSSC. This included re-reduction of the oxidized state of the dye, electron-transfer
kinetics at the counter-electrode, dark current reaction, the process of ion-pairing
with the dye and charge transport in the semiconductor film an in solution (Longo &
Paoli, 2003).
Recently, under irradiation of 100mWcm-2
(AM 1.5), the overall light-to-
electricity conversion efficiency of DSSC with liquid electrolyte have reached 11%
(Yang et al., 2007). However, the achievement of long-term stability at temperature
about 80 to 85˚C, which is an important requirement for outdoor application, still
remains a major challenge. The critical factors limiting the long-term performance
of DSSC, especially at elevated temperature are the leakage of liquid electrolyte,
possible desorption of loosely attached dyes, photodegradation in the desorbed state
as well as corrosion of the Pt counter by the triiodide/iodide couple (P. Wang et al.,
2003).
Several attempts have been made to improve the long-term stability, which
included p-type inorganic and organic hole conductors. Due to inefficient hole
transport which is causes by imperfect contact between the dye-anchored electrode
and hole conductor, the efficiency with using hole conductors are relatively low
(Kang et al., 2004). Furthermore, as compare to liquid electrolyte, DSSC with solid
polymer electrolyte achieved lower conversion efficiency due to high recombination
18
rate at the TiO2/solid-state electrolyte interface and the low conductivity of solid-
state electrolyte (Lu, Koeppe, Gu, & Sariciftci, 2006).
An alternative to overcome the disadvantage of hole conductors is used
polymer gel to quasi-solidify the liquid electrolyte. Polymer gel is a system that
consists of a polymer network swollen with a solvent. It has both cohesive properties
of solid and diffusive transport properties of liquid. Polymer gel electrolytes possess
a high ambient ionic conductivity but poor mechanical properties compared to pure
polymer electrolytes.
The development of non-corrosive electrolyte is the direction of one current
research. The most promising result is obtained with Co(II)/Co(III) redox couple
with overall efficiency up to 4%. However, the researchers do not considered the
obvious benefits which could be achieved. These benefits may be explained by the
perfect functioning of couple wherein negatively charged ion carries the
positive electrical charge. The resulting electrostatic repulsion between the electron
in the TiO2 and the hole on the ion may be advantages for slow interfacial
recombination kinetics (Lenzmann & Kroon, 2007).
2.4.1 Liquid Electrolytes
The efficiency up to 11% have been reported in section 2.4 and this result is typical
achieved with acetonitrile (ACN) based liquid electrolyte. ACN is a low-viscosity
volatile solvent and this electrolyte consists of ACN:VN (3/1), 1M 1-propyl-3-
methylimidazolium iodide (PMII), 0.03 M iodide (I2) , 0.1 M guanidinium
thiococynate (GuSCN) and 0.5 M tert-bytylpuridin (TBP). It uses comparatively low
iodide concentration. It is able to achieve high efficiency; however, it was not able to
achieving the best long term stability at the same time. Therefore, other electrolyte
formulations which use less volatile solvents or ionic liquids along with higher
iodine concentrations are desired (Yang et al., 2007).

19
An alternative for acetonitrile based liquid electrolyte is methoxypropionitrile
(MPN) based liquid electrolyte. This electrolyte is referred to as robust electrolyte. It
consists of MPN, 1M 1-propyl-3-methylimidazolium iodide (PMII), 0.15 M iodide
(I2), 0.1 M guanidinium thiococynate (GuSCN) and 0.5 M 1-butyl-1H-benzimidazole
(NBB). MPN-based electrolyte has higher stability than ACN-based electrolyte, but
it leads to a lower efficiency output which is in the range of 7% to 9%. (Lenzmann,
& Kroon, 2007) Both ACN- and MPN-based liquid electrolyte are use widely due to
acceptable vapour pressure which ranging from 9 hPa for MPN-based to 97 hPa for
ACN- based (Dye Senitized solar cells, n.d.).
Ionic liquid electrolyte is other type of liquid electrolyte. Ionic liquid (IL) is a
salt in the liquid state. The toxic organic solvents use in liquid electrolyte may be
disadvantages to preparation and operation of DSSC. Organic solvents are chemical
class of compounds share a common structure which is at least 1 carbon and 1
hydrogen atom. The organic solvents such as acetonitrile, methoxyacetonitrile or
methoxypropionitrile are even harmful to the environment (An et al., 2006). While
ordinary liquids are made up of electrically neutral molecule, ILs are composed
solely of anions and cations. Cations included Imidazolium, Pyrazolium, Triazolium,
Thiazolium and more. Anions are classified into organic and inorganic. The
examples of organic anions are Sulfonate, Imide, and Methide. While for inorganic
anions, they are and
. R is represent halide, CF3, C2F5, and other electron
withdrawing aryl or alkyl substitutes. ILs based liquid electrolyte have several
advantages, which are, non-flammable, non-corrosive, thermally and hydrolytically
stable, wide liquid range and negligible vapour pressure (Covalent Associaes, Inc.,
n.d.). It is environmental friendly but the efficiency was low compare to ACN- and
MPN- based liquid electrolyte. An example of ionic liquid is LiI(C2H5OH)4-I2 with
efficiency of 4.9% (Xue et al., 2004).

20
2.4.2 Gel Electrolytes
Generally, gel electrolytes are obtained by incorporating a large amount of a liquid
plasticizer and/or solvent which containing the desired ionic salts into a polymer
matrix. During gelation, a dilute or more viscous polymer solution is converted into a
high viscosity system, a stable gel with polymer host structure. The name “gelator” is
giving for the polymer or oligomer that from this stable network because it solidifies
the liquid phase. The mechanical properties of the gel can be improved by cross
linking the components and/or incorporated thermoset into gel electrolyte
formulation. Hence, gel can be form by either chemical or physical crosslinking
process. Physical crosslinking is also known as “enlargement network”. For covalent
crosslinking it will leads to the irreversible formation of gels. The polymer use as
polymer matrices included poly(ethylene oxide), poly(acrylonitrile), poly(vinyl
pyrrolidinine), poly(vinyl chloride), poly(vinyl carbonate), poly (vinylidene fluoride)
and poly(methyl methacrylate) (Günes, 2006).
Succinonitrile is a molecular plastic crystal, when silica nanoparticles and 1-
butyl-3-methylimidazolium tetrafluoroborate (BMIBF4) added, it become gel by
introducing the hydrogen bond (O-H...F) network. By adding silica nanoparticles and
BMIBF4, the thermostability of the cell was improved. Moreover, compare with
electrolyte without succinonitrile, the electrolyte with relatively high succinonitrile
content has higher conductivity, ionic diffusion coefficient and cell performance.
Therefore, succinonitrile-based gel electrolyte satisfies the need for both
thermostability and high conductivity. Besides that, the cell which is fabricated was
able to work well at high temperature (60 – 80 ˚C) and shows excellent long-time
stability (Chen et al., 2007).
The second type of gel electrolyte is thermoplastic gel electrolyte (TPGE).
The TPGE can be prepared by a simple and convenient protocol. It has thermoplastic
character, high conductivity and long-term stability. Furthermore, by tuning the
composition, its viscosity, conductivity and phase state can be controlled. Using
poly(ethylene glycol) as host, propylene carbonates solvent and KI/I2 as ionic

21
conductors, a DSSC with a photoelectric conversion efficiency of 7.22% was
achieved (Wu et al., n.d.).
Thermosetting gel electrolyte (TSGE) which is based on polyacrylic acid-
polyethylene glycol (PAA-PEG) hybrid is another type of gel electrolyte. The hybrid
contained shows a unique character of superabsorbent (PAA). It can absorb large
amount of liquid electrolyte and the absorbed liquid is hard to be volatilized and
leaked. Therefore, it maintains the merits of liquid electrolyte used in DSSC such as
high ionic conductivity, good soakage property with counter electrode and porous
TiO2. DSSC which used TSGE as electrolyte attains photocurrent efficiency of 6.10%
under AM 1.5 irradiation (Wu et al., n.d.).
Lianos et al. (n.d.) proposes another type of gel electrolyte which is known as
nanocomposite gel electrolytes. These materials are composed of organic and
inorganic substances in nanoscale. Without any other additional aids, the inorganic
sub-phase can act as gelling agent, and at the same time works simultaneously as a
gluing material that holding the counter and working electrode together. While for
organic sub-phase, it is made of mixture of chemical substance which provides ionic
conductivity. The example of organic sub-phase is silica. The advantage for these
nanocomposite gels is that it can accommodate appropriate solvents within the
organic sub-phase so that ionic conductivity can be raised to acceptable level. By
using these gel electrolytes, the DSSCs were able to obtain the overall efficiency
exceeding 5% and stable for several months under ambient conditions.
In year 2007, Lu, Koeppe, Gunes, and Sariciftci fabricated a quasi-solid-state
DSSC employing commercial glue („„SuperGlues‟‟) as electrolyte matrix. This
commercial glue consists of cyanoacrylate. The cyano groups of the cyanoacrylate
can form a supramolecular complex with tetrapropylammonium cations. This
reaction will immobilizes the cations and hence produce a desired anionic charge
transport which is essential for a good performance of the iodide/triiodide electrolytic
conductor. Cyanoacrylate quasi-solid state electrolyte is a very good laminating
agent and therefore offers significant advantages in the fabrication of solar cells.
22
Besides, it is an ordinary and low-cost compound. Efficiency of 4% was obtained for
DSSC with this electrolyte.
Poly(vinylidenrflouride-co-hexaflouropropylene) (PVdF-HFP) based gel
electrolyte is one of the famous polymer gel electrolyte. Since it is a fluorinated
polymer, PVdF-HFP is known to be photo-electrochemically stable even in the
presence of titanium oxide and platinum nanoparticles. (Kang et al., 2004)
Furthermore, when compare with poly(acrolynitrile), poly(ethylene glycol),
poly(oligoethylene glycol methacrylate), poly(siloxane-co-ethylene oxide) and
poly(butylacrylate), PVdF-HFP shows relatively high ionic conductivities at room
temperature (Suryanarayanan, Lee, Ho, Chen, & Ho, 2007).
The last type of gel electrolyte available is poly(methyl methacrylate) based
DCCS. This type of gel electrolyte use sodium iodide and iodine as source of ,
PMMA as polymer host, and 1,2-propanediol carbonate and dimethyl carbonate as
organic mixture solvents. PMMA based gel electrolyte possessed a good long-term
stability. Under irradiation of 100 mW cm-2
simulated sunlight, light-to-electrical
energy conversion efficiency of 4.78% was obtained (Yang et al., 2007).
2.4.3 Comparison of Liquid and Gel Electrolytes
In year 2004, Kang et al. (2004) studied the characteristic of polymer gel electrolyte
containing PVdF-HFP in N-methyl-2-pyrrolidone (NMP). They concluded that, the
energy conversion efficiency of this electrolyte is comparable to ACN- and MPN-
based liquid electrolyte. The efficiency of PVdF-HFP gel electrolyte, ACN- and
MPN- based liquid electrolyte are 2.86%, 2.91% and 2.80% respectively. They also
found that, compare to NMP, PVdF-HFP is hardly soluble in both ACN and MPN.
Yang et al. (2007) reported that the efficiency of quasi-solid-state DSSC is
almost equal to DSSC with a liquid electrolyte under irradiation of 100 mWcm-2
. The
23
polymer electrolyte used in their study is PMMA-EC/PC/DMC-NaI2 with energy
conversion efficiency of 4.78%.
P. Wang et al. (2003) demonstrated that MPN- based liquid electrolyte can be
gelled by PVdF-HFP polymer without affecting the charge transport of the
triiodide/iodide couple inside the polymer network. The found that, at AM 0.01, 0.1,
0.5, 1.0 and 1.5, there is no different between conversion efficiency for both liquid
and quasi-solid electrolyte.
The stability of the liquid and quasi-solid electrolyte has been tested out by
Yang et al. (2007). In their study, two DSSCs were fabricated using the same
technology. After 5 days, the efficiency for DSSC with liquid electrolyte decrease
40%, while for DSSC with polymer gel electrolyte, only 8% of decrease in efficiency
is reported. After 40 days, the DSSC with liquid electrolyte only have 27% of
original light-to-electrical energy conversion efficiency. For DSSC with polymer gel
electrolyte, it keeps 83% of the original efficiency.
The polymer gel electrolyte is in quasi-liquid form when it is in room
temperature. When the temperature increases up to 80˚C, it will become viscous
liquid. When N719 is used as sensitizer, the overall efficiency is decreased
approximately 35% during the first week (80˚C). This clearly reflects of the
molecular structure of the sensitizer of the sensitizer on the stability of DSSC. For
N719 dye, one of the 4,4‟-dicarboxylic acid-2, 2‟-bipyridines is replaced with 4,4‟-
dinonyl-2,2‟-bipyridine to make the dye more hydrophobic. P. Wang et al. (2003)
believes that desorption of N719 at high temperature is the factor that result in the
poor thermostability of the DSSC.
2.5 Counter Electrode
There are 3 requirements for a material to be used as counter-electrode in a DSSC.
Firstly, the material must has low charge-transfer resistance. Secondly, it must has
24
high exchange current densities for the reduction of the oxidized from of the charge
mediator (Equation 2.5). Lastly, when contact with electrolyte medium use in the cell,
such material must presents chemical stability (Longo & Paoli, 2003).
Up to year 2003, the best charge mediator for the DSSC is the redox
couple. Nonetheless, in several materials, the iodine reduction reaction is not
reversible, and its kinetics is solvent dependent. Besides, the electron-transfer
kinetics for reduction of triiodide to iodide which occur at the surface of transparent
glass-ITO or glass-FTO electrodes is very slow. Platinum, particularly a thin film
deposited by thermal oxidation of hexachloroplatinate is the best material that acts as
catalyst and provides high exchange current for this reaction (Longo & Paoli, 2003).
2.6 Alternative Device Approaches
2.6.1 Natural Dye
Recently, although high efficiency cell have been achieved with nanoporous TiO2
electrodes which sensitised with ruthenium complexes, there still remains the need
for alternative photosensitizers. This is because ruthenium complexes are a high cost
material and it has a long-term unavailability. Besides, it also required time
consuming chromatographic purification procedures. In this context, application of
natural dyes has numerous advantages over rare metal complexes and other organic
dyes. Natural dyes have wide availability, easy extraction, can be applied without
further purification, are environment-friendly and considerably reduce the cost of the
devices. In natural dye, anthocyanins are a group for colour of flowers, fruits and
vegetables.
In year 2007, Wongchareea, Meeyooa, & Sumaeth fabricated DSSCs using
natural dye extract from rosella, blue pea and a mixture of the extracts. The
efficiency is 0.37%, 0.05% and 0.15% respectively. They also found out that,
extracting temperature, extracting solvent and pH of the extract solution are the

25
parameters which will affect the efficiency of natural dye. When the temperature
decrease from 100˚C to 50˚C and pH change from 3.2 to 1.0, efficiency of rosella
extract sensitised DSSC was improved from 0.37% to 0.70%. By comparing to water,
after being exposed to the simulated sunlight for a short period, the efficiency of a
DSSC using ethanol as extracting solvent was found to be diminished.
In year 2007, Lai, Su, Teoh, and Hon have fabricated water-based DSSC
which used gold nanoparticles as a Schottky barrier on a TiO2 electrode, commercial
dyes and free natural dyes as dye sensitizer and aqueous electrolyte of Ce4+/3
+
system. The function of Schottky barrier is to avoid electron from going back to
oxidized dye or electrolyte. The efficiency for commercial (Crystal violet,
Mercurochrome and Chlorophyll) and natural dyes [Bongainvillea brasiliensis
Raeusch, Garcinia suubelliptica, Ficus Reusa Linn and Rhoeo spathacea (Sw.)
Stearn.] are 0.0997%, 0.617%, 0.705%, 0.454%, 0.691%, 1.18% and 1.49%. The
result shows that natural dyes have higher efficiency that commercial dye due to the
carbonyl and hydroxyl groups presented on anthocyanin molecules. These groups
can be bound to the surface of the TiO2 film and hence favour the photoelectric
conversion effect. While for commercial dyes, when they are aggregated or mixed
together, it will lead to high thermal relation. Since absorbed energy in aggregated
dyes is mostly changed into heat (loss), low efficiency resulted.
In 2008, few flowers are extracted by ethanol and HCl with pH less than 1
was added so that solution becomes deep red in colour. The oxonium ion in acidic
solution results in an extended conjugation of double bonds through 3 rings of the
aglycone moiety. This helps in the absorption of the protons in the visible spectra.
When there is change in pH, it will tend to increase the number of conjugated double
bonds in the molecules and lower the energy level of the electronic transition
between the ground states and the excited state. Hence, photons absorb at greater
wavelength. Due to condensation of alcoholic-bound protons with the hydroxyl
groups in the surface of nanoparticles TiO2 layer, the chemical absorption of these
dyes takes place. Although natural dyes have several advantages over other organic
dye and rare metal complexes, the efficiency obtain is less than 2%. In order for
26
natural dyes to be used in large scale photon conversion, further studies and
researches are needed to improve its efficiency (Fernando & Senadeera, 2008).
2.6.2 DSSC with TiO2 Nanotube
Recently, DSSC fabricated using order arrays of titanium oxide nanotubes which
grown on titanium has been carry out. Its structure, dynamics of electron transport
and recombination are the parameters which researches are interested in. When
nanotubes (NT) are used as metal oxides DSSC, both interior and exterior walls are
cover with dye molecules. It is able to improve the charge-collection efficiency by
promoting faster transport and slower recombination. The recombination is 10 times
slower than nanoparticles-base DSSC (NP) and therefore increases the charge-
collection efficiency by 25%. In addition, NT-based also has higher photocurrent
densities, and 20% higher light-harvesting efficiency than NP-based. However, due
to the insulating oxide layer between NT which forms during anodization, its fill
factor (FF) is lower than NP. The lower FF offset the gain in Jsc resulting the
comparable performance of TiO2 NP- and NT-based DSSC (Zhu, Neale, Miedaner,
& Frank, n.d.).

27
CHAPTER 3
3 METHODOLOGY
3.1 Equipments
This chapter included characterisation techniques such as scanning electrode
microscope (SEM), X-ray Diffractometer (XRD), IV tester and UV-visible
spectrometer. Besides, the equipments, raw materials and apparatus used in this
project are stated. Lastly, cell preparation and assembly are discussed.
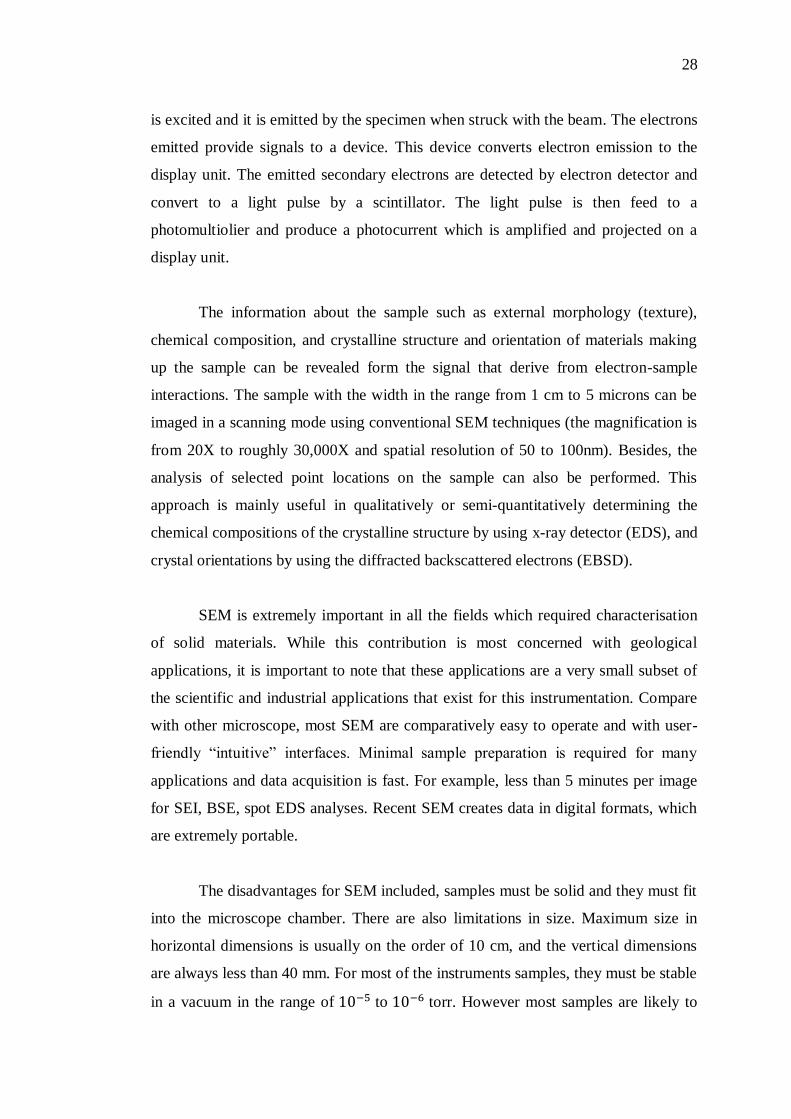
3.1.1 Scanning Electron Microscope
Scanning electron microscope (SEM) is a type of electron microscope which uses a
focused beam of high-energy electron to generate a variety of signals at the surface
of solid specimens. When the specimen is bombarded by electrons, it emits X-ray
and secondary electrons. The emitted X-ray is used in chemical analysis and
secondary electrons are used for image generation.
SEM consists of column, tube and computer. The column with high voltage is
connected to the filament current supply with using a tube. High voltage and current
are needed for electron beam generation. With the help of the lenses the beam is
focus down to a drastically narrow point which is about two nanometers across. This
beam is then scanned rapidly in lines back and forth across a specimen. The electron
28
is excited and it is emitted by the specimen when struck with the beam. The electrons
emitted provide signals to a device. This device converts electron emission to the
display unit. The emitted secondary electrons are detected by electron detector and
convert to a light pulse by a scintillator. The light pulse is then feed to a
photomultiolier and produce a photocurrent which is amplified and projected on a
display unit.
The information about the sample such as external morphology (texture),
chemical composition, and crystalline structure and orientation of materials making
up the sample can be revealed form the signal that derive from electron-sample
interactions. The sample with the width in the range from 1 cm to 5 microns can be
imaged in a scanning mode using conventional SEM techniques (the magnification is
from 20X to roughly 30,000X and spatial resolution of 50 to 100nm). Besides, the
analysis of selected point locations on the sample can also be performed. This
approach is mainly useful in qualitatively or semi-quantitatively determining the
chemical compositions of the crystalline structure by using x-ray detector (EDS), and
crystal orientations by using the diffracted backscattered electrons (EBSD).
SEM is extremely important in all the fields which required characterisation
of solid materials. While this contribution is most concerned with geological
applications, it is important to note that these applications are a very small subset of
the scientific and industrial applications that exist for this instrumentation. Compare
with other microscope, most SEM are comparatively easy to operate and with user-
friendly “intuitive” interfaces. Minimal sample preparation is required for many
applications and data acquisition is fast. For example, less than 5 minutes per image
for SEI, BSE, spot EDS analyses. Recent SEM creates data in digital formats, which
are extremely portable.
The disadvantages for SEM included, samples must be solid and they must fit
into the microscope chamber. There are also limitations in size. Maximum size in
horizontal dimensions is usually on the order of 10 cm, and the vertical dimensions
are always less than 40 mm. For most of the instruments samples, they must be stable
in a vacuum in the range of to torr. However most samples are likely to
29
outgas at low pressure such as rocks saturated with hydrocarbons. Besides, “wet”
samples such as coal and organic materials or swelling clays are unsuitable for
examination in conventional SEM‟s. Therefore, “low vacuum” and “environmental”
SEMs exist so that these types of samples can be successfully examined in these
specialized instruments. The EDS detectors, which is a part of SEM cannot detect
very light elements such as H, He, Li, and elements with atomic numbers less than
11. Majority of SEMs used solid state x-ray detector, which known as EDS. These
detectors are very fast and easy to utilize, but when compared with wavelength
dispersive x-ray detectors (WDS) on most electron probe microanalyzers (EPMA),
they have relatively poor energy resolution and low sensitivity to elements present in
low abundances. In order for electrically insulating samples to study in conventional
SEM‟s, an electrically conductive coating must be applied to it. This step can only
been ignore if and only if the instrument is capable of operation in a low vacuum
mode.
Figure 3.1: Scanning Electron Microscope (SEM)

30
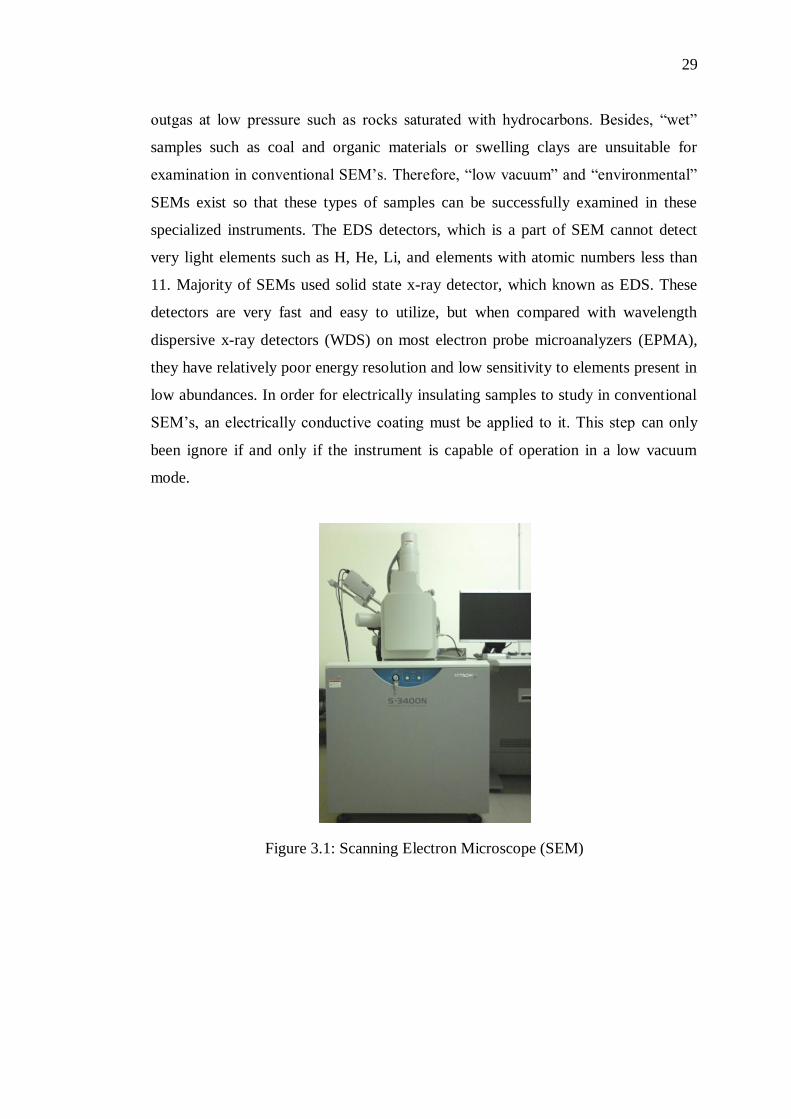
3.1.2 X-ray Diffractometer
Diffraction is a phenomenon occurs when wave encounters a series of regularly
spaced obstacles that are able to scattering the wave. Besides, the obstacles must
have spacing that is comparable in magnitude to the wavelength. The common
diffraction technique included striking the monochromatic x-radiation to a powdered
or polycrystalline specimen which consisting of many fine and randomly oriented
particles. In order to ensure that some particles are properly oriented such that every
possible set of crystallographic planes will be available for diffraction, each powder
particles (or grain) must be a crystal and having a large number of them with random
orientation.
The main applications of X-ray Diffractometer are to characterise the
crystallographic structure and preferred orientation of the thin film. X-rays which
used to provide electron beam are generated by heated tungsten filament. The
chamber (also known as X-ray tube) is evacuated to prevent the oxidation of tungsten
filament. The beam is accelerated toward the sample mounted on the sample stage
(anode) with a potential different of 30kV. When the electron struck the sample, a
spectrum of X-rays is emitted. The X-rays leave the chamber through beryllium
window. Since the atomic weight of elements affects the absorption of X-rays
passing through the material, beryllium is chosen as window material due to its small
atomic number. Due to same reason, lead is used for shielding X-ray equipment and
absorbing stray radiation. During operation, continuous cooling of anode is essential
because only small portion of the energy of the incident electron beam is converted
into X-ray while most of the energy is converted into heat. The heat generate could
heat up the anode and anode would melt if cooling do not take place.
X-ray Diffraction (XRD) is a powerful technique used for characterizes and
identifies phases. The advantages of the technique are simplification of sample
preparation, rapidity of measurement, and ability to analyse mixed phases. However,
it has difficulty of mounting large single crystal. Collection time is rather short even
for small and weakly scattering samples since all possible crystal orientations are
measured simultaneously.
31
Figure 3.2: X-ray Diffractometer
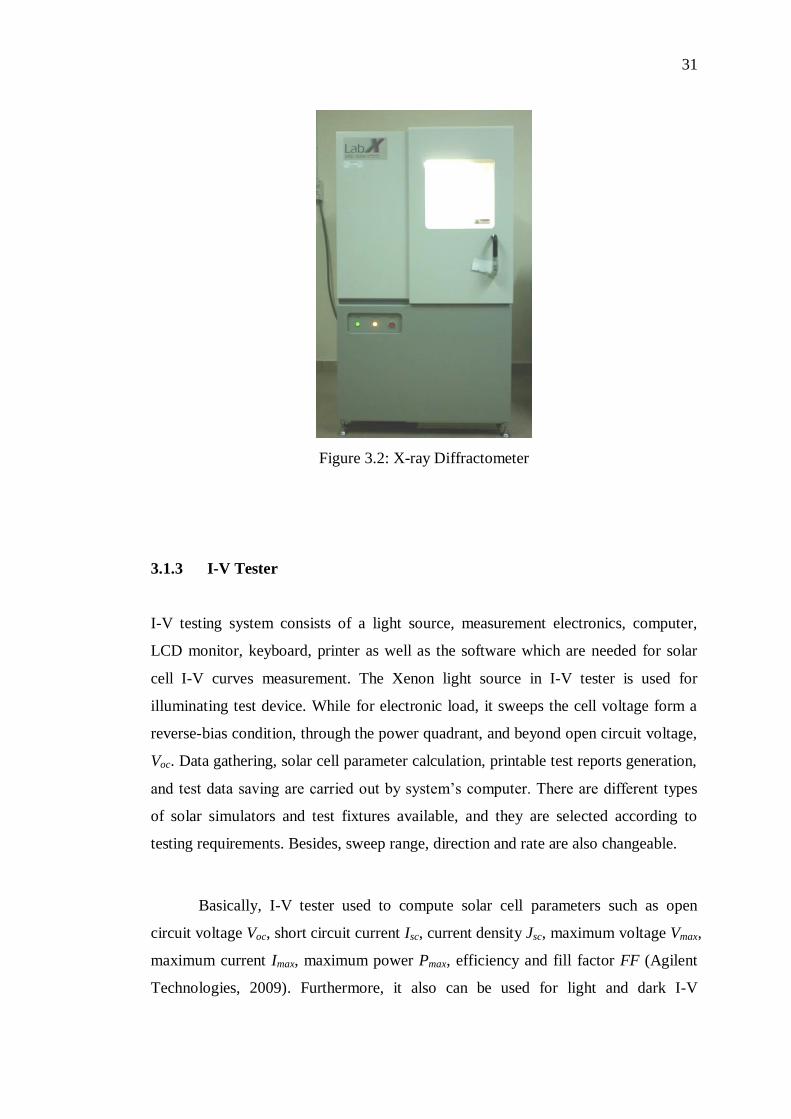
3.1.3 I-V Tester
I-V testing system consists of a light source, measurement electronics, computer,
LCD monitor, keyboard, printer as well as the software which are needed for solar
cell I-V curves measurement. The Xenon light source in I-V tester is used for
illuminating test device. While for electronic load, it sweeps the cell voltage form a
reverse-bias condition, through the power quadrant, and beyond open circuit voltage,
Voc. Data gathering, solar cell parameter calculation, printable test reports generation,
and test data saving are carried out by system‟s computer. There are different types
of solar simulators and test fixtures available, and they are selected according to
testing requirements. Besides, sweep range, direction and rate are also changeable.
Basically, I-V tester used to compute solar cell parameters such as open
circuit voltage Voc, short circuit current Isc, current density Jsc, maximum voltage Vmax,
maximum current Imax, maximum power Pmax, efficiency and fill factor FF (Agilent
Technologies, 2009). Furthermore, it also can be used for light and dark I-V

32
characteristics measurement. Some of the I-V tester manufacturers use irradiance
monitor to compensate for lamp flicker and drift (PV Measurements, Inc., 2009).
Figure 3.3: I-V Tester
3.1.4 Ultraviolet Spectroscopy
Ultraviolet Spectroscopy (UV spectroscopy) is a physical technique of the optical
spectroscopy that uses light in the visible (VIS), ultraviolet and near infrared ranges.
For Ultraviolet-visible spectroscopy (UV-Vis spectroscopy), its absorption
spectroscopy is in the ultraviolet-visible spectral region. The perceived colour of the
chemicals involved is affects by the absorption in the visible range. In this region,
molecules undergo electronic transitions. Different to fluorescence spectroscopy
which deals with transitions from the excited state to the ground state, UV-Vis
spectroscopy measures transitions from the ground state to the excited state.
When molecules (sample) is exposed to light with an energy that matches its
electronic transition, the electron is promoted to a higher orbital and some of the light
energy will be absorbed. The spectrometer will then records the wavelength at which

33
absorption occurs and the degree of absorption at each wave length. A graph of
absorbance versus wavelength is used to represent the resulting spectrum.
UV-Vis spectrophotometer is applicable in determining the absorption or
transmission of ultraviolet as well as the visible light of oxide film. It measures the
intensity of the light entering a sample and the light exiting a sample. The ratio of
these two intensities can be expressed as transmittance (%T). The concentration of
sensitising dye (absorbance) can be measure by Beer‟s Law which stated that the
absorbance is directly proportional to the concentration of a solution. The %T is
related to absorbance (A) in Equation 3.1.
A = 2 – [log(%T)] (3.1)
Figure 3.4: Ultraviolet Spectroscopy
3.2 Materials Used
Highly fluorine transparent conducting oxide (TCO) films coated on glass plates
(FTO glass) and Pt-coated glass were the glasses that used in this project. The paste
used in this project was 20nm anatase nanoparticle Titania paste. Sensitizer which
was chosen for this project is Ruthenium 535-bisTBA, N719 or (cis-
bis(isothiocyanato)bis(2,2‟-bipyridyl-4,4‟-dicarboxylato)-ruthenium(II)bis-tetrabutyl

34
ammonium). N719 was chosen rather than Ruthenium 535, N3 because it sensitizes
metal oxide, for example, TiO2 efficiently and giving higher open circuit voltage.
The electrolytes used were liquid ACN-based electrolyte, liquid MPN-based
electrolyte and quasi-solid MPN-based electrolyte. The liquid ACN-based electrolyte
was synthesized in the lab. It consists of acetonitrile, valeronitrile, 1-Butyl-3-
methylimidazolium (BMII), iodine, 4-tert-butylpyridine (TBP) and guanidinium
thiococynate (GuSCN). Surlyn®
-30 Sealant was used to seal FTO glass and Pt-coated
glass before dip into electrolyte. It is thermoplastic sealants which soften when less
than 100˚C.
3.3 Fabrication Processes
FTO and platinum coated glass were cut into small pieces with using diamond cutter.
The sequence of the chemical used in cleaning step for FTO glass was soap, distill
water, deionized water, acetone, ethanol and lastly deionized water. For Pt-coated
glass, the step was simpler. The sequence was ethanol and deionized water. Both
FTO and platinum glass were dried and heated at 400˚C to remove organic solvent
which contained in ethanol and acetone.
Dyes were prepared by mixing absolute ethanol with N719 and N3 powders.
The concentration of dye solution used in this project was 0.3 mM. Dye solution was
stored in the bottle which was wrapped with aluminium foil to avoid excitation of
dye when sunlight or electrical lightening presented.
The electrolytes used were liquid ACN-based electrolyte, liquid MPN-based
electrolyte and quasi-solid state electrolyte. ACN-based electrolyte was synthesized
35
in the lab and it is a solution of acetonitrile, valeronitrile, BMII, iodine, TBP and
GuSCN.
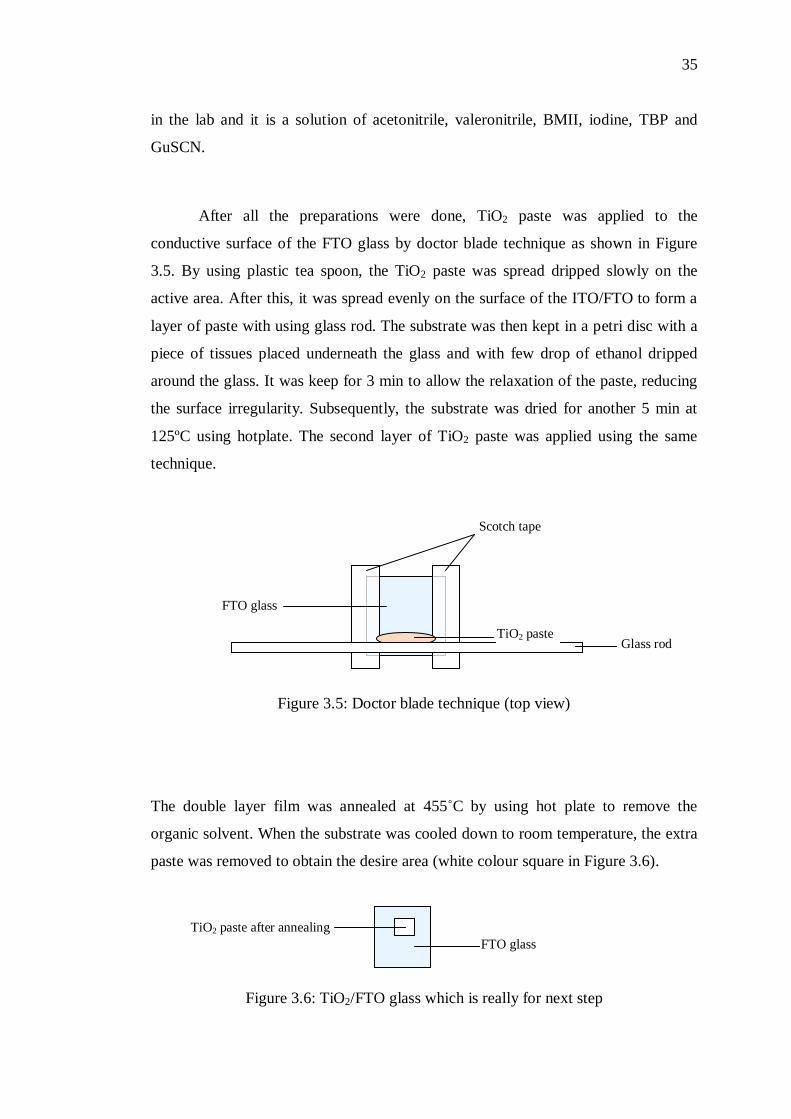
After all the preparations were done, TiO2 paste was applied to the
conductive surface of the FTO glass by doctor blade technique as shown in Figure
3.5. By using plastic tea spoon, the TiO2 paste was spread dripped slowly on the
active area. After this, it was spread evenly on the surface of the ITO/FTO to form a
layer of paste with using glass rod. The substrate was then kept in a petri disc with a
piece of tissues placed underneath the glass and with few drop of ethanol dripped
around the glass. It was keep for 3 min to allow the relaxation of the paste, reducing
the surface irregularity. Subsequently, the substrate was dried for another 5 min at
125ºC using hotplate. The second layer of TiO2 paste was applied using the same
technique.
Figure 3.5: Doctor blade technique (top view)
The double layer film was annealed at 455˚C by using hot plate to remove the
organic solvent. When the substrate was cooled down to room temperature, the extra
paste was removed to obtain the desire area (white colour square in Figure 3.6).
Figure 3.6: TiO2/FTO glass which is really for next step
Scotch tape
FTO glass
TiO2 paste Glass rod
FTO glass
TiO2 paste after annealing

36
After this, the substrate was carefully placed into a glass bottle. N719 solution
produced previously was dripped slowly into glass bottle until the substrate was fully
immersed in the sensitizer. The glass bottle was placed inside a closed box at room
temperature. Once TiO2 films were immersed in dye for 24 hours, the dyed film was
then taken out from the dye solution and cleaned with ethanol. Figure 3.7 (left)
shows the immersion of TiO2/FTO glass and the Figure 3.7 (right) shows the change
in colour of TiO2 paste after immersion.
Figure 3.7: Sensitising TiO2 film with N719. Picture in the right shows the top view
of the bottle.
A through hole was drill Pt-coated counter electrode. The dye-coated TiO2 electrode
and Pt-coated counter electrode were sandwiched using sealant. The cell was heated
on by using hot plate to melt the sealant. As shown in Figure 3.8, weight was applied
onto the cell to produce a fine seal.
Figure 3.8: weight applied during sealing
N719
Dyed TiO2 film
Hot plate
Weight
DSSC
Force
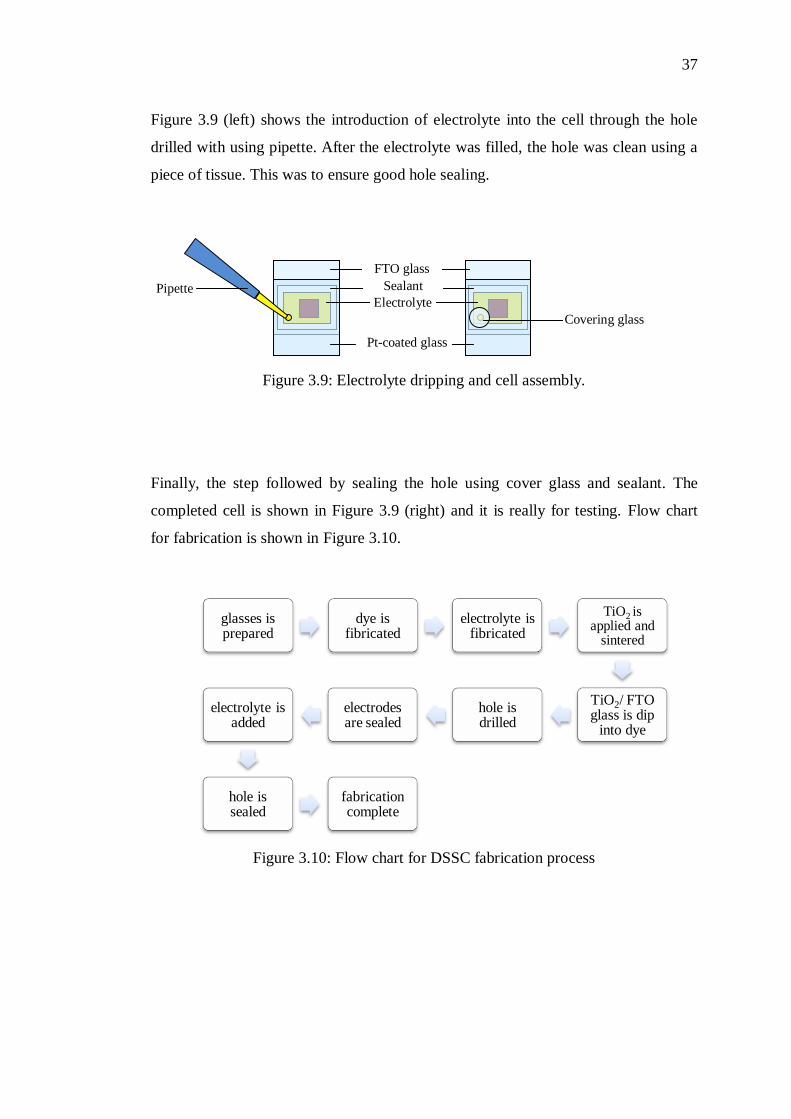
37
Figure 3.9 (left) shows the introduction of electrolyte into the cell through the hole
drilled with using pipette. After the electrolyte was filled, the hole was clean using a
piece of tissue. This was to ensure good hole sealing.
Figure 3.9: Electrolyte dripping and cell assembly.
Finally, the step followed by sealing the hole using cover glass and sealant. The
completed cell is shown in Figure 3.9 (right) and it is really for testing. Flow chart
for fabrication is shown in Figure 3.10.
Figure 3.10: Flow chart for DSSC fabrication process
glasses is prepared
dye is fibricated
electrolyte is fibricated
TiO2 is applied and
sintered
TiO2/ FTO glass is dip
into dye
hole is drilled
electrodes are sealed
electrolyte is added
hole is sealed
fabrication complete
FTO glass
Pt-coated glass
Sealant
Electrolyte
Covering glass
Pipette
38
CHAPTER 4
4 RESULTS AND DISCUSSION
4.1 Liquid MPN-based and ACN-based Electrolyte
As discussed in chapter 2, MPN-based electrolyte uses 3-methoxypropionitrile as
solvent while ACN- based electrolyte uses acetonitride and valeronitrile as solvents.
When the solvents for the electrolyte are different, the additive and concentration of
iodine used in the electrolyte will be affected as well hence probably will affect the
efficiency of DSSC. In this section, efficiency and stability of ACN- and MPN-based
electrolyte will be discussed.
4.1.1 Efficiency
The maximum energy conversion efficiency (η) of the DSSC can be calculated from
Equation 4.1.
where
= conversion efficiency
Jsc = short circuit photocurrent density, mA/cm2
Voc = open circuit voltage, V
FF = the fill factor
(4.1)

39
P = power of the incident light, 100mWcm-2
and
with
Isc = short circult photocurrent density, mA
A = area of DSSC, cm2
From Equation 4.1, it is clear that the efficiency is directly proportional to Jsc, Voc
and FF.
In the study of Yang & Liao (2009), DSSC that used ACN-based electrolyte
should achieve higher efficiency due to higher Voc and FF. This photovoltage
improvement was mainly due to two factors. Firstly, the back electron transfer at the
TiO2/electrolyte interface was suppressed. Secondly, the potential where dark
cathodic current started would be reduced. In the discussion onward, MPN used to
represent MPN-based electrolyte and ACN representing ACN-based electrolyte.
However, in this project, different result is obtained; DSSC with MPN shows
higher efficiency than that of ACN (Table 4.1). This might due to the preparation of
both electrolytes was different. ACN was prepared in the laboratory with open air
environment while MPN believed to be produced in an environment totally free from
contaminants was purchased from a supplier in Australia. Therefore, contamination
might occur during the preparation of ACN. Besides, quantity of iodine and additives
required for preparation of ACN was too small and causes inaccuracy. For example,
only 0.019035g of iodide was used to fabricate 20ml of ACN.
Table 4.1: Comparison of liquid MPN and ACN
Voc (V) Jsc (mA/cm2) FF η (%)
MPN 0.73 14.15 68.21 7.01
ACN 0.72 12.67 61.49 5.58
(4.2)

40
Figure 4.1: Photocurrent-voltage curve of liquid ACN and MPN
Figure 4.1 shows that, MPN exhibits higher Jsc compare to ACN, the associated
value for MPN and ACN are 14.15 and 12.67 mA/cm2 respectively. Yang & Liao
(2009) found that the increase of Jsc in MPN was associated with the suppression of
triiodide reduction at the TiO2/electrolyte interface and hence, led to a facile injection
of electron carriers into FTO substrate.
4.1.2 Stability
Performance of the solar cell can be affected by its stability. Low stability solar cell
will degrade in short period of time and its efficiency will decrease tremendously.
This is an undesirable characteristic of DSSC. No one will like to change the solar
cell frequently. This will be costly and at the same time, not environmental friendly.
In this study, measurement was taken once each day for the period of 32 days using a
particular solar cell to determine the stability of that cell. The measurement was not
able to perform continuously within these 32 days due to the lab was close during
weekends.
0
2
4
6
8
10
12
14
16
0 0.2 0.4 0.6 0.8
Ph
oto
curr
en
t d
ensi
ty (
mA
/cm
2)
Voltage (V)
ACN based
MPN based

41
Figure 4.2: Jsc for ACN and MPN
Figure 4.2 shows that Jsc decrease with the increase of time. Both ACN and
MPN decrease at a similar rate. After 32 days, Jsc for ACN and MPN was reduced by
7.3649 mA/cm2 and 9.5759 mA/cm
2 respectively. Decrease in Jsc was suspected to
be originated from the dye desorption. However, Kang et al. (2004) found that the
dye desorption essentially did not occur in ACN and MPN. In his study, amount of
dye desorbed from the TiO2 firms into the contacting solvent for 4 days was
measured. For comparison, NMP (N-mthyl-2-pyrrplidone), MPN and ACN were
used as the solvent. By comparing to ACN and MPN, dye molecule desorbed occur
NPM to some extend. This suggested that the decrease in the Jsc was not due to the
desorption of the dye from the TiO2 to electrolyte.
The second posibility of Jsc reduction is the damage of the electrolyte.
Leonardi (2010) found that, the strong reduction in Jsc was due to the cells were
damaged from the interaction with oxygen and moisture. His idea was supported by
Electrochemical Impedance Spectroscopy (EIS) measurements. Based on the Nyquist
diagram (Figure 4.3), the high resistance was located at the part of the curve which
representing the ionic diffusion (red circle). This curve was enlarged very much
toward higher resistance over a period of time. This represented the increment in
diffusion resistance which was mainly due to reduction of ions concentration. This
0
4
8
12
16
0 5 10 15 20 25 30 35
Jsc
Time (day)
MPN ACN
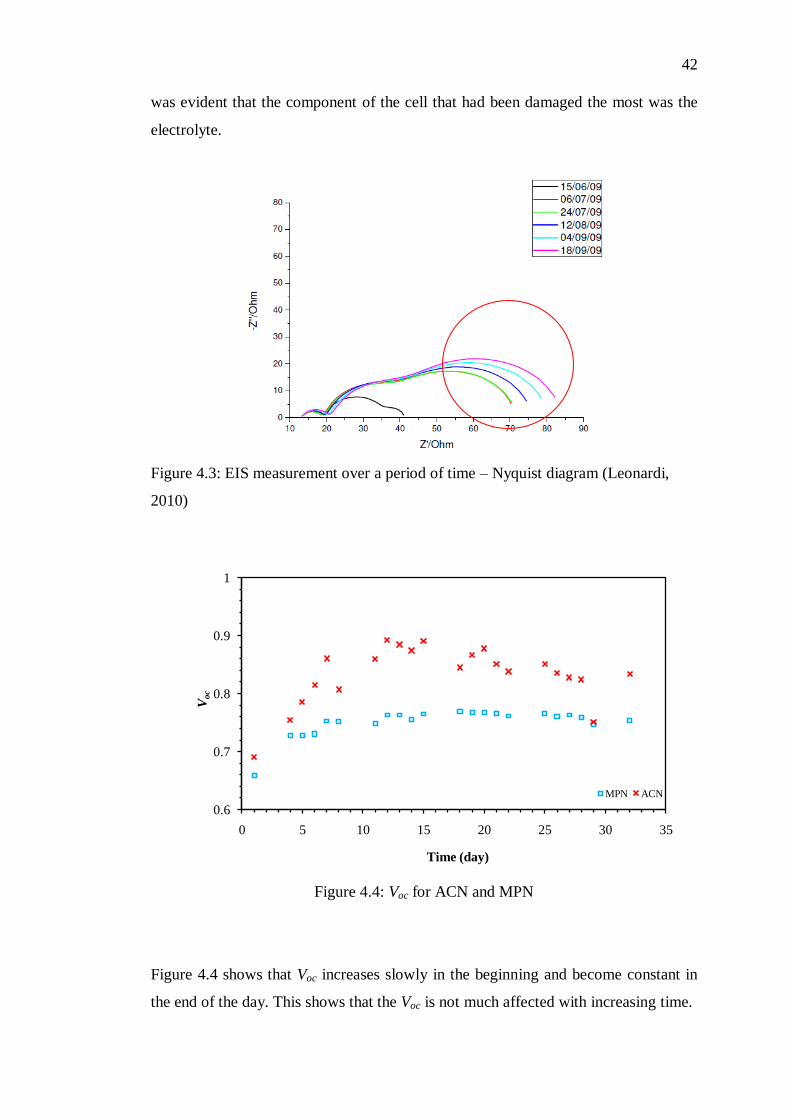
42
was evident that the component of the cell that had been damaged the most was the
electrolyte.
Figure 4.3: EIS measurement over a period of time – Nyquist diagram (Leonardi,
2010)
Figure 4.4: Voc for ACN and MPN
Figure 4.4 shows that Voc increases slowly in the beginning and become constant in
the end of the day. This shows that the Voc is not much affected with increasing time.
0.6
0.7
0.8
0.9
1
0 5 10 15 20 25 30 35
Voc
Time (day)
MPN ACN
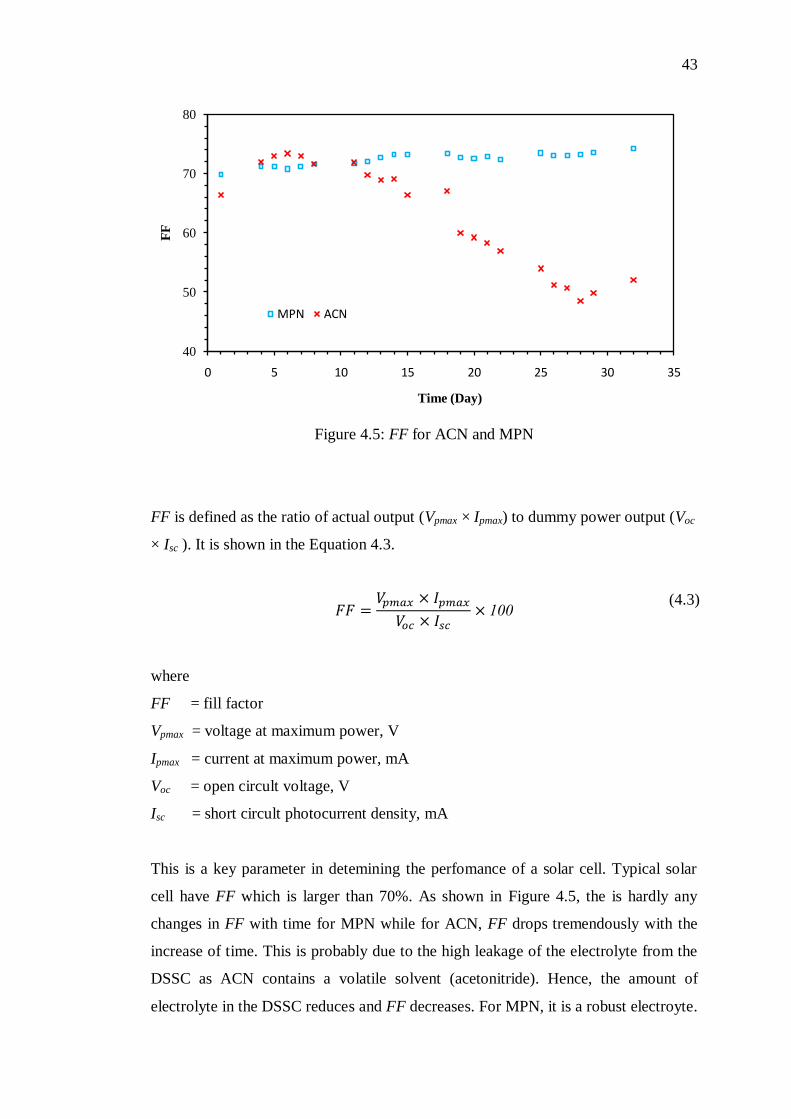
43
Figure 4.5: FF for ACN and MPN
FF is defined as the ratio of actual output (Vpmax × Ipmax) to dummy power output (Voc
× Isc ). It is shown in the Equation 4.3.
where
FF = fill factor
Vpmax = voltage at maximum power, V
Ipmax = current at maximum power, mA
Voc = open circult voltage, V
Isc = short circult photocurrent density, mA
This is a key parameter in detemining the perfomance of a solar cell. Typical solar
cell have FF which is larger than 70%. As shown in Figure 4.5, the is hardly any
changes in FF with time for MPN while for ACN, FF drops tremendously with the
increase of time. This is probably due to the high leakage of the electrolyte from the
DSSC as ACN contains a volatile solvent (acetonitride). Hence, the amount of
electrolyte in the DSSC reduces and FF decreases. For MPN, it is a robust electroyte.
40
50
60
70
80
0 5 10 15 20 25 30 35
FF
Time (Day)
MPN ACN
(4.3)

44
It is more stable than ACN and leakage is not a main problem, therefore, FF remains
stable.
Figure 4.6: Efficiency for ACN and MPN
Figure 4.6 shows the efficiency of DSSC with ACN and MPN. The highest
efficiency is recorded at day 6 and day 4 for MPN and ACN respectively. This is due
to time is needed for the added electrolyte to penetrate into the TiO2 layer (Kang et
al., 2004). The efficiency will then start to decrease with time. The trend for MPN is
relatively stable than ACN. The efficiency in day 32 decreases by 46.95% compare
to the highest recorded efficiency while for ACN, it decreases by 97.58%. This
shows that ACN is not able to achieve a long term stability compare to MPN. The
phenomenon is supported by the study of Yang et al. (2007) and Lenzmann & Kroon
(2007). The low stability of ACN is due to its low iodide concentration and solvent.
Acetonitrile is a low-viscosity volatile solvent, easily evaporated at normal room
temperature (25˚C).
Figure 4.6 also shows that the efficiency of ACN to reduce at a higher rate
compares to MPN. The numeral data for both ACN and MPN are shown in appendix
A, Table A and B respectively. In order to determine the factor that affects the
efficiency the most, it is needed to analyse in detail the trend of each parameter
0
2
4
6
8
0 10 20 30 40
Eff
icie
ncy (%
)
Time (Day)
MPN ACN

45
affecting the efficiency (Figure 4.2 – 4.5). Jsc for MPN and ACN decreases in similar
rate. Therefore, it is not the primary reason that causes higher reduction rate of
ACN‟s efficiency. ACN has higher Voc than MPN, but it is not enough to compensate
the decrease in FF. Voc for the ACN is higher than MPN by 0.1 to 0.2V, however, its
FF is lower than MPN by 0 to 20 times and decrease enormously after day 12. In
conclusion, FF is most significant factor that affects efficiency of ACN.
Generally, the long term stability for liquid electrolyte is low. This is due to
that liquid electrolyte easily volatilized and leak in long-term operation. Besides, the
life-time of the DSSC will be affected by the presence of water in the solar cell from
the surrounding through the imperfection packaging sealants. This will further cause
decrease in life-time of photogenerated electrons on the working electrodes which
induces the occurrence of the dark current to the electrolyte. Hence the life-time of
the DSSC is significantly deteriorated (H. L. Lu et al., n.d.).
4.2 Liquid and Quasi-solid MPN-based Electrolyte
Table 4.2 shows that the DSSC with quasi-solid (gel) electrolyte has similar
efficiency to that of liquid electrolyte. Nevertheless, the efficiency of quasi-solid
state DSSC still cannot reach the efficiencies of the conventional liquid electrolyte
cells due to the poor contact of the solid-state charge transport material with the dye-
coated TiO2 surface (Günes, 2006). The ion is more difficult to penetrate through
the TiO2 in the gel state. Kang et al. (2006) suggests to left the completed cells were
at room temperature for 1 day in order for the electrolyte to penetrate in TiO2 pores
prior to photocurrent-voltage (IV) measurement.
Table 4.2: Comparison of gel and liquid MPN
Voc (V) Jsc (mA/cm2) FF η (%)
Gel 0.74 15.07 59.51 6.59
Liquid 0.73 14.15 68.21 7.01
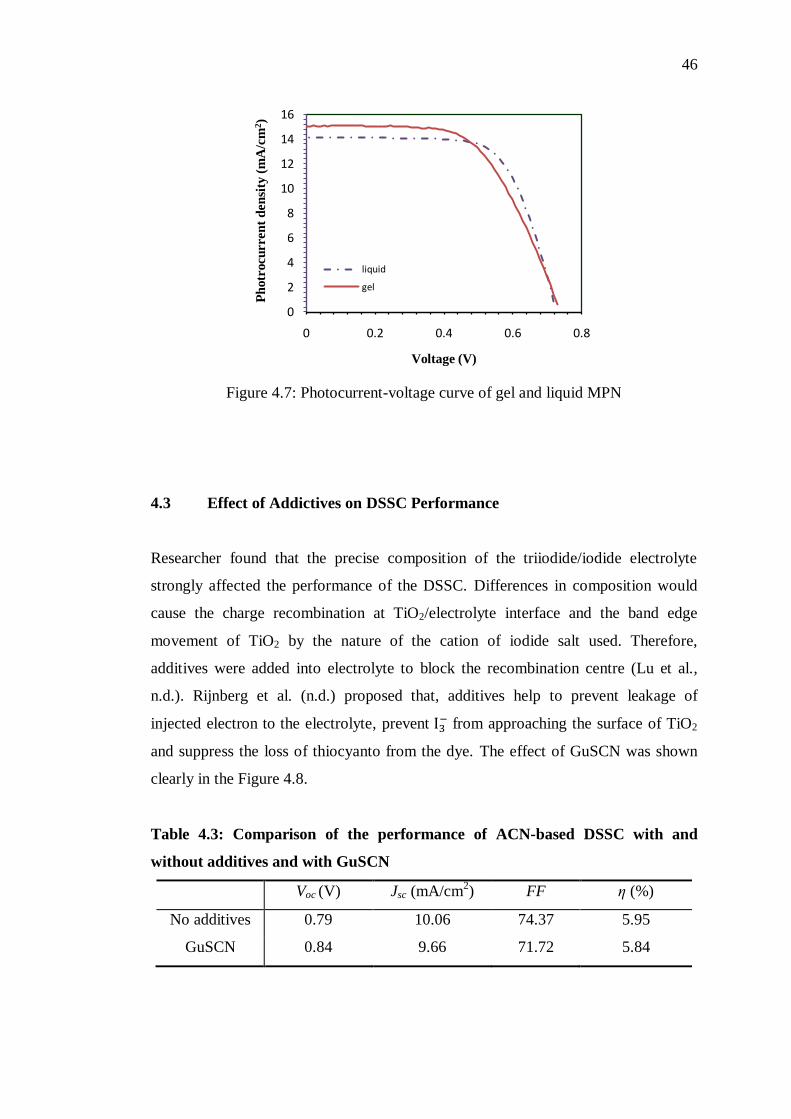
46
Figure 4.7: Photocurrent-voltage curve of gel and liquid MPN
4.3 Effect of Addictives on DSSC Performance
Researcher found that the precise composition of the triiodide/iodide electrolyte
strongly affected the performance of the DSSC. Differences in composition would
cause the charge recombination at TiO2/electrolyte interface and the band edge
movement of TiO2 by the nature of the cation of iodide salt used. Therefore,
additives were added into electrolyte to block the recombination centre (Lu et al.,
n.d.). Rijnberg et al. (n.d.) proposed that, additives help to prevent leakage of
injected electron to the electrolyte, prevent from approaching the surface of TiO2
and suppress the loss of thiocyanto from the dye. The effect of GuSCN was shown
clearly in the Figure 4.8.
Table 4.3: Comparison of the performance of ACN-based DSSC with and
without additives and with GuSCN
Voc (V) Jsc (mA/cm2) FF η (%)
No additives 0.79 10.06 74.37 5.95
GuSCN 0.84 9.66 71.72 5.84
0
2
4
6
8
10
12
14
16
0 0.2 0.4 0.6 0.8
Ph
otr
ocu
rren
t d
en
sity
(m
A/c
m2)
Voltage (V)
liquid
gel

47
Figure 4.8: Photocurrent-voltage curve of ACN-based DSSC with and without
GuSCN
Refer to Table 4.3, Voc for DSSC with GuSCN is higher than that of without
additive by 0.05V or 6.4%. This is because GuSCN suppresses the recombination
rate of DSSC. Increase in Voc will normally lead to increase in efficiency. (Dye
Sensitized Solar Cells, n.d.) However, in this study, the result shows the other way.
This might due to the lower FF of DSSC with GuSCN owing to the leakage of
electrolyte and hence, results in lower efficiency.
Table 4.4: Comparison of the performance of ACN-based DSSC with and
without pyridine derivative (TBP)
Voc (V) Jsc (mA/cm2) FF η (%)
No additives 0.7949 10.0572 74.3690 5.9453
TBP 0.8396 9.9501 73.9544 6.1780
0
2
4
6
8
10
12
0 0.2 0.4 0.6 0.8 1
Ph
oto
cu
rren
t d
en
sity
(m
A/c
m2)
Voltage (V)
no additive
Guanidinium derivatives

48
Figure 4.9: Photocurrent-voltage curve of ACN-based DSSC with and without TBP
TBP about 0.5M was added for most of the electrolyte and this is the
concentration used in this study. Result in Table 4.4 shows that TBP able to increase
the Voc by 0.0447V or 5.6%. Based on Equation 4.1, the increases in Voc will further
lead to the increase of efficiency. Therefore, compare to the untreated cell, the DSSC
with TBP has higher efficiency.
According to Lu et al. (n.d.), the increase of Voc was contributed from the
negative shift of Fermi level. This correlation can be explained by Figure 4.10. As
shown in the figure, the voltage was generated due to the energy gap between the
Fermi level of TiO2 and the redox potential of the electrolyte mediator. When the
Fermi level was shifted negatively, the maximum voltage increased, hence Voc
increased.
0
2
4
6
8
10
12
0 0.2 0.4 0.6 0.8 1
Ph
oto
cu
rren
t d
en
sity
(m
A/c
m2)
Voltage (V)
no addiditives
TBP

49
Figure 4.10: schematic energy diagram for DSSC
The energy gap between the LUMO and conduction band level of TiO2, ,
is an important factor to determine the Jsc of DSSC. The energy level of LUMO must
be sufficiently negative with respect to the conduction band of TiO2. However, when
TBP is added, conduction band (Ec) shifts negatively, reduces the . This cause the
driving force of the electron injection from N719 LUMO to the conduction band of
TiO2 reduces, hence, Jsc decreases. Therefore, the energy gap must be larger than
approximately 0.2V as driving force for electron-transfer reaction to occur with
optimal efficiency (Hara & Arawaka, 2003).
Based on Equation 4.1, when Jsc reduced, efficiency will be reduced.
However, the reduction of Jsc was compensated by increase in Voc. In this study,
addition of TBP improves the Voc and FF of DSSC and thus improves the efficiency
of the cell as shown in Table 4.4.
M. Y. Li et al. (2007) found that the positive effect of pyridine derivatives on
the Voc and FF was due to the adsorption of pyridine groups on TiO2 surface which
induces electron density into the TiO2 and creating a surface dipole. This results in
suppression of the recombination of photogenerated electron from TiO2 to triiodine
in the electrolyte. Besides, addition of TBP protects the device from the usual

50
destructive effect due to the presence of water and probably results in a smaller
reduction of Jsc (Rijnberg et al, n.d.).
4.4 Comparison of the performance for 4 DSSCs
Table 4.5 shows that Voc, Jsc, FF and η are different for 4 similar DSSCs with TiO2
metal oxide, N719 dye and MPN based electrolyte.
Table 4.5: I-V characteristic for sample A, B, C and D
Voc (V) Jsc (mA/cm2) FF η (%)
A 0.7321 10.1066 68.8034 5.0906
B 0.7568 11.7600 67.6369 6.0200
C 0.7260 14.1476 68.2089 7.0054
D 0.7581 15.9308 73.3363 8.8570
Sample D provided by Liu (2011)
The differences in DSSCs performance might be due to the crack formation
in the TiO2 paste of the cells as shown in the SEM micrograph (Figure 4.14). The
formation of crack is due to the film shrinkage resulting from the evaporation and
decomposition of organic substances and the considerable stress in the film induced
by the volume change due to the crystallisation of TiO2 (Ngamsinlapasathian et al.,
2004). At the boundary of the crack, TiO2 particle are not interconnected. This
hinders the percolation of injected electrons thus reduces the efficiencies of certain
cells.
Interconnection between first and second layer of the TiO2 may affect the
efficiency of the DSSC. When the connection between the TiO2 is stronger, the
efficiency of the DSSC will be higher. Poor contact between those layers hinders the
electron transfer. SEM micrographs in Figure 4.14 show the poor connection
between 2 layers of 20nm TiO2 while Figure 4.15 shows a good connection of those

51
layers. Thus, sample D has the highest efficiency among the 4 samples. Furthermore,
it is observed that the thickness of the TiO2 layer is less than the optimum thickness
(15 to 18 µm). Below optimum thickness, photocurrent generation is increase with
increase in thickness. Therefore, Jsc is lower and η are negatively affected (Z. S.
Wang et al., 2004).
4.5 XRD Analysis
To determine the phase identity and purity of TiO2 used in this project, XRD is
perform on the 20nm TiO2 paste. Figure 4.11, shows the XRD patterns of single and
double layers of the TiO2. Both patterns display sharp peaks suggesting that they are
crystalline in nature. Cell refinement was performed using “CHEKCELL” and all the
peaks could be fully indexed as tetragonal with anatase structure confirming the
formation of phase pure compound .Anatase phase is the preferred crystal polymorph
as it results in larger maximum photovoltage. Therefore, the DSSCs can achieve
better performance than that of DSSC with rutile TiO2 (G. H. Li et al., 2009).
2 theta (2θ)
Figure 4.11: XRD pattern of single and double layers of 20 nm TiO2
Single layer
Double layer

52
4.6 EDX
When other element is present in the paste, the conduction band of TiO2 might be
affected and it is not favourable for percolation of injected electrons. Consequently,
it acts as the obstacle for electron transfer and performance of the DSSC will be
affected.
Figure 4.12 shows the EDX result of a TiO2 paste. From the result, it is
proven that no other unwanted element is present in the TiO2 paste used in this study.
Small percentage of Carbon (C) might be coming from the carbon tape used for
attachment of sample to the sample holder, finger print and contaminants in the air.
Table 4.6: Elements presented in TiO2 paste
Element Wt% At%
C 01.23 02.84
O 34.60 59.99
Ti 64.17 37.16
Figure 4.12: EDX result of TiO2 paste

53
4.7 SEM
Figure 4.13: SEM micrograph of crack at the TiO2 paste (1300 x magnification).
a
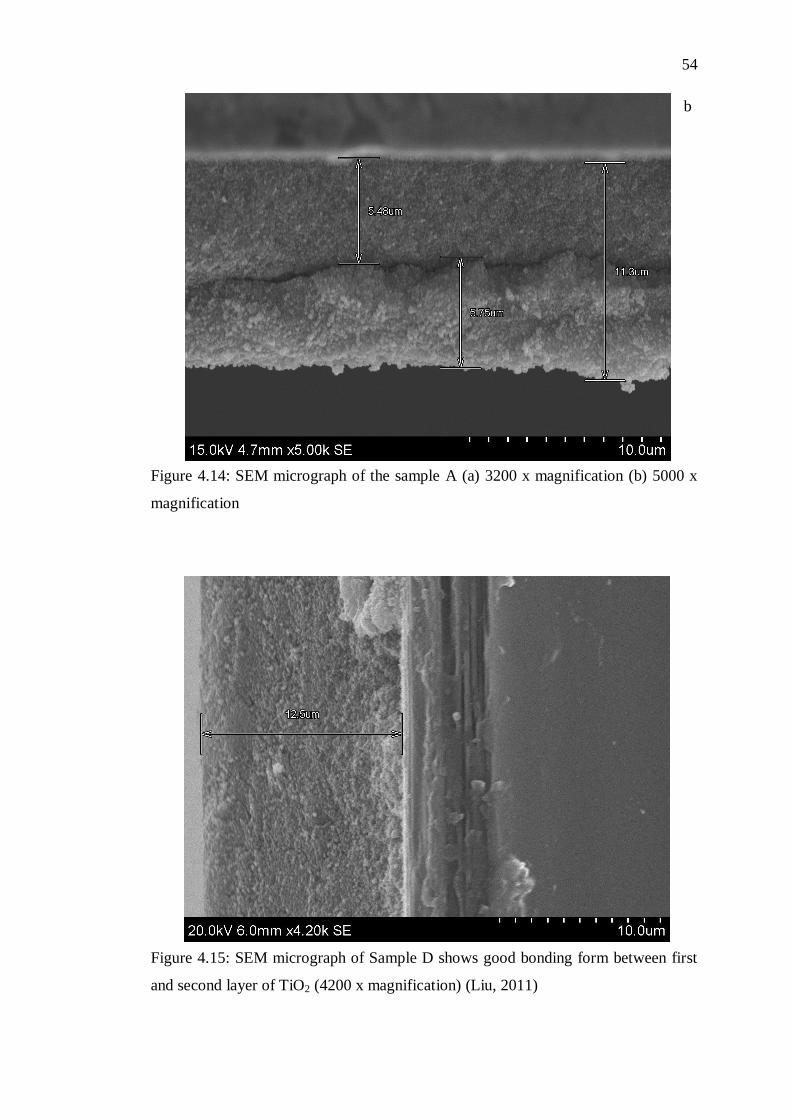
54
Figure 4.14: SEM micrograph of the sample A (a) 3200 x magnification (b) 5000 x
magnification
Figure 4.15: SEM micrograph of Sample D shows good bonding form between first
and second layer of TiO2 (4200 x magnification) (Liu, 2011)
b

55
CHAPTER 5
5 CONCLUSION AND RECOMMENDATIONS
5.1 Conclusion
The efficiency of the MPN-based electrolyte is higher than that of ACN-based
electrolyte. However, according to the other researches, the ACN-based electrolyte
should achieve a higher efficiency due to its formulations of relative low iodine
concentration in the electrolyte. Therefore, it is suggested that the main cause for this
difference is the fabrication process. On the other hand, higher iodine content in the
MPN-based electrolyte improves its stability.
DSSC with the quasi-solid MPN-based electrolyte has lower efficiency than
that of liquid MPN-based electrolyte due to poor contact of the quasi solid-state
charge transport material with the dye-coated TiO2 surface.
GuSCN is able to increase the Voc of the solar cell by suppressing the
recombination rate of DSSC. TBP yields the same result due to a negative
conduction band movement; TBP adsorbed on the TiO2 surface, its pyridine ring
induces electron density into the TiO2 and creating a surface dipole and suppresses
the recombination of photogenerated electron from TiO2 to triiodine in the electrolyte.
However, Jsc of DSSC is lower than untreated cells. This is because the negative
conduction band movement tends to reduce the driving force for electron injection to
the TiO2 conduction band.
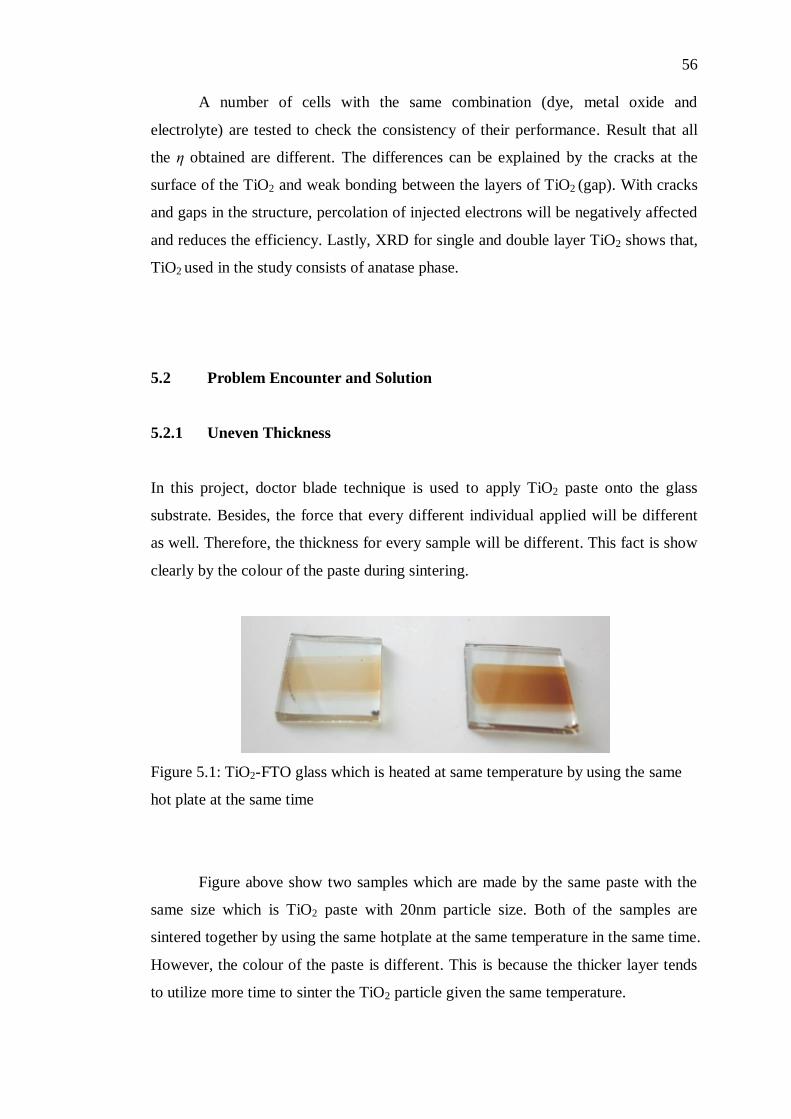
56
A number of cells with the same combination (dye, metal oxide and
electrolyte) are tested to check the consistency of their performance. Result that all
the η obtained are different. The differences can be explained by the cracks at the
surface of the TiO2 and weak bonding between the layers of TiO2 (gap). With cracks
and gaps in the structure, percolation of injected electrons will be negatively affected
and reduces the efficiency. Lastly, XRD for single and double layer TiO2 shows that,
TiO2 used in the study consists of anatase phase.
5.2 Problem Encounter and Solution
5.2.1 Uneven Thickness
In this project, doctor blade technique is used to apply TiO2 paste onto the glass
substrate. Besides, the force that every different individual applied will be different
as well. Therefore, the thickness for every sample will be different. This fact is show
clearly by the colour of the paste during sintering.
Figure 5.1: TiO2-FTO glass which is heated at same temperature by using the same
hot plate at the same time
Figure above show two samples which are made by the same paste with the
same size which is TiO2 paste with 20nm particle size. Both of the samples are
sintered together by using the same hotplate at the same temperature in the same time.
However, the colour of the paste is different. This is because the thicker layer tends
to utilize more time to sinter the TiO2 particle given the same temperature.
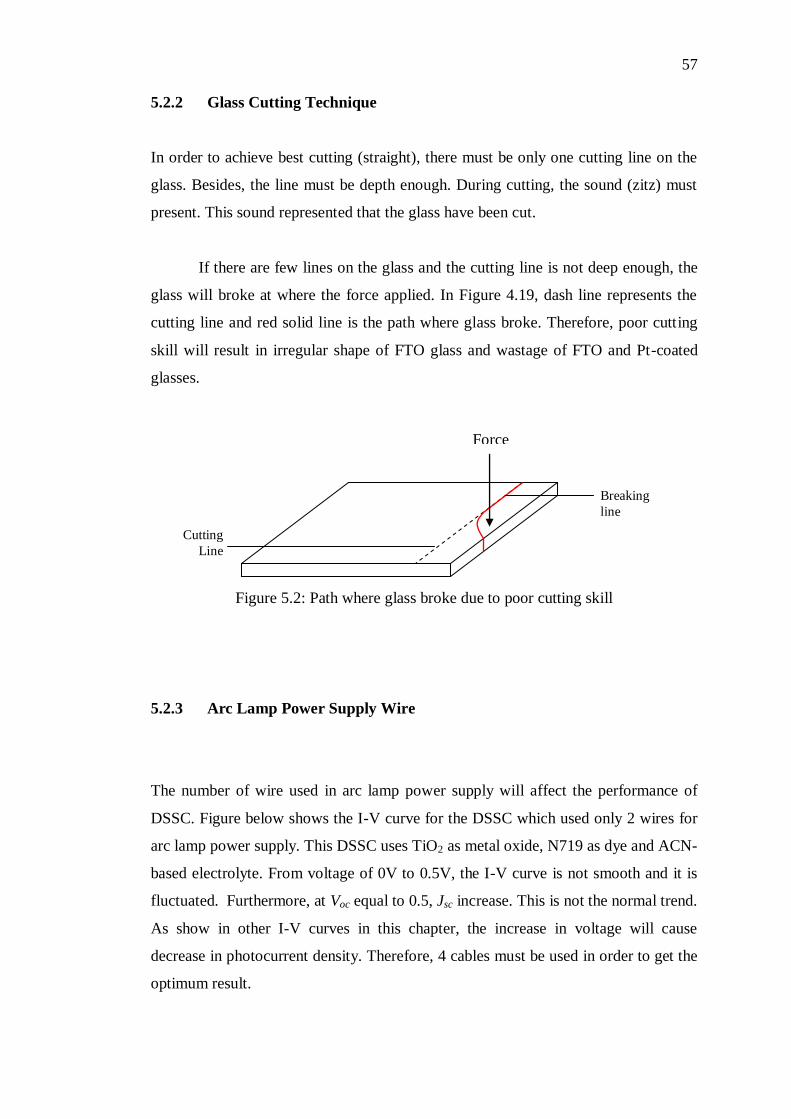
57
5.2.2 Glass Cutting Technique
In order to achieve best cutting (straight), there must be only one cutting line on the
glass. Besides, the line must be depth enough. During cutting, the sound (zitz) must
present. This sound represented that the glass have been cut.
If there are few lines on the glass and the cutting line is not deep enough, the
glass will broke at where the force applied. In Figure 4.19, dash line represents the
cutting line and red solid line is the path where glass broke. Therefore, poor cutting
skill will result in irregular shape of FTO glass and wastage of FTO and Pt-coated
glasses.
Figure 5.2: Path where glass broke due to poor cutting skill
5.2.3 Arc Lamp Power Supply Wire
The number of wire used in arc lamp power supply will affect the performance of
DSSC. Figure below shows the I-V curve for the DSSC which used only 2 wires for
arc lamp power supply. This DSSC uses TiO2 as metal oxide, N719 as dye and ACN-
based electrolyte. From voltage of 0V to 0.5V, the I-V curve is not smooth and it is
fluctuated. Furthermore, at Voc equal to 0.5, Jsc increase. This is not the normal trend.
As show in other I-V curves in this chapter, the increase in voltage will cause
decrease in photocurrent density. Therefore, 4 cables must be used in order to get the
optimum result.
Force
Cutting
Line
Breaking
line
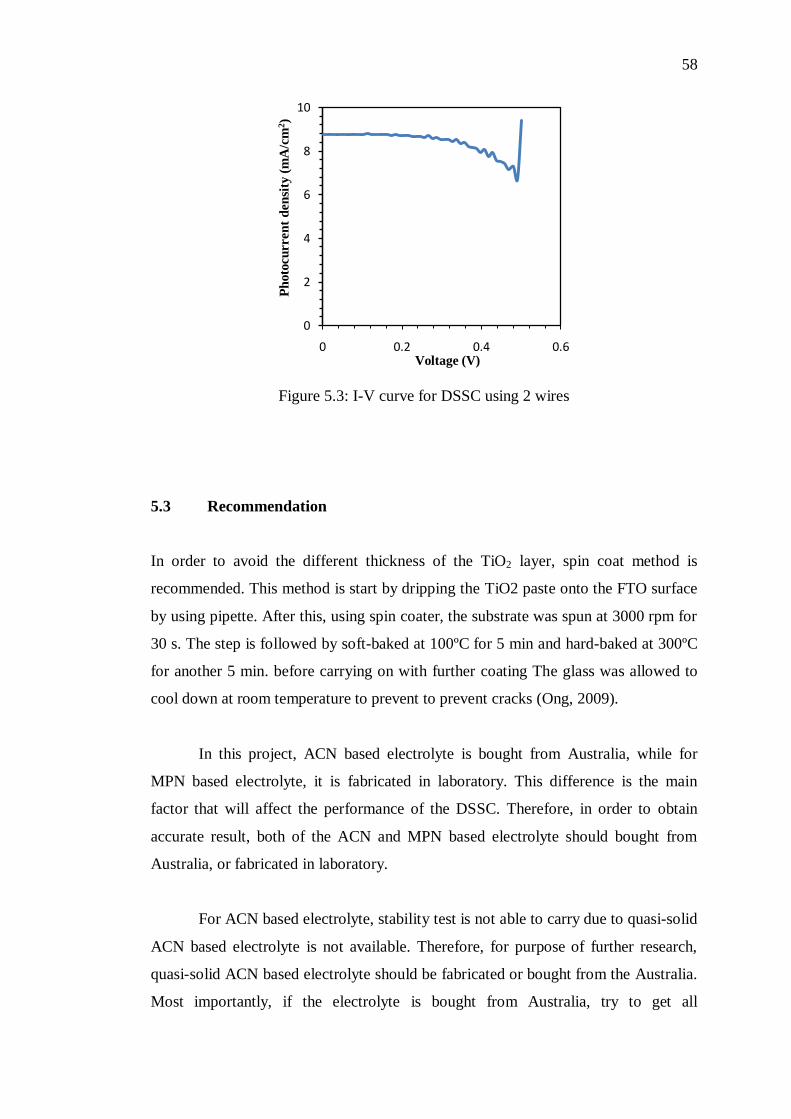
58
Figure 5.3: I-V curve for DSSC using 2 wires
5.3 Recommendation
In order to avoid the different thickness of the TiO2 layer, spin coat method is
recommended. This method is start by dripping the TiO2 paste onto the FTO surface
by using pipette. After this, using spin coater, the substrate was spun at 3000 rpm for
30 s. The step is followed by soft-baked at 100ºC for 5 min and hard-baked at 300ºC
for another 5 min. before carrying on with further coating The glass was allowed to
cool down at room temperature to prevent to prevent cracks (Ong, 2009).
In this project, ACN based electrolyte is bought from Australia, while for
MPN based electrolyte, it is fabricated in laboratory. This difference is the main
factor that will affect the performance of the DSSC. Therefore, in order to obtain
accurate result, both of the ACN and MPN based electrolyte should bought from
Australia, or fabricated in laboratory.
For ACN based electrolyte, stability test is not able to carry due to quasi-solid
ACN based electrolyte is not available. Therefore, for purpose of further research,
quasi-solid ACN based electrolyte should be fabricated or bought from the Australia.
Most importantly, if the electrolyte is bought from Australia, try to get all
0
2
4
6
8
10
0 0.2 0.4 0.6
Ph
oto
cu
rren
t d
en
sity
(m
A/c
m2)
Voltage (V)

59
electrolytes from the same company, if not, fabricate all in laboratory. This can
reduce one parameter (fabrication process) which will affect the testing result and the
performance of DSSC.
As discussed in section 2.2.3, sintering time and temperature is one of the
parameter that will affect the efficiency of DSSC. The sintering time and temperature
used in this project is not able to achieve the optimum performance of the DSSC.
Therefore, the DSSC should sinter at 450˚C for 2 hour.
60
REFERENCES
An, H. L., Xue, B. F., Li, D. M., Li, H., Meng, Q. B., Guo, L., & Chen, L. Q. (2006).
Environmentally friendly LiI/ethanol based gel electrolyte for dye-sensitized solar
cells. Electrochemistry Communications, 8, 170-172.
Agilent Technologies. (2009). PS-X10-100 solar cell I-V test system. Retrieved
August 11, 2010, from http://cp.literature.agilent.com/litweb/pdf/5990-
4328ENA.pdf
Biancardo, M. (2006). Incorporation of gel electrolyte in dye-sensitized solar cells
could widen applications. Retrieved November 23, 2010, from
http://spie.org/documents/Newsroom/Imported/394/2006090394.PDF
Chen, Z. G., Yang, H., Li, X. H., Li, F. Y., Yi, T., & Huang, C. H. (2007).
Thermostable succinonitrile-based gel electrolyte for efficient, long-life dye
sensitized solar cells. Journal of Materials Chemistry, 17, 1602-1607.
Covalent Associates, Inc. (n.d.). Introduction to ionic liquids. Retrieved November
30, 2010, from http://www.covalentassociates.com/Introduction%20to%20Ionic%
20Liquids.pdf
Dye sensitized solar cell. (n.d.). Retrieved July 3, 2010, from http://www.diss.fu-
berlin.de/diss/servlets/MCRFileNodeServlet/FUDISS_derivate_000000002568/02
_2.pdf?hosts=
Fernando, J. M. R. C., & Senadeera, G. K. R. (2008). Natural anthocyanins as
photosensitizers for dye-sensitized solar devices. Current Science, 95(5), 663-666.
Grätzel, M. (2005). Mesocopic solar cells for electricity and hydrogen production
from sunlight. Chemistry Letters, 34(1), 8.
Günes, D. I. S. (2006). Nanostructured electrodes from inorganic materials for hybrid
solar cells. Unpublished PhD‟s thesis. Johannes Kepler Universität Linz, Austria.
Hara, K., & Arawaka, H. (2003). Dye-senitized solar cells. In Handbook of
Photovoltaic Science and Engineering (p. 663). John Wiley &Sons Ltd.
Inakazu, F., Noma, Y., Ogomi, Y., & Hayasea, S. (2008). Dye-sensitized solar cells
consisting of dye-bilayer structure stained with two dyes for harvesting light of
wide range of wavelength. Retrieved June 13, 2010, from
http://apl.aip.org/applab/v93/i9/p093304_s1?view=fulltext&display=print&bypass
SSO=1
61
Kang, M. G., Kim, K. M., Ryu, K. S., Chang, S. H., Park, N. G., Hong, J. S., et al.
(2004). Dye-sensitized TiO2 solar cells using polymer gel electrolyte based on
PVdF-HFP. Journal of The Electrochemical Society, 151(2), E257-E260.
Koo, H. J., Park, J. H., Yoo, B. J., Yoo, K. C., Kim, K. K., & Park, N. G. (2008).
Size-dependent scattering efficiency in dye-sensitized solar cell. Inorganic
Chimica Acta, 361, 677-683.
Kr u ger, J. (2003). Interface engineering in solid-state dye-sensitized solar cell.
Unpublished PhD‟s thesis. Ecole Polytechnique Federale De Lausanne,
Switzerland.
Lai, M. H., Tubtimtae, A., Lee, M. W., & Wang, G. J. (2010). ZnO-nanorod dye-
sensitized solar cells: new structure without a transparent conducting oxide layer.
International Journal of Photoenergy, 2010.
Lai, W. H., Su, Y. H., Teoh, L. G., & Hon, M. H. (2008). Commercial and natural
dyes as photosensitizers for a water-based dye-sensitized solar cell loaded with
gold nanoparticles. Journal of Photochemistry and Photobiology A: Chemistry,
195, 307–313.
Lenzmann, F. O., & Kroon, J. M. (2007). Review article: Recent advances in dye-
sensitized solar cells. Advances in OptoElectronics, 2007.
Leonardi, E. (2010). Sealing materials – encapsulation procedures and ageing tests
for dye sensitized solar cell. Unpublished PhD‟s thesis. Universita Degli Studi Di
Roma “Tor Vergata”, Italy.
Li, G. H., Richter, P. C., Milot, R. L., Cai, L., Schmuttebnaer, C. A., Crabtree, R. H.
et al. (2009). Synergistic effect between anatase and rutile TiO2 nanoparticles in
dye-sensitized solar cells. Dalton Transaction, 10078–10085.
Li, M. Y., Feng, S. J., Fang, S. B., Xiao, X. R., Li, X. P., Zhou, X. W. et al. (2007).
Quasi-solid state dye-sensitized solar cells based on pyridine or imidazole
containing copolymer chemically crosslinked gel electrolytes. Chinese Science
Bulletin, 52 (17), 2320-2325.
Lianos, P., Stathatos, E., Orel, B., Jese, R., Surca Vuk, A., & Jovanovski, V., (n.d.).
A quasi-solid state dye-sensitized solar cell based on a sol-gel nanocomposite
electrolyte. Retrieved December 18, 2010, from
http://www.electrochem.org/dl/ma/203/pdfs/0147.pdf
Liu, C. C. (2011). Fabrication and characterisation of dye sensitized solar cell.
Unpublished degree‟s thesis. Universiti Tunku Abdul Rahman, Malaysia.
Longo, C., & Paoli, M. A. (2003). Dye-sensitized solar cells: A successful
combination of materials. Journal of the Brazilizn Chemical Society, 14(6).

62
Lu, S. L., Koeppe, R., Gu nes, S., & Sariciftci, N. S. (2007). Quasi-solid state dye-
sensitized solar cells with cyanoacrylate as electrolyte matrix. Solar Energy
Materials & Solar Cells, 91, 1081–1086.
Lu, H. L., Li, Y. H., Huang, S. T., Su, C. C., & Thomas Yang, C. K. (n.d.).
Influences of water in bis-benzimidazole-derivative electrolyte additives to the
degradation of the dye-sensitized solar cell. Retrieved April 9, 2011, from
http://www.cc.ntut.edu.tw/~wwwoaa/oaa-nwww/oaa-bt/bt-data/98_phd/paper/37.
Ngamsinlapasathian, S., Sreethawong, T., Suzuki Y., & Yoshikawa, S. (2004).
Single- and double-layered mesoporous TiO2/P25 TiO2 electrode for dye-
sensitized solar cell. Retrieved June 25, 2010, from
http://www.thaiscience.info/Article%20for%20ThaiScience/Article/3/Ts-3%20sin
gle-%20and%20double-layered%20mesoporous%20tio2p25%20tio2%20electrode
%20for%20dye-sensitized%20solar%20cell.pdf
Ong, C. H. (2009). Conductive nanorod arrays for solar cells. Unpublished degree‟s
thesis. Nanyang Technological University, Singapore.
Patch, K. (2004). Solar cell doubles as battery. Retrieved July 3, 2010, from
http://www.trnmag.com/Stories/2004/120104/Solar_cell_doubles_as_battery_12
0104.html
PV Measurements, Inc. (2009). I-V testing systems. Retrieved August 11, 2010, from
http://www.pvmeasurements.com/products/i-v-testing-system
Rijnberg, E., Kroon, J. M., Eienke, J., Hinsch, A., van Roosmalen, J. A. M., & Sinke,
W. C. (n.d.). Long-term stability of nanocrystalline dye sensitized solar cell.
Retrieved December 18, 2010, from
http://www.ecn.nl/docs/library/report/1998/rx98033.pdf
Suryanarayanan, V., Lee, K. M., Ho, W. H., Chen, H. C., & Ho, K. C. (2007). A
comparative study of gel polymer electrolytes based on PVdF-HFP and liquid
electrolytes, containing imidazolinium ionic liquids of different carbon chain
lengths in DSSCs. Solar Energy Materials & Solar Cells, 91, 1467-1471.
ScienceDaily. (2008). New efficiency benchmark for dye-sensitized solar cell.
Retrieved August 11, 2010, from http://www.sciencedaily.com/releases/2008/06/
080629130741.htm
Tan, B., & Wu, Y. Y., (2006). Dye-sensitized solar cells based on anatase TiO2
nanoparticle/nanowire composites. Journal of Physics and Chemistry, 110, 15932-
15938.
U.S. Department of Energy Office of Basic Energy Science. (2005). Basic research
needs for solar energy utilization. Retrieved July 2, 2010, from
http://www.science.deo.gov/bes/reports/files/SEU_rpt.pdf
Wang, P., Zakeeruddin, S. M., Moser, J. E., Nazeeruddin, M. K., Sekiguchi, T., &
Gra tzel, M. (2003). A stable quasi-solid-state dye-sensitized solar cell with an

63
amphiphilic ruthenium sensitizer and polymer gel electrolyte. Nature Materials, 2,
402-406.
Wang, Z. S., Kawauchi, H., Kashima, T., & Arakawa, H. (2004). Significant
influence of TiO2 photoelectrode morphology on the energy conversion efficiency
of N719 dye-senitized solar cell. Cordination Chemistry Reviews, 248, 1381-1390.
Wongchareea, K., Meeyooa, V., & Sumaeth, C. (2007). Dye-sensitized solar cell
using natural dyes extracted from rosella and blue pea flowers. Retrieved June
18, 2010, from http://www.energy-based.nrct.go.th/Article/Ts-3%20dye%20sensi
tized%20solar%20cell%20using%20natural%20dyes%20extracted%20from%20r
osella%20and%20blue%20pea%20flowers.pdf
Wu, J. H., Lan, Z., Hao, S. C., Li, P. J., Lin, J. M., & Huang, M. L. (n.d.). Progress
on the polymer electrolytes for dye-sensitized solar cells. Retrieved December 2,
2010, fom http://event09.ise-online.org/cdrom/files/ise082635.pdf
Xue, B. F., Wang, H. X., Hu, Y. S., Li, H., Wang, Z. X., Meng, Q. B., et al. (2004).
An alternative ionic liquid based electrolyte for dye-sensitizedsolar cells.
Photochem. Photobiol. Sci., 3, 918–919.
Yang, C. H., & Liao, S. H. (2009). Hydrothermal processed TiO2 nanoparticles for
optimization in dye-sensitized solar cells using statistical experimental strategies.
Physical and Analytical Electrochemistry (General), 19(32), 3–20.
Yang, H. X., Huang, M. L., Wu, J. H., Lan, Z., Hao, S. C., & Lin, J. M. (2008). The
polymer gel electrolyte based on poly(methyl methacrylate) and its application in
quasi-solid-state dye sensitized solar cell. Materials Chemistry and Physics, 110,
38-42.
Zhu, K., Neale, N. R., Miedaner, A., & Frank, A. J. (n.d.). Oriented TiO2 nanotube
arrays for dye-sensitized solar cells:Effect of nanostructure order on transport,
recombination, and light harvesting. Retrieved June 18, 2010, from
http://www1.eere.energy.gov/solar/review_meeting/pdfs/p_56_zhu_nrel.pdf

64
APPENDICES
APPENDIX A: Tables
In order to test the stability of ACN and MPN, 2 DSSCs have been fabricated
which one of it using ACN-based electrolyte while the other used MPN-based
electrolyte. Other parameter such as type of conductive glass, metal oxide and dye
were remained constant. The conductive glass used was FTO glass and Pt-coated
glass. The 20nm TiO2 was chosen as the metal oxide. Lastly, the dye that used is
N719. Table A shows the I-V characteristic for MPN over 32 days. I-V characteristic
for ACN over 32 days are listed in Table B.
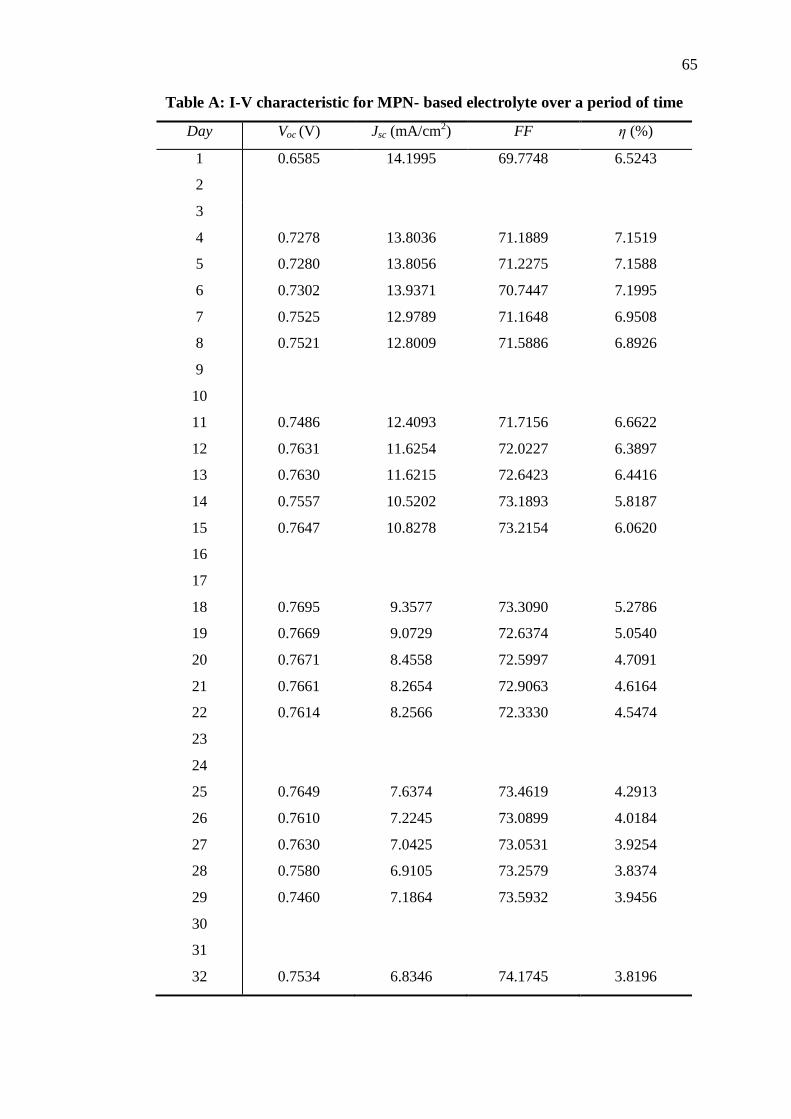
65
Table A: I-V characteristic for MPN- based electrolyte over a period of time
Day Voc (V) Jsc (mA/cm2) FF η (%)
1
2
0.6585 14.1995 69.7748 6.5243
3
4
5
6
7
8
9
10
11
12
13
14
15
16
17
18
19
20
21
22
23
24
25
26
27
28
29
30
31
32
0.7278
0.7280
0.7302
0.7525
0.7521
0.7486
0.7631
0.7630
0.7557
0.7647
0.7695
0.7669
0.7671
0.7661
0.7614
0.7649
0.7610
0.7630
0.7580
0.7460
0.7534
13.8036
13.8056
13.9371
12.9789
12.8009
12.4093
11.6254
11.6215
10.5202
10.8278
9.3577
9.0729
8.4558
8.2654
8.2566
7.6374
7.2245
7.0425
6.9105
7.1864
6.8346
71.1889
71.2275
70.7447
71.1648
71.5886
71.7156
72.0227
72.6423
73.1893
73.2154
73.3090
72.6374
72.5997
72.9063
72.3330
73.4619
73.0899
73.0531
73.2579
73.5932
74.1745
7.1519
7.1588
7.1995
6.9508
6.8926
6.6622
6.3897
6.4416
5.8187
6.0620
5.2786
5.0540
4.7091
4.6164
4.5474
4.2913
4.0184
3.9254
3.8374
3.9456
3.8196

66
Table B: I-V characteristic for ACN- based electrolyte over a period of time
Day Voc (V) Jsc (mA/cm2) FF η (%)
1
2
0.6905
9.8677 66.3498 4.5206
3
4
5
6
7
8
9
10
11
12
13
14
15
16
17
18
19
20
21
22
23
24
25
26
27
28
29
30
31
32
0.7538
0.7857
0.8148
0.8606
0.8072
0.8594
0.8925
0.8844
0.8743
0.8910
0.8453
0.8668
0.8777
0.8506
0.8380
0.8505
0.8362
0.8277
0.8243
0.7503
0.8337
9.6641
8.9514
5.4886
6.0513
5.9096
7.0858
6.5737
5.7349
4.5857
4.4453
2.9091
3.0922
2.7960
2.3424
1.7766
1.9178
1.4095
1.2060
1.0885
0.4395
0.2918
71.9187
72.9871
73.3892
72.9730
71.5540
71.9025
69.7732
68.8946
69.0138
66.3842
67.0798
59.8912
59.2097
58.2970
56.9945
54.0063
51.2138
50.7174
48.5100
49.8008
52.0698
5.2393
5.1330
3.2821
3.8003
3.6796
4.3083
4.0935
3.4943
2.7670
2.6290
1.6495
1.6053
1.4531
1.1615
0.8485
0.8809
0.6036
0.5062
0.4353
0.1642
0.1267