![Reminder Fourier Basis: t [0,1] nZnZ Fourier Series: Fourier Coefficient:](https://static.fdocuments.in/doc/165x107/56649d395503460f94a13929/reminder-fourier-basis-t-01-nznz-fourier-series-fourier-coefficient.jpg)
Reminder Fourier Basis: t [0,1] nZnZ Fourier Series: Fourier Coefficient:

IEEE TRANSACTIONS ON INDUSTRY APPLICATIONS, VOL. 36, NO. 5, SEPTEMBER/OCTOBER 2000 1267
Fabric Defect Detection by Fourier AnalysisChi-ho Chan, Student Member, IEEE,and Grantham K. H. Pang, Member, IEEE
Abstract—Many fabric defects are very small and undistin-guishable, which makes them very difficult to detect by onlymonitoring the intensity change. Faultless fabric is a repetitiveand regular global texture and Fourier transform can be appliedto monitor the spatial frequency spectrum of a fabric. When adefect occurs in fabric, its regular structure is changed so thatthe corresponding intensity at some specific positions of the fre-quency spectrum would change. However, the three-dimensionalfrequency spectrum is very difficult to analyze. In this paper, asimulated fabric model is used to understand the relationship be-tween the fabric structure in the image space and in the frequencyspace. Based on the three-dimensional frequency spectrum, twosignificant spectral diagrams are defined and used for analyzingthe fabric defect. These two diagrams are called the central spatialfrequency spectrums. The defects are broadly classified into fourclasses: 1) double yarn; 2) missing yarn; 3) webs or broken fabric;and 4) yarn densities variation. After evaluating these four classesof defects using some simulated models and real samples, sevencharacteristic parameters for a central spatial frequency spectrumare extracted for defect classification.
Index Terms—Defect detection, Fourier analysis, quality assur-ance, textile industry, texture characterization.
I. INTRODUCTION
I N THE TEXTILE industry, before any shipments are sent tocustomers, inspection is needed for maintaining the fabric
quality. Srinivasanet al.[1] have stated that the price of second-quality fabric is only 45%–65% of that of first-quality fabric.However, the current inspection process still depends mainly onhuman sight. The nature of this work is very dull and repetitive.Moreover, there could be many human errors in this process.According to some studies, human visual inspection can onlycatch around 60%–75% of the significant defects [2]. There-fore, in order to lower the cost of the inspection process and toincrease the competitive advantage of the products, it is neces-sary to automate the inspection process.
In this paper, the central spatial frequency spectrum approachis introduced and examined. This method would reduce thecomputational time for defect detection and provide moreparameters for defect classification. Before introducing thismethod, the characteristics of fabric structure in the frequencyspectrum will be examined and some defect examples willbe described. After that, the procedures of the method andexperimental results will be discussed.
Paper MSDAD-S 00–10, presented at the 1999 Industry Applications SocietyAnnual Meeting, Phoenix, AZ, October 3–7, and approved for publication in theIEEE TRANSACTIONS ONINDUSTRYAPPLICATIONSby the Industrial Automationand Control Committee of the IEEE Industry Applications Society. Manuscriptsubmitted for review October 15, 1999 and released for publication May 6, 2000.
The authors are with the Department of Electrical and Electronic Engineering,The University of Hong Kong, Hong Kong (e-mail: [email protected]).
Publisher Item Identifier S 0093-9994(00)07614-3.
Zhanget al.[3] have introduced two approaches to detect de-fects: gray-level statistical and morphological methods. Lanes[4] has defined a number of convolution masks to detect thedefect. These methods, which depend on intensity change onthe fabric image, can only capture the significant defects suchas knot, web, and slub. However, faultless fabric has a periodicregular global structure. The occurrence of a defect in the fabricmeans that the regular structure has been destroyed. Therefore,the fabric defect can be detected by monitoring fabric structure.Ciamberllini and his colleagues have used the optical Fouriertransform to monitor the fabric structure. Their methods canbe classified as follows: fixed masks or structured detectors,adaptable filters [5], electronic elaboration of the image [6],and binary histogram [7]. Fixed masks, structured detectors,and adaptive filters are the fixed optical filters placed overthe photodetector active area. They are composed of periodicarray transparent and opaque zones, and their locations dependon the peak of the fabric diffraction image. When a defectoccurs, some localized peaks in the diffraction image will bepassed to the sensor. However, this type of operation requirescareful alignment and different fabric types require differentfilters. The method of electronic elaboration is based on thesubtraction of the reference image of faultless fabric from thatof the fabric under inspection. The binary histogram methodis based on a summation of the gray-level pixels, which havegray level greater than a threshold. The threshold is definedaccording to the fabric type and system sensitivity. Opticalprocessing is very expensive and requires careful calibration.Also, this method could not recognize fabric with higher fabricdensity.
Another class of methods is dependent on digital imageprocessing. Wood [8] has used Fourier and associate transformto characterize carpet patterns. Ravandi and Toriumi [9] haveused Fourier transform analysis to measure fabric appear-ance. Fabric surface characteristics, fill, and warp yarns forplain-weave cotton fabric were also discussed. Escofetet al.[10] have used the angular correlation of the Fourier spectra toevaluate fabric web resistance to abrasion. Sari-Saraf and hiscolleagues [11] have used Fourier transform to detect fabricdefects. Their approach examines and performs a one-dimen-sional signature diagram in the two-dimensional spectrum.The signature diagram is obtained by integrating the pointswithin each ring in the two-dimensional spectrum. The ringsare concentric with different radii, and they are used to monitorthe fill and wrap densities. The idea of this approach is similarto the concentric ring filter in optical processing [5]. The mainadvantage of this approach is that it is less sensitive to thebackground noise (intensity source variation). Also, it is moreeffective for revealing a defect due to dimensional changesin the structure of the fabric. This method can recognize the
0093–9994/00$10.00 © 2000 IEEE

1268 IEEE TRANSACTIONS ON INDUSTRY APPLICATIONS, VOL. 36, NO. 5, SEPTEMBER/OCTOBER 2000
(a) (b) (c)
Fig. 1. (a) Fabric structure gap. (b) Fabric gap location. (c) Simulated faultless fabric
(a) (b) (c)
Fig. 2. Magnitude of frequency spectrum (central portion). (a) Fabric structure gap. (b) Fabric gap location. (c) Simulated faultless fabric.
(a) (b) (c) (d)
Fig. 3. Fabric defect samples. (a) Double yarn. (b) Missing yarn. (c) Broken fabric. (d) Variation of yarn.
high fabric densities by using the zoomed camera, but longcomputational time is expected.
II. BACKGROUND KNOWLEDGE
A. Fourier Transform
Fourier theorem states that any signal can be represented bythe sum of the sine and cosine wave with various amplitudesand frequencies. That is, the relationship between a repeti-tive, regular, and uniform fabric pattern in the image spaceand its spectrum in the spatial frequency can be linked by op-erating two-dimensional Fourier transform. Let a two-dimen-sional image be , which is a real function representingthe gray level in spatial coordinates, and let the imagewidth and image length be . Let denote the Fouriertransform of with and spatial frequencies. The
general equation of two-dimensional discrete Fourier transformis
(1)
The computational time for Fourier transform is generallylong. For two-dimensional discrete Fourier transform, it is pro-portional to the second order of the image size. In order to reducethe computation time, fast Fourier transform (FFT) is used. FFTis a discrete Fourier transform with some reorganization that cansave an enormous amount of time. For one-dimensional FFT,the computation time is . Because of the separabletransform [12], [13] being used to perform the two-dimensionaltransform, the computation time is proportional to .One of the advantages for the spatial frequency spectrum ap-proach is the translation property of Fourier transform [12], [13]

CHAN AND PANG: FABRIC DEFECT DETECTION BY FOURIER ANALYSIS 1269
(a) (b) (c)
Fig. 4. (a) Faultless fabricf(x; y). (b) Rectangle series functiond(x; y). (c) Double fill defect.
Fig. 5. (a) Portion of faultless fabric frequency magnitude spectrum. (b) Fill direction frequency spectrum. (c) Wrap direction frequency spectrum.
that is shown in (2), which means that the magnitude of fre-quency spectrum does not change when the fabric is moved up.The spectrum is only varied by the change of fabric structure
(2)
B. Characteristics of Fabric Structure in the Magnitude ofFrequency Spectrum
A simulated frequency spectrum should be examined for un-derstanding the characteristics of fabric structure in the magni-
tude of frequency spectrum. A two-dimensional discrete convo-lution theorem is involved for constructing a simulated fabric.Let and be the input and output image, respectively, andisa convolution mask. Therefore, the convolution denoted byisthe computation of weighted sums of the image pixels with theconvolution mask, which is shown in
(3)

1270 IEEE TRANSACTIONS ON INDUSTRY APPLICATIONS, VOL. 36, NO. 5, SEPTEMBER/OCTOBER 2000
The simulated pattern of a faultless fabric is shown inFig. 1(c). The faultless fabric image pattern is modeledas shown in
(4)
where
andotherwise
and where , which is the two-dimensionalDirac function.
The first part of (4) is a function that describes the fabricstructure gap [Fig. 1(a)], where is the width of the gap and
is the height of the gap. Let be the wrap period andbe the fill period. The second part is the impulse function thatmodels the location of the gap in the fabric [Fig. 1(b)].
The Fourier transform of the convolution of two functions inan image space is equal to the product of their respective Fouriertransforms as shown in
sinc sinc
(5)
The frequency spectrums of the corresponding figures ofFig. 1 are shown in Fig. 2. The envelope of the faultless fabricin frequency space shown in Fig. 2(c) is proportional to theenvelope of the Fourier transform of the fabric structure gap asshown in Fig. 2(a). In fact, the shape of the envelope of Fig. 2(a)is affected by two parameters: and . For example, if thestructure gap and are increased, the envelope shape ofFig. 2(a) will be narrower. Referring to Fig. 1(b), the location ofthe impulse in the image space is inversely proportional to theimpulse location in frequency space in Fig. 2(b). The distancebetween two impulses in Fig. 2(b) should be in thehorizontal axis and in the vertical axis. These propertiescan aid to monitor the yarn densities in the two directions.For example, the density in the horizontal direction is equal tothe distance between two impulses in the horizontal axis (i.e.,
) multiplied by the image width.
C. Simulation of Fabric Defect
In this paper, the defects are broadly classified into fourclasses: 1) double yarn; 2) missing yarn; 3) webs or brokenfabric; and 4) yarn densities variation. Examples are shown inFig. 3. The double yarn (fill) is a change of spatial periodicityon the vertical axis. The spectrum on theaxis (fill direction)denotes the corresponding change of spatial frequency. Ina simulated model of the double yarn, , shown inFig. 4(c), the defect can be regarded as a subtraction from afaultless fabric [Fig. 4(a)] to a series of rectangle function,
[Fig. 4(b)]. By the distributivity property of the Fouriertransform
(6)
the defect in the frequency space can be formed by subtractingthe faultless fabric frequency spectrum from the Fourier trans-form of the irregular structure function .
D. Central Spatial Frequency Spectrum
Due to the nature of the fabric structure, many defects wouldoccur along the and axes, which means that those character-istics would appear on the wrap () and fill ( ) direction in thefrequency spectrum. In addition, a three-dimensional graph ofthe frequency spectrum is very difficult to analyze. The methodof central spatial frequency spectrum is, therefore, proposed inthis paper. This method extracts two diagrams along theand
direction ( and ) from the three-dimen-sional graph, which are shown in Fig. 5.
Seven significant features can be extracted in these two di-agrams for describing defect characteristics. The equations ofthese parameters are as follows:
P1 P2 P3
P4
P5 P6
P7
where and correspond to the first harmonic frequencyin their respective diagrams that are also shown in Fig. 5. Thefirst featureP1 is the average light intensity of the image, whichis used to characterize irregular fabric structure. Higher yarndensity decreases the light intensity andP1 is decreased, andvice versa.P2, P3, andP4 are for detecting the horizontal (fill)threads structure, whereasP5, P6, andP7 are used to monitorthe vertical (wrap) threads structure. FeaturesP3andP6corre-spond to the first harmonic frequency and they are used to mon-itor the wrap and fill threads density in the image. When defectsoccur, the amplitude of harmonic frequencies plus other changeswould appear in the central spatial frequency spectrum. FeaturesP2, P4, P5, andP7are used to describe and detect these charac-teristics. Those features are more concentrated on analyzing theregion between the central peak and first peak (first harmonicfrequency) because higher harmonic frequency components aresignificantly distorted in a real environment.
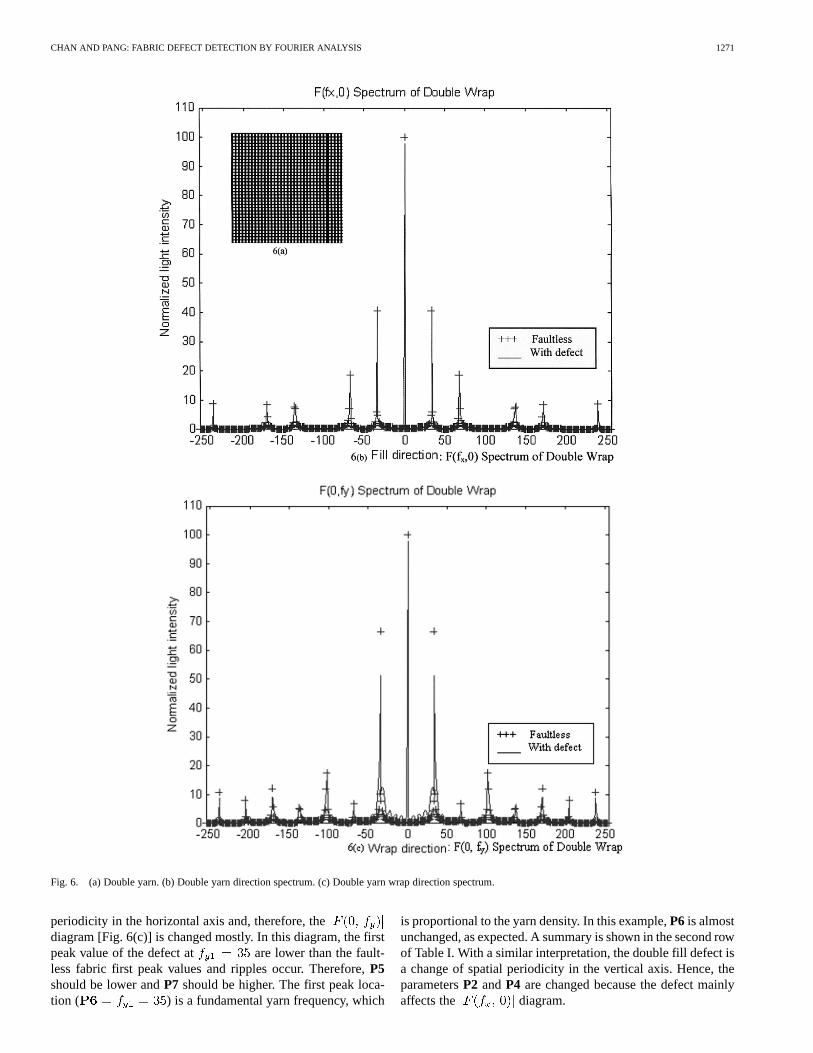
A defect such as double wrap is shown in Fig. 6(a). A com-parison of the defect spectrum and faultless fabric spectrumare shown in Fig. 6(b) and (c), where the defect is denoted bythe solid line and the faultless fabric is denoted by the crosses.Fig. 6(b) and (c) shows that the central peak value (P1) of thedefect fabric is lower than that of the faultless fabric. This isbecause more vertical (wrap) threads are added in the faultlessfabric, which leads to lower light intensity in the defect image asshown in Fig. 6(a). The double wrap defect is a change of spatial
CHAN AND PANG: FABRIC DEFECT DETECTION BY FOURIER ANALYSIS 1271
Fig. 6. (a) Double yarn. (b) Double yarn direction spectrum. (c) Double yarn wrap direction spectrum.
periodicity in the horizontal axis and, therefore, thediagram [Fig. 6(c)] is changed mostly. In this diagram, the firstpeak value of the defect at are lower than the fault-less fabric first peak values and ripples occur. Therefore,P5should be lower andP7 should be higher. The first peak loca-tion ( ) is a fundamental yarn frequency, which
is proportional to the yarn density. In this example,P6 is almostunchanged, as expected. A summary is shown in the second rowof Table I. With a similar interpretation, the double fill defect isa change of spatial periodicity in the vertical axis. Hence, theparametersP2 andP4 are changed because the defect mainlyaffects the diagram.

1272 IEEE TRANSACTIONS ON INDUSTRY APPLICATIONS, VOL. 36, NO. 5, SEPTEMBER/OCTOBER 2000
Fig. 7. System flow of fabric defect detection.
(a) (b)
(c) (d)
Fig. 8. Example of an image with gray-level histogram. (a) Original image. (b) Gray-level histogram of original image. (c) Image after equalization.(d) Gray-levelhistogram after equalization.
The difference between missing yarn and double yarn is theirfabric threads count. Average light intensityP1 can show thischaracteristic. For missing yarn, higherP1 is expected becausethere is less thread in this defect. Broken fabric and yarn densi-ties variation (low or high fabric density) are a change of peri-odicity in both and axes, and both anddiagrams are mostly changed.
In the broken fabric,P3andP6values are not changed. Thisis because this defect is an instant change of the fabric density,and it only affectsP1, P2, P4, P5, andP7values. TheP1 is highbecause the fabric is broken, and leads to increase of light in-tensity. For the low fabric density,P3andP6are lower becausethe numbers of thread are decreased. The thread width may bechanged in this defect. Therefore,P1, P2, P4, P5, andP7 arenot applicable to detect these defect characteristics. Details ofthe expected results are summarized below.
III. EXPERIMENTAL SETUP
A. Image Acquisition
In this study, plain white fabrics are used. Defects withdouble yarn, missing yarn, web and fabric density variation
TABLE IDIFFERENCE INPARAMETERS PREDICTED BETWEEN THE FABRIC
AND ITS DEFECT
were inspected and compared with the faultless fabric. Theimage acquisition system includes a personal computer (Pen-tium-200MMX), frame grabber, CMOS imager, and a systemmonitor. The fabric image is captured by a CMOS imager, anda frame grabber digitizes the video signal into a 768576

CHAN AND PANG: FABRIC DEFECT DETECTION BY FOURIER ANALYSIS 1273
Fig. 9. (a) Faultless fabric. (b) Double fill. (c) Their fill direction spectrum. (d) Their wrap direction spectrum.
pixel with 8-bit gray-level resolution image and stores it intocomputer memory. This image data is then processed by the
defect detection procedures as shown in Fig. 7. Backlightingillumination is used to achieve the high-contrast fabric images.
1274 IEEE TRANSACTIONS ON INDUSTRY APPLICATIONS, VOL. 36, NO. 5, SEPTEMBER/OCTOBER 2000
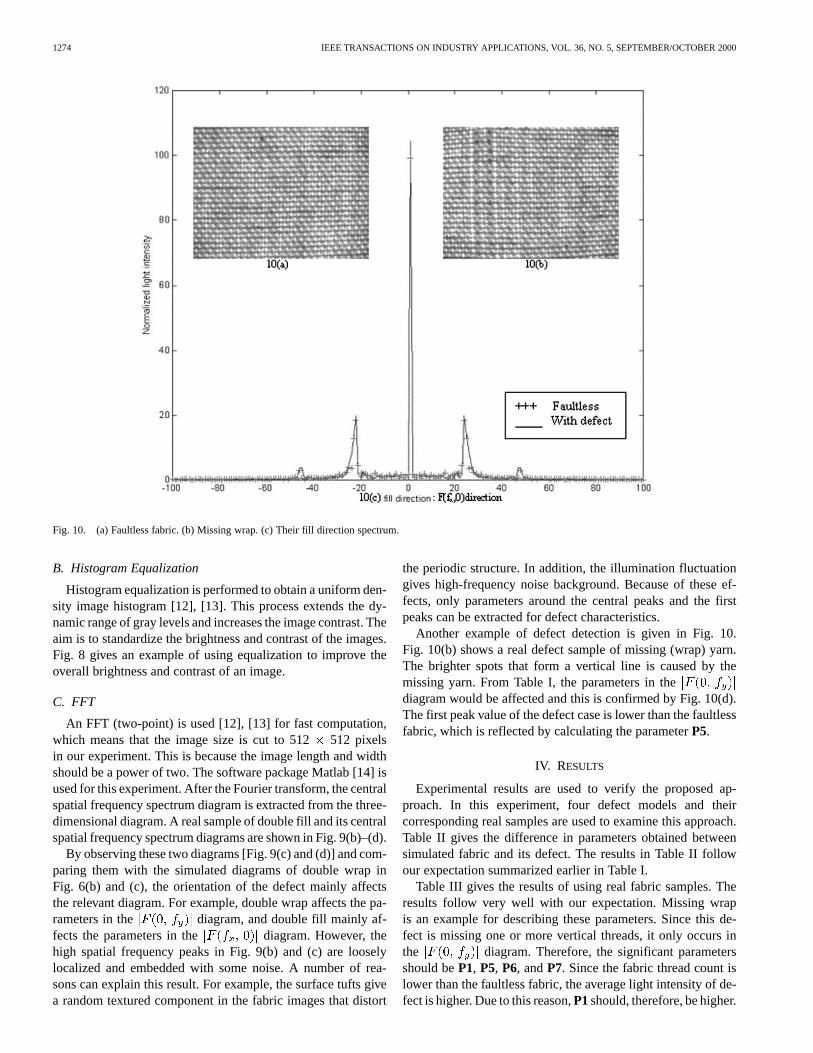
Fig. 10. (a) Faultless fabric. (b) Missing wrap. (c) Their fill direction spectrum.
B. Histogram Equalization
Histogram equalization is performed to obtain a uniform den-sity image histogram [12], [13]. This process extends the dy-namic range of gray levels and increases the image contrast. Theaim is to standardize the brightness and contrast of the images.Fig. 8 gives an example of using equalization to improve theoverall brightness and contrast of an image.
C. FFT
An FFT (two-point) is used [12], [13] for fast computation,which means that the image size is cut to 512512 pixelsin our experiment. This is because the image length and widthshould be a power of two. The software package Matlab [14] isused for this experiment. After the Fourier transform, the centralspatial frequency spectrum diagram is extracted from the three-dimensional diagram. A real sample of double fill and its centralspatial frequency spectrum diagrams are shown in Fig. 9(b)–(d).
By observing these two diagrams [Fig. 9(c) and (d)] and com-paring them with the simulated diagrams of double wrap inFig. 6(b) and (c), the orientation of the defect mainly affectsthe relevant diagram. For example, double wrap affects the pa-rameters in the diagram, and double fill mainly af-fects the parameters in the diagram. However, thehigh spatial frequency peaks in Fig. 9(b) and (c) are looselylocalized and embedded with some noise. A number of rea-sons can explain this result. For example, the surface tufts givea random textured component in the fabric images that distort
the periodic structure. In addition, the illumination fluctuationgives high-frequency noise background. Because of these ef-fects, only parameters around the central peaks and the firstpeaks can be extracted for defect characteristics.
Another example of defect detection is given in Fig. 10.Fig. 10(b) shows a real defect sample of missing (wrap) yarn.The brighter spots that form a vertical line is caused by themissing yarn. From Table I, the parameters in thediagram would be affected and this is confirmed by Fig. 10(d).The first peak value of the defect case is lower than the faultlessfabric, which is reflected by calculating the parameterP5.
IV. RESULTS
Experimental results are used to verify the proposed ap-proach. In this experiment, four defect models and theircorresponding real samples are used to examine this approach.Table II gives the difference in parameters obtained betweensimulated fabric and its defect. The results in Table II followour expectation summarized earlier in Table I.
Table III gives the results of using real fabric samples. Theresults follow very well with our expectation. Missing wrapis an example for describing these parameters. Since this de-fect is missing one or more vertical threads, it only occurs inthe diagram. Therefore, the significant parametersshould beP1, P5, P6, andP7. Since the fabric thread count islower than the faultless fabric, the average light intensity of de-fect is higher. Due to this reason,P1should, therefore, be higher.

CHAN AND PANG: FABRIC DEFECT DETECTION BY FOURIER ANALYSIS 1275
Fig. 10. (Continued.)(d) Their wrap direction spectrum.
TABLE IIDIFFERENCE INPARAMETERS OBTAINED BETWEEN A SIMULATED FABRIC
MODEL AND ITS DEFECT
In addition, due to the irregular texture in the wrap direction,the first peak value is decreased and ripple occurs, which wouldcauseP5 to be lower andP7 higher. In summary, Tables II andIII can be used to classify the fabric defect type by noting thechanges in the parameters.
V. CONCLUSIONS
An approach based on Fourier transform has been describedto detect the structural defect in fabric. The simulated models
TABLE IIIDIFFERENCE INPARAMETERS OBTAINED BETWEEN A REAL FABRIC
AND ITS DEFECT
are used to understand the behavior of frequency spectrum.Since the three-dimensional frequency spectrum is very diffi-cult to analyze and many defects occur along the horizontal andvertical axes, the central spatial frequency spectrum approachhas been proposed to increase the efficiency of the analysisprocess. Seven significant characteristic parameters can beextracted from the central spatial frequency spectrums fordescribing the defect type. Experiments have shown that theextracted parameters can be used to classify fabric defects.

1276 IEEE TRANSACTIONS ON INDUSTRY APPLICATIONS, VOL. 36, NO. 5, SEPTEMBER/OCTOBER 2000
REFERENCES
[1] K. Srinivasan, P. H. Dastoor, P. Radhakrishnaiah, and S. Jayaraman,“FDAS: A knowledge-based framework for analysis of defects in woventextile structures,”J. Textile Inst., pt. 1, vol. 83, no. 3, pp. 431–1448,1992.
[2] K. Schicktanz, “Automatic fault detection possibilities on nonwovenfabrics,”Melliand Textilberichte, vol. 74, pp. 294–295, 1993.
[3] X. F. Zhang and R. R. Bresee, “Fabric defect detection and classifictionusing image analysis,”Textile Res. J., vol. 65, no. 1, pp. 1–9, 1995.
[4] J. S. Lane and S. C. Moure, “Textile fabric inspection system,” U.S.Patent 5 774 177, 1998.
[5] C. Ciamberlini, F. Francini, P. Sansoni, and B. Tiribilli, “Defect detectionin textured materials by optical filtering with structured detectors andself-adaptable masks,”Opt. Eng., vol. 35, no. 3, pp. 838–844, 1996.
[6] C. Castellini, F. Francini, G. Longobardi, and B. Tiribilli, “On-line tex-tile quality control using optical Fourier transforms,”Opt. Lasers Eng.,vol. 24, pp. 19–32, 1996.
[7] C. Ciamberlini, F. Francini, G. Longobardi, P. Poggi, P. Sansoni, andB. Tiribilli, “Weaving defect detection by Fourier imaging,”Vis. Syst.Applicat. SPIE, vol. 2786, pp. 9–18, 1996.
[8] E. J. Wood, “Applying Fourier and associated transforms to pattern char-acterization in textiles,”Textile Res. J., vol. 60, pp. 212–220, 1990.
[9] S. A. H. Ravandi and K. Toriumi, “Fourier transform analysis of plainweave fabric appearance,”Textile Res. J., vol. 65, no. 11, pp. 676–683,1995.
[10] J. Escofet, M. S. Millan, H. Abril, and E. Torrecilla, “Inspection of fabricresistance to abrasion by fouries analysis,”Proc. SPIE, vol. 3490, pp.207–210, 1998.
[11] H. Sari-Saraf and J. S. Goddard, “On-line optical measurement and mon-itoring of yarn density in woven fabrics,”Automat. Opt. Inspect. Ind.SPIE, vol. 2899, pp. 444–452, 1996.
[12] R. C. Gonzalez and R. E. Woods, “Image transforms,” inDigitalImage Processing. Reading, MA: Addison-Wesley, 1993, ch. 3, pp.81–128.
[13] R. C. Gonzalez and R. E. Woods, “Image enchancement,” inDigitalImage Processing. Reading, MA: Addison-Wesley, 1993, ch. 4, pp.166–189.
[14] MATLAB User’s Guide, The MathWorks Inc., Natick, MA, Aug.1992.
Chi-ho Chan (S’00) was born in Hong Kong. He re-ceived the B. Eng. degree in electrical and electronicengineering from the University of Bradford, Brad-ford, U.K., in 1997. He is currently working towardthe M.Phil degree in electrical and electronic engi-neering at The University of Hong Kong, Hong Kong.
His major research interests include imageprocessing and analysis.
Grantham K. H. Pang (S’84–M’86) received thePh.D. degree from the University of Cambridge,Cambridge, U.K., in 1986 for research in multivari-able control system design and expert systems.
He was with the Department of Electrical andComputer Engineering, University of Waterloo,Waterloo, ON, Canada, from 1986 to 1996. Hejoined the Department of Electrical and ElectronicEngineering, The University of Hong Kong, HongKong, in 1996. Since 1988, he has authored morethan 80 published technical papers and has authored
or coauthored three books. His research interests include expert systems forcontrol system design, intelligent control, intelligent transportation systems,neural networks, control theory, and computer-aided design. In 1994, he wasa Senior Visiting Researcher at the Hitachi Research Laboratory, Japan. Hehas acted as a Consultant to several companies, including Mitsubishi ElectricCorporation, Japan, and Northern Telecom and Imperial Oil Ltd., Canada. Heis an Editor of theInternational Journal of Intelligent Control and Systems.He is also an Editor ofControl and Computers, published by the InternationalAssociation of Science and Technology for Development (IASTED).
Dr. Pang was the Organizing Chair of the 1996 IEEE Symposium on Com-puter-Aided Control System Design. He was appointed by the President of theIEEE Control Systems Society as the Chair of the Technical Committee on Com-puter-Aided Control System Design (1993–1995). In 1989, he was awarded theICI Prize for authorship of the best paper on the application of the theory of con-trol published in theTransactions of the Institute of Measurement and Control.He is a Chartered Electrical Engineer in the U.K. and a member of the Institu-tion of Electrical Engineers, U.K., and the Hong Kong Institution of Engineers.


![2D Gabor Filter for Surface Defect Detection Using GA and ...amsemodelling.com/publications/advances_in... · fabric defect detection [12]. The basic work of et.al Tsai [22], defect](https://static.fdocuments.in/doc/165x107/5e61b8b01da72f30701d1b08/2d-gabor-filter-for-surface-defect-detection-using-ga-and-fabric-defect-detection.jpg)