FABEGEAB ANNUALREPORT2008 CONTENTS · PDF fileFABEGEAB | ANNUALREPORT2008 CONTENTS ... 2007 F...
89
FABEGE AB | ANNUAL REPORT 2008
Transcript of FABEGEAB ANNUALREPORT2008 CONTENTS · PDF fileFABEGEAB | ANNUALREPORT2008 CONTENTS ... 2007 F...
FABEGE AB | ANNUAL REPORT 2008CONTENTS
The Year in Brief 1Message from the CEO 2Business concept and strategic focus 4Value creating strategies and the Fabege brand 7Market overview 8Fabege’s Business 13Responsible Enterprise 22Fabege’s Environmental policy 28The Fabege share 30Market valuation of Fabege’s Property Portfolio 33Tax Situation 34
Directors’ Report 35Financial Reports
Consolidated profit and loss account 40Consolidated balance sheet 41Consolidated statement of changes in equity 42Consolidated cash flow statement 43Parent company profit and loss account 44Parent company balance sheet 45Parent company statement of changes in equity 46Parent company cash flow statement 47Notes 48
Signing of the Annual Report 60Audit Report 61
Corporate Governance Report 63Board of Directors 64Group Management 66
Articles of Association 71Five-year Summary 72
The formal audited annual report concerns pages 35–61.
ANNUAL GENERAL MEETING 2009
The AGM 2009 will be held at Nalen on Regeringsgatan 74 inStockholm, on Tuesday 31rd March at 4 p.m. CET. Registration for theAGM begins at 2.30 p.m. CET.
The notice of the AGM was published in Post- och Inrikes Tidningar,Svenska Dagbladet and at the comapnys website.
Shareholders who wish to attend the AGM mustbe registered in the share register maintained by Euroclear SwedenAB (former VPC AB) on Wednesday 25 March 2009,notify the Company of their intention to participate, stating thenames of any assistants they wish to invite, no later than 4 p.m. onWednesday 25 March 2009.
Notice of attendance at the AGM may be made in one of the followingways:
by mail to Fabege AB (publ), “Fabeges Årsstämma”, Box 7839,SE-103 98 Stockholm, Swedenby telephone on +46 (0)8 402 90 68by fax on +46 (0)8 20 56 85at Fabege’s website, where further information about the AGM alsocan be obtained
FINANCIAL REPORTS 2009Interim report January-March: 28 AprilInterim report January-June: 10 JulyInterim report January-September: 27 October
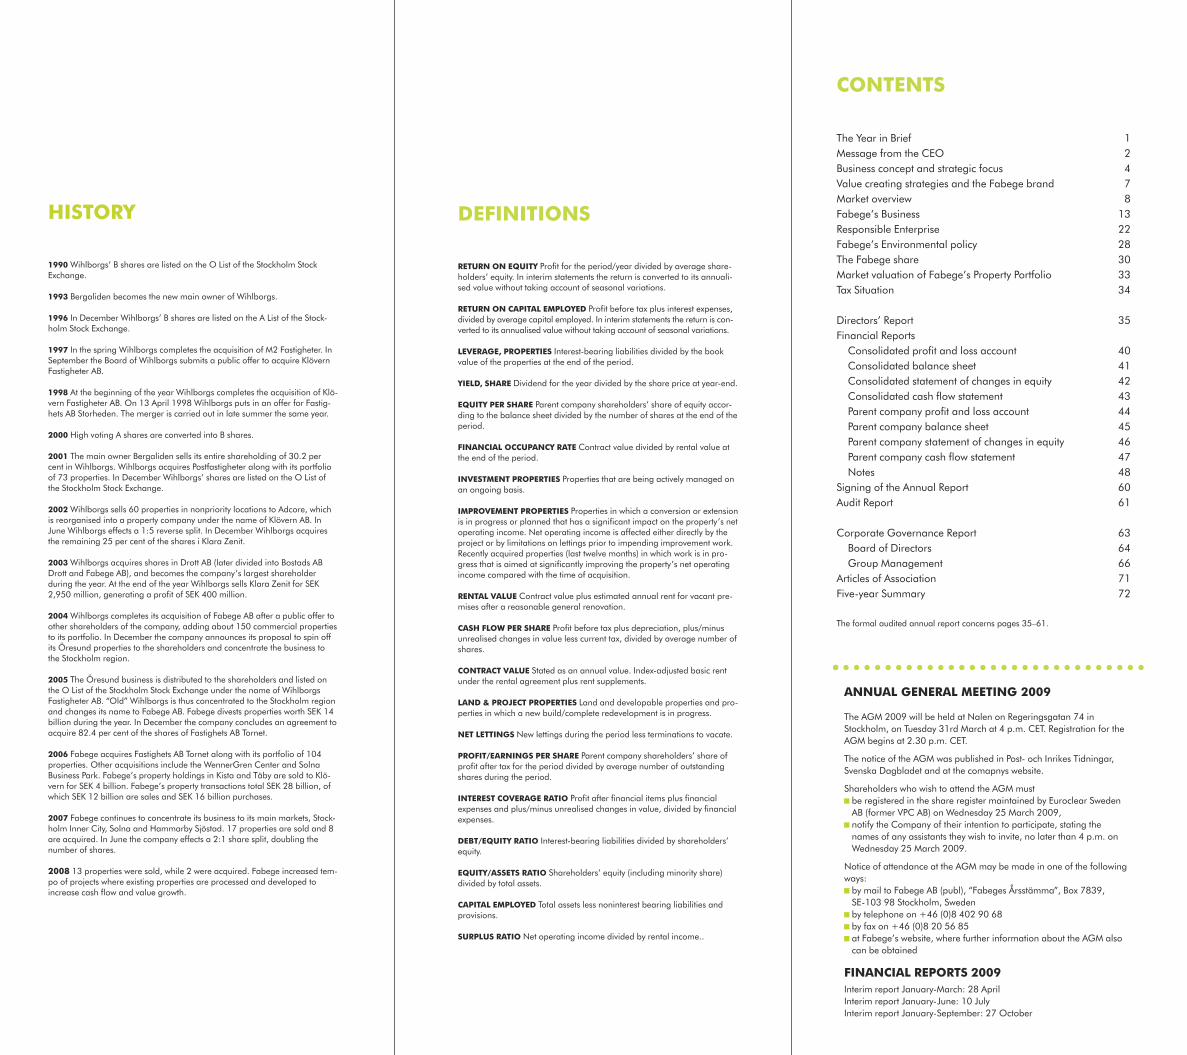
HISTORY
1990 Wihlborgs’ B shares are listed on the O List of the Stockholm StockExchange.
1993 Bergaliden becomes the new main owner of Wihlborgs.
1996 In December Wihlborgs’ B shares are listed on the A List of the Stock-holm Stock Exchange.
1997 In the spring Wihlborgs completes the acquisition of M2 Fastigheter. InSeptember the Board of Wihlborgs submits a public offer to acquire KlövernFastigheter AB.
1998 At the beginning of the year Wihlborgs completes the acquisition of Klö-vern Fastigheter AB. On 13 April 1998 Wihlborgs puts in an offer for Fastig-hets AB Storheden. The merger is carried out in late summer the same year.
2000 High voting A shares are converted into B shares.
2001 The main owner Bergaliden sells its entire shareholding of 30.2 percent in Wihlborgs. Wihlborgs acquires Postfastigheter along with its portfolioof 73 properties. In December Wihlborgs’ shares are listed on the O List ofthe Stockholm Stock Exchange.
2002 Wihlborgs sells 60 properties in nonpriority locations to Adcore, whichis reorganised into a property company under the name of Klövern AB. InJune Wihlborgs effects a 1:5 reverse split. In December Wihlborgs acquiresthe remaining 25 per cent of the shares i Klara Zenit.
2003 Wihlborgs acquires shares in Drott AB (later divided into Bostads ABDrott and Fabege AB), and becomes the company’s largest shareholderduring the year. At the end of the year Wihlborgs sells Klara Zenit for SEK2,950 million, generating a profit of SEK 400 million.
2004 Wihlborgs completes its acquisition of Fabege AB after a public offer toother shareholders of the company, adding about 150 commercial propertiesto its portfolio. In December the company announces its proposal to spin offits Öresund properties to the shareholders and concentrate the business tothe Stockholm region.
2005 The Öresund business is distributed to the shareholders and listed onthe O List of the Stockholm Stock Exchange under the name of WihlborgsFastigheter AB. “Old” Wihlborgs is thus concentrated to the Stockholm regionand changes its name to Fabege AB. Fabege divests properties worth SEK 14billion during the year. In December the company concludes an agreement toacquire 82.4 per cent of the shares of Fastighets AB Tornet.
2006 Fabege acquires Fastighets AB Tornet along with its portfolio of 104properties. Other acquisitions include the WennerGren Center and SolnaBusiness Park. Fabege’s property holdings in Kista and Täby are sold to Klö-vern for SEK 4 billion. Fabege’s property transactions total SEK 28 billion, ofwhich SEK 12 billion are sales and SEK 16 billion purchases.
2007 Fabege continues to concentrate its business to its main markets, Stock-holm Inner City, Solna and Hammarby Sjöstad. 17 properties are sold and 8are acquired. In June the company effects a 2:1 share split, doubling thenumber of shares.
2008 13 properties were sold, while 2 were acquired. Fabege increased tem-po of projects where existing properties are processed and developed toincrease cash flow and value growth.
DEFINITIONS
RETURN ON EQUITY Profit for the period/year divided by average share-holders’ equity. In interim statements the return is converted to its annuali-sed value without taking account of seasonal variations.
RETURN ON CAPITAL EMPLOYED Profit before tax plus interest expenses,divided by average capital employed. In interim statements the return is con-verted to its annualised value without taking account of seasonal variations.
LEVERAGE, PROPERTIES Interest-bearing liabilities divided by the bookvalue of the properties at the end of the period.
YIELD, SHARE Dividend for the year divided by the share price at year-end.
EQUITY PER SHARE Parent company shareholders’ share of equity accor-ding to the balance sheet divided by the number of shares at the end of theperiod.
FINANCIAL OCCUPANCY RATE Contract value divided by rental value atthe end of the period.
INVESTMENT PROPERTIES Properties that are being actively managed onan ongoing basis.
IMPROVEMENT PROPERTIES Properties in which a conversion or extensionis in progress or planned that has a significant impact on the property’s netoperating income. Net operating income is affected either directly by theproject or by limitations on lettings prior to impending improvement work.Recently acquired properties (last twelve months) in which work is in pro-gress that is aimed at significantly improving the property’s net operatingincome compared with the time of acquisition.
RENTAL VALUE Contract value plus estimated annual rent for vacant pre-mises after a reasonable general renovation.
CASH FLOW PER SHARE Profit before tax plus depreciation, plus/minusunrealised changes in value less current tax, divided by average number ofshares.
CONTRACT VALUE Stated as an annual value. Index-adjusted basic rentunder the rental agreement plus rent supplements.
LAND & PROJECT PROPERTIES Land and developable properties and pro-perties in which a new build/complete redevelopment is in progress.
NET LETTINGS New lettings during the period less terminations to vacate.
PROFIT/EARNINGS PER SHARE Parent company shareholders’ share ofprofit after tax for the period divided by average number of outstandingshares during the period.
INTEREST COVERAGE RATIO Profit after financial items plus financialexpenses and plus/minus unrealised changes in value, divided by financialexpenses.
DEBT/EQUITY RATIO Interest-bearing liabilities divided by shareholders’equity.
EQUITY/ASSETS RATIO Shareholders’ equity (including minority share)divided by total assets.
CAPITAL EMPLOYED Total assets less noninterest bearing liabilities andprovisions.
SURPLUS RATIO Net operating income divided by rental income..
CONTENTS
The Year in Brief 1Message from the CEO 2Business concept and strategic focus 4Value creating strategies and the Fabege brand 7Market overview 8Fabege’s Business 13Responsible Enterprise 22Fabege’s Environmental policy 28The Fabege share 30Market valuation of Fabege’s Property Portfolio 33Tax Situation 34
Directors’ Report 35Financial Reports
Consolidated profit and loss account 40Consolidated balance sheet 41Consolidated statement of changes in equity 42Consolidated cash flow statement 43Parent company profit and loss account 44Parent company balance sheet 45Parent company statement of changes in equity 46Parent company cash flow statement 47Notes 48
Signing of the Annual Report 60Audit Report 61
Corporate Governance Report 63Board of Directors 64Group Management 66
Articles of Association 71Five-year Summary 72
The formal audited annual report concerns pages 35–61.
ANNUAL GENERAL MEETING 2009
The AGM 2009 will be held at Nalen on Regeringsgatan 74 inStockholm, on Tuesday 31rd March at 4 p.m. CET. Registration for theAGM begins at 2.30 p.m. CET.
The notice of the AGM was published in Post- och Inrikes Tidningar,Svenska Dagbladet and at the comapnys website.
Shareholders who wish to attend the AGM mustbe registered in the share register maintained by Euroclear SwedenAB (former VPC AB) on Wednesday 25 March 2009,notify the Company of their intention to participate, stating thenames of any assistants they wish to invite, no later than 4 p.m. onWednesday 25 March 2009.
Notice of attendance at the AGM may be made in one of the followingways:by mail to Fabege AB (publ), “Fabeges Årsstämma”, Box 7839,SE-103 98 Stockholm, Swedenby telephone on +46 (0)8 402 90 68by fax on +46 (0)8 20 56 85at Fabege’s website, where further information about the AGM alsocan be obtained
FINANCIAL REPORTS 2009Interim report January-March: 28 AprilInterim report January-June: 10 JulyInterim report January-September: 27 October
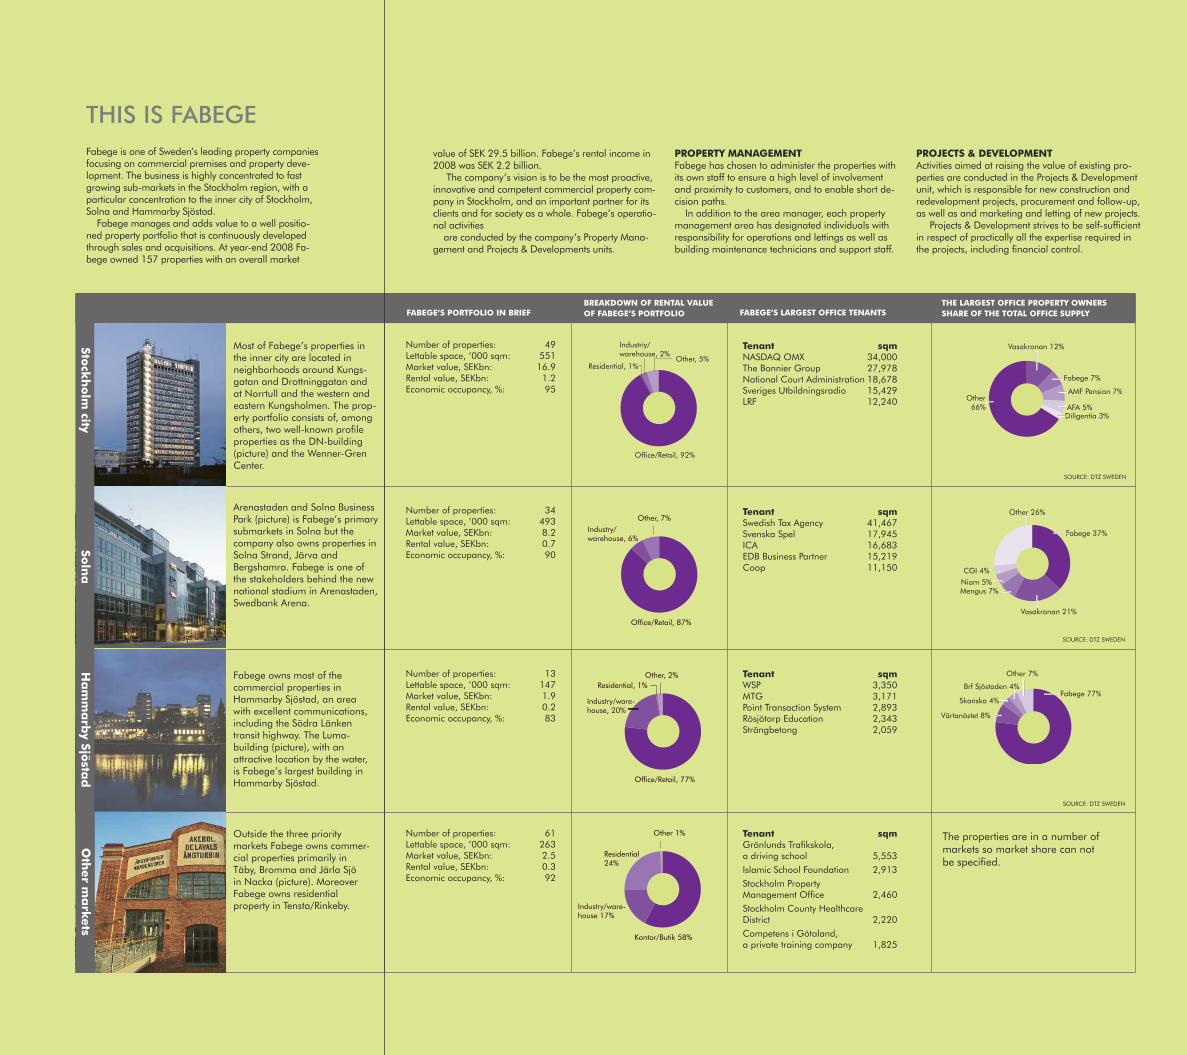
Tenant sqmWSP 3,350MTG 3,171Point Transaction System 2,893Rösjötorp Education 2,343Strängbetong 2,059
Tenant sqmNASDAQ OMX 34,000The Bonnier Group 27,978National Court Administration 18,678Sveriges Utbildningsradio 15,429LRF 12,240
THIS IS FABEGEFabege is one of Sweden’s leading property companiesfocusing on commercial premises and property deve-lopment. The business is highly concentrated to fastgrowing sub-markets in the Stockholm region, with aparticular concentration to the inner city of Stockholm,Solna and Hammarby Sjöstad.
Fabege manages and adds value to a well positio-ned property portfolio that is continuously developedthrough sales and acquisitions. At year-end 2008 Fa-bege owned 157 properties with an overall market
value of SEK 29.5 billion. Fabege’s rental income in2008 was SEK 2.2 billion.
The company’s vision is to be the most proactive,innovative and competent commercial property com-pany in Stockholm, and an important partner for itsclients and for society as a whole. Fabege’s operatio-nal activities
are conducted by the company’s Property Mana-gement and Projects & Developments units.
PROPERTY MANAGEMENTFabege has chosen to administer the properties withits own staff to ensure a high level of involvementand proximity to customers, and to enable short de-cision paths.
In addition to the area manager, each propertymanagement area has designated individuals withresponsibility for operations and lettings as well asbuilding maintenance technicians and support staff.
PROJECTS & DEVELOPMENTActivities aimed at raising the value of existing pro-perties are conducted in the Projects & Developmentunit, which is responsible for new construction andredevelopment projects, procurement and follow-up,as well as and marketing and letting of new projects.
Projects & Development strives to be self-sufficientin respect of practically all the expertise required inthe projects, including financial control.
Office/Retail, 87%
Industry/warehouse, 6%
Other, 7%
Office/Retail, 77%
Industry/ware-house, 20%
Other, 2%Residential, 1%
Kontor/Butik 58%
Industry/ware-house 17%
Other 1%
Residential24%
Most of Fabege’s properties inthe inner city are located inneighborhoods around Kungs-gatan and Drottninggatan andat Norrtull and the western andeastern Kungsholmen. The prop-erty portfolio consists of, amongothers, two well-known profileproperties as the DN-building(picture) and the Wenner-GrenCenter.
Arenastaden and Solna BusinessPark (picture) is Fabege’s primarysubmarkets in Solna but thecompany also owns properties inSolna Strand, Järva andBergshamra. Fabege is one ofthe stakeholders behind the newnational stadium in Arenastaden,Swedbank Arena.
Fabege owns most of thecommercial properties inHammarby Sjöstad, an areawith excellent communications,including the Södra Länkentransit highway. The Luma-building (picture), with anattractive location by the water,is Fabege’s largest building inHammarby Sjöstad.
Outside the three prioritymarkets Fabege owns commer-cial properties primarily inTäby, Bromma and Järla Sjöin Nacka (picture). MoreoverFabege owns residentialproperty in Tensta/Rinkeby.
Vasakronan 12%
Fabege 7%
AMF Pension 7%
AFA 5%Diligentia 3%
Other66%
Office/Retail, 92%
Residential, 1%
Industriy/warehouse, 2%
Other, 5%
Other 26%
Mengus 7%Niam 5%
CGI 4%
Vasakronan 21%
Fabege 37%
Other 7%
Skanska 4%
Brf Sjöstaden 4%Fabege 77%
Värtanästet 8%
Tenant sqmSwedish Tax Agency 41,467Svenska Spel 17,945ICA 16,683EDB Business Partner 15,219Coop 11,150
Tenant sqmGrönlunds Trafikskola,a driving school 5,553Islamic School Foundation 2,913Stockholm PropertyManagement Office 2,460Stockholm County HealthcareDistrict 2,220Competens i Götaland,a private training company 1,825
Number of properties: 49Lettable space, ’000 sqm: 551Market value, SEKbn: 16.9Rental value, SEKbn: 1.2Economic occupancy, %: 95
Number of properties: 34Lettable space, ’000 sqm: 493Market value, SEKbn: 8.2Rental value, SEKbn: 0.7Economic occupancy, %: 90
Number of properties: 13Lettable space, ’000 sqm: 147Market value, SEKbn: 1.9Rental value, SEKbn: 0.2Economic occupancy, %: 83
Number of properties: 61Lettable space, ’000 sqm: 263Market value, SEKbn: 2.5Rental value, SEKbn: 0.3Economic occupancy, %: 92
FABEGE’S PORTFOLIO IN BRIEF FABEGE’S LARGEST OFFICE TENANTS
The properties are in a number ofmarkets so market share can notbe specified.
THE LARGEST OFFICE PROPERTY OWNERSSHARE OF THE TOTAL OFFICE SUPPLY
BREAKDOWN OF RENTAL VALUEOF FABEGE’S PORTFOLIO
SOURCE: DTZ SWEDEN
SOURCE: DTZ SWEDEN
SOURCE: DTZ SWEDEN
Solna
Stockholmcity
HammarbySjöstad
Othermarkets
Fabege annual report 2008
the
yea
r i
n b
rie
f
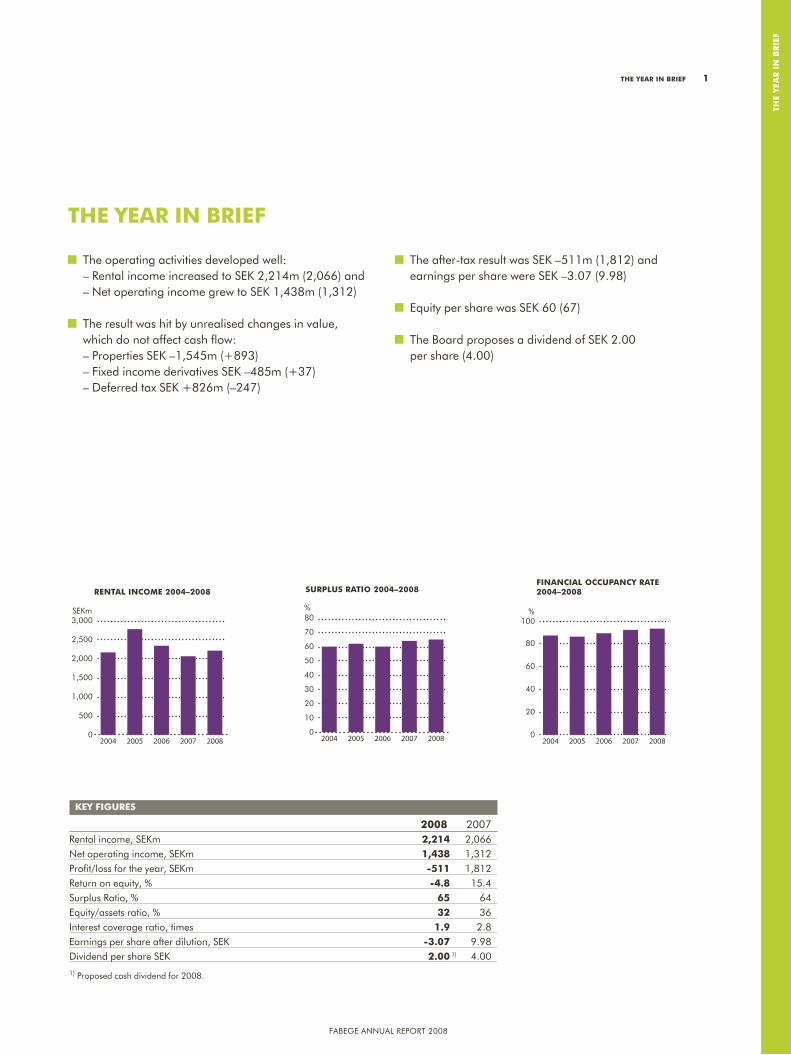
the operating activities developed well: – rental income increased to SeK 2,214m (2,066) and – net operating income grew to SeK 1,438m (1,312)
the result was hit by unrealised changes in value, which do not affect cash flow: – properties SeK –1,545m (+893) – Fixed income derivatives SeK –485m (+37) – Deferred tax SeK +826m (–247)
the after-tax result was SeK –511m (1,812) and earnings per share were SeK –3.07 (9.98)
equity per share was SeK 60 (67)
the board proposes a dividend of SeK 2.00 per share (4.00)
the year in brief
FINANCIAL OCCUPANCY RATE2004–2008
0
20
40
60
80
100
20082007200620052004
%
RENTAL INCOME 2004–2008
0
500
1,000
1,500
2,000
2,500
3,000
20082007200620052004
SEKm
SURPLUS RATIO 2004–2008
0
10
20
30
40
50
60
70
80
20082007200620052004
%
Key figures 2008 2007rental income, SeKm 2,214 2,066net operating income, SeKm 1,438 1,312 profit/loss for the year, SeKm -511 1,812return on equity, % -4.8 15.4Surplus ratio, % 65 64equity/assets ratio, % 32 36 Interest coverage ratio, times 1.9 2.8 earnings per share after dilution, SeK -3.07 9.98Dividend per share SeK 2.00 1) 4.00
1) proposed cash dividend for 2008.
the year in brief 1
Fabege annual report 2008
2 Message frOM the CeO
2008 was a year of big swings and sharp turns in the economy and in financial markets, affecting businesses as well as other sectors of society. The strong economic climate continued into the new year but in the autumn a serious financial crisis evolved, sparking a recession which soon had a serious impact on Sweden’s major exporters. Fixed income markets, which are crucial for Fabege, saw big swings – first up, then down. On the stock market, it was generally substantially down, and Fabege shares declined 55 percent during the turbulent stock market year 2008.
OperatiOnal gOals aChieved
For our operational activities 2008 was a year in which the lettings market remained stable, and Fabege was able to increase rental income by about SEK 150m and raise net opering income by almost ten per cent. We achieved our operational goals: the surplus ratio improved, the vacancy rate decreased, the project volume increased and we continued to make progress in the drive to concentrate activities to our main markets.
We continued to streamline our operations and developed our property management units and our human resources. An example of successful streamlining is an eight per cent reduction in energy use, which will benefit the environment as well as our bottom line.
earnings hit by asset iMpairMent
Despite this, Fabege’s earnings fell due to impairment of properties and fixed income derivatives. These impairment losses do not affect cash flow but have, in accordance with IFRS, yet a direct impact on the profit and loss account.
In response to the problems affecting credit markets and their consequences for the transaction market, yield requirements increased in 2008, putting downward pressure on property values. For Fabege this had the effect of reducing the value of the company’s property portfolio by SEK 1.5bn, or by about five per cent. The biggest adjustments to values were made in class C locations while prime, class A locations, where Fabege has most of its properties, fared
better. This is a pattern which I, along with many other leading property analysts, believe is set to continue.
sharp fall in interest expense
Fixed income markets were turbulent, pushing up Fabege’s average interest rate from 4.3 per cent at the beginning of the year to 5.1 per cent before the financial crisis culminated and the measures taken to restore confidence brought rates back down again. At year-end Fabege’s average interest rate had fallen to 3.3 per cent.
In early 2009 short-term interest rates have continued to fall. This will most likely significantly reduce our interest expense compared with 2008, strengthening our cash flow. Following a review of our funding requirements in the autumn, we now have good access to long-term capital.
transaCtiOn MarKet set
tO revive
In 2008 Fabege was a net seller of properties. We sold 13 properties for SEK 2.1bn and bought two properties for SEK 0.2bn. The activity, however, was generally low in the property market, with the exception of a few very large transactions. The gradual decline in market interest rates is now making returns on properties increasingly attractive, and it is likely that we will see a pick-up in activity and transactions.
Many new lettings
at the beginning Of the year
In early 2009 the rental market remains stable in our main markets and the new year has got off to a good start, with several new lettings, including a number of major lettings in project properties. Vattenfall, a major energy company, will be renting about 43,000 sqm of space in a new office building to be built in Arenastaden in Solna. This is a very strong confirmation of the growing attraction of the area. The vision for Arenastaden is starting to take shape, and we look forward to a number of exciting years, as a new part of town emerges in Solna. In the Lindhagen/Paradiset 29 property in western Kungsholmen we have concluded a lease for a 2,300 sqm office with IFS, a provider of business systems. IFS will become the first office tenant in this new and attractive office and retail property, which stands in an excellent location for signage exposure as well as transport connections next to the Essingeleden motorway.
well equipped fOr harder tiMes
All indications point to a substantially weakening economy but Fabege is well equipped, both organisationally and in
Our fOCus will be On Caring fOr and develOping Our relatiOnships with CustOMers
a year with bOth OperatiOnal prOgress and finanCial turbulenCe
Fabege annual report 2008
Mes
sa
ge
frO
M t
he
CeO
terms of stock, to face the challenges that this will bring. Our goals for 2009 are to
• Increase tenant retention• Improve the surplus ratio• Maintain a strong balance sheet
Our focus will be on caring for and developing our relationships with customers. By taking good care of our tenants and offering them opportunities to develop within our property portfolio, we will build a good platform for our property management activities in an environment of weakening economic climate and market turbulence. We will also continue to streamline our operations and improve our net operating income and surplus ratio.
We will continue to take advantage of good opportunities as we did last year. Sales of low-yielding properties with limited development potential, and to invest in our high-yielding projects are fully in line with our business model.
OutlOOK fOr 2009
Fabege has skilled and highly motivated staff and an organisation that can adapt rapidly to changing circumstances. With falling interest rates and secured access to capital, a strong cash flow, a high occupancy rate and properties and premises that will remain attractive regardless of the state of the economy, Fabege is in a good position for 2009, which will be a year of big challenges as well as interesting opportunities.
Christian Hermelin, Chief Executive Officer
Message frOM the CeO 3
Fabege annual report 2008
4
Fabege’s property portfolio comprises 157 properties with a strong concentration to dynamic sub-markets with development potential in Stockholm’s inner city, Solna and Hammarby Sjöstad. The company offers efficient and flexible premises, primarily offices but also retail and other premises.
Fabege strives to create well contained clusters of properties to ensure that proximity to and knowledge about the market provides the best possible opportunities for efficient management and a high occupancy rate.
Fabege has built up a strong pool of expertise in project development and is running a number of property projects in attractive locations. The company also has a portfolio of potential project opportunities. We develop and add value to properties in response to changing market requirements, the demand situation and opportunities to generate a strong return. A new property project will be started only once the property has been fully let in advance. Fabege’s project investments are forward-looking and are designed to reduce vacancy rates and raise rents in the portfolio, thereby improving cash flows and adding value.
The business is concentrated to the Stockholm region, the Nordic region’s largest and most dynamic property and rental market, where Fabege’s business model – acquisitions, improvement, management and sales – has the potential to generate business opportunities and values throughout the business cycle. Stockholm is undergoing rapid develop-ment, and Fabege has a significant presence in several of the capital’s main up-and-coming development areas, including
the Norra Station district and western Kungsholmen. In Solna Fabege has a large property holding in the number one development area, Arenastaden.
Client fOCus
Fabege has a flat organisation and a strong client focus that is clearly expressed in the company’s core values (Speed – Informality – Entrepreneurship – Business Orientation – Client Proximity, see below). Stockholm’s dynamic rental and property market and the high pace of business constantly create new challenges. As a client-oriented and entrepreneurial company,
Fabege is continually adapting to changing market requirements and our clients’ development. Each market area in Fabege operates as a company within the company with separate responsibility and the ability to react rapidly to changes and identify new business opportunities.
Fabege has about 2,000 leases in its commercial property portfolio. To minimise risk, the company strives to achieve a balanced mix of stable customers from different market segments. The ten largest tenants by value account for about 20 per cent of the total contract value and generally have significantly longer leases than average.
fabege’s eMplOyees and values
Fabege’s 148 employees are its most important resource. The right expertise and a strong commitment among employees are crucial success factors. Fabege offers skills development and further education through its customised training programmes, which are arranged on a regular basis. The building blocks of Fabege’s company culture are its five core values: Speed, Informality, Entrepreneurship, Business Orientation and Client Proximity, and the company provides special training courses centred on these values for all employees to unite all staff around a common value basis.
For the future the company’s ability to attract and retain the right individuals will be a key success factor. Fabege works consistently to improve awareness of and strengthen the image of the company among potential future employees, especially university students.
business COnCept and strategiC fOCus
fabege owns, manages and adds value to a significant property portfolio in the stockholm region – the nordic region’s most dynamic property and rental market. the company’s business model is designed to create business opportunities and values throughout the business cycle.
4 business COnCept and strategiC fOCus
business COnCeptFabege’s business concept is focused on commercial properties in the Stockholm region with an emphasis on a limited number of fast-growing sub-markets. The aim is to create value by managing, improving and working actively with its property portfolio, both through sales and acquisitions. Accrued values should be realised at the right time.
visiOnTo be the most proactive, innova-tive and competent commercial property company in Stockholm, an important partner for our clients and for society as whole. The natural first choice.
MissiOnTo understand our customers’ needs and deliver services that exceed expectations. To continuously increase our company’s value and build a conscious position and profile in society.
Fabege annual report 2008
fab
ege’
s b
usin
ess M
Od
el
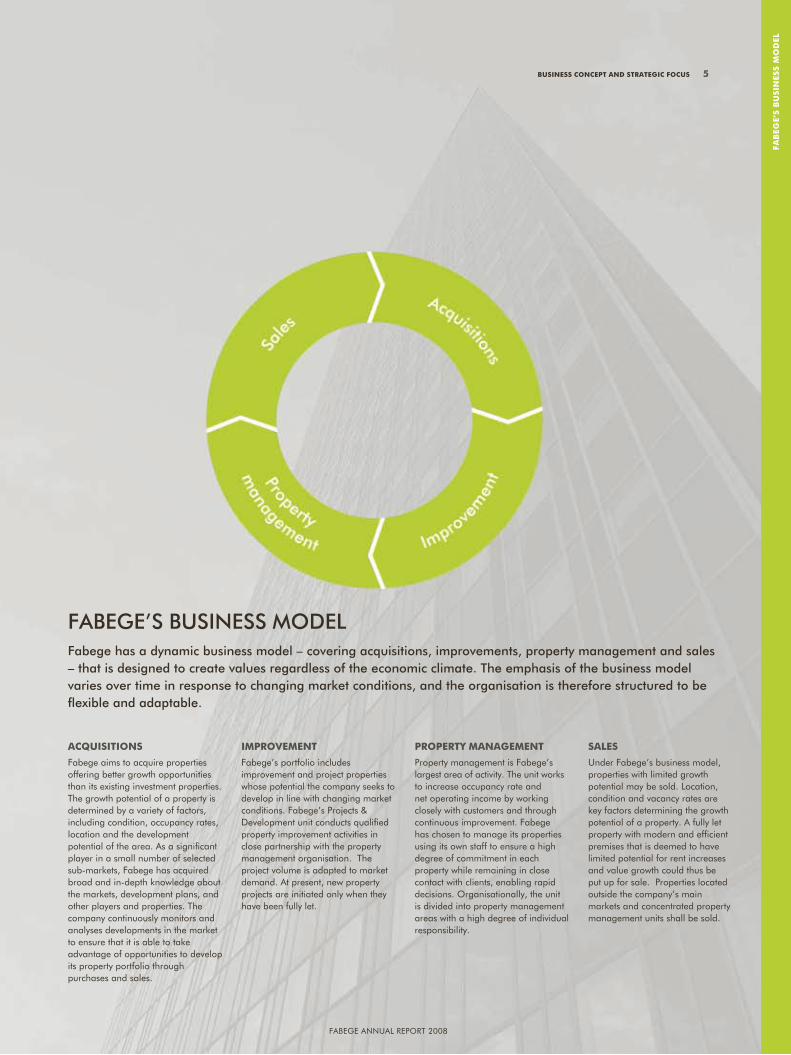
FAbege’S buSineSS modelFabege has a dynamic business model – covering acquisitions, improvements, property management and sales – that is designed to create values regardless of the economic climate. The emphasis of the business model varies over time in response to changing market conditions, and the organisation is therefore structured to be flexible and adaptable.
aCquisitiOns
Fabege aims to acquire properties offering better growth opportunities than its existing investment properties. the growth potential of a property is determined by a variety of factors, including condition, occupancy rates, location and the development potential of the area. as a significant player in a small number of selected sub-markets, Fabege has acquired broad and in-depth knowledge about the markets, development plans, and other players and properties. the company continuously monitors and analyses developments in the market to ensure that it is able to take advantage of opportunities to develop its property portfolio through purchases and sales.
iMprOveMent
Fabege’s portfolio includes improvement and project properties whose potential the company seeks to develop in line with changing market conditions. Fabege’s projects & Development unit conducts qualified property improvement activities in close partnership with the property management organisation. the project volume is adapted to market demand. at present, new property projects are initiated only when they have been fully let.
prOperty ManageMent
property management is Fabege’s largest area of activity. the unit works to increase occupancy rate and net operating income by working closely with customers and through continuous improvement. Fabege has chosen to manage its properties using its own staff to ensure a high degree of commitment in each property while remaining in close contact with clients, enabling rapid decisions. organisationally, the unit is divided into property management areas with a high degree of individual responsibility.
sales
under Fabege’s business model, properties with limited growth potential may be sold. location, condition and vacancy rates are key factors determining the growth potential of a property. a fully let property with modern and efficient premises that is deemed to have limited potential for rent increases and value growth could thus be put up for sale. properties located outside the company’s main markets and concentrated property management units shall be sold.
Fabege annual report 2008
business COnCept and strategiC fOCus 5
Fabege annual report 2008Fabege annual report 2008
0
1
2
3
4
5
20082007200620052004
Goal
INTEREST COVERAGE RATIO, 2004–2008
Times
0
10
20
30
40
50
20082007200620052004
%
Goal
EQUITY/ASSETS RATIO 2004–2008RETURN ON EQUITY 2004–2008
-5
0
5
10
15
20
25
20082007200620052004
%
Fabege’s operations are guided by defi ned goals at all levels of the company – from the company’s overall goals to goals for individual units and departments. management of objectives are based on several different business perspectives.
A goAl-orienTed buSineSS
Overall gOals
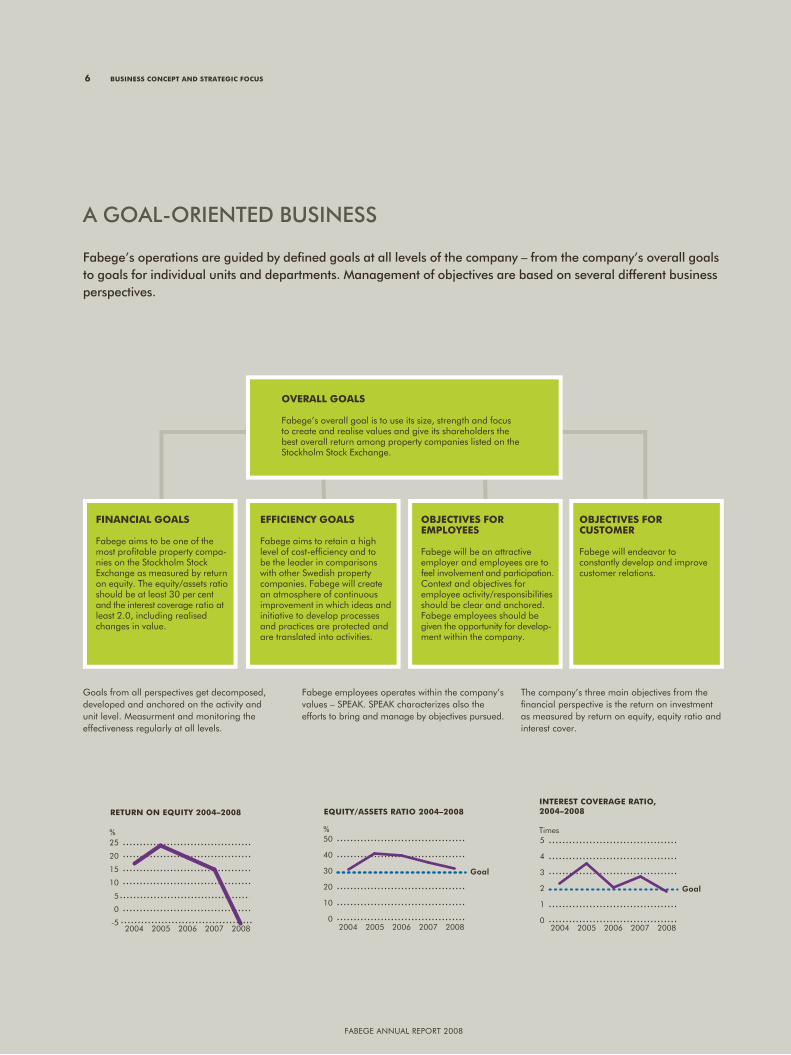
Fabege’s overall goal is to use its size, strength and focus to create and realise values and give its shareholders the best overall return among property companies listed on the Stockholm Stock exchange.
finanCial gOals
Fabege aims to be one of the most profi table property compa-nies on the Stockholm Stock exchange as measured by return on equity. the equity/assets ratio should be at least 30 per cent and the interest coverage ratio at least 2.0, including realised changes in value.
ObJeCtives fOr eMplOyees
Fabege will be an attractive employer and employees are to feel involvement and participation. Context and objectives for employee activity/responsibilities should be clear and anchored. Fabege employees should be given the opportunity for develop-ment within the company.
ObJeCtives fOr CustOMer
Fabege will endeavor to constantly develop and improve customer relations.
effiCienCy gOals
Fabege aims to retain a high level of cost-effi ciency and to be the leader in comparisons with other Swedish property companies. Fabege will create an atmosphere of continuous improvement in which ideas and initiative to develop processes and practices are protected and are translated into activities.
goals from all perspectives get decomposed, developed and anchored on the activity and unit level. Measurment and monitoring the effectiveness regularly at all levels.
Fabege employees operates within the company’s values – SpeaK. SpeaK characterizes also the efforts to bring and manage by objectives pursued.
the company’s three main objectives from the fi nancial perspective is the return on investment as measured by return on equity, equity ratio and interest cover.
6 business COnCept and strategiC fOCus
Fabege annual report 2008
va
lue-
Cr
eati
ng
str
ate
gie
s
value-Creating strategies and the fabege brand 7
pOrtfOliO strategy
Commercial properties and projects in the Stockholm region constitute Fabege’s core business. Fabege seeks to concentrate its properties into units that can be managed efficiently. Anomalous properties that are located well beyond these units should be sold. Another key aspect of the strategy is to continually develop and improve the portfolio through acquisitions, sales and improvements. The aim is to consolidate and strengthen the company’s market positions by concentrating on selected market segments.
During the years 2004-2006 Fabege implemented a comprehensive restructuring and a drive to concentrate its property portfolio to the Stockholm region. Since then the company has continued to gradually concentrate its holdings to office properties in its main markets, the inner city of Stockholm, Solna and Hammarby Sjöstad.
value-adding strategy
Fabege aims to acquire properties that offer better growth opportunities than its existing investment properties. New projects should be 35 per cent financed by the company’s funds and generate a return on equity of at least 20 per cent. The average turnaround time should be three to five years and properties should be sold at the right time to realise the accrued values.
In 2008 project investments worth SEK 462m were approved and SEK 1,963m was invested in existing properties and projects. Fabege’s project investments are forward-looking and are designed to reduce vacancy rates and raise rents, thereby improving cash flows and adding value to the portfolio.
CustOMer and brand
Fabege strives to have a diversified customer portfolio with many different tenants representing a wide range of industries. Existing customer relation-ships are to be maintained and developed
while efforts shall be made to attract new customers and relationships and develop these.
The Fabege brand should support the company’s business, create value and contribute to achieving the company’s goals. Fabege’s brand should be associated with the company’s five core values (see page 23), which should inspire the organisation and company culture.
Developing the strength of the brand is crucial to the company’s continued success. Developing Fabege’s intangible assets also involves building strong brands in the company’s prioritised areas, both for the area as a whole (e.g. Arenastaden in Solna) and for individual properties/concepts. Our employees are the best creators and carriers of the Fabege brand. The brand should be built from the inside out, and it is to a large extent our employees’ expertise and conduct in contacts with clients, owners and other stakeholders that make up the Fabege brand.
value-Creating strategies and the fabege brand
to achieve its goals, fabege has defined clear strategies for the development of its property port-folio and for adding value to properties. the fabege brand should support the company’s business and contribute to achieving the company’s goals.
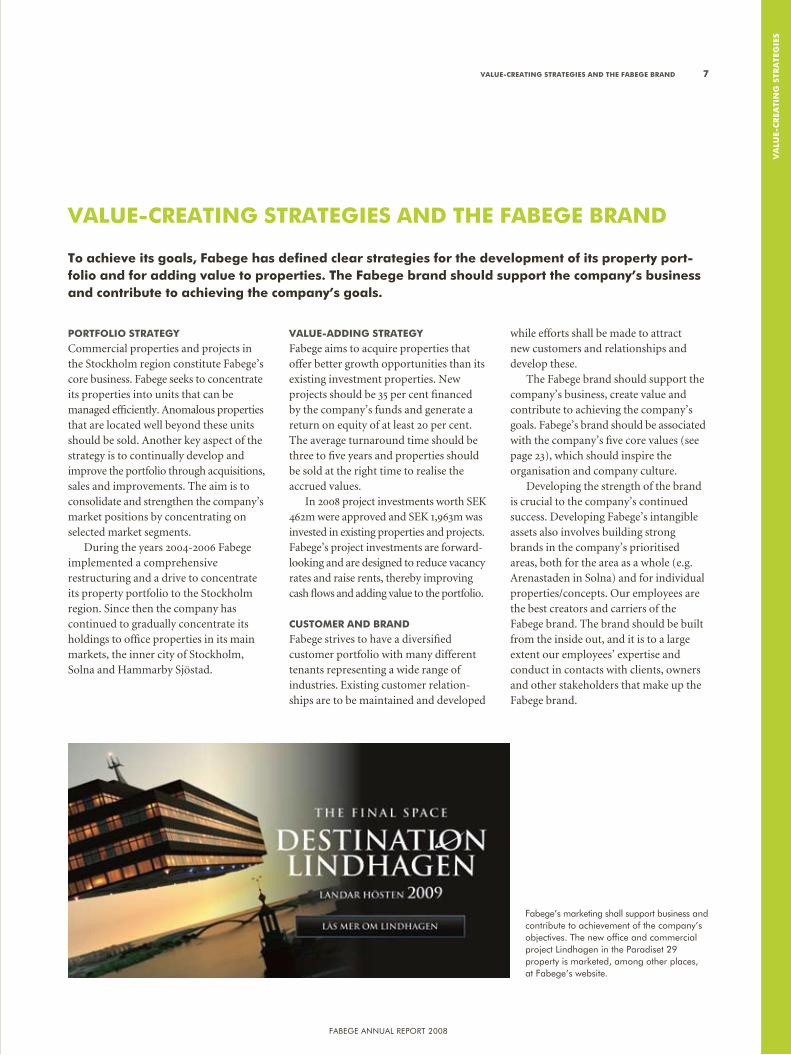
Fabege’s marketing shall support business and contribute to achievement of the company’s objectives. the new office and commercial project lindhagen in the paradiset 29 property is marketed, among other places, at Fabege’s website.
Fabege annual report 2008
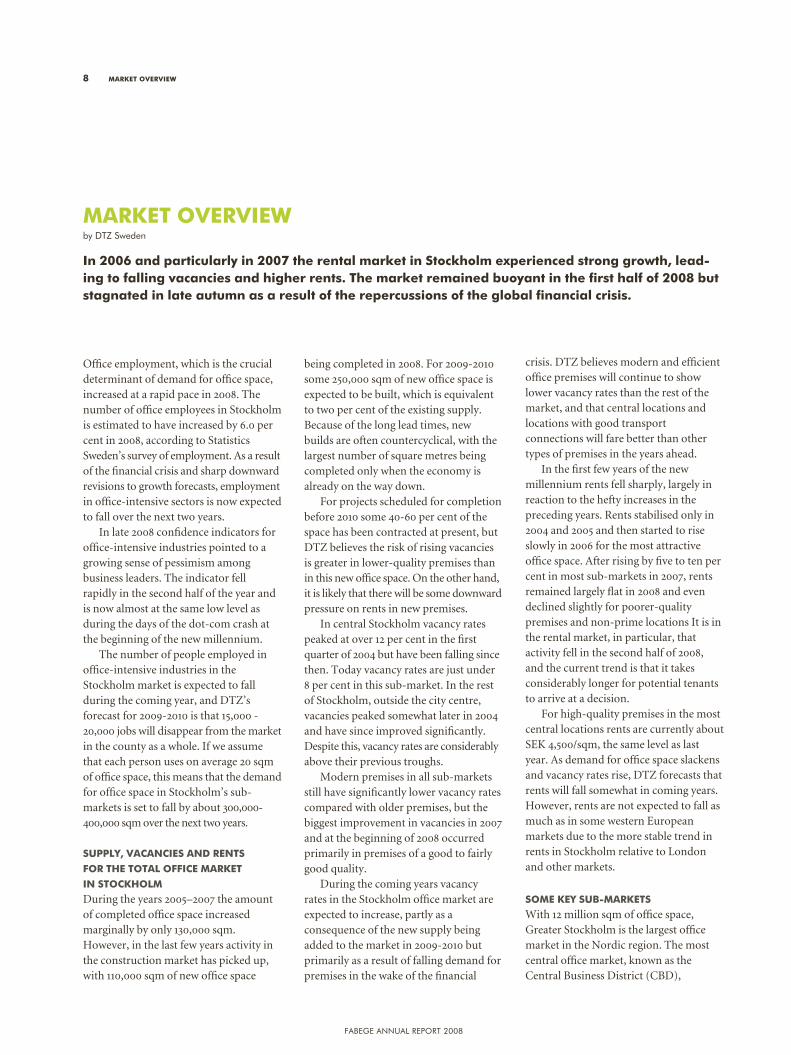
Office employment, which is the crucial determinant of demand for office space, increased at a rapid pace in 2008. The number of office employees in Stockholm is estimated to have increased by 6.0 per cent in 2008, according to Statistics Sweden’s survey of employment. As a result of the financial crisis and sharp downward revisions to growth forecasts, employment in office-intensive sectors is now expected to fall over the next two years.
In late 2008 confidence indicators for office-intensive industries pointed to a growing sense of pessimism among business leaders. The indicator fell rapidly in the second half of the year and is now almost at the same low level as during the days of the dot-com crash at the beginning of the new millennium.
The number of people employed in office-intensive industries in the Stockholm market is expected to fall during the coming year, and DTZ’s forecast for 2009-2010 is that 15,000 - 20,000 jobs will disappear from the market in the county as a whole. If we assume that each person uses on average 20 sqm of office space, this means that the demand for office space in Stockholm’s sub-markets is set to fall by about 300,000-400,000 sqm over the next two years.
supply, vaCanCies and rents
fOr the tOtal OffiCe MarKet
in stOCKhOlM
During the years 2005–2007 the amount of completed office space increased marginally by only 130,000 sqm. However, in the last few years activity in the construction market has picked up, with 110,000 sqm of new office space
being completed in 2008. For 2009-2010 some 250,000 sqm of new office space is expected to be built, which is equivalent to two per cent of the existing supply. Because of the long lead times, new builds are often countercyclical, with the largest number of square metres being completed only when the economy is already on the way down.
For projects scheduled for completion before 2010 some 40-60 per cent of the space has been contracted at present, but DTZ believes the risk of rising vacancies is greater in lower-quality premises than in this new office space. On the other hand, it is likely that there will be some downward pressure on rents in new premises.
In central Stockholm vacancy rates peaked at over 12 per cent in the first quarter of 2004 but have been falling since then. Today vacancy rates are just under 8 per cent in this sub-market. In the rest of Stockholm, outside the city centre, vacancies peaked somewhat later in 2004 and have since improved significantly. Despite this, vacancy rates are considerably above their previous troughs.
Modern premises in all sub-markets still have significantly lower vacancy rates compared with older premises, but the biggest improvement in vacancies in 2007 and at the beginning of 2008 occurred primarily in premises of a good to fairly good quality.
During the coming years vacancy rates in the Stockholm office market are expected to increase, partly as a consequence of the new supply being added to the market in 2009-2010 but primarily as a result of falling demand for premises in the wake of the financial
crisis. DTZ believes modern and efficient office premises will continue to show lower vacancy rates than the rest of the market, and that central locations and locations with good transport connections will fare better than other types of premises in the years ahead.
In the first few years of the new millennium rents fell sharply, largely in reaction to the hefty increases in the preceding years. Rents stabilised only in 2004 and 2005 and then started to rise slowly in 2006 for the most attractive office space. After rising by five to ten per cent in most sub-markets in 2007, rents remained largely flat in 2008 and even declined slightly for poorer-quality premises and non-prime locations It is in the rental market, in particular, that activity fell in the second half of 2008, and the current trend is that it takes considerably longer for potential tenants to arrive at a decision.
For high-quality premises in the most central locations rents are currently about SEK 4,500/sqm, the same level as last year. As demand for office space slackens and vacancy rates rise, DTZ forecasts that rents will fall somewhat in coming years. However, rents are not expected to fall as much as in some western European markets due to the more stable trend in rents in Stockholm relative to London and other markets.
sOMe Key sub-MarKets
With 12 million sqm of office space, Greater Stockholm is the largest office market in the Nordic region. The most central office market, known as the Central Business District (CBD),
8 MarKet Overview
MarKet Overview by DtZ Sweden
in 2006 and particularly in 2007 the rental market in stockholm experienced strong growth, lead-ing to falling vacancies and higher rents. the market remained buoyant in the first half of 2008 but stagnated in late autumn as a result of the repercussions of the global financial crisis.
Fabege annual report 2008
Ma
rK
et O
ver
vie
w
accounts for about 1.85 million sqm. Outside Stockholm City there are a
number of large and important office sub-markets, of which Kista, western Kungsholmen, Frösunda, Solna and Marievik/Liljeholmen are the most established.
Cbd – CenTrAl buSineSS diSTriCT The most central parts of Stockholm, CBD, are attractive to tenants for several reasons. The central location is highly sought after, transport connections are excellent and the level of local services in the area is very high. A move to CBD is generally seen as prestigious, and the addresses in the area are widely known. In many industries a central location is a very high priority, and price sensitivity is low, as reflected in the high rents.
In recent years CBD has expanded to also comprise the area around the Central Station and Blekholmen as well as the new office buildings around Norra Bantorget. The supply of office space in this area is estimated to have increased to about 1.85 million sqm. High-quality modern office properties and well planned office environments have been and continue to be in short supply, but in 2009 - 2011 at least 80,000 sqm of newly built office space will be added to the market at the same time as several properties have recently undergone or will undergo major renovation.
Market rents for the best office premises in the most attractive CBD locations increased somewhat at the beginning of 2008 and then retreated slightly to end the year at roughly the same level as in 2007. Top rents in the “Golden Triangle”, the area of CBD bordered by Hamngatan, Norrlandsgatan and Birger Jarlsgatan, currently range from SEK 4,200 to 4,700/sqm with a few contracts priced at up to SEK 5,000/sqm.
In the sub-market as a whole rents range from SEK 2,500 to 4,700/sqm depending on location, size and quality. Vacancy rates for high-quality office space are estimated at five to eight per cent,
with higher levels for older premises. DTZ estimates that the expected decline in demand in the next few years will primarily affect poorer-quality, inefficient premises in the CBD district.
reST oF The inner CiTyThe other parts of the inner city of Stockholm, i.e. central Kungsholmen, Östermalm and Södermalm, are also attractive in terms of location and local services. Transport connections are good and the areas are well known. The supply of offices varies both in terms of quality and age. There is a limited number of modern office buildings in these areas, and although some new builds and conversion projects are under way, it is clear that modern offices are in short supply also in these sub-markets. Vacancy rates are about eight to ten per cent and rents range from SEK 2,000 to 3,400/sqm. DTZ expects that the above four districts will be affected by the decline in demand but outperform several other sub-markets.
SolnA/SundbybergSolna’s office market is estimated at 1 million sqm, accounting for about nine per cent of the total supply in Greater Stockholm. The Solna office market can be divided into five sub-markets: Solna Strand, Solna Centrum, Solna Business Park, Solna Station and Frösunda. The municipality of Sundbyberg includes the nearby, competing sub-markets Sundbybergs Centrum and Hallonbergen/Rissne.
Solna Strand is an area with a large concentration of big office buildings erected mostly in the 1970s and 80s. In the late 1990s the area experienced an upsurge, as a number of major tenants relocated to the area, pushing rents higher. Rents for good-quality office space soared from SEK 1,000/sqm to SEK 1,500-2,100/sqm in only a few years and have remained at these levels since then. Solna Strand’s main competitive asset is its excellent transport location, with the
MarKet Overview 9
-6
-4
-2
0
2
4
6
8
10
Forecast
OFFICE STAFF EMPLOYED, ANNUAL CHANGE STOCKHOLM MARKET
05 07 09 100301999795
%
Source: DTZ Sweden
-60-50-40-30-20-10
01020304050607080%
Shortage of staff, proportion
Confidence indicator,office-intensive
CONFIDENCE INDICATOR AND SHORTAGE OF STAFF FOR OFFICE-INTENSIVE INDUSTRIES, STOCKHOLM MARKET
Source: DTZ Sweden
0
50
100
150
200
250
300
350
400
0
2
4
6
8
10
12
14
16
18
10090807060504030201009998979695949392
% ’000 sqm
Vacancy Production of new buildings
Forecast
ANNUAL PRODUCTION OF NEW BUILDINGS AND DEGREE OF VACCANCY, STOCKHOLM MARKET
Source: DTZ Sweden
Fabege annual report 2008
nearby Vreten metro station and access to commuter trains. The local property owners have also joined forces to market the area in an effort to attract more tenants. Vacancy rates range from 8-12 per cent.
Solna Business Park (Vireberg) has a number of high-class office properties that have been upgraded in recent years, but there are also a number of office properties of considerably lower standard. In the last five to six years the office park has established itself as a strong office location, following decisions by attractive tenants such as ICA, EDB, Coop and IFS to move their head offices to the area. As in Solna Strand, rent levels in the area have increased from SEK 1,000/sqm a few years ago to SEK 1,200-2,000/sqm today. Vacancies are concentrated almost entirely to poor-quality offices, but for the area as a whole the vacancy rate is about 8-14 per cent.
Like Solna Strand, Solna Station was built largely in the 1970s and 80s. Here, too, there are large office units of varying quality. Previously, property owners in the area have suffered from high vacancy rates, but the local lettings market has picked up considerably in recent years. Planning and preparations for the new national arena and surrounding blocks are currently under way. As this work progresses the area’s attractiveness will increase. The area has good transport connections thanks to the commuter train services, with a station centrally located in the area. Rents are similar to those in Solna Business Park.
Frösunda is another strong office district in Solna. The area’s location close to the E4 motorway and Solna station ensures good access to transport and provides excellent locations for billboards and signage. The area is home to modern office properties of a very high standard. Although created relatively recently, the area has rapidly established itself as one of Greater Stockholm’s most popular office locations. Rents range from SEK 1,700 - 2,600/sqm for modern office
space, with older premises fetching SEK 1,500 - 1,800/sqm. The area’s supply of offices is still growing, and if the space currently under construction is included, the vacancy rate would be about 15 per cent.
hAmmArby SjöSTAd And SödrA hAmmArbyhAmnenIn the last decade Hammarby Sjöstad has been one of the most interesting development areas in Greater Stockholm. An entirely new part of town has been built and 20,000 people have moved here as the area has been transformed. Södra Hammarbyhamnen, an adjoining area that was previously home to light industry, has also undergone a transformation into an alternative place of establishment for office tenants. Transport connections have improved considerably with the extension of the Tvärbanan light rail line, and a number of property owners have invested capital and time in raising the standard of their properties in the area. The supply of office space in the area is highly varied, modern standards mixed with old. This situation is reflected in the wide price range, with rents ranging from SEK 700 - 2,000/sqm. Vacancy rates are expected to be 12-15 per cent, and a large share of the space is of a character that requires major investments.
the investMent MarKet
In recent years the Swedish investment market for properties has seen high transaction volumes and a large influx of foreign investors. 2008 was no exception, with properties worth SEK 155bn changing hands. This is a significant increase on 2007, which saw total transactions of SEK 135bn. However, about one third of the total volume was in some way linked to the big Vasakronan deal in July. The Swedish government’s sale to AP Fastigheter, which then sold a large part of the portfolio to Niam, and a couple of swap deals with other government-owned companies earlier in the year accounted for SEK 53bn of the total.
1008060402009896949290
Source: DTZ Sweden
Forecast
PRIME OFFICE YIELD, STOCKHOLM
2
0
4
6
8%
0
1,000
2,000
3,000
4,000
5,000
6,000
-20
-10
0
10
20
30
40
10080604020098969492
% ’000 sqm
Rise in rents Rent Forecast
ANNUAL RENTAL GROWTH AND OFFICE RENTAL LEVELS AT PRIME LOCATION
Source: DTZ Sweden
SEKm
TOTAL ANNUAL TURNOVER IN THE SWEDISH TRANSACTION MARKET
0
30
60
90
120
150
180
080706050403020100
Total turnover International buyersSource: DTZ Sweden
10 MarKet Overview
Fabege annual report 2008
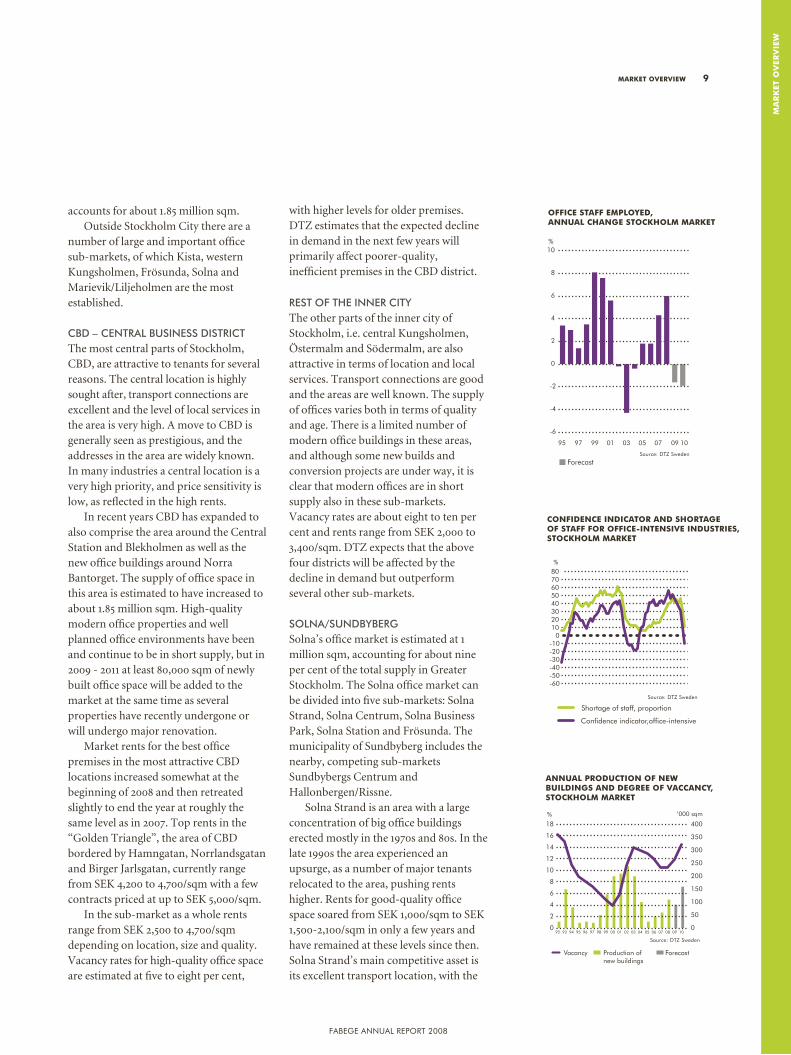
In the fashion world there is a tradition of letting the office serve as a crystal-clear reflection of the brand. every detail here should be a manifestation of what tiger of Sweden represents: the unexpected stylish fashion company! So the whole office had to be tailor-made, which we and Fabege has put a lot of commitment and energy into. our new office on norra bantorget is a meeting place for the whole fashion industry chain, taking in design and product development as well as the function of the premises as showroom for the customers who visit us to place their orders. all of which makes tiger of Sweden a classic fashion house.
Jonas nyström retail Manager, tiger of Sweden
Ma
rK
et O
ver
vie
wMarKet Overview 11
Fabege annual report 2008
Despite the seemingly high volume for the full year, the Swedish property market has been widely affected by the financial crisis in 2008. A number of transactions, including the very large Vasakronan and Steen & Ström deals, which were initiated before the summer, were successfully completed in late summer before the transaction market ground to halt. In the fourth quarter turnover fell sharply, and total transaction volumes were 55 per cent and 45 per cent lower than in the same quarters in 2007 and 2006. A worrying trend is that a shrinking number of transactions and transaction prices were announced in late autumn, creating greater uncertainty for valuers and investors.
Interest from foreign investors has also diminished appreciably in 2008 due to the serious problems affecting the investors’ home markets. UK investors, in particular, who have been very active in recent years, have been forced to concentrate on managing their existing holdings at home and also see significantly better investment opportunities in the UK where prices have fallen sharply. Norwegian and Danish investors, who had also been very active in Sweden, have sharply curtailed their activities.
Stockholm has long been the most attractive and largest property market in Sweden in terms of transaction volume. If one includes Stockholm’s share in the Vasakronan portfolio, the Stockholm market set a new transaction record in 2008. Properties worth SEK 78bn changed hands, which is slightly more than half the volume for the country as a whole. The corresponding figure for both 2006 and 2007 was SEK 58bn. The office sector remained the single largest sector, accounting for just over 50 per cent of the total volume in Stockholm.
As in the overall Swedish market, the share of foreign buyers was significantly lower than in previous years. In 2008 this category of investor bought properties worth SEK 12bn, against SEK 29bn in
2007. The single largest transaction was US-based Pembroke’s purchase of properties in the Putten and Hästen blocks in central Stockholm from CIC Partners, also of the US, for SEK 7bn in July 2008.
Yield requirements for property investments increased steadily during the year as a result of the financial crisis and the consequent shortage of liquidity in the banking system and widespread concerns about the economic outlook. Interest margins have increased but the most notable impact is that banks have more or less cut off funding for all types of properties, particularly in non-prime locations or areas with high vacancies. Nor is it uncommon today to find that banks refuse to provide funding altogether to investors that do not already have a strong relationship with the bank.
After hitting a bottom in mid-2007 yield requirements have increased and are now estimated to be about 5.00 per cent, or slightly more, for prime property, after increasing by 50–75 basis points during the year. For poorer-quality office
properties, but still in CBD locations, yield requirements are about 5.75 per cent with variations depending on the standard and contract situation.
DTZ estimates that yield requirements for office properties will continue to increase in 2009, albeit at a slower pace. The key fundamental reason is of course the slowdown in the real real economy but a tough financing market is another factor. Previous high expectations for rent increases, which were factored into yield requirements, are set to decline in line with an expected increase in vacancies over the next few years. The low interest rates have the opposite effect but because of the banks’ high margins and reluctance to lend the impact is small.
Globally, a clear trend is evident, with rising yield requirements in the large European investment markets since the second half of 2007. Historically, yield requirements in the Stockholm market have mirrored the London market with a lag of about one quarter, and this, too, suggests that we can expect a further rise.
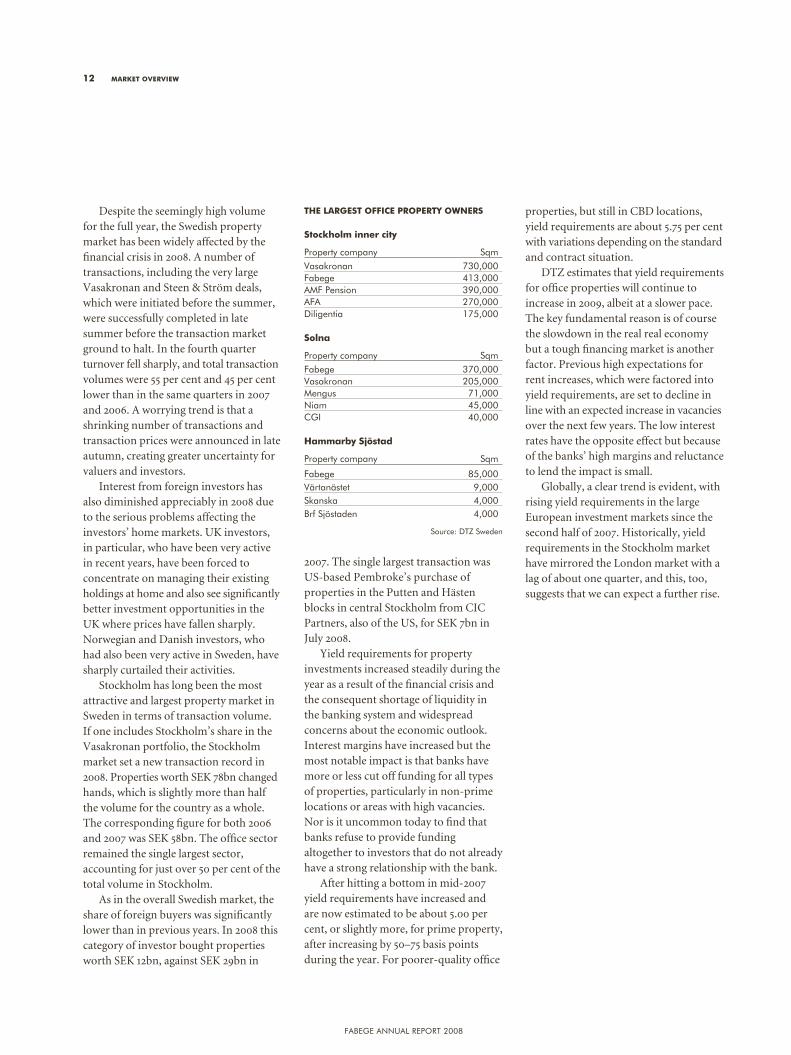
the largest OffiCe prOperty Owners
stockholm inner city
property company SqmVasakronan 730,000Fabege 413,000aMF pension 390,000aFa 270,000Diligentia 175,000
solna
property company SqmFabege 370,000Vasakronan 205,000Mengus 71,000niam 45,000CgI 40,000
hammarby sjöstad
property company Sqm
Fabege 85,000Värtanästet 9,000Skanska 4,000brf Sjöstaden 4,000
12 MarKet Overview
Source: DtZ Sweden
Fabege annual report 2008
fab
ege’
s b
usin
ess
Fabege is one of Sweden’s leading property companies focusing on commercial premises. The company’s properties are located in the Stockholm region with a strong concentration to Stockholm’s inner city, Solna and Hammarby Sjöstad. Fabege owns and manages 157 properties.
The Stockholm region is the single largest rental and property market in Sweden, with some 12 million sqm of office space. As the owner of about 8 per cent of the total supply of office space, Fabege is one of the largest players in the Stockholm market.
Fabege currently has a well contained portfolio in which a majority of properties
are located within a radius of 5 km from Kungsgatan in the centre of Stockholm. The portfolio contains stable properties with good cash flows as well as properties with good development potential.
prOperty ManageMent
Creating or finding the right premises for the customer is the heart of the business. This is achieved through long-term work coupled with daily contacts with the customer, which builds trust and loyalty on both sides.
Fabege’s approach to property management has built a robust platform with a high occupancy rate and stable tenants. The area manager is responsible for operations and development as well as
for the financial statements of each property management area. A team of operations managers, marketing officers, building maintenance technicians, support and lettings staff are assigned to each management area. About 85 of Fabege’s 148 employees work in property management.
Active management also involves solving big and complex moves. This can involve helping a customer find new premises, or providing support for a move and then initiating a project to add value to the vacated premises. Before Fabege initiates an improvement project the property must be fully let.
fabege’s business 13
fabege’s business
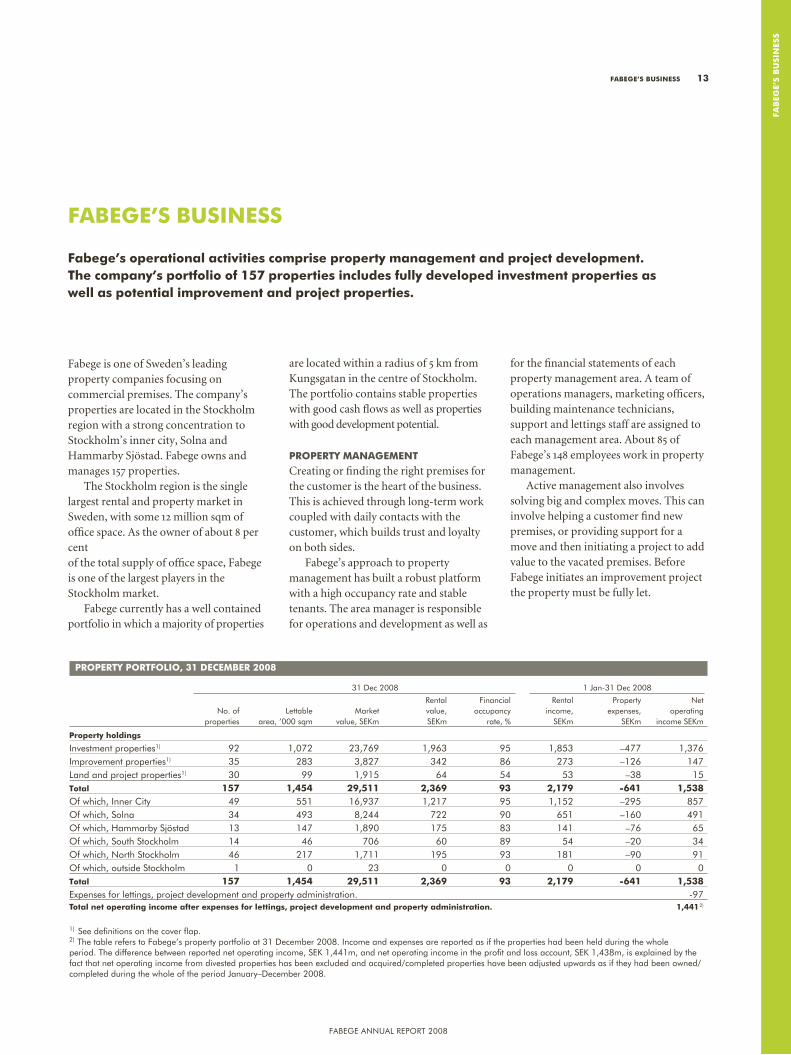
fabege’s operational activities comprise property management and project development. the company’s portfolio of 157 properties includes fully developed investment properties as well as potential improvement and project properties.
prOperty pOrtfOliO, 31 deCeMber 2008
31 Dec 2008 1 Jan-31 Dec 2008
rental Financial rental property net no. of lettable Market value, occupancy income, expenses, operating properties area, ’000 sqm value, SeKm SeKm rate, % SeKm SeKm income SeKm
property holdings
Investment properties1) 92 1,072 23,769 1,963 95 1,853 –477 1,376Improvement properties1) 35 283 3,827 342 86 273 –126 147land and project properties1) 30 99 1,915 64 54 53 –38 15total 157 1,454 29,511 2,369 93 2,179 -641 1,538of which, Inner City 49 551 16,937 1,217 95 1,152 –295 857of which, Solna 34 493 8,244 722 90 651 –160 491of which, Hammarby Sjöstad 13 147 1,890 175 83 141 –76 65of which, South Stockholm 14 46 706 60 89 54 –20 34of which, north Stockholm 46 217 1,711 195 93 181 –90 91of which, outside Stockholm 1 0 23 0 0 0 0 0total 157 1,454 29,511 2,369 93 2,179 -641 1,538expenses for lettings, project development and property administration. -97total net operating income after expenses for lettings, project development and property administration. 1,441 2)
1) See definitions on the cover flap.2) the table refers to Fabege’s property portfolio at 31 December 2008. Income and expenses are reported as if the properties had been held during the whole period. the difference between reported net operating income, SeK 1,441m, and net operating income in the profit and loss account, SeK 1,438m, is explained by the fact that net operating income from divested properties has been excluded and acquired/completed properties have been adjusted upwards as if they had been owned/completed during the whole of the period January–December 2008.
Fabege annual report 2008
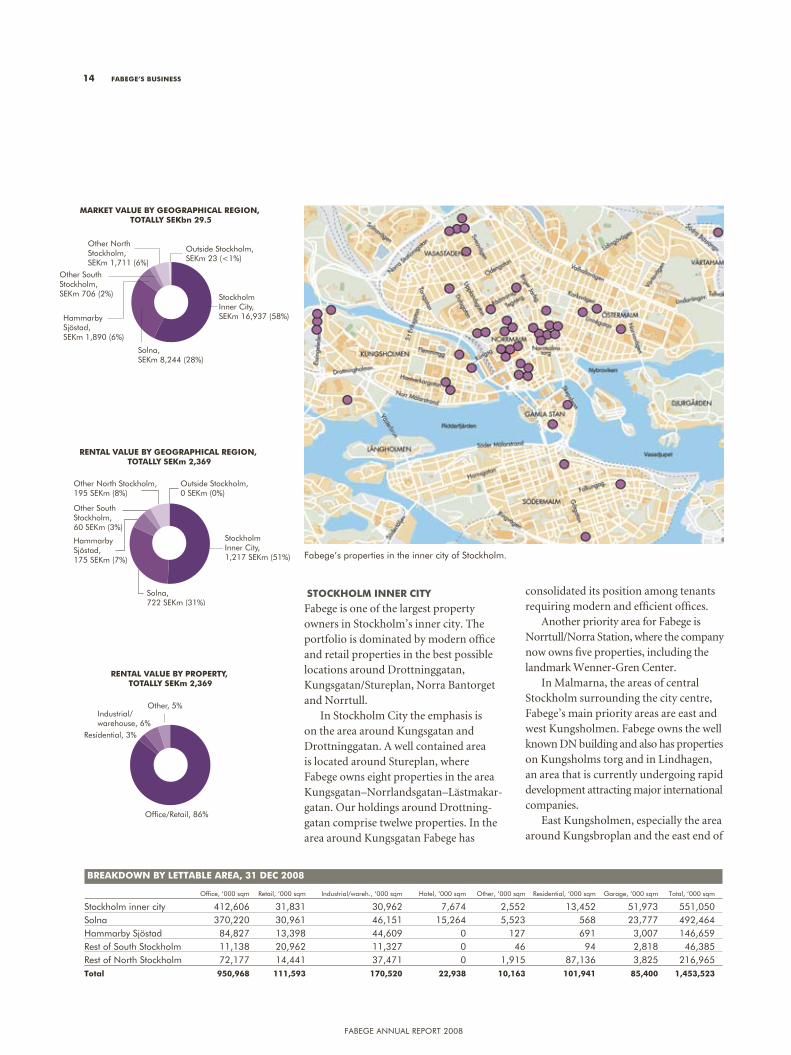
stOCKhOlM inner City
Fabege is one of the largest property owners in Stockholm’s inner city. The portfolio is dominated by modern office and retail properties in the best possible locations around Drottninggatan, Kungsgatan/Stureplan, Norra Bantorget and Norrtull.
In Stockholm City the emphasis is on the area around Kungsgatan and Drottninggatan. A well contained area is located around Stureplan, where Fabege owns eight properties in the area Kungsgatan–Norrlandsgatan–Lästmakar-gatan. Our holdings around Drottning-gatan comprise twelwe properties. In the area around Kungsgatan Fabege has
consolidated its position among tenants requiring modern and efficient offices.
Another priority area for Fabege is Norrtull/Norra Station, where the company now owns five properties, including the landmark Wenner-Gren Center.
In Malmarna, the areas of central Stockholm surrounding the city centre, Fabege’s main priority areas are east and west Kungsholmen. Fabege owns the well known DN building and also has properties on Kungsholms torg and in Lindhagen, an area that is currently undergoing rapid development attracting major international companies.
East Kungsholmen, especially the area around Kungsbroplan and the east end of
14 fabege’s business
Office/Retail, 86%
Industrial/warehouse, 6%
Other, 5%
Residential, 3%
RENTAL VALUE BY PROPERTY, TOTALLY SEKm 2,369
RENTAL VALUE BY GEOGRAPHICAL REGION, TOTALLY SEKm 2,369
Stockholm Inner City, 1,217 SEKm (51%)
Outside Stockholm, 0 SEKm (0%)
Hammarby Sjöstad, 175 SEKm (7%)
Solna, 722 SEKm (31%)
Other North Stockholm,195 SEKm (8%)
Other South Stockholm, 60 SEKm (3%)
Stockholm Inner City, SEKm 16,937 (58%)
Solna, SEKm 8,244 (28%)
Hammarby Sjöstad, SEKm 1,890 (6%)
Other South Stockholm, SEKm 706 (2%)
Other North Stockholm, SEKm 1,711 (6%)
Outside Stockholm, SEKm 23 (<1%)
MARKET VALUE BY GEOGRAPHICAL REGION, TOTALLY SEKbn 29.5
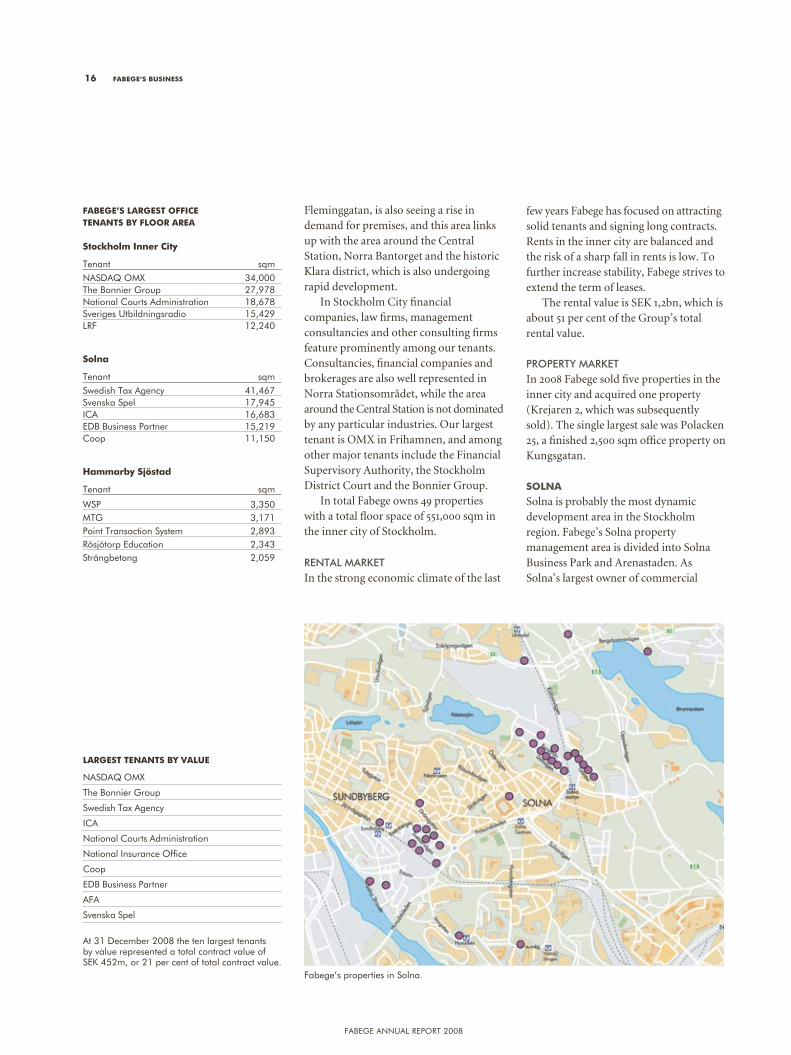
Fabege’s properties in the inner city of Stockholm.
breaKdOwn by lettable area, 31 deC 2008 office, ‘000 sqm retail, ‘000 sqm Industrial/wareh., ‘000 sqm Hotel, ‘000 sqm other, ‘000 sqm residential, ‘000 sqm garage, ‘000 sqm total, ‘000 sqm
Stockholm inner city 412,606 31,831 30,962 7,674 2,552 13,452 51,973 551,050 Solna 370,220 30,961 46,151 15,264 5,523 568 23,777 492,464 Hammarby Sjöstad 84,827 13,398 44,609 0 127 691 3,007 146,659 rest of South Stockholm 11,138 20,962 11,327 0 46 94 2,818 46,385 rest of north Stockholm 72,177 14,441 37,471 0 1,915 87,136 3,825 216,965 total 950,968 111,593 170,520 22,938 10,163 101,941 85,400 1,453,523
Fabege annual report 2008
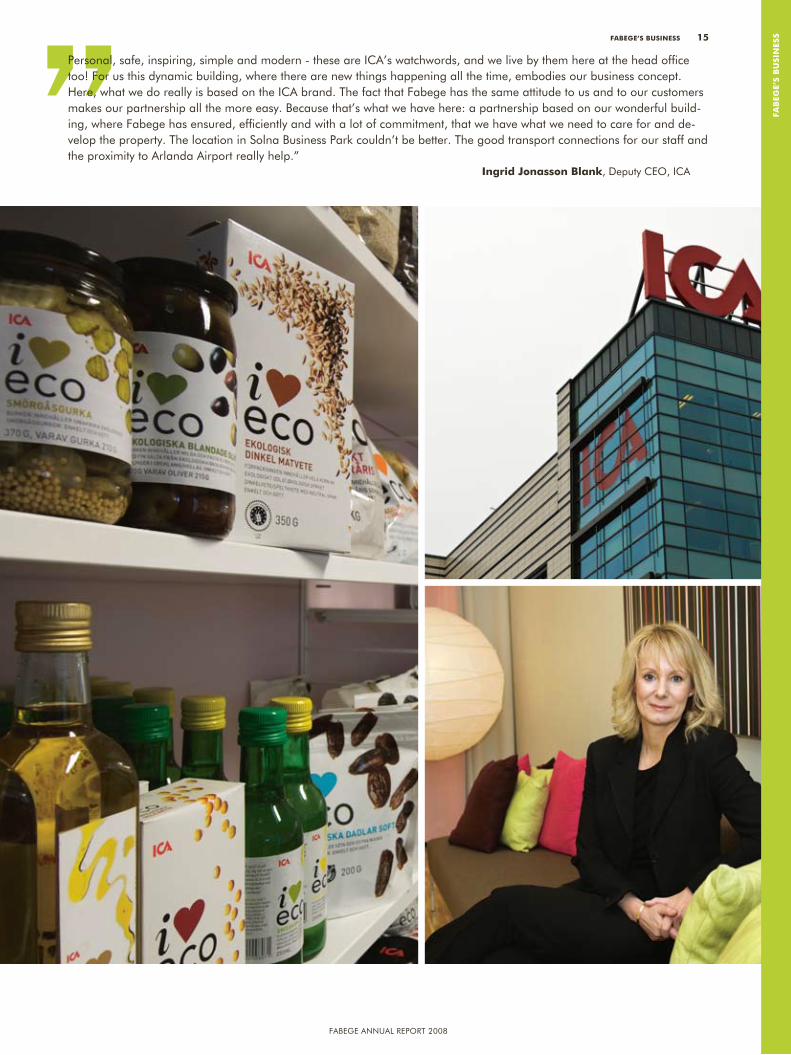
personal, safe, inspiring, simple and modern - these are ICa’s watchwords, and we live by them here at the head office too! For us this dynamic building, where there are new things happening all the time, embodies our business concept. Here, what we do really is based on the ICa brand. the fact that Fabege has the same attitude to us and to our customers makes our partnership all the more easy. because that’s what we have here: a partnership based on our wonderful build-ing, where Fabege has ensured, efficiently and with a lot of commitment, that we have what we need to care for and de-velop the property. the location in Solna business park couldn’t be better. the good transport connections for our staff and the proximity to arlanda airport really help.”
ingrid Jonasson blank, Deputy Ceo, ICa
fab
ege’
s b
usin
essfabege’s business 15
Fabege annual report 2008
Fleminggatan, is also seeing a rise in demand for premises, and this area links up with the area around the Central Station, Norra Bantorget and the historic Klara district, which is also undergoing rapid development.
In Stockholm City financial companies, law firms, management consultancies and other consulting firms feature prominently among our tenants. Consultancies, financial companies and brokerages are also well represented in Norra Stationsområdet, while the area around the Central Station is not dominated by any particular industries. Our largest tenant is OMX in Frihamnen, and among other major tenants include the Financial Supervisory Authority, the Stockholm District Court and the Bonnier Group.
In total Fabege owns 49 properties with a total floor space of 551,000 sqm in the inner city of Stockholm.
renTAl mArkeT In the strong economic climate of the last
few years Fabege has focused on attracting solid tenants and signing long contracts. Rents in the inner city are balanced and the risk of a sharp fall in rents is low. To further increase stability, Fabege strives to extend the term of leases.
The rental value is SEK 1,2bn, which is about 51 per cent of the Group’s total rental value.
ProPerTy mArkeTIn 2008 Fabege sold five properties in the inner city and acquired one property (Krejaren 2, which was subsequently sold). The single largest sale was Polacken 25, a finished 2,500 sqm office property on Kungsgatan.
sOlna
Solna is probably the most dynamic development area in the Stockholm region. Fabege’s Solna property management area is divided into Solna Business Park and Arenastaden. As Solna’s largest owner of commercial
16 fabege’s business
fabege’s largest OffiCe tenants by flOOr area
stockholm inner City
tenant sqmnaSDaQ oMX 34,000the bonnier group 27,978national Courts administration 18,678Sveriges utbildningsradio 15,429lrF 12,240
solna
tenant sqmSwedish tax agency 41,467Svenska Spel 17,945ICa 16,683eDb business partner 15,219Coop 11,150
hammarby sjöstad
tenant sqm
WSp 3,350Mtg 3,171point transaction System 2,893rösjötorp education 2,343Strängbetong 2,059
largest tenants by value
naSDaQ oMX
the bonnier group
Swedish tax agency
ICa
national Courts administration
national Insurance office
Coop
eDb business partner
aFa
Svenska Spel
at 31 December 2008 the ten largest tenants by value represented a total contract value of SeK 452m, or 21 per cent of total contract value.
Fabege’s properties in Solna.
Fabege annual report 2008
fab
ege’
s b
usin
ess
properties with a market share of about 40 per cent on offices, Fabege is in a unique position to take part in shaping entirely districts.
Solna Business Park is today a largely finished property district that forms an established business park with large and stable customers, especially in the food industry. The occupancy rate is 97 per cent, which ensures stable cash flows and creates good development opportunities for the future.
In Arenastaden a new part of town is emerging around Solna Station centred around the future Swedbank Arena. Here Fabege sees a big potential to create an attractive and living district with office, retail and residential properties in an attractive environment. Thanks to its good transport connections and proximity to airports, Arenastaden is in the same position as Solna Business Park a few years ago. The ambition is to create an area with head offices for companies which due to their size have chosen not to
establish themselves in central Stockholm. Even today, Arenastaden is home to businesses from a variety of sectors, with an emphasis on offices and light industry.
Fabege also has ten properties in other parts of Solna – Solna Strand, Huvudsta, Järva and Bergshamra.
In all, Fabege owns 34 properties with a total floor space of 493,000 sqm in Solna. The rental value is about SEK 700m, representing 31 per cent of the company’s total rental value.
renTAl mArkeT Rents remained stable during the year and are expected to remain balanced in 2009. Fabege’s tenants in Solna Business Park are stable customers with long leases. In Arenastaden, which is still being developed, rents are lower than in SBP and vacancies are higher.
ProPerTy mArkeTThe biggest change in the portfolio in 2008 was the sale of the 32,000 sqm
fabege’s business 17
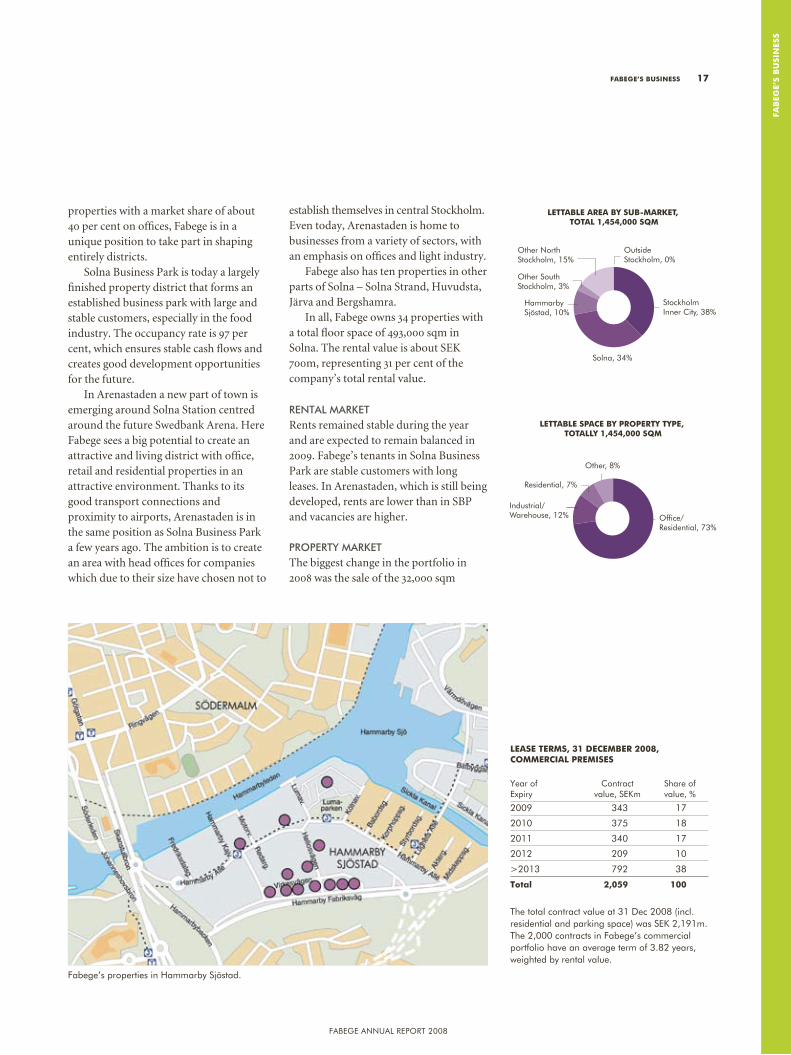
Stockholm Inner City, 38%
Other South Stockholm, 3%
Other North Stockholm, 15%
Outside Stockholm, 0%
LETTABLE AREA BY SUB-MARKET, TOTAL 1,454,000 SQM
Hammarby Sjöstad, 10%
Solna, 34%
Office/ Residential, 73%
Industrial/Warehouse, 12%
Residential, 7%
Other, 8%
LETTABLE SPACE BY PROPERTY TYPE, TOTALLY 1,454,000 SQM
lease terMs, 31 deCeMber 2008, COMMerCial preMises
Year of Contract Share of expiry value, SeKm value, %
2009 343 17
2010 375 18
2011 340 17
2012 209 10
>2013 792 38
total 2,059 100
the total contract value at 31 Dec 2008 (incl. residential and parking space) was SeK 2,191m. the 2,000 contracts in Fabege’s commercial portfolio have an average term of 3.82 years, weighted by rental value.
Fabege’s properties in Hammarby Sjöstad.
Fabege annual report 2008
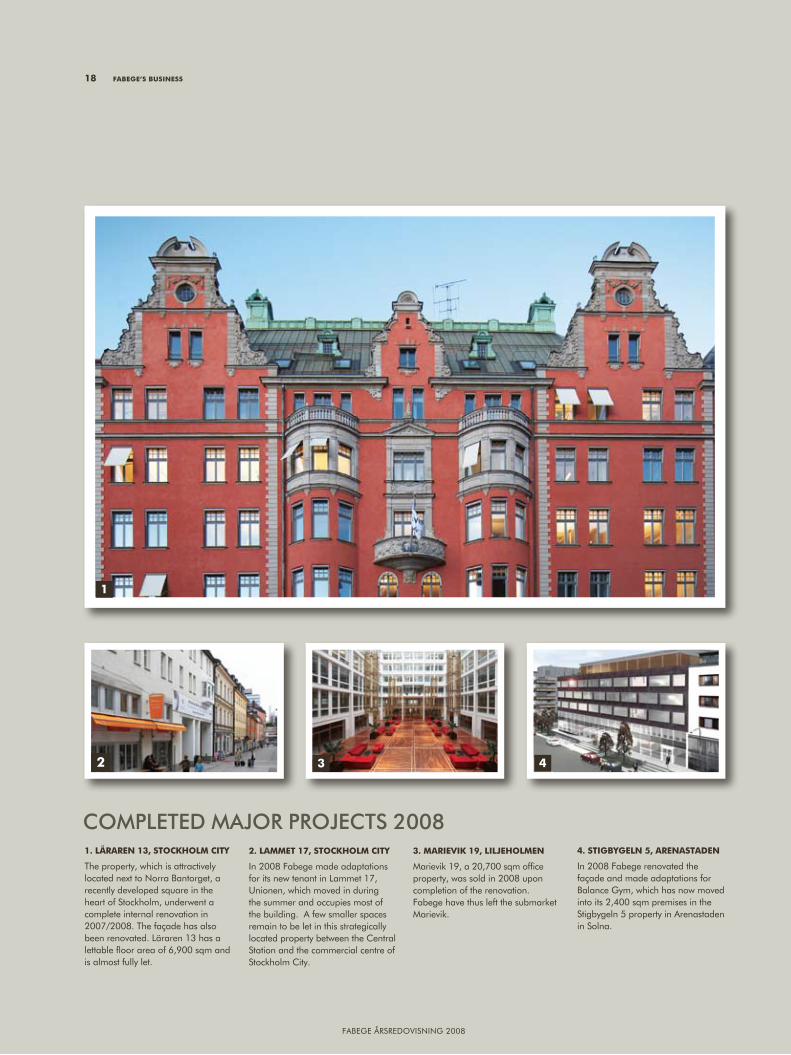
ComPleTed mAjor ProjeCTS 20081. läraren 13, stOCKhOlM City
the property, which is attractively located next to norra bantorget, a recently developed square in the heart of Stockholm, underwent a complete internal renovation in 2007/2008. the façade has also been renovated. läraren 13 has a lettable fl oor area of 6,900 sqm and is almost fully let.
2. laMMet 17, stOCKhOlM City
In 2008 Fabege made adaptations for its new tenant in lammet 17, unionen, which moved in during the summer and occupies most of the building. a few smaller spaces remain to be let in this strategically located property between the Central Station and the commercial centre of Stockholm City.
3. MarieviK 19, lilJehOlMen
Marievik 19, a 20,700 sqm offi ce property, was sold in 2008 upon completion of the renovation. Fabege have thus left the submarket Marievik.
4. stigbygeln 5, arenastaden
In 2008 Fabege renovated the façade and made adaptations for balance gym, which has now moved into its 2,400 sqm premises in the Stigbygeln 5 property in arenastaden in Solna.
1
2 3 4
Fabege ÅrSreDoVISnIng 2008
18 fabege’s business
Fabege annual report 2008
fab
ege’
s b
usin
ess
fabege’s business 19
IF-huset property (Axet 1 & Bladet 1) in Bergshamra to Vasakronan. During the year Fabege strengthened its presence in Arenastaden through the acquisition of the 5,600 sqm Uarda 2 property.
haMMarby sJöstad
In the space of only a few years Hammarby Sjöstad has evolved into a new part of town providing housing as well as commercial premises. Fabege is the biggest commercial player in the area and has 77 per cent of the office market. Good transport connections and the closeness to Stockholm’s inner city are attracting a growing number of service-sector companies to the area, which is currently home to about 380 businesses, a number that is expected to double once the area has been fully developed.
As the single largest manager of office properties in the area, Fabege is in a good position to influence the character of the area, where light industries are now giving place to service companies and housing. The location, good transport links and waterfront buildings give the area a special character that is attracting creative service-sector companies such as architect firms, advertising agencies and TV production companies.
renTAl mArkeTToday 58 per cent of Fabege’s premises in the area are offices, with warehouses and light industry accounting for the rest. The outlook for Hammarby Sjöstad is good as the expansion of local services and improved transport connections further increase the attraction of the area. In all, Fabege owns 13 properties with a total floor space of 147,000 sqm in Hammarby Sjöstad. The rental value is about SEK 175m, representing seven per cent of the company’s total rental value. The portfolio consists of a large number of small customers. Rents have increased in the last two to three years and are forecast to grow in the longer term. The vacancy rate in the area in 2008 was about 15 per cent.
ProPerTy mArkeTNo changes to Fabege’s portfolio in Hammarby Sjöstad were made during the year, either purchases or sales. Other prOperties
In the rest of the Stockholm area Fabege has 60 properties with a total lettable area of 263,000 sqm. Most of the commercial properties are located in Täby, Bromma and Järla Sjö (Nacka). In Tensta/Rinkeby Fabege owns a portfolio of residential properties.
In 2008 Fabege continued to sell properties that are located outside the company’s priority markets. The largest sales were two properties comprising a total floor space of 37,600 sqm in Marievik, as a result of which the company left the Marievik sub-market.
prOJeCts and develOpMent
Qualified improvement activities that add value to Fabege’s properties are a cornerstone of the company’s business. Fabege has long experience of running extensive improvement projects and strives to attract long-term tenants to properties that have not yet been fully developed and can be redesigned based on the customer’s requirements. Responsibility for new builds and redevelopment projects, procurement and follow-up as well as marketing and lettings of new projects rests with the Projects & Development unit.
To maximise its ability to influence developments, Fabege has concentrated its property holdings to areas that are deemed to have a strong development potential. As the dominant player in a specific area, Fabege can take an active role in redeveloping the area, working in close partnership with the local authority from the planning stage onwards.
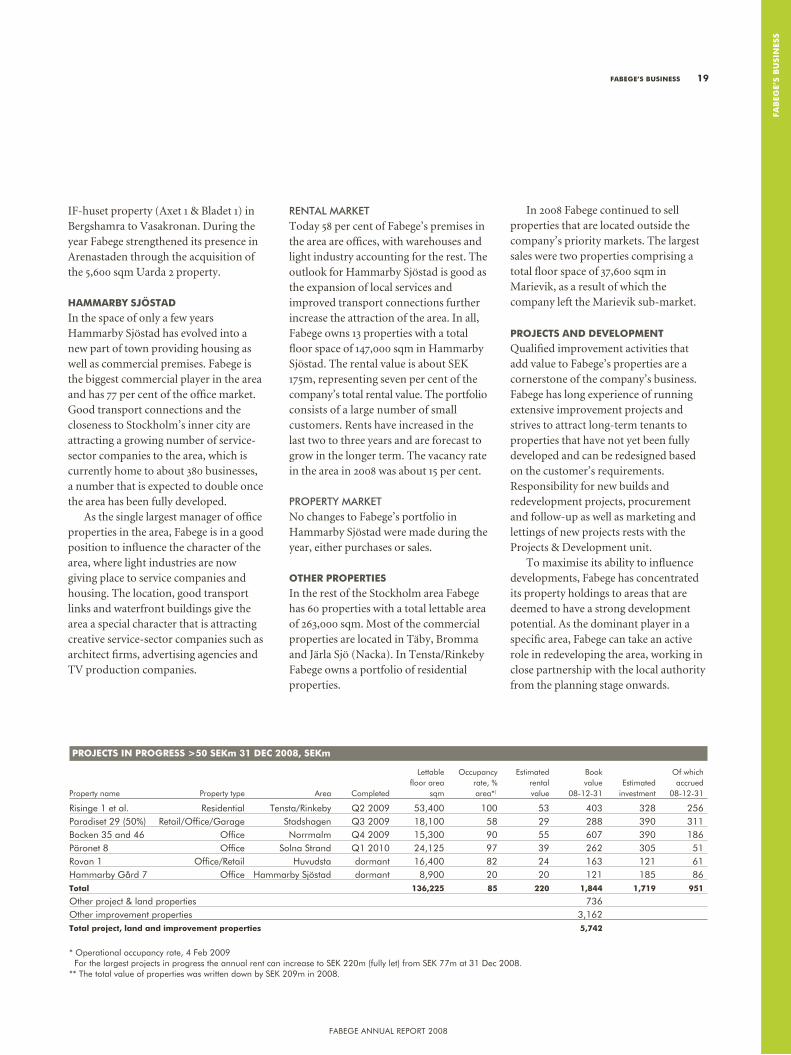
prOJeCts in prOgress >50 seKm 31 deC 2008, seKm
lettable occupancy estimated book of which floor area rate, % rental value estimated accrued property name property type area Completed sqm area*) value 08-12-31 investment 08-12-31
risinge 1 et al. residential tensta/rinkeby Q2 2009 53,400 100 53 403 328 256 paradiset 29 (50%) retail/office/garage Stadshagen Q3 2009 18,100 58 29 288 390 311 bocken 35 and 46 office norrmalm Q4 2009 15,300 90 55 607 390 186 päronet 8 office Solna Strand Q1 2010 24,125 97 39 262 305 51 rovan 1 office/retail Huvudsta dormant 16,400 82 24 163 121 61Hammarby gård 7 office Hammarby Sjöstad dormant 8,900 20 20 121 185 86 total 136,225 85 220 1,844 1,719 951
other project & land properties 736 other improvement properties 3,162 total project, land and improvement properties 5,742
* operational occupancy rate, 4 Feb 2009 For the largest projects in progress the annual rent can increase to SeK 220m (fully let) from SeK 77m at 31 Dec 2008. ** the total value of properties was written down by SeK 209m in 2008.
Fabege annual report 2008
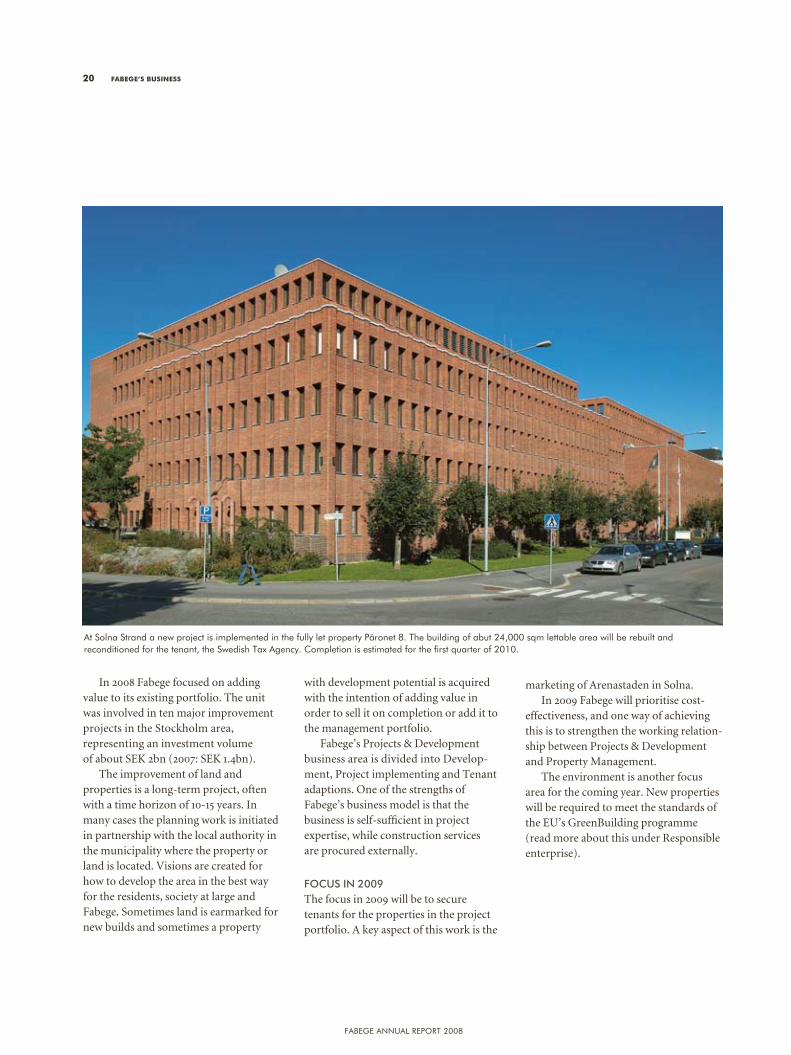
In 2008 Fabege focused on adding value to its existing portfolio. The unit was involved in ten major improvement projects in the Stockholm area, representing an investment volume of about SEK 2bn (2007: SEK 1.4bn).
The improvement of land and properties is a long-term project, often with a time horizon of 10-15 years. In many cases the planning work is initiated in partnership with the local authority in the municipality where the property or land is located. Visions are created for how to develop the area in the best way for the residents, society at large and Fabege. Sometimes land is earmarked for new builds and sometimes a property
with development potential is acquired with the intention of adding value in order to sell it on completion or add it to the management portfolio.
Fabege’s Projects & Development business area is divided into Develop-ment, Project implementing and Tenant adaptions. One of the strengths of Fabege’s business model is that the business is self-sufficient in project expertise, while construction services are procured externally.
FoCuS in 2009The focus in 2009 will be to secure tenants for the properties in the project portfolio. A key aspect of this work is the
marketing of Arenastaden in Solna.In 2009 Fabege will prioritise cost-
effectiveness, and one way of achieving this is to strengthen the working relation-ship between Projects & Development and Property Management.
The environment is another focus area for the coming year. New properties will be required to meet the standards of the EU’s GreenBuilding programme (read more about this under Responsible enterprise).
20 fabege’s business
at Solna Strand a new project is implemented in the fully let property päronet 8. the building of abut 24,000 sqm lettable area will be rebuilt and reconditioned for the tenant, the Swedish tax agency. Completion is estimated for the first quarter of 2010.
Fabege annual report 2008
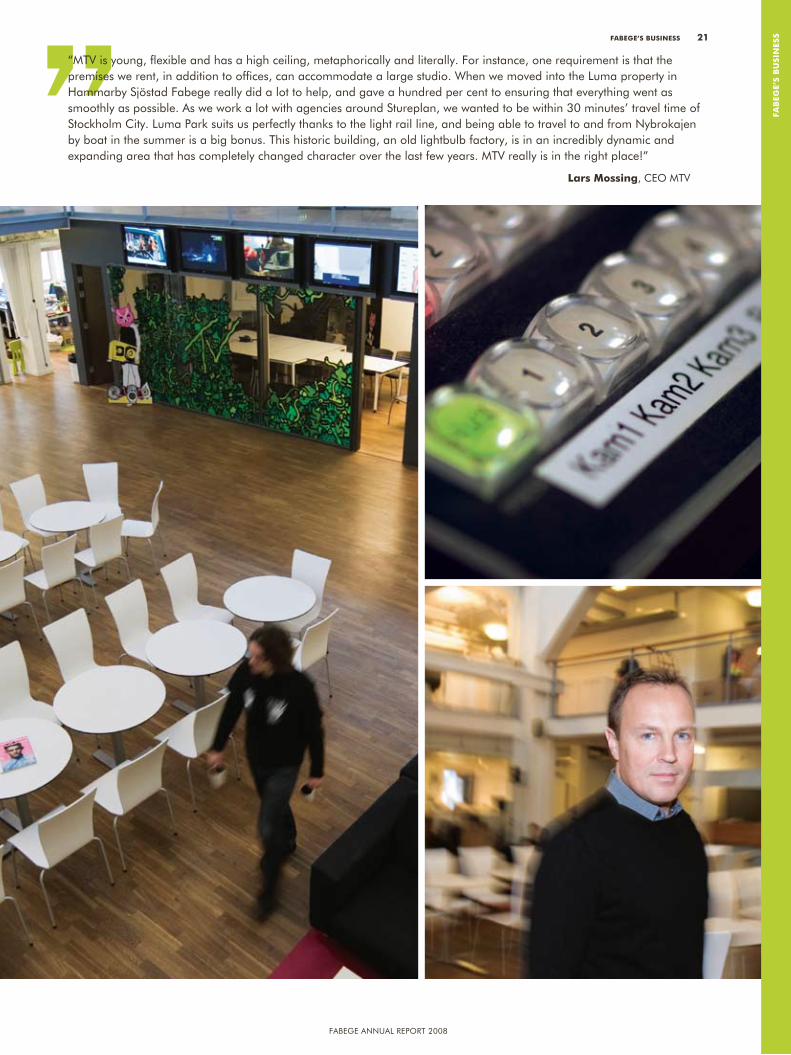
“MtV is young, flexible and has a high ceiling, metaphorically and literally. For instance, one requirement is that the premises we rent, in addition to offices, can accommodate a large studio. When we moved into the luma property in Hammarby Sjöstad Fabege really did a lot to help, and gave a hundred per cent to ensuring that everything went as smoothly as possible. as we work a lot with agencies around Stureplan, we wanted to be within 30 minutes’ travel time of Stockholm City. luma park suits us perfectly thanks to the light rail line, and being able to travel to and from nybrokajen by boat in the summer is a big bonus. this historic building, an old lightbulb factory, is in an incredibly dynamic and expanding area that has completely changed character over the last few years. MtV really is in the right place!”
lars Mossing, Ceo MtV
fab
ege’
s b
usin
essfabege’s business 21
Fabege annual report 2008
Offering our customers premises with strong environmental and energy efficiency credentials improves our competitiveness and good relationships with our main stakeholders improves our overall ability to run a successful business. In a longer-term perspective Fabege’s conscientious approach to doing business thus helps to build shareholder value.
Social and environmental responsibility are a natural part of Fabege’s business. This covers issues such as our impact on the climate, ethics in business relations, equal opportunities and social commit-ment. Fabege has therefore adopted a set of ethical guidelines for its activities which, together with our clearly defined values and policies, govern Fabege’s efforts to ensure that it conducts its business in a socially responsible manner. The United Nations Global Compact Code of Conduction and other standard-setting initiatives serve as a guide for corporate responsibility at Fabege.
Fabege’s company culture should be marked by openness, truthfulness, honesty and responsible behaviour.
Responsibility includes being an
attractive employer, working to improve the environment and supporting social initiatives at a local level.
respOnsibility fOr eMplOyees
Fabege has 148 employees, whose expertise and commitment are crucial to the company’s future development. A key factor in ensuring that Fabege achieves its goals is to develop the company’s human resources and build a strong commitment among employees. As part of its ambition to be an attractive employer, a key goal for Fabege in 2008 was to give concrete expression to the company’s core values thoughout the company.
imPlemenTing FAbege’S Core vAlueSFabege’s vision is to “be the most proactive, innovative and competent commercial property company in Stockholm, and an important partner for our clients and for society as whole. The natural first choice.” This requires a high degree of commit-ment from our employees.
Shared values and a strong company culture are hallmarks of successful businesses.
In 2008 Fabege assembled all employees on five occasions for the purpose of strengthening our shared commitment to Fabege’s core values: Speed, Informality, Entrepreneurship, Business Orientation and Client Proximity. Fabege will continue this work in 2009.
An ATTrACTive emPloyerStaff mobility in the property industry is relatively high. To be able to recruit and retain skilled staff, a company must be an attractive employer. During the year Fabege initiated several interdepartmental projects aimed at creating a sense of togetherness among staff.
Work-liFe bAlAnCe And equAl oPPorTuniTieSAn important part of our ambition to be an attractive employer is the ability to offer a good balance between work and free time. Our health and fitness initiative will continue. 2009 will also see the launch of a major new partnership with a newly opened fitness facility that is aimed at improving the health of employees through fitness activities and a healthy diet.
22 respOnsible enterprise
respOnsible enterprise
fabege’s vision includes being an important partner for our customers and for society at large. this requires responsible enterprise. to achieve long-term profitability, fabege must take social and environmental responsibility as well as economic responsibility.
AVERAGE NO. OF EMPLOYEES2004–2008
0
50
100
150
200
20082007200620052004
Number
AVERAGE PERIOD OF EMPLOYMENT 2004–2008
0
1
2
3
4
5
6
7
8
20082007200620052004
Year
STAFF TURNOVER2004–2008
0
5
10
15
20
25
30
35
20082007200620052004
%
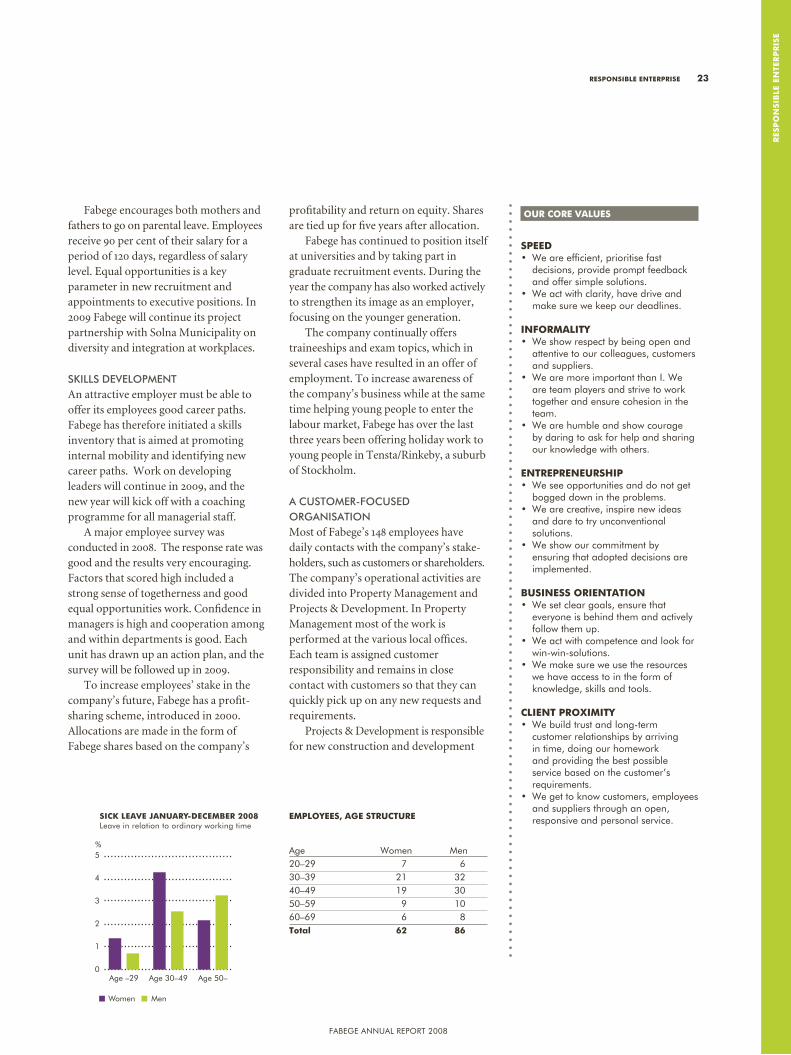
Fabege annual report 2008
res
pO
nsib
le e
nte
rp
ris
e
Fabege encourages both mothers and fathers to go on parental leave. Employees receive 90 per cent of their salary for a period of 120 days, regardless of salary level. Equal opportunities is a key parameter in new recruitment and appointments to executive positions. In 2009 Fabege will continue its project partnership with Solna Municipality on diversity and integration at workplaces.
SkillS develoPmenT An attractive employer must be able to offer its employees good career paths. Fabege has therefore initiated a skills inventory that is aimed at promoting internal mobility and identifying new career paths. Work on developing leaders will continue in 2009, and the new year will kick off with a coaching programme for all managerial staff.
A major employee survey was conducted in 2008. The response rate was good and the results very encouraging. Factors that scored high included a strong sense of togetherness and good equal opportunities work. Confidence in managers is high and cooperation among and within departments is good. Each unit has drawn up an action plan, and the survey will be followed up in 2009.
To increase employees’ stake in the company’s future, Fabege has a profit-sharing scheme, introduced in 2000. Allocations are made in the form of Fabege shares based on the company’s
profitability and return on equity. Shares are tied up for five years after allocation.
Fabege has continued to position itself at universities and by taking part in graduate recruitment events. During the year the company has also worked actively to strengthen its image as an employer, focusing on the younger generation.
The company continually offers traineeships and exam topics, which in several cases have resulted in an offer of employment. To increase awareness of the company’s business while at the same time helping young people to enter the labour market, Fabege has over the last three years been offering holiday work to young people in Tensta/Rinkeby, a suburb of Stockholm.
A CuSTomer-FoCuSed orgAniSATionMost of Fabege’s 148 employees have daily contacts with the company’s stake-holders, such as customers or shareholders. The company’s operational activities are divided into Property Management and Projects & Development. In Property Management most of the work is performed at the various local offices. Each team is assigned customer responsibility and remains in close contact with customers so that they can quickly pick up on any new requests and requirements.
Projects & Development is responsible for new construction and development
eMplOyees, age struCture
age Women Men20–29 7 630–39 21 3240–49 19 3050–59 9 1060–69 6 8total 62 86
Women Men
SICK LEAVE JANUARY-DECEMBER 2008Leave in relation to ordinary working time
0
1
2
3
4
5
Age 50–Age 30–49Age –29
%
Our COre values
speed• Weareefficient,prioritisefast
decisions, provide prompt feedback and offer simple solutions.
• Weactwithclarity,havedriveand make sure we keep our deadlines.
infOrMality• Weshowrespectbybeingopenand
attentive to our colleagues, customers and suppliers.
• WearemoreimportantthanI.Weare team players and strive to work together and ensure cohesion in the team.
• Wearehumbleandshowcourageby daring to ask for help and sharing our knowledge with others.
entrepreneurship• Weseeopportunitiesanddonotget
bogged down in the problems.• Wearecreative,inspirenewideas
and dare to try unconventional solutions.
• Weshowourcommitmentby ensuring that adopted decisions are implemented.
business OrientatiOn• Wesetcleargoals,ensurethat
everyone is behind them and actively follow them up.
• Weactwithcompetenceandlookfor win-win-solutions.
• Wemakesureweusetheresources we have access to in the form of knowledge, skills and tools.
Client prOxiMity• Webuildtrustandlong-term
customer relationships by arriving in time, doing our homework and providing the best possible service based on the customer’s requirements.
• Wegettoknowcustomers,employeesand suppliers through an open, responsive and personal service.
respOnsible enterprise 23
Fabege annual report 2008
projects, environmental issues, purchasing and operational optimisation, and for coordinating activities with Property Management. The unit brings together all of Fabege’s talent in development and financial control of projects. In addition to the operational units, Fabege has five support functions: Business Development, Accounting & Finance, Marketing, Corporate Communications & IR and Human Resources.
A SAFe Work environmenTAll employees have the right to work in an environment that is safe, both physically and mentally. Fabege has worked continuously on work environment issues for several years.
In 2008 the company increased awareness of fire and safety issues through customised training programmes in risk management, risk analysis, protection planning and fire protection. The courses will continue in 2009, with a particular focus on fire protection.
Work environment policy Fabege seeks to ensure a safe work environment in order to:• Strengthen employees’ commitment
and collaboration • Promote personal and professional
development • Prevent and eliminate risks to property
and health • Ensure that business trips using company
cars can be made in a safe manner.
envirOnMental respOnsibility
The purpose of Fabege’s environmental responsibility is to reduce and prevent any negative impact on the environment, and thus promote a sustainable develop-ment. Since 2002 Fabege has worked systematically to optimise energy use in its properties. In every year since then the company has succeeded in cutting energy use by at least five per cent.
In 2008 we reduced heat consumption by ten per cent and resource consumption
by an average of eight per cent, partly through successful optimisation of operations and activities identified in energy assessments, and partly through investments in energy-efficient technology.
Three major environmental initiatives were conducted during the year: energy assessments of all properties, the introduction of green electricity in all properties and the launch of the GreenBuilding certification concept.
energy ASSeSSmenTSIn 2007 the Swedish National Board of Housing, Building and Planning introduced a new regulation requiring property owners to conduct energy assessments of their properties. In practical terms, this involves reviewing each property’s energy use and issuing certificates showing how much energy is used in the property. In 2008, work has been carried out by external experts, which also had the task of creating a more comprehensive basis for action than the law requires, for reducing energy consumption.
The results can then be compared with those of similar properties to identify ways in which energy costs can be reduced. The assessments have proved to be a valuable tool for defining concrete measures to further cut energy costs.
green eleCTriCiTyAnother aspect of environmental
responsibility concerns the use of electricity that has been produced in an environmentally friendly manner. Starting in 2008, Fabege has chosen to use only “green” electricity, i.e. electricity produced from renewable energy sources. In 2008 the company concluded an agreement with Vattenfall under which Vattenfall will deliver only certified renewable hydro-generated electricity from their Nordic power plants. The certification is made in compliance with the international Environmental Product Declaration (EPD) system. During the year Fabege converted its last oil-fired boilers to district heating.
As a result of the recent work on systematic energy optimization, conversion from oil to district heating, switch to green electricity, improved environ-mental performance of district heating and cooling and to some extent changes in property stock, development has been very positive and carbon dioxide emissions have decreased from 39,447 tonnes in 2002 to 5,989 tonnes in 2008.
greenbuilding CerTiFiCATion oF ProPerTy PorTFolio in 2009Customers and other stakeholders are demanding an ever higher standard of energy efficiency in new buildings. Fabege has therefore set a goal of obtaining GreenBuilding certification for its property portfolio in 2009. To qualify, 30 per cent of the portfolio must meet the Green-Building requirements.
At year-end 2008 Fabege had obtained GreenBuilding certification for one property: the Lindhagen project in Paradiset 29 on Kungsholmen.
In 2008 Fabege decided to sign up to the Climate Pact, a partnership between the City of Stockholm and local business that provides a platform for collaboration on climate-related issues. The partnership agreement, which is designed to reduce greenhouse gas emissions, will be signed in early 2009. A similar partnership exists with the Municipality of Solna.
24 respOnsible enterprise
high-rAnking by The CArbon diSCloSure ProjeCT
In 2008 Fabege received top placement in the highly prestigious rankings conducted by the Carbon Disclosure project for the second year in a row. behind the study lies 475 of the world’s largest institutional investors.
after years of environmental initiatives Fabege was appointed in 2008 to one of the 100 most sustainable companies in the world by the british research firm Innovest.
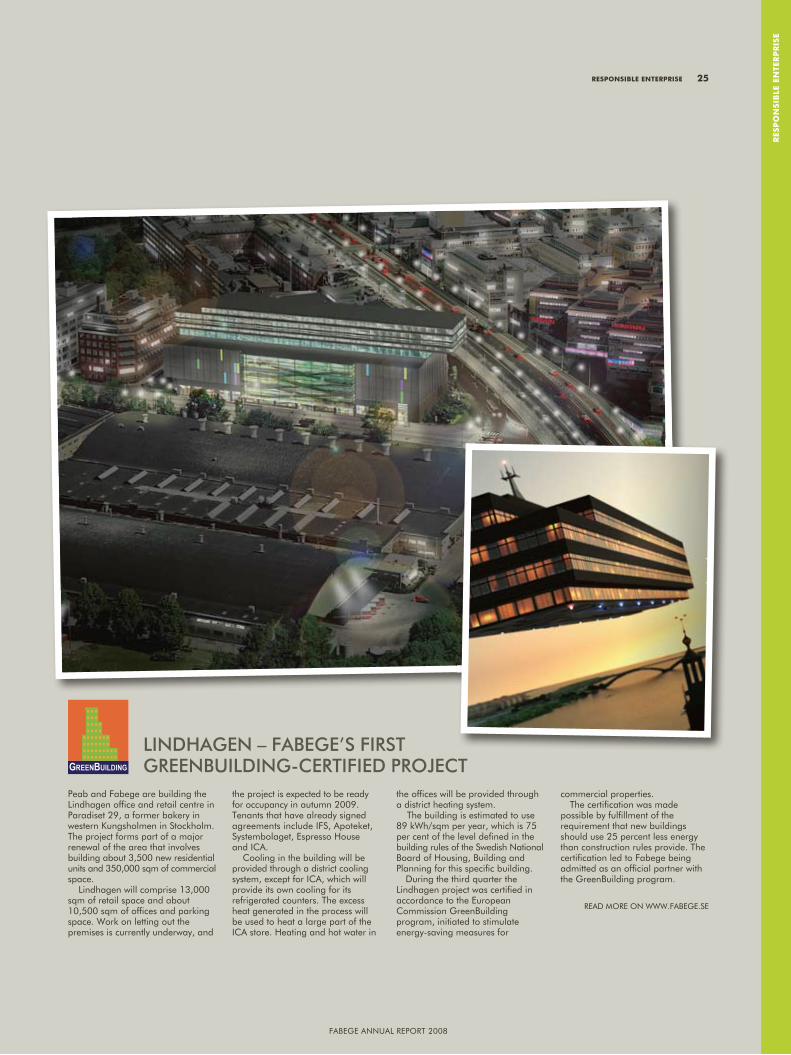
Fabege annual report 2008
res
pO
nsib
le e
nte
rp
ris
e
peab and Fabege are building the lindhagen offi ce and retail centre in paradiset 29, a former bakery in western Kungsholmen in Stockholm. the project forms part of a major renewal of the area that involves building about 3,500 new residential units and 350,000 sqm of commercial space.
lindhagen will comprise 13,000 sqm of retail space and about 10,500 sqm of offi ces and parking space. Work on letting out the premises is currently underway, and
the project is expected to be ready for occupancy in autumn 2009. tenants that have already signed agreements include IFS, apoteket, Systembolaget, espresso House and ICa.
Cooling in the building will be provided through a district cooling system, except for ICa, which will provide its own cooling for its refrigerated counters. the excess heat generated in the process will be used to heat a large part of the ICa store. Heating and hot water in
the offi ces will be provided through a district heating system.
the building is estimated to use 89 kWh/sqm per year, which is 75 per cent of the level defi ned in the building rules of the Swedish national board of Housing, building and planning for this specifi c building. During the third quarter the lindhagen project was certifi ed in accordance to the european Commission greenbuilding program, initiated to stimulate energy-saving measures for
commercial properties. the certifi cation was made possible by fulfi llment of the requirement that new buildings should use 25 percent less energy than construction rules provide. the certifi cation led to Fabege being admitted as an offi cial partner with the greenbuilding program.
reaD More on WWW.Fabege.Se
lindhAgen – FAbege’S FirST greenbuilding-CerTiFied ProjeCT
Fabege annual report 2008
respOnsible enterprise 25

Fabege annual report 2008
hAzArdouS SubSTAnCeSUnder a 2007 regulation on polychlorinated biphenyls (PCBs), owners of industrial or apartment buildings built between 1956-1973 are required to conduct PCB assessments for these buildings. Fabege is taking the measures required under the regulation and is also conducting surveys assess the presence of radon in residential and school buildings, in compliance with regulatory requirements.
ConTinuouS imProvemenT oF WASTe mAnAgemenTWhen making an acquisition or adapting premises for tenants, Fabege explores which areas can be used for sorting of waste for recycling, both centrally and in the premises of each tenant. We also look at where the areas are located within the property in relation to goods flows, transports, floor plans, etc. At year-end 2008 an average of nine different types of waste were being sorted and recycled at Fabege’s properties.
environmenTAl ProgrAmmeS For building SiTeS And SuPPlierSIn projects and development activities Fabege’s general environmental programme has now been integrated into the Framework Programme as regards the choice of materials, waste management and building methods. The aim is to give concrete expression to Fabege’s environ-mental policy through environmental control of the building process. When a building is converted or renovated a demolition plan is drawn up. In new builds and redevelopment projects only building materials and products with limited environmental impact may be
used. In all projects a plan for handling of waste products is prepared together with the building contractor and waste management contractor.
FAbege’S requiremenTS on SuPPlierSPurchasing activities and suppliers’ and contractors’ environmental performance constitute a cornerstone of Fabege’s environmental work. Fabege strives to conclude sound deals in all respects. Our purchases and supplier agreements should secure strong commercial terms and prices, good quality and high delivery reliability and should be inspired by concern for human beings and the environment. The general principle is that suppliers should comply with applicable employment laws and other applicable laws, rules and regulations. Suppliers must also permit Fabege to verify such compliance. Fabege supports the United Nations Convention on the Rights of the Child, Article 32:1.
To clarify the company’s views to suppliers/contractors, the company’s own staff and other stakeholders, Fabege has defined a number of requirements in its procurement policy, which is available on the company’s website, www.fabege.se
ACquiSiTionS And SAleSEnergy consumption and improvement potential are becoming increasingly important factors in acquisitions and sales of properties. As part of the acquisition process, Fabege or an environmental specialist analyses the property’s energy consumption and environmental risks to assess their value.
26 respOnsible enterprise
Hydropower, 100%
ENERGY SOURCES IN ELECTRICITY PRODUCTION
Renewable, 88%
Non-renewable, 12%
ENERGY TYPES FOR DISTRICT HEATING, TOTAL
tOtal COnsuMptiOn data
water use, m3 893,037
energy use, mwh 203,509
of which
Heating 106,113
Cooling 21,111
Electricity 76,285
renewable energy, mwh 183,047
Co2 emissions, tonnes
(heating, electricity, cooling) 5,300
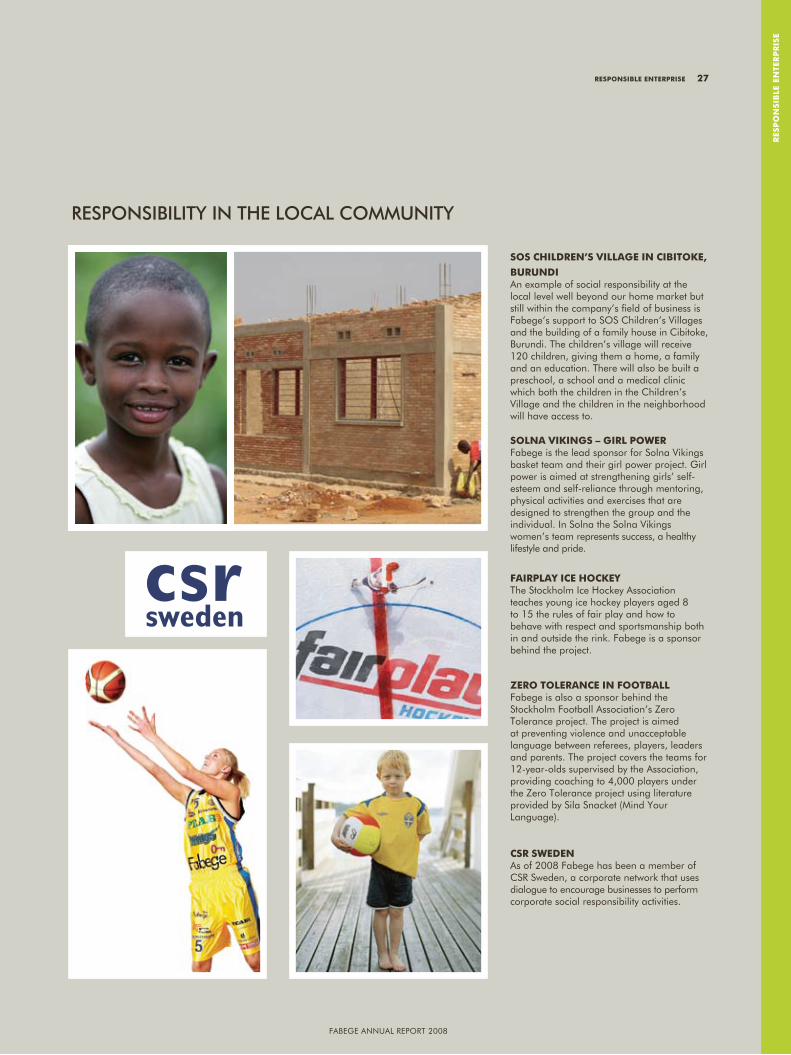
Fabege annual report 2008
res
pO
nsib
le e
nte
rp
ris
e
sOs Children’s village in CibitOKe,
burundian example of social responsibility at the local level well beyond our home market but still within the company’s field of business is Fabege’s support to SoS Children’s Villages and the building of a family house in Cibitoke, burundi. the children’s village will receive 120 children, giving them a home, a family and an education. there will also be built a preschool, a school and a medical clinic which both the children in the Children’s Village and the children in the neighborhood will have access to.
sOlna viKings – girl pOwerFabege is the lead sponsor for Solna Vikings basket team and their girl power project. girl power is aimed at strengthening girls’ self-esteem and self-reliance through mentoring, physical activities and exercises that are designed to strengthen the group and the individual. In Solna the Solna Vikings women’s team represents success, a healthy lifestyle and pride.
fairplay iCe hOCKeythe Stockholm Ice Hockey association teaches young ice hockey players aged 8 to 15 the rules of fair play and how to behave with respect and sportsmanship both in and outside the rink. Fabege is a sponsor behind the project.
ZerO tOleranCe in fOOtballFabege is also a sponsor behind the Stockholm Football association’s Zero tolerance project. the project is aimed at preventing violence and unacceptable language between referees, players, leaders and parents. the project covers the teams for 12-year-olds supervised by the association, providing coaching to 4,000 players under the Zero tolerance project using literature provided by Sila Snacket (Mind Your language).
Csr sweden as of 2008 Fabege has been a member of CSr Sweden, a corporate network that uses dialogue to encourage businesses to perform corporate social responsibility activities.
reSPonSibiliTy in The loCAl CommuniTy
Fabege annual report 2008
respOnsible enterprise 27
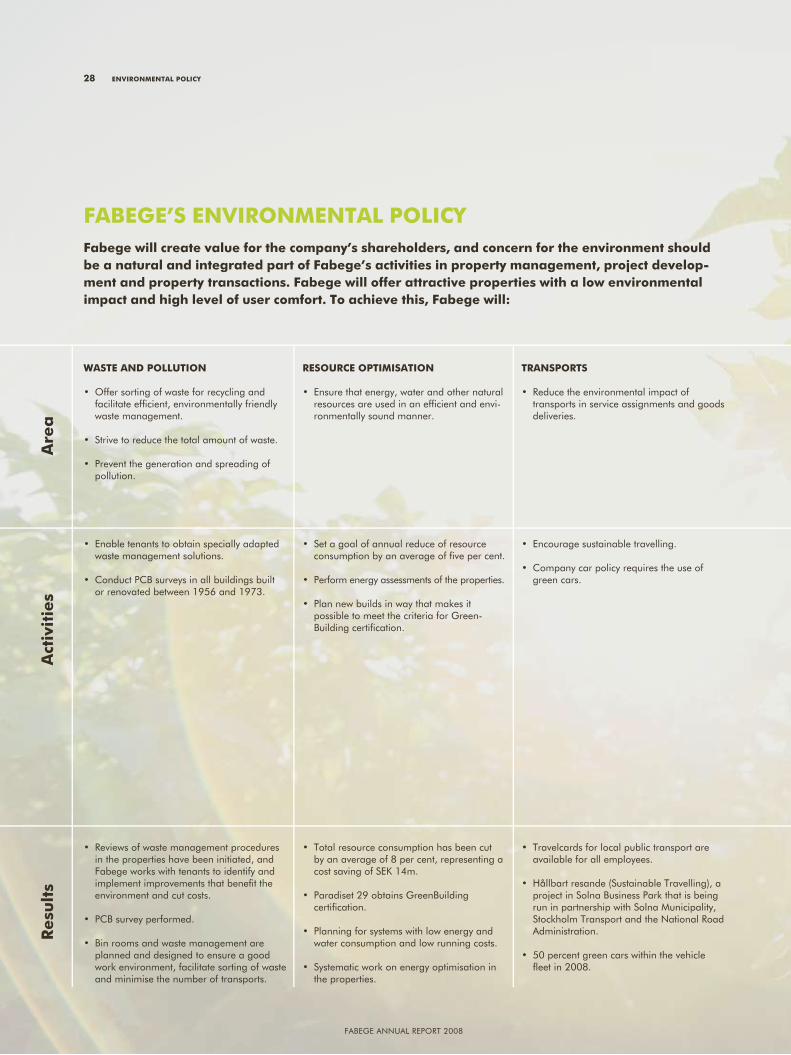
Fabege annual report 2008
28 envirOnMental pOliCy
waste and pOllutiOn
• Offersortingofwasteforrecyclingandfacilitate effi cient, environmentally friendly waste management.
• Strivetoreducethetotalamountofwaste. • Preventthegenerationandspreadingof
pollution.
resOurCe OptiMisatiOn
• Ensurethatenergy,waterandothernaturalresources are used in an effi cient and envi-ronmentally sound manner.
transpOrts
• Reducetheenvironmentalimpactof transports in service assignments and goods deliveries.
• Enabletenantstoobtainspeciallyadaptedwaste management solutions.
• ConductPCBsurveysinallbuildingsbuiltor renovated between 1956 and 1973.
• Setagoalofannualreduceofresource consumption by an average of fi ve per cent.
• Performenergyassessmentsoftheproperties.
• Plannewbuildsinwaythatmakesit possible to meet the criteria for green-building certifi cation.
• Encouragesustainabletravelling.
• Companycarpolicyrequirestheuseofgreen cars.
• Reviewsofwastemanagementproceduresin the properties have been initiated, and Fabege works with tenants to identify and implement improvements that benefi t the environment and cut costs.
• PCBsurveyperformed.
• Binroomsandwastemanagementareplanned and designed to ensure a good work environment, facilitate sorting of waste and minimise the number of transports.
• Totalresourceconsumptionhasbeencutby an average of 8 per cent, representing a cost saving of SeK 14m.
• Paradiset29obtainsGreenBuilding certifi cation.
• Planningforsystemswithlowenergyandwater consumption and low running costs.
• Systematicworkonenergyoptimisationinthe properties.
• Travelcardsforlocalpublictransportareavailable for all employees.
• Hållbartresande(SustainableTravelling),aproject in Solna business park that is being run in partnership with Solna Municipality, Stockholm transport and the national road administration.
• 50percentgreencarswithinthevehiclefl eet in 2008.
fabege’s envirOnMental pOliCyfabege will create value for the company’s shareholders, and concern for the environment should be a natural and integrated part of fabege’s activities in property management, project develop-ment and property transactions. fabege will offer attractive properties with a low environmental impact and high level of user comfort. to achieve this, fabege will:
are
aa
ctiv
itie
sr
esu
lts
Fabege annual report 2008
Fabege annual report 2008
envirOnMental pOliCy 29
envirOnMental requireMents fOr building Materials and MethOds
• Choosebuildingmethodsandmaterialswith green credentials and in compliance with Fabege’s framework programme.
• Replacehazardouschemicalswithlesshaz-ardous alternatives where possible.
• Setclearenvironmentalrequirementsforthe purchase of goods and services
internal envirOnMental awareness
• Raisethelevelofenvironmentalexpertiseamong employees through training and communicate environmental issues inter-nally and externally.
• Regularlydocument,followup,evaluateand improve our environmental work.
envirOnMental laws
• Complywithorexceedapplicableenvironmental legislation and other require-ments affecting the business.
• Assessbuildingproductsfromalifecycleperspective.
• Compilebuildingproductdeclarations
• Allmaterialsarecheckedagainstthe Swedish Chemical Inspectorate’s prIo list.
• SubstancesthatdonotcomplywithBASTA*should not be used in materials or products
• Demandthatsuppliersandcontractorshave a set of systematic quality and environmental procedures covering the whole chain of suppliers
• Askquestionswhenprocuringcleaningand other services. In new builds we use assessment databases such as byggvaru-bedömningen (building product assessment)
• Fabegeworkscontinuouslytoincreaseknowledge about the company’s environ-mental impact.
• Threefull-timeemployeesworkon environmental and energy issues. the work is documented in Fabege’s nyckel-knippan database
• Environmentallegislationcanbeaccessedby all employees on Fabege’s Intranet.
• Fabege’sself-assessmentprogrammeiscalled nyckelknippan (bunch of Keys). It is a database containing environmental status reports and legally required monitoring and inspection reports for all properties.
• Self-assessmentactivitiesarefollowedupcontinuously by Fabege’s environmental coordinators.
• Thegatheringandcompilationofprod-uct declarations facilitate traceability and minimise the use of hazardous materials, improving the health and wellbeing of cus-tomers, employees and suppliers
• Awarenessencouragesamoreenviron-mentally minded approach throughout the organisation.
• Fabege’senvironmentalinitiativesarepresented to the management team on a regular basis throughout the year.
• Implementedprocedurestocontinuouslywork with regulatory requirements and other requirements affecting the business.
Fabege annual report 2008
env
irO
nM
enta
l p
Oli
Cy
* baSta = the construction industry’s settlement of particularly dangerous substances. the products are judged on the chemical content. the products that pass the criteria is contained in a database.
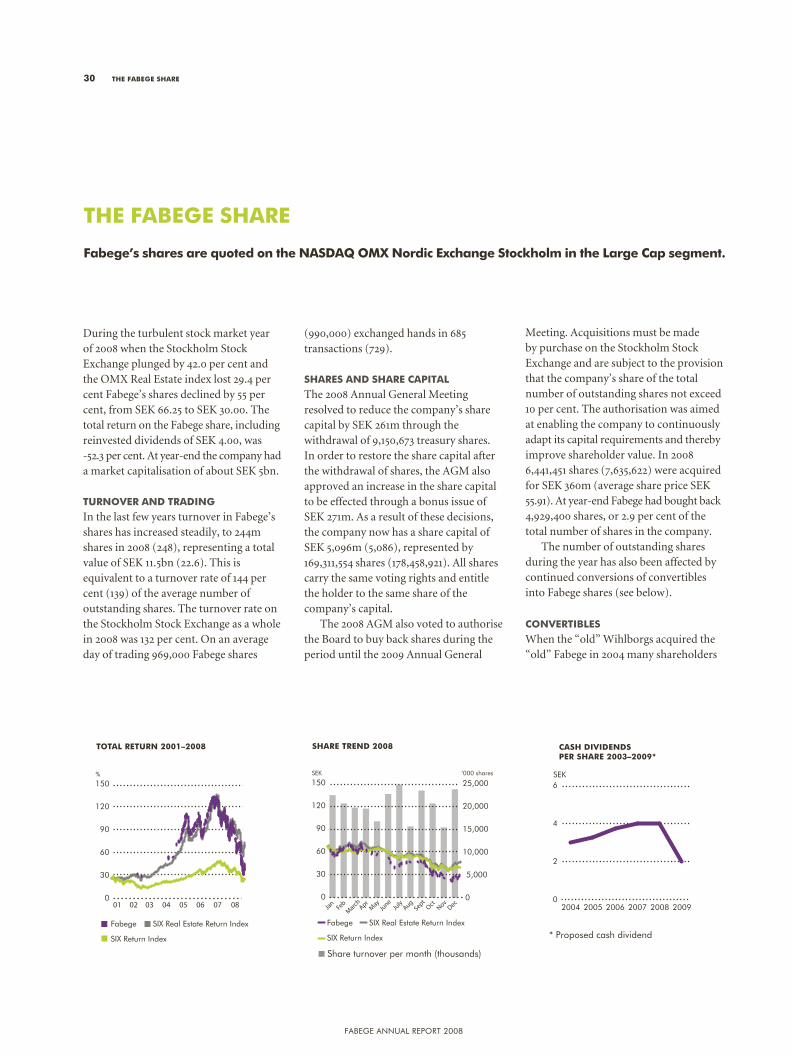
Fabege annual report 2008
During the turbulent stock market year of 2008 when the Stockholm Stock Exchange plunged by 42.0 per cent and the OMX Real Estate index lost 29.4 per cent Fabege’s shares declined by 55 per cent, from SEK 66.25 to SEK 30.00. The total return on the Fabege share, including reinvested dividends of SEK 4.00, was -52.3 per cent. At year-end the company had a market capitalisation of about SEK 5bn.
turnOver and trading
In the last few years turnover in Fabege’s shares has increased steadily, to 244m shares in 2008 (248), representing a total value of SEK 11.5bn (22.6). This is equivalent to a turnover rate of 144 per cent (139) of the average number of outstanding shares. The turnover rate on the Stockholm Stock Exchange as a whole in 2008 was 132 per cent. On an average day of trading 969,000 Fabege shares
(990,000) exchanged hands in 685 transactions (729).
shares and share Capital
The 2008 Annual General Meeting resolved to reduce the company’s share capital by SEK 261m through the withdrawal of 9,150,673 treasury shares. In order to restore the share capital after the withdrawal of shares, the AGM also approved an increase in the share capital to be effected through a bonus issue of SEK 271m. As a result of these decisions, the company now has a share capital of SEK 5,096m (5,086), represented by 169,311,554 shares (178,458,921). All shares carry the same voting rights and entitle the holder to the same share of the company’s capital.
The 2008 AGM also voted to authorise the Board to buy back shares during the period until the 2009 Annual General
Meeting. Acquisitions must be made by purchase on the Stockholm Stock Exchange and are subject to the provision that the company’s share of the total number of outstanding shares not exceed 10 per cent. The authorisation was aimed at enabling the company to continuously adapt its capital requirements and thereby improve shareholder value. In 2008 6,441,451 shares (7,635,622) were acquired for SEK 360m (average share price SEK 55.91). At year-end Fabege had bought back 4,929,400 shares, or 2.9 per cent of the total number of shares in the company.
The number of outstanding shares during the year has also been affected by continued conversions of convertibles into Fabege shares (see below).
COnvertibles
When the “old” Wihlborgs acquired the “old” Fabege in 2004 many shareholders
the fabege share
fabege’s shares are quoted on the nasdaq OMx nordic exchange stockholm in the large Cap segment.
0
5,000
10,000
15,000
20,000
25,000SEK ‘000 shares
0
30
60
90
120
150
Fabege
SIX Return Index
SIX Real Estate Return Index
Share turnover per mounth (thousands)
Jan
FebM
arch
AprM
ayJu
neJu
lyAug
SeptOct
NovDec
SHARE TREND 2008
%
TOTAL RETURN 2001–2008
0
30
60
90
120
150
Fabege
SIX Return Index
SIX Real Estate Return Index
05 06 07 0804030201
CASH DIVIDENDS PER SHARE 2003–2009*
0
2
4
6
200920082007200620052004
SEK
* proposed cash dividend
Share turnover per month (thousands)
30 the fabege share
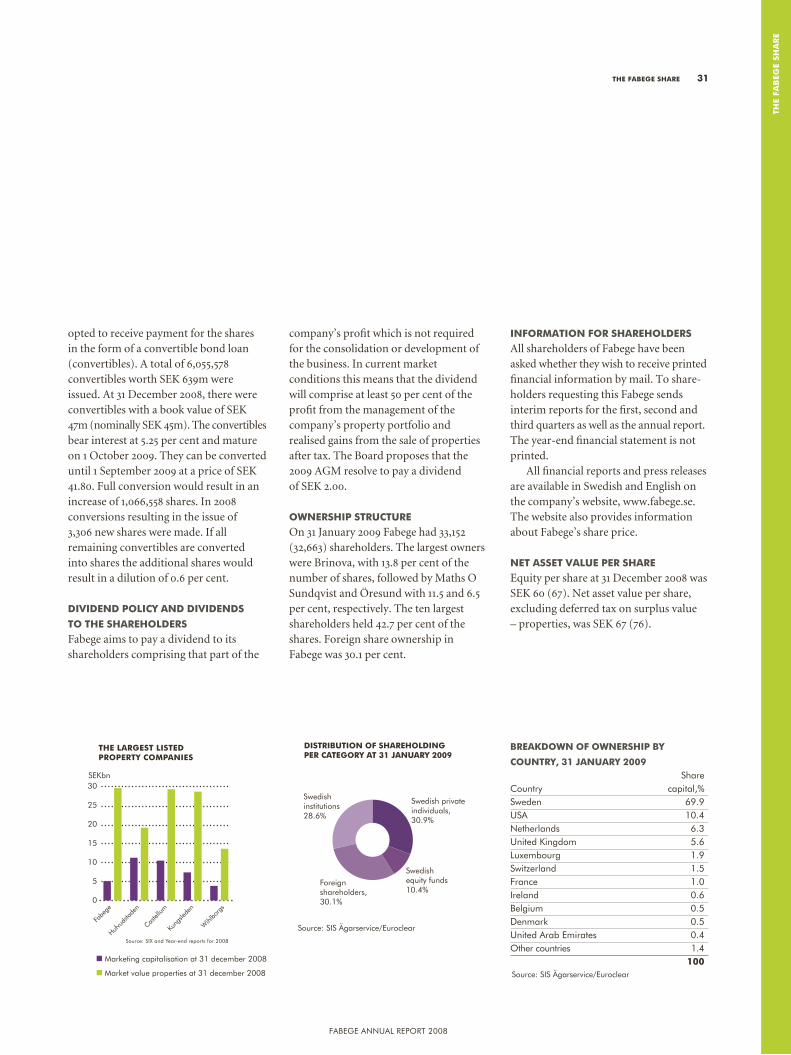
Fabege annual report 2008
the
fab
ege
sh
ar
e
opted to receive payment for the shares in the form of a convertible bond loan (convertibles). A total of 6,055,578 convertibles worth SEK 639m were issued. At 31 December 2008, there were convertibles with a book value of SEK 47m (nominally SEK 45m). The convertibles bear interest at 5.25 per cent and mature on 1 October 2009. They can be converted until 1 September 2009 at a price of SEK 41.80. Full conversion would result in an increase of 1,066,558 shares. In 2008 conversions resulting in the issue of 3,306 new shares were made. If all remaining convertibles are converted into shares the additional shares would result in a dilution of 0.6 per cent.
dividend pOliCy and dividends
tO the sharehOlders
Fabege aims to pay a dividend to its shareholders comprising that part of the
company’s profit which is not required for the consolidation or development of the business. In current market conditions this means that the dividend will comprise at least 50 per cent of the profit from the management of the company’s property portfolio and realised gains from the sale of properties after tax. The Board proposes that the 2009 AGM resolve to pay a dividend of SEK 2.00.
Ownership struCture
On 31 January 2009 Fabege had 33,152 (32,663) shareholders. The largest owners were Brinova, with 13.8 per cent of the number of shares, followed by Maths O Sundqvist and Öresund with 11.5 and 6.5 per cent, respectively. The ten largest shareholders held 42.7 per cent of the shares. Foreign share ownership in Fabege was 30.1 per cent.
infOrMatiOn fOr sharehOlders
All shareholders of Fabege have been asked whether they wish to receive printed financial information by mail. To share-holders requesting this Fabege sends interim reports for the first, second and third quarters as well as the annual report. The year-end financial statement is not printed.
All financial reports and press releases are available in Swedish and English on the company’s website, www.fabege.se. The website also provides information about Fabege’s share price.
net asset value per share
Equity per share at 31 December 2008 was SEK 60 (67). Net asset value per share, excluding deferred tax on surplus value – properties, was SEK 67 (76).
the fabege share 31
Swedish privateindividuals, 30.9%
Swedish institutions28.6%
Foreignshareholders, 30.1%
Swedish equity funds10.4%
DISTRIBUTION OF SHAREHOLDING PER CATEGORY AT 31 JANUARY 2009
breaKdOwn Of Ownership by
COuntry, 31 January 2009 Share Country capital,%Sweden 69.9uSa 10.4netherlands 6.3united Kingdom 5.6luxembourg 1.9Switzerland 1.5France 1.0Ireland 0.6belgium 0.5Denmark 0.5united arab emirates 0.4other countries 1.4 100Source: SIS Ägarservice/euroclear
Source: SIS Ägarservice/euroclear
Source: SIX and Year-end reports for 2008
Wihl
borg
s
Kung
slede
n
Castel
lum
Hufvud
stade
n
Fabe
ge
Marketing capitalisation at 31 december 2008
Market value properties at 31 december 2008
THE LARGEST LISTED PROPERTY COMPANIES
0
5
10
15
20
25
30SEKbn
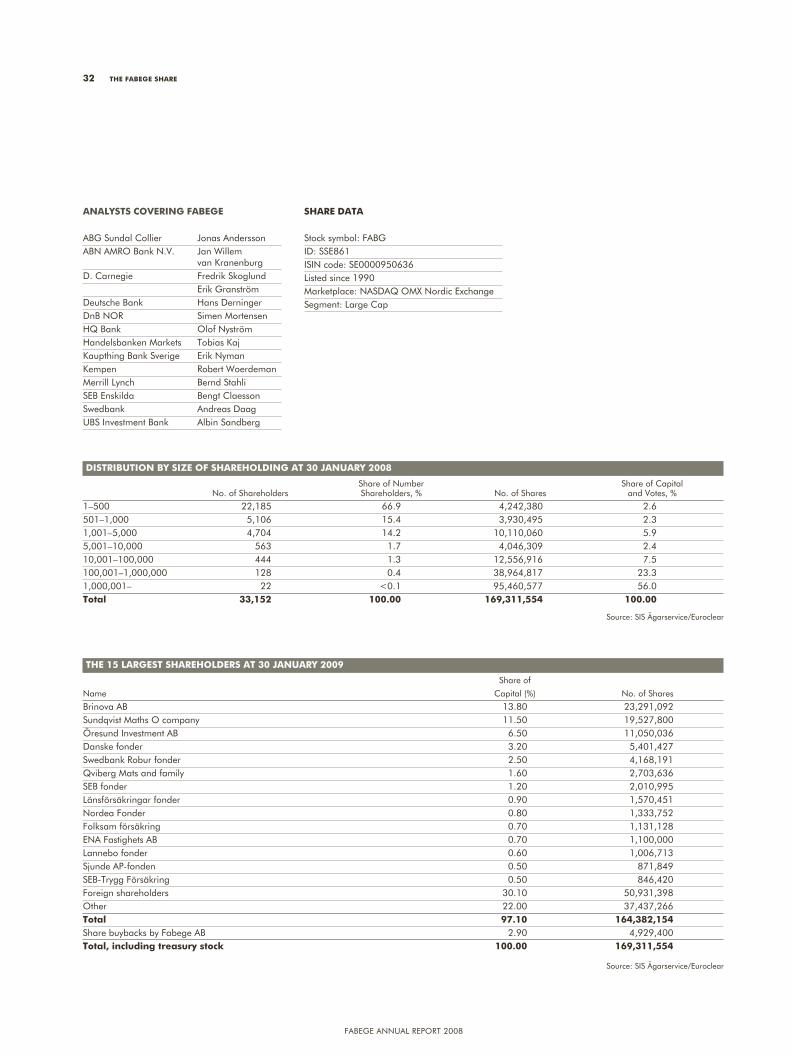
Fabege annual report 2008
32 THE FABEGE SHARE
THE 15 lARGEST SHAREHoldERS AT 30 JAnuARy 2009
Share of
name Capital (%) no. of Shares
brinova ab 13.80 23,291,092 Sundqvist Maths o company 11.50 19,527,800 Öresund Investment ab 6.50 11,050,036 Danske fonder 3.20 5,401,427 Swedbank robur fonder 2.50 4,168,191 Qviberg Mats and family 1.60 2,703,636 Seb fonder 1.20 2,010,995 länsförsäkringar fonder 0.90 1,570,451 nordea Fonder 0.80 1,333,752 Folksam försäkring 0.70 1,131,128 ena Fastighets ab 0.70 1,100,000 lannebo fonder 0.60 1,006,713 Sjunde ap-fonden 0.50 871,849 Seb-trygg Försäkring 0.50 846,420 Foreign shareholders 30.10 50,931,398 other 22.00 37,437,266 Total 97.10 164,382,154 Share buybacks by Fabege ab 2.90 4,929,400 Total, including treasury stock 100.00 169,311,554
diSTRiBuTion By SizE oF SHAREHoldinG AT 30 JAnuARy 2008
Share of number Share of Capital no. of Shareholders Shareholders, % no. of Shares and Votes, %
1–500 22,185 66.9 4,242,380 2.6501–1,000 5,106 15.4 3,930,495 2.31,001–5,000 4,704 14.2 10,110,060 5.95,001–10,000 563 1.7 4,046,309 2.410,001–100,000 444 1.3 12,556,916 7.5100,001–1,000,000 128 0.4 38,964,817 23.31,000,001– 22 <0.1 95,460,577 56.0Total 33,152 100.00 169,311,554 100.00
AnAlySTS covERinG FABEGE
abg Sundal Collier Jonas anderssonabn aMro bank n.V. Jan Willem van KranenburgD. Carnegie Fredrik Skoglund erik granström Deutsche bank Hans Derninger Dnb nor Simen MortensenHQ bank olof nyströmHandelsbanken Markets tobias KajKaupthing bank Sverige erik nymanKempen robert WoerdemanMerrill lynch bernd StahliSeb enskilda bengt ClaessonSwedbank andreas DaagubS Investment bank albin Sandberg
SHARE dATA
Stock symbol: FabgID: SSe861ISIn code: Se0000950636listed since 1990Marketplace: naSDaQ oMX nordic exchangeSegment: large Cap
Source: SIS Ägarservice/euroclear
Source: SIS Ägarservice/euroclear
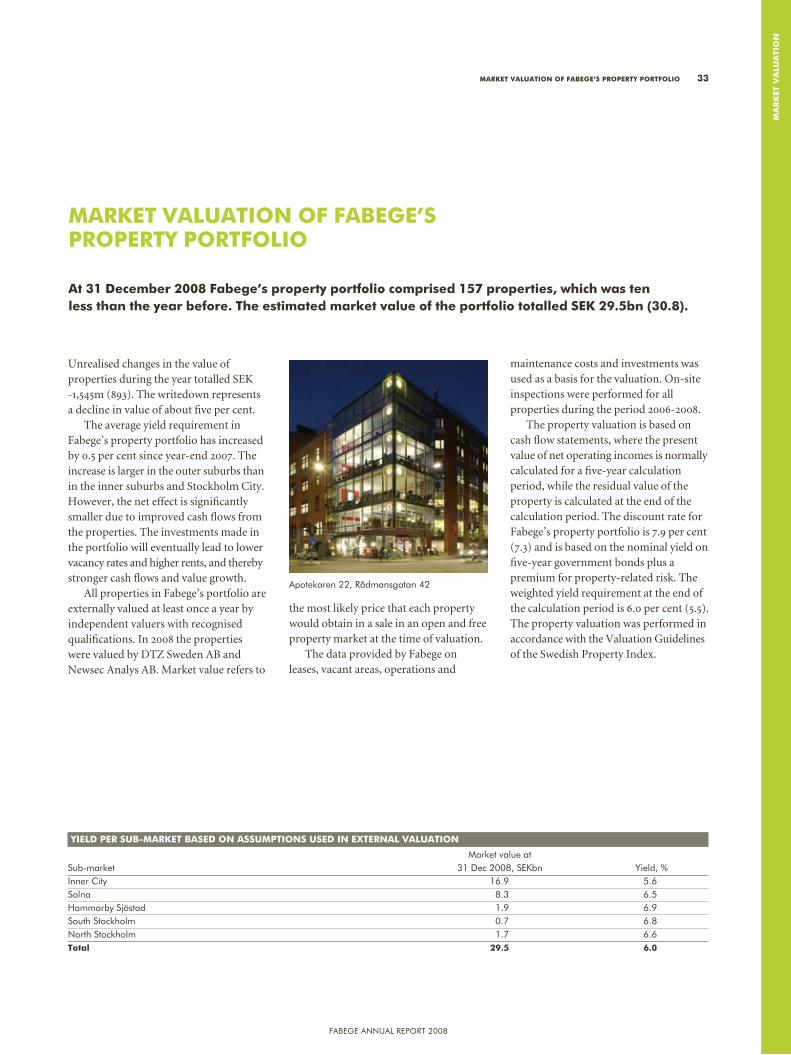
Fabege annual report 2008
Ma
rK
et v
alu
ati
On
Unrealised changes in the value of properties during the year totalled SEK -1,545m (893). The writedown represents a decline in value of about five per cent.
The average yield requirement in Fabege’s property portfolio has increased by 0.5 per cent since year-end 2007. The increase is larger in the outer suburbs than in the inner suburbs and Stockholm City. However, the net effect is significantly smaller due to improved cash flows from the properties. The investments made in the portfolio will eventually lead to lower vacancy rates and higher rents, and thereby stronger cash flows and value growth.
All properties in Fabege’s portfolio are externally valued at least once a year by independent valuers with recognised qualifications. In 2008 the properties were valued by DTZ Sweden AB and Newsec Analys AB. Market value refers to
the most likely price that each property would obtain in a sale in an open and free property market at the time of valuation.
The data provided by Fabege on leases, vacant areas, operations and
maintenance costs and investments was used as a basis for the valuation. On-site inspections were performed for all properties during the period 2006-2008.
The property valuation is based on cash flow statements, where the present value of net operating incomes is normally calculated for a five-year calculation period, while the residual value of the property is calculated at the end of the calculation period. The discount rate for Fabege’s property portfolio is 7.9 per cent (7.3) and is based on the nominal yield on five-year government bonds plus a premium for property-related risk. The weighted yield requirement at the end of the calculation period is 6.0 per cent (5.5). The property valuation was performed in accordance with the Valuation Guidelines of the Swedish Property Index.
MarKet valuatiOn Of fabege’s prOperty pOrtfOliO 33
MarKet valuatiOn Of fabege’s prOperty pOrtfOliO
at 31 december 2008 fabege’s property portfolio comprised 157 properties, which was ten less than the year before. the estimated market value of the portfolio totalled seK 29.5bn (30.8).
yield per sub-MarKet based On assuMptiOns used in external valuatiOn
Market value at Sub-market 31 Dec 2008, SeKbn Yield, %Inner City 16.9 5.6Solna 8.3 6.5Hammarby Sjöstad 1.9 6.9South Stockholm 0.7 6.8north Stockholm 1.7 6.6total 29.5 6.0
apotekaren 22, rådmansgatan 42
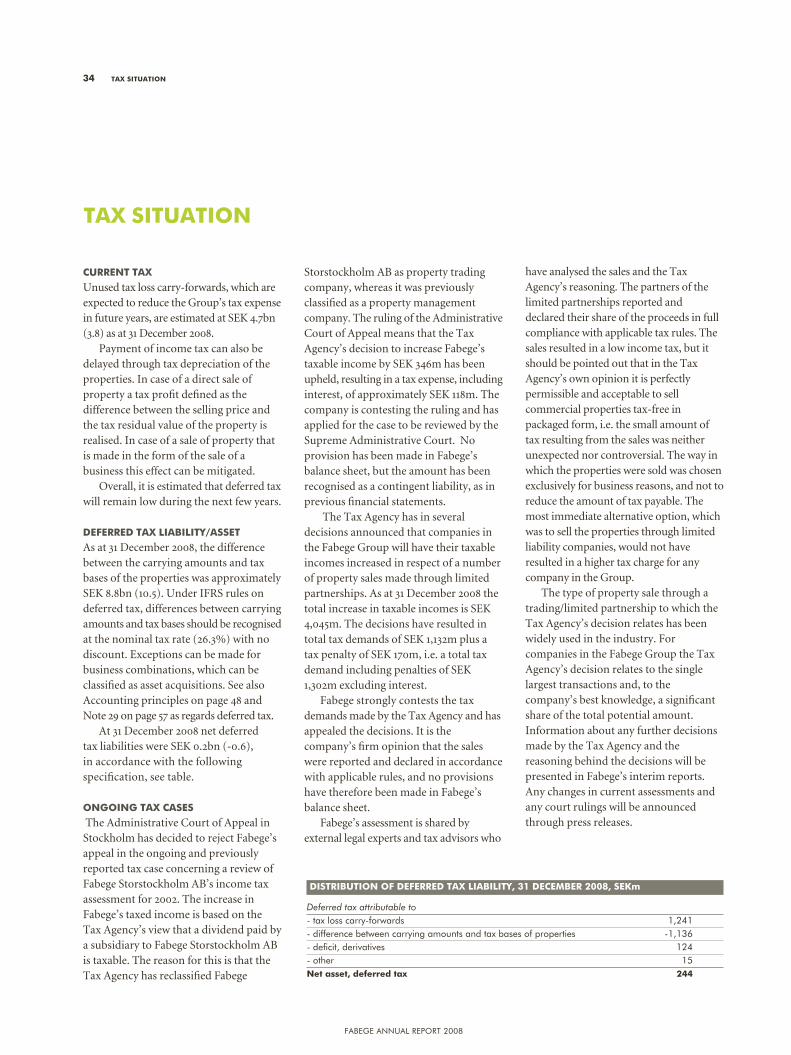
Fabege annual report 2008
Current tax
Unused tax loss carry-forwards, which are expected to reduce the Group’s tax expense in future years, are estimated at SEK 4.7bn (3.8) as at 31 December 2008.
Payment of income tax can also be delayed through tax depreciation of the properties. In case of a direct sale of property a tax profit defined as the difference between the selling price and the tax residual value of the property is realised. In case of a sale of property that is made in the form of the sale of a business this effect can be mitigated.
Overall, it is estimated that deferred tax will remain low during the next few years.
deferred tax liability/asset
As at 31 December 2008, the difference between the carrying amounts and tax bases of the properties was approximately SEK 8.8bn (10.5). Under IFRS rules on deferred tax, differences between carrying amounts and tax bases should be recognised at the nominal tax rate (26.3%) with no discount. Exceptions can be made for business combinations, which can be classified as asset acquisitions. See also Accounting principles on page 48 and Note 29 on page 57 as regards deferred tax.
At 31 December 2008 net deferred tax liabilities were SEK 0.2bn (-0.6), in accordance with the following specification, see table.
OngOing tax Cases
The Administrative Court of Appeal in Stockholm has decided to reject Fabege’s appeal in the ongoing and previously reported tax case concerning a review of Fabege Storstockholm AB’s income tax assessment for 2002. The increase in Fabege’s taxed income is based on the Tax Agency’s view that a dividend paid by a subsidiary to Fabege Storstockholm AB is taxable. The reason for this is that the Tax Agency has reclassified Fabege
Storstockholm AB as property trading company, whereas it was previously classified as a property management company. The ruling of the Administrative Court of Appeal means that the Tax Agency’s decision to increase Fabege’s taxable income by SEK 346m has been upheld, resulting in a tax expense, including interest, of approximately SEK 118m. The company is contesting the ruling and has applied for the case to be reviewed by the Supreme Administrative Court. No provision has been made in Fabege’s balance sheet, but the amount has been recognised as a contingent liability, as in previous financial statements.
The Tax Agency has in several decisions announced that companies in the Fabege Group will have their taxable incomes increased in respect of a number of property sales made through limited partnerships. As at 31 December 2008 the total increase in taxable incomes is SEK 4,045m. The decisions have resulted in total tax demands of SEK 1,132m plus a tax penalty of SEK 170m, i.e. a total tax demand including penalties of SEK 1,302m excluding interest.
Fabege strongly contests the tax demands made by the Tax Agency and has appealed the decisions. It is the company’s firm opinion that the sales were reported and declared in accordance with applicable rules, and no provisions have therefore been made in Fabege’s balance sheet.
Fabege’s assessment is shared by external legal experts and tax advisors who
have analysed the sales and the Tax Agency’s reasoning. The partners of the limited partnerships reported and declared their share of the proceeds in full compliance with applicable tax rules. The sales resulted in a low income tax, but it should be pointed out that in the Tax Agency’s own opinion it is perfectly permissible and acceptable to sell commercial properties tax-free in packaged form, i.e. the small amount of tax resulting from the sales was neither unexpected nor controversial. The way in which the properties were sold was chosen exclusively for business reasons, and not to reduce the amount of tax payable. The most immediate alternative option, which was to sell the properties through limited liability companies, would not have resulted in a higher tax charge for any company in the Group.
The type of property sale through a trading/limited partnership to which the Tax Agency’s decision relates has been widely used in the industry. For companies in the Fabege Group the Tax Agency’s decision relates to the single largest transactions and, to the company’s best knowledge, a significant share of the total potential amount. Information about any further decisions made by the Tax Agency and the reasoning behind the decisions will be presented in Fabege’s interim reports. Any changes in current assessments and any court rulings will be announced through press releases.
34 tax situatiOn
tax situatiOn
distributiOn Of deferred tax liability, 31 deCeMber 2008, seKm Deferred tax attributable to - tax loss carry-forwards 1,241- difference between carrying amounts and tax bases of properties -1,136- deficit, derivatives 124- other 15net asset, deferred tax 244
Fabege annual report 2008
The Board of Directors and Chief Executive Officer of Fabege AB (publ), corporate identity number 556049-1523, hereby present their 2008 report for the Group and parent company.
the business
Fabege is one of Sweden’s leading property companies focusing on commercial premises. The business is concentrated to a small number of fast-growing priority sub-markets in the Stockholm region. Fabege manages and improves its existing properties while continuously developing its portfolio through sales and acquisitions. Realising value is an integral and key part of the business.
The deals and investments made in 2008 continued the process of concentrating the Group’s property holdings to the inner city of Stockholm, Solna and Hammarby Sjöstad. As at 31 December 2008 Fabege had a rental value of SEK 2.4bn, a lettable area of 1.5 million sqm and a book value, including project properties, of SEK 29.5bn. At 31 December 2008 Fabege’s property portfolio in the inner city of Stockholm, Solna and Hammarby Sjöstad represented 89 per cent (88%) of the total rental value.
Commercial premises represented 97 per cent (97%) of the rental value and residential premises 3 per cent (3%).
inCOMe and earnings
The loss after tax was SEK -511m (1,812) and earnings per share were SEK -3.07 (9.98). The loss after financial items was SEK -1,340m (2,066).
Rental income was SEK 2,214m (2,066) and net operating income SEK 1,438m (1,312). The increase in rental income was due to a net increase in properties and higher rents in existing properties. For comparable properties rental income grew by 3 per cent.
Realised changes in the value of properties totalled SEK 143m (446). Unrealised changes were SEK -1,545m (893) due to increased yield requirements. Changes in the value of the Group’s fixed income derivatives were SEK -485m (37) as a result of a sharp decline in market interest rates at the end of year.
The net interest expense increased to SEK -804m (-609) due to net investments in properties and higher interest rates.
Tax (current and deferred) for the year was SEK 829m (-254). The big change is due to elimination of deferred tax as a result of property sales and asset impairment as well as valuations of additional tax loss carry-forwards. At 31 December 2008, differences between the carrying amounts and tax bases of the properties were approximately SEK 8.8bn (10.5). At the same date the Group had valued tax loss carry-forwards of SEK 4.7bn (3.8).
Cash flOw
The result increased liquidity by SEK 640m (1,142). After an increase of SEK 1,104m (-491) in working capital, which varies primarily as a result of occupancy/final settlement for acquired and divested properties, operating activities resulted in a change in liquidity of SEK -464m (1,633). Investments and acquisitions exceeded property sales by SEK 217m (2,653). The total change in liquidity resulting from operating activities was thus SEK -681m (-1,020). Dividends to shareholders and share buybacks totalled SEK 670m (761) and SEK 361m (543), respectively. After the increase in debt, consolidated cash and cash equivalents were SEK 54m (75).
finanCing
Fabege employs long-term credit lines with fixed terms and conditions and an average maturity by year-end of 5.4 years. The company’s creditors are major Nordic banks. Interest-bearing liabilities at year-end were SEK 18,902m (17,210). The financial turbulence during the year has not affected the company’s access to long-term capital. However, the gradual rise in market interest rates up to November had a negative impact on the net interest expense. The decline in market rates during the fourth quarter has affected Fabege’s average interest rate, which fell by 1.83 percentage points during the period to 3.27 per cent excluding the cost of unused committed lines of credit at year-end, or 3.29 per cent including this cost.
Approximately 40 per cent of Fabege’s loan portfolio was fixed through fixed income derivatives. The average fixed-rate period was 24 months, including the effect of derivatives. At 31 December the company’s derivatives portfolio had a value of SEK 7,700m with maturities of up to 10 years. Out of this, SEK 5,950m refers to callable swaps, which are expected to increase to SEK 7,550m in the first quarter of 2009. The derivatives contracts were concluded in summer 2008 to improve cash flow in a situation where the market was expecting interest rates to rise. The aim was to obtain a discount on interest rates or fix rates at a level that was attractive from a long-term perspective.
In compliance with the accounting rules contained in IAS 39, the derivatives portfolio has been valued at market value and the change has been passed through the profit and loss account. Following the sharp fall in market interest rates the value of the portfolio declined during the fourth quarter. At 31 December the deficit in the portfolio was SEK 471m. The derivatives portfolio has been valued at the present value of future cash flows. The change in value is of an accounting character and does not affect cash flow or leverage. The portfolio had a positive impact of
direCtOrs’ repOrt
dir
eCtO
rs’
rep
Or
t
direCtOrs’ repOrt 35
Fabege annual report 2008
SEK 54m on the net interest expense for the year.The average fixed-rate period for variable-rate loans is 32 days.
Future changes in interest rates will thus quickly affect 60 per cent of the loan portfolio.
At 31 December 2008 the company had unused committed lines of credit of SEK 2,446m. SEK 1,468m was refinanced in the fourth quarter.
Fabege has available long-term credit facilities covering all outstanding commercial paper at any given time. Due to falling demand in the commercial paper market during the period, the company has shifted its funding to these. Outstanding commercial paper at 31 December 2008 were nominally SEK 740m.
The total loan volume includes loans for projects worth SEK 1,766m, on which the interest of SEK 41m has been capitalised.
finanCial pOsitiOn and net asset value
Shareholders’ equity was SEK 9,873m (11,415) and the equity/assets ratio 32 per cent (36%).
Equity per share was SEK 60 (67). Net asset value per share, excluding deferred tax on the surplus value of properties, was SEK 67 (76).
aCquisitiOns and sales
Investments in 2008 were SEK 2,164m (4,984), of which SEK 201m (4,018) refers to property acquisitions and SEK 1,963m (966) to investments in existing properties and projects. Two properties were acquired for a total consideration of SEK 201m and 13 properties were sold for SEK 2,095m. The sales resulted in a profit of SEK 143m before tax, or SEK 333m after tax.
Major sales refers to two properties in Marievik (SEK 975m) and one property in Solna (SEK 570m). The deals concluded during the year resulted in a further concentration of the Group’s property portfolio to Fabege’s priority sub-markets, which accounted for 92 per cent of the total value of the Group’s properties at 31 December.
investMents in existing prOperties and
prOJeCts in prOgress
In 2008 the Group continued its active efforts to add value through improvements to properties, and major project investments of approximately SEK 462bn were approved. Investments of SEK 1,963m (966) in existing properties and projects referred to land, new builds, extensions and conversions. Major investments during the year were Bocken 35 and 46 (Norrmalm), Paradiset 29 (Stads-hagen) and Marievik 19 (Marievik), which was sold in April 2008.
parent COMpany
Turnover during the year was SEK 108m (108) and earnings before appropriations and tax were SEK -25m (1,048). Net investments in property, equipment and shares were SEK -140m (32). At 31 December the company had cash and cash equivalents of SEK 43m (58).
shares and share Capital
Fabege’s share capital at year-end was SEK 5,096m (5,086m), represented by 169,311,554 shares (178,458,921). All shares carry the same voting rights and entitle the holder to the same share of the company’s capital. Full conversion of all outstanding convertible debentures would result in an increase of 1,066,558 shares.
The following indirect or direct shareholdings in the company as at 31 January 2009 represent one tenth or more of the votes for all shares in the company:
Shareholder Share of votes, %brinova 14.2
Maths o Sundqvist 11.9
Through Fabege’s profit-sharing fund and the Wihlborgs & Fabege profit-sharing fund the employees own a total of 566,766 shares in the company.
share buybaCK prOgraMMe
The 2008 AGM passed a resolution authorising the Board, during the period up to the next AGM, to buy back and assign shares to other parties. Share buybacks are subject to a limit of 10 per cent of the total number of outstanding shares at any time. With the aim of continuously adapting the company’s capital requirements and improving shareholder value, the Board of Directors has decided to use its authorisation to buy back shares. 6,444,451 shares (7,635,622) were repurchased during the year. At 31 December 2008 the company owned 4,929,400 treasury shares (7,635,622), which is equivalent to 2.9 per cent of the total number of registered shares. The average price paid for shares in buyback transactions was SEK 55.91. The quota value is SEK 30.10 per share.
risKs and unCertainties
Risks and uncertainties relating to cash flow from operations are primarily attributable to changes in rents, vacancies and interest rates. Another uncertainty relates to changes in the value of properties. A detailed description of the impact of these changes on consolidated cash flow and key figures is given in the sensitivity analyses.
Financial risk, i.e. the risk of insufficient access to long-term funding through loans, and Fabege’s management of this risk are described in Note 3.
The sensitivity analysis is based on Fabege’s property holdings and balance sheet as at 31 December 2008. The sensitivity analysis shows the effects on the Group’s profit after financial items on an annualised basis after taking account of the full effect of each parameter.
The result will also be affected by realised and unrealised changes in the value of properties.
36 direCtOrs’ repOrt
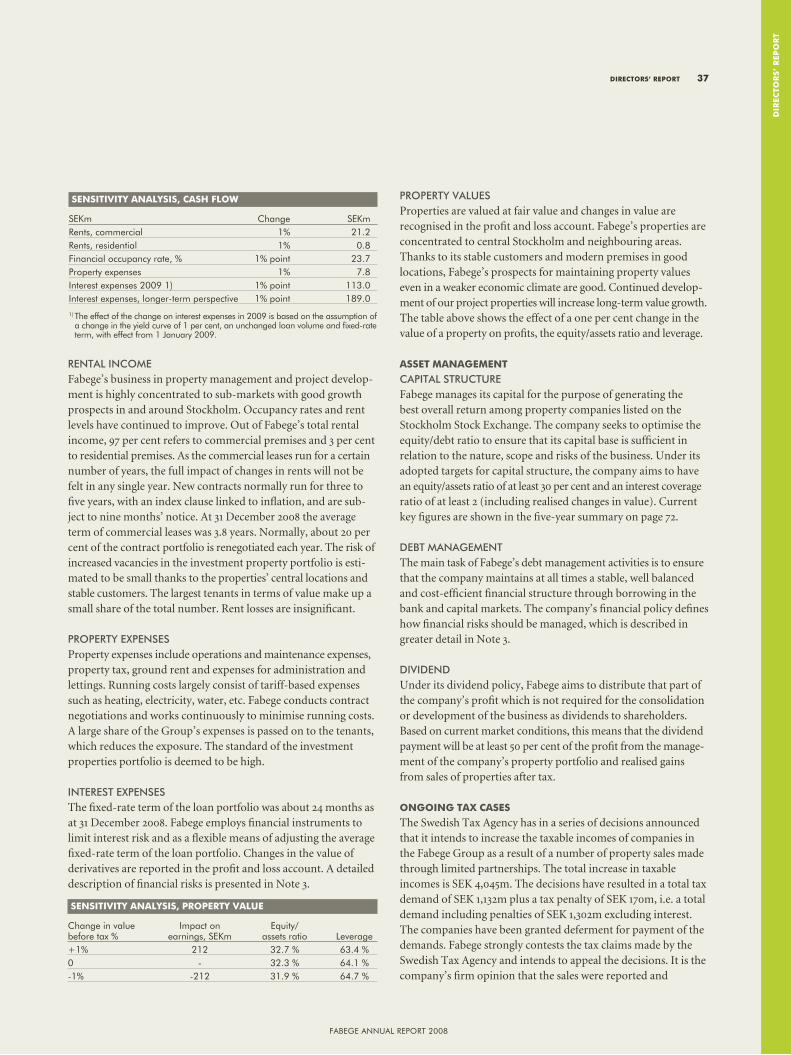
Fabege annual report 2008
renTAl inComeFabege’s business in property management and project develop-ment is highly concentrated to sub-markets with good growth prospects in and around Stockholm. Occupancy rates and rent levels have continued to improve. Out of Fabege’s total rental income, 97 per cent refers to commercial premises and 3 per cent to residential premises. As the commercial leases run for a certain number of years, the full impact of changes in rents will not be felt in any single year. New contracts normally run for three tofive years, with an index clause linked to inflation, and are sub-ject to nine months’ notice. At 31 December 2008 the average term of commercial leases was 3.8 years. Normally, about 20 per cent of the contract portfolio is renegotiated each year. The risk of increased vacancies in the investment property portfolio is esti-mated to be small thanks to the properties’ central locations and stable customers. The largest tenants in terms of value make up a small share of the total number. Rent losses are insignificant.
ProPerTy exPenSeSProperty expenses include operations and maintenance expenses, property tax, ground rent and expenses for administration and lettings. Running costs largely consist of tariff-based expenses such as heating, electricity, water, etc. Fabege conducts contract negotiations and works continuously to minimise running costs. A large share of the Group’s expenses is passed on to the tenants, which reduces the exposure. The standard of the investment properties portfolio is deemed to be high.
inTereST exPenSeSThe fixed-rate term of the loan portfolio was about 24 months as at 31 December 2008. Fabege employs financial instruments to limit interest risk and as a flexible means of adjusting the average fixed-rate term of the loan portfolio. Changes in the value of derivatives are reported in the profit and loss account. A detailed description of financial risks is presented in Note 3.
ProPerTy vAlueSProperties are valued at fair value and changes in value are recognised in the profit and loss account. Fabege’s properties are concentrated to central Stockholm and neighbouring areas. Thanks to its stable customers and modern premises in good locations, Fabege’s prospects for maintaining property values even in a weaker economic climate are good. Continued develop-ment of our project properties will increase long-term value growth. The table above shows the effect of a one per cent change in the value of a property on profits, the equity/assets ratio and leverage.
asset ManageMent
CAPiTAl STruCTure Fabege manages its capital for the purpose of generating the best overall return among property companies listed on the Stockholm Stock Exchange. The company seeks to optimise the equity/debt ratio to ensure that its capital base is sufficient in relation to the nature, scope and risks of the business. Under its adopted targets for capital structure, the company aims to have an equity/assets ratio of at least 30 per cent and an interest coverage ratio of at least 2 (including realised changes in value). Current key figures are shown in the five-year summary on page 72.
debT mAnAgemenT The main task of Fabege’s debt management activities is to ensure that the company maintains at all times a stable, well balanced and cost-efficient financial structure through borrowing in the bank and capital markets. The company’s financial policy defines how financial risks should be managed, which is described in greater detail in Note 3.
dividendUnder its dividend policy, Fabege aims to distribute that part of the company’s profit which is not required for the consolidation or development of the business as dividends to shareholders. Based on current market conditions, this means that the dividend payment will be at least 50 per cent of the profit from the manage-ment of the company’s property portfolio and realised gains from sales of properties after tax.
OngOing tax Cases
The Swedish Tax Agency has in a series of decisions announced that it intends to increase the taxable incomes of companies in the Fabege Group as a result of a number of property sales made through limited partnerships. The total increase in taxable incomes is SEK 4,045m. The decisions have resulted in a total tax demand of SEK 1,132m plus a tax penalty of SEK 170m, i.e. a total demand including penalties of SEK 1,302m excluding interest. The companies have been granted deferment for payment of the demands. Fabege strongly contests the tax claims made by the Swedish Tax Agency and intends to appeal the decisions. It is the company’s firm opinion that the sales were reported and
sensitivity analysis, prOperty value
Change in value Impact on equity/ before tax % earnings, SeKm assets ratio leverage+1% 212 32.7 % 63.4 %0 - 32.3 % 64.1 %-1% -212 31.9 % 64.7 %
sensitivity analysis, Cash flOw
SeKm Change SeKmrents, commercial 1% 21.2rents, residential 1% 0.8Financial occupancy rate, % 1% point 23.7property expenses 1% 7.8Interest expenses 2009 1) 1% point 113.0Interest expenses, longer-term perspective 1% point 189.0 1) the effect of the change on interest expenses in 2009 is based on the assumption of
a change in the yield curve of 1 per cent, an unchanged loan volume and fixed-rate term, with effect from 1 January 2009.
direCtOrs’ repOrt 37
dir
eCtO
rs’
rep
Or
t
Fabege annual report 2008
declared in compliance with applicable rules, and no provisions have therefore been made in Fabege’s balance sheet (reported as contingent liability). Fabege’s assessment is shared by external legal experts and tax advisors that have analysed the sales and the Tax Agency’s reasoning. See also Fabege’s tax situation on page 34.
The Administrative Court of Appeal in Stockholm has decided to reject Fabege’s appeal in the ongoing and previously reported tax case concerning a review of the 2002 income tax for Fabege Storstockholm AB. The adopted increase in Fabege’s taxed income is due to the fact that the Tax Agency takes the view that a dividend paid by a subsidiary to Fabege Storstockholm AB is taxable. The reason for this is that the Tax Agency has reclassified Fabege Storstockholm AB from a property management company to a property trading company. The ruling of the Administrative Court of Appeal means that the Tax Agency’s decision to increase Fabege’s taxable income by SEK 346m has been upheld, resulting in a tax expense, including interest, of approximately SEK 118m. The company does not accept the ruling of the Administrative Court of Appeal and has so for not made any provision for the expense in its balance sheet (reported as contingent liability). The company’s assessment is shared by external legal experts and tax advisors that have analysed the sales and the ruling of the Administrative Court of Appeal. Fabege has applied for the case to be reviewed by the Supreme Administrative Court.
There were no new developments in the above cases in 2008.
the wOrK Of the bOard Of direCtOrs
A separate description of the work of the Board of Directors is given in the Corporate Governance Report on page 63.
envirOnMent
Fabege does not conduct activities that are subject to permit and notification requirements under Chapter 9, Section 6 of the Environmental Code. Out of Fabege’s tenants, only a few conduct such activities. More information about Fabege’s environmental work is given in the section on the Responsible enterprise on page 22.
staff
The average number of employees in the Group during the year was 149 (146), of which 58 (60) were women and 91 (86) were men. Out of these, 34 were employed in the parent company (33). At year-end the number of employees was 148, of which 62 were women. See also page 52, Note 5.
guidelines fOr COMpensatiOn and eMplOyMent terMs
fOr COMpany ManageMent
The term ‘company management’ refers to the Chief Executive Officer and other members of Group management. The entire Board of Directors (except the CEO) is responsible for drawing up a draft statement of principles governing compensation and other terms of employment for company management and for
preparing decisions on the CEO’s compensation and other terms of employment.
The 2008 AGM resolved to adopt the following guidelines for compensation and other employment terms for company management:
Compensation should be market-based and competitive, and should reflect responsibilities and performance that are in the interest of the shareholders. The fixed salary should be reviewed each year. Fabege has a profit-sharing fund covering all employees of the company. Allocations to the profit-sharing fund should be based on the achieved return on equity and are subject to a ceiling of one base amount per year per employee. Any compensation in addition to the fixed salary should be subject to a ceiling and related to the fixed salary. Any other benefits should constitute a limited part of the compensation. The retirement age is 65. Pension benefits should correspond to the ITP occupational pension plan or be contribution-based with a maximum contribution of 35 per cent of the pensionable salary. Termination salary and severance pay must not exceed 24 months in total.
Information about compensation paid to senior executives in 2008 is provided in Note 5.
The Board’s proposal to the 2009 AGM is that the guidelines remain unchanged.
events after the end Of the periOd
mAjor leTTing To vATTenFAll in ArenASTAdenVattenfall has concluded a rental agreement with Fabege for 43,000 sqm of office space as well as garage and parking space in Arenastaden in Solna. Vattenfall’s Nordic business area will be moving into a new office building located next to the Swedbank Arena and Mall of Scandinavia. Construction is scheduled to begin in 2009, subject to completion of the planning process . The contract runs for 12 years and has an annual rental value of about SEK 100m. The total cost of the project is SEK 1,150m and funding has been arranged through a new SEK 875m facility. Vattenfall Nordic’s new office building is expected to be completed in the third quarter of 2012.
OutlOOK fOr 2009
At the start of 2009 the rental market in Fabege’s main markets in Stockholm remains stable, and Fabege has since year-end 2008 concluded agreements on the rental of premises representing a contracted annual value of approx SEK 120m. With falling interest rates and good access to capital, a strong cash flow, a high occupancy rate and properties and premises that will remain attractive regardless of the state of the economy, Fabege is in a good position for 2009, which will be year of big challenges as well as interesting opportunities. Overall, there are good prospects for a balanced development of Fabege’s operations and earnings in 2009.
38 direCtOrs’ repOrt
Fabege annual report 2008
prOpOsed allOCatiOn Of prOfits
The following amounts are at the disposal of the AGM:
retained earnings 1,790,066,989profit for the year 229,209,367total 2,019,276,356
The Board of Directors and Chief Executive Officer propose that the amount be allocated as follows:
Dividend to the shareholders SeK 2 per share 328,764,308
Carried forward 1,690,512,048
total 2,019,276,356
The dividend amount is based on the total number of outstanding shares at 31 January 2008, i.e. 164,382,154 shares. The total dividend amount is subject to alteration up to and including the record date, depending on conversions of debentures and share buybacks.
stateMent Of the bOard Of direCtOrs On
the prOpOsed dividend
groundSThe Group’s equity has been calculated in accordance with the EU-approved IFRS standards, the interpretations of these (IFRIC) and Swedish law through the application of Recommendation RFR 1:1 (Supplementary Accounting Rules for Corporate Groups) of the Swedish Financial Accounting Standards Coun-cil. Equity in the parent company has been calculated in accord-ance with Swedish law, applying Recommendation RFR 2:1 (Accounting for Legal Entities) of the Swedish Financial Accounting Standards Board.
The Board of Directors has established that the company will have full coverage for its restricted equity after the proposed dividend.
The Board of Directors considers that the proposed dividend is defensible based on the criteria contained in the second and third paragraphs of Section 3 of Chapter 17 of the Swedish Companies Act (Nature and scope of the business and associated risks, Consolidation requirements, Liquidity and other financial circumstances). The Board would like to make the following comments pertaining thereto:
nature, sCOpe and risKs Of the business
The Board estimates that the company’s and Group’s equity after the proposed dividend will be sufficient in view of the nature and scope of the business and the associated risks. In this connection the Board has taken account of the company’s equity/assets ratio, historical and budgeted performance, investment plans and the general economic situation.
ConSolidATion requiremenTS, liquidiTy And oTher FinAnCiAl CirCumSTAnCeSConsolidation requirementsThe Board of Directors has made a general assessment of the company’s and Group’s financial position and its ability to meet its commitments. The proposed dividend constitutes 3.2 per cent of the company’s equity and 3.3 per cent of consolidated equity. The stated target for the Group’s capital structure is a minimumequity/assets ratio of 30 per cent and an interest coverage ratio of at least 2.0, and it is estimated that the Group will be able to maintain this also after the proposed dividend. In view of the current situation in the property market, the company and Group have a good equity/assets ratio. Against this background, the Board considers that the company and Group are in a good position to take advantage of future business opportunities and ride out any losses that may be incurred. Planned investments have been taken into account in the proposed dividend payment. Nor will the dividend adversely affect the company’s or Group’s ability to make further commercially motivated investments in accordance with the adopted plans.
In the parent company assets and liabilities have been valued at fair value in accordance with Chapter 4, Section 14 of the Annual Accounts Act. The effect of this valuation on parent company equity (SEK -485m) has been taken into account.
liquidityThe proposed dividend will not affect the company’s and Group’s ability to meet its payment obligations at the right time. The company and Group have good access to liquidity reserves in the form of short- and long-term credit. Agreed credit lines can be drawn at short notice, which means that the company and Group are well prepared to deal with variations in liquidity and any unexpected events.
other financial circumstancesThe Board of Directors has assessed all other known circum-stances that may be significant for the company’s and Group’s financial position and that have not been addressed in the above. No circumstance has been discovered in the course of the assess-ment that would cast doubt on the defensibility of the proposed dividend.
Stockholm, March 3, 2009The Board of Directors
direCtOrs’ repOrt 39
dir
eCtO
rs’
rep
Or
t
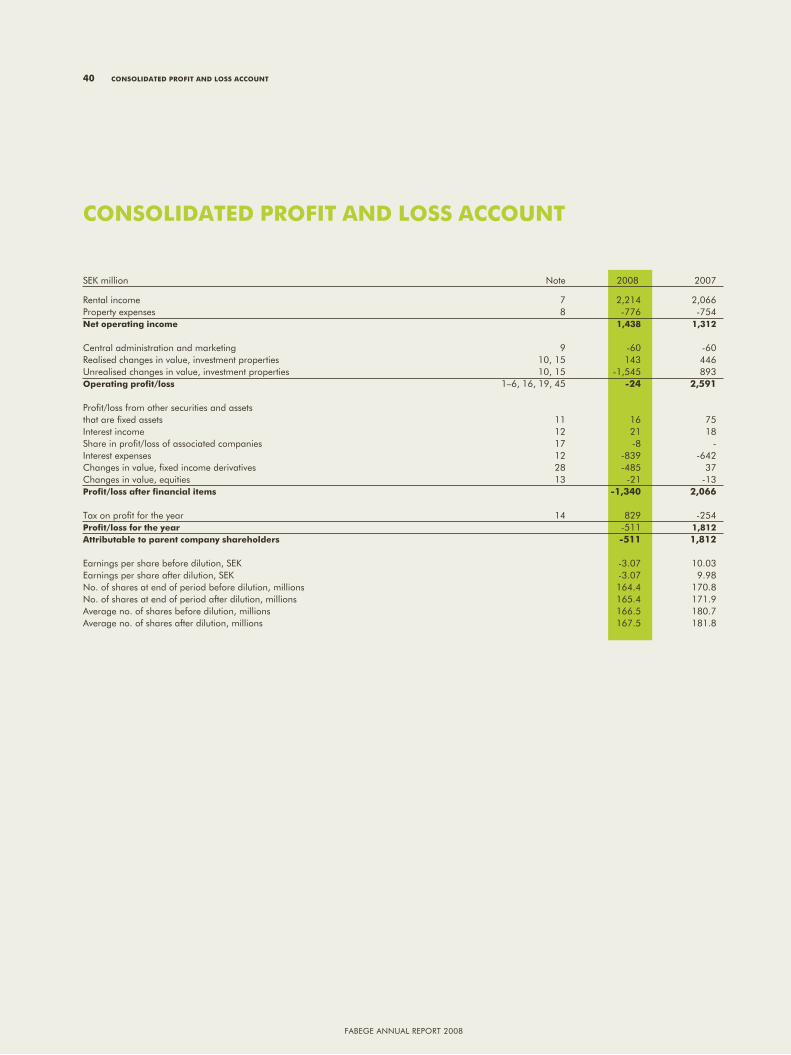
Fabege annual report 2008
SeK million note 2008 2007
rental income 7 2,214 2,066property expenses 8 -776 -754net operating income 1,438 1,312 Central administration and marketing 9 -60 -60realised changes in value, investment properties 10, 15 143 446unrealised changes in value, investment properties 10, 15 -1,545 893Operating profit/loss 1–6, 16, 19, 45 -24 2,591 profit/loss from other securities and assets that are fixed assets 11 16 75Interest income 12 21 18Share in profit/loss of associated companies 17 -8 -Interest expenses 12 -839 -642Changes in value, fixed income derivatives 28 -485 37Changes in value, equities 13 -21 -13profit/loss after financial items -1,340 2,066 tax on profit for the year 14 829 -254profit/loss for the year -511 1,812attributable to parent company shareholders -511 1,812
earnings per share before dilution, SeK -3.07 10.03earnings per share after dilution, SeK -3.07 9.98no. of shares at end of period before dilution, millions 164.4 170.8no. of shares at end of period after dilution, millions 165.4 171.9average no. of shares before dilution, millions 166.5 180.7average no. of shares after dilution, millions 167.5 181.8
COnsOlidated prOfit and lOss aCCOunt
40 COnsOlidated prOfit and lOss aCCOunt
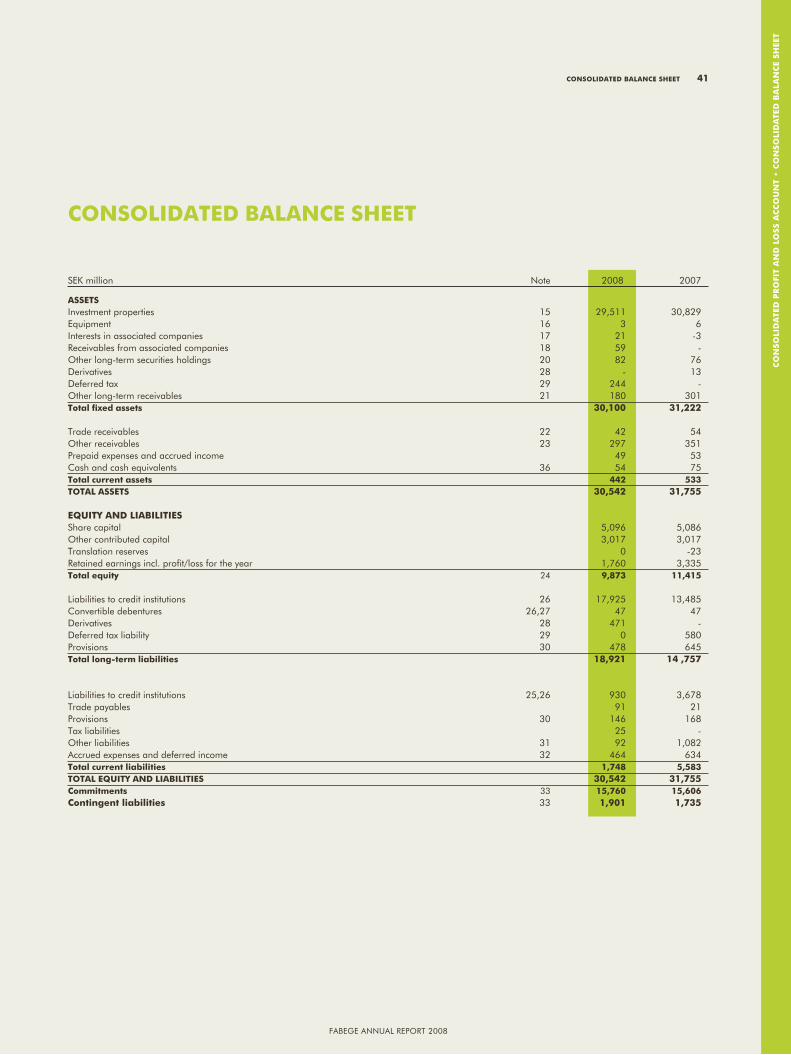
Co
nso
lid
ate
d p
ro
fit
an
d l
oss a
CC
ou
nt
• C
on
so
lid
ate
d B
ala
nC
e sH
eet
Fabege annual report 2008
SeK million note 2008 2007
assets Investment properties 15 29,511 30,829 equipment 16 3 6 Interests in associated companies 17 21 -3 receivables from associated companies 18 59 - other long-term securities holdings 20 82 76 Derivatives 28 - 13 Deferred tax 29 244 -other long-term receivables 21 180 301 total fixed assets 30,100 31,222 trade receivables 22 42 54 other receivables 23 297 351 prepaid expenses and accrued income 49 53 Cash and cash equivalents 36 54 75 total current assets 442 533 tOtal assets 30,542 31,755 equity and liabilities Share capital 5,096 5,086 other contributed capital 3,017 3,017 translation reserves 0 -23 retained earnings incl. profit/loss for the year 1,760 3,335 total equity 24 9,873 11,415 liabilities to credit institutions 26 17,925 13,485 Convertible debentures 26,27 47 47 Derivatives 28 471 - Deferred tax liability 29 0 580 provisions 30 478 645 total long-term liabilities 18,921 14 ,757
liabilities to credit institutions 25,26 930 3,678 trade payables 91 21 provisions 30 146 168 tax liabilities 25 -other liabilities 31 92 1,082 accrued expenses and deferred income 32 464 634 total current liabilities 1,748 5,583 tOtal equity and liabilities 30,542 31,755 Commitments 33 15,760 15,606 Contingent liabilities 33 1,901 1,735
COnsOlidated balanCe sheet
COnsOlidated balanCe sheet 41
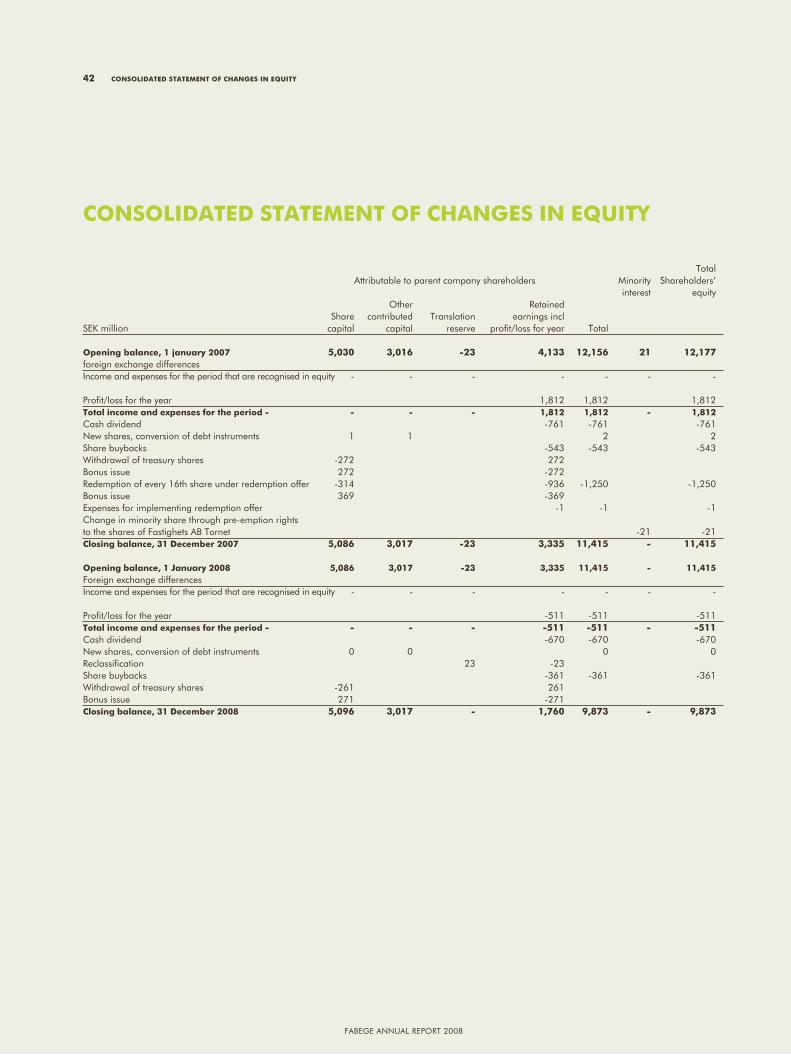
Fabege annual report 2008
total attributable to parent company shareholders Minority Shareholders’ interest equity other retained Share contributed translation earnings incl SeK million capital capital reserve profit/loss for year total
Opening balance, 1 january 2007 5,030 3,016 -23 4,133 12,156 21 12,177foreign exchange differences Income and expenses for the period that are recognised in equity - - - - - - - profit/loss for the year 1,812 1,812 1,812total income and expenses for the period - - - - 1,812 1,812 - 1,812Cash dividend -761 -761 -761new shares, conversion of debt instruments 1 1 2 2Share buybacks -543 -543 -543Withdrawal of treasury shares -272 272 bonus issue 272 -272 redemption of every 16th share under redemption offer -314 -936 -1,250 -1,250bonus issue 369 -369 expenses for implementing redemption offer -1 -1 -1Change in minority share through pre-emption rights to the shares of Fastighets ab tornet -21 -21Closing balance, 31 december 2007 5,086 3,017 -23 3,335 11,415 - 11,415 Opening balance, 1 January 2008 5,086 3,017 -23 3,335 11,415 - 11,415Foreign exchange differences Income and expenses for the period that are recognised in equity - - - - - - - profit/loss for the year -511 -511 -511total income and expenses for the period - - - - -511 -511 - -511Cash dividend -670 -670 -670new shares, conversion of debt instruments 0 0 0 0reclassification 23 -23Share buybacks -361 -361 -361Withdrawal of treasury shares -261 261 bonus issue 271 -271 Closing balance, 31 december 2008 5,096 3,017 - 1,760 9,873 - 9,873
COnsOlidated stateMent Of Changes in equity
42 COnsOlidated stateMent Of Changes in equity
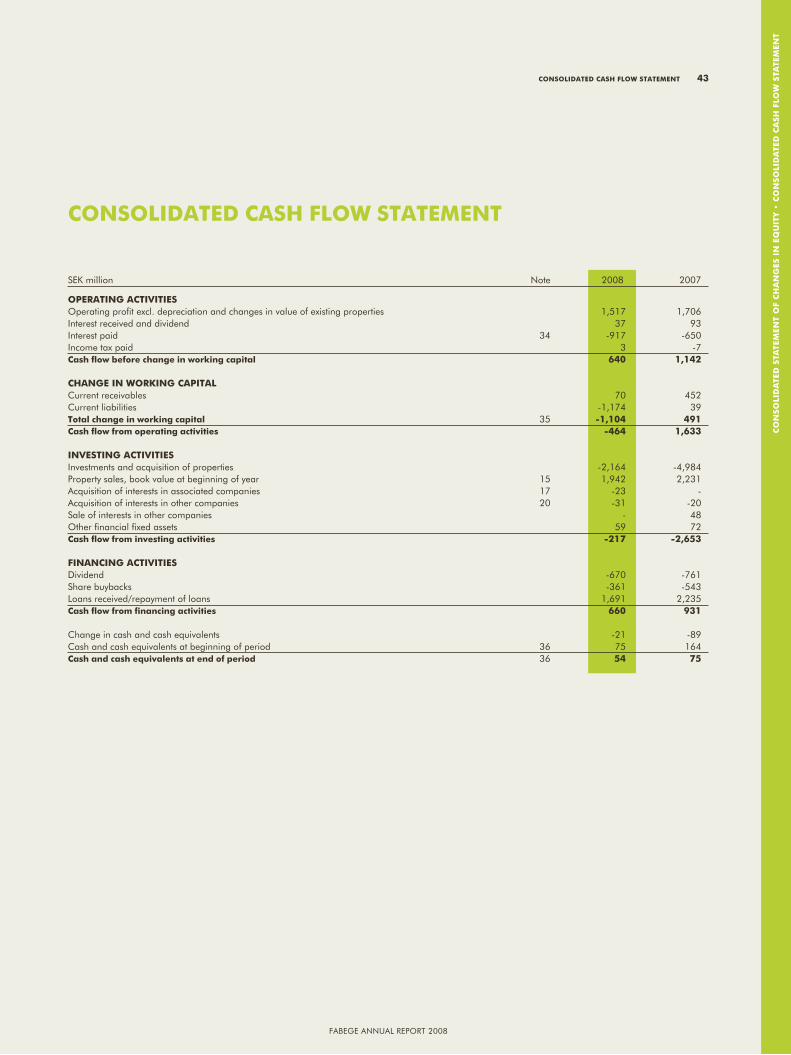
Co
nso
lid
ate
d s
tate
Men
t o
f C
Ha
nG
es i
n e
Qu
itY •
Co
nso
lid
ate
d C
asH
flo
W s
tate
Men
t
Fabege annual report 2008
COnsOlidated Cash flOw stateMent
SeK million note 2008 2007
Operating aCtivities operating profit excl. depreciation and changes in value of existing properties 1,517 1,706Interest received and dividend 37 93Interest paid 34 -917 -650Income tax paid 3 -7Cash flow before change in working capital 640 1,142
Change in wOrKing Capital Current receivables 70 452Current liabilities -1,174 39total change in working capital 35 -1,104 491Cash flow from operating activities -464 1,633 investing aCtivities Investments and acquisition of properties -2,164 -4,984property sales, book value at beginning of year 15 1,942 2,231acquisition of interests in associated companies 17 -23 -acquisition of interests in other companies 20 -31 -20Sale of interests in other companies - 48other financial fixed assets 59 72Cash flow from investing activities -217 -2,653 finanCing aCtivities Dividend -670 -761Share buybacks -361 -543loans received/repayment of loans 1,691 2,235Cash flow from financing activities 660 931 Change in cash and cash equivalents -21 -89Cash and cash equivalents at beginning of period 36 75 164Cash and cash equivalents at end of period 36 54 75
COnsOlidated Cash flOw stateMent 43
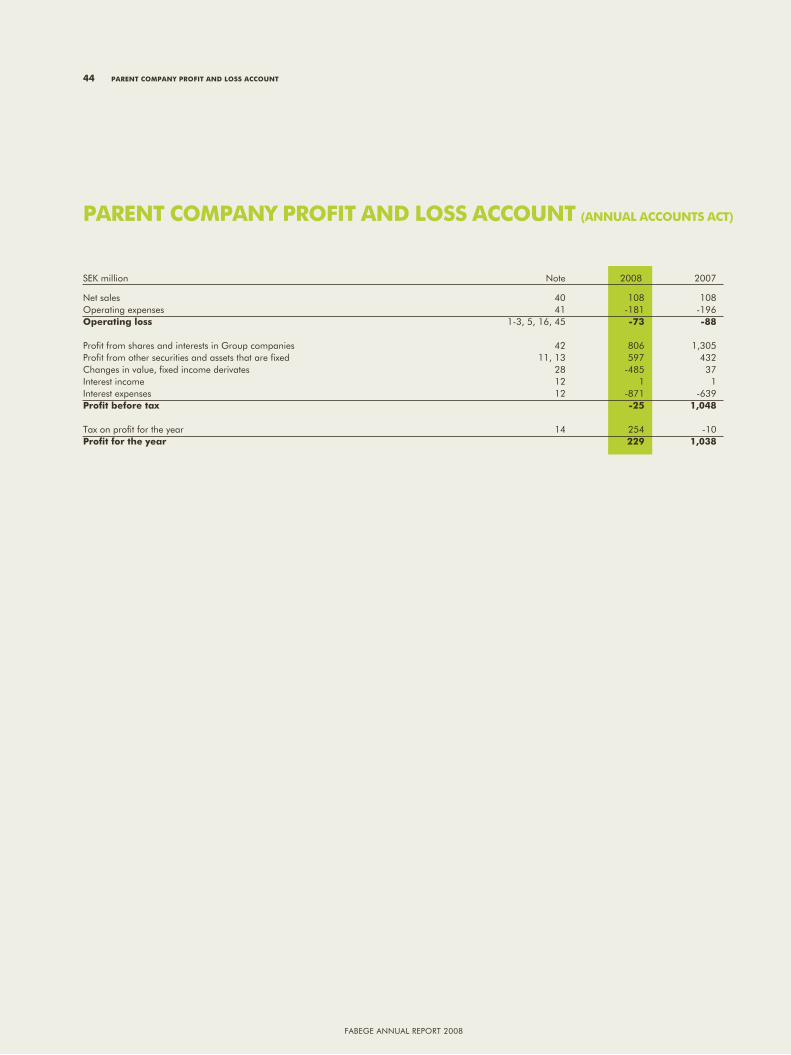
Fabege annual report 2008
parent COMpany prOfit and lOss aCCOunt (annual aCCOunts aCt)
SeK million note 2008 2007
net sales 40 108 108operating expenses 41 -181 -196Operating loss 1-3, 5, 16, 45 -73 -88
profit from shares and interests in group companies 42 806 1,305profit from other securities and assets that are fixed 11, 13 597 432Changes in value, fixed income derivates 28 -485 37Interest income 12 1 1Interest expenses 12 -871 -639profit before tax -25 1,048
tax on profit for the year 14 254 -10profit for the year 229 1,038
44 parent COMpany prOfit and lOss aCCOunt
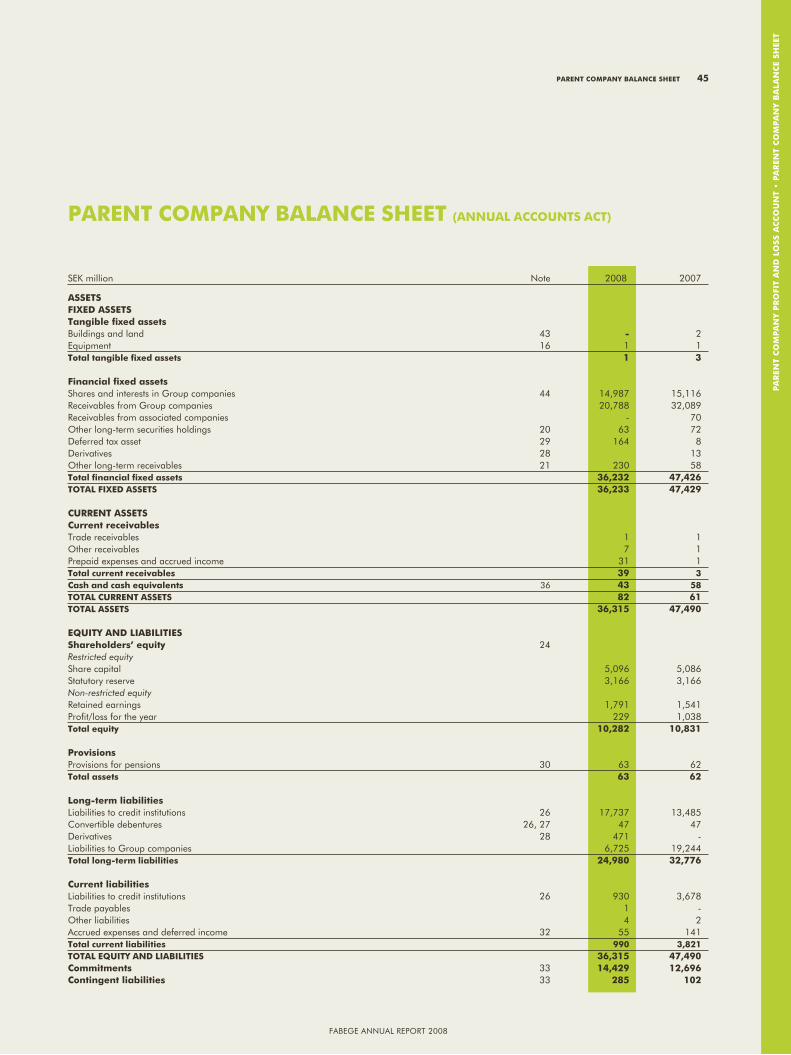
pa
ren
t C
oM
pa
nY p
ro
fit
an
d l
oss a
CC
ou
nt
• p
ar
ent
Co
Mpa
nY B
ala
nC
e sH
eet
Fabege annual report 2008
SeK million note 2008 2007
assetsfixed assets tangible fixed assets buildings and land 43 - 2equipment 16 1 1total tangible fixed assets 1 3 financial fixed assets Shares and interests in group companies 44 14,987 15,116receivables from group companies 20,788 32,089receivables from associated companies - 70other long-term securities holdings 20 63 72Deferred tax asset 29 164 8Derivatives 28 13other long-term receivables 21 230 58total financial fixed assets 36,232 47,426tOtal fixed assets 36,233 47,429 Current assets Current receivablestrade receivables 1 1other receivables 7 1prepaid expenses and accrued income 31 1total current receivables 39 3Cash and cash equivalents 36 43 58tOtal Current assets 82 61tOtal assets 36,315 47,490
equity and liabilities shareholders’ equity 24 Restricted equity Share capital 5,096 5,086Statutory reserve 3,166 3,166Non-restricted equity retained earnings 1,791 1,541profit/loss for the year 229 1,038total equity 10,282 10,831 provisionsprovisions for pensions 30 63 62total assets 63 62
long-term liabilities liabilities to credit institutions 26 17,737 13,485Convertible debentures 26, 27 47 47Derivatives 28 471 -liabilities to group companies 6,725 19,244total long-term liabilities 24,980 32,776
Current liabilities liabilities to credit institutions 26 930 3,678trade payables 1 -other liabilities 4 2accrued expenses and deferred income 32 55 141total current liabilities 990 3,821tOtal equity and liabilities 36,315 47,490Commitments 33 14,429 12,696Contingent liabilities 33 285 102
parent COMpany balanCe sheet (annual aCCOunts aCt)
parent COMpany balanCe sheet 45
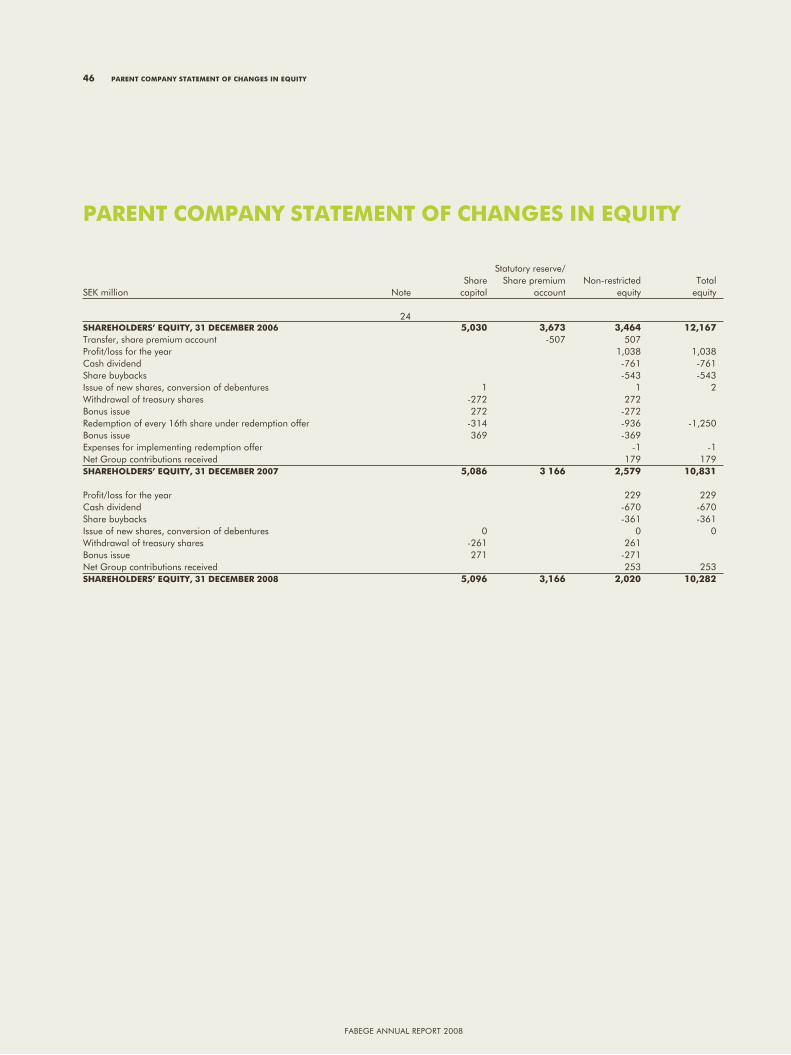
Fabege annual report 2008
Statutory reserve/ Share Share premium non-restricted totalSeK million note capital account equity equity 24 sharehOlders’ equity, 31 deCeMber 2006 5,030 3,673 3,464 12,167 transfer, share premium account -507 507 profit/loss for the year 1,038 1,038 Cash dividend -761 -761 Share buybacks -543 -543 Issue of new shares, conversion of debentures 1 1 2 Withdrawal of treasury shares -272 272 bonus issue 272 -272 redemption of every 16th share under redemption offer -314 -936 -1,250 bonus issue 369 -369 expenses for implementing redemption offer -1 -1 net group contributions received 179 179 sharehOlders’ equity, 31 deCeMber 2007 5,086 3 166 2,579 10,831 profit/loss for the year 229 229 Cash dividend -670 -670 Share buybacks -361 -361 Issue of new shares, conversion of debentures 0 0 0 Withdrawal of treasury shares -261 261 bonus issue 271 -271 net group contributions received 253 253 sharehOlders’ equity, 31 deCeMber 2008 5,096 3,166 2,020 10,282
parent COMpany stateMent Of Changes in equity
46 parent COMpany stateMent Of Changes in equity
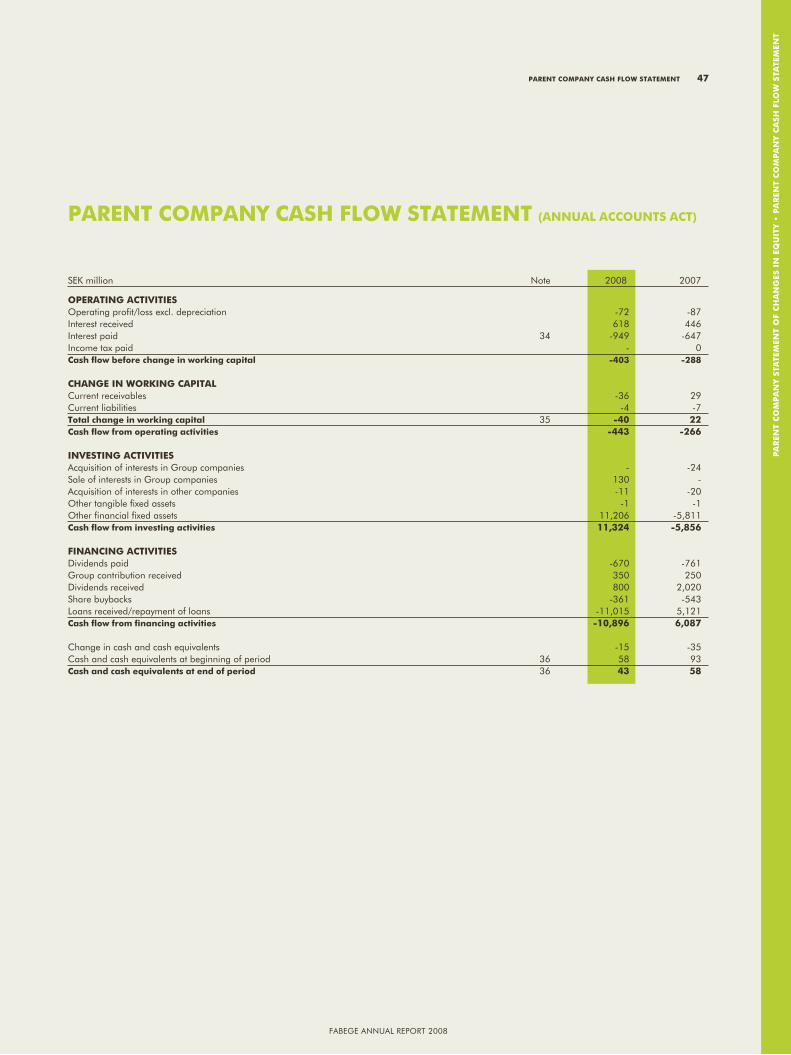
pa
ren
t C
oM
pa
nY s
tate
Men
t o
f C
Ha
nG
es i
n e
Qu
itY •
pa
ren
t C
oM
pa
nY C
asH
flo
W s
tate
Men
t
Fabege annual report 2008
parent COMpany Cash flOw stateMent (annual aCCOunts aCt)
SeK million note 2008 2007
Operating aCtivities operating profit/loss excl. depreciation -72 -87 Interest received 618 446 Interest paid 34 -949 -647 Income tax paid - 0 Cash flow before change in working capital -403 -288 Change in wOrKing Capital Current receivables -36 29 Current liabilities -4 -7 total change in working capital 35 -40 22 Cash flow from operating activities -443 -266 investing aCtivities acquisition of interests in group companies - -24 Sale of interests in group companies 130 -acquisition of interests in other companies -11 -20 other tangible fixed assets -1 -1 other financial fixed assets 11,206 -5,811 Cash flow from investing activities 11,324 -5,856 finanCing aCtivities Dividends paid -670 -761 group contribution received 350 250 Dividends received 800 2,020 Share buybacks -361 -543 loans received/repayment of loans -11,015 5,121 Cash flow from financing activities -10,896 6,087 Change in cash and cash equivalents -15 -35 Cash and cash equivalents at beginning of period 36 58 93 Cash and cash equivalents at end of period 36 43 58
parent COMpany Cash flOw stateMent 47
Fabege annual report 2008
nOte 1 general infOrMatiOnFabege ab (publ), Corporate identity number 556049-1523, with registered office in Stockholm, is the parent company of a corporate group with subsidiary companies, as stated in note 44. the company is registered in Sweden and the address of the company’s head office in Stockholm is: Fabege ab, box 730, 169 27 Solna. Visiting address: Dalvägen 8.
Fabege is one of Sweden’s leading properties companies, with a business that is concentrated to the Stockholm region. the company operates through subsidiaries and its property portfolio consists primarily of commercial premises. nOte 2 aCCOunting prinCiplesthe consolidated financial statements have been prepared in accordance with the Swedish annual accounts act, the International Financial reporting Standards (IFrS), as adopted by the eu, and the interpretations of the International Financial reporting Interpretations Committee (IFrIC), as at December 31, 2008. the group also applies recommendation rFr 1:1 (Supplementary accounting rules for Corporate groups) of the Swedish Financial reporting board, which specifies the supplementary rules that are required in addition to IFrS under provisions contained in the Swedish annual accounts act. the annual accounts of the parent company have been prepared in accordance with the annual accounts act, recommendation rFr 2:1 (accounting for legal entities) of the Swedish Financial reporting board and statements issued by the Swedish Financial reporting board. the parent company’s accounts comply with the group’s principles, except in respect of what is stated below in the section entitled Differences between the accounting principles of the group and the parent company. Items included in the annual accounts have been valued at cost, except in the case of revaluation of investment properties and in respect of financial instruments. the following is a description of some significant accounting principles that have been applied.
Consolidated financial statementsSubsidiariesSubsidiaries are those companies in which the group directly or indirectly holds more than 50 per cent of the votes or in other ways exercises a controlling influence. Controlling influence means that the group has the right to draw up financial and operational strategies. the existence and effect of potential voting rights that can currently be used or converted is taken into account in assessing whether the group exercises a controlling influence. Subsidiaries are included in the consolidated financial statements as of the time when the controlling influence is transferred to the group and are excluded from the consolidated financial statements as of the time when the controlling influence ceases. Subsidiaries are reported in accordance with the acquisition method. acquired identifiable assets, liabilities and contingent liabilities are valued at fair value on the date of acquisition. the surplus, which is defined as the difference between cost and fair value of the acquired interests and the sum of fair value of acquired identifiable assets and liabilities, is recognised as goodwill. If the historical cost is less than the fair value of the acquired subsidiary’s net assets, the difference is recognised directly in the profit and loss account. all inter-company transactions and balances within the group have been eliminated in preparing the consolidated financial statements. In case of the acquisition of a group of assets or net assets that do not constitute an operation, the costs for the group are instead allocated to the individually identifiable assets and liabilities in the group based on their relative fair values at the time of acquisition.
interests in associated companies a company is reported as an associated company if Fabege holds at least 20 per cent and no more than 50 per cent of the votes or
otherwise exercises a significant influence on the company’s operational and financial control. In the consolidated financial statements associated companies are reported in accordance with the equity method. Interests in associated companies are recognised at cost in the balance sheet after adjusting for changes in the group’s share of the associated company’s net assets, less any decrease in the fair value of individual interests. In transactions among group companies and associated companies that part of unrealised gains and losses which represents the group’s share of the associated company is eliminated, except as regards unrealised losses that are due to impairment of an assigned asset.
Joint venturesFor companies that are 50 per cent owned in which Fabege exercises a joint controlling influence together with another party, the company’s assets, liabilities, income and expenses have been included in the consolidated financial statements in proportion to Fabege’s ownership share (proportionate consolidation). In transactions between the group and a joint venture that part of unrealised gains and losses which represents the group’s share of the jointly controlled company is eliminated.
Minority interestMinority interest consists of the market value of minority interests in net assets for subsidiaries that were included in the consolidated financial statements at the time of the original acquisition and the minority owners’ share of changes in equity after the acquisition.
reporting of income all investment properties are let to tenants under operating leases. rental income from the company’s property management activities is recognised in the period to which it refers. gains or losses from the sale of properties are recognised on the date of contract unless the purchase contract contains special provisions which prohibit this. rental income for investment properties is recognised on a straight-line basis in accordance with the terms and conditions of the applicable leases. In cases where the lease provides for a discounted rent during a certain period that is offset by a higher rent at other times, the resulting deficit or surplus is distributed over the term of the lease.
Interest income is distributed over the term of the contract. Dividends on shares are recognised when the shareholder’s right to receive payment is deemed to be secure.
leasing – fabege as lesseeleases in which the risks and benefits associated with ownership of the assets are in all material respects are borne by the lessor are classified as operating leases. all of the group’s leases are classified as operating leases. lease payments are recognised as an expense in the profit and loss account and distributed across the term of the lease on a straight-line basis.
investment propertiesall properties in the group are classified as investment properties, as they are held for the purpose of earning rental income or for capital appreciation or a combination of the two.
the concept of investment property includes buildings, land and land improvements, new builds, extensions or conversions in progress and property fixtures.
Investment properties are recognised at fair value at the balance sheet date. gains and losses attributable to changes in fair value of investment properties are recognised in the period in which they arise in the income and expense item unrealised changes in value, investment properties.
gains or losses from the sale or disposal of investment properties consist of the difference between the selling price and carrying amount
nOtes(SeK million, unless otherwise specified)
48 nOtes
Fabege annual report 2008
Fabege annual report 2008
nO
tes
based on the most recent revaluation to fair value. gains or losses from sales or disposals are recognised in the income and expense item realised changes in value, investment properties. projects involving conversion/maintenance and adaptations for tenants are recognised as an asset to the extent that the measure adds value in relation to the latest value. other expenses are charged to expense immediately. In case of major new builds, extensions and conversions, interest expenses are recognised as assets over the period of production. Sales and acquisitions of properties are recognised at the time when the risks and benefits associated with ownership are transferred to the buyer or seller, which is normally on the contract date.
tangible fixed assetsequipment is recognised at cost less accumulated depreciation and any impairment. Depreciation of equipment is expensed by writing off the value of the asset on a straight-line basis over its estimated period of use.
impairmentIn case of an indication of a decrease in the value of an asset (excluding investment properties and financial instruments, which are valued at fair value), the recoverable amount of the asset is determined. If the carrying amount of the asset exceeds the recoverable amount, the asset is written down to this value. recoverable amount is defined as the higher of market value and value in use. Value in use is defined as the present value of estimated future payments generated by the asset.
loan expensesIn the consolidated financial statements loan expenses have been charged to earnings in the year to which they refer, except to the extent that they have been included in the historical cost of a building project. the interest rate used to calculate the capitalised borrowing cost is the average interest rate of the loan portfolio. In the accounts of individual companies the main principle, that all loan expenses should be charged to expense in the year to which they refer, has been applied.
income tax the income and expense item tax on profit for the year includes current and deferred income tax for Swedish and foreign group units. the current tax liability is based on the taxable profit for the year. taxable profit for the year differs from reported profit for the year in that it has been adjusted for non-taxable and non-deductible items. the group’s current tax liability is calculated on the basis of tax rates that have been prescribed or announced on the balance sheet date.
Deferred tax refers to tax on temporary differences that arise between the carrying amounts of assets and the tax bases used in calculating the taxable profit. Deferred tax is reported in accordance with the balance sheet liability method. Deferred tax liabilities are recognised for practically all taxable temporary differences, and deferred tax assets are recognised when it is likely that the amounts can be used to offset future taxable profits. the carrying amount of deferred tax assets is tested for impairment at the end of each financial year and an impairment loss is recognised to the extent that it is no longer probable that sufficient taxable profits will be available against which the deferred tax asset can be fully or partially offset. Deferred tax is recognised at the nominal current tax rate with no discount. Deferred tax is recognised as an income or expense in the profit and loss account, except in those cases where it refers to transactions or events that have been recognised directly in equity. In such cases the deferred tax is also recognised directly in equity.
Deferred tax assets and tax liabilities are offset against one another when they refer to income tax payable to the same tax authority and when the group intends to settle the tax by paying the net amount.
foreign currenciestransactions in foreign currencies are translated, upon inclusion in the accounts, to the functional currency at the exchange rates applying on the transaction date. Monetary assets and liabilities in foreign currencies are translated on the balance sheet date at the exchange rates applying on the balance sheet date. any resulting exchange rate differences are recognised in the profit and loss account for the period.
In preparing consolidated financial statements, the balance sheets of the group’s foreign businesses are translated from their functional currencies into Swedish kronor based on the exchange rates applying on the balance sheet date. Income and expense items are translated at the average exchange rate for the period. any translation differences that arise are recognised in equity and transferred to the group’s translation reserve. the accumulated translation difference is transferred and reported as part of a capital gain or loss in cases where the foreign business is divested.
Cash flow statement Fabege reports cash flows from the company’s main sources of income: net operating income from the property management business and gains from property sales in the company’s operating activities.
information about related parties For information about the company’s transactions with related parties, see note 5 in respect of compensation to senior executives and note 37 for other related-party transactions.
provisions and contingent liabilities provisions are recognised when the company has a commitment and it is likely that an outflow of resources will be required and the amount can be reliably estimated.
Contingent liabilities are recognised if there exists a possible commitment that is confirmed only by several uncertain future events and it is not likely that an outflow of resources will be required or that the size of the commitment can be calculated with sufficient accuracy.
financial instrumentsa financial asset or financial liability is recognised in the balance sheet when the company becomes a party to the commercial terms and conditions of the instrument. a financial asset is removed from the balance sheet when the rights inherent in the agreement are realised or expire or if the company loses control over them. a financial liability is removed from the balance sheet when the obligation arising from the agreement has been met or ceased for other reasons.
transaction date accounting is used for derivatives while settlement date accounting is used for spot purchases and sales of financial assets.
In connection with each financial report the company assesses whether there are objective indications of impairment of financial assets or groups of financial assets.
Financial instruments are recognised at amortised cost or fair value, depending on the initial categorisation under IaS 39.
Calculation of fair value of financial instrumentsFair value of derivatives and loan liabilities is determined by discounting future cash flows by the quoted market interest rate for each maturity. Future cash flows in the derivatives portfolio are calculated as the difference between the fixed contractual interest under each derivatives contract and the implied Stockholm Interbank offered rate (StIbor) for the period concerned. the present value of the future interest flows arising therefrom is calculated using the implied StIbor curve. For the callable swaps included in the portfolio the option component has not been assigned a value, as the swaps can only be called at par value and thus do not have an impact on earnings. Decisions to call swaps are made by the banks.
nOtes 49
Fabege annual report 2008
Fabege annual report 2008
Shareholdings have been categorised as “financial assets held for trading”. these are valued at fair value and changes in value are recognised in the profit and loss account. Quoted market prices are used in determining the fair value of shareholdings. Where such prices are not available fair value is established using the company’s own valuation technique. For all financial assets and liabilities, unless otherwise stated in the notes, the carrying amount is considered to be a good approximation of fair value.
set-off of financial assets and liabilities Financial assets and liabilities are offset against each other and the net amount is recognised in the balance sheet when there is a legal right of set-off and there is an intention to settle the items by a net amount or to simultaneously realise the asset and settle the liability.
Cash and cash equivalentsCash and cash equivalents consist of cash assets held at financial institutions. the item also includes short-term investments that have amaturity from the time of acquisition of less than three months andthat are exposed to insignificant risk of fluctuations in value. Cashand cash equivalents are recognised at their nominal amounts.
trade receivablestrade receivables are categorised as “loans and receivables”, which means that the item is recognised at amortised cost. Fabege’s trade receivables are recognised at the amount that is expected to be received after deducting for uncertain receivables, which are assessed individually. the expected maturity of a trade receivable is short, and the value is therefore recognised at the nominal amount with no discount. Impairment of trade receivables is recognised in operating expenses.
long-term receivables and other receivableslong-term receivables and other (current) receivables primarily consist of promissory note receivables relating to sales proceeds for properties that have been sold but not yet vacated. these items are categorised as “loans and receivables”, which means that the items are recognised at amortised cost. receivables are recognised at the amount that is expected to be received after deducting for uncertain receivables, which are assessed individually. receivables with short maturities are recognised at nominal amounts with no discount.
derivatives Fabege does not apply hedge accounting of derivatives and therefore categorises derivatives as “Financial assets or financial liabilities that are held for trading purposes”. assets and liabilities in these categories are valued at fair value and changes in value are recognised in the profit and loss account.
trade payablestrade payables are categorised as “other liabilities”, which means that the item is recognised at amortised cost. the expected maturity of a trade payable is short, and the liability is therefore recognised at the nominal amount with no discount.
issued convertible bondsConvertible bonds are recognised as a compound financial instrument consisting of a debt component and an equity component. the break-down of the value into these components is made by calculating the fair value of the liability and assuming that the residual item represents the value of the equity component. the debt component is then recognised at amortised cost. transactions incurred in connection with the issue of a compound financial instrument must be divided into debt and equity
components in proportion to the breakdown of the proceeds of the issue.the interest on the current convertible bonds was 5.25 per cent,
which was higher than the market interest rate, as Fabege’s average borrowing rate at the time (1 oct 2004) was 4.35 per cent. For that reason no breakdown by equity component has been recognised as at 31 December 2008.
Other liabilitiesFabege’s liabilities to credit institutions and holders of commercial paper and other liabilities are categorised as “other liabilities” and valued at amortised cost. long-term liabilities have an expected maturity of more than 1 year while current liabilities have a maturity of less than 1 year.
Compensation to employees Compensation to employees in the form of salaries, holiday pay, paid sick leave, etc. as well as pensions are recognised as it is earned. pensions and other compensation paid after termination of employment are classified as defined contribution or defined benefit pension schemes. the group has both defined contribution and defined benefit pension plans. pension costs for defined contribution plans are charged to expense as they are incurred. For defined benefit plans the present value of the pension liability is calculated using an actuarial method known as the projected unit credit method. actuarial gains and losses are recognised in the profit and loss account to the extent that they exceed the higher of 10 per cent of the group’s pension assets and liabilities at the beginning of the reporting period. amounts outside this corridor are recognised in the profit and loss account during the employees’ estimated average remaining period of service. employees in the former Fabege have defined benefit pension schemes. as of 2005 no further accrual of this pension liability has been made.
differences between the accounting principles of the group and the parent company accounting principlesthe accounts of the parent company are prepared in accordance withthe annual accounts act, recommendation rFr 1:1 (accounting forlegal entities) of the Swedish Financial accounting Standards Counciland statements issued by the Swedish Finacial reporting borad. tax laws in Sweden allow companies to defer tax payments by making allocations to untaxed reserves in the balance sheet via the income and expense item appropriations. In the consolidated balance sheet these are treated as temporary differences, i.e. a breakdown is made between deferred tax liability and equity. Changes in untaxed reserves are recognised in the consolidated profit and loss account and broken down into deferred tax and profit for the year. Interest during the building period that is included in the cost of the building is only recognised in the consolidated financial statements.
group contributions and shareholder contributions are reported in accordance with Statement uFr 2 of the Swedish Financial reporting board. this means that group contributions and shareholder contributions are recognised based on their economic significance. the contributions are reported as a capital transfer, i.e. as a decrease or increase of unrestricted equity. the consequence of this accounting principle is that only tax that is attributable to income and expense items is recognised in the profit and loss account.
Defined benefit and defined contribution pension schemes are reported in accordance with hitherto applicable Swedish accounting standards, which are based on the provisions of the pension obligations Vesting act (tryggandelagen).
50 nOtes
Fabege annual report 2008
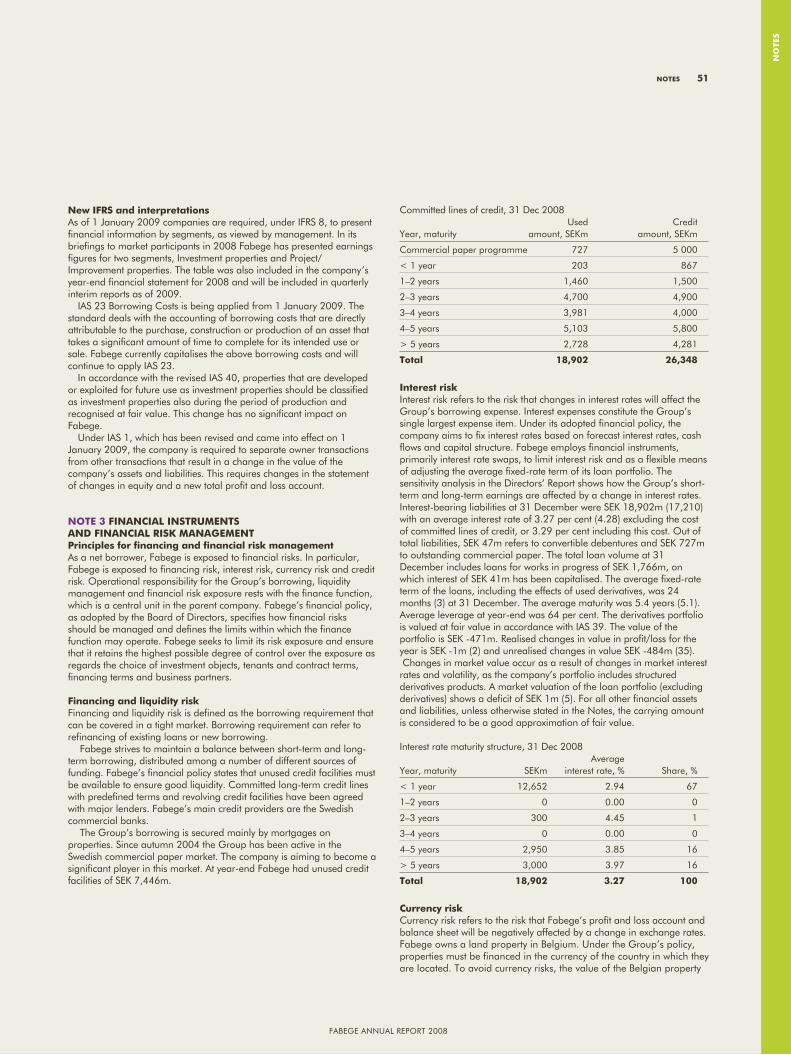
Fabege annual report 2008
nO
tes
new ifrs and interpretationsas of 1 January 2009 companies are required, under IFrS 8, to present financial information by segments, as viewed by management. In its briefings to market participants in 2008 Fabege has presented earnings figures for two segments, Investment properties and project/Improvement properties. the table was also included in the company’s year-end financial statement for 2008 and will be included in quarterly interim reports as of 2009. IaS 23 borrowing Costs is being applied from 1 January 2009. the standard deals with the accounting of borrowing costs that are directly attributable to the purchase, construction or production of an asset that takes a significant amount of time to complete for its intended use or sale. Fabege currently capitalises the above borrowing costs and will continue to apply IaS 23. In accordance with the revised IaS 40, properties that are developed or exploited for future use as investment properties should be classified as investment properties also during the period of production and recognised at fair value. this change has no significant impact on Fabege. under IaS 1, which has been revised and came into effect on 1 January 2009, the company is required to separate owner transactions from other transactions that result in a change in the value of the company’s assets and liabilities. this requires changes in the statement of changes in equity and a new total profit and loss account. nOte 3 finanCial instruMents and finanCial risK ManageMent principles for financing and financial risk management as a net borrower, Fabege is exposed to financial risks. In particular, Fabege is exposed to financing risk, interest risk, currency risk and credit risk. operational responsibility for the group’s borrowing, liquidity management and financial risk exposure rests with the finance function, which is a central unit in the parent company. Fabege’s financial policy, as adopted by the board of Directors, specifies how financial risks should be managed and defines the limits within which the finance function may operate. Fabege seeks to limit its risk exposure and ensure that it retains the highest possible degree of control over the exposure as regards the choice of investment objects, tenants and contract terms, financing terms and business partners.
financing and liquidity riskFinancing and liquidity risk is defined as the borrowing requirement that can be covered in a tight market. borrowing requirement can refer to refinancing of existing loans or new borrowing.
Fabege strives to maintain a balance between short-term and long-term borrowing, distributed among a number of different sources of funding. Fabege’s financial policy states that unused credit facilities must be available to ensure good liquidity. Committed long-term credit lines with predefined terms and revolving credit facilities have been agreed with major lenders. Fabege’s main credit providers are the Swedish commercial banks.
the group’s borrowing is secured mainly by mortgages on properties. Since autumn 2004 the group has been active in the Swedish commercial paper market. the company is aiming to become a significant player in this market. at year-end Fabege had unused credit facilities of SeK 7,446m.
Committed lines of credit, 31 Dec 2008 used CreditYear, maturity amount, SeKm amount, SeKm
Commercial paper programme 727 5 000
< 1 year 203 867
1–2 years 1,460 1,500
2–3 years 4,700 4,900
3–4 years 3,981 4,000
4–5 years 5,103 5,800
> 5 years 2,728 4,281
total 18,902 26,348
interest riskInterest risk refers to the risk that changes in interest rates will affect the group’s borrowing expense. Interest expenses constitute the group’s single largest expense item. under its adopted financial policy, the company aims to fix interest rates based on forecast interest rates, cash flows and capital structure. Fabege employs financial instruments, primarily interest rate swaps, to limit interest risk and as a flexible means of adjusting the average fixed-rate term of its loan portfolio. the sensitivity analysis in the Directors’ report shows how the group’s short-term and long-term earnings are affected by a change in interest rates. Interest-bearing liabilities at 31 December were SeK 18,902m (17,210) with an average interest rate of 3.27 per cent (4.28) excluding the cost of committed lines of credit, or 3.29 per cent including this cost. out of total liabilities, SeK 47m refers to convertible debentures and SeK 727m to outstanding commercial paper. the total loan volume at 31 December includes loans for works in progress of SeK 1,766m, on which interest of SeK 41m has been capitalised. the average fixed-rate term of the loans, including the effects of used derivatives, was 24 months (3) at 31 December. the average maturity was 5.4 years (5.1). average leverage at year-end was 64 per cent. the derivatives portfolio is valued at fair value in accordance with IaS 39. the value of the portfolio is SeK -471m. realised changes in value in profit/loss for theyear is SeK -1m (2) and unrealised changes in value SeK -484m (35). Changes in market value occur as a result of changes in market interest rates and volatility, as the company’s portfolio includes structured derivatives products. a market valuation of the loan portfolio (excluding derivatives) shows a deficit of SeK 1m (5). For all other financial assets and liabilities, unless otherwise stated in the notes, the carrying amount is considered to be a good approximation of fair value.
Interest rate maturity structure, 31 Dec 2008 averageYear, maturity SeKm interest rate, % Share, %
< 1 year 12,652 2.94 67
1–2 years 0 0.00 0
2–3 years 300 4.45 1
3–4 years 0 0.00 0
4–5 years 2,950 3.85 16
> 5 years 3,000 3.97 16
total 18,902 3.27 100
Currency riskCurrency risk refers to the risk that Fabege’s profit and loss account and balance sheet will be negatively affected by a change in exchange rates. Fabege owns a land property in belgium. under the group’s policy, properties must be financed in the currency of the country in which they are located. to avoid currency risks, the value of the belgian property
nOtes 51
Fabege annual report 2008
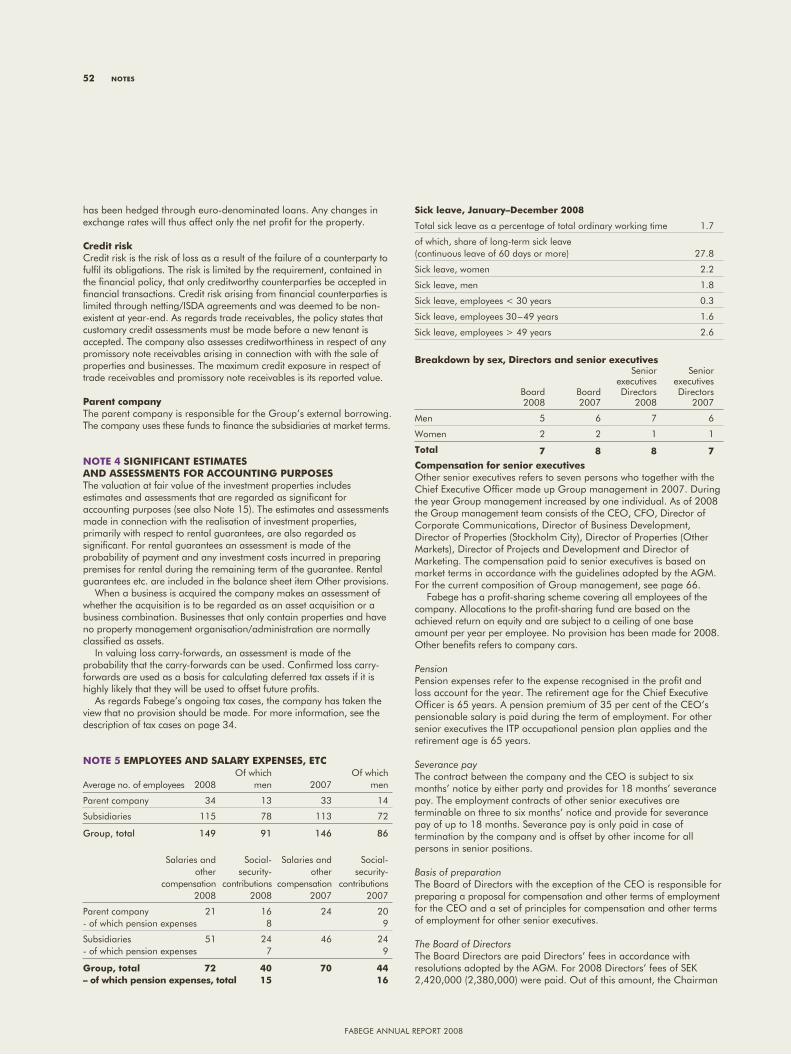
Fabege annual report 2008
has been hedged through euro-denominated loans. any changes in exchange rates will thus affect only the net profit for the property.
Credit riskCredit risk is the risk of loss as a result of the failure of a counterparty to fulfil its obligations. the risk is limited by the requirement, contained in the financial policy, that only creditworthy counterparties be accepted in financial transactions. Credit risk arising from financial counterparties is limited through netting/ISDa agreements and was deemed to be non-existent at year-end. as regards trade receivables, the policy states that customary credit assessments must be made before a new tenant is accepted. the company also assesses creditworthiness in respect of any promissory note receivables arising in connection with with the sale of properties and businesses. the maximum credit exposure in respect of trade receivables and promissory note receivables is its reported value.
parent companythe parent company is responsible for the group’s external borrowing. the company uses these funds to finance the subsidiaries at market terms.
nOte 4 signifiCant estiMates and assessMents fOr aCCOunting purpOsesthe valuation at fair value of the investment properties includes estimates and assessments that are regarded as significant for accounting purposes (see also note 15). the estimates and assessments made in connection with the realisation of investment properties, primarily with respect to rental guarantees, are also regarded as significant. For rental guarantees an assessment is made of the probability of payment and any investment costs incurred in preparing premises for rental during the remaining term of the guarantee. rental guarantees etc. are included in the balance sheet item other provisions.
When a business is acquired the company makes an assessment of whether the acquisition is to be regarded as an asset acquisition or a business combination. businesses that only contain properties and have no property management organisation/administration are normally classified as assets.
In valuing loss carry-forwards, an assessment is made of the probability that the carry-forwards can be used. Confirmed loss carry-forwards are used as a basis for calculating deferred tax assets if it is highly likely that they will be used to offset future profits.
as regards Fabege’s ongoing tax cases, the company has taken the view that no provision should be made. For more information, see the description of tax cases on page 34.
nOte 5 eMplOyees and salary expenses, etC of which of whichaverage no. of employees 2008 men 2007 men
parent company 34 13 33 14
Subsidiaries 115 78 113 72
group, total 149 91 146 86
Salaries and Social- Salaries and Social- other security- other security- compensation contributions compensation contributions 2008 2008 2007 2007
parent company 21 16 24 20 - of which pension expenses 8 9
Subsidiaries 51 24 46 24 - of which pension expenses 7 9
group, total 72 40 70 44– of which pension expenses, total 15 16
sick leave, January–december 2008
total sick leave as a percentage of total ordinary working time 1.7
of which, share of long-term sick leave (continuous leave of 60 days or more) 27.8
Sick leave, women 2.2
Sick leave, men 1.8
Sick leave, employees < 30 years 0.3
Sick leave, employees 30–49 years 1.6
Sick leave, employees > 49 years 2.6
breakdown by sex, directors and senior executives Senior Senior executives executives board board Directors Directors 2008 2007 2008 2007
Men 5 6 7 6
Women 2 2 1 1
total 7 8 8 7
Compensation for senior executivesother senior executives refers to seven persons who together with the Chief executive officer made up group management in 2007. During the year group management increased by one individual. as of 2008 the group management team consists of the Ceo, CFo, Director of Corporate Communications, Director of business Development, Director of properties (Stockholm City), Director of properties (other Markets), Director of projects and Development and Director of Marketing. the compensation paid to senior executives is based on market terms in accordance with the guidelines adopted by the agM. For the current composition of group management, see page 66.
Fabege has a profit-sharing scheme covering all employees of the company. allocations to the profit-sharing fund are based on the achieved return on equity and are subject to a ceiling of one base amount per year per employee. no provision has been made for 2008. other benefits refers to company cars.
Pensionpension expenses refer to the expense recognised in the profit and loss account for the year. the retirement age for the Chief executive officer is 65 years. a pension premium of 35 per cent of the Ceo’s pensionable salary is paid during the term of employment. For other senior executives the Itp occupational pension plan applies and the retirement age is 65 years.
Severance paythe contract between the company and the Ceo is subject to six months’ notice by either party and provides for 18 months’ severance pay. the employment contracts of other senior executives are terminable on three to six months’ notice and provide for severance pay of up to 18 months. Severance pay is only paid in case of termination by the company and is offset by other income for all persons in senior positions.
Basis of preparationthe board of Directors with the exception of the Ceo is responsible for preparing a proposal for compensation and other terms of employment for the Ceo and a set of principles for compensation and other terms of employment for other senior executives.
The Board of Directorsthe board Directors are paid Directors’ fees in accordance with resolutions adopted by the agM. For 2008 Directors’ fees of SeK 2,420,000 (2,380,000) were paid. out of this amount, the Chairman
52 nOtes
Fabege annual report 2008
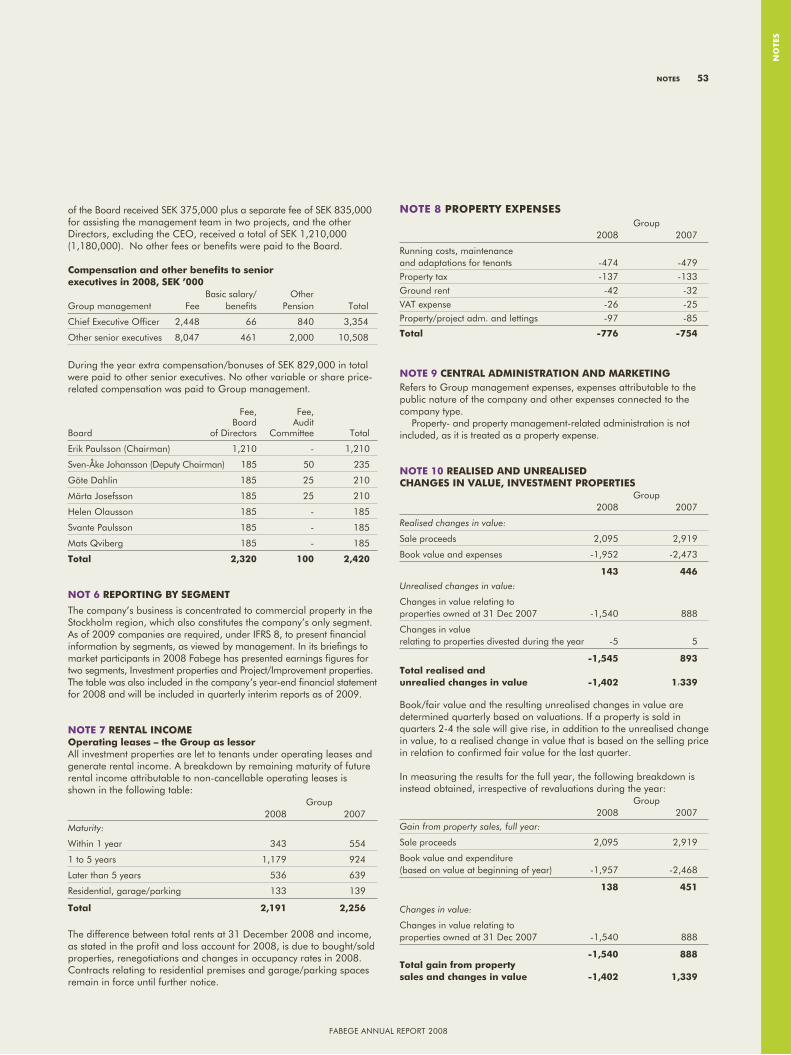
Fabege annual report 2008
nO
tes
of the board received SeK 375,000 plus a separate fee of SeK 835,000 for assisting the management team in two projects, and the other Directors, excluding the Ceo, received a total of SeK 1,210,000 (1,180,000). no other fees or benefits were paid to the board.
Compensation and other benefits to senior executives in 2008, seK ’000 basic salary/ other group management Fee benefits pension total
Chief executive officer 2,448 66 840 3,354
other senior executives 8,047 461 2,000 10,508
During the year extra compensation/bonuses of SeK 829,000 in total were paid to other senior executives. no other variable or share price-related compensation was paid to group management.
Fee, Fee, board audit board of Directors Committee total
erik paulsson (Chairman) 1,210 - 1,210
Sven-Åke Johansson (Deputy Chairman) 185 50 235
göte Dahlin 185 25 210
Märta Josefsson 185 25 210
Helen olausson 185 - 185
Svante paulsson 185 - 185
Mats Qviberg 185 - 185
total 2,320 100 2,420 nOt 6 repOrting by segMent
the company’s business is concentrated to commercial property in the Stockholm region, which also constitutes the company’s only segment.as of 2009 companies are required, under IFrS 8, to present financial information by segments, as viewed by management. In its briefings to market participants in 2008 Fabege has presented earnings figures for two segments, Investment properties and project/Improvement properties.the table was also included in the company’s year-end financial statement for 2008 and will be included in quarterly interim reports as of 2009. nOte 7 rental inCOMeOperating leases – the group as lessorall investment properties are let to tenants under operating leases and generate rental income. a breakdown by remaining maturity of future rental income attributable to non-cancellable operating leases is shown in the following table: group 2008 2007Maturity:
Within 1 year 343 554
1 to 5 years 1,179 924
later than 5 years 536 639
residential, garage/parking 133 139
total 2,191 2,256
the difference between total rents at 31 December 2008 and income, as stated in the profit and loss account for 2008, is due to bought/sold properties, renegotiations and changes in occupancy rates in 2008. Contracts relating to residential premises and garage/parking spaces remain in force until further notice.
nOte 8 prOperty expenses group 2008 2007
running costs, maintenance and adaptations for tenants -474 -479property tax -137 -133ground rent -42 -32Vat expense -26 -25property/project adm. and lettings -97 -85
total -776 -754
nOte 9 Central adMinistratiOn and MarKetingrefers to group management expenses, expenses attributable to the public nature of the company and other expenses connected to the company type.
property- and property management-related administration is not included, as it is treated as a property expense. nOte 10 realised and unrealised Changes in value, investMent prOperties group 2008 2007
Realised changes in value:
Sale proceeds 2,095 2,919
book value and expenses -1,952 -2,473
143 446
Unrealised changes in value:
Changes in value relating to properties owned at 31 Dec 2007 -1,540 888
Changes in value relating to properties divested during the year -5 5
-1,545 893total realised and unrealied changes in value -1,402 1,339 book/fair value and the resulting unrealised changes in value are determined quarterly based on valuations. If a property is sold in quarters 2-4 the sale will give rise, in addition to the unrealised change in value, to a realised change in value that is based on the selling price in relation to confirmed fair value for the last quarter.
In measuring the results for the full year, the following breakdown is instead obtained, irrespective of revaluations during the year: group 2008 2007Gain from property sales, full year:
Sale proceeds 2,095 2,919
book value and expenditure (based on value at beginning of year) -1,957 -2,468
138 451
Changes in value:
Changes in value relating to properties owned at 31 Dec 2007 -1,540 888
-1,540 888total gain from property sales and changes in value -1,402 1,339
nOtes 53
Fabege annual report 2008
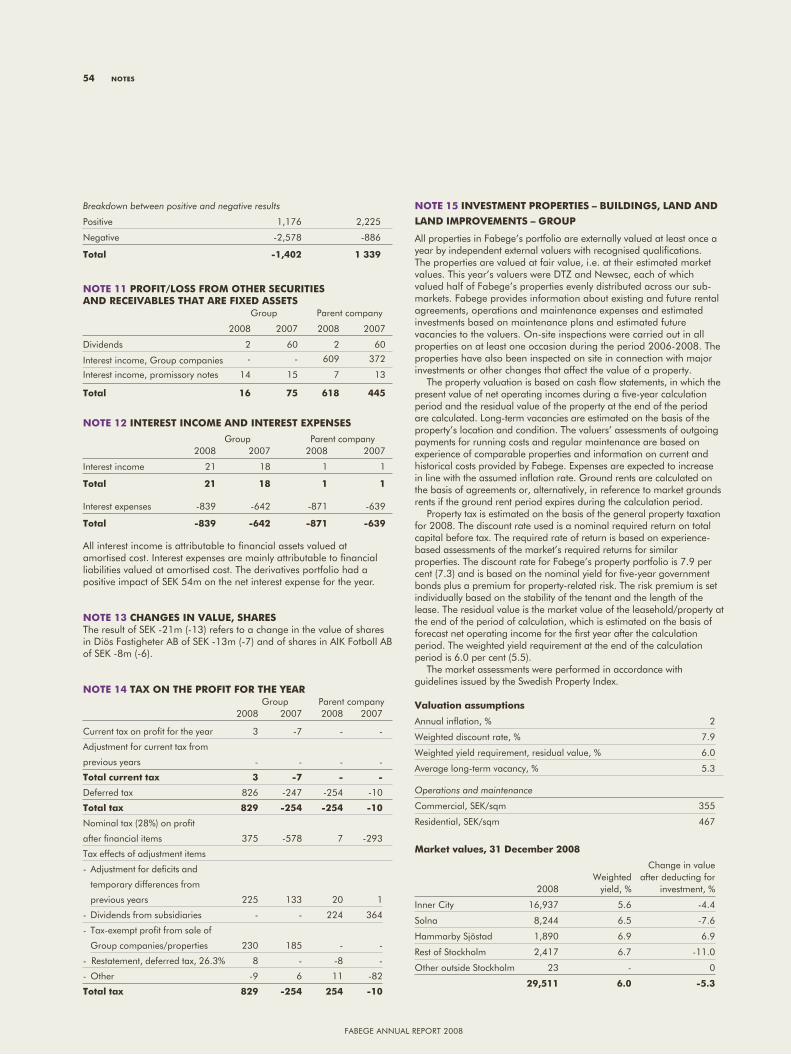
Fabege annual report 2008
Breakdown between positive and negative results
positive 1,176 2,225
negative -2,578 -886
total -1,402 1 339
nOte 11 prOfit/lOss frOM Other seCurities and reCeivables that are fixed assets group parent company
2008 2007 2008 2007
Dividends 2 60 2 60
Interest income, group companies - - 609 372
Interest income, promissory notes 14 15 7 13
total 16 75 618 445
nOte 12 interest inCOMe and interest expenses
group parent company 2008 2007 2008 2007
Interest income 21 18 1 1
total 21 18 1 1 Interest expenses -839 -642 -871 -639
total -839 -642 -871 -639
all interest income is attributable to financial assets valued at amortised cost. Interest expenses are mainly attributable to financial liabilities valued at amortised cost. the derivatives portfolio had a positive impact of SeK 54m on the net interest expense for the year. nOte 13 Changes in value, sharesthe result of SeK -21m (-13) refers to a change in the value of shares in Diös Fastigheter ab of SeK -13m (-7) and of shares in aIK Fotboll ab of SeK -8m (-6). nOte 14 tax On the prOfit fOr the year group parent company 2008 2007 2008 2007
Current tax on profit for the year 3 -7 - -
adjustment for current tax from
previous years - - - -
total current tax 3 -7 - -
Deferred tax 826 -247 -254 -10
total tax 829 -254 -254 -10
nominal tax (28%) on profit
after financial items 375 -578 7 -293
tax effects of adjustment items
- adjustment for deficits and
temporary differences from
previous years 225 133 20 1
- Dividends from subsidiaries - - 224 364
- tax-exempt profit from sale of
group companies/properties 230 185 - -
- restatement, deferred tax, 26.3% 8 - -8 -
- other -9 6 11 -82
total tax 829 -254 254 -10
nOte 15 investMent prOperties – buildings, land and
land iMprOveMents – grOup
all properties in Fabege’s portfolio are externally valued at least once a year by independent external valuers with recognised qualifications. the properties are valued at fair value, i.e. at their estimated market values. this year’s valuers were DtZ and newsec, each of which valued half of Fabege’s properties evenly distributed across our sub-markets. Fabege provides information about existing and future rental agreements, operations and maintenance expenses and estimated investments based on maintenance plans and estimated future vacancies to the valuers. on-site inspections were carried out in all properties on at least one occasion during the period 2006-2008. the properties have also been inspected on site in connection with major investments or other changes that affect the value of a property.
the property valuation is based on cash flow statements, in which the present value of net operating incomes during a five-year calculation period and the residual value of the property at the end of the period are calculated. long-term vacancies are estimated on the basis of the property’s location and condition. the valuers’ assessments of outgoing payments for running costs and regular maintenance are based on experience of comparable properties and information on current and historical costs provided by Fabege. expenses are expected to increase in line with the assumed inflation rate. ground rents are calculated on the basis of agreements or, alternatively, in reference to market grounds rents if the ground rent period expires during the calculation period.
property tax is estimated on the basis of the general property taxation for 2008. the discount rate used is a nominal required return on total capital before tax. the required rate of return is based on experience-based assessments of the market’s required returns for similar properties. the discount rate for Fabege’s property portfolio is 7.9 per cent (7.3) and is based on the nominal yield for five-year government bonds plus a premium for property-related risk. the risk premium is set individually based on the stability of the tenant and the length of the lease. the residual value is the market value of the leasehold/property at the end of the period of calculation, which is estimated on the basis of forecast net operating income for the first year after the calculation period. the weighted yield requirement at the end of the calculation period is 6.0 per cent (5.5).
the market assessments were performed in accordance with guidelines issued by the Swedish property Index.
valuation assumptions
annual inflation, % 2
Weighted discount rate, % 7.9
Weighted yield requirement, residual value, % 6.0
average long-term vacancy, % 5.3
Operations and maintenance
Commercial, SeK/sqm 355
residential, SeK/sqm 467
Market values, 31 december 2008
Change in value Weighted after deducting for 2008 yield, % investment, %
Inner City 16,937 5.6 -4.4
Solna 8,244 6.5 -7.6
Hammarby Sjöstad 1,890 6.9 6.9
rest of Stockholm 2,417 6.7 -11.0
other outside Stockholm 23 - 0
29,511 6.0 -5.3
54 nOtes
Fabege annual report 2008
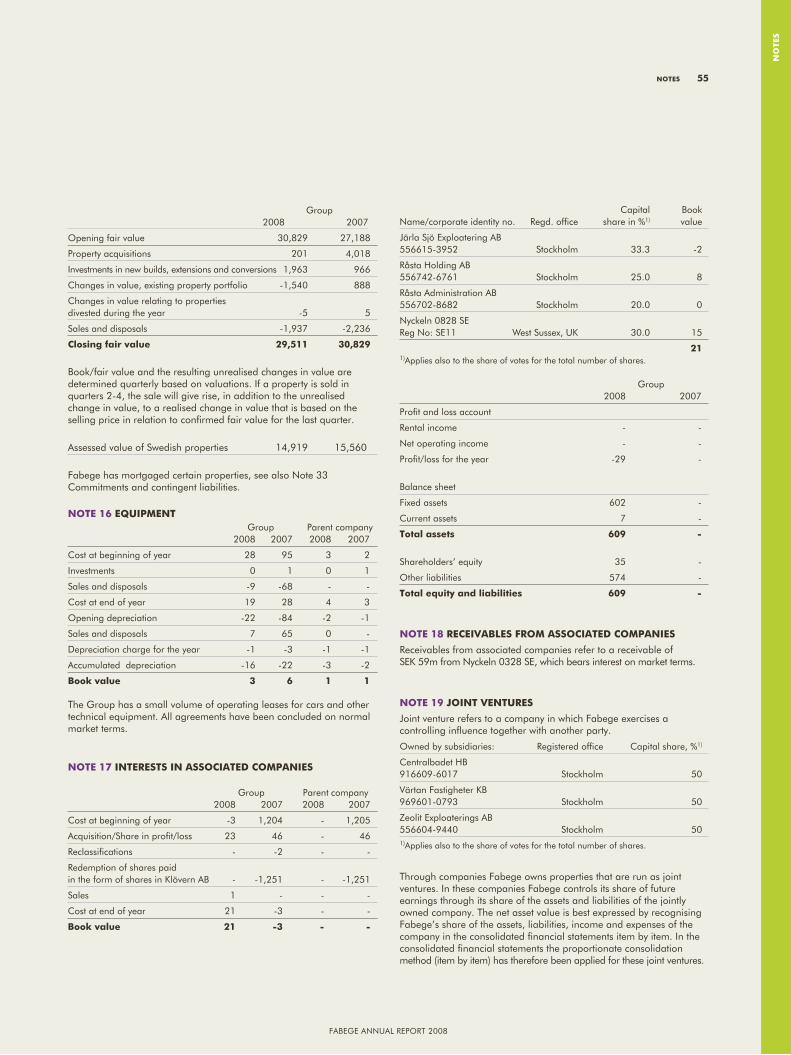
Fabege annual report 2008
nO
tes
group 2008 2007
opening fair value 30,829 27,188
property acquisitions 201 4,018
Investments in new builds, extensions and conversions 1,963 966
Changes in value, existing property portfolio -1,540 888
Changes in value relating to properties divested during the year -5 5
Sales and disposals -1,937 -2,236
Closing fair value 29,511 30,829
book/fair value and the resulting unrealised changes in value are determined quarterly based on valuations. If a property is sold in quarters 2-4, the sale will give rise, in addition to the unrealised change in value, to a realised change in value that is based on the selling price in relation to confirmed fair value for the last quarter.
assessed value of Swedish properties 14,919 15,560
Fabege has mortgaged certain properties, see also note 33 Commitments and contingent liabilities.
nOte 16 equipMent group parent company 2008 2007 2008 2007
Cost at beginning of year 28 95 3 2
Investments 0 1 0 1
Sales and disposals -9 -68 - -
Cost at end of year 19 28 4 3
opening depreciation -22 -84 -2 -1
Sales and disposals 7 65 0 -
Depreciation charge for the year -1 -3 -1 -1
accumulated depreciation -16 -22 -3 -2
book value 3 6 1 1
the group has a small volume of operating leases for cars and other technical equipment. all agreements have been concluded on normal market terms.
nOte 17 interests in assOCiated COMpanies
group parent company 2008 2007 2008 2007
Cost at beginning of year -3 1,204 - 1,205
acquisition/Share in profit/loss 23 46 - 46
reclassifications - -2 - -
redemption of shares paid in the form of shares in Klövern ab - -1,251 - -1,251
Sales 1 - - -
Cost at end of year 21 -3 - -
book value 21 -3 - -
Capital bookname/corporate identity no. regd. office share in %1) value
Järla Sjö exploatering ab 556615-3952 Stockholm 33.3 -2
råsta Holding ab 556742-6761 Stockholm 25.0 8
råsta administration ab 556702-8682 Stockholm 20.0 0
nyckeln 0828 Se reg no: Se11 West Sussex, uK 30.0 15
211) applies also to the share of votes for the total number of shares.
group 2008 2007
profit and loss account
rental income - -
net operating income - -
profit/loss for the year -29 -
balance sheet
Fixed assets 602 -
Current assets 7 -
total assets 609 -
Shareholders’ equity 35 -
other liabilities 574 -
total equity and liabilities 609 -
nOte 18 reCeivables frOM assOCiated COMpanies
receivables from associated companies refer to a receivable of SeK 59m from nyckeln 0328 Se, which bears interest on market terms.
nOte 19 JOint ventures
Joint venture refers to a company in which Fabege exercises a controlling influence together with another party.
owned by subsidiaries: registered office Capital share, %1)
Centralbadet Hb 916609-6017 Stockholm 50
Värtan Fastigheter Kb 969601-0793 Stockholm 50
Zeolit exploaterings ab 556604-9440 Stockholm 501) applies also to the share of votes for the total number of shares.
through companies Fabege owns properties that are run as joint ventures. In these companies Fabege controls its share of future earnings through its share of the assets and liabilities of the jointly owned company. the net asset value is best expressed by recognising Fabege’s share of the assets, liabilities, income and expenses of the company in the consolidated financial statements item by item. In the consolidated financial statements the proportionate consolidation method (item by item) has therefore been applied for these joint ventures.
nOtes 55
Fabege annual report 2008
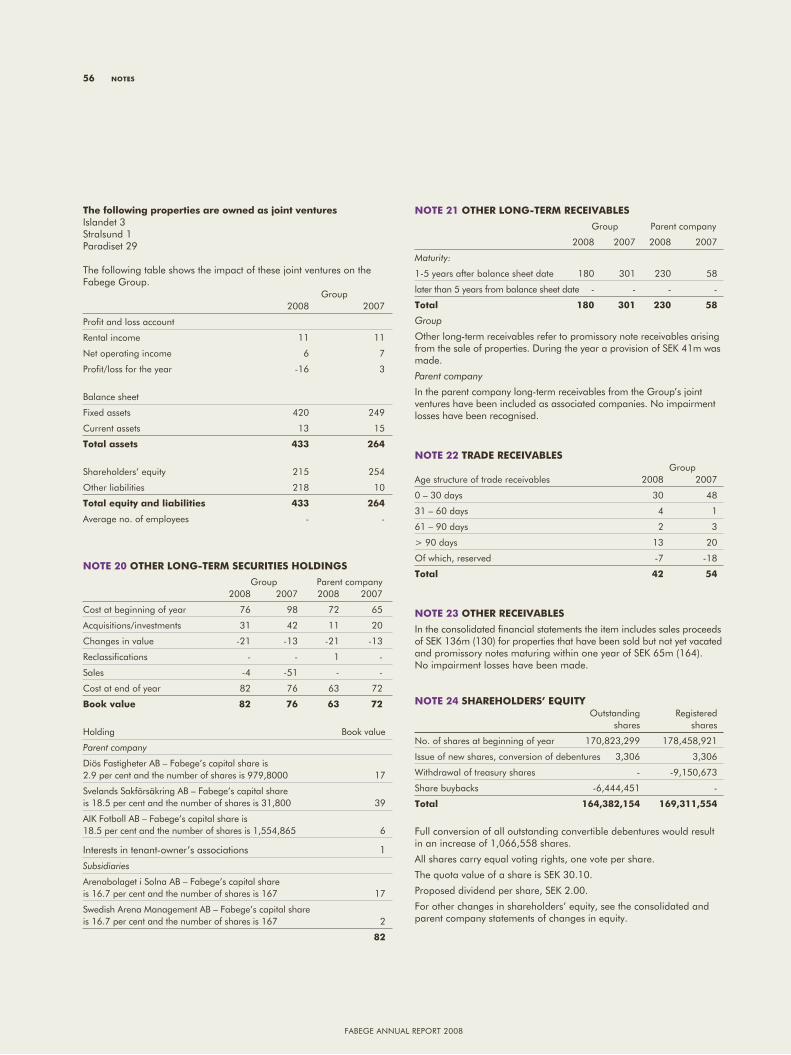
Fabege annual report 2008
the following properties are owned as joint venturesIslandet 3Stralsund 1paradiset 29
the following table shows the impact of these joint ventures on the Fabege group. group 2008 2007
profit and loss account
rental income 11 11
net operating income 6 7
profit/loss for the year -16 3
balance sheet
Fixed assets 420 249
Current assets 13 15
total assets 433 264
Shareholders’ equity 215 254
other liabilities 218 10
total equity and liabilities 433 264
average no. of employees - -
nOte 20 Other lOng-terM seCurities hOldings
group parent company 2008 2007 2008 2007
Cost at beginning of year 76 98 72 65
acquisitions/investments 31 42 11 20
Changes in value -21 -13 -21 -13
reclassifications - - 1 -
Sales -4 -51 - -
Cost at end of year 82 76 63 72
book value 82 76 63 72
Holding book value
Parent company
Diös Fastigheter ab – Fabege’s capital share is 2.9 per cent and the number of shares is 979,8000 17
Svelands Sakförsäkring ab – Fabege’s capital share is 18.5 per cent and the number of shares is 31,800 39
aIK Fotboll ab – Fabege’s capital share is 18.5 per cent and the number of shares is 1,554,865 6
Interests in tenant-owner’s associations 1
Subsidiaries
arenabolaget i Solna ab – Fabege’s capital share is 16.7 per cent and the number of shares is 167 17
Swedish arena Management ab – Fabege’s capital share is 16.7 per cent and the number of shares is 167 2
82
nOte 21 Other lOng-terM reCeivables
group parent company
2008 2007 2008 2007
Maturity:
1-5 years after balance sheet date 180 301 230 58
later than 5 years from balance sheet date - - - -
total 180 301 230 58
Group
other long-term receivables refer to promissory note receivables arising from the sale of properties. During the year a provision of SeK 41m was made.
Parent company
In the parent company long-term receivables from the group’s joint ventures have been included as associated companies. no impairment losses have been recognised.
nOte 22 trade reCeivables groupage structure of trade receivables 2008 2007
0 – 30 days 30 48
31 – 60 days 4 1
61 – 90 days 2 3
> 90 days 13 20
of which, reserved -7 -18
total 42 54
nOte 23 Other reCeivables
In the consolidated financial statements the item includes sales proceeds of SeK 136m (130) for properties that have been sold but not yet vacated and promissory notes maturing within one year of SeK 65m (164). no impairment losses have been made.
nOte 24 sharehOlders’ equity outstanding registered shares shares
no. of shares at beginning of year 170,823,299 178,458,921
Issue of new shares, conversion of debentures 3,306 3,306
Withdrawal of treasury shares - -9,150,673
Share buybacks -6,444,451 -
total 164,382,154 169,311,554
Full conversion of all outstanding convertible debentures would result in an increase of 1,066,558 shares.
all shares carry equal voting rights, one vote per share.
the quota value of a share is SeK 30.10.
proposed dividend per share, SeK 2.00.
For other changes in shareholders’ equity, see the consolidated and parent company statements of changes in equity.
56 nOtes
Fabege annual report 2008
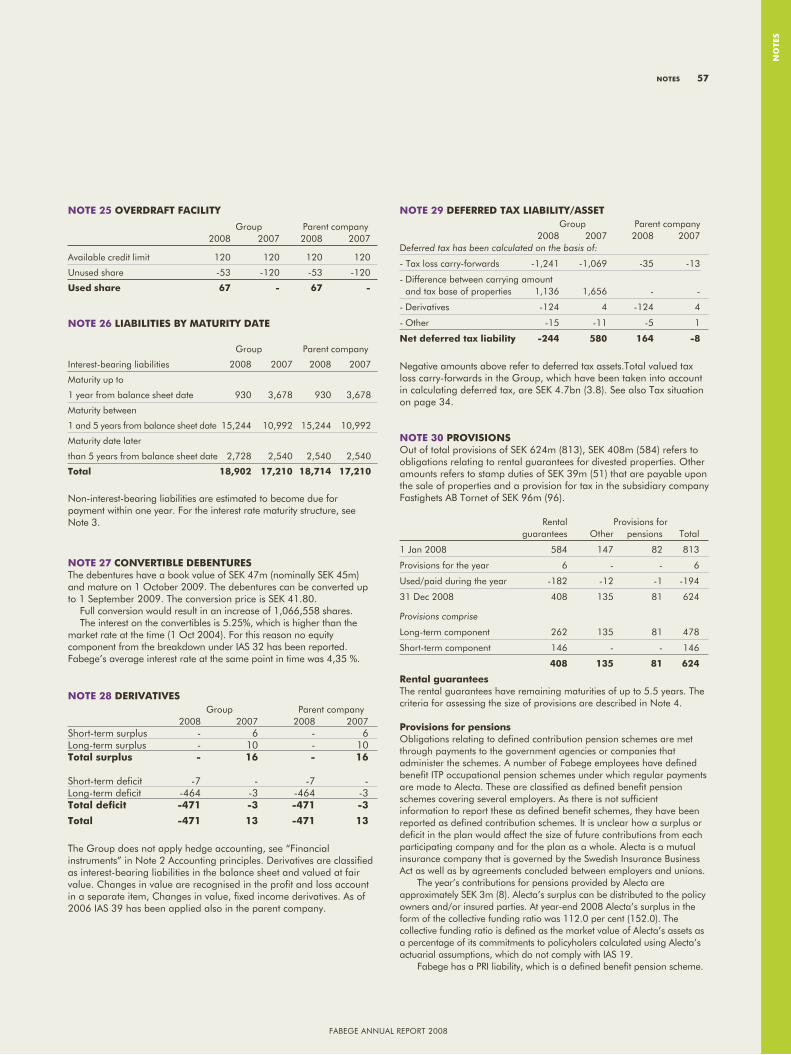
Fabege annual report 2008
nO
tes
nOte 25 Overdraft faCility
group parent company 2008 2007 2008 2007
available credit limit 120 120 120 120
unused share -53 -120 -53 -120
used share 67 - 67 -
nOte 26 liabilities by Maturity date
group parent company
Interest-bearing liabilities 2008 2007 2008 2007
Maturity up to
1 year from balance sheet date 930 3,678 930 3,678
Maturity between
1 and 5 years from balance sheet date 15,244 10,992 15,244 10,992
Maturity date later
than 5 years from balance sheet date 2,728 2,540 2,540 2,540
total 18,902 17,210 18,714 17,210
non-interest-bearing liabilities are estimated to become due for payment within one year. For the interest rate maturity structure, see note 3.
nOte 27 COnvertible debenturesthe debentures have a book value of SeK 47m (nominally SeK 45m) and mature on 1 october 2009. the debentures can be converted up to 1 September 2009. the conversion price is SeK 41.80.
Full conversion would result in an increase of 1,066,558 shares.the interest on the convertibles is 5.25%, which is higher than the
market rate at the time (1 oct 2004). For this reason no equity component from the breakdown under IaS 32 has been reported. Fabege’s average interest rate at the same point in time was 4,35 %.
nOte 28 derivatives
group parent company 2008 2007 2008 2007
Short-term surplus - 6 - 6long-term surplus - 10 - 10total surplus - 16 - 16 Short-term deficit -7 - -7 -long-term deficit -464 -3 -464 -3total deficit -471 -3 -471 -3
total -471 13 -471 13
the group does not apply hedge accounting, see “Financial instruments” in note 2 accounting principles. Derivatives are classified as interest-bearing liabilities in the balance sheet and valued at fair value. Changes in value are recognised in the profit and loss account in a separate item, Changes in value, fixed income derivatives. as of 2006 IaS 39 has been applied also in the parent company.
nOte 29 deferred tax liability/asset group parent company 2008 2007 2008 2007Deferred tax has been calculated on the basis of:
- tax loss carry-forwards -1,241 -1,069 -35 -13
- Difference between carrying amount and tax base of properties 1,136 1,656 - -
- Derivatives -124 4 -124 4
- other -15 -11 -5 1
net deferred tax liability -244 580 164 -8
negative amounts above refer to deferred tax assets.total valued tax loss carry-forwards in the group, which have been taken into account in calculating deferred tax, are SeK 4.7bn (3.8). See also tax situation on page 34.
nOte 30 prOvisiOnsout of total provisions of SeK 624m (813), SeK 408m (584) refers to obligations relating to rental guarantees for divested properties. other amounts refers to stamp duties of SeK 39m (51) that are payable upon the sale of properties and a provision for tax in the subsidiary company Fastighets ab tornet of SeK 96m (96).
rental provisions for guarantees other pensions total
1 Jan 2008 584 147 82 813
provisions for the year 6 - - 6
used/paid during the year -182 -12 -1 -194
31 Dec 2008 408 135 81 624
Provisions comprise
long-term component 262 135 81 478
Short-term component 146 - - 146
408 135 81 624
rental guaranteesthe rental guarantees have remaining maturities of up to 5.5 years. the criteria for assessing the size of provisions are described in note 4.
provisions for pensionsobligations relating to defined contribution pension schemes are met through payments to the government agencies or companies that administer the schemes. a number of Fabege employees have defined benefit Itp occupational pension schemes under which regular payments are made to alecta. these are classified as defined benefit pension schemes covering several employers. as there is not sufficient information to report these as defined benefit schemes, they have been reported as defined contribution schemes. It is unclear how a surplus or deficit in the plan would affect the size of future contributions from each participating company and for the plan as a whole. alecta is a mutual insurance company that is governed by the Swedish Insurance business act as well as by agreements concluded between employers and unions.
the year’s contributions for pensions provided by alecta are approximately SeK 3m (8). alecta’s surplus can be distributed to the policy owners and/or insured parties. at year-end 2008 alecta’s surplus in the form of the collective funding ratio was 112.0 per cent (152.0). the collective funding ratio is defined as the market value of alecta’s assets as a percentage of its commitments to policyholers calculated using alecta’s actuarial assumptions, which do not comply with IaS 19.
Fabege has a prI liability, which is a defined benefit pension scheme.
nOtes 57
Fabege annual report 2008
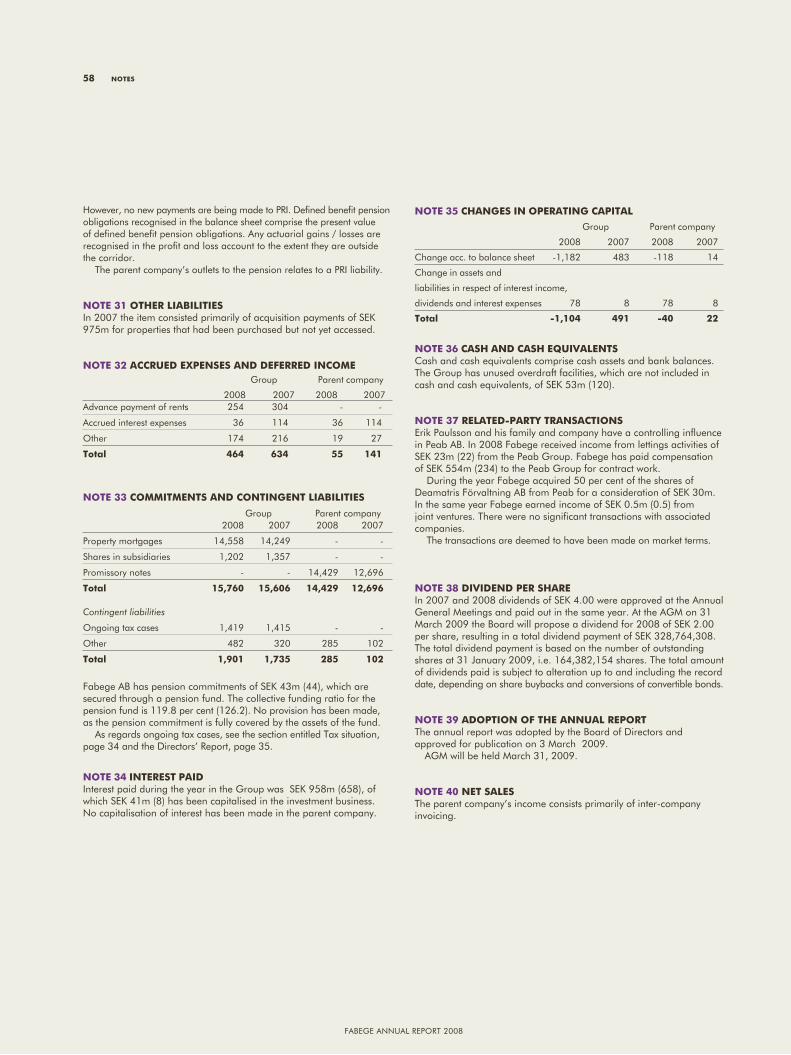
Fabege annual report 2008
However, no new payments are being made to prI. Defined benefit pension obligations recognised in the balance sheet comprise the present value of defined benefit pension obligations. any actuarial gains / losses are recognised in the profit and loss account to the extent they are outside the corridor.
the parent company’s outlets to the pension relates to a prI liability.
nOte 31 Other liabilitiesIn 2007 the item consisted primarily of acquisition payments of SeK 975m for properties that had been purchased but not yet accessed.
nOte 32 aCCrued expenses and deferred inCOMe group parent company
2008 2007 2008 2007advance payment of rents 254 304 - -
accrued interest expenses 36 114 36 114
other 174 216 19 27
total 464 634 55 141
nOte 33 COMMitMents and COntingent liabilities
group parent company 2008 2007 2008 2007
property mortgages 14,558 14,249 - -
Shares in subsidiaries 1,202 1,357 - -
promissory notes - - 14,429 12,696
total 15,760 15,606 14,429 12,696 Contingent liabilities
ongoing tax cases 1,419 1,415 - -
other 482 320 285 102
total 1,901 1,735 285 102
Fabege ab has pension commitments of SeK 43m (44), which are secured through a pension fund. the collective funding ratio for the pension fund is 119.8 per cent (126.2). no provision has been made, as the pension commitment is fully covered by the assets of the fund.
as regards ongoing tax cases, see the section entitled tax situation, page 34 and the Directors’ report, page 35.
nOte 34 interest paidInterest paid during the year in the group was SeK 958m (658), of which SeK 41m (8) has been capitalised in the investment business. no capitalisation of interest has been made in the parent company.
nOte 35 Changes in Operating Capital
group parent company
2008 2007 2008 2007
Change acc. to balance sheet -1,182 483 -118 14
Change in assets and
liabilities in respect of interest income,
dividends and interest expenses 78 8 78 8
total -1,104 491 -40 22
nOte 36 Cash and Cash equivalentsCash and cash equivalents comprise cash assets and bank balances. the group has unused overdraft facilities, which are not included in cash and cash equivalents, of SeK 53m (120). nOte 37 related-party transaCtiOnserik paulsson and his family and company have a controlling influence in peab ab. In 2008 Fabege received income from lettings activities of SeK 23m (22) from the peab group. Fabege has paid compensation of SeK 554m (234) to the peab group for contract work.
During the year Fabege acquired 50 per cent of the shares of Deamatris Förvaltning ab from peab for a consideration of SeK 30m. In the same year Fabege earned income of SeK 0.5m (0.5) from joint ventures. there were no significant transactions with associated companies.
the transactions are deemed to have been made on market terms.
nOte 38 dividend per shareIn 2007 and 2008 dividends of SeK 4.00 were approved at the annual general Meetings and paid out in the same year. at the agM on 31 March 2009 the board will propose a dividend for 2008 of SeK 2.00 per share, resulting in a total dividend payment of SeK 328,764,308. the total dividend payment is based on the number of outstanding shares at 31 January 2009, i.e. 164,382,154 shares. the total amount of dividends paid is subject to alteration up to and including the record date, depending on share buybacks and conversions of convertible bonds.
nOte 39 adOptiOn Of the annual repOrtthe annual report was adopted by the board of Directors and approved for publication on 3 March 2009. agM will be held March 31, 2009. nOte 40 net salesthe parent company’s income consists primarily of inter-company invoicing.
58 nOtes
Fabege annual report 2008
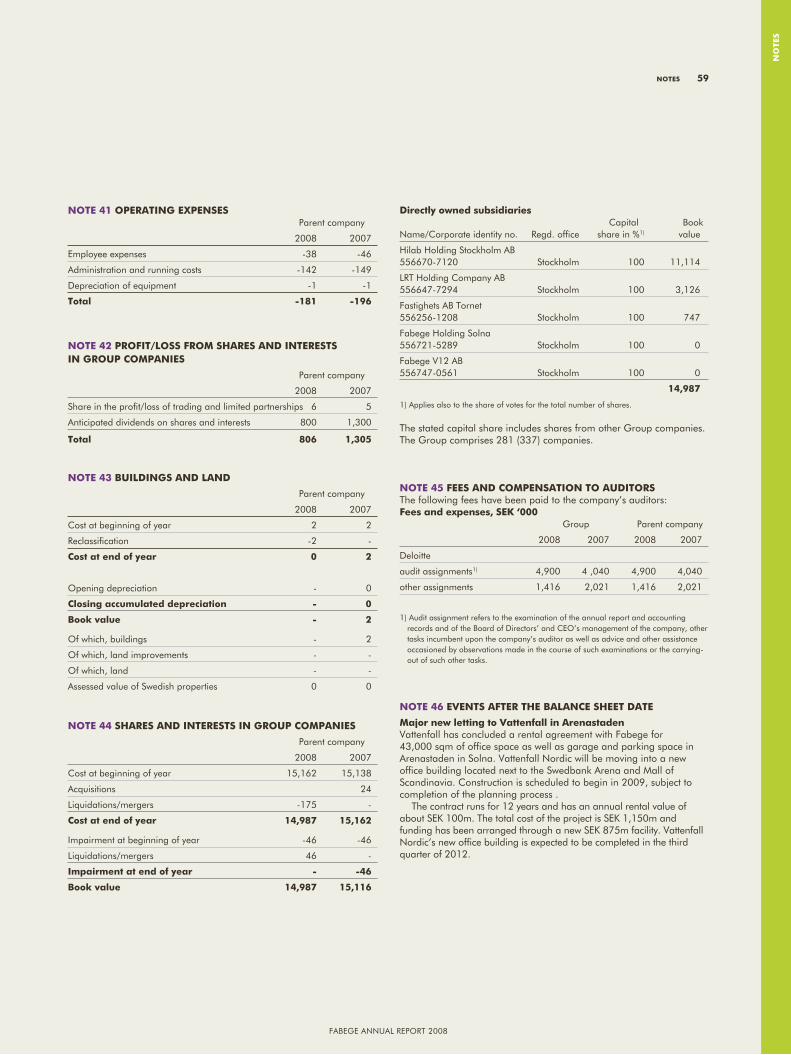
Fabege annual report 2008
nO
tes
nOte 41 Operating expenses parent company
2008 2007
employee expenses -38 -46
administration and running costs -142 -149
Depreciation of equipment -1 -1
total -181 -196
nOte 42 prOfit/lOss frOM shares and interests in grOup COMpanies
parent company
2008 2007
Share in the profit/loss of trading and limited partnerships 6 5
anticipated dividends on shares and interests 800 1,300
total 806 1,305 nOte 43 buildings and land
parent company
2008 2007
Cost at beginning of year 2 2
reclassification -2 -
Cost at end of year 0 2
opening depreciation - 0
Closing accumulated depreciation - 0
book value - 2
of which, buildings - 2
of which, land improvements - -
of which, land - -
assessed value of Swedish properties 0 0
nOte 44 shares and interests in grOup COMpanies
parent company
2008 2007
Cost at beginning of year 15,162 15,138
acquisitions 24
liquidations/mergers -175 -
Cost at end of year 14,987 15,162
Impairment at beginning of year -46 -46
liquidations/mergers 46 -
impairment at end of year - -46
book value 14,987 15,116
directly owned subsidiaries Capital bookname/Corporate identity no. regd. office share in %1) value
Hilab Holding Stockholm ab 556670-7120 Stockholm 100 11,114
lrt Holding Company ab 556647-7294 Stockholm 100 3,126
Fastighets ab tornet 556256-1208 Stockholm 100 747
Fabege Holding Solna 556721-5289 Stockholm 100 0
Fabege V12 ab 556747-0561 Stockholm 100 0
14,987
1) applies also to the share of votes for the total number of shares.
the stated capital share includes shares from other group companies. the group comprises 281 (337) companies.
nOte 45 fees and COMpensatiOn tO auditOrsthe following fees have been paid to the company’s auditors:fees and expenses, seK ‘000 group parent company
2008 2007 2008 2007
Deloitte
audit assignments1) 4,900 4 ,040 4,900 4,040
other assignments 1,416 2,021 1,416 2,021
1) audit assignment refers to the examination of the annual report and accounting records and of the board of Directors’ and Ceo’s management of the company, other tasks incumbent upon the company’s auditor as well as advice and other assistance occasioned by observations made in the course of such examinations or the carrying-out of such other tasks.
nOte 46 events after the balanCe sheet date
Major new letting to vattenfall in arenastadenVattenfall has concluded a rental agreement with Fabege for 43,000 sqm of office space as well as garage and parking space in arenastaden in Solna. Vattenfall nordic will be moving into a new office building located next to the Swedbank arena and Mall of Scandinavia. Construction is scheduled to begin in 2009, subject to completion of the planning process .
the contract runs for 12 years and has an annual rental value of about SeK 100m. the total cost of the project is SeK 1,150m and funding has been arranged through a new SeK 875m facility. Vattenfall nordic’s new office building is expected to be completed in the third quarter of 2012.
nOtes 59
Fabege annual report 2008
Fabege annual report 2008Fabege annual report 2008
60 signing Of the annual repOrt
The Board of Directors and CEO hereby certify that:
the annual report has been prepared in accordance with the Swedish Annual Accounts Act and Recommendation RFR 2:1 of the Swedish Financial Accounting Standards Board.
the annual report gives a true and fair picture of the company’s financial position and results, and
the Directors’ Report gives a true and fair overview of the development of the company’s business, position and results and describes significant risks and uncertainties faced by the company.
The Board of Directors and Chief Executive Officer furthermore certify that:
the consolidated financial statements have been prepared in accordance with the International Financial Reporting Standards (IFRS), as referred to in Regulation (EC) No 1606/2002 of 19 July 2002 on the application of international accounting standards.
the consolidated financial statements give a true and fair picture of the Group’s financial position and results, and
the Directors’ Report for the Group gives a true and fair overview of the development of the Group’s business, results and position and describes significant risks and uncertainties faced by the companies included in the Group.
signing Of the annual repOrt
Stockholm, March 3, 2009
Erik Paulsson Chairman
Sven-Åke Johansson Göte Dahlin Märtha Josefsson Deputy Chairman
Helen Olausson Svante Paulsson Mats Qviberg
Christian Hermelin Chief Executive Officer
We submitted our audit report on March 3, 2009 Deloitte AB
Svante Forsberg Authorised Public Accountant
Fabege annual report 2008Fabege annual report 2008
audit repOrt 61
We have audited the annual accounts, the consolidated accounts, the accounting records and the administration of the board of directors and the managing director of Fabege AB for the financial year 2008. The statutory annual accounts for the Company are included in the printed version of this document on pages 35–60. The board of directors and the managing director are responsible for these accounts and the administration of the company as well as for the application of the Annual Accounts Act when preparing the annual accounts and the application of international financial reporting standards IFRSs as adopted by the EU and the Annual Accounts Act when preparing the consolidated accounts. Our responsibility is to express an opinion on the annual accounts, the consolidated accounts and the administration based on our audit.
We conducted our audit in accordance with generally accepted auditing standards in Sweden. Those standards require that we plan and perform the audit to obtain reasonable assurance that the annual accounts and the consolidated accounts are free of material misstatement. An audit includes examining, on a test basis, evidence supporting the amounts and disclosures in the accounts. An audit also includes assessing the accounting principles used and their application by the board of directors and the managing director and significant estimates made by the board of directors and the managing director when preparing the annual accounts and consolidated accounts as well as evaluating the overall presentation of information in the annual accounts and the consolidated accounts. As a basis for
our opinion concerning discharge from liability, we examined significant decisions, actions taken and circumstances of the company in order to be able to determine the liability, if any, to the company of any board member or the managing director . We also examined whether any board member or the managing director has, in any other way, acted in contravention of the Companies Act, the Annual Accounts Act or the Articles of Association. We believe that our audit provides a reasonable basis for our opinion set out below.
The annual accounts have been prepared in accordance with the Annual Accounts Act and give a true and fair view of the company’s financial position and results of operations in accordance with generally accepted accounting principles in Sweden. The consolidated accounts have been prepared in accordance with international financial reporting standards IFRSs as adopted by the EU and the Annual Accounts Act and give a true and fair view of the group’s financial position and results of operations. The statutory administration report is consistent with the other parts of the annual accounts and the consolidated accounts.
We recommend to the annual meeting of shareholders that the income statements and balance sheets of the parent company and the group be adopted, that the profit of the parent company be dealt with in accordance with the proposal in the administration report and that the members of the board of directors and the managing director be discharged from liability for the financial year.
audit repOrt to the annual general Meeting of the shareholders of Fabege ab (publ)Corporate identity number 556049-1523
Stockholm, March 3, 2009 Deloitte AB
Svante ForsbergAuthorised Public Accountant
siG
nin
G o
f tH
e a
nn
ua
l r
epo
rt
• a
ud
it r
epo
rt
Fabege annual report 2008
the property pan 1 in the old town.
Fabege annual report 2008
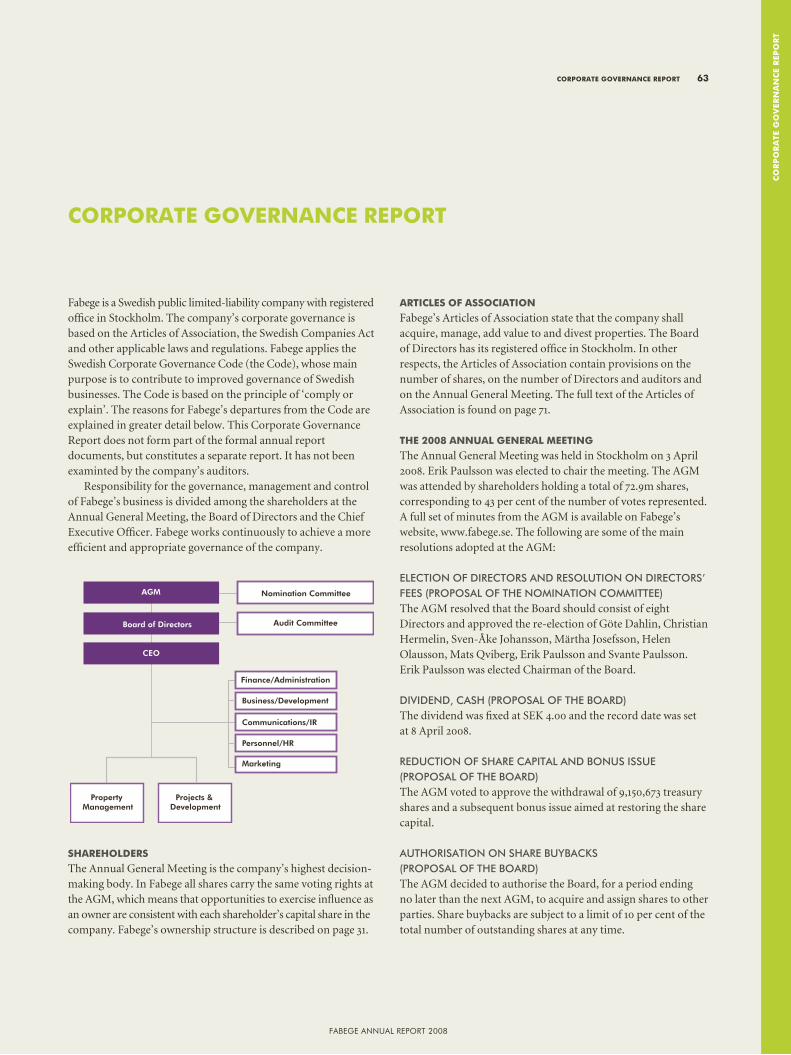
Fabege annual report 2008
CO
rp
Or
ate
gO
ver
na
nC
e r
epO
rt
Fabege is a Swedish public limited-liability company with registered office in Stockholm. The company’s corporate governance is based on the Articles of Association, the Swedish Companies Act and other applicable laws and regulations. Fabege applies the Swedish Corporate Governance Code (the Code), whose main purpose is to contribute to improved governance of Swedish businesses. The Code is based on the principle of ‘comply or explain’. The reasons for Fabege’s departures from the Code are explained in greater detail below. This Corporate Governance Report does not form part of the formal annual report documents, but constitutes a separate report. It has not been examinted by the company’s auditors.
Responsibility for the governance, management and control of Fabege’s business is divided among the shareholders at the Annual General Meeting, the Board of Directors and the Chief Executive Officer. Fabege works continuously to achieve a more efficient and appropriate governance of the company.
sharehOlders
The Annual General Meeting is the company’s highest decision-making body. In Fabege all shares carry the same voting rights at the AGM, which means that opportunities to exercise influence as an owner are consistent with each shareholder’s capital share in the company. Fabege’s ownership structure is described on page 31.
artiCles Of assOCiatiOn
Fabege’s Articles of Association state that the company shall acquire, manage, add value to and divest properties. The Board of Directors has its registered office in Stockholm. In other respects, the Articles of Association contain provisions on the number of shares, on the number of Directors and auditors and on the Annual General Meeting. The full text of the Articles of Association is found on page 71.
the 2008 annual general Meeting
The Annual General Meeting was held in Stockholm on 3 April 2008. Erik Paulsson was elected to chair the meeting. The AGM was attended by shareholders holding a total of 72.9m shares, corresponding to 43 per cent of the number of votes represented. A full set of minutes from the AGM is available on Fabege’s website, www.fabege.se. The following are some of the main resolutions adopted at the AGM:
eleCTion oF direCTorS And reSoluTion on direCTorS’ FeeS (ProPoSAl oF The nominATion CommiTTee)The AGM resolved that the Board should consist of eight Directors and approved the re-election of Göte Dahlin, Christian Hermelin, Sven-Åke Johansson, Märtha Josefsson, Helen Olausson, Mats Qviberg, Erik Paulsson and Svante Paulsson. Erik Paulsson was elected Chairman of the Board.
dividend, CASh (ProPoSAl oF The boArd)The dividend was fixed at SEK 4.00 and the record date was set at 8 April 2008.
reduCTion oF ShAre CAPiTAl And bonuS iSSue (ProPoSAl oF The boArd)The AGM voted to approve the withdrawal of 9,150,673 treasury shares and a subsequent bonus issue aimed at restoring the share capital.
AuThoriSATion on ShAre buybACkS (ProPoSAl oF The boArd)The AGM decided to authorise the Board, for a period ending no later than the next AGM, to acquire and assign shares to other parties. Share buybacks are subject to a limit of 10 per cent of the total number of outstanding shares at any time.
COrpOrate gOvernanCe repOrt
Personnel/HR
Communications/IR
Business/Development
Marketing
AGM
Board of Directors
CEO
Property Management
Projects & Development
Nomination Committee
Audit Committee
Finance/Administration
COrpOrate gOvernanCe repOrt 63
Fabege annual report 2008
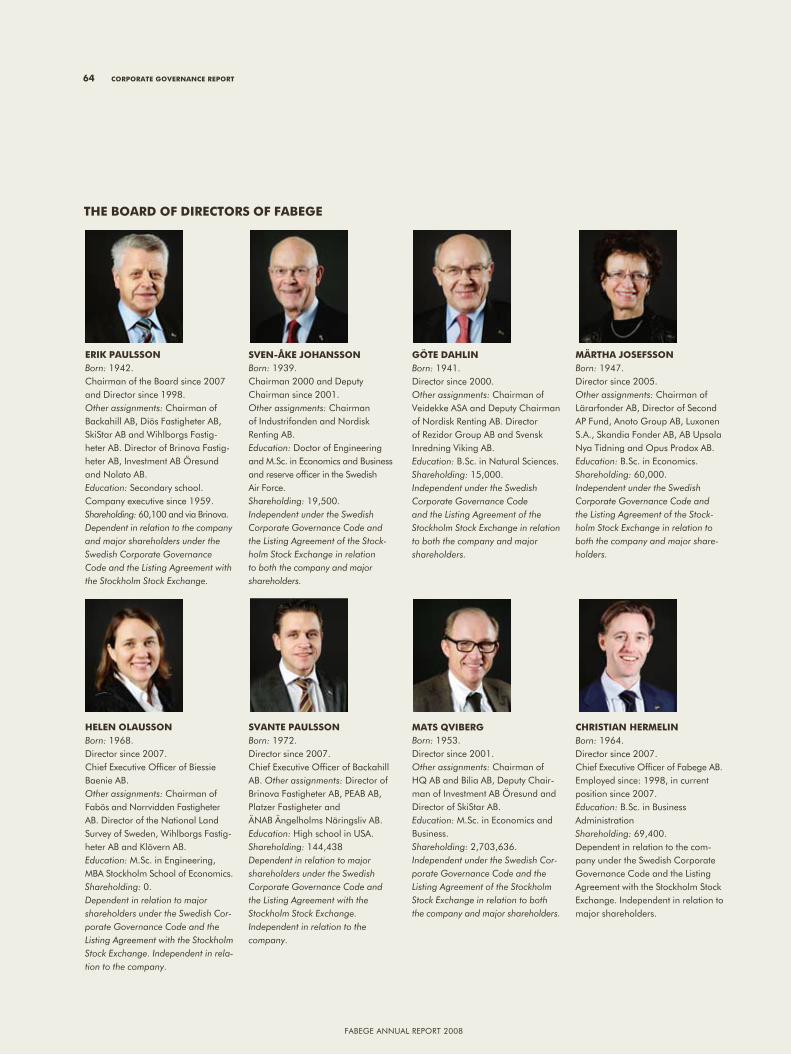
Fabege annual report 2008
the bOard Of direCtOrs Of fabege
64 COrpOrate gOvernanCe repOrt
eriK paulssOnBorn: 1942.Chairman of the board since 2007 and Director since 1998.Other assignments: Chairman of backahill ab, Diös Fastigheter ab, SkiStar ab and Wihlborgs Fastig-heter ab. Director of brinova Fastig-heter ab, Investment ab Öresund and nolato ab.Education: Secondary school. Company executive since 1959.Shareholding: 60,100 and via brinova.Dependent in relation to the company and major shareholders under the Swedish Corporate Governance Code and the Listing Agreement with the Stockholm Stock Exchange.
helen OlaussOnBorn: 1968. Director since 2007.Chief executive officer of biessie baenie ab.Other assignments: Chairman of Fabös and norrvidden Fastigheter ab. Director of the national land Survey of Sweden, Wihlborgs Fastig-heter ab and Klövern ab. Education: M.Sc. in engineering, Mba Stockholm School of economics.Shareholding: 0.Dependent in relation to major shareholders under the Swedish Cor-porate Governance Code and the Listing Agreement with the Stockholm Stock Exchange. Independent in rela-tion to the company.
sven-ÅKe JOhanssOn
Born: 1939.Chairman 2000 and Deputy Chairman since 2001. Other assignments: Chairman of Industrifonden and nordisk renting ab.Education: Doctor of engineering and M.Sc. in economics and business and reserve officer in the Swedish air Force. Shareholding: 19,500. Independent under the Swedish Corporate Governance Code and the Listing Agreement of the Stock-holm Stock Exchange in relation to both the company and major shareholders.
svante paulssOnBorn: 1972. Director since 2007.Chief executive officer of backahill ab. Other assignments: Director of brinova Fastigheter ab, peab ab, platzer Fastigheter and Änab Ängelholms näringsliv ab.Education: High school in uSa. Shareholding: 144,438Dependent in relation to major shareholders under the Swedish Corporate Governance Code and the Listing Agreement with the Stockholm Stock Exchange. Independent in relation to the company.
göte dahlinBorn: 1941.Director since 2000.Other assignments: Chairman of Veidekke aSa and Deputy Chairman of nordisk renting ab. Director of rezidor group ab and Svensk Inredning Viking ab. Education: b.Sc. in natural Sciences. Shareholding: 15,000.Independent under the Swedish Corporate Governance Code and the Listing Agreement of the Stockholm Stock Exchange in relation to both the company and major share holders.
Mats qviberg
Born: 1953.Director since 2001.Other assignments: Chairman of HQ ab and bilia ab, Deputy Chair-man of Investment ab Öresund and Director of SkiStar ab. Education: M.Sc. in economics and business. Shareholding: 2,703,636.Independent under the Swedish Cor-porate Governance Code and the Listing Agreement of the Stockholm Stock Exchange in relation to both the company and major shareholders.
Märtha JOsefssOnBorn: 1947.Director since 2005.Other assignments: Chairman of lärarfonder ab, Director of Second ap Fund, anoto group ab, luxonen S.a., Skandia Fonder ab, ab upsala nya tidning and opus prodox ab. Education: b.Sc. in economics. Shareholding: 60,000.Independent under the Swedish Corporate Governance Code and the Listing Agreement of the Stock-holm Stock Exchange in relation to both the company and major share-holders.
Christian herMelinBorn: 1964.Director since 2007. Chief executive officer of Fabege ab.employed since: 1998, in current position since 2007.Education: b.Sc. in business administrationShareholding: 69,400.Dependent in relation to the com-pany under the Swedish Corporate governance Code and the listing agreement with the Stockholm Stock exchange. Independent in relation to major shareholders.
Fabege annual report 2008
Fabege annual report 2008
CO
rp
Or
ate
gO
ver
na
nC
e r
epO
rt
PrinCiPleS For The APPoinTmenT oF The nominATion CommiTTee (ProPoSAl oF The nominATion CommiTTee)The AGM adopted a set of principles for the appointment of the Nomination Committee and passed a resolution on the proposals that the Nomination Committee is required to prepare. The Nomination Committee will consist of representatives for the four largest owners.
the nOMinatiOn COMMittee
The Nomination Committee is the AGM body responsible for preparing resolutions on appointments. The Committee’s task is to draw up proposals for the appointment of the AGM chairman, Chairman of the Board and Director, Directors’ fees, the appointment of auditors, auditors’ fees and any changes to the principles governing the election of the Nomination Committee. The proposal for Directors’ fees must specify a breakdown between the Chairman, Directors and committee work.
On 30 September 2008 a Nomination Committee was announced consisting of representatives of the four largest owners, in accordance with the resolution adopted at the 2008 AGM. The Nomination Committee consists of the following members: Peter Lindh (representing Maths O Sundqvist), Anders Silverbåge (Brinova Fastigheter AB), Per Ovrén (Investment AB Öresund) and Mikael Nordberg (Danske Capital). Anders Silverbåge is chairman of the Nomination Committee. The four owner representatives represent about 33 per cent of the votes in Fabege.
The Nomination Committee has held two minuted meetings and has remained in contact during the intervening periods. As a basis for its work, the Committee has met the Board Chairman and listened to the CEO’s views on the work of the Board. The Committee has also contacted the other Directors as well as the company’s auditors to obtain a clear idea of the work of the Board. It has also studied the company’s strategy, risk manage-ment and control functions. In addition, the chairman of the Nomination Committee has obtained information about the work of the Audit Committee through interviews with its chairman.
The Nomination Committee has discussed the size and composition of the Board of Directors in respect of industry experience, expertise, and the need for continuity and renewal of the work of the Board. The Committee has also discussed and taken into account the issue of the independence of Directors (see below for a description of the Board).
The Nomination Committee’s report on how it has conducted its work and its proposals for the 2009 AGM are available on the company’s website. The proposals of the Nomination Committee are also described in the notice of the 2009 AGM.
the bOard Of direCtOrs
Under the Companies Act, the Board of Directors is responsible for the company’s organisation and the administration of the company’s affairs. The Board is required to continuously assess the financial situation of the company and Group. Its main task is to manage the company’s business on behalf of the owners in a way that secures the owners’ interest in a strong long-term return on capital.
In 2008 the Board consisted of eight Directors elected at the 2008 AGM. The AGM also elected Erik Paulsson as Chairman of the Board. Sven-Åke Johansson was appointed Deputy Chairman at the constituent Board meeting. Fabege’s Chief Financial Officer, Åsa Bergström, is the Board’s secretary.
Fabege’s Board of Directors includes members that have skills and experience that are of great significance for the support, monitoring and control of the operations of a leading property company in Sweden. There are members with knowledge of property, the property market, financing and business development. At the end of the year an assessment was made of the Board, which showed that the Board was operating in a highly satisfactory manner. Together, the members of the Board have, directly or indirectly, significant investments in Fabege shares.
Fabege’s Board meets the requirements on independent Directors contained in the Code and in the Listing Agreement of the Stockholm Stock Exchange. The Nomination Committee proposes that all Directors be re-elected. Out of the proposed Directors, Erik Paulsson is to be regarded as dependent both in relation to the company and in relation to major shareholders, Helen Olausson and Svante Paulsson as dependent in relation to major shareholders and the CEO Christian Hermelin as dependent in relation to the company. The other proposed Directors are, according to the definitions contained in the Code and the Listing Agreement, independent in relation to both the company and major shareholders.
In 2008 the Board held six ordinary meetings and 12 meetings altogether, including one constituent meeting and five conference calls. During the year the Board made decisions on several major transactions and investments in the company’s existing property portfolio. In 2008 Fabege acquired two properties for SEK 201m and sold 13 properties for SEK 2,095m. Decisions were made on investments of SEK 462m relating to the development and improvement of properties in the company’s existing portfolio. The Board also reviewed the company’s business concept, goals, strategies, budget and interim reporting.
Information about the Directors’ attendance at the meetings is provided in the table below. The table also shows which Directors are members of the Audit Committee. The Directors are paid Directors’ fees in accordance with the resolutions of the Annual General Meeting. For 2008 total fees of SEK 2,420,000 were paid, of which the Chairman received SEK 375,000 plus
COrpOrate gOvernanCe repOrt 65
Fabege annual report 2008
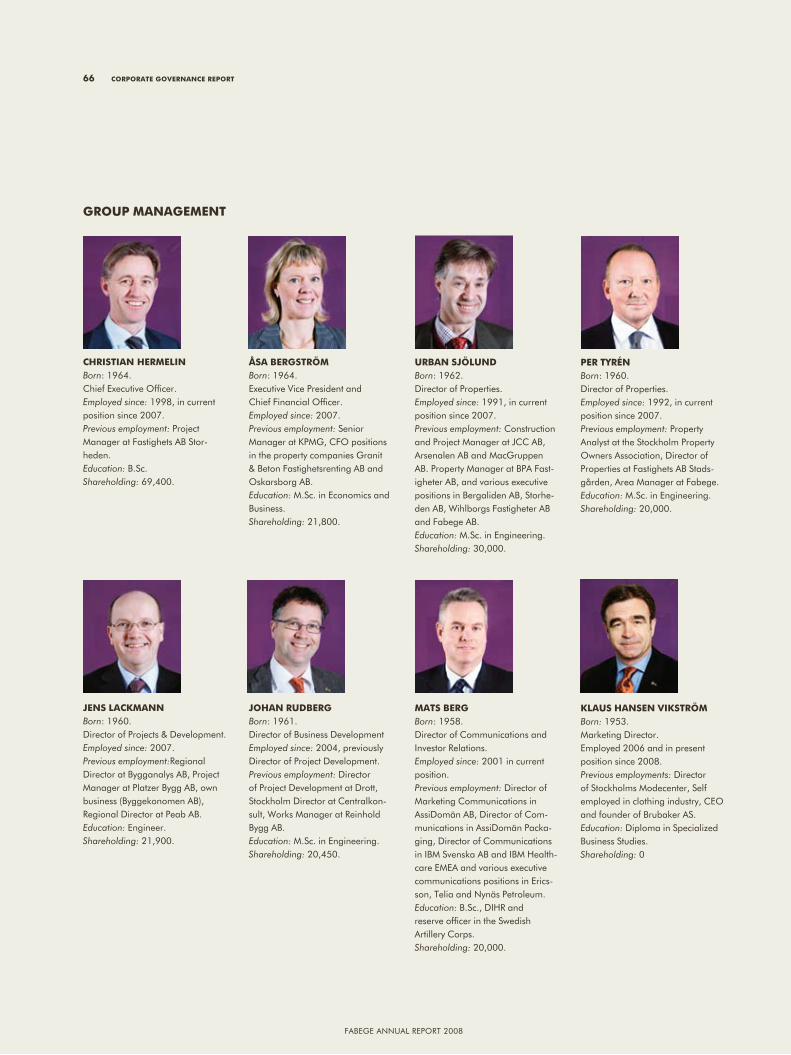
Fabege annual report 2008
66 COrpOrate gOvernanCe repOrt
Christian herMelinBorn: 1964.Chief executive officer.Employed since: 1998, in current position since 2007.Previous employment: project Manager at Fastighets ab Stor-heden.Education: b.Sc.Shareholding: 69,400.
Jens laCKMannBorn: 1960.Director of projects & Development.Employed since: 2007.Previous employment:regional Director at bygganalys ab, project Manager at platzer bygg ab, own business (byggekonomen ab), regional Director at peab ab.Education: engineer.Shareholding: 21,900.
Åsa bergströMBorn: 1964.executive Vice president and Chief Financial officer.Employed since: 2007.Previous employment: Senior Manager at KpMg, CFo positions in the property companies granit & beton Fastighetsrenting ab and oskarsborg ab.Education: M.Sc. in economics and business.Shareholding: 21,800.
JOhan rudbergBorn: 1961.Director of business Development Employed since: 2004, previously Director of project Development.Previous employment: Director of project Development at Drott, Stockholm Director at Centralkon-sult, Works Manager at reinhold bygg ab.Education: M.Sc. in engineering.Shareholding: 20,450.
urban sJölundBorn: 1962.Director of properties.Employed since: 1991, in current position since 2007.Previous employment: Construction and project Manager at JCC ab, arsenalen ab and Macgruppen ab. property Manager at bpa Fast-igheter ab, and various executive positions in bergaliden ab, Storhe-den ab, Wihlborgs Fastigheter ab and Fabege ab.Education: M.Sc. in engineering.Shareholding: 30,000.
Mats bergBorn: 1958.Director of Communications and Investor relations.Employed since: 2001 in current position.Previous employment: Director of Marketing Communications in assiDomän ab, Director of Com-munications in assiDomän packa-ging, Director of Communications in IbM Svenska ab and IbM Health-care eMea and various executive communications positions in erics-son, telia and nynäs petroleum. Education: b.Sc., DIHr and reserve officer in the Swedish artillery Corps.Shareholding: 20,000.
per tyrénBorn: 1960.Director of properties.Employed since: 1992, in current position since 2007.Previous employment: property analyst at the Stockholm property owners association, Director of properties at Fastighets ab Stads-gården, area Manager at Fabege.Education: M.Sc. in engineering.Shareholding: 20,000.
Klaus hansen viKströMBorn: 1953.Marketing Director.employed 2006 and in present position since 2008.Previous employments: Director of Stockholms Modecenter, Self employed in clothing industry, Ceo and founder of brubaker aS.Education: Diploma in Specialized business Studies.Shareholding: 0
grOup ManageMent
Fabege annual report 2008
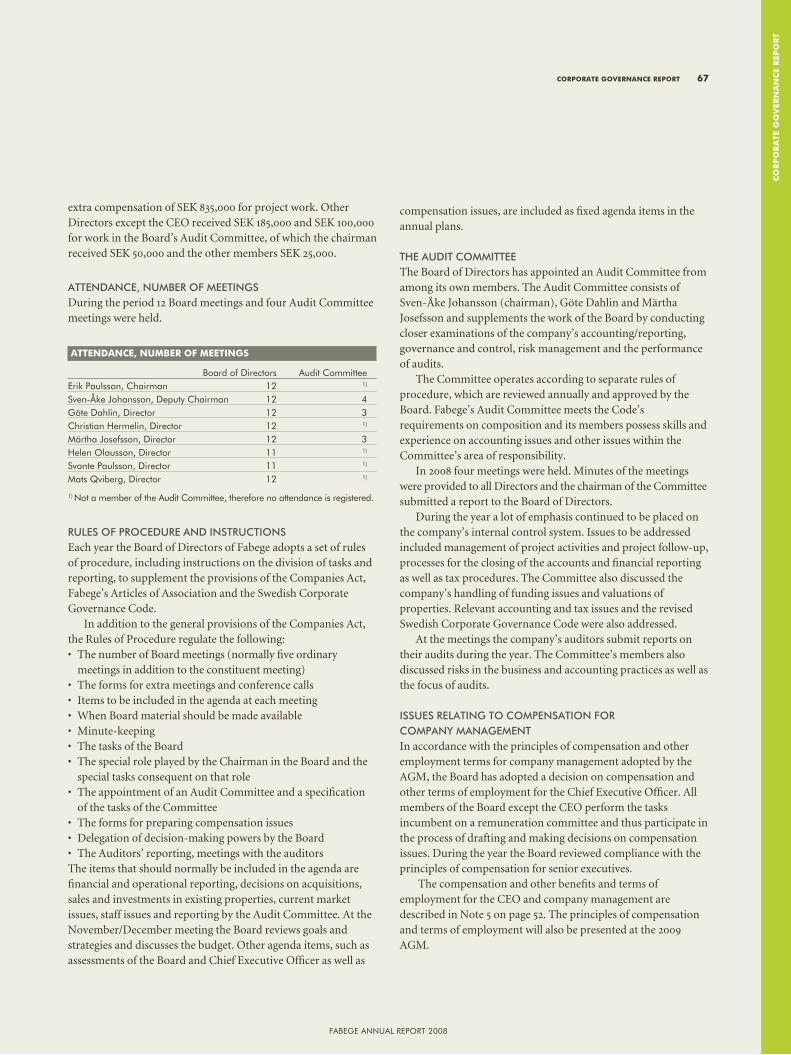
Fabege annual report 2008
CO
rp
Or
ate
gO
ver
na
nC
e r
epO
rt
extra compensation of SEK 835,000 for project work. Other Directors except the CEO received SEK 185,000 and SEK 100,000 for work in the Board’s Audit Committee, of which the chairman received SEK 50,000 and the other members SEK 25,000.
ATTendAnCe, number oF meeTingSDuring the period 12 Board meetings and four Audit Committee meetings were held.
ruleS oF ProCedure And inSTruCTionSEach year the Board of Directors of Fabege adopts a set of rules of procedure, including instructions on the division of tasks and reporting, to supplement the provisions of the Companies Act, Fabege’s Articles of Association and the Swedish Corporate Governance Code.
In addition to the general provisions of the Companies Act, the Rules of Procedure regulate the following:• The number of Board meetings (normally five ordinary
meetings in addition to the constituent meeting) • The forms for extra meetings and conference calls• Items to be included in the agenda at each meeting• When Board material should be made available• Minute-keeping• The tasks of the Board • The special role played by the Chairman in the Board and the
special tasks consequent on that role • The appointment of an Audit Committee and a specification
of the tasks of the Committee• The forms for preparing compensation issues • Delegation of decision-making powers by the Board• The Auditors’ reporting, meetings with the auditors The items that should normally be included in the agenda are financial and operational reporting, decisions on acquisitions, sales and investments in existing properties, current market issues, staff issues and reporting by the Audit Committee. At the November/December meeting the Board reviews goals and strategies and discusses the budget. Other agenda items, such as assessments of the Board and Chief Executive Officer as well as
compensation issues, are included as fixed agenda items in the annual plans.
The AudiT CommiTTee The Board of Directors has appointed an Audit Committee from among its own members. The Audit Committee consists of Sven-Åke Johansson (chairman), Göte Dahlin and Märtha Josefsson and supplements the work of the Board by conducting closer examinations of the company’s accounting/reporting, governance and control, risk management and the performance of audits.
The Committee operates according to separate rules of procedure, which are reviewed annually and approved by the Board. Fabege’s Audit Committee meets the Code’s requirements on composition and its members possess skills and experience on accounting issues and other issues within the Committee’s area of responsibility.
In 2008 four meetings were held. Minutes of the meetings were provided to all Directors and the chairman of the Committee submitted a report to the Board of Directors.
During the year a lot of emphasis continued to be placed on the company’s internal control system. Issues to be addressed included management of project activities and project follow-up, processes for the closing of the accounts and financial reporting as well as tax procedures. The Committee also discussed the company’s handling of funding issues and valuations of properties. Relevant accounting and tax issues and the revised Swedish Corporate Governance Code were also addressed.
At the meetings the company’s auditors submit reports on their audits during the year. The Committee’s members also discussed risks in the business and accounting practices as well as the focus of audits.
iSSueS relATing To ComPenSATion For ComPAny mAnAgemenT In accordance with the principles of compensation and other employment terms for company management adopted by the AGM, the Board has adopted a decision on compensation and other terms of employment for the Chief Executive Officer. All members of the Board except the CEO perform the tasks incumbent on a remuneration committee and thus participate in the process of drafting and making decisions on compensation issues. During the year the Board reviewed compliance with the principles of compensation for senior executives.
The compensation and other benefits and terms of employment for the CEO and company management are described in Note 5 on page 52. The principles of compensation and terms of employment will also be presented at the 2009 AGM.
COrpOrate gOvernanCe repOrt 67
Fabege annual report 2008
attendanCe, nuMber Of Meetings
board of Directors audit Committeeerik paulsson, Chairman 12 1)
Sven-Åke Johansson, Deputy Chairman 12 4göte Dahlin, Director 12 3Christian Hermelin, Director 12 1)
Märtha Josefsson, Director 12 3Helen olausson, Director 11 1)
Svante paulsson, Director 11 1)
Mats Qviberg, Director 12 1)
1) not a member of the audit Committee, therefore no attendance is registered.
Fabege annual report 2008
COMpany ManageMent
The ChieF exeCuTive oFFiCerThe Chief Executive Officer is responsible for operational governance and for day-to-day management and leadership of the company’s activities, in accordance with the guidelines, instructions and decisions adopted by the Board of Directors.
In addition to the general provisions relating to division of responsibility contained in the Swedish Companies Act, the rules of procedure governing the work of the CEO specify:
• the CEO’s duty to ensure that the Board of Directors receives
information and the necessary documentation on which to base decisions.
• the CEO’s role of presenting reports at Board meetings.• the CEO’s task and duty to ensure that the necessary
information is obtained on a continuous basis from each company in the Group.
• the CEO’s task and duty to monitor compliance with the Board’s decisions in respect of goals, business concept, strategic plans, ethical and other guidelines and, where necessary, request a review of the same by the Board.
• tasks that must always be submitted to the Board, such as major acquisitions and sales or major investments in existing properties.
• the CEO’s task and duty to ensure that Fabege fulfils its obligations in respect of information, etc. under the company’s Listing Agreement with the Stockholm Stock Exchange.
The rules of procedure also contain a separate reporting instruction, which governs the content and timing of reporting to the Board.
grouP mAnAgemenTIn 2008 Group management consisted of seven persons in addition to the CEO (for the current Group management, see page 66):
• Chief Financial Officer• Director of Corporate Communications • Director of Properties (Stockholm City)• Director of Properties (Other Markets)• Director of Projects & Development• Director of Business Development• Director of Marketing
Group management meetings are normally held every two weeks. During the meetings management addresses strategic and operational issues such as property transactions, lettings, market trends, organisational issues and monthly and quarterly business reviews. The Executive Assistant to the CEO also participates in these meetings.
repOrt On internal COntrOl in respeCt
Of finanCial repOrting
Internal control is the process performed by the Board of Directors, company management and other staff for the purpose of building confidence that the company
• has an appropriate and efficient organisation for its business operations
• produces reliable financial reports • complies with applicable laws and regulations
This report has been prepared in accordance with the Swedish Corporate Governance Code (Sections 10.5 and 10.6). The report, which is limited to internal control in respect of financial reporting, does not constitute a part of the formal annual report and has not been examined by the company’s auditors.
In its work the company uses the established COSO framework (Internal Control – Integrated Framework).
ConTrol environmenT Fabege has a geographically well contained organisation and a homogenous operational business, but its legal structure is complex. The business is capital-intensive and is characterised by large monetary flows, including rental income, expenses for project activities, acquisitions/sales of properties and financial expenses.
Overall responsibility for ensuring good internal control and efficient risk management rests with the Board of Directors. To be able to perform its work in an appropriate and efficient manner, the Board has adopted a set of rules of procedure. These contain guidelines for the work of the Board and its committees, the tasks of the Chief Executive Officer and financial reporting. The rules of procedure are updated annually.
Overall responsibility for internal control rests with the company’s management and with those individuals who by virtue of their roles in the company are in charge of each defined critical process, function or area.
In 2008 the Board conducted its annual review and defined the rules of procedure for the Board, the rules of procedure for the Audit Committee and a set of ethical guidelines for the company’s conduct. The company’s financial reporting is governed by policies and guidelines. The company has existing policies for issues such as the environment, equal opportunities and corporate communications, accounting principles and instructions for year-end financial statements, and payment authorisation instructions, which are reviewed and updated continuously.
riSk ASSeSSmenTRisks and critical processes, functions and areas are defined on the basis of the control environment, significant results and
68 COrpOrate gOvernanCe repOrt
Fabege annual report 2008
Fabege annual report 2008
CO
rp
Or
ate
gO
ver
na
nC
e r
epO
rt
balance sheet items as well as significant business processes. Examples of processes, functions and areas that have been defined as critical for Fabege include the processes for the acquisition, sale and valuation of properties, the project process, the finance function, taxes and the year-end accounting and reporting process. Fabege conducts annual reviews and evaluations of risk areas for the purpose of identifying and managing risks through consultation between management, the Audit Committee, the company’s auditors and other parties.
ConTrol ACTiviTieS The Board’s rules of procedure are aimed at ensuring a clear division of responsibility between the Board of Directors (and its committees) and the Chief Executive Officer (and his management group) with a view to achieving efficient risk management in the company’s business operations as well as its financial reporting.
Company management is responsible for designing and documenting and for maintaining and testing the systems/processes and the internal controls that are required to manage significant risks in the accounts and the company’s business operations.
Critical processes, functions and areas are described and documented in respect of division of responsibility, risks and controls. The necessary instructions, procedures and manuals are produced, updated and communicated to the relevant staff to ensure that they have up-to-date knowledge and adequate tools. The measures are aimed at integrating risk management in the company’s daily procedures. Compliance with policies, guidelines and instructions is monitored on an ongoing basis. Employees are given frequent training in how to secure the required expertise.
The operating units, Property Management and Projects & Development, have a separate controller function which supplements the central controller function at Group level. Operating reports are prepared monthly and quarterly based on a standardised reporting package. Executives with responsibility for the operating business comment on/approve the reports.
A central function prepares consolidated financial statements and other financial reports in close collaboration with the controller function/operating units and the finance function. This work includes integrated control activities in the form of reconciliation with stand-alone systems/specifications of outcomes for income and expense items and balance sheet items.
inFormATion And CommuniCATionCompany management is responsible for informing the staff concerned about their responsibility to maintain good internal control. The company’s Intranet and information meetings are used to ensure that employees are kept up-to-date on the company’s governing policies and guidelines.
The communications department is responsible for external information. The company’s IR work is conducted on the basis of principles for regular and accurate information in accordance with stock exchange regulations. The ambition is to create understanding and build confidence in the business among investors and other stakeholders.
In addition to financial reporting to the Board, detailed reports are prepared at more frequent intervals to support of the company’s internal governance and control. Monthly reports are presented and discussed at meetings of Group management.
FolloW-uPThe internal control system also needs to change over time. The aim is to ensure that this is monitored and addressed on an ongoing basis through management work at various levels of the company, both through monitoring of the individuals holding responsibility for each defined critical process, function and area and through ongoing evaluations of the internal control system.
The company’s management reports regularly to the Board in accordance with the instructions for financial reporting, which are designed to ensure that the information provided is relevant, adequate, up-to-date and appropriate.
The Audit Committee also reports to the Board. It acts as an extension of the Board in respect of monitoring the preparation of and reliability of financial reports. The Audit Committee has, in addition to examining the content of and methods used in preparing financial reports, studied the way in which the more detailed and frequent internal reporting is used for evaluating and managing different areas of activity in the business. Such use also provides an indication of the quality of the control environment. The Audit Committee also performs regular reviews and evaluations of internal controls in respect of the company’s critical processes.
The Audit Committee regularly studies the results of the external auditors’ examination of the company’s accounts and internal controls. The auditors examine the company’s financial reporting in respect of the full-year financial statements and perform a review of a quarterly report.
The Board regularly evaluates the information submitted by management and the Audit Committee. Of particular significance, when required, is the Audit Committee’s task of monitoring management’s work on developing internal controls and of ensuring that measures are taken to address any problems and proposals that have been identified in the course of examinations by the Board, Audit Committee or auditors.
The Board of Directors has obtained information from among its members and through the Audit Committee on risk areas, risk management, financial reporting and internal control and has discussed the risks of errors in financial reporting in consultation with the external auditors.
In the course of its examinations the Audit Committee has
COrpOrate gOvernanCe repOrt 69
Fabege annual report 2008
Fabege annual report 2008Fabege annual report 2008
70 COrpOrate gOvernanCe repOrt
not found it necessary to draw the Board’s attention to any significant issues or significant unaddressed risks in its financial reports.
inTernAl AudiTingIn view of the homogenous and geographically limited nature of the business as well as the simple structure of the organisation, the Board has not found it necessary to set up an internal audit unit, based on the view that the monitoring and examination described, along with the work performed by the external auditors, are sufficient to maintain effective internal controls in respect of financial reporting.
auditing
Under the Companies Act, the company’s auditor is required to examine the company’s annual report and accounts as well as the management of the Board of Directors and Chief Executive Officer. After the end of each financial year, the auditor is required to submit an audit report to the Annual General Meeting. Auditors are appointed and compensated in accordance with the resolutions adopted at the Annual General Meeting based on proposals from the Nomination Committee.
At the 2005 AGM the auditing firm Deloitte was appointed as auditor with the authorised public accountant Svante Forsberg as chief auditor for the period up to the 2009 AGM. The Nomination Committee proposes Deloitte, through Svante Forsberg to be re-elected.
In addition to Fabege, Svante Forsberg has audit assignment for the following major companies: Anticimex, Black Earth Farming, Connecta, Diligentia and Skandia Liv. He has no other assignments for companies that are closely related to Fabege’s
major owners or the CEO. In the last four years Deloitte has also assisted Fabege in audit-related assignments, mainly on prospectus and accounting issues.
The auditors reported their observations and simultaneously presented their views on the quality of internal controls in Fabege at the Board meeting held in February 2009. The auditors have participated in and presented reports at all meetings of the Audit Committee (4 in 2008). During the year reports have also been presented to company management.
Fees paid to the company’s auditors are described in Note 45 on page 59.
differenCes in relatiOn tO the COde
The Swedish Corporate Governance Code is based on the principle of ‘comply or explain’, which means that it is not always necessary to follow all rules and that departures from one or several individual rules do not constitute a breach of the Code if such departures are justified and explained.• The entire Board of Directors has met the company’s auditors,
but not without the presence of the Chief Executive Officer or another person from company management. After consulting with the company’s auditors, the Board has not found it necessary to arrange such a meeting, partly because the auditors have on several occasions presented reports to the Audit Committee without the presence of the CEO.
Stockholm, 3 March 2009
The Board of Directors
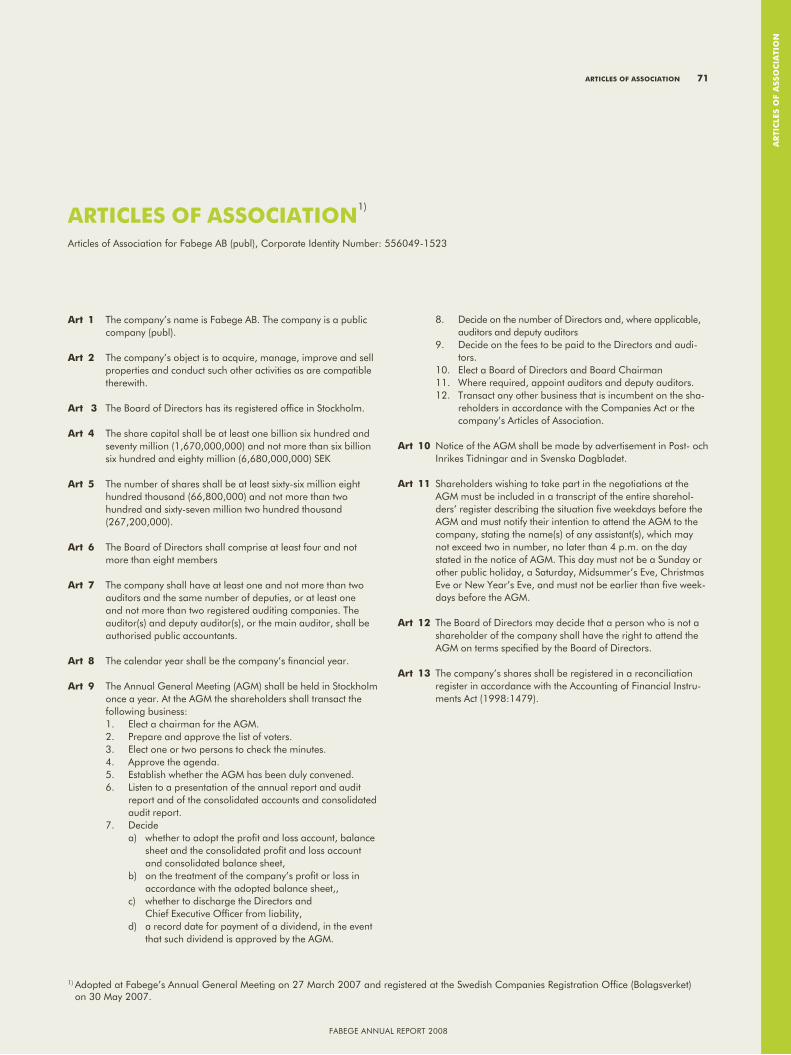
Fabege annual report 2008
ar
tiC
les O
f a
ssO
Cia
tiO
n
artiCles Of assOCiatiOn 71
art 1 the company’s name is Fabege ab. the company is a public company (publ).
art 2 the company’s object is to acquire, manage, improve and sell properties and conduct such other activities as are compatible therewith.
art 3 the board of Directors has its registered office in Stockholm.
art 4 the share capital shall be at least one billion six hundred and seventy million (1,670,000,000) and not more than six billion six hundred and eighty million (6,680,000,000) SeK
art 5 the number of shares shall be at least sixty-six million eight hundred thousand (66,800,000) and not more than two hundred and sixty-seven million two hundred thousand (267,200,000).
art 6 the board of Directors shall comprise at least four and not more than eight members
art 7 the company shall have at least one and not more than two auditors and the same number of deputies, or at least one and not more than two registered auditing companies. the auditor(s) and deputy auditor(s), or the main auditor, shall be authorised public accountants.
art 8 the calendar year shall be the company’s financial year.
art 9 the annual general Meeting (agM) shall be held in Stockholm once a year. at the agM the shareholders shall transact the following business:1. elect a chairman for the agM. 2. prepare and approve the list of voters. 3. elect one or two persons to check the minutes. 4. approve the agenda. 5. establish whether the agM has been duly convened. 6. listen to a presentation of the annual report and audit
report and of the consolidated accounts and consolidated audit report.
7. Decide a) whether to adopt the profit and loss account, balance
sheet and the consolidated profit and loss account and consolidated balance sheet,
b) on the treatment of the company’s profit or loss in accordance with the adopted balance sheet,,
c) whether to discharge the Directors and Chief executive officer from liability,
d) a record date for payment of a dividend, in the event that such dividend is approved by the agM.
8. Decide on the number of Directors and, where applicable, auditors and deputy auditors
9. Decide on the fees to be paid to the Directors and audi-tors.
10. elect a board of Directors and board Chairman11. Where required, appoint auditors and deputy auditors.12. transact any other business that is incumbent on the sha-
reholders in accordance with the Companies act or the company’s articles of association.
art 10 notice of the agM shall be made by advertisement in post- och Inrikes tidningar and in Svenska Dagbladet.
art 11 Shareholders wishing to take part in the negotiations at the agM must be included in a transcript of the entire sharehol-ders’ register describing the situation five weekdays before the agM and must notify their intention to attend the agM to the company, stating the name(s) of any assistant(s), which may not exceed two in number, no later than 4 p.m. on the day stated in the notice of agM. this day must not be a Sunday or other public holiday, a Saturday, Midsummer’s eve, Christmas eve or new Year’s eve, and must not be earlier than five week-days before the agM.
art 12 the board of Directors may decide that a person who is not a shareholder of the company shall have the right to attend the agM on terms specified by the board of Directors.
art 13 the company’s shares shall be registered in a reconciliation register in accordance with the accounting of Financial Instru-ments act (1998:1479).
artiCles Of assOCiatiOnarticles of association for Fabege ab (publ), Corporate Identity number: 556049-1523
1)
1) adopted at Fabege’s annual general Meeting on 27 March 2007 and registered at the Swedish Companies registration office (bolagsverket) on 30 May 2007.
Fabege annual report 2008
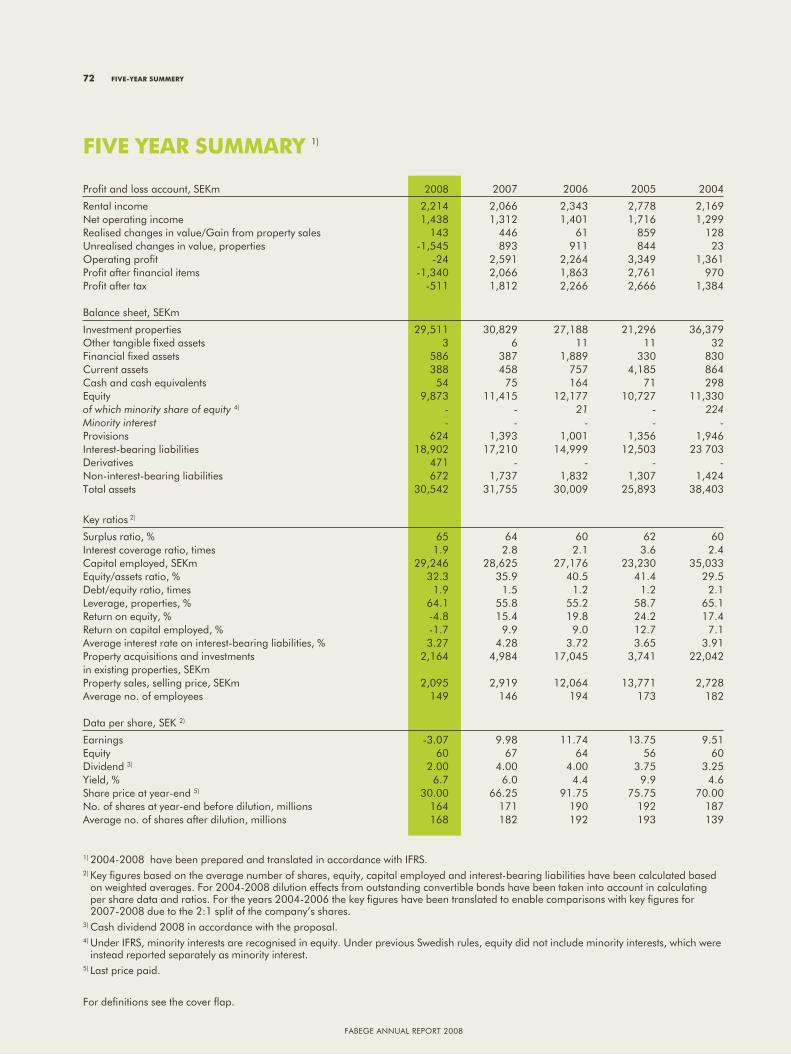
Fabege annual report 2008Fabege annual report 2008
72 five-year suMMery
profit and loss account, SeKm 2008 2007 2006 2005 2004
rental income 2,214 2,066 2,343 2,778 2,169net operating income 1,438 1,312 1,401 1,716 1,299realised changes in value/gain from property sales 143 446 61 859 128unrealised changes in value, properties -1,545 893 911 844 23operating profit -24 2,591 2,264 3,349 1,361profit after financial items -1,340 2,066 1,863 2,761 970profit after tax -511 1,812 2,266 2,666 1,384 balance sheet, SeKm
Investment properties 29,511 30,829 27,188 21,296 36,379other tangible fixed assets 3 6 11 11 32Financial fixed assets 586 387 1,889 330 830Current assets 388 458 757 4,185 864Cash and cash equivalents 54 75 164 71 298equity 9,873 11,415 12,177 10,727 11,330of which minority share of equity 4) - - 21 - 224Minority interest - - - - -provisions 624 1,393 1,001 1,356 1,946Interest-bearing liabilities 18,902 17,210 14,999 12,503 23 703Derivatives 471 - - - -non-interest-bearing liabilities 672 1,737 1,832 1,307 1,424total assets 30,542 31,755 30,009 25,893 38,403
Key ratios 2)
Surplus ratio, % 65 64 60 62 60Interest coverage ratio, times 1.9 2.8 2.1 3.6 2.4Capital employed, SeKm 29,246 28,625 27,176 23,230 35,033equity/assets ratio, % 32.3 35.9 40.5 41.4 29.5Debt/equity ratio, times 1.9 1.5 1.2 1.2 2.1leverage, properties, % 64.1 55.8 55.2 58.7 65.1return on equity, % -4.8 15.4 19.8 24.2 17.4return on capital employed, % -1.7 9.9 9.0 12.7 7.1average interest rate on interest-bearing liabilities, % 3.27 4.28 3.72 3.65 3.91property acquisitions and investments 2,164 4,984 17,045 3,741 22,042in existing properties, SeKm property sales, selling price, SeKm 2,095 2,919 12,064 13,771 2,728average no. of employees 149 146 194 173 182 Data per share, SeK 2)
earnings -3.07 9.98 11.74 13.75 9.51equity 60 67 64 56 60Dividend 3) 2.00 4.00 4.00 3.75 3.25Yield, % 6.7 6.0 4.4 9.9 4.6Share price at year-end 5) 30.00 66.25 91.75 75.75 70.00no. of shares at year-end before dilution, millions 164 171 190 192 187average no. of shares after dilution, millions 168 182 192 193 139
1) 2004-2008 have been prepared and translated in accordance with IFrS.2) Key figures based on the average number of shares, equity, capital employed and interest-bearing liabilities have been calculated based
on weighted averages. For 2004-2008 dilution effects from outstanding convertible bonds have been taken into account in calculating per share data and ratios. For the years 2004-2006 the key figures have been translated to enable comparisons with key figures for 2007-2008 due to the 2:1 split of the company’s shares.
3) Cash dividend 2008 in accordance with the proposal.4) under IFrS, minority interests are recognised in equity. under previous Swedish rules, equity did not include minority interests, which were
instead reported separately as minority interest.5) last price paid. For definitions see the cover flap.
five year suMMary 1)
LIST OF PROPERTIES 31.12.2008– WITH PROPERTIES ACQUIRED AND SOLD
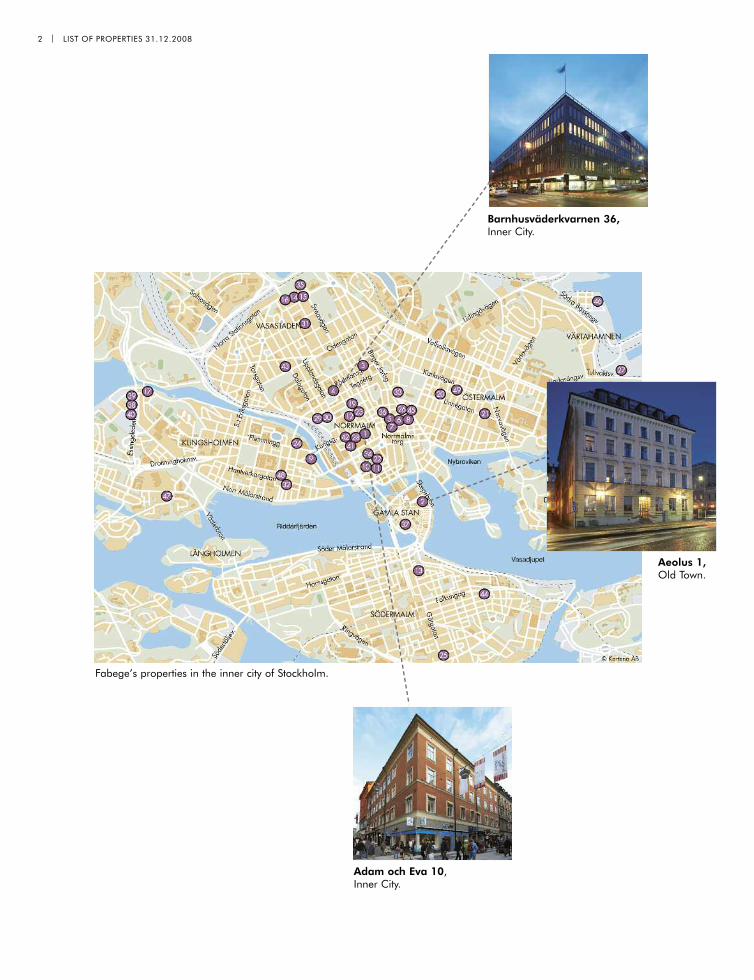
2 | LIST OF PROPERTIES 31.12.2008
Barnhusväderkvarnen 36,Inner City.
Fabege’s properties in the inner city of Stockholm.
Adam och Eva 10,Inner City.
Aeolus 1,Old Town.
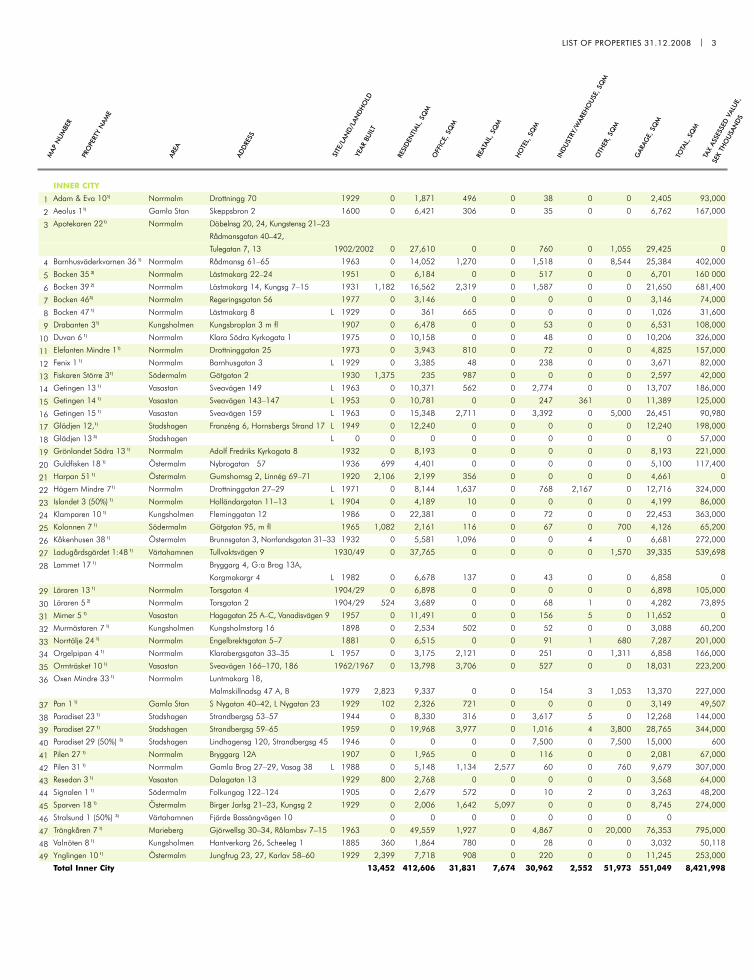
AREA
SITE/LAN
D/LAN
DHOLD
RESIDEN
TIAL, SQM
OFFICE,SQ
M
REATAIL,SQ
M
HOTEL,SQ
M
INDUSTRY/W
AREHOUSE, SQM
OTHER, SQM
GARAG
E,SQ
M
TOTAL,SQ
M
TAXASSESSED
VALUE,
SEKTHOUSANDS
ADDRESS
YEAR
BUILT
PROPERTYNAM
E
MAP
NUMBER
INNER CITY
Adam & Eva 101) Norrmalm Drottningg 70 1929 0 1,871 496 0 38 0 0 2,405 93,000
Aeolus 11) Gamla Stan Skeppsbron 2 1600 0 6,421 306 0 35 0 0 6,762 167,000
Apotekaren 221) Norrmalm Döbelnsg 20, 24, Kungstensg 21–23
Rådmansgatan 40–42,
Tulegatan 7, 13 1902/2002 0 27,610 0 0 760 0 1,055 29,425 0
Barnhusväderkvarnen 36 1) Norrmalm Rådmansg 61–65 1963 0 14,052 1,270 0 1,518 0 8,544 25,384 402,000
Bocken 35 3) Norrmalm Lästmakarg 22–24 1951 0 6,184 0 0 517 0 0 6,701 160 000
Bocken 39 2) Norrmalm Lästmakarg 14, Kungsg 7–15 1931 1,182 16,562 2,319 0 1,587 0 0 21,650 681,400
Bocken 463) Norrmalm Regeringsgatan 56 1977 0 3,146 0 0 0 0 0 3,146 74,000
Bocken 47 1) Norrmalm Lästmakarg 8 L 1929 0 361 665 0 0 0 0 1,026 31,600
Drabanten 31) Kungsholmen Kungsbroplan 3 m fl 1907 0 6,478 0 0 53 0 0 6,531 108,000
Duvan 6 1) Norrmalm Klara Södra Kyrkogata 1 1975 0 10,158 0 0 48 0 0 10,206 326,000
Elefanten Mindre 11) Norrmalm Drottninggatan 25 1973 0 3,943 810 0 72 0 0 4,825 157,000
Fenix 1 1) Norrmalm Barnhusgatan 3 L 1929 0 3,385 48 0 238 0 0 3,671 82,000
Fiskaren Större 31) Södermalm Götgatan 2 1930 1,375 235 987 0 0 0 0 2,597 42,000
Getingen 13 1) Vasastan Sveavägen 149 L 1963 0 10,371 562 0 2,774 0 0 13,707 186,000
Getingen 14 1) Vasastan Sveavägen 143–147 L 1953 0 10,781 0 0 247 361 0 11,389 125,000
Getingen 15 1) Vasastan Sveavägen 159 L 1963 0 15,348 2,711 0 3,392 0 5,000 26,451 90,980
Glädjen 12,1) Stadshagen Franzéng 6, Hornsbergs Strand 17 L 1949 0 12,240 0 0 0 0 0 12,240 198,000
Glädjen 13 3) Stadshagen L 0 0 0 0 0 0 0 0 0 57,000
Grönlandet Södra 13 1) Norrmalm Adolf Fredriks Kyrkogata 8 1932 0 8,193 0 0 0 0 0 8,193 221,000
Guldfisken 18 1) Östermalm Nybrogatan 57 1936 699 4,401 0 0 0 0 0 5,100 117,400
Harpan 51 1) Östermalm Gumshornsg 2, Linnég 69–71 1920 2,106 2,199 356 0 0 0 0 4,661 0
Hägern Mindre 71) Norrmalm Drottninggatan 27–29 L 1971 0 8,144 1,637 0 768 2,167 0 12,716 324,000
Islandet 3 (50%) 1) Norrmalm Holländargatan 11–13 L 1904 0 4,189 10 0 0 0 0 4,199 86,000
Klamparen 10 1) Kungsholmen Fleminggatan 12 1986 0 22,381 0 0 72 0 0 22,453 363,000
Kolonnen 7 1) Södermalm Götgatan 95, m fl 1965 1,082 2,161 116 0 67 0 700 4,126 65,200
Kåkenhusen 38 1) Östermalm Brunnsgatan 3, Norrlandsgatan 31–33 1932 0 5,581 1,096 0 0 4 0 6,681 272,000
Ladugårdsgärdet 1:48 1) Värtahamnen Tullvaktsvägen 9 1930/49 0 37,765 0 0 0 0 1,570 39,335 539,698
Lammet 17 1) Norrmalm Bryggarg 4, G:a Brog 13A,
Korgmakargr 4 L 1982 0 6,678 137 0 43 0 0 6,858 0
Läraren 13 1) Norrmalm Torsgatan 4 1904/29 0 6,898 0 0 0 0 0 6,898 105,000
Läraren 5 2) Norrmalm Torsgatan 2 1904/29 524 3,689 0 0 68 1 0 4,282 73,895
Mimer 5 1) Vasastan Hagagatan 25 A–C, Vanadisvägen 9 1957 0 11,491 0 0 156 5 0 11,652 0
Murmästaren 7 1) Kungsholmen Kungsholmstorg 16 1898 0 2,534 502 0 52 0 0 3,088 60,200
Norrtälje 24 1) Norrmalm Engelbrektsgatan 5–7 1881 0 6,515 0 0 91 1 680 7,287 201,000
Orgelpipan 4 1) Norrmalm Klarabergsgatan 33–35 L 1957 0 3,175 2,121 0 251 0 1,311 6,858 166,000
Ormträsket 10 1) Vasastan Sveavägen 166–170, 186 1962/1967 0 13,798 3,706 0 527 0 0 18,031 223,200
Oxen Mindre 33 1) Norrmalm Luntmakarg 18,
Malmskillnadsg 47 A, B 1979 2,823 9,337 0 0 154 3 1,053 13,370 227,000
Pan 1 1) Gamla Stan S Nygatan 40–42, L Nygatan 23 1929 102 2,326 721 0 0 0 0 3,149 49,507
Paradiset 23 1) Stadshagen Strandbergsg 53–57 1944 0 8,330 316 0 3,617 5 0 12,268 144,000
Paradiset 27 1) Stadshagen Strandbergsg 59–65 1959 0 19,968 3,977 0 1,016 4 3,800 28,765 344,000
Paradiset 29 (50%) 3) Stadshagen Lindhagensg 120, Strandbergsg 45 1946 0 0 0 0 7,500 0 7,500 15,000 600
Pilen 27 1) Norrmalm Bryggarg 12A 1907 0 1,965 0 0 116 0 0 2,081 67,000
Pilen 31 1) Norrmalm Gamla Brog 27–29, Vasag 38 L 1988 0 5,148 1,134 2,577 60 0 760 9,679 307,000
Resedan 3 1) Vasastan Dalagatan 13 1929 800 2,768 0 0 0 0 0 3,568 64,000
Signalen 1 1) Södermalm Folkungag 122–124 1905 0 2,679 572 0 10 2 0 3,263 48,200
Sparven 18 1) Östermalm Birger Jarlsg 21–23, Kungsg 2 1929 0 2,006 1,642 5,097 0 0 0 8,745 274,000
Stralsund 1 (50%) 3) Värtahamnen Fjärde Bassängvägen 10 0 0 0 0 0 0 0 0
Trängkåren 7 1) Marieberg Gjörwellsg 30–34, Rålambsv 7–15 1963 0 49,559 1,927 0 4,867 0 20,000 76,353 795,000
Valnöten 8 1) Kungsholmen Hantverkarg 26, Scheeleg 1 1885 360 1,864 780 0 28 0 0 3,032 50,118
Ynglingen 10 1) Östermalm Jungfrug 23, 27, Karlav 58–60 1929 2,399 7,718 908 0 220 0 0 11,245 253,000
Total Inner City 13,452 412,606 31,831 7,674 30,962 2,552 51,973 551,049 8,421,998
1
2
3
4
5
6
7
8
9
10
11
12
13
14
15
16
17
18
19
20
21
22
23
24
25
26
27
28
29
30
31
32
33
34
35
36
37
38
39
40
41
42
43
44
45
46
47
48
49
LIST OF PROPERTIES 31.12.2008 | 3
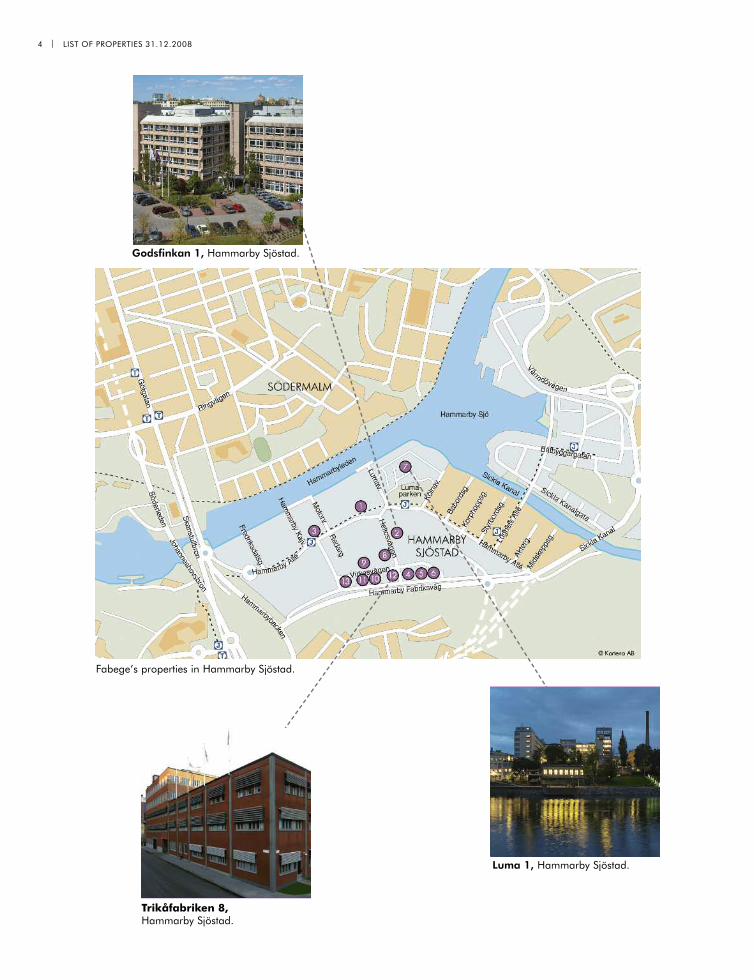
4 | LIST OF PROPERTIES 31.12.2008
Luma 1, Hammarby Sjöstad.
Trikåfabriken 8,Hammarby Sjöstad.
Godsfinkan 1, Hammarby Sjöstad.
Fabege’s properties in Hammarby Sjöstad.
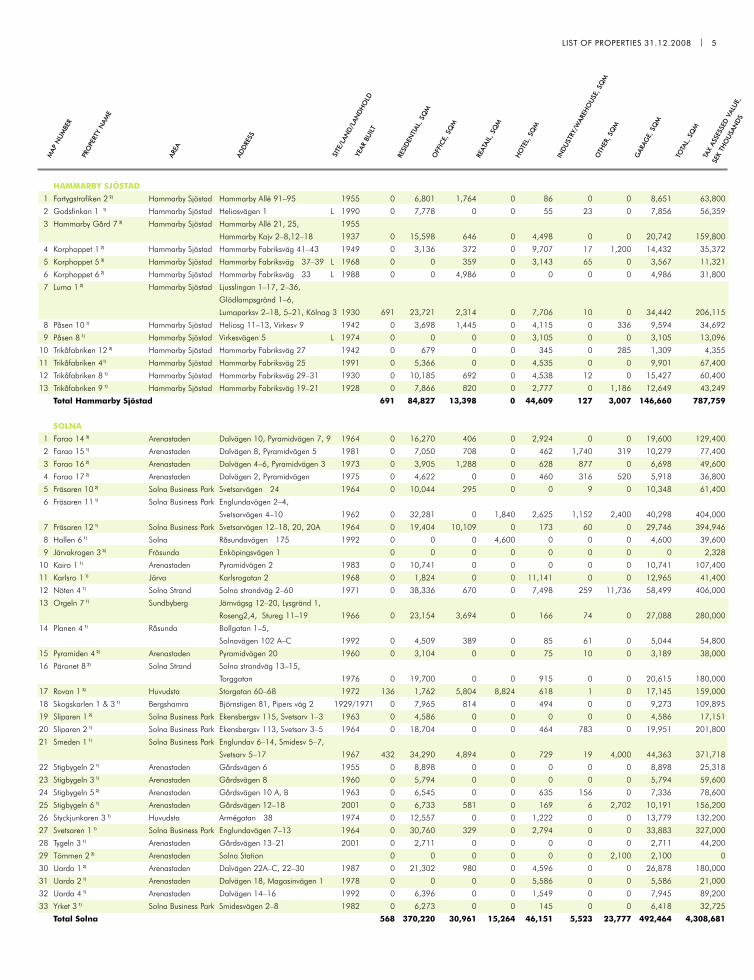
HAMMARBY SJÖSTAD
Fartygstrafiken 2 2) Hammarby Sjöstad Hammarby Allé 91–95 1955 0 6,801 1,764 0 86 0 0 8,651 63,800
Godsfinkan 1 1) Hammarby Sjöstad Heliosvägen 1 L 1990 0 7,778 0 0 55 23 0 7,856 56,359
Hammarby Gård 7 3) Hammarby Sjöstad Hammarby Allé 21, 25, 1955
Hammarby Kajv 2–8,12–18 1937 0 15,598 646 0 4,498 0 0 20,742 159,800
Korphoppet 1 2) Hammarby Sjöstad Hammarby Fabriksväg 41–43 1949 0 3,136 372 0 9,707 17 1,200 14,432 35,372
Korphoppet 5 3) Hammarby Sjöstad Hammarby Fabriksväg 37–39 L 1968 0 0 359 0 3,143 65 0 3,567 11,321
Korphoppet 6 2) Hammarby Sjöstad Hammarby Fabriksväg 33 L 1988 0 0 4,986 0 0 0 0 4,986 31,800
Luma 1 2) Hammarby Sjöstad Ljusslingan 1–17, 2–36,
Glödlampsgränd 1–6,
Lumaparksv 2–18, 5–21, Kölnag 3 1930 691 23,721 2,314 0 7,706 10 0 34,442 206,115
Påsen 10 1) Hammarby Sjöstad Heliosg 11–13, Virkesv 9 1942 0 3,698 1,445 0 4,115 0 336 9,594 34,692
Påsen 8 1) Hammarby Sjöstad Virkesvägen 5 L 1974 0 0 0 0 3,105 0 0 3,105 13,096
Trikåfabriken 12 3) Hammarby Sjöstad Hammarby Fabriksväg 27 1942 0 679 0 0 345 0 285 1,309 4,355
Trikåfabriken 41) Hammarby Sjöstad Hammarby Fabriksväg 25 1991 0 5,366 0 0 4,535 0 0 9,901 67,400
Trikåfabriken 8 1) Hammarby Sjöstad Hammarby Fabriksväg 29–31 1930 0 10,185 692 0 4,538 12 0 15,427 60,400
Trikåfabriken 9 1) Hammarby Sjöstad Hammarby Fabriksväg 19–21 1928 0 7,866 820 0 2,777 0 1,186 12,649 43,249
Total Hammarby Sjöstad 691 84,827 13,398 0 44,609 127 3,007 146,660 787,759
SOLNA
Farao 14 3) Arenastaden Dalvägen 10, Pyramidvägen 7, 9 1964 0 16,270 406 0 2,924 0 0 19,600 129,400
Farao 15 1) Arenastaden Dalvägen 8, Pyramidvägen 5 1981 0 7,050 708 0 462 1,740 319 10,279 77,400
Farao 16 2) Arenastaden Dalvägen 4–6, Pyramidvägen 3 1973 0 3,905 1,288 0 628 877 0 6,698 49,600
Farao 17 2) Arenastaden Dalvägen 2, Pyramidvägen 1975 0 4,622 0 0 460 316 520 5,918 36,800
Fräsaren 10 2) Solna Business Park Svetsarvägen 24 1964 0 10,044 295 0 0 9 0 10,348 61,400
Fräsaren 11 1) Solna Business Park Englundavägen 2–4,
Svetsarvägen 4–10 1962 0 32,281 0 1,840 2,625 1,152 2,400 40,298 404,000
Fräsaren 12 1) Solna Business Park Svetsarvägen 12–18, 20, 20A 1964 0 19,404 10,109 0 173 60 0 29,746 394,946
Hallen 6 1) Solna Råsundavägen 175 1992 0 0 0 4,600 0 0 0 4,600 39,600
Järvakrogen 3 3) Frösunda Enköpingsvägen 1 0 0 0 0 0 0 0 0 2,328
Kairo 1 1) Arenastaden Pyramidvägen 2 1983 0 10,741 0 0 0 0 0 10,741 107,400
Karlsro 1 1) Järva Karlsrogatan 2 1968 0 1,824 0 0 11,141 0 0 12,965 41,400
Nöten 4 1) Solna Strand Solna strandväg 2–60 1971 0 38,336 670 0 7,498 259 11,736 58,499 406,000
Orgeln 7 1) Sundbyberg Järnvägsg 12–20, Lysgränd 1,
Roseng2,4, Stureg 11–19 1966 0 23,154 3,694 0 166 74 0 27,088 280,000
Planen 4 1) Råsunda Bollgatan 1–5,
Solnavägen 102 A–C 1992 0 4,509 389 0 85 61 0 5,044 54,800
Pyramiden 4 2) Arenastaden Pyramidvägen 20 1960 0 3,104 0 0 75 10 0 3,189 38,000
Päronet 8 2) Solna Strand Solna strandväg 13–15,
Torggatan 1976 0 19,700 0 0 915 0 0 20,615 180,000
Rovan 1 3) Huvudsta Storgatan 60–68 1972 136 1,762 5,804 8,824 618 1 0 17,145 159,000
Skogskarlen 1 & 3 1) Bergshamra Björnstigen 81, Pipers väg 2 1929/1971 0 7,965 814 0 494 0 0 9,273 109,895
Sliparen 1 2) Solna Business Park Ekensbergsv 115, Svetsarv 1–3 1963 0 4,586 0 0 0 0 0 4,586 17,151
Sliparen 2 1) Solna Business Park Ekensbergsv 113, Svetsarv 3–5 1964 0 18,704 0 0 464 783 0 19,951 201,800
Smeden 1 1) Solna Business Park Englundav 6–14, Smidesv 5–7,
Svetsarv 5–17 1967 432 34,290 4,894 0 729 19 4,000 44,363 371,718
Stigbygeln 2 1) Arenastaden Gårdsvägen 6 1955 0 8,898 0 0 0 0 0 8,898 25,318
Stigbygeln 3 1) Arenastaden Gårdsvägen 8 1960 0 5,794 0 0 0 0 0 5,794 59,600
Stigbygeln 5 2) Arenastaden Gårdsvägen 10 A, B 1963 0 6,545 0 0 635 156 0 7,336 78,600
Stigbygeln 6 1) Arenastaden Gårdsvägen 12–18 2001 0 6,733 581 0 169 6 2,702 10,191 156,200
Styckjunkaren 3 1) Huvudsta Armégatan 38 1974 0 12,557 0 0 1,222 0 0 13,779 132,200
Svetsaren 1 1) Solna Business Park Englundavägen 7–13 1964 0 30,760 329 0 2,794 0 0 33,883 327,000
Tygeln 3 1) Arenastaden Gårdsvägen 13–21 2001 0 2,711 0 0 0 0 0 2,711 44,200
Tömmen 2 2) Arenastaden Solna Station 0 0 0 0 0 0 2,100 2,100 0
Uarda 1 2) Arenastaden Dalvägen 22A–C, 22–30 1987 0 21,302 980 0 4,596 0 0 26,878 180,000
Uarda 2 1) Arenastaden Dalvägen 18, Magasinvägen 1 1978 0 0 0 0 5,586 0 0 5,586 21,000
Uarda 4 1) Arenastaden Dalvägen 14–16 1992 0 6,396 0 0 1,549 0 0 7,945 89,200
Yrket 3 1) Solna Business Park Smidesvägen 2–8 1982 0 6,273 0 0 145 0 0 6,418 32,725
Total Solna 568 370,220 30,961 15,264 46,151 5,523 23,777 492,464 4,308,681
1
2
3
4
5
6
7
8
9
10
11
12
13
1
2
3
4
5
6
7
8
9
10
11
12
13
14
15
16
17
18
19
20
21
22
23
24
25
26
27
28
29
30
31
32
33
LIST OF PROPERTIES 31.12.2008 | 5
AREA
SITE/LAN
D/LAN
DHOLD
RESIDEN
TIAL, SQM
OFFICE,SQ
M
REATAIL,SQ
M
HOTEL,SQ
M
INDUSTRY/W
AREHOUSE, SQM
OTHER, SQM
GARAG
E,SQ
M
TOTAL,SQ
M
TAXASSESSED
VALUE,
SEKTHOUSANDS
ADDRESS
YEAR
BUILT
PROPERTYNAM
E
MAP
NUMBER
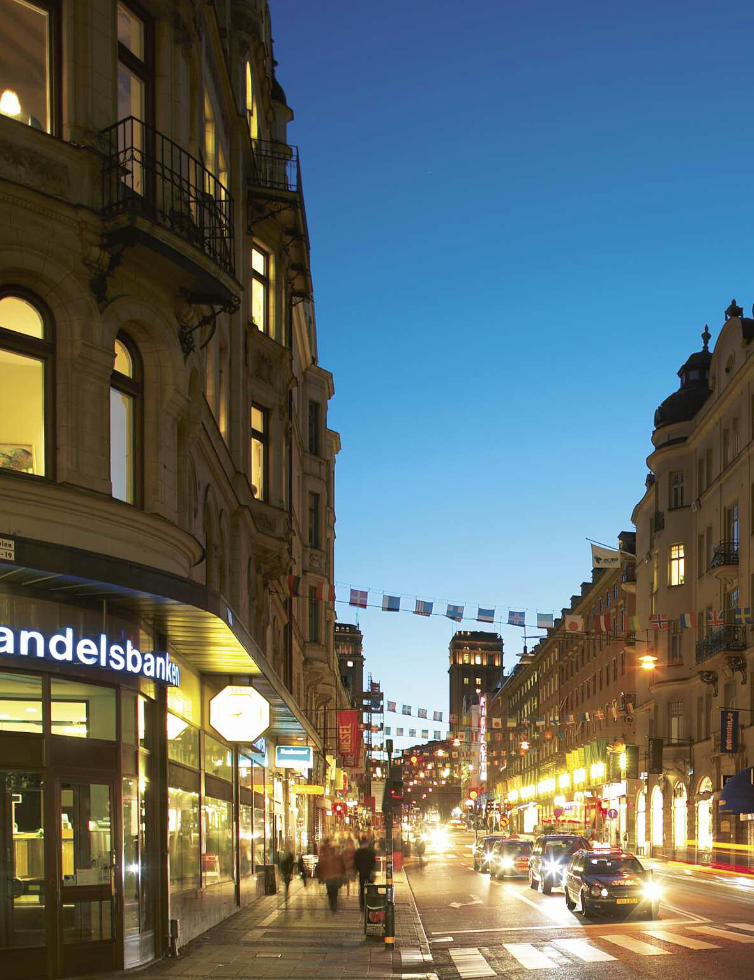
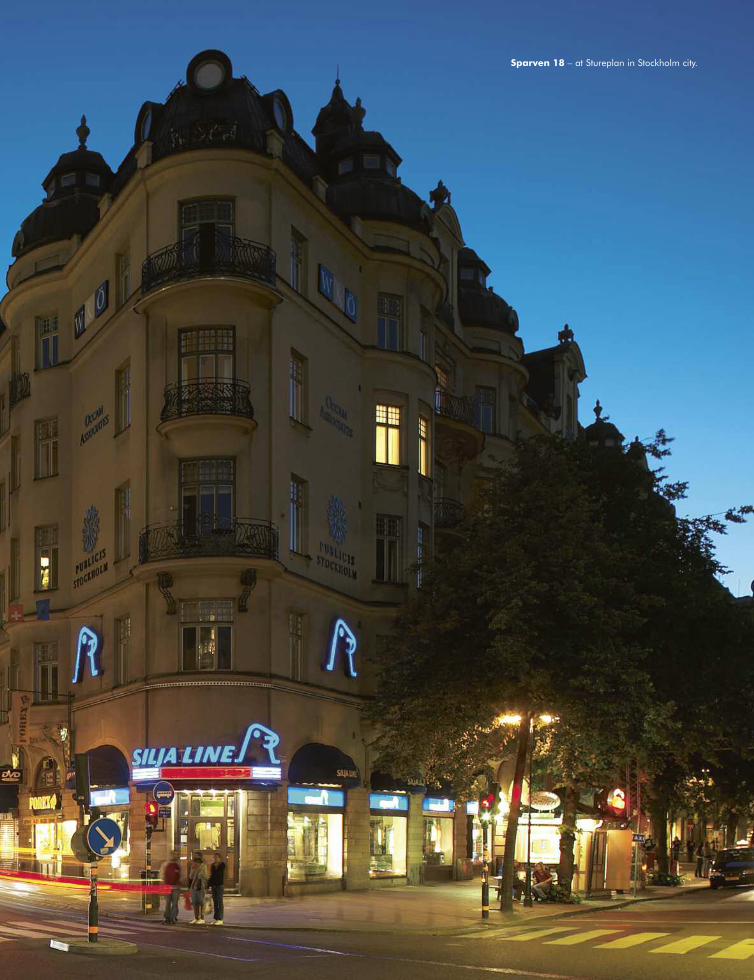
Sparven 18 – at Stureplan in Stockholm city.
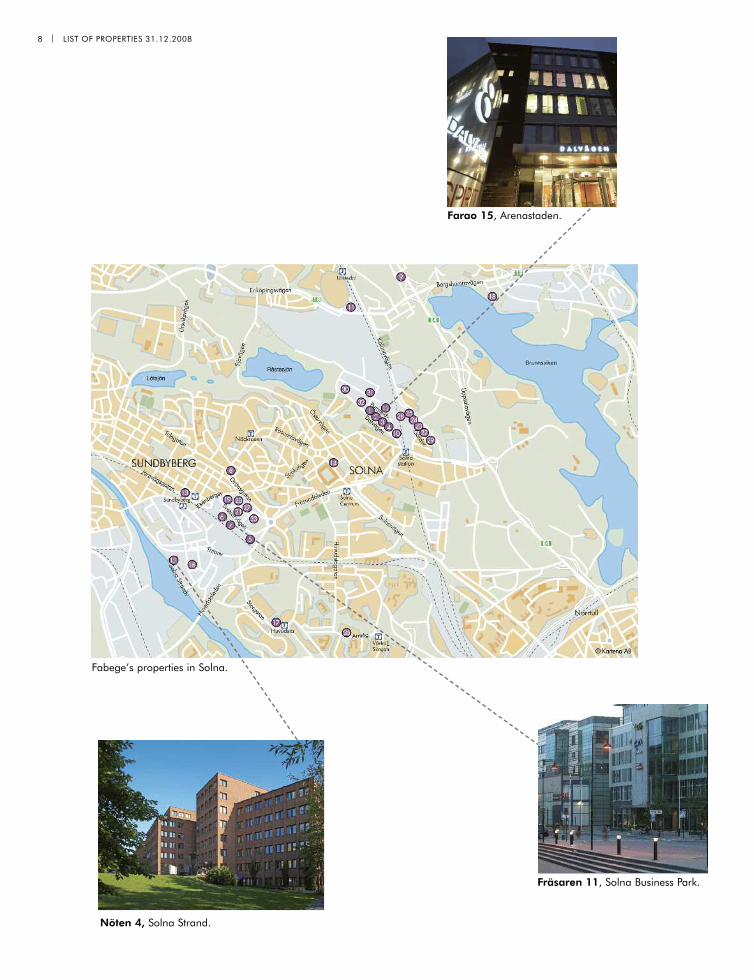
8 | LIST OF PROPERTIES 31.12.2008
Farao 15, Arenastaden.
Nöten 4, Solna Strand.
Fräsaren 11, Solna Business Park.
Fabege’s properties in Solna.
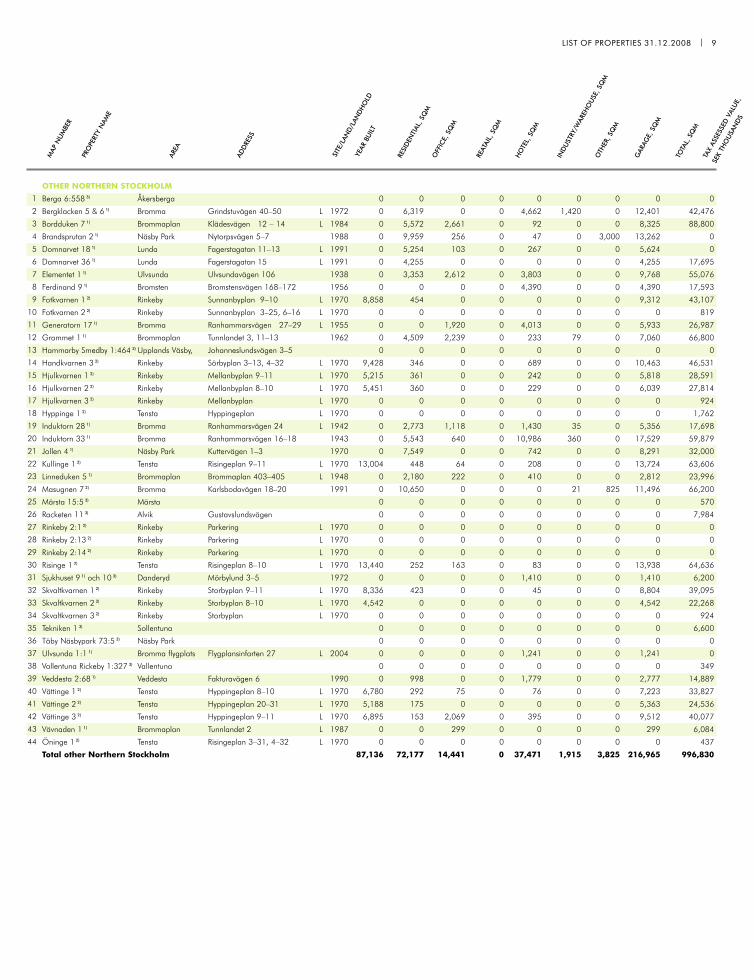
OTHER NORTHERN STOCKHOLM
Berga 6:558 3) Åkersberga 0 0 0 0 0 0 0 0 0
Bergklacken 5 & 6 1) Bromma Grindstuvägen 40–50 L 1972 0 6,319 0 0 4,662 1,420 0 12,401 42,476
Bordduken 7 1) Brommaplan Klädesvägen 12 – 14 L 1984 0 5,572 2,661 0 92 0 0 8,325 88,800
Brandsprutan 2 1) Näsby Park Nytorpsvägen 5–7 1988 0 9,959 256 0 47 0 3,000 13,262 0
Domnarvet 18 1) Lunda Fagerstagatan 11–13 L 1991 0 5,254 103 0 267 0 0 5,624 0
Domnarvet 36 1) Lunda Fagerstagatan 15 L 1991 0 4,255 0 0 0 0 0 4,255 17,695
Elementet 1 1) Ulvsunda Ulvsundavägen 106 1938 0 3,353 2,612 0 3,803 0 0 9,768 55,076
Ferdinand 9 1) Bromsten Bromstensvägen 168–172 1956 0 0 0 0 4,390 0 0 4,390 17,593
Fotkvarnen 1 2) Rinkeby Sunnanbyplan 9–10 L 1970 8,858 454 0 0 0 0 0 9,312 43,107
Fotkvarnen 2 2) Rinkeby Sunnanbyplan 3–25, 6–16 L 1970 0 0 0 0 0 0 0 0 819
Generatorn 17 1) Bromma Ranhammarsvägen 27–29 L 1955 0 0 1,920 0 4,013 0 0 5,933 26,987
Grammet 1 1) Brommaplan Tunnlandet 3, 11–13 1962 0 4,509 2,239 0 233 79 0 7,060 66,800
Hammarby Smedby 1:464 3) Upplands Väsby, Johanneslundsvägen 3–5 0 0 0 0 0 0 0 0 0
Handkvarnen 3 2) Rinkeby Sörbyplan 3–13, 4–32 L 1970 9,428 346 0 0 689 0 0 10,463 46,531
Hjulkvarnen 1 2) Rinkeby Mellanbyplan 9–11 L 1970 5,215 361 0 0 242 0 0 5,818 28,591
Hjulkvarnen 2 2) Rinkeby Mellanbyplan 8–10 L 1970 5,451 360 0 0 229 0 0 6,039 27,814
Hjulkvarnen 3 2) Rinkeby Mellanbyplan L 1970 0 0 0 0 0 0 0 0 924
Hyppinge 1 2) Tensta Hyppingeplan L 1970 0 0 0 0 0 0 0 0 1,762
Induktorn 28 1) Bromma Ranhammarsvägen 24 L 1942 0 2,773 1,118 0 1,430 35 0 5,356 17,698
Induktorn 33 1) Bromma Ranhammarsvägen 16–18 1943 0 5,543 640 0 10,986 360 0 17,529 59,879
Jollen 4 1) Näsby Park Kuttervägen 1–3 1970 0 7,549 0 0 742 0 0 8,291 32,000
Kullinge 1 2) Tensta Risingeplan 9–11 L 1970 13,004 448 64 0 208 0 0 13,724 63,606
Linneduken 5 1) Brommaplan Brommaplan 403–405 L 1948 0 2,180 222 0 410 0 0 2,812 23,996
Masugnen 7 2) Bromma Karlsbodavägen 18–20 1991 0 10,650 0 0 0 21 825 11,496 66,200
Märsta 15:5 3) Märsta 0 0 0 0 0 0 0 0 570
Racketen 11 3) Alvik Gustavslundsvägen 0 0 0 0 0 0 0 0 7,984
Rinkeby 2:1 2) Rinkeby Parkering L 1970 0 0 0 0 0 0 0 0 0
Rinkeby 2:13 2) Rinkeby Parkering L 1970 0 0 0 0 0 0 0 0 0
Rinkeby 2:14 2) Rinkeby Parkering L 1970 0 0 0 0 0 0 0 0 0
Risinge 1 2) Tensta Risingeplan 8–10 L 1970 13,440 252 163 0 83 0 0 13,938 64,636
Sjukhuset 9 1) och 10 3) Danderyd Mörbylund 3–5 1972 0 0 0 0 1,410 0 0 1,410 6,200
Skvaltkvarnen 1 2) Rinkeby Storbyplan 9–11 L 1970 8,336 423 0 0 45 0 0 8,804 39,095
Skvaltkvarnen 2 2) Rinkeby Storbyplan 8–10 L 1970 4,542 0 0 0 0 0 0 4,542 22,268
Skvaltkvarnen 3 2) Rinkeby Storbyplan L 1970 0 0 0 0 0 0 0 0 924
Tekniken 1 3) Sollentuna 0 0 0 0 0 0 0 0 6,600
Täby Näsbypark 73:5 3) Näsby Park 0 0 0 0 0 0 0 0 0
Ulvsunda 1:1 1) Bromma flygplats Flygplansinfarten 27 L 2004 0 0 0 0 1,241 0 0 1,241 0
Vallentuna Rickeby 1:327 3) Vallentuna 0 0 0 0 0 0 0 0 349
Veddesta 2:68 1) Veddesta Fakturavägen 6 1990 0 998 0 0 1,779 0 0 2,777 14,889
Vättinge 1 2) Tensta Hyppingeplan 8–10 L 1970 6,780 292 75 0 76 0 0 7,223 33,827
Vättinge 2 2) Tensta Hyppingeplan 20–31 L 1970 5,188 175 0 0 0 0 0 5,363 24,536
Vättinge 3 2) Tensta Hyppingeplan 9–11 L 1970 6,895 153 2,069 0 395 0 0 9,512 40,077
Vävnaden 1 1) Brommaplan Tunnlandet 2 L 1987 0 0 299 0 0 0 0 299 6,084
Öninge 1 2) Tensta Risingeplan 3–31, 4–32 L 1970 0 0 0 0 0 0 0 0 437
Total other Northern Stockholm 87,136 72,177 14,441 0 37,471 1,915 3,825 216,965 996,830
1
2
3
4
5
6
7
8
9
10
11
12
13
14
15
16
17
18
19
20
21
22
23
24
25
26
27
28
29
30
31
32
33
34
35
36
37
38
39
40
41
42
43
44
LIST OF PROPERTIES 31.12.2008 | 9
AREA
SITE/LAN
D/LAN
DHOLD
RESIDEN
TIAL, SQM
OFFICE,SQ
M
REATAIL,SQ
M
HOTEL,SQ
M
INDUSTRY/W
AREHOUSE, SQM
OTHER, SQM
GARAG
E,SQ
M
TOTAL,SQ
M
TAXASSESSED
VALUE,
SEKTHOUSANDS
ADDRESS
YEAR
BUILT
PROPERTYNAM
E
MAP
NUMBER
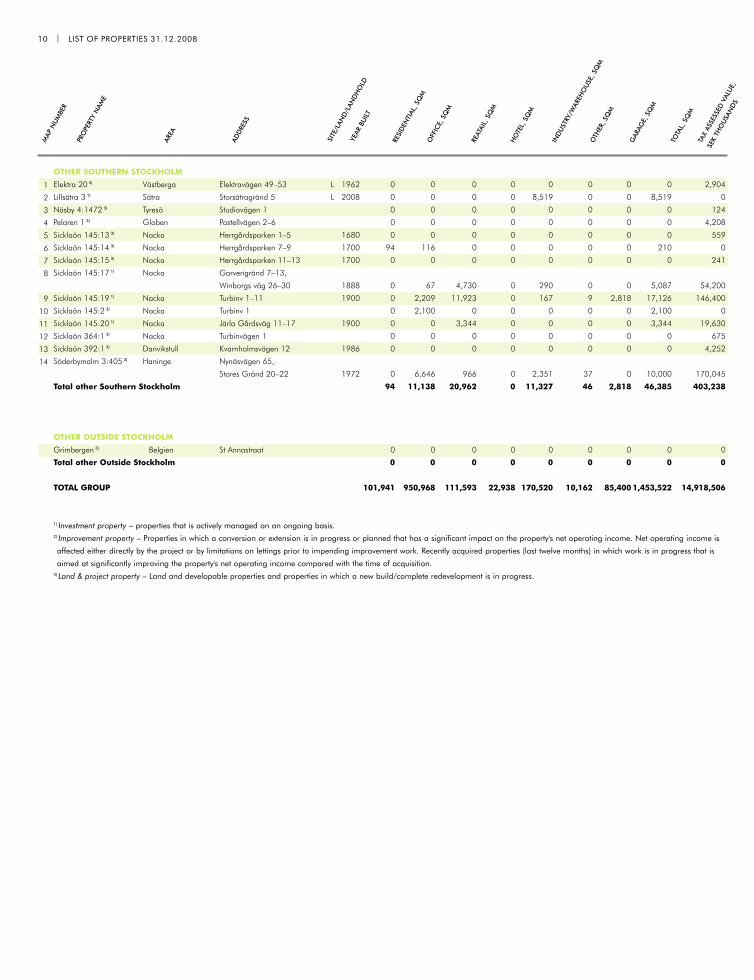
OTHER SOUTHERN STOCKHOLM
Elektra 20 3) Västberga Elektravägen 49–53 L 1962 0 0 0 0 0 0 0 0 2,904
Lillsätra 3 1) Sätra Storsätragränd 5 L 2008 0 0 0 0 8,519 0 0 8,519 0
Näsby 4:1472 3) Tyresö Studiovägen 1 0 0 0 0 0 0 0 0 124
Pelaren 1 3) Globen Pastellvägen 2–6 0 0 0 0 0 0 0 0 4,208
Sicklaön 145:13 3) Nacka Herrgårdsparken 1–5 1680 0 0 0 0 0 0 0 0 559
Sicklaön 145:14 3) Nacka Herrgårdsparken 7–9 1700 94 116 0 0 0 0 0 210 0
Sicklaön 145:15 3) Nacka Herrgårdsparken 11–13 1700 0 0 0 0 0 0 0 0 241
Sicklaön 145:17 1) Nacka Garverigränd 7–13,
Winborgs väg 26–30 1888 0 67 4,730 0 290 0 0 5,087 54,200
Sicklaön 145:19 1) Nacka Turbinv 1–11 1900 0 2,209 11,923 0 167 9 2,818 17,126 146,400
Sicklaön 145:2 3) Nacka Turbinv 1 0 2,100 0 0 0 0 0 2,100 0
Sicklaön 145:20 1) Nacka Järla Gårdsväg 11–17 1900 0 0 3,344 0 0 0 0 3,344 19,630
Sicklaön 364:1 3) Nacka Turbinvägen 1 0 0 0 0 0 0 0 0 675
Sicklaön 392:1 3) Danvikstull Kvarnholmsvägen 12 1986 0 0 0 0 0 0 0 0 4,252
Söderbymalm 3:405 3) Haninge Nynäsvägen 65,
Stores Gränd 20–22 1972 0 6,646 966 0 2,351 37 0 10,000 170,045
Total other Southern Stockholm 94 11,138 20,962 0 11,327 46 2,818 46,385 403,238
OTHER OUTSIDE STOCKHOLM
Grimbergen 3) Belgien St Annastraat 0 0 0 0 0 0 0 0 0
Total other Outside Stockholm 0 0 0 0 0 0 0 0 0
TOTAL GROUP 101,941 950,968 111,593 22,938 170,520 10,162 85,4001,453,522 14,918,506
1) Investment property – properties that is actively managed on an ongoing basis.2) Improvement property – Properties in which a conversion or extension is in progress or planned that has a significant impact on the property's net operating income. Net operating income is
affected either directly by the project or by limitations on lettings prior to impending improvement work. Recently acquired properties (last twelve months) in which work is in progress that is
aimed at significantly improving the property's net operating income compared with the time of acquisition.3) Land & project property – Land and developable properties and properties in which a new build/complete redevelopment is in progress.
1
2
3
4
5
6
7
8
9
10
11
12
13
14
10 | LIST OF PROPERTIES 31.12.2008
AREA
SITE/LAN
D/LAN
DHOLD
RESIDEN
TIAL, SQM
OFFICE,SQ
M
REATAIL,SQ
M
HOTEL,SQ
M
INDUSTRY/W
AREHOUSE, SQM
OTHER, SQM
GARAG
E,SQ
M
TOTAL,SQ
M
TAXASSESSED
VALUE,
SEKTHOUSANDS
ADDRESS
YEAR
BUILT
PROPERTYNAM
E
MAP
NUMBER
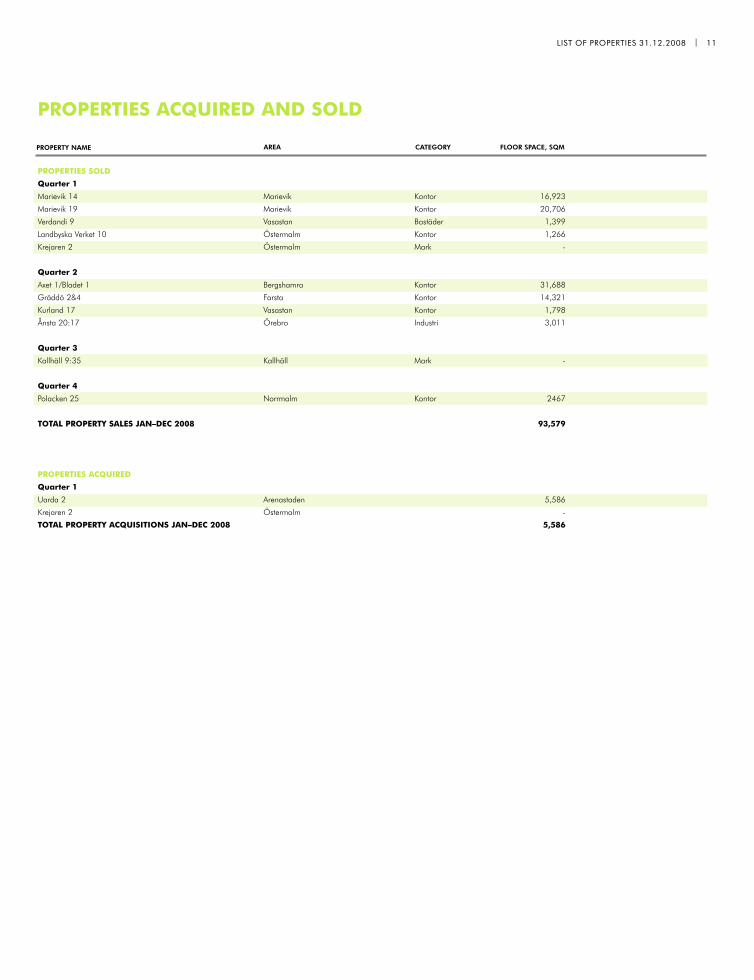
PROPERTIES SOLD
Quarter 1
Marievik 14 Marievik Kontor 16,923
Marievik 19 Marievik Kontor 20,706
Verdandi 9 Vasastan Bostäder 1,399
Landbyska Verket 10 Östermalm Kontor 1,266
Krejaren 2 Östermalm Mark -
Quarter 2
Axet 1/Bladet 1 Bergshamra Kontor 31,688
Gräddö 2&4 Farsta Kontor 14,321
Kurland 17 Vasastan Kontor 1,798
Ånsta 20:17 Örebro Industri 3,011
Quarter 3
Kallhäll 9:35 Kallhäll Mark -
Quarter 4
Polacken 25 Norrmalm Kontor 2467
TOTAL PROPERTY SALES JAN–DEC 2008 93,579
PROPERTIES ACQUIRED
Quarter 1
Uarda 2 Arenastaden 5,586
Krejaren 2 Östermalm -
TOTAL PROPERTY ACQUISITIONS JAN–DEC 2008 5,586
AREA CATEGORYPROPERTY NAME FLOOR SPACE, SQM
PROPERTIES ACQUIRED AND SOLD
LIST OF PROPERTIES 31.12.2008 | 11
READ MORE ABOUT OUR PROPERTIES AT WWW.FABEGE.SE

HISTORY
1990 Wihlborgs’ B shares are listed on the O List of the Stockholm StockExchange.
1993 Bergaliden becomes the new main owner of Wihlborgs.
1996 In December Wihlborgs’ B shares are listed on the A List of the Stock-holm Stock Exchange.
1997 In the spring Wihlborgs completes the acquisition of M2 Fastigheter. InSeptember the Board of Wihlborgs submits a public offer to acquire KlövernFastigheter AB.
1998 At the beginning of the year Wihlborgs completes the acquisition of Klö-vern Fastigheter AB. On 13 April 1998 Wihlborgs puts in an offer for Fastig-hets AB Storheden. The merger is carried out in late summer the same year.
2000 High voting A shares are converted into B shares.
2001 The main owner Bergaliden sells its entire shareholding of 30.2 percent in Wihlborgs. Wihlborgs acquires Postfastigheter along with its portfolioof 73 properties. In December Wihlborgs’ shares are listed on the O List ofthe Stockholm Stock Exchange.
2002 Wihlborgs sells 60 properties in nonpriority locations to Adcore, whichis reorganised into a property company under the name of Klövern AB. InJune Wihlborgs effects a 1:5 reverse split. In December Wihlborgs acquiresthe remaining 25 per cent of the shares i Klara Zenit.
2003 Wihlborgs acquires shares in Drott AB (later divided into Bostads ABDrott and Fabege AB), and becomes the company’s largest shareholderduring the year. At the end of the year Wihlborgs sells Klara Zenit for SEK2,950 million, generating a profit of SEK 400 million.
2004 Wihlborgs completes its acquisition of Fabege AB after a public offer toother shareholders of the company, adding about 150 commercial propertiesto its portfolio. In December the company announces its proposal to spin offits Öresund properties to the shareholders and concentrate the business tothe Stockholm region.
2005 The Öresund business is distributed to the shareholders and listed onthe O List of the Stockholm Stock Exchange under the name of WihlborgsFastigheter AB. “Old” Wihlborgs is thus concentrated to the Stockholm regionand changes its name to Fabege AB. Fabege divests properties worth SEK 14billion during the year. In December the company concludes an agreement toacquire 82.4 per cent of the shares of Fastighets AB Tornet.
2006 Fabege acquires Fastighets AB Tornet along with its portfolio of 104properties. Other acquisitions include the WennerGren Center and SolnaBusiness Park. Fabege’s property holdings in Kista and Täby are sold to Klö-vern for SEK 4 billion. Fabege’s property transactions total SEK 28 billion, ofwhich SEK 12 billion are sales and SEK 16 billion purchases.
2007 Fabege continues to concentrate its business to its main markets, Stock-holm Inner City, Solna and Hammarby Sjöstad. 17 properties are sold and 8are acquired. In June the company effects a 2:1 share split, doubling thenumber of shares.
2008 13 properties were sold, while 2 were acquired. Fabege increased tem-po of projects where existing properties are processed and developed toincrease cash flow and value growth.
PRODUCTION: Fabege in partnership with Löwenberg Media PRINT: Arkitektkopia 2009.PHOTOGRAPHERS: Per-Erik Adamsson, Victor Brott, Mia Carlsson and Anders Roth.

DEFINITIONS
RETURN ON EQUITY Profit for the period/year divided by average share-holders’ equity. In interim statements the return is converted to its annuali-sed value without taking account of seasonal variations.
RETURN ON CAPITAL EMPLOYED Profit before tax plus interest expenses,divided by average capital employed. In interim statements the return is con-verted to its annualised value without taking account of seasonal variations.
LEVERAGE, PROPERTIES Interest-bearing liabilities divided by the bookvalue of the properties at the end of the period.
YIELD, SHARE Dividend for the year divided by the share price at year-end.
EQUITY PER SHARE Parent company shareholders’ share of equity accor-ding to the balance sheet divided by the number of shares at the end of theperiod.
FINANCIAL OCCUPANCY RATE Contract value divided by rental value atthe end of the period.
INVESTMENT PROPERTIES Properties that are being actively managed onan ongoing basis.
IMPROVEMENT PROPERTIES Properties in which a conversion or extensionis in progress or planned that has a significant impact on the property’s netoperating income. Net operating income is affected either directly by theproject or by limitations on lettings prior to impending improvement work.Recently acquired properties (last twelve months) in which work is in pro-gress that is aimed at significantly improving the property’s net operatingincome compared with the time of acquisition.
RENTAL VALUE Contract value plus estimated annual rent for vacant pre-mises after a reasonable general renovation.
CASH FLOW PER SHARE Profit before tax plus depreciation, plus/minusunrealised changes in value less current tax, divided by average number ofshares.
CONTRACT VALUE Stated as an annual value. Index-adjusted basic rentunder the rental agreement plus rent supplements.
LAND & PROJECT PROPERTIES Land and developable properties and pro-perties in which a new build/complete redevelopment is in progress.
NET LETTINGS New lettings during the period less terminations to vacate.
PROFIT/EARNINGS PER SHARE Parent company shareholders’ share ofprofit after tax for the period divided by average number of outstandingshares during the period.
INTEREST COVERAGE RATIO Profit after financial items plus financialexpenses and plus/minus unrealised changes in value, divided by financialexpenses.
DEBT/EQUITY RATIO Interest-bearing liabilities divided by shareholders’equity.
EQUITY/ASSETS RATIO Shareholders’ equity (including minority share)divided by total assets.
CAPITAL EMPLOYED Total assets less noninterest bearing liabilities andprovisions.
SURPLUS RATIO Net operating income divided by rental income..
FABEGE AB (PUBL)
P O BOX 730, SE-169 27 SOLNA
VISITORS: DALVÄGEN 8, SE-169 56 SOLNA
PHONE: +46 (0)8-555 148 00
FAX: +46 (0)8-555 148 01
E-MAIL: [email protected]
INTERNET: WWW.FABEGE.SE
CORPORATE IDENTITY NO: 556049-1523
BOARD REGISTRED OFFICE: STOCKHOLM