FAA Aerospace Forecast · control air traffic. Precise, satellitebased navigation is already...
124
HQ-121545 FAA Aerospace Forecast Fiscal Years 2012-2032 U.S. Department of Transportation Federal Aviation Administration Aviation Policy and Plans
Transcript of FAA Aerospace Forecast · control air traffic. Precise, satellitebased navigation is already...

HQ
-121
545
FAA Aerospace ForecastFiscal Years 2012-2032
U.S. Department of Transportation Federal Aviation Administration Aviation Policy and Plans


FAA Aerospace Forecast Fiscal Years 2012-2032
Message from the Administrator The aviation industry continued to show resilience last year despite tough economic times. The activity of U.S. carriers at home and abroad increased by 3.5 percent in 2011. Despite a slight pause in growth projected for 2012, we expect that over the long run, aviation will continue to experience steady, moderate growth. U.S. airlines have returned to profitability in the last two years and we expect that trend will continue in 2012 as well. This forecast looks at how many planes and how many people will fly on U.S. carriers in the future – from 2012 to 2032. We want to see a picture of air travel in the next 20 years, and we want to know what we at the FAA should strive to meet and accommodate. The FAA sees a competitive and profitable industry continuing to grow over the long term despite the fact that we are operating in a climate of economic uncertainty and rising oil prices. As the economy continues to recover, the total number of takeoffs and landings and the number of passengers who board U.S. airlines will continue to climb. This year, we expect that international markets for U.S. carriers will continue to grow faster than domestic markets, as they did last year. The forecast calls for a slight decrease –less than one percent—in domestic capacity in 2012, as measured by available seat miles. This is after a 2 percent increase in 2011. Despite this pause in growth, the FAA projects continued growth between 2 percent and 3 percent per year over the next 20 years. This year’s forecast predicts that the industry will grow from 731 million passengers in 2011 to 1.2 billion in 2032. Cumulatively, air traffic growth for U.S. carriers–measured by revenue passenger miles–is expected to rise by more than 90 percent in the next 20 years. It grew by 3.5 percent in 2011. Airport tower operations are expected to increase by 23 percent. Also, the number of aircraft handled at FAA en-route centers, which separate high altitude traffic, is expected to increase by 50 percent. Over the next 20 years, large airports will continue to grow faster than their smaller counterparts in the United States. We are forecasting that the number of larger regional jets will increase, while most of the smaller regional jets will be retired from the fleet. On the general aviation front, the demand for products and services will continue to grow, particularly in new business jets and light sport aircraft. As our aviation system advances into the next century of flight, the solution for handling the demand for service is the Next Generation Air Transportation System, or NextGen. We are in
FAA Aerospace Forecast Fiscal Years 2012-2032
the process of transforming our national air space system from the ground-based radar of today, to the satellite-based system of tomorrow. This is a fundamental change in the way the United States and the world will navigate and control air traffic. Precise, satellite-based navigation is already revolutionizing the way we do business today. Technology is helping us to become safer, quieter, cleaner and more efficient with our assets. We are creating a new template for the way we manage air traffic, yet the FAA’s core mission remains the same. We will continue to work every day to deliver the safest and most efficient aerospace system in the world.
Michael P. Huerta FAA Acting Administrator

FAA Aerospace Forecast Fiscal Years 2012-2032
Table of Contents FORECAST HIGHLIGHTS .........................................................................................................................................1
REVIEW OF 2011 .......................................................................................................................................................3
U.S. ECONOMIC ACTIVITY ...................................................................................................................................5 WORLD ECONOMIC ACTIVITY .............................................................................................................................8 COMMERCIAL AVIATION ......................................................................................................................................9
World Travel Demand .........................................................................................................................................9 U.S. Travel Demand ......................................................................................................................................... 13
Commercial Air Carriers – Passenger .......................................................................................................... 14 Domestic Passenger Markets ....................................................................................................................... 16 International Passenger Markets .................................................................................................................. 19 Commercial Air Carriers – Cargo.................................................................................................................. 21 International Air Cargo Revenue Ton Miles by Region ................................................................................ 23
U.S. Commercial Air Carriers 2011 Financial Results ..................................................................................... 23 U.S. Commercial Air Carriers 2011 Aircraft Fleets ........................................................................................... 25
GENERAL AVIATION .......................................................................................................................................... 27 FAA WORKLOAD ................................................................................................................................................ 29
FAA AEROSPACE FORECASTS .......................................................................................................................... 32
ECONOMIC FORECASTS .................................................................................................................................. 34 World Economy ................................................................................................................................................ 36
AVIATION TRAFFIC AND ACTIVITY FORECASTS ............................................................................................ 38 Commercial Aviation Forecasts ........................................................................................................................ 38
Domestic Markets ......................................................................................................................................... 39 International Markets .................................................................................................................................... 44
Commercial Aircraft Fleet ................................................................................................................................. 49 General Aviation ............................................................................................................................................... 51 FAA Workload Forecasts ................................................................................................................................. 54
FAA and Contract Towers ............................................................................................................................ 54 En-route Centers .......................................................................................................................................... 55
UNMANNED AIRCRAFT SYSTEMS ...................................................................................................................... 57
COMMERCIAL SPACE TRANSPORTATION ........................................................................................................ 58
OVERVIEW ............................................................................................................................................................. 58 REVIEW OF 2011 .................................................................................................................................................... 59 GLOBAL FORECAST ................................................................................................................................................ 59
RISKS TO THE FORECASTS ................................................................................................................................ 61
APPENDIX A: ALTERNATIVE FORECAST SCENARIOS ................................................................................... 64
SCENARIO ASSUMPTIONS ....................................................................................................................................... 64 ALTERNATIVE FORECASTS ...................................................................................................................................... 68
Passengers ....................................................................................................................................................... 68 Revenue Passenger Miles ............................................................................................................................... 68 Available Seat Miles ......................................................................................................................................... 69 Load Factor ...................................................................................................................................................... 70 Yield .................................................................................................................................................................. 70 Passenger Trip Length ..................................................................................................................................... 71
APPENDIX B: FAA FORECAST ACCURACY ..................................................................................................... 76
APPENDIX C: ACKNOWLEDGEMENTS .............................................................................................................. 79
APPENDIX D: FORECAST TABLES .................................................................................................................... 81

FAA Aerospace Forecast Fiscal Years 2012-2032
This page has been intentionally left blank.
FAA Aerospace Forecast Fiscal Years 2012-2032
1
FORECAST HIGHLIGHTS 2012-2032
Since the beginning of the century, the commercial air carrier industry has suffered several major shocks that have led to reduced demand for air travel. These shocks include the terror attacks of September 11, skyrocketing prices for fuel, debt restructuring in Europe and the United States (U.S.), and a global recession. To manage this period of extreme volatility, air carriers have fine-tuned their business models with the aim of minimizing financial losses by lowering operating costs, eliminating unprofitable routes and grounding older, less fuel efficient aircraft. To increase operating revenues, carriers have initiated new services that customers are willing to purchase. Carriers have also started charging separately for services that were historically bundled in the price of a ticket. The capacity discipline exhibited by carriers and their focus on additional revenue streams bolstered the industry to profitability in 2011 for the second consecutive year. Going into the next decade, there is cautious optimism that the industry has been transformed from that of a boom-to-bust cycle to one of sustainable profits. As the economy recovers from the most serious economic downturn and slow recovery in recent history, aviation will continue to grow over the long run. The 2012 FAA forecast now calls for one billion passengers in 2024, three years later than projected last year. Growth over the next five years will be moderate, with a return to historic levels of growth only attainable in the long term. This delayed trajectory represents the downward adjustments of the overall economy, here in the U.S. and abroad, and the aviation sector’s responses. One of the many factors influencing the delayed recovery is the uncertainty that surrounds the U.S. and European economies. The latter, primarily those belonging to the Euro area, have been hit hard by the pressure from bond markets for fiscal austerity. Combined with the slow pace of these economies, debt restructuring pulled the European economy into recession in early 2012. This has not helped the pace of U.S. economic growth given the importance of its trade with Europe. Despite this and the ambiguity surrounding its own fiscal imbalances, the U.S. economy has managed to avoid a double dip recession and trudges along the path of slow recovery. System capacity in available seat miles (ASMs) – the overall yardstick for how busy aviation is both domestically and internationally – will remain flat this year after posting a 3.4 percent increase in 2011; it will then grow at an average annual rate of 3.1 percent through 2032. In the domestic market, capacity overall shrinks by 0.8 percent in 2012 after having registered an increase of 2.0 percent in 2011. Domestic capacity is projected to grow at an average annual rate of 2.5 percent for the remainder of the forecast period. Domestic mainline carrier capacity will decrease by 0.8 percent in 2012 after registering a one-year increase in 2011 of 2.3 percent following three years of decline. For the regional carriers, domestic capacity will shrink by 0.5 percent from 2011 levels thus registering another decline after shrinking in 2009 – the only two periods when the industry has shrunk since deregulation. Commercial air carrier domestic revenue passenger miles (RPMs) are forecast to shrink 0.2 percent in 2012, and then grow at an average of 2.8 percent per year through 2032; domestic enplanements in 2012 will decrease 0.1 percent, and then grow at an average annual rate of 2.4 percent for the remainder of the forecast.
FAA Aerospace Forecast Fiscal Years 2012-2032
2
The average size of domestic aircraft is expected to increase by 0.2 seats in FY 2012 to 122.8 seats. Average seats per aircraft for mainline carriers are projected to stay relatively flat as network carriers1 continue to reconfigure their domestic fleets. While demand for 70-90 seat aircraft continues to increase, we expect the number of 50 seat regional jets in service to fall, increasing the average regional aircraft size in 2012 by 0.5 seats to 56.8 seats per mile. Passenger trip length in domestic markets will decrease by 1.3 miles during the same period. Although the slow growth and expectations of a European recession has dampened the near term prospects for general aviation, the long-term outlook remains favorable. We see growth in business aviation demand over the long term driven by a growing U.S. and world economy especially in the turbo jet and turbine rotorcraft markets. As the fleet grows, the number of general aviation hours flown is projected to increase an average of 1.7 percent a year through 2032. The global economy is facing a prospect of slow growth again including a possible recession in the first part of the year in Europe which may slow the demand for air travel. Profitability for U.S. carriers will hinge on a stable environment for fuel prices, an increase in demand for corporate air travel, maintaining the ability to pass along fare increases to leisure travelers, and the continual generation of ancillary revenues. To navigate this volatile operating environment, mainline carriers will continue to drive down costs by better matching flight frequencies and/or aircraft gauge with demand, delaying deliveries of newer aircraft and/or grounding older aircraft, along with pressuring regional affiliates to accept lower fees for contract flying. Over the long term, we see a competitive and profitable industry characterized by increasing demand for air travel and airfares growing more slowly than inflation.
1 Alaska Airlines, American Airlines, United-Continental Airlines, Delta Airlines, and U.S. Airways.

FAA Aerospace Forecast Fiscal Years 2012-2032
3
REVIEW OF 2011
Although the year 2011 began with a lot of hope for an economic recovery, it was primarily characterized as a year of full scale uncertainty. The grim operating environment faced by the carriers at the start of the global recession that revolutionized how they operate today also helped the industry cope with this uncertainty. Consequently, U.S. airlines made a profit for the second consecutive year. A view held by some industry professionals is that recent carrier initiatives will provide traction towards profitability, even during future periods of uncertainty, and this appears to have borne fruit in 2011. One recent initiative by the passenger carriers is a shift in focus from increasing market share to one of boosting shareholder return on investment. The U.S. airline industry has become more nimble; that is, adjusting capacity to seize opportunities or contracting in times of economic distress. As a result, it expanded its capacity by 2.0 percent in 2011 while positioning itself for a reduction of 0.8 percent this year in anticipation of the uncertain economic environment. Even during times of economic instability and distress, the industry has found ways to increase revenue. For example, air carriers are charging fees for services that used to be included in airfare (e.g. meal service), as well as for services that were not previously available (e.g. premium boarding and fare lock fees). The impact from these recent initiatives gives reason for optimism. After posting net losses for eight consecutive quarters, the industry (passenger and cargo carriers combined) posted profits in both 2010 and 2011. Demand for air travel in 2011 grew slowly following a dismal 2010 that was marked by fading consumer confidence, tightening credit, surging unemployment, eroding corporate travel budgets, and the pressure of debt restructuring in Europe and the U.S. In 20112 system revenue passenger miles increased 3.5 percent as enplanements increased 2.5 percent. Commercial air carrier domestic enplanements were up 2.3 percent while international enplanements were up 4.4 percent. The system-wide load factor continued to rise to 82.0 percent (up 0.1 points from 2010). Domestic enplanement market share continued to rise for low-cost carriers in 2011 while network and “other” carrier and regional carrier share decreased. Domestic low cost carrier enplanement share increased by 1.1 points to 28.4 percent while the share of network and “other” carriers fell by 0.4 points to 46.8 percent and regional carrier share dropped by 0.6 points to 24.8 percent. Capacity restraint by the carriers as passenger demand returned helped the system wide real yield to increase by 6.4 percent in 2011. Data for FY 2011 show that the reporting passenger carriers had a combined operating profit of $5.8 billion (compared to a $7.3 billion operating profit for FY 2010). The network carriers reported combined operating profits of $4.23 billion while the low cost carriers reported combined operating profits of $1.1 billion, with four out of the five network carriers and five of the nine low cost carriers posting profits. The general aviation market continued its decline in calendar year (CY) 2011, although at a slower rate. U.S. manufacturer shipments declined for the fourth year in a row, down an 2 All stated years and quarters for U.S. economic and U.S. air carrier traffic and financial data and forecasts are on a fiscal year (FY) basis (October 1 through September 30). All stated years and quarters for international economic and world traffic and financial data are on a calendar year (CY) basis, unless otherwise stated.
FAA Aerospace Forecast Fiscal Years 2012-2032
4
estimated 8.9 percent, even though U.S. billings are estimated to have increased 6.7 percent than their CY 2010 levels. Piston aircraft shipments by U.S. manufacturers fell an estimated 10.5 percent, and turbine aircraft shipments (turboprop and business jets) by U.S. manufacturers declined by 7.0 percent in CY 2011 compared to CY 2010. While continuing decreases in U.S. shipments reflected the fragile nature of the economic recovery, the pace of the decline has slowed. The 7.0 percent decrease for the turbines compared favorably to the 24.9 percent decline recorded in 2010 and 39.2 percent decline posted in 2009 in turbine aircraft shipments by U.S. manufacturers. The business jet segment showed even more reason for optimism as shipments fell by only 2.7 percent in CY 2011 versus decreases of 29.2 percent and 46.2 percent, respectively in CY 2010 and CY 2009. Along with the fall in shipments, general aviation activity at FAA and contract tower airports fell 2.3 percent in 2011. Total operations at FAA and contract towers decreased for the 4th consecutive year, falling 1.0 percent, as activity declines in the air taxi and general aviation categories offset increases in air carrier and military activity. Although the overall number of flights fell, FAA’s workload did not. As the fleet mix changes with increasing numbers of regional and business jets in the nation’s skies, along with carriers consolidating operations in their large hubs, the complexity of activity in the airspace continues to grow, increasing controllers’ workload.

FAA Aerospace Forecast Fiscal Years 2012-2032
5
U.S. ECONOMIC ACTIVITY Following an unprecedented fiscal stimulus (i.e., American Recovery and Reinvestment Act or ARRA) of over $800 billion that took place in 2009, with over half of it being spent during 2010, the U.S. economy was left to its own fundamentals in the latter part of 2010 and 2011. The economy grew at an average annual rate of 2.1 percent in fiscal year (FY) 2010 and 2.1 percent in FY 2011. Given the uncertainty that characterized 2011, the economic growth that occurred without a contraction or double-dip recession was reassuring. Towards the end of the fiscal year and beginning with FY 2012, there were signs of pent-up demand coming back as consumer spending continued to grow, the housing market appeared to be finally turning around and the labor market gained traction. Overall, business spending continues growing, perhaps partly influenced by tax incentives and a cautious environment that has kept inventories to a minimum.
The nation’s unemployment rate has been greatly affected by the recession. When the recession began in December 2007 the unemployment rate was 5.0 percent. Unemployment climbed throughout 2008, intensified during 2009, and reached its pinnacle during the first quarter of FY 2010 (10.0 percent). The unemployment rate is gradually falling, from an average of 9.7 percent in FY 2010 to 9.2 percent in FY 2011; this rate of decline is relatively slow compared to past recessions.
0.5
2.2
3.33.5
3.1
2.2
1.61.8
0.0
0.5
1.0
1.5
2.0
2.5
3.0
3.5
4.0
2009 Q4 2010 Q1 2010 Q2 2010 Q3 2010 Q4 2011 Q1 2011 Q2 2011 Q3
Perc
ent C
hang
e
U.S. Gross Domestic ProductSeasonally Adjusted Annual Growth
Fiscal Year 2011Fiscal Year 2010

FAA Aerospace Forecast Fiscal Years 2012-2032
6
The price of oil, as measured by the U.S. Refiners’ Acquisition Cost (for West Texas Intermediate, or WTI), was $96.05 in FY 2011, an increase of 29 percent from FY 2010. This is on top of the last year’s increase of 36 percent. The fuel price volatility that characterized 2008-2009 has diminished considerably but a rising trend appears to be settling in throughout the last two years.
6.0
6.9
8.2
9.39.7
10.0 9.7 9.6 9.6 9.6
8.9 9.1 9.2
0.0
2.0
4.0
6.0
8.0
10.0
12.0
2008 Q3 2009 Q1 2009 Q3 2010 Q1 2010 Q3 2011 Q1 2011 Q3
Perc
ent U
nem
ploy
ed
Date
U.S. Unemployment Rate
83 8591
97104
115
123
115 114 117110 113
110 111
0
20
40
60
80
100
120
140
Oct-10 Dec-10 Feb-11 Apr-11 Jun-11 Aug-11 Oct-11
$ Pe
r Bar
rel o
f (W
TI) O
il
Date
U.S. Refiners' Acquisition Cost
Source: IHS Global Insight

FAA Aerospace Forecast Fiscal Years 2012-2032
7
Finally, consumer prices continued to increase in 2011. Core inflation (excluding gas and food) was moderate (2.2 percent); while headline inflation was up a modest 2.6 percent due to an increase in oil and gasoline prices.

FAA Aerospace Forecast Fiscal Years 2012-2032
8
WORLD ECONOMIC ACTIVITY
Based on preliminary figures, according to IHS Global Insight, the U.S. and rest of the world economies grew 1.7 and 3.1 percent, respectively, in 2011. The advanced economies (U.S., Western Europe, Japan, Australia, New Zealand, and Canada) expanded 1.3 percent overall. All world regions saw their economies grow, except Japan which was impacted by the devastation wrought by the March earthquake and tsunami. Data coming out at the year’s end suggest that the recovery in Europe is continuing to lag that of other world regions.
On a calendar year basis, gross domestic product (GDP) in Canada expanded at a faster pace (up 2.2 percent) than the U.S. in 2011 (up 1.7 percent). The combined economies of the Asian and Far East nations grew 4.2 percent in 2011, down from 6.8 percent a year earlier. This region includes the world’s second largest economy, Japan (down 0.6 percent), and the world’s most vibrant economy, China (up 9.3 percent). The combined economies of Europe rebounded more slowly, with Western Europe up 1.6 percent and the combined economies of Central Europe and the former Soviet Union up 4.4 percent. GDP in Latin America (including the Caribbean) expanded by 4.0 percent with Brazil up 3.6 percent and Mexico up 3.9 percent.
3.5 3.1
2.7
1.9
(0.3)
(3.5)
3.0
1.7
4.2 3.7
4.7 4.8
2.0
(1.9)
4.4
3.1
(4.0)
(3.0)
(2.0)
(1.0)
-
1.0
2.0
3.0
4.0
5.0
6.0
2004 2005 2006 2007 2008 2009 2010 2011
Annu
al P
erce
nt C
hang
e
Calendar Year
U.S. and World Gross Domestic Product
US WorldSource: Global Insight website, GDP Components Tables (Interim Forecast, Monthly), Release date 14 OCT 2011

FAA Aerospace Forecast Fiscal Years 2012-2032
9
COMMERCIAL AVIATION Commercial aviation continued a slow recovery in 2011 despite rising jet fuel prices and a shaky global economy. The U.S. industry posted a net profit in 2011, with a similar outcome predicted for foreign carriers. After posting net profits of $15.8 billion in 2010, global industry net profits for calendar year 2011 are expected to be $6.9 billion.3 All global regions are projected to see a drop in profits as fuel costs increased by $40 billion worldwide.
World Travel Demand Based on data compiled by the International Civil Aviation Organization (ICAO), world air carriers are expected to post another solid performance in CY 2011 as demand for air travel continues to rebound from the depressed levels recorded during 2009. Although traffic results are not available for full year 2011 at the time of this printing, ICAO predicts that worldwide revenue passenger kilometers (RPKs) will increase 6.4 percent following an increase of 7.9 percent in 2010.4
Statistics from the Association of European Airlines (AEA) available for calendar year 2011 show passengers are up 7.1 percent over calendar year 2010. Data for the same period shows capacity, as measured by available seat kilometers (ASKs), to be up 8.9 percent and 3 IATA Financial Forecast, December 2011. 4 ICAO press release dated January 6, 2012.
11.6
7.1
5.2
8.3
-0.4-1.1
8.1
5.9
13.9
7.3
5.0
7.4
2.6
-1.6
7.9
6.4
-4.0
0.0
4.0
8.0
12.0
16.0
2004 2005 2006 2007 2008 2009 2010 2011E
Annu
al P
erce
nt C
hang
e
Calendar Year
World Passenger Demand
Passengers RPKsSource: 2004-10 ICAO; 2011 IATA

FAA Aerospace Forecast Fiscal Years 2012-2032
10
RPKs to be up 8.0 percent. Results for April 2011 show a resurgence of traffic followed by airspace closures stemming from volcanic ash clouds that took place in April, 2010.
The Association of Asia Pacific Airlines (AAPA) reported an increase of 3.7 percent in international RPKs and a 6.3 percent increase in international ASKs; international passengers were up 3.5 percent during the same period.
0.0
5.0
10.0
15.0
20.0
25.0
30.0
Jan Feb Mar Apr May Jun Jul Aug Sep Oct Nov Dec
Annu
al P
erce
nt C
hang
e (%
)
Month
European Carriers Capacity and TrafficCalendar Year 2011
ASKs RPKs
-2.0
0.0
2.0
4.0
6.0
8.0
10.0
Jan Feb Mar Apr May Jun Jul Aug Sep Oct Nov Dec
Year
ove
r Yea
r Per
cent
Cha
nge
Month
Asia Pacific Carriers Capacity and TrafficCalendar Year 2011
ASKs RPKs

FAA Aerospace Forecast Fiscal Years 2012-2032
11
In CY 2011, U.S. and foreign flag carriers transported an estimated 161.8 million passengers between the United States and the rest of the world, a 2.8 percent increase from 2010. Year-over-year growth increased in the Transborder, Pacific and Latin markets (up 2.2 percent, 5.7 percent and 5.0 percent, respectively). Passengers decreased in the Atlantic market (down 0.6 percent) due to repercussions from the debt crisis in Europe, which is slowing the recovery of that region’s economy, and from the worldwide economic slowdown.
Worldwide air cargo demand contracted slightly in 2011 following a sharp rebound in 2010.5 According to IATA, worldwide freight ton kilometers were estimated to decline 0.5 percent in calendar year 2011 compared to 2010. Freight ton kilometers (FTKs) of AEA member carriers were up 2.1 percent in calendar year 2011 whereas FTKs of AAPA member carriers fell 4.8 percent during the same period.
5 IATA News Release, January 2012.
49 50 50 53 57 55 56 56
43 44 47 49 50 48 53 56
24 25 26 26 26 2427 2819 20 21 22 22
2022 22
0
20
40
60
80
100
120
140
160
180
2004 2005 2006 2007 2008 2009 2010 2011E
Mill
ions
of P
asse
nger
s
Calendar Year
Total Passengers To/From the U.S.U.S. and Foreign Flag Carriers
Atlantic L. America Pacific Transborder

FAA Aerospace Forecast Fiscal Years 2012-2032
12
The International Air Transport Association (IATA) reports that world air carriers (including U.S. airlines) are expected to register an operating profit of $13.2 billion for 2011. IATA estimates global airline industry net profits to be $6.9 billion for the same period with all regions expected to be in the black. Based on financial data compiled by ICAO and IATA, between 2003 and 2011 world airlines produced cumulative operating profits of $76.9 billion (with seven years out of nine posting gains) and net losses of $5.5 billion (with four years out of nine posting gains).6
6 IATA Financial Forecast, December 2011.
9.6
2.4
6.44.9
-3.4
-10.1
12.3
-0.7
7.9
0.4
4.8 4.8
-1.0
-9.8
18.7
-0.5
-15.0
-10.0
-5.0
0.0
5.0
10.0
15.0
20.0
25.0
2004 2005 2006 2007 2008 2009 2010 2011E
Annu
al P
erce
nt C
hang
e
Calendar Year
World Air Cargo Demand
Tonnes RTKsSource: 2004-10 ICAO; 2011 IATA

FAA Aerospace Forecast Fiscal Years 2012-2032
13
U.S. Travel Demand By year end of FY 2011, the U.S. commercial aviation industry consisted of 16 scheduled mainline air carriers that used large passenger jets (over 90 seats) and 68 regional carriers that used smaller piston, turboprop, and regional jet aircraft (up to 90 seats) to provide connecting passengers to the larger carriers. Mainline and regional carriers offer domestic and international passenger service between the U.S. and foreign destinations, although regional carrier international service is confined to the border markets in Canada, Mexico, and the Caribbean. Twenty-six all-cargo carriers were providing domestic and/or international air cargo service at the end 2011. Shaping today’s commercial air carrier industry are three distinct trends: (1) convergence of the network and low cost carrier business models and unit costs; (2) continuing industry consolidation and restructuring, and (3) the proliferation of ancillary revenues. A sign that the business models for the low cost and network carriers groups are converging is the narrowing share of capacity flown between these two groups and the fares they charge. After losing market share in 2008, partially due to the cessation of operations by two low cost carriers during that year,7 low cost carrier capacity share has been on the rise (up 0.9 points in 2009, up 0.4 points in 2010, and up 1.6 points in 2011). Since 2000, the share of capacity flown by the low cost carrier group has almost doubled, going from a 17.0 percent market share in 2000 to over 32.0 percent share in 2011. Another narrowing gap is the average
7 American Trans Air and Skybus Airlines.
3.3 4.4
15.0
19.9
-1.1
1.9
21.7
13.2
-5.6-4.1
5.0
14.7
-26.1
-4.6
15.8
6.9
-30.0
-20.0
-10.0
0.0
10.0
20.0
30.0
2004 2005 2006 2007 2008 2009 2010 2011E
Bill
ions
of D
olla
rs
Calendar Year
World Air Carrier Profit/Loss
Operating NetSource: 2004-10 ICAO; 2011 IATA

FAA Aerospace Forecast Fiscal Years 2012-2032
14
domestic yield (a proxy for airfare) reported by the low cost and network carrier groups. In 2000, average domestic yield for the low cost carrier group was 12.4 cents versus 14.5 cents for the network carrier group. By 2011, they were virtually identical on average; however, this does not show the variations in market premiums that each airline may command due to its unique market position. Industry restructuring and consolidation continued in 2011. Operations at Northwest Airlines were folded into Delta Airlines, while operations at Midwest Airlines were folded into Frontier Airlines. For the regional carriers, Delta Airlines sold its subsidiaries, Compass and Mesaba, to Trans States and Pinnacle, respectively, and Arctic Circle Air merged with ERA Aviation. Soon after FY 2011 ended, American Airlines declared bankruptcy at the end of November 2011. As a result of industry restructuring and consolidation, far fewer carriers now report traffic to the Bureau of Transportation Statistics when compared to 2001. Subsequently, 7.0 percent fewer domestic ASMs were flown but almost 3.0 percent more passengers were carried domestically in 2011 when compared to 2001. This has had clear implications on the size of the aircraft being used and the load factors, topics which will be discussed later in this document. The 7.0 percent reduction in domestic capacity since 2001 has not been shared equally between the mainline carriers and their regional counterparts. In 2011, the mainline carrier group provided 16 percent less capacity than it did in 2001 (and carried 12 percent fewer passengers). Conversely, capacity flown by the regional group increased 153 percent over the same ten year period (with passengers carried up 113 percent). The shift in capacity from the mainline carrier group to the regional carrier group emerged from several factors. One factor was the type of aircraft flown by the regional carriers, which has been transformed from one of predominantly turboprop and piston aircraft to that of 50-90 seat regional jets. This fleet transformation has permitted the regional carriers to fly longer haul routes that were not previously accessible with smaller turboprop aircraft. Another factor leading to the shift in capacity was the external operating environment. Air travel demand was reduced by the terror attacks of September 11, the record breaking fuel prices of 2008, and the global recession that followed. To better match demand to capacity, the mainline carriers contracted out “thin” routes to their regional counterparts because they could provide lift at a lower cost. Over the past few years, however, this trend has slowed down considerably. The most recent trend to take hold is that of ancillary revenues. Carriers generate ancillary revenues by selling products and services beyond that of an airplane ticket to customers. As noted earlier, U.S. passenger carriers posted net profits for the second consecutive year in 2011 with ancillary revenues a contributing factor to the favorable outcome.
Commercial Air Carriers – Passenger Coming off of a formidable 2010 brought on by the continuing global economic slowdown and debt restructuring issues plaguing the financial recovery, U.S. commercial air carriers’ traffic and capacity results in 2011 showed a modest increase in both. System (the sum of domestic plus international) capacity increased 3.4 percent to 993.9 billion ASMs while RPMs increased 3.5 percent to 814.6 billion. During the same period system-wide passengers increased 2.5 percent to 730.7 million; U.S. mainline carrier passenger growth was 3.4 percent while

FAA Aerospace Forecast Fiscal Years 2012-2032
15
regional carrier passengers declined by 0.4 percent to 163.6 million. In the domestic market, mainline passengers saw an increase of 3.1 percent following a three year consecutive decline prior to 2011. Mainline passengers in international markets posted strong growth for the second year in a row (up 4.7 percent). Even though the recession was officially over in June 2009,8 carriers continued to face economic uncertainty in 2011 as corporate travel budgets remained strained and double-digit unemployment persisted accompanied by uncertainty surrounding debt restructuring and the payroll tax break. Despite this, the industry expanded capacity, after three consecutive years of capacity reductions that were instituted in the latter part of 2008 to counter skyrocketing fuel prices and reduced demand. Counter intuitively, with a slight increase in seats available to the travelling public, carriers were still able to raise airfares as demand returned. Combining this new found pricing power with ancillary revenues, U.S. carriers finished 2011 with a net profit. System load factor and trip length climbed in 2011, as seats per aircraft mile increased. The average load factor reached a record-breaking 82.0 points, up 0.1 points from 2010. Trip length increased by 10.9 miles to 1,114.9 miles. This marks the ninth consecutive annual increase in trip length. Seats per aircraft mile increased to 141.0 seats (up 1.3 seats per aircraft mile).
8 According to the National Bureau of Economic Research.
3.5 3.2
-3.4
0.9
-2.0
-8.4
-1.5
0.9
7.0
5.3
-0.2
2.7
1.4
-7.3
-0.5
3.4
-10.0
-8.0
-6.0
-4.0
-2.0
0.0
2.0
4.0
6.0
8.0
2004 2005 2006 2007 2008 2009 2010 2011
Annu
al P
erce
nt C
hang
e
Fiscal Year
U.S. Commercial Air CarriersSystem ASMs and Aircraft Operations
Operations ASMs

FAA Aerospace Forecast Fiscal Years 2012-2032
16
Domestic Passenger Markets Domestic capacity9 was up 2.0 percent in 2011 after a decline of 0.4 percent in 2010. This was preceded by the steepest decline (in 2009 of 9.0 percent) ever recorded since deregulation of the industry in 1978. Departures were flat for the year after falling 1.8 percent in FY 2010. A year-over-year increase in capacity was posted for the first seven months of 2011 with the first quarter up 2.9 percent and the second and third quarters up by 2.2 and 1.9 percent, respectively. Capacity declined 0.3 percent year-over-year in the fourth quarter. Mainline carrier capacity was up 2.3 percent for the year, while regional carrier capacity was up 0.6 percent. Despite this increase, domestic ASMs were still 7.8 percent below pre-recession levels (2007) with departures down 12.1 percent at the end of 2011.
9 The 50 states, Puerto Rico, and the U.S. Virgin Islands.
10.6
7.4
2.73.9
0.8
-7.1
2.23.5
7.57.0
0.4
3.4
-0.8
-7.2
1.22.5
-10.0
-8.0
-6.0
-4.0
-2.0
0.0
2.0
4.0
6.0
8.0
10.0
12.0
2004 2005 2006 2007 2008 2009 2010 2011
Annu
al P
erce
nt C
hang
e
Fiscal Year
U.S. Commercial Air CarriersSystem RPMs and Enplanements
RPMs Enplanement

FAA Aerospace Forecast Fiscal Years 2012-2032
17
Domestic passenger enplanements grew at a faster rate than ASMs in 2011 up 2.3 percent. In the first half of the year, domestic passengers were up 3.2 percent but growth slowed in the second half of the year with passengers up just 1.5 percent. On a year-over-year basis, mainline carrier enplanements were up 3.1 percent for the year while regional carrier enplanements fell 0.2 percent, posting the second decline in three years for this segment of the industry.
-2.0
-1.0
0.0
1.0
2.0
3.0
4.0
5.0
Oct-11 Nov Dec Jan-12 Feb Mar Apr May Jun Jul Aug Sep
Year
ove
r Yea
r Per
cent
Cha
nge
Month
U.S. Commercial CarriersDomestic Capacity
Fiscal Year 2011
Departures ASMs

FAA Aerospace Forecast Fiscal Years 2012-2032
18
Similar to passenger counts, domestic RPMs grew faster than ASMs with domestic RPMs up 3.0 percent in FY 2011. Growth slowed during the year with the first quarter up 5.1 percent, the second quarter up 2.6 percent, and the last half of the year up 2.2 percent. For the year, mainline carrier RPM growth was 3.3 percent, while regional carrier growth was just 0.6 percent. Domestic carrier load factor increased 0.8 points to 82.5 percent, with both the mainline and regional carriers groups posting record high loads. Mainline carrier load factor increased 0.9 points from FY 2010 to 83.6 percent, while regional carrier load factor remained constant at 76.2 percent. Since FY 2000, total domestic capacity has decreased by 4.5 percent. Mainline carriers have reduced their domestic capacity by 13.6 percent with cutbacks by network carriers more than offsetting the growth of low-cost carriers. Making up some of the shortfall from network carrier capacity cuts during this time are the regional carriers. This segment of the industry has greatly expanded capacity (up 158.4 percent from 2000). During the same period, mainline carrier RPMs have increased 1.4 percent, while enplanements have fallen 13.0 percent. In comparison, regional carrier RPMs and enplanements have increased 230.8 percent and 102.4 percent, respectively. As a result, mainline carrier domestic capacity share has fallen from 94.7 percent in 2000 to 85.7 percent in 2011, with the share of domestic RPMs flown by mainline carriers dropping from 95.5 percent to 86.8 percent during the same period. Regional carriers now fly one in every four passengers, up from one in eight in 2000.
-1.0
0.0
1.0
2.0
3.0
4.0
5.0
6.0
7.0
8.0
Oct Nov Dec Jan-11 Feb Mar Apr May Jun Jul Aug Sep
Year
ove
r Yea
r Per
cent
Cha
nge
Month
U.S. Commercial CarriersDomestic TrafficFiscal Year 2011
Enplanement RPMs

FAA Aerospace Forecast Fiscal Years 2012-2032
19
International Passenger Markets U.S. carrier ASMs were up 6.7 percent and departures were up 3.9 percent in 2011. ASMs increased in all three regions with the Atlantic, Latin, and Pacific markets, up 5.6, 5.3 and 10.4 percent, respectively.
502.6 523.1 516.2 533.9 521.6 476.8 473.6 488.6
125.9146.4 152.2 156.2 159.1
154.0 161.6 161.3
0
100
200
300
400
500
600
700
800
2004 2005 2006 2007 2008 2009 2010 2011E
Mill
ions
Fiscal Year
U.S. Commercial Air CarriersEnplanements by Carrier Group
Mainline Regionals

FAA Aerospace Forecast Fiscal Years 2012-2032
20
International RPMs were up 4.8 percent and passenger enplanements were up 4.4 percent in 2011. The Atlantic market posted an increase, with RPMs up 2.8 percent and enplanements up 3.2 percent. RPMs and enplanements increased 5.9 and 4.9 percent, respectively, in the Latin American market, while RPMs and enplanements increased 7.4 and 4.7 percent, respectively, in the Pacific market.
-6.0
-4.0
-2.0
0.0
2.0
4.0
6.0
8.0
10.0
12.0
14.0
Oct Nov Dec Jan Feb Mar Apr May Jun Jul Aug Sep
Year
ove
r Yea
r Per
cent
Cha
nge
Month
U.S. Commercial CarriersInternational Capacity
Fiscal Year 2011
ASMs Departures

FAA Aerospace Forecast Fiscal Years 2012-2032
21
The international load factor dropped 1.4 percentage points overall in 2011 to 80.7 percent. Load factor decreased in all markets except Latin America: in the Pacific market load factor was down 3.0 points to 81.5 percent; in the North Atlantic market load factor was down 2.7 points to 80.7 percent; and in the Latin America market the load factor increased by 0.6 points to 79.7 percent. In 2011, 51.9 percent of the passengers flying abroad on U.S. flag carriers traveled to the Latin America market. The remaining 48.1 percent of international passengers was split between the Atlantic market (31.3 percent) and the Pacific market (16.7 percent).
Commercial Air Carriers – Cargo Air cargo traffic contains both domestic and international freight/express and mail. The demand for air cargo is a derived demand resulting from economic activity. Cargo moves in the bellies of passenger aircraft and in dedicated all-cargo aircraft on both scheduled and nonscheduled service. Cargo carriers face price competition from alternative shipping modes such as trucks, container ships, and rail cars. U.S. air carriers flew 37.3 billion revenue ton miles (RTMs) in 2011, up 3.7 percent from 2010. Domestic cargo revenue ton miles (RTMs) fell by 6.1 percent to 12.0 billion. However, international RTMs increased by 9.1 percent to 25.2 billion, more than offsetting the decline in domestic RTMs. The strong growth in international RTMs reflects a rebound from the recession and the global financial crisis, with international air cargo RTMs now exceeding the pre-crisis (FY 2007) levels by 4.1 percent.
-4.0
-2.0
0.0
2.0
4.0
6.0
8.0
10.0
12.0
14.0
Oct Nov Dec Jan Feb Mar Apr May Jun Jul Aug Sep
Year
ove
r Yea
r Per
cent
Cha
nge
Month
U.S. Commercial CarriersInternational Traffic
Fiscal Year 2011
RPMs Enplanements

FAA Aerospace Forecast Fiscal Years 2012-2032
22
Air cargo RTMs flown by all-cargo carriers were 75.1 percent of total RTMs in 2011, with passenger carriers flying the rest, or 24.9 percent. Total RTMs flown by the all-cargo carriers increased 3.0 percent in 2011 from 27.2 billion to 28.0 billion. Total RTMs flown by passenger carriers were 9.3 billion in 2011, 5.9 percent higher than in 2010. On August 3, 2007, “Recommendations of the 9/11 Commission Act of 2007” was signed into law. Section 1602 of this Act states that air cargo placed on passenger aircraft will receive the same level of screening as passenger-checked baggage. The legislation went into effect on August 1, 2010, and requires 100 percent inspection of cargo transported on passenger aircraft at the piece level. The legislation did not apply to cargo on U.S. bound passenger flights from overseas or on cargo-only aircraft. However, following the discovery of a bomb on an all-cargo plane bound for the U.S., the Air Cargo Security Act was introduced on November 16, 2010. The purpose of the Act is to expand the 100 percent cargo screening mandate of passenger aircraft to cargo only aircraft. The bill didn’t become a law and TSA is currently negotiating screening agreements with 20 countries where approximately 80 percent of U.S. bound international cargo originates.
16.3 16.1 15.7 15.8 14.4 11.9 12.8 12.0
20.123.1 24.0 24.2 24.6
19.123.1 25.2
0.0
5.0
10.0
15.0
20.0
25.0
30.0
35.0
40.0
45.0
2004 2005 2006 2007 2008 2009 2010 2011E
Bill
ions
Fiscal Year
U.S. Commercial Air CarriersCargo Revenue Ton Miles
Domestic RTMs International RTMs

FAA Aerospace Forecast Fiscal Years 2012-2032
23
International Air Cargo Revenue Ton Miles by Region International air cargo traffic can be divided into four components consisting of Atlantic, Latin, Pacific, and ‘Other International.’ While total international RTMs increased, not all regions experienced growth in 2011. Latin cargo fell from 1.9 billion RTMs to 1.8 billion RTMs, a 9.3 percent decline. However, Atlantic RTMs rose 5.4 percent, from 6.9 to 7.2 billion and the Pacific region enjoyed even more expansion, a 9.1 percent increase from 8.4 to 9.1 billion. The ‘Other International’ category experienced the most growth. RTMs in that ‘region’ expanded from 5.9 billion to 7.1 billion, growing by 20.4 percent.
U.S. Commercial Air Carriers 2011 Financial Results U.S. commercial air carriers posted a net profit of $1.6 billion during FY 2011 after reporting a net profit of $3.4 billion one year earlier.
Operating revenues (passenger and cargo) for FY 2011 were up 10.4 percent from FY 2010. The increase in revenue underscored the ability of passenger carriers to push through fare increases and to offer value-added services that leisure and business passengers were willing to buy. The increase in revenues for cargo carriers followed a rebound from the global financial crisis that strengthened demand for air cargo services. During the same period, operating expenses increased 12.3 percent. The increase in operating expenses during FY 2011 was driven by a 24.6 percent rise in the price of fuel for the year, as
0.7
-1.2
5.6
10.2
-2.0
0.8
9.77.6
-4.6
-11.7
-0.2
5.9
-18.6
-7.8
3.41.6
-25.0
-20.0
-15.0
-10.0
-5.0
0.0
5.0
10.0
15.0
2004 2005 2006 2007 2008 2009 2010 2011E
Bill
ions
of D
olla
rs ($
)
Fiscal Year
U.S. Commercial Air CarriersOperating and Net Profit/Loss
Operating Profit/Loss Net Profit/LossSource: DOT Form 41 & 298C

FAA Aerospace Forecast Fiscal Years 2012-2032
24
well as an increase in variable costs resulting from increased demand for passenger and cargo services. In FY 2011, passenger carriers reported operating income of $5.8 billion and net profits of $540 million, while air cargo carriers reported an operating profit of $1.9 billion and a net income of $1.1 billion. In the domestic market, passenger carriers generated an operating profit of $3.8 billion but posted a net loss of $152 million. In the international market, this carrier group posted operating and net profits of $1.9 billion and $0.7 billion, respectively. Cargo carriers posted an operating profit of $2.6 billion and a net income of $1.5 billion in domestic markets. In international markets, the cargo carriers reported an operating loss of $0.7 billion and net loss of $0.5 billion. The industry’s financial boost is largely due to a turnaround in the performance of the network carriers. After two consecutive years (FY 2008-2009) of net losses totaling $27.3 billion, this carrier group has now recorded back to back profitable years in FY 2010-2011. In FY 2011 the network carriers posted net profits of $766 million and operating profits of $4.2 billion. For the nine reporting low-cost carriers, operating profits totaled $1.1 billion and net income totaled $179 million for the full year. An upswing in leisure and business demand along with ongoing capacity discipline led to a rebound in mainline carrier passenger yield for the year. Domestic mainline carrier passenger yield increased 5.6 percent in 2011.
0
5
10
15
20
25
30
2004 2005 2006 2007 2008 2009 2010 2011E
Rev
enue
per
Mile
(₵)
Fiscal Year
U.S. Commercial Air CarriersDomestic Passenger Yield
Mainline Regionals

FAA Aerospace Forecast Fiscal Years 2012-2032
25
Of the reporting regional carriers, operating profits totaled $0.5 billion and net losses totaled $0.5 billion for FY 2011. During the same period, regional domestic yield was unchanged.10 Reflecting the changing nature of the industry the network carriers are putting the squeeze on their regional partners by negotiating fee-for-departure contracts that shift more of the financial risk of contract flying to the regional carriers. Since 2000, regional carrier yield is down 59.8 percent in real terms (compared to a drop of 25.8 percent in mainline carrier yield for the same period). The drop in regional carrier yield can be attributed to longer trip lengths (due to a growing number of larger and faster regional jet aircraft entering the fleet) and rising load factors. All other things being equal, an increase in either the trip length or the load factor results in drop in yield since fee-for-departure revenues are spread over a broader base of RPMs.
U.S. Commercial Air Carriers 2011 Aircraft Fleets The commercial passenger carrier fleet is undergoing transformation. The mainline carriers are retiring older, less fuel efficient aircraft (e.g. 737-300/400/500 and MD-80) and replacing them with more technologically advanced A320 and 737-700/800/900 aircraft. The regional carriers are growing their fleet of 70 to 90 seat regional jet aircraft and reducing their fleet of 50-seat jet aircraft. The total number of aircraft in the U.S. commercial fleet (including regional carriers) is estimated at 7,185 for 2011, a decrease of 29 aircraft from 2010. This includes 3,739 mainline air carrier passenger aircraft (over 90 seats), 879 mainline air carrier cargo aircraft, and 2,567 regional carrier aircraft (jets, turboprops, and pistons).
10 Passenger revenues include payments received by regionals from mainline partners for contractual flying.

FAA Aerospace Forecast Fiscal Years 2012-2032
26
The mainline carriers’ passenger jet fleet shrunk by 12 aircraft in 2011, following a 41 unit increase in 2010. The decrease was driven by a 61 unit decrease by the remaining network carriers as they continued to prune their fleets in the face of uncertain economic growth and rising fuel prices. With the decline of the fleet in 2011, the mainline carrier fleet now stands at 16.7 percent below (749 aircraft) the level it was in 2000. The regional carrier fleet was also reduced in 2011, falling by 46 units, and now stands at its lowest level since 2003. Regional carriers continue to retire 50 seat and smaller regional jets as the operating economics of these aircraft get worse as fuel prices continue to climb.
4,024
3,906
3,898
3,983
3,795
3,710
3,751
3,739
2,747
2,779
2,732
2,780
2,682
2,653
2,613
2,567
993
1,001
1,012
974
960
841
850
879
0 1,000 2,000 3,000 4,000 5,000
2004
2005
2006
2007
2008
2009
2010
2011E
Number of Aircraft
Cal
enda
r Yea
r
U.S. Commercial Air Carriers Aircraft Fleet
Cargo Regionals Mainline AC

FAA Aerospace Forecast Fiscal Years 2012-2032
27
GENERAL AVIATION While the signs of a slow economic recovery have been observed, difficulties in the general aviation industry continued in 2011. Based on figures released by the General Aviation Manufacturers Association (GAMA), U.S. manufacturers of general aviation aircraft delivered an estimated 1,215 aircraft in CY 2011, 8.9 percent fewer than CY 2010. This translates into a fourth consecutive year of decline in shipments, although at a slower rate. Overall piston deliveries declined 10.5 percent, with single-engine deliveries down 9.1 percent and the much smaller multi-engine category down 23.9 percent. In the turbine categories, turbojet deliveries were only slightly lower than that of last year, by 2.7 percent, while turboprops were down an estimated 13.8 percent. U.S. billings in CY 2011 are estimated to have totaled $8.4 billion, up 6.7 percent compared with 2010.
General aviation activity at FAA air traffic facilities posted mixed results in 2011. Operations at combined FAA and contract towers declined 2.3 percent in 2011, continuing a decade long trend. General aviation activity at consolidated traffic facilities (FAA TRACONs) fell 2.6 percent, while the number of general aviation aircraft handled at FAA en-route centers was essentially flat, up a scant 0.1 percent. The FAA uses estimates of fleet size, hours flown and utilization from the General Aviation and Part 135 Activity Survey (GA Survey) as baseline figures upon which assumed growth rates are applied. This survey has been conducted annually since 1977. Beginning with the CY 2004 Survey there were significant improvements to the survey methodology. These improvements included conducting 100 percent samples for turboprops and turbojets, all
2,355
2,857 3,147 3,279
3,079
1,585
1,334 1,215 6.8
8.7
10.4
11.9
13.3
9.1
7.9 8.4
0.0
2.0
4.0
6.0
8.0
10.0
12.0
14.0
0
500
1,000
1,500
2,000
2,500
3,000
3,500
2004 2005 2006 2007 2008 2009 2010 2011E
Bill
ings
($B
)
Ship
men
ts
Calendar Year
General AviationU.S. Manufacturers Shipments and Billings
Shipments Billings ($ Billion)Source: GAMA

FAA Aerospace Forecast Fiscal Years 2012-2032
28
rotorcraft, all aircraft in Alaska and all aircraft operating on-demand under Part 135. In addition, the sample design was revised to stratify by aircraft type (19 categories), FAA region (9 categories), and whether the aircraft was owned by an entity certified to fly Part 135 operations (2 categories). Furthermore, a large fleet reporting form was incorporated to allow owners/operators of multiple aircraft to report aggregated data for their entire fleet on a single form. In 2005 an additional aircraft category (light sport aircraft) was added. The result of these changes was the sample size nearly doubled. Between 2003 and 2005 large changes in both the number of aircraft (turbojets up by 22.8 percent, total rotorcraft up by 33.7 percent) and hours (single-engine piston down by 17.6 percent) in many categories occurred. The results of the 2010 Survey, the latest one available, are consistent with the results of past surveys since 2004. This reinforces our belief that methodological improvements have resulted in superior estimates relative to those in the past and these are used as the basis for our forecast. Based on the latest FAA assumptions about fleet attrition and aircraft utilization along with General Aircraft Manufacturer’s Association (GAMA) aircraft shipment statistics, the active general aviation fleet is estimated to have decreased 0.4 percent in 2011 to 222,520. With the decrease in the active fleet, general aviation flight hours are estimated to have decreased 1.6 percent in 2011 to 24.4 million. Student pilots are important to general aviation and the aviation industry as a whole. Student pilot numbers had been in decline for many years but in 2010 the FAA issued a rule that increased the duration of validity for student pilot certificates for pilots under the age of 40 from 36 months to 60 months. As a result, according to statistics compiled by the FAA’s Mike Monroney Aeronautical Center, the number of student pilots at the end of 2010 increased by 64.8 percent, or approximately 47,000 pilots, compared to calendar year end 2009. While the impact of the new rule on the long term trend in student pilots has yet to be fully determined, by the end of 2011, the number of student pilots decreased by 0.4 percent from its 2010 level to 118,657. The average age of a U.S. pilot in 2011 was 44.4 years old.

FAA Aerospace Forecast Fiscal Years 2012-2032
29
FAA WORKLOAD In 2011, FAA facilities experienced their fourth year of decline in activity. Commercial air traffic activity increased for the first time since 2007 as increases in air carrier activity offset declines in air taxi activity. Growth was higher during the first half of the year as carriers increased capacity in response to strengthening demand. The decline in noncommercial activity is attributed to a lackluster economy and rising fuel prices. Total activity at combined FAA and contract tower airports was 50.7 million operations in 2011, down 1.0 percent from 2010 and 26.1 percent below the peak activity level recorded in 2000. Commercial activity (the sum of air carrier and commuter/air taxi) at combined FAA and contract towers rose by 0.3 percent in 2011. Air carrier operations were up 1.6 percent while commuter/air taxi operations declined 1.4 percent. Commercial operations in 2011 were 15.1 percent lower than their peak in 2005. Non-commercial activity (the sum of general aviation and military) at combined FAA and contract towers fell by 2.0 percent in 2011, the smallest decrease in four years. General aviation activity (26.0 million) was down 2.3 percent while military activity (2.6 million) was up 0.9 percent. Since 1999, general aviation activity has increased only once (2007). At the end of 2011, non-commercial aircraft activity was 33.1 percent below the activity in 2000.
The FAA pays close attention to the trends occurring at the “Core 30” airports. These airports represent the top 30 airports in the country in terms of passenger activity (except Memphis which
37.9 37.035.8 35.9
34.1
30.629.2 28.6
25.2 26.1 25.2 25.3 24.822.4 22.1 22.1
0
5
10
15
20
25
30
35
40
2004 2005 2006 2007 2008 2009 2010 2011
Mill
ions
Fiscal Year
Aircraft Activity at Combined FAA and Contract Towers
Non Commercial Commercial

FAA Aerospace Forecast Fiscal Years 2012-2032
30
is a major freight hub) and account for about 70 percent of commercial passengers. Commercial activity at the Core 30 airports peaked in 2005, but subsequent industry restructuring has resulted in a drop in combined commercial activity at these airports since then. In 2011, commercial activity at the Core 30 airports rose by 1.5 percent from the previous year but was 8.3 percent below 2005 activity levels. Of the Core 30 airports, 23 recorded increases in activity from 2010 with the largest increases occurring at Miami (up 6.3 percent) and Reagan National in Washington, DC (up 6.1 percent). The largest decreases in activity occurred at Memphis (down 4.9 percent), and Salt Lake City (down 3.9 percent). Only six of the Core 30 airports exceeded 2005 peak activity levels during fiscal year 2011, up from four airports in both 2009 and 2010.
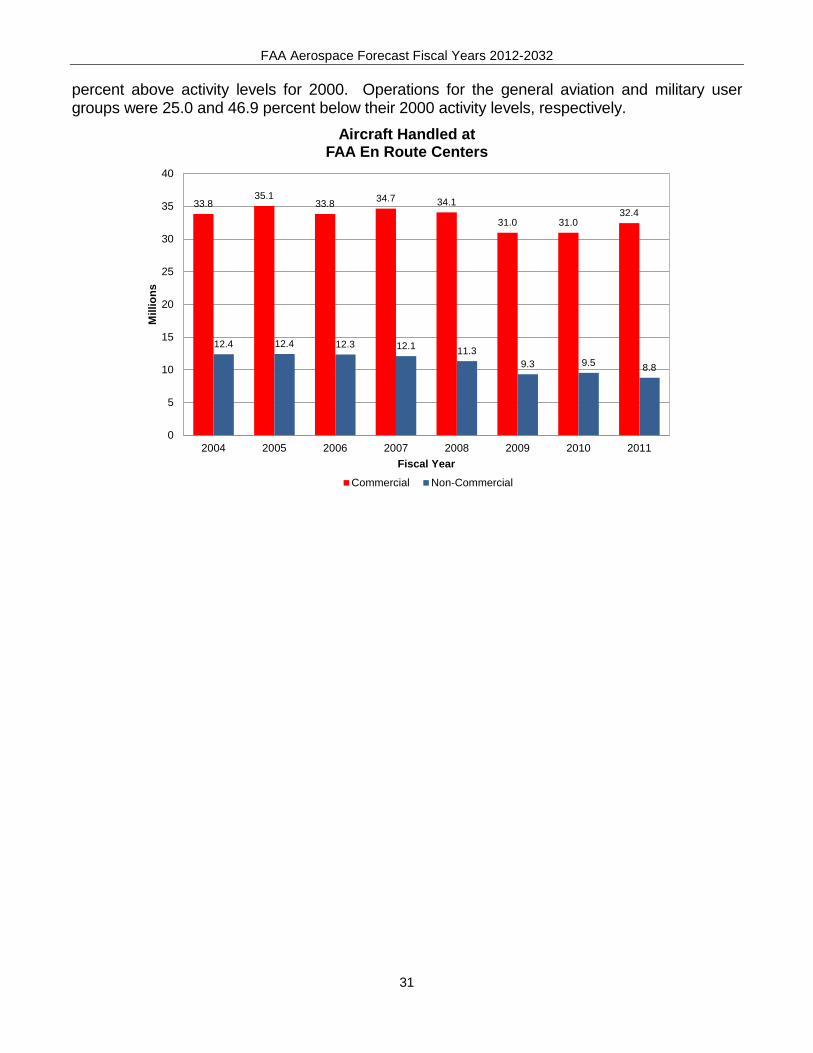
Since 2005 there has been a pronounced shift in demand which is reflected in the relative growth of commercial operations across the Core 30 airports. Commercial operations at San Francisco (up 16.2 percent), New York-Kennedy (up 14.9 percent), and Denver (up 14.9 percent) have increased the most relative to their 2005 activity levels. Commercial operations at Dulles (down 37.4 percent), and Tampa (down 26.0 percent) show the largest declines from 2005 levels. These activity level shifts reflect the impact of airline industry restructuring. The demise of Indy Air and United’s continuing restructuring of its network resulted in a dramatic reduction of operations at Dulles, while the bankruptcy of Delta and its subsequent merger with Northwest along with Continental’s continuing restructuring of its network has led to a dramatic shrinking of operations in Tampa. In 2011, total activity at FAA en-route centers (41.2 million) increased 1.8 percent from the previous year, the fastest growth since 2005. Commercial activity was up sharply (4.8 percent) with air carrier operations up 4.9 percent and commuter/air taxi operations up 4.5 percent. Non-commercial activity was down 7.8 percent for the year as general aviation activity was flat (up only 0.1 percent) while military activity decreased 25.3 percent. In 2011, air carrier operations were 6.2 percent below their 2000 activity levels and air taxi/commuter operations were 11.2
0
20
40
60
80
100
120
140
SFO
JFK
DEN CLT MIA
DC
A
IAH
ATL
BWI
EWR
OR
D
LGA
SEA
LAX
MC
O
LAS
BOS
DFW PH
X
FLL
PHL
MD
W
DTW SA
N
ME
M
MS
P
HN
L
SLC
TPA
IAD
Perc
ent o
f FY
2005
Ops
Airport
Only Six of Core 30 Airports are above 2005 Activity Levels
FY 2011 VS. FY 2005 Commercial Activity
FAA Aerospace Forecast Fiscal Years 2012-2032
31
percent above activity levels for 2000. Operations for the general aviation and military user groups were 25.0 and 46.9 percent below their 2000 activity levels, respectively.
33.835.1
33.8 34.7 34.1
31.0 31.032.4
12.4 12.4 12.3 12.1 11.39.3 9.5 8.8
0
5
10
15
20
25
30
35
40
2004 2005 2006 2007 2008 2009 2010 2011
Mill
ions
Fiscal Year
Aircraft Handled at FAA En Route Centers
Commercial Non-Commercial

FAA Aerospace Forecast Fiscal Years 2012-2032
32
FAA AEROSPACE FORECASTS FISCAL YEARS 2012 – 2032
Developing forecasts of aviation demand and activity levels continues to be challenging as the aviation industry evolves and prior relationships change. In times of amplified volatility, the process is filled with uncertainty, particularly in the short-term. Once again, the U.S. aviation industry has shown that the demand for air travel is resilient as it rebounds from its most recent downward spiral caused by the Great Recession. With the start of 2011, lingering questions remain. Are the U.S. and global economies on firm ground? Is it plausible that evolving structural changes will revamp the industry from one of boom-to-bust to one of sustainable profits? Will industry consolidation continue? After 15 consecutive months11 of modest increases in year-over-year domestic capacity, carriers reversed course and posted capacity declines in each of the last two months of 2011. The restraint in capacity coupled with strengthening demand led to record high load factors and recovery in yield. Yield is expected to show continued strength in 2012 as the capacity reductions at the end of FY 2011 accelerate into FY 2012. Given the current instability in the global economy, there is much uncertainty as to the timing and strength of a recovery in aviation demand. Nevertheless, the FAA has developed a set of assumptions and forecasts consistent with the emerging trends and structural changes currently taking place within the aviation industry. The FAA is confident that these forecasts accurately predict future aviation demand; however, due to the large uncertainty of the operating environment, the variance around the forecasts is wider than it was in prior years. The commercial aviation forecasts and assumptions are developed from econometric models that explain and incorporate emerging trends for the different segments of the industry. In addition the commercial aviation forecasts are considered unconstrained in that they assume there will be sufficient infrastructure to handle the projected levels of activity. These forecasts do not assume further contractions of the industry through bankruptcy, consolidation, or liquidation. The commercial aviation forecast methodology is a blended one. The starting point for developing the commercial aviation forecasts (air carriers and regionals) is the future schedules published by Innovata. To generate the short-term forecast (i.e., two years out) current monthly trends are used in conjunction with published monthly schedules to allow FAA forecasters to develop monthly capacity and demand forecasts for both mainline and regional carriers for fiscal and calendar years 2012-13. The medium to long-term forecasts (2014-2032) are based on the results of econometric models. The general aviation forecasts rely heavily on discussions with industry experts conducted at a workshop co-hosted by FAA and the Transportation Research Board (TRB) in July 2011 along 11 May 2010 through July 2011.

FAA Aerospace Forecast Fiscal Years 2012-2032
33
with the results of the 2010 General Aviation and Part 135 Activity Survey. The assumptions have been updated by FAA analysts to reflect more recent data and developing trends, as well as further information from industry experts. The FAA also presents the forecasts and assumptions to industry staff and aviation associations, who are asked to comment on the reasonableness of the assumptions and forecasts. Their comments and/or suggestions have been incorporated into the forecasts as appropriate.

FAA Aerospace Forecast Fiscal Years 2012-2032
34
ECONOMIC FORECASTS For this year’s Aerospace Forecast, the FAA is using economic forecasts developed by IHS Global Insight, Inc. to project domestic aviation demand. Furthermore, the FAA uses world and individual country economic projections provided by IHS Global Insight, Inc. to forecast the demand for international aviation services. Annual historical data and economic forecasts are presented in Tables 1 through 4. U.S. economic forecasts are presented on a U.S. government fiscal year (October through September) basis, whereas international forecasts are presented on a calendar year basis. Data suggest that unemployment hit its highest point in the first quarter of FY 2010 (10.0 percent) and will likely remain above 9.0 percent through 2012. IHS Global Insight expects the recovery to be modest by historical standards with the economy plagued by continued levels of high private and public debt, a weak housing market, and tight credit. How these issues are resolved will determine the future path of the recovery. On the bright side, prior fears of a double-dip recession are unlikely to be realized. The boost to the economy from fiscal stimulus and inventory buildup is fading, leaving the economy to depend on underlying strength in private demand. On a quarter-by-quarter basis U.S. economic growth is projected to range between 1.4 to 3.0 percent for the next two years.
Consumer spending is by far the largest component of the U.S. economy. Burdened by high household debt and rising unemployment, consumer spending increased only 2.0 percent in 2011. The recovery in consumer spending is projected to continue with increases of 1.9
1.2
1.5
2.4 2.4
1.8 1.8
1.4
3.0
0.0
0.5
1.0
1.5
2.0
2.5
3.0
3.5
2011 Q4 2012 Q1 2012 Q2 2012 Q3 2012 Q4 2013 Q1 2013 Q2 2013 Q3
Annu
al P
erce
nt C
hang
e
U.S. Gross Domestic ProductSeasonally Adjusted Annual Growth
by Quarter
Fiscal Year 2012 Fiscal Year 2013Source: IHS Global Insight

FAA Aerospace Forecast Fiscal Years 2012-2032
35
percent in 2012 and 1.8 percent in 2013 as households continue their struggle to reduce debt burdens and rebuild retirement assets. In the medium term, (the four year period between 2013 and 2017), U.S. economic growth is projected to average 3.1 percent per year with rates ranging between 2.1 and 3.5 percent. Consumption growth remains muted during the same period (up an average of 2.1 percent). For the balance of the forecast period, U.S. real GDP growth slows to around 2.5 percent annually while consumption growth increases to 2.3 percent annually. The long-term stability of U.S. economic growth depends on sustained growth in the workforce and capital stock along with improved productivity and competitiveness.
After the price of oil increased by 29 percent in 2011, IHS Global Insight projects the price, as measured by the Refiners’ Acquisition Cost, to be $100 per barrel in 2012 (up 6.0 percent from 2011). Oil prices are now forecast to rise to over $115 per barrel by 2020 and then gradually increase to over $118 per barrel by 2025. For the remainder of the forecast period, oil prices are projected to grow faster than inflation, reaching $138 per barrel by 2032.
2.1 2.1
1.6
2.1
3.0
3.5
2.5
0.0
0.5
1.0
1.5
2.0
2.5
3.0
3.5
4.0
2010 2011 2012 2013 2014 2015 2017-2032
Annu
al P
erce
nt C
hang
e
Fiscal Year
U.S. Gross Domestic Product
Source: IHS Global Insight

FAA Aerospace Forecast Fiscal Years 2012-2032
36
Spurred by continued economic growth, the inflation rate (as measured by the CPI), rose 2.6 percent in FY 2011 and is expected to rise 1.9 percent and 1.8 percent in 2012 and 2013, respectively. After 2012, consumer price inflation is projected to grow between 1.8 and 2.2 percent per year for the balance of the forecast. To reflect the uncertainty in the projection of economic growth, the FAA Aerospace Forecast uses high and low economic growth cases along with the base forecast. The high and low economic growth cases are based on optimistic and pessimistic scenarios from IHS Global Insight’s 30-Year Focus (released third quarter 2011). The high economic growth case incorporates higher population growth, capital spending, and productivity relative to the base case. Due to the higher productivity, inflation is lower than in the base case. Real GDP growth in the high case averages 3.0 percent annually compared to 2.6 percent in the base case. The low economic growth case incorporates lower population growth, capital spending, and productivity than does the base case. By contrast, in the low economic case, inflation is higher than in the base case due to lower productivity growth. Real GDP growth in the low case averages 2.0 percent annually over the forecast horizon. Further details about the high and low scenarios can be found in Appendix A.
World Economy After weathering the first contraction in global GDP since the Great Depression and a deepening recession in Europe, worldwide economic activity is estimated by IHS Global Insight to have expanded by 2.7 percent in 2011. The advanced economies (U.S., Canada, Europe, and Japan) posted growth in output ranging from a low of -0.6 percent to a high of 2.2 percent.
26.9
6.0 6.8
2.91.4
0.0
5.0
10.0
15.0
20.0
25.0
30.0
2011 2012 2013 2014 2015-2032
Annu
al P
erce
nt C
hang
e
Fiscal Year
Refiners' Acquisition Cost
Source: IHS Global Insight

FAA Aerospace Forecast Fiscal Years 2012-2032
37
The emerging market economies grew 6.2 percent, 1.2 points lower than in 2010 with the economy of China up 9.3 percent, India up 7.5 percent, Brazil up 3.6 percent, and Russia up 4.1 percent. In 2012, economic growth is projected to slow (up 2.6 percent) as weak household finances, sluggish employment growth, and constrained banking sectors of the advanced economies prevent global aggregate demand from growing fast enough to offset weakness from inventory accumulation, the recession in Europe, and the decline of stimulus spending. Beyond 2012 the balance of the forecast period world real GDP is projected to increase an average of 3.3 percent per year.
The Asia/Pacific and Latin America/Caribbean regions will continue to have the world’s highest economic growth rates. These regions are expected to see their economic activity grow at annual rates of 4.5 and 4.2 percent a year, respectively, over the forecast period (2012-2032). China, with a population of approximately 1.3 billion, is forecast to grow 6.5 percent a year, becoming the world’s second largest economy by 2013 (surpassing Japan). India, with a population of approximately 1.2 billion, is projected to see its GDP more than quadruple in size, growing at an average rate of 7.3 percent a year during the forecast period. In contrast, Japan grows at just 0.7 percent a year over the forecast horizon as structural impediments, the effects of the 2011 earthquakes and tsunami, and an aging population continues to limit growth. The GDP of the Canadian, Western European, and Middle Eastern/North Africa regions are anticipated to rise at more moderate rates of 2.4, 1.7, and 3.8 percent a year, respectively, over the forecast period.
2.52.2
1.6
2.4
5.6
4.0
3.4
4.2
6.8
4.2
5.04.5
3.2
2.21.9
2.4
4.0
2.7 2.6
3.3
-
1.0
2.0
3.0
4.0
5.0
6.0
7.0
8.0
2010 2011 2012 2012-2032
Annu
al P
erce
nt C
hang
e
Calendar Year
Real Gross Domestic Productby World Region
Total Europe/Africa/ME Latin America & Caribbean Asia-Pacific Canada World
Source: IHS Global Insight

FAA Aerospace Forecast Fiscal Years 2012-2032
38
AVIATION TRAFFIC AND ACTIVITY FORECASTS Total traffic and activity forecasts for commercial air carriers (the sum of mainline and regional carriers) are presented in Tables 5 through 9. These tables contain year-to-year historical data and forecasts. Mainline air carrier traffic and activity forecasts and the forecast assumptions are displayed in Tables 10 through 18, 21, and 23. These tables contain year-to-year historical data and forecasts. Regional carrier forecasts and assumptions are found in Tables 24 through 27. These tables provide year-to-year historical and forecast data. Tables 19 and 20 provide year-to-year historical and forecast data for cargo activity. Table 22 provides year-to-year historical and forecast data for the cargo jet fleet. General aviation forecasts are found in Tables 28 through 31. These tables provide year-to-year historical data and forecasts. Tables 32 through 34 provide forecasts of aircraft activity at FAA and contract facilities.
Commercial Aviation Forecasts System capacity is projected to remain flat in 2012. In the domestic market, mainline carrier capacity expanded slightly (2.2 percent) in 2011 but now is projected to contract by 0.8 percent while capacity for the regional carriers is projected to also decline in FY 2012 (down 0.5 percent). In the international sector, capacity is forecast to increase in all markets -- Atlantic, Latin, and Pacific -- resulting in overall international capacity growth of 2.0 percent. Passenger demand shows very little growth in 2012 with system RPMs forecast to grow 0.5 percent and all of this increase projected to come from international markets. An upturn is projected in 2013 with system RPMs and passengers increasing 2.6 and 1.9 percent, respectively, on a capacity increase of 2.1 percent. For the overall forecast period, system capacity is projected to increase an average of 3.1 percent a year. Supported by a growing U.S. economy, with real yields increasing in the near term (2012-2013), and then falling, system RPMs are projected to increase 3.2 percent a year, with regional carriers (up 3.5 percent a year) growing faster than mainline carriers (up 3.2 percent a year). System passengers are projected to increase an average of 2.5 percent a year, with regional carriers growing at slightly higher rate (up 2.5 percent a year) than their mainline counterparts (up 2.5 percent). By 2032, U.S. commercial air carriers are projected to fly 1.9 trillion ASMs and transport 1.23 billion enplaned passengers a total of 1.57 trillion passenger miles. Planes will remain crowded, with load factors projected to grow moderately during the early years of the forecast period then tapering during the mid to latter years to 83.4 percent in 2032

FAA Aerospace Forecast Fiscal Years 2012-2032
39
(up 1.1 points compared to the beginning of the forecast period in 2012). Passenger trip length is forecast to increase by more than 157 miles over the forecast period to 1,276 miles in 2032 (up 8 miles annually). The growth in passenger trip length reflects the faster growth in the relatively longer international and domestic trips as compared to shorter-haul flights.
Domestic Markets After declining for three consecutive years, domestic capacity expanded in FY 2011 but is projected to fall again in 2012 (down 0.8 percent). The contraction will be similar for both mainline and regional carriers; mainline carrier capacity is forecast to decline 0.8 percent in FY 2012 while that of regional carriers is expected to fall by 0.5 percent. Domestic commercial carrier capacity picks up in 2013 (up 1.5 percent) with mainline carriers growing faster than regional carriers, 1.6 percent versus 0.8 percent. For the entire forecast period (2012-2032), overall domestic capacity is projected to increase at an average annual rate of 2.7 percent, slightly faster than economic growth. Mainline carriers are projected to grow at an annual rate of 2.5 percent while regional carriers are projected to grow a percentage point higher.
0
200
400
600
800
1,000
1,200
1,400
2011 2014 2017 2020 2023 2026 2029 2032
Mill
ions
of P
asse
nger
s
Fiscal Year
U.S. Commercial Air CarriersSystem Enplanements
Regionals Mainline

FAA Aerospace Forecast Fiscal Years 2012-2032
40
The slow pace of the economic recovery in the U.S. will dampen RPM growth during 2012, the first year of the forecast (down 0.2 percent). Traffic growth is projected to be sluggish in the first half of the year as fiscal uncertainty continues to surround the U.S. economy. Mainline carrier RPMs are projected to decline by 0.4 percent during 2012, while regional carrier RPMs are projected to increase by 1.1 percent. By 2013, traffic growth improves with RPMs up 2.1 percent as the economic recovery gains some footing. Driven by economic growth and falling real yield, domestic RPMs grow 2.8 percent a year for the remainder of the forecast (2013-2032). For the overall forecast period (2012-2032), domestic RPMs are projected to grow an average of 2.8 percent a year. Mainline carriers are projected to grow more slowly than the regional carriers throughout the forecast period (averaging 2.7 percent versus 3.6 percent a year, respectively).
2.3
-0.8
2.5
0.6
-0.5
3.5
-1.5
-1.0
-0.5
0.0
0.5
1.0
1.5
2.0
2.5
3.0
3.5
4.0
2011 2012 2012-32
Annu
al P
erce
nt C
hang
e
Fiscal Year
U.S. Commercial Air CarriersDomestic ASMs
Mainline Regionals
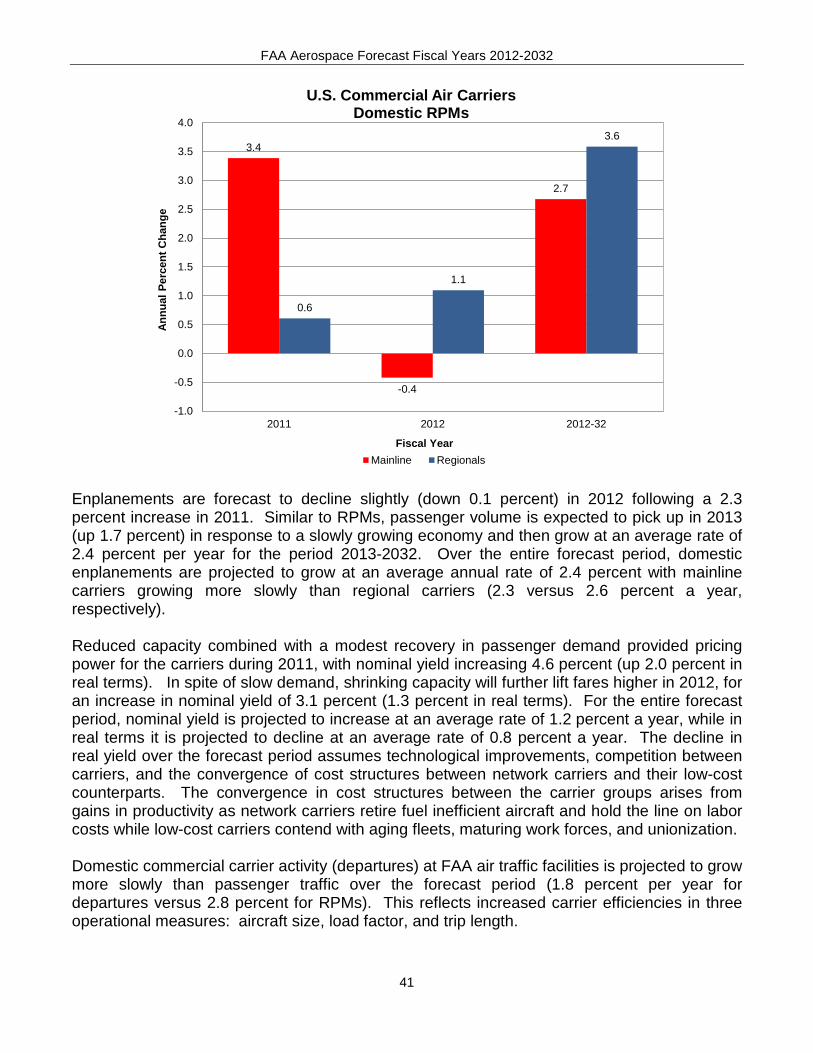
FAA Aerospace Forecast Fiscal Years 2012-2032
41
Enplanements are forecast to decline slightly (down 0.1 percent) in 2012 following a 2.3 percent increase in 2011. Similar to RPMs, passenger volume is expected to pick up in 2013 (up 1.7 percent) in response to a slowly growing economy and then grow at an average rate of 2.4 percent per year for the period 2013-2032. Over the entire forecast period, domestic enplanements are projected to grow at an average annual rate of 2.4 percent with mainline carriers growing more slowly than regional carriers (2.3 versus 2.6 percent a year, respectively). Reduced capacity combined with a modest recovery in passenger demand provided pricing power for the carriers during 2011, with nominal yield increasing 4.6 percent (up 2.0 percent in real terms). In spite of slow demand, shrinking capacity will further lift fares higher in 2012, for an increase in nominal yield of 3.1 percent (1.3 percent in real terms). For the entire forecast period, nominal yield is projected to increase at an average rate of 1.2 percent a year, while in real terms it is projected to decline at an average rate of 0.8 percent a year. The decline in real yield over the forecast period assumes technological improvements, competition between carriers, and the convergence of cost structures between network carriers and their low-cost counterparts. The convergence in cost structures between the carrier groups arises from gains in productivity as network carriers retire fuel inefficient aircraft and hold the line on labor costs while low-cost carriers contend with aging fleets, maturing work forces, and unionization. Domestic commercial carrier activity (departures) at FAA air traffic facilities is projected to grow more slowly than passenger traffic over the forecast period (1.8 percent per year for departures versus 2.8 percent for RPMs). This reflects increased carrier efficiencies in three operational measures: aircraft size, load factor, and trip length.
3.4
-0.4
2.7
0.6
1.1
3.6
-1.0
-0.5
0.0
0.5
1.0
1.5
2.0
2.5
3.0
3.5
4.0
2011 2012 2012-32
Annu
al P
erce
nt C
hang
e
Fiscal Year
U.S. Commercial Air CarriersDomestic RPMs
Mainline Regionals

FAA Aerospace Forecast Fiscal Years 2012-2032
42
Aircraft size increased on an individual basis for both the mainline and regional carrier groups in 2011, resulting in a 0.8 seat increase in overall domestic average aircraft size to 122.6 seats. Mainline carrier aircraft size increased 0.4 seats with the grounding of older, fuel inefficient aircraft (i.e. MD-80’s and 737-300/400/500). Regional aircraft size increased by 0.3 seats with the retirement of 50-seat jet aircraft as larger 70-90 seat jet aircraft entered the fleet. Domestic seats per aircraft are forecast to increase in 2012 (up 0.2 seats). Over the balance of the forecast (2013-2032), domestic seats per aircraft are projected to gradually increase to 126.0 seats by 2032, an average of 0.1 seats per year. The FAA’s projection of domestic carrier average aircraft size is greatly influenced by carrier fleet plans, publicly known aircraft order books, and the FAA’s expectations of the changing domestic competitive landscape. In the near-term (through 2013), the forecast incorporates several assumptions: 1) mainline carriers desire to constrain ASM capacity growth; 2) the retirement of older inefficient aircraft (many of which are narrow-body); 3) the shifting of wide-body and larger narrow-body aircraft to international services, and 4) growing use of 70-90 seat regional jet aircraft. In the longer-term, network carriers will replace their older narrow-body aircraft (A320’s/B757-200/300) larger narrow-body aircraft in their domestic route networks with next generation, narrow-body aircraft like the A320 Neo and the 737 Max. The use of smaller aircraft, like the 100-seat Embraer 190, to supplement carrier route structures will be limited. The use of the next generation, narrow-body aircraft will allow mainline carriers to better serve their customers by more closely matching supply (the number of seats) with demand (the number of passengers), and improve profitability through lower operating costs. Mainline carrier domestic aircraft size increased in 2011 by 0.4 seats to 152.3 seats, and is projected to increase by 0.1 seats in 2012. Domestic aircraft size for mainline carriers is projected to remain unchanged in 2013 and then gradually increase for the balance of the forecast. Overall, average aircraft size for the mainline group will increase by only 1.6 seats between 2011 and 2032, going from 152.3 to 153.9. Regional carrier aircraft size flown domestically is projected to grow at a much faster pace than that of the mainline carriers. The faster growth in aircraft size for regional carriers is stimulated by the wave of 70 to 90 seat regional jet aircraft that are entering the fleet as well as reductions in the 50-seat and under jet fleet. Regional carriers are better equipped to support operations of their mainline partners by providing capacity that complements market demand. The larger share of 70 to 90-seat regional jets in the fleet coupled with significant 50-seat jet and small turboprop retirements over the next few years increases the average seating capacity of the regional fleet from 56.4 seats in 2011 to 56.9 seats by 2012. Over the course of the forecast, seats per aircraft for the regional carriers increases an average of 0.5 seats per year to 66.4 seats in 2032. The changing aircraft fleet mix is narrowing the gap between the size and aircraft types operated by the mainline and regional carriers. The commercial carrier domestic load factor increased 0.8 points during FY 2011 to an all-time high of 82.5 percent, with record load factors posted by the mainline and regional carrier groups. The mainline carrier group posted a load factor of 83.6 percent, up 0.9 percentage points from 2010. The load factor for the regional carriers remained flat at 76.2 percent. In 2012, the domestic load factor is forecast to increase 0.5 points to 83.0 percent as mainline

FAA Aerospace Forecast Fiscal Years 2012-2032
43
carriers increase by 0.4 percentage point and regional carriers further boost their load factor by 1.2 points. Thereafter, the commercial carrier domestic load factor gradually rises to 84.8 percent by 2032. In 2011 the average domestic passenger trip length increased by 6 miles to 881 miles in total, after increasing by 5.3 miles in 2010. Passenger trip length is forecast to decline by 1.3 miles in 2012 and then increase by 3.4 miles in 2013 as carriers continue to restructure their networks and realign capacity. After 2013, trip length is projected to remain stable for a number of years before steadily increasing from 2018 onwards, reaching 951.6 miles by 2032. The increase in trip length reflects longer trips flown by the mainline and regional carrier group. Mainline carrier trip length increases as thinner, shorter haul markets are relinquished to regional partners and replaced with longer domestic trips. Regional carrier trip length increases as flying in shorter haul markets is abandoned and/or reduced as more of the larger 70 and 90-seat regional jets penetrate thinner longer-haul markets previously accessible with only mainline equipment. Another key factor in predicting aviation activity relative to passenger demand is the level of connecting versus non-stop (origin-destination) traffic. However, as the current cycle of U.S. airline industry restructuring unfolds and hub structures change, the impact on local communities and airport activity levels can vary significantly. The FAA analyzes the ratio of passenger enplanements to origin-destination (O&D) passengers over time to identify changes in connecting versus non-stop traffic. This ratio is an indicator of the tendency of the average passenger to connect during a typical journey. The closer the ratio is to 1.0, the more passengers fly on a point-to-point routing. As the chart below shows, the overall ratio for the U.S. domestic industry varied within a narrow band between 1995 and 2002. After 2002, the ratio trailed downward to its lowest level (1.32 enplanements for every O&D passenger) by 2008. The decline in the ratio during this six year period is characterized by a drop in connectivity by the network carriers and a rising passenger share for the low-cost carriers. A slight uptick in the ratio started again in 2009 (1.34 enplanements for every O&D passenger) and continued into 2011 (1.35 enplanements for every O&D passenger); this highlights the retrenchment by carriers as fuel costs skyrocketed and demand for air travel plummeted. The FAA’s forecast recognizes the changing pattern of domestic traffic connectivity and these trends are captured in the forecast’s passenger enplanement totals.

FAA Aerospace Forecast Fiscal Years 2012-2032
44
International Markets U.S. and Foreign Flag Carriers The FAA provides forecasts of total international passenger demand12 for travel between the United States and three world travel areas: Atlantic, Latin America (including Mexico and the Caribbean), and Asia/Pacific, as well as for U.S.–Canadian transborder traffic. These forecasts are based on historical passenger statistics provided by the United States Immigration and Naturalization Services (INS) and Transport Canada, and on regional world historical data and economic projections from Global Insight, Inc. Total passenger traffic between the United States and the rest of the world is estimated to total 161.8 million in CY 2011, 2.8 percent higher than in 2010. Passenger demand remains consistent in 2012 (up 2.6 percent) and accelerates in 2013 (up 4.0 percent) as the world economic recovery solidifies. For the balance of the forecast period, stable worldwide economic growth leads international passengers to grow at an average rate of 4.1 percent a year, totaling 376.1 million in 2032. In the Latin America region, sustained economic growth drives passenger growth to an average of 4.7 percent a year over the entire forecast period (2011-2032). The highest growth is projected for Brazil (average annual growth of 6.2 percent) while the largest market in the region, Mexico, grows at an average of 4.9 percent a year. The slowest rates of growth are
12 The sum of U.S. and foreign flag carriers.
1.30
1.31
1.32
1.33
1.34
1.35
1.36
1.37
1.38
1.39R
atio
Fiscal Year
U.S. Commercial CarriersDomestic Enplanements per
Origin-Destination Passenger
Source: DOT T100 and O&D Survey

FAA Aerospace Forecast Fiscal Years 2012-2032
45
projected to occur in the Bahamian and Jamaican markets (averaging growth of 0.2 and 2.6 percent a year, respectively). Emerging economies in the Asia-Pacific market boost passenger demand an average of 4.1 percent per year. India, Taiwan and China (passenger growth of 6.3, 5.0 and 6.9 percent a year, respectively) are forecast to be the fastest growing markets in the region. Growth in the Japan market (the largest and most established in the region) is projected to be well below the regional average at 2.4 percent a year. In the mature Atlantic market, the Open Skies agreement between the European Union and the United States along with competition between global airline alliances helps fuel passenger growth of 3.8 percent a year over the forecast period. Over the 21-year forecast horizon, average annual passenger growth in the top four Atlantic markets (Ireland, Netherlands, Germany, and the United Kingdom) is 5.1, 4.1, 3.7, and 3.6 percent, respectively. Growth in the Canadian transborder market is forecast to be higher than that of the domestic U.S. market (2.3 percent), averaging 3.0 percent a year over the forecast period.
U.S. Flag Air Carriers International U.S. commercial air carrier capacity grew substantially in 2011, up 6.7 percent from 2010. The Pacific and Atlantic markets both made strong recoveries in 2011 (up 10.4 and 5.6 percent, respectively) whereas Latin America’s capacity was slightly sluggish at 5.3 percent. In 2012, moderate demand and increasing competition between global alliances is expected to boost capacity by 2.0 percent (up 2.5, 0.8 and 3.6 percent, respectively in the Pacific, Atlantic, and Latin markets). Capacity is projected to grow an additional 3.5 percent in
3.8
4.7
2.6
4.1
-
0.5
1.0
1.5
2.0
2.5
3.0
3.5
4.0
4.5
5.0
Atlantic Latin America Asia/Pacific Canada Transborder
Annu
al P
erce
nt C
hang
e
U.S. and Foreign Flag CarriersPassengers to/from U.S.
Calendar Years 2011-2032

FAA Aerospace Forecast Fiscal Years 2012-2032
46
2013, fueled by stronger economic growth projected for all world regions, and is projected to average 4.4 percent a year for the remainder of the forecast period. Moderate growth over the forecast period reflects favorable U.S. and world economic activity as it recovers from the global contraction.
U.S. commercial air carrier international RPMs and enplanements increased 4.8 percent and 4.4 percent, respectively, in 2011. The strong growth in capacity relative to RPMs and passengers highlights a significant change from last year when carriers actively restrained capacity as demand resumed. An increase in RPMs for the Latin market (up 5.9 percent) and Pacific market (up 7.4 percent) helped offset a more modest increase in the Atlantic market (up 2.8 percent). In 2012, U.S. carrier international RPMs are expected to increase only 2.2 percent while being led by growth in the Latin American market (up 4.7 percent) and followed by growth in the Pacific (up 1.6 percent) and the Atlantic market (up 1.0 percent). For the balance of the forecast, RPMs increase an average of 4.4 percent a year with the fastest growth showing in the Latin region (5.0 percent). International enplanement growth for 2012 shows very flat demand (1.9 percent); however, enplanements are projected rebound at 3.0 percent in 2013. Over the balance of the forecast period (2014-2032), enplanements are forecast to increase an average of 4.3 percent a year with the fastest growth in Latin and Pacific markets (up 4.7 and 4.2 percent a year, respectively).
5.6
0.8
4.1
5.3
3.6
5.0
10.4
2.5
3.6
6.7
2.0
4.2
0.0
2.0
4.0
6.0
8.0
10.0
12.0
2011 2012 2011-32
Annu
al P
erce
nt C
hang
e
Calendar Year
U.S. Commercial Air CarriersInternational ASMs
Atlantic Latin Pacific Total

FAA Aerospace Forecast Fiscal Years 2012-2032
47
The growth in U.S. carrier international passengers over the period 2011-2032 (4.1 percent a year) compares favorably to the growth in overall international passengers (also 4.1 percent a year, including the U.S.-Canada transborder market). Forecasts of international demand assume U.S. and foreign flag carriers will benefit from improving economic activity in both the United States and world markets. International load factor for U.S. commercial carriers was 80.7 percent in 2011, a decrease of 1.7 percent from 2010. Load factor is expected to remain flat in 2012 as stronger capacity growth relative to traffic growth in the Atlantic market is offset by stronger traffic growth relative to capacity growth in the Pacific and Latin markets. International load factor is projected to increase 0.2 points in 2013 as traffic growth exceeds capacity growth in all three world markets. Load factor rises quite slowly through the remainder of the forecast to be 81.2 percent in 2032. International passenger real yields for U.S. mainline carriers were up 7.2 percent in 2011 as the rebound in passenger demand from the global recession outpaced capacity growth. The largest increase was in the Latin America market (up 11.4 percent), followed by the Pacific (up 9.8 percent) and the Atlantic market (up 3.3 percent). Buoyed by growing passenger demand, international real yields are projected to increase by 3.9 and 1.3 percent in 2012 and 2013, respectively. For the remainder of the forecast period, real yield decreases an average of 1.0 percent a year. In nominal terms, international yields are forecast to increase 5.9 percent in 2012, and 3.1 percent in 2013 and then grow at an annual rate of 1.0 percent over the remainder of the forecast. The decline in real yields assumes competitive pressures and technological improvements will hold the line on fare increases.
2.8
1.0
4.1
6.2
4.2
5.0
7.4
2.2
3.6
4.9
2.2
4.3
-
1.0
2.0
3.0
4.0
5.0
6.0
7.0
8.0
2011 2012 2011-32
Annu
al P
erce
nt C
hang
e
Calendar Year
U.S. Commercial Air CarriersInternational RPMs
Atlantic Latin Pacific Total

FAA Aerospace Forecast Fiscal Years 2012-2032
48
Commercial Air Carriers – Air Cargo During 2009, world industrial production fell 9.0 percent, producing the worst decline in freight transport in 80 years.13 Historically, air cargo activity tracks with GDP. Additional factors that affect air cargo growth are fuel price volatility, movement of real yields, and globalization. Significant structural changes have occurred in the air cargo industry; among these are air cargo security regulations by the FAA and TSA, maturation of the domestic express market, a shift from air to other modes (especially truck), use of all-cargo carriers (e.g., FedEx) by the U.S. Postal Service to transport mail, and the increased use of mail substitutes (e.g., faxes, e-mail). The forecasts of Revenue Ton Miles (RTMs) are based on several assumptions specific to the cargo industry. First, security restrictions on air cargo transportation will remain in place. Second, most of the shift from air to ground transportation has occurred. Finally, long-term cargo activity will be tied to economic growth. The forecasts of RTMs were based on models that link cargo activity to GDP. Forecasts of domestic cargo RTMs were developed with real U.S. GDP as the primary driver. Projections of international cargo RTMs were based on growth in world GDP, adjusted for inflation. The distribution of RTMs between passenger and all-cargo carriers was forecast based on an analysis of historic trends in shares, changes in industry structure, and market assumptions. Total RTMs grew by 3.7 percent in 2011 and are forecast to grow again in 2012 by 4.5 percent. Driven by steady economic growth, total RTMs are projected to increase at an average annual rate of 4.9 percent for the balance of the forecast period. Domestic cargo RTMs contracted by 6.1 percent in 2011 and are forecast to decline by 2.7 percent in 2012. Between 2012 and 2032, domestic cargo RTMs are forecast to increase at an average annual rate of 1.8 percent. The freight/express segment of domestic air cargo is highly correlated with capital spending. Thus, this segment’s growth will be tied to growth in the economy. The mail segment of domestic air cargo will be affected by price and substitution (e.g. e-mail). The all-cargo carriers have increased their share of domestic cargo RTMs flown from 70.0 percent in 2000 to 87.6 percent in 2011. This is because of the shrinkage of the domestic freight/express business for passenger carriers as they have responded to the substantial shocks to the aviation system during this time. Shrinking networks, elimination of unprofitable flying, and consolidation have reduced opportunities for growth in their freight/express business. The all-cargo share is forecast to grow to 89.7 percent by 2032 based on increases in capacity for all-cargo carriers and security considerations.
13 Boeing World Air Cargo Forecast 2010-2011, released November 2010.

FAA Aerospace Forecast Fiscal Years 2012-2032
49
International cargo RTMs rose 9.1 percent in 2011 reflecting a continuing recovery from the global economic downturn of 2009. They are projected to grow 8.0 percent in 2012 as trade continues to expand. For the balance of the forecast period, international cargo RTMs are forecast to increase an average of 5.7 percent a year based on projected growth in world GDP. The share of international cargo RTMs flown by all-cargo carriers increased from 49.3 percent in 2000 to 69.2 percent in 2011. Beyond 2011, the all-cargo share of RTMs flown is forecast to increase modestly to 75.5 percent by 2032.
Commercial Aircraft Fleet The number of commercial aircraft is forecast to grow from 7,185 in 2011 to 9,853 in 2032, an average annual growth rate of 1.5 percent or 127 aircraft annually. The commercial fleet is projected to decrease by 97 aircraft in 2012 after shrinking by 29 aircraft in 2011 as the slow recovery in demand and rising fuel prices prompted carriers to prune their fleets. Since 2007, the U.S. commercial airline fleet has contracted by 552 aircraft. In comparison, the U.S. commercial fleet contracted by 262 aircraft between 2000 and 2003, the last downturn in aviation.
-6.1
-2.7
1.8
9.18.0
5.9
-10.0
-5.0
0.0
5.0
10.0
15.0
2011 2012 2012-32
Annu
al P
erce
nt C
hang
e
Fiscal Year
U.S. Commercial Air CarriersRTMs
Domestic International
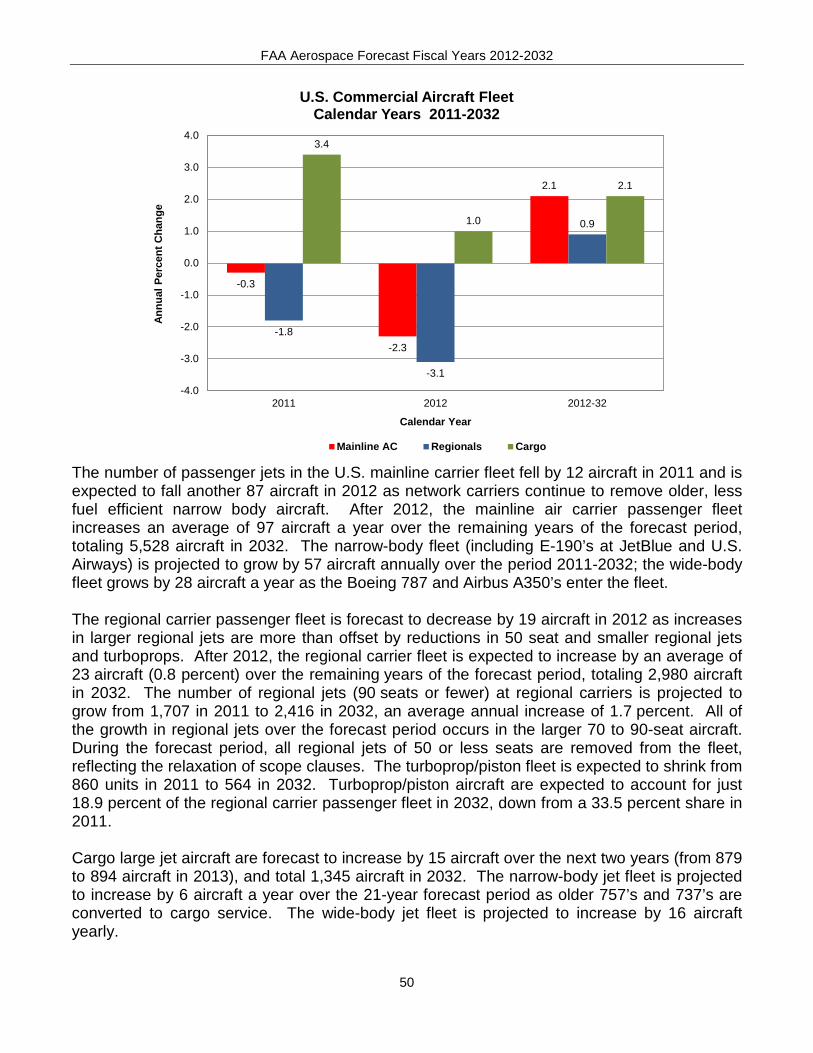
FAA Aerospace Forecast Fiscal Years 2012-2032
50
The number of passenger jets in the U.S. mainline carrier fleet fell by 12 aircraft in 2011 and is expected to fall another 87 aircraft in 2012 as network carriers continue to remove older, less fuel efficient narrow body aircraft. After 2012, the mainline air carrier passenger fleet increases an average of 97 aircraft a year over the remaining years of the forecast period, totaling 5,528 aircraft in 2032. The narrow-body fleet (including E-190’s at JetBlue and U.S. Airways) is projected to grow by 57 aircraft annually over the period 2011-2032; the wide-body fleet grows by 28 aircraft a year as the Boeing 787 and Airbus A350’s enter the fleet. The regional carrier passenger fleet is forecast to decrease by 19 aircraft in 2012 as increases in larger regional jets are more than offset by reductions in 50 seat and smaller regional jets and turboprops. After 2012, the regional carrier fleet is expected to increase by an average of 23 aircraft (0.8 percent) over the remaining years of the forecast period, totaling 2,980 aircraft in 2032. The number of regional jets (90 seats or fewer) at regional carriers is projected to grow from 1,707 in 2011 to 2,416 in 2032, an average annual increase of 1.7 percent. All of the growth in regional jets over the forecast period occurs in the larger 70 to 90-seat aircraft. During the forecast period, all regional jets of 50 or less seats are removed from the fleet, reflecting the relaxation of scope clauses. The turboprop/piston fleet is expected to shrink from 860 units in 2011 to 564 in 2032. Turboprop/piston aircraft are expected to account for just 18.9 percent of the regional carrier passenger fleet in 2032, down from a 33.5 percent share in 2011. Cargo large jet aircraft are forecast to increase by 15 aircraft over the next two years (from 879 to 894 aircraft in 2013), and total 1,345 aircraft in 2032. The narrow-body jet fleet is projected to increase by 6 aircraft a year over the 21-year forecast period as older 757’s and 737’s are converted to cargo service. The wide-body jet fleet is projected to increase by 16 aircraft yearly.
-0.3
-2.3
2.1
-1.8
-3.1
0.9
3.4
1.0
2.1
-4.0
-3.0
-2.0
-1.0
0.0
1.0
2.0
3.0
4.0
2011 2012 2012-32
Annu
al P
erce
nt C
hang
e
Calendar Year
U.S. Commercial Aircraft FleetCalendar Years 2011-2032
Mainline AC Regionals Cargo

FAA Aerospace Forecast Fiscal Years 2012-2032
51
General Aviation The FAA forecasts the fleet and hours flown for single-engine piston aircraft, multi-engine piston, turboprops, turbojets, piston and turbine powered rotorcraft, light sport, experimental and “other” (which consists of gliders and lighter than air vehicles). The FAA forecasts “active aircraft,”14 not total aircraft. The FAA uses estimates of fleet size, hours flown, and utilization from the General Aviation and Part 135 Activity Survey (GA Survey) as baseline figures upon which assumed growth rates can be applied. Beginning with the 2004 GA Survey, there were significant improvements to the survey methodology. Coinciding with the changed survey methodology, large changes in many categories were observed, both in the number of aircraft and hours flown. The results of the 2010 GA Survey are consistent with the results of surveys conducted since 2004, reinforcing our belief that the methodological improvements have resulted in superior estimates relative to those of the past. Thus, they are used as the basis for our forecast. Because results from the GA Survey are not published until the following year, the 2010 statistics are the latest available. Figures for 2011 are estimated based on other activity indicators. Activity forecasts begin in 2012 and continue through 2032. After growing rapidly for most of the past decade, and having slowed over the past few years, the most recent shipment activity indicates cautiously optimistic results that the hard impact of the recession on the business jet market may have come to an end and demand for business jet aircraft is beginning to recover. The forecast calls for robust growth in the long term outlook, driven by higher corporate profits and the growth of worldwide GDP. Additionally, continued concerns about safety, security, and flight delays keep business aviation attractive relative to commercial air travel. As the industry experts report a significant portion of piston aircraft hours are also used for business purposes, we predict business usage of general aviation aircraft will expand at a faster pace than that for personal and recreational use. The active general aviation fleet is projected to increase at an average annual rate of 0.6 percent over the 21-year forecast period, growing from an estimated 222,520 in 2011 to 253,205 aircraft by 2032. The more expensive and sophisticated turbine-powered fleet (including rotorcraft) is projected to grow at an average of 2.9 percent a year over the forecast period, with the turbine jet portion increasing at 4.0 percent a year.
14 An active aircraft is one that flies at least one hour during the year.

FAA Aerospace Forecast Fiscal Years 2012-2032
52
The number of active piston-powered aircraft (including rotorcraft) is projected to decrease from the 2010 total of 159,007 to 151,685 through 2023, with declines in both single and multi-engine fixed wing aircraft, but with the smaller category of piston-powered rotorcraft growing. Beyond 2023, active piston-powered aircraft are forecast to increase to 155,395 by 2032. Over the forecast period, piston-powered aircraft is projected to decrease by an average annual rate of 0.1 percent. Although piston rotorcraft are forecast to increase by 2.1 percent a year, they are a relatively small part of this segment of general aviation aircraft and therefore have little effect on the overall trend. Single-engine fixed-wing piston aircraft, which are much more numerous, are projected to decline at a rate of 0.1 percent, while multi-engine fixed wing piston aircraft are projected to decline by 0.5 percent a year. Starting in 2005, a new category of aircraft (previously not included in the FAA's aircraft registry counts) was created: "light sport" aircraft. At the end of 2010, a total of 6,528 active aircraft were estimated to be in this category. The forecast assumes about 4 percent annual growth of the fleet until 2013. Thereafter the rate of increase in the fleet slows to about 2 percent per year. By 2032, a total of 10,195 light sport aircraft are projected to be in the fleet. The number of general aviation hours flown is projected to increase by 1.7 percent yearly over the forecast period. The FAA projects above average growth in hours will occur after 2023 with increases in the fixed wing turbine aircraft fleet, as well as a rebounding single engine piston fleet and increasing utilization of single engine piston aircraft as the aging of this fleet starts to slow down. In the medium term, much of the increase in hours flown reflects strong growth in the rotorcraft and turbine jet fleets. Hours flown by turbine aircraft (including rotorcraft) are forecast to increase 3.6 percent yearly over the forecast period, compared with essentially no growth (0.03 percent) for piston-powered aircraft. Jet aircraft are forecast to account for most of the increase, with hours flown increasing at an average annual rate of 5.3 percent over the forecast period. The large increases in jet hours result mainly from the increasing size of the
(0.4)
0.1
0.6
2.0 2.1
2.9
-1.0
-0.5
0.0
0.5
1.0
1.5
2.0
2.5
3.0
3.5
2011 2012 2012-32
Annu
al P
erce
nt C
hang
e
Calendar Year
Active General Aviation Aircraft
Total Turbines

FAA Aerospace Forecast Fiscal Years 2012-2032
53
business jet fleet, along with a measured recovery in utilization rates from recession induced record lows. Rotorcraft hours, which were less impacted by the economic downturn when compared to other categories and rebounded earlier, are projected to grow by 2.6 percent yearly. An expected decline in utilization rates of turbine rotorcraft is due to the assumption that recently improved affordability at the lower end of the turbine market will sustain the recent market share shift toward turbines; however, as turbine powered rotorcraft replaces the pistons, and since most of their functions will remain unchanged, utilization rates of some of the new turbines will be closer to those of the pistons. Lastly, the light sport aircraft category is expected to see an increase in hours flown of 3.5 percent a year; this is primarily driven by growth in the fleet.
The number of active general aviation pilots (excluding air transport pilots) is projected to be 510,295 in 2032, an increase of over 35,000 (up 0.3 percent yearly) over the forecast period. Commercial pilots are projected to increase from 120,865 in 2011 to 130,100 in 2032, an average annual increase of 0.4 percent. The number of student pilots is forecast to decrease at an average annual rate of 0.1 percent over the forecast period, declining from 118,657 in 2011 to 116,720 in 2032. In addition, the FAA is projecting that by the end of the forecast period a total of 13,900 sport pilots will be certified. As of December 31, 2011, the number of sport pilot certificates issued was 4,066 reflecting a steady increase in this new “entry level” pilot certificate that was only created in 2005. The number of private pilots is projected to grow at an average yearly rate of 0.1 percent over the forecast period to a total of 199,300 in 2032 from 194,441 in 2011.
(1.6)
1.4 1.7
(0.4)
8.7
3.3
(4.0)
(2.0)
-
2.0
4.0
6.0
8.0
10.0
2011 2012 2012-32
Annu
al P
erce
nt C
hang
e
Calendar Year
Hours Flown in General Aviation Aircraft
Total Turbines

FAA Aerospace Forecast Fiscal Years 2012-2032
54
FAA Workload Forecasts
FAA and Contract Towers Activity at the 512 FAA (264) and contract towers (248) totaled 50.7 million operations in 2011, down 1.0 percent from 2010. Activity is projected to decrease 1.2 percent in 2012, as declines in non-commercial operations more than offset increases in commercial activity. Growth in total activity at FAA and contract towers resumes in 2013 (1.1 percent) and for the balance of the forecast, activity grows at an average rate of 1.1 percent per year, reaching 62.6 million operations in 2032. Most of the growth over the forecast period results from increased commercial aircraft activity (up 1.8 percent annually). Air carrier activity is projected to increase slightly (0.2) percent in 2012 as carriers keep capacity under control given the uncertain economic environment. Beyond 2012, air carrier activity is projected to increase an average of 2.1 percent per year over the forecast period. Commuter/air taxi operations are forecast to fall 0.7 percent in 2012 then increase 1.6 percent a year for the balance of the forecast period. General aviation activity fell 2.3 percent in 2011 with declines in both itinerant (down 2.3 percent) and local (down 2.4 percent) activity. Activity is projected to fall again in 2012 (down 2.2 percent) reflecting the continuing impact of the 2009 recession before beginning to rise modestly in 2013 (up 0.4 percent) as a growing economy promotes the growth of flight hours and operations despite higher oil prices. For the entire forecast period, general aviation activity at towered airports is projected to increase an average of 0.4 percent a year, to 27.8 million operations in 2032. General aviation activity at combined FAA/contract towers grows in line with the modest increase forecast for general aviation piston hours already cited. Most operations at the smaller towers are in piston aircraft, while those at the largest airports tend to be turbine operations. Military activity rose 0.9 percent in 2011 and is assumed to remain at 2011 levels throughout the balance of the forecast period. Operations15 at FAA TRACONs (Terminal Radar Approach Control) fell 1.8 percent in 2011, the seventh year in a row. They are projected to fall an additional 1.2 percent in 2012 as both commercial and non-commercial activity decline. After 2012, TRACON operations are forecast to increase at an average annual rate of 1.3 percent for the balance of the forecast. For the entire forecast period, TRACON operations grow an average of 1.2 percent per year, totaling 49.4 million in 2032.
15 TRACON operations consist of itinerant Instrument Flight Rules (IFR) and Visual Flight Rules (VFR) arrivals and departures at all airports in the domain of the TRACON as well as IFR and VFR overflights.

FAA Aerospace Forecast Fiscal Years 2012-2032
55
Over the forecast period, commercial aircraft operations at FAA TRACONs are forecast to increase at 1.8 percent per year with increases in air carrier activity surpassing commuter/air taxi activity. General aviation operations at FAA TRACONs are projected to grow 0.3 percent a year, reflecting the slow growth in the general aviation fleet and hours. Military activity is expected to remain at its 2011 level (2.4 million) of activity throughout the forecast period.
En-route Centers The number of IFR aircraft handled at FAA en-route traffic control centers increased 1.8 percent to 41.2 million in 2011, highlighted by a 4.8 percent increase in commercial aviation activity. However given the projected declines in airline activity and general aviation hours, en-route center activity is forecast to decrease by 0.1 percent in 2012. After 2012, through the balance of the forecast period, en-route activity increases 2.1 percent annually, reaching 61.2 million aircraft handled in 2032. Over the entire forecast period, commercial activity is projected to increase at an average annual rate of 2.4 percent, reflecting increases in the commercial fleet and aircraft stage lengths. During the same period, general aviation activity is projected to grow 0.9 percent per year, reflecting growth in business aviation. Military activity is held constant at the 2011 activity level throughout the forecast period.
-1.8
-1.2
1.3
-1.2
-0.4
1.9
-2.5
-2.0
-1.5
-1.0
-0.5
0.0
0.5
1.0
1.5
2.0
2.5
2011 2012 2012-32
Annu
al P
erce
nt C
hang
e
Fiscal Year
Tracon Operations
Total Commercial

FAA Aerospace Forecast Fiscal Years 2012-2032
56
Activity at FAA en-route centers is growing faster than at FAA towered airports because more of the activity at en-route centers is from the faster growing commercial sector and high-end (mainly turbine) general aviation flying. Much of general aviation activity at FAA towered airports, which is growing more slowly, is local in nature, and does not impact the centers.
1.8
-0.1
2.1
4.8
0.1
2.4
-1.0
0.0
1.0
2.0
3.0
4.0
5.0
6.0
2011 2012 2012-32
Annu
al P
erce
nt C
hang
e
Fiscal Year
IFR Aircraft Handledat FAA En-Route Centers
Total Commercial

FAA Aerospace Forecast Fiscal Years 2012-2032
57
UNMANNED AIRCRAFT SYSTEMS
Unmanned Aircraft Systems (UASs) come in a variety of shapes and sizes, and serve many purposes. Some have wingspans as large as a Boeing 737 and some are smaller than a radio-controlled model airplane. UAS have changed from remotely piloted vehicles with limited capabilities to semi and fully autonomous vehicles with expanded potential commercial applications. In the United States alone, over 50 companies, universities, and government organizations are developing and producing some 155 unmanned aircraft designs. Market Research Media projects an annual growth of 12 percent for UAS military market. The Teal Group forecasts over $94 billion in total UAS spending over the next ten years.
To address the increasing civil market and the desire by civilian operators to fly UASs, the FAA is developing new policies, procedures, and approval processes. The FAA is working closely with stakeholders in the UAS community to define operational and certification requirements.
It is critical to develop and validate appropriate operational procedures, regulatory standards and policies for routine UAS access to the NAS. To facilitate this, the FAA created the Unmanned Aircraft Program Office (UAPO). The FAA has asked RTCA – a group that frequently advises the agency on technical issues – to work with the industry and develop UAS standards. The FAA chartered an Aviation Rulemaking Committee (ARC) to examine these operational and safety issues and make recommendations on how to proceed with regulating small UASs. The FAA is in the process of proposing a regulation based on the recommendations received from the ARC.
Once enabled, commercial UAS markets will develop. There are many potential ways for a company to generate revenue from UAS applications, whether from new markets or more efficient applications in established markets. Based upon the expected regulatory environment, FAA predicts roughly 10,000 active commercial UASs in five years.
With the safe integration into the airspace, UAS has the potential to be a significant component in commercial aviation.
FAA Aerospace Forecast Fiscal Years 2012-2032
58
COMMERCIAL SPACE TRANSPORTATION
The Federal Aviation Administration’s (FAA) Office of Commercial Space Transportation (AST) licenses and regulates U.S. commercial space launch activity including launch vehicles and non-federal launch sites authorized by Executive Order 12465 and 49 U.S. Code, Subtitle IX, Chapter 701 (formerly the Commercial Space Launch Act). Title 49 and the Executive Order also direct the Department of Transportation (carried out by the FAA) to encourage, facilitate, and promote commercial launches. AST’s mission is to license and regulate commercial launch and reentry operations and non-federal launch sites to protect public health and safety, the safety of property, and the national security and foreign policy interests of the United States.
Overview
Commercial space transportation primarily consists of commercial launch service providers launching satellites into orbit for either commercial or government customers. Commercial space transportation also includes suborbital launches, where a payload or a vehicle is launched on a trajectory that briefly enters space but returns to Earth without entering orbit. Finally, it includes the reentry of objects from space to Earth.
The FAA licenses several expendable vehicles used for commercial orbital launches. The most frequently used vehicles are:
• Atlas V, a heavy-class vehicle built by United Launch Alliance (ULA), a joint venture between Boeing and Lockheed Martin, and marketed by Lockheed Martin Commercial Launch Services (LMCLS);
• Delta IV, a heavy-class vehicle and the Delta II, a medium-class vehicle, both built by ULA and marketed by Boeing Launch Services (BLS);
• Falcon 9, an intermediate-class launch vehicle built, operated, and marketed by Space Exploration Technologies Corp. (SpaceX).
• Pegasus and Taurus, two small vehicles built, operated, and marketed by Orbital Sciences Corporation (Orbital); and
• Zenit-3SL, a heavy-class vehicle built by the Ukrainian company KB Yuzhnoye for the multinational Sea Launch venture which conducts launches from a floating launch platform, with Long Beach, CA as its home port.
The medium-class Antares by Orbital is currently under development and its first launch is planned for 2012. From 1989 through the end of 2011, DOT/FAA has licensed 205 orbital and suborbital commercial launches.

FAA Aerospace Forecast Fiscal Years 2012-2032
59
Experimental Permits, for suborbital reusable vehicle development and test flights, were first granted by the FAA in 2006 to Blue Origin and Armadillo Aerospace. Other permits have been granted for vehicles participating in the Lunar Lander Challenge. This is a competition to demonstrate technologies potentially applicable to both future lunar spacecraft and commercial suborbital vehicles, with $2 million in prizes offered by NASA’s Centennial Challenges program. Eight commercial spaceports, located in six states, Alaska, California (Vandenberg Air Force Base and Mojave Air and Space Port), Florida (Cape Canaveral and Cecil Field Spaceport), New Mexico, Oklahoma, and Virginia, currently have FAA launch site operator licenses. Several other commercial spaceports around the United States are under development.
Review of 2011 There was one FAA-licensed orbital launch in 2011, down from four in 2010. Sea Launch performed one Zenit 3SL launch of the communications Atlantic Bird 7 satellite for Eutelsat.
FAA Licensed and Permitted Launches, 2010-2011 2010 2011 2012 Forecast Licensed Launches 4 1 6-9 Permitted Launches 0 2 10-25
Worldwide there were 18 orbital commercial launches in 2011, compared to 23 in 2010. In addition to the one FAA-licensed launch, Europe performed four commercial launches, all on the Ariane 5 vehicle. Russian conducted 11 commercial launches of various vehicles, and China conduct two commercial launches on the Long March 3B vehicle. There were 84 total worldwide commercial, civil, and military launches in 2011, with commercial launches representing approximately 23 percent of the total. For more details, see the Year in Review report available online at: http://www.faa.gov/about/office_org/headquarters_offices/ast/reports_studies/year_review/.
Global Forecast
In May 2011, the FAA and the Commercial Space Transportation Advisory Committee (COMSTAC) published their annual global forecast for commercial launch demand, the 2011 Commercial Space Transportation Forecasts. The report forecasts an average of 28.6 commercial orbital launches per year of geosynchronous orbit (GSO) and non-geosynchronous orbit (NGSO) payloads through 2020. That annual average includes 15.6 launches of medium-to-heavy vehicles to deploy GSO satellites, 11.1 launches of medium-to-heavy vehicles to NGSO, and 1.9 launches to NGSO by small vehicles.

FAA Aerospace Forecast Fiscal Years 2012-2032
60
Commercial GSO launches are used for communications satellites with masses ranging from 2,000 to over 6,000 kilograms. There has been an increase in the number of GSO satellites that are larger and more complex; however, there is still a demand for smaller satellites. Demand for commercial NGSO launches spans a number of markets, including commercial remote sensing; science and technology demonstration; and replenishment and replacement of low Earth orbit communications satellite systems reaching the end of their lifespan. The majority of commercial NGSO launches for science and technology demonstration missions are for nations that do not have indigenous launch capability. The GSO and NGSO forecasts are not a prediction of what will actually be launched but instead represent the expected demand for launch services, based on a variety of inputs. The complete forecast report is available at: http://www.faa.gov/about/office_org/headquarters_offices/ast/reports_studies/forecasts/
FAA Aerospace Forecast Fiscal Years 2012-2032
61
RISKS TO THE FORECASTS The FAA is confident that its current outlook for aviation demand and activity can be achieved. However, this year’s forecast is driven, at least in the short-term, by a number of factors including security, as well as the strength of the economic recovery. As numerous recent incidents (the attempted bombing of a Northwest airliner on Christmas Day 2009, the discovery on multiple devices on cargo flights out of Europe in October 2010) remind us, terrorism remains among the greatest risks to achieving the forecast. Because of aviation’s high visibility and global reach, concerns remain about international terrorism. Any terrorist incident aimed at aviation would have an immediate and significant impact on the demand for aviation services. Although oil prices remained high in 2011, there is still considerable uncertainty as to the level of oil prices once the economic recovery is on firmer ground. The FAA’s baseline forecast (derived from economic assumptions in IHS Global Insight’s 30-Year Focus released during the third quarter of 2011) calls for steady increases in oil prices after 2011. The increases are relatively modest, with the price of oil approaching $110/barrel by 2015 and then remaining around that level until 2024. Thereafter, prices begin to escalate gradually, approaching $140/barrel by the end of the forecast period in 2032. Some forecasters are calling for a much sharper increase in the price of oil. The U.S. Energy Information Administration (EIA) in its 2012 Annual Energy Outlook projects oil prices exceeding $120/barrel by 2015-2016 and continuing to rise over the next 20 years, reaching $195-$210 per barrel in 2032. While lower oil prices give consumers an impetus for additional spending, including air travel, and increases the chances for industry profitability, higher oil prices could lead to further shifts in consumer expenditures away from aviation, dampening a recovery in air transport demand. Furthermore, higher oil prices, especially in the near term, could wipe out industry profitability, put increasing pressure on airline costs, delay balance sheet improvements and discourage expansion plans or orders for new aircraft as carriers focus on maintaining and increasing cash balances. Although the global economy has begun to grow again, the data suggests that a two track recovery is emerging, with growth concentrated in relatively few countries. As a result, the ensuing economic recovery may not be balanced and there is considerable doubt about the strength and sustainability of the expansion. The baseline forecast assumes that growth in China will be significantly higher than in the other large economies – U.S., Japan and the European Union. Doubts remain over the strength of demand in the U.S., Japan and in the European Union as these areas continue to be constrained by structural economic problems and institutional constraints. In addition, many countries in the European Union are implementing austerity policies, aimed at reducing government spending and personal debt, which could turn the regional downturn into a second global recession. Furthermore the steps that were taken to resuscitate the global economy may prove to be excessive, since the resulting surge in liquidity growth seems to be inflating asset bubbles and exacerbating existing global imbalances. Once the global economy recovers from the current downturn, there could be an increased risk posed by asset bubbles and macroeconomic imbalances, which could result in a deeper, more prolonged, and less manageable recession and financial

FAA Aerospace Forecast Fiscal Years 2012-2032
62
crisis. The current forecasts assume strong passenger growth for travel between the United States and other world regions. Any slowing of worldwide economic activity could seriously inhibit the growth in global passenger demand. The outlook for further consolidation via mergers and acquisitions (M&A) is mixed. For network carriers, the bankruptcy filing of American Airlines in November 2011 has led to much speculation of possible combinations with either U.S. Airways or Delta. In the low cost carrier sector, the merger between Southwest and AirTran is progressing at a steady pace with the issuance of a single operating certificate expected in early 2012. Aside from Southwest and AirTran, there appears to be little scope for further consolidation as there are significant obstacles. In particular the financial situation of many low cost carriers limits the possibilities of additional merger activity. For many low cost carriers, the sheer size of merger transactions or the amount of financial risk associated with a merger makes further merger activity unlikely. However, U.S. airlines are exploring other options including global alliances. Many of the major carriers in the U.S. are members of global alliances that operate with some measure of anti-trust immunity from the U.S. DOT. While anti-trust immunity may provide flexibility for airline operators across borders, it may create an anti-competitive environment in the marketplace. These market consolidating vehicles, particularly the anti-trust immunity provisions, may invite increased regulatory scrutiny. If such oversights are launched in the future, this will complicate the evolving structure of the airline industry and may impact demand via new regulations. The forecast assumes the addition of sizable numbers of large regional jets (70 to 90 seats) into the fleet of regional carriers. However, the regional carriers’ future is closely linked to those of the larger network carriers. As demand continues to slowly recover, increased financial pressures on regional operators have appeared. Furthermore, as consolidation has occurred among the network carriers, certain regional carriers have found themselves either saddled with excess capacity or lack of sufficient capacity, or lack of feed traffic. Unlike the period after the terror attacks of September 11, 2001, when network carriers also reduced the size and breadth of their networks, regional carriers have not necessarily seen opportunities for increased flying to backfill the loss of the mainline service. The Delta/Northwest combination and the impending United/Continental combination may reduce opportunities for regional flying substantially. After suffering through a significant downturn in 2009, business and corporate aviation saw a partial recovery in 2010-11. The pace of the recovery in business and corporate aviation is largely based upon the future prospects of economic growth and corporate profits. Future uncertainty in these leading indicators could pose a risk to the forecast, but the risk is not limited to these factors. Public perception of business and corporate aviation, potential environmental regulations and taxes, along with increased security measures placed on business jets, will place downward pressure on the forecast. Other factors, such as new and more efficient product offerings and increased competition from new entrant manufacturers, serve to broaden the potential of the industry. Estimates show that a record number of new business jets are delivered overseas and, with the potential easing of regulations on the use of airspace in foreign countries, the scenario for business jet manufacturers looks all the more promising. Raising the level of security restrictions, and the

FAA Aerospace Forecast Fiscal Years 2012-2032
63
subsequent travel hassles placed on airline passengers, could make corporate jet travel look increasingly appealing. Not only is the volume of aircraft operating at most large hubs expected to increase over the next 20 years, the mix of aircraft operating at most large hubs is also expected to become increasingly complex over the forecast period. The expected increases in the numbers of regional jets and business jets will increase the complexity of the national airspace system and make the FAA’s job more challenging. The increased complexity of the mix of aircraft serves to compound the increases in workload strictly due to the increasing demand for aviation services projected over the forecast period. Although overall activity at FAA and contract towers fell in 2011, activity at the largest airports increased in 2011 and delays remained at historically high levels at many U.S. airports. As demand recovers and workload increases, congestion and delays could become a critical limit to growth over the forecast period. FAA’s forecasts of both demand and workload are unconstrained in that they assume that there will be sufficient infrastructure to handle the projected levels of activity. Should the infrastructure be inadequate and result in even more congestion and delays, it is likely that the forecasts of both demand and workload would not be achieved. The Department of Transportation and the FAA are examining a number of options to manage congestion but the specific measures have yet to be implemented; therefore, their impacts are unknown at this time. There are concerns that aviation’s impact on the environment could potentially restrict the ability of the aviation sector to grow to meet national economic and mobility needs. Airport expansion or new construction is often a contentious issue because of noise, air quality, and water quality concerns. Concerns about the climate impacts of aviation emissions continue to grow. Although aviation currently accounts for 2 to 3 percent of global carbon emissions, this is expected to increase with the growth in operations unless mitigated with new technology, renewable fuels, operational improvements and market based measures. Market based measures could lead to increased operating costs. For example, if international objections to inclusion of aviation in the European Emissions Trading System (EU ETS) are not resolved, implementation of EU ETS has the potential to increase costs to the aviation sector. The increase in costs would not only raise the price of aviation to consumers but could also reduce available funds for needed investments in new technology that could reduce emissions. The increased costs could also conceivably hasten the adoption of more fuel efficient technologies. Energy concerns are also rising, driven by spikes in fuel prices, supply and security issues, and concerns about fossil fuel emissions contributing to global climate change. Lack of progress in improving the environmental and energy outlook for the future fleet may result in more restrictions via standards or operating limitations on the fleet in service which in turn may depress growth. By contrast, breakthroughs in quieter, cleaner aircraft technologies and renewable fuels could reduce environmental and energy constraints on the forecast, and enable sustainable growth.

FAA Aerospace Forecast Fiscal Years 2012-2032
64
APPENDIX A: ALTERNATIVE FORECAST SCENARIOS
Uncertainty exists in all industries, but especially in the commercial air travel industry. As volatility in the global environment has increased, the importance of scenarios for planning purposes has increased. In order to help stakeholders better prepare for the future, the FAA has begun to provide alternative scenarios to our baseline forecasts of airline traffic and capacity. To create the baseline forecast, economic assumptions for both U.S. and international regions from IHS Global Insight’s 30-Year Focus (released third quarter 2011) were used to generate enplanements, mainline real yield and nominal yield. The baseline forecast of passenger trip length (an input variable used to forecast mainline real yield) was derived from recent historical trends and analyst judgment. To develop the alternative scenarios, assumptions from the optimistic and pessimistic scenarios contained in IHS Global Insight’s 30-Year Focus were used. Inputs from these scenarios were substituted for the baseline scenario inputs to create a “high” and “low” traffic, capacity, and yield forecast. The baseline forecast trip length was adjusted in the optimistic and pessimistic scenarios based on the movement of oil prices in Global Insight’s alternative forecasts relative to the baseline forecast. International passengers and traffic are primarily determined by GDP. Thus, the baseline forecast of GDP for both the U.S. and international regions is modified using the optimistic and pessimistic forecasts of GDP described above in order to create a high and low case.
Scenario Assumptions The FAA’s baseline forecast assumes that the economy recovers from the current downturn and suffers no major mishaps such as large oil price shocks, swings in macroeconomic policy, or financial meltdowns. In the alternative scenarios, the economy is assumed to proceed smoothly as well, however at a different pace than projected under the baseline forecast. Projections for economic growth in IHS Global Insight's alternative scenarios are rooted in demographics. In IHS Global Insight's optimistic forecast scenario, population grows more rapidly than in the baseline due to higher net immigration. The reverse is true for the pessimistic forecast; population grows more slowly than the baseline forecast due to slower net immigration. The FAA’s high case forecast uses IHS Global Insight’s optimistic forecast. The optimistic forecast is characterized by lower inflation and faster growth in the labor force and capital stock than in the baseline forecast. In this scenario productivity growth is higher and potential output climbs more rapidly, with GDP growing about 0.4 percentage points faster per year than the baseline forecast and unemployment averaging 0.4 points lower on an annual basis than the baseline (GDP and unemployment are used as an input variables to the FAA’s base, high and

FAA Aerospace Forecast Fiscal Years 2012-2032
65
low forecasts of enplanements). Conversely, FAA’s low case forecast uses IHS Global Insight’s pessimistic scenario. The pessimistic forecast is characterized by higher inflation and slower growth in the labor force and capital stock than in the baseline forecast. In this scenario, the U.S. economy grows 0.6 percentage points slower per year than in the baseline due to slower productivity and lower potential output growth, and unemployment, on average, is 0.3 points higher on an annual basis than in the baseline.
Oil prices affect the supply of and demand for air travel and have a direct impact on the profitability of the industry. In all three forecast scenarios prices remain high by historical standards. In the baseline forecast, oil prices rise as the world economy recovers from the recession, but are kept in check as technological improvements act as a counterbalance to rising prices. In the baseline, the refiners acquisition cost (RAC) of oil increases 46 percent between 2011 and 2032, rising from $95 to $138 per barrel. In the high case, the RAC increases at a slower pace than in the baseline forecast resulting in a price of $114 per barrel at the end of the forecast period. The high case is characterized by availability of energy and gains in technology which help to temper prices compared to the baseline. In the low case forecast, scarcity of oil and lower productivity gains create upward pressure in oil prices. In this scenario, the RAC doubles, rising to $191 by 2032.
2.01.9
2.0
2.6 2.6 2.6
3.0
3.3
2.9
0.0
1.0
2.0
3.0
4.0
2011-2032 2011-2016 2016-2032
Annu
al P
erce
nt C
hang
e
Fiscal Year
Real Gross Domestic Product
Pessimistic Baseline OptimisticSource: IHS Global Insight

FAA Aerospace Forecast Fiscal Years 2012-2032
66
The price of energy is one of the critical drivers in the growth of consumer prices over the forecast period. In the high case the consumer price index (CPI) grows at an average rate of 1.6 percent per year (compared to growth of 2.0 percent annually in the baseline) as energy prices, wages, and import prices grow more slowly than in the baseline. In the low case forecast the opposite assumptions hold with energy prices, wages and import prices rising more rapidly compared to the baseline. As a result, in the low case, CPI grows an average of 3.4 percent annually over the forecast period as the growth accelerates to almost 4 percent per year by the end of the forecast.
95.3
119.7
191.4
94.7
113.6
138.2
89.398.2
114.1
0
50
100
150
200
250
2011 2016 2032
$ Pe
r Bar
rel
Fiscal Year
U.S. Refiners' Acquisition Cost
Pessimistic Baseline OptimisticSource: IHS Global Insight

FAA Aerospace Forecast Fiscal Years 2012-2032
67
The baseline passenger trip length forecast is predicated upon analyst judgment and recent trip length trends. Carrier behavior as a result of volatile fuel prices during 2008–2011 provided the basis for adjusting trip length in the alternative forecasts. During 2008–2011, high fuel costs made flying on some longer haul routes cost prohibitive (thus unprofitable), resulting in lower trip length compared to prior years. Since the FAA’s low case forecast is characterized by higher fuel prices relative to the baseline forecast, it is assumed that trip length rises at a slower pace than in the baseline forecast. In FAA’s high forecast, fuel prices are lower than projected in the baseline, pushing trip length up as lower fuel prices make flying longer-haul routes more affordable.
3.4
2.6
3.6
2.0 2.0 1.9
1.6 1.5 1.6
0.0
1.0
2.0
3.0
4.0
2011-2032 2011-2016 2016-2032
Annu
al P
erce
nt C
hang
e
Fiscal Year
Consumer Price Index - All Urban Consumers
Pessimistic Baseline OptimisticSource: IHS Global Insight
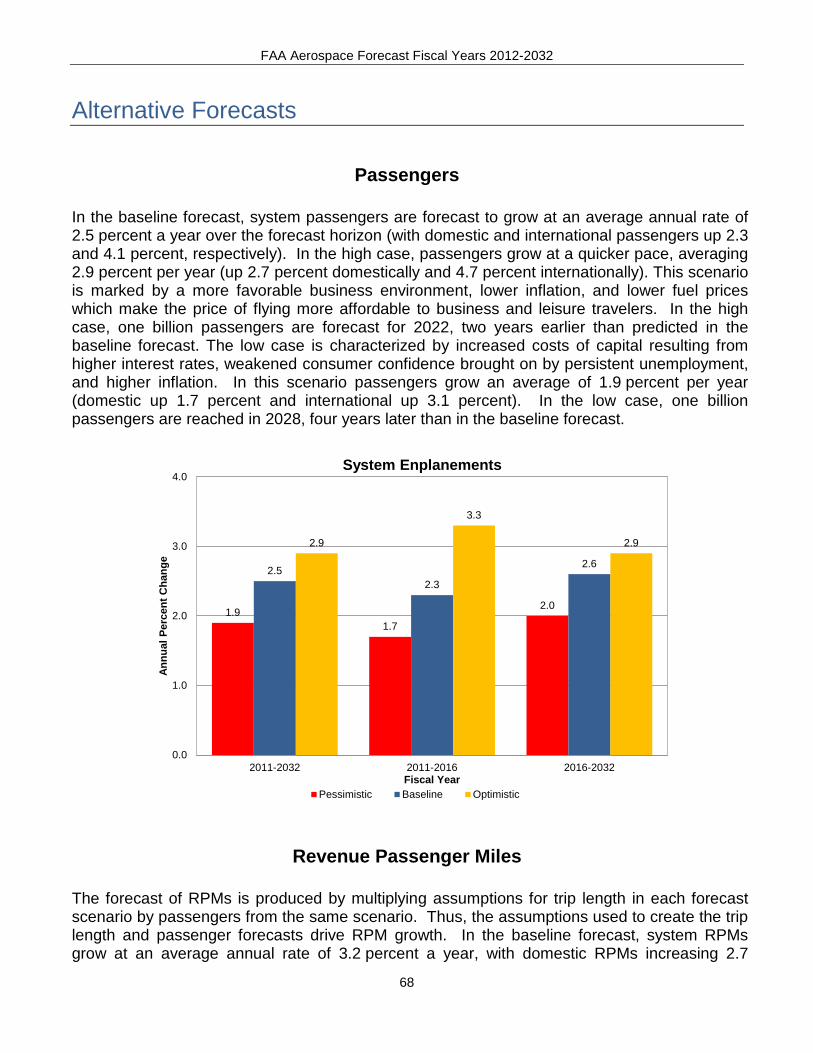
FAA Aerospace Forecast Fiscal Years 2012-2032
68
Alternative Forecasts
Passengers In the baseline forecast, system passengers are forecast to grow at an average annual rate of 2.5 percent a year over the forecast horizon (with domestic and international passengers up 2.3 and 4.1 percent, respectively). In the high case, passengers grow at a quicker pace, averaging 2.9 percent per year (up 2.7 percent domestically and 4.7 percent internationally). This scenario is marked by a more favorable business environment, lower inflation, and lower fuel prices which make the price of flying more affordable to business and leisure travelers. In the high case, one billion passengers are forecast for 2022, two years earlier than predicted in the baseline forecast. The low case is characterized by increased costs of capital resulting from higher interest rates, weakened consumer confidence brought on by persistent unemployment, and higher inflation. In this scenario passengers grow an average of 1.9 percent per year (domestic up 1.7 percent and international up 3.1 percent). In the low case, one billion passengers are reached in 2028, four years later than in the baseline forecast.
Revenue Passenger Miles The forecast of RPMs is produced by multiplying assumptions for trip length in each forecast scenario by passengers from the same scenario. Thus, the assumptions used to create the trip length and passenger forecasts drive RPM growth. In the baseline forecast, system RPMs grow at an average annual rate of 3.2 percent a year, with domestic RPMs increasing 2.7
1.91.7
2.0
2.52.3
2.6
2.9
3.3
2.9
0.0
1.0
2.0
3.0
4.0
2011-2032 2011-2016 2016-2032
Annu
al P
erce
nt C
hang
e
Fiscal Year
System Enplanements
Pessimistic Baseline Optimistic

FAA Aerospace Forecast Fiscal Years 2012-2032
69
percent annually and international RPMs growing 4.2 percent annually. In the high case, the faster growing economy coupled with lower energy prices drives RPMs higher than the baseline, with growth averaging 3.7 percent per year (domestic and international RPMs up 3.1 and 4.7 percent, respectively). In the low case, the combination of a slower growing economy and higher energy prices result in RPM growth averaging 2.4 percent annually with domestic markets growing 2.0 percent a year while international traffic grows 3.3 percent annually.
Available Seat Miles In the base case, system capacity is forecast to increase an average of 3.1 percent annually over the forecast horizon (with growth averaging 2.5 percent annually in domestic markets and 4.2 percent a year in international markets). In the high case, capacity grows at a faster clip than in the baseline forecast, averaging growth of 3.6 percent annually (up 3.0 percent domestically and up 4.7 percent internationally). Carriers increase capacity compared to the baseline forecast to accommodate increased travel demand brought about by a more favorable economic environment. In the low case, demand for air travel is lower than in the baseline, thus system capacity grows at a slower pace of 2.3 percent annually (domestic up 1.9 percent annually and international up 3.2 percent annually).
2.4
2.0
2.6
3.2
2.7
3.3
3.7 3.83.6
0.0
1.0
2.0
3.0
4.0
2011-2032 2011-2016 2016-2032
Annu
al P
erce
nt C
hang
e
Fiscal Year
System Revenue Passenger Miles
Pessimistic Baseline Optimistic
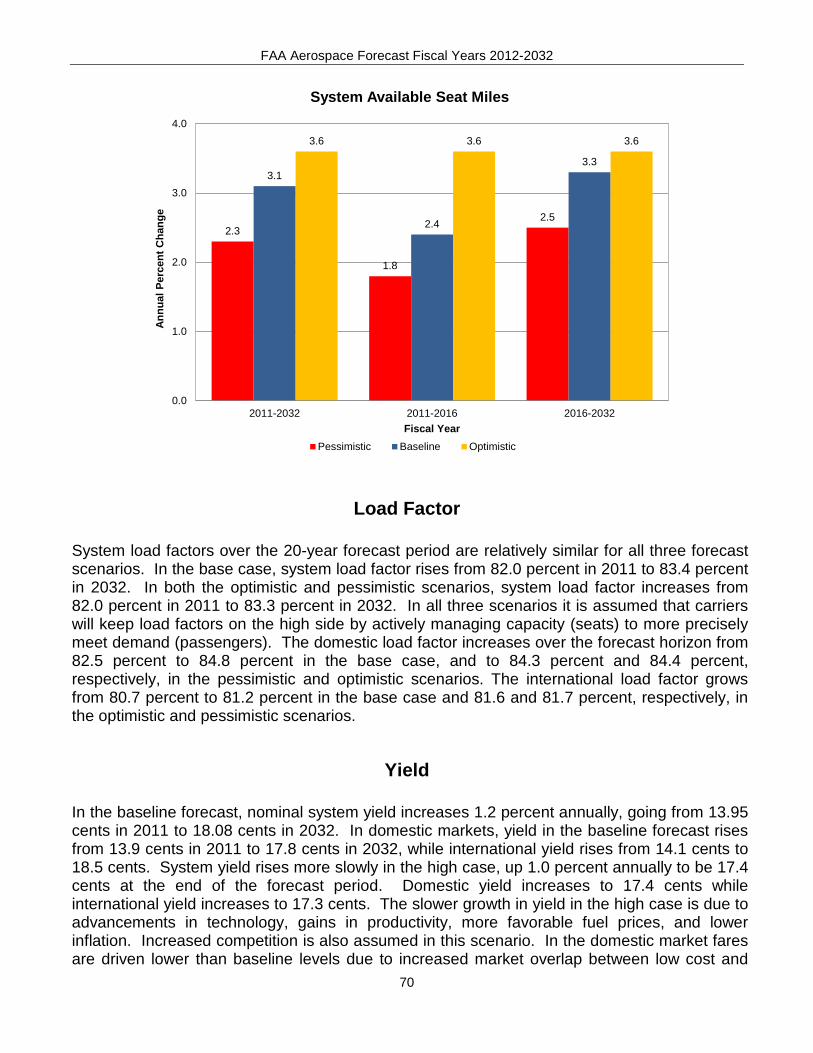
FAA Aerospace Forecast Fiscal Years 2012-2032
70
Load Factor System load factors over the 20-year forecast period are relatively similar for all three forecast scenarios. In the base case, system load factor rises from 82.0 percent in 2011 to 83.4 percent in 2032. In both the optimistic and pessimistic scenarios, system load factor increases from 82.0 percent in 2011 to 83.3 percent in 2032. In all three scenarios it is assumed that carriers will keep load factors on the high side by actively managing capacity (seats) to more precisely meet demand (passengers). The domestic load factor increases over the forecast horizon from 82.5 percent to 84.8 percent in the base case, and to 84.3 percent and 84.4 percent, respectively, in the pessimistic and optimistic scenarios. The international load factor grows from 80.7 percent to 81.2 percent in the base case and 81.6 and 81.7 percent, respectively, in the optimistic and pessimistic scenarios.
Yield In the baseline forecast, nominal system yield increases 1.2 percent annually, going from 13.95 cents in 2011 to 18.08 cents in 2032. In domestic markets, yield in the baseline forecast rises from 13.9 cents in 2011 to 17.8 cents in 2032, while international yield rises from 14.1 cents to 18.5 cents. System yield rises more slowly in the high case, up 1.0 percent annually to be 17.4 cents at the end of the forecast period. Domestic yield increases to 17.4 cents while international yield increases to 17.3 cents. The slower growth in yield in the high case is due to advancements in technology, gains in productivity, more favorable fuel prices, and lower inflation. Increased competition is also assumed in this scenario. In the domestic market fares are driven lower than baseline levels due to increased market overlap between low cost and
2.3
1.8
2.5
3.1
2.4
3.3
3.6 3.6 3.6
0.0
1.0
2.0
3.0
4.0
2011-2032 2011-2016 2016-2032
Annu
al P
erce
nt C
hang
e
Fiscal Year
System Available Seat Miles
Pessimistic Baseline Optimistic

FAA Aerospace Forecast Fiscal Years 2012-2032
71
legacy carriers. In the international market, increased competition from growing liberalization puts downward pressure on fares. In the low case, nominal yields rise more rapidly than in the baseline, growing an average of 2.9 percent annually, reaching 25.3 cents by 2032 (25.7 cents domestically and 24.4 cents internationally). This scenario reflects higher general inflation and higher energy prices than in the baseline, forcing carriers to increase fares in order to cover the higher costs of fuel, labor, and capital.
Passenger Trip Length Over the 21-year forecast horizon, baseline system passenger trip length is assumed to grow an average of 7.7 miles per year. In the high case, passenger trip length grows 8.3 miles per year, 0.6 miles per year faster than in the base case. In the high case, fuel prices are lower than in the baseline which allows carriers to operate longer-haul routes more profitably. Conversely, the low forecast is characterized by fuel prices that are higher than the baseline forecast. Higher fuel costs makes flying longer-haul routes less affordable to the carriers; hence passenger trip length trails the baseline forecast by 1.8 miles per year, growing an average of 5.9 miles per year.

FAA Aerospace Forecast Fiscal Years 2012-2032
72
Hist
oric
alFO
RECA
STPE
RCEN
T AV
ERAG
E AN
NUAL
GRO
WTH
Varia
ble
Scen
ario
2011
2012
2017
2022
2032
11-1
211
-17
12-2
211
-32
Econ
omic
Assu
mpt
ions
Rea
l Gro
ss D
omes
tic P
rodu
ctP
essi
mis
tic13
,246
13,3
8514
,857
16,2
8119
,993
1.0%
1.9%
2.0%
2.0%
(BIL
05$
)B
asel
ine
13,2
5613
,474
15,5
1117
,542
22,6
141.
6%2.
7%2.
7%2.
6%
O
ptim
istic
13,2
6213
,642
16,0
8118
,582
24,8
012.
9%3.
3%3.
1%3.
0%
Ref
iner
s Ac
quis
ition
Cos
t -P
essi
mis
tic95
.310
2.7
122.
913
2.3
191.
47.
8%4.
3%2.
6%3.
4%
Aver
age
- $ P
er B
arre
lB
asel
ine
94.7
100.
411
5.9
115.
413
8.2
6.0%
3.4%
1.4%
1.8%
O
ptim
istic
89.3
75.3
101.
510
6.2
114.
1-1
5.7%
2.1%
3.5%
1.2%
Con
sum
er P
rice
Inde
xP
essi
mis
tic2.
232.
282.
633.
104.
462.
2%2.
8%3.
1%3.
4%
All U
rban
, 198
2-84
= 1
.0B
asel
ine
2.23
2.27
2.51
2.76
3.35
1.9%
2.0%
2.0%
2.0%
Opt
imis
tic2.
222.
242.
442.
643.
090.
8%1.
6%1.
7%1.
6%
Civ
ilian
Une
mpl
oym
ent R
ate
Pes
sim
istic
9.3
9.8
7.0
6.0
5.6
0.5
-0.4
-0.4
-0.2
(%)
Bas
elin
e9.
29.
26.
55.
75.
40.
0-0
.5-0
.4-0
.2
Opt
imis
tic9.
28.
86.
25.
34.
9-0
.4-0
.5-0
.4-0
.2
Sou
rce:
IHS
Glo
bal I
nsig
ht, 3
0-Y
ear F
ocus
, Thi
rd Q
uarte
r 201
1
TAB
LE A
-1
FAA
FORE
CAS
T EC
ONO
MIC
ASS
UMPT
IONS
FISC
AL Y
EARS
201
1-20
32

FAA Aerospace Forecast Fiscal Years 2012-2032
73
Hist
oric
alFO
RECA
STPE
RCEN
T AV
ERAG
E AN
NUAL
GRO
WTH
Varia
ble
Scen
ario
2011
2012
2017
2022
2032
11-1
211
-17
12-2
211
-32
Syst
em
Avia
tion
Activ
ity
Avai
labl
e S
eat M
iles
Pes
sim
istic
993.
998
8.6
1,11
0.1
1,25
1.1
1,61
2.6
-0.5
%1.
9%2.
4%2.
3%
(BIL
)B
asel
ine
993.
999
4.3
1,15
5.6
1,35
6.2
1,88
5.5
0.0%
2.5%
3.2%
3.1%
Opt
imis
tic99
3.9
1,04
6.8
1,22
2.9
1,44
5.7
2,08
0.1
5.3%
3.5%
3.3%
3.6%
Rev
enue
Pas
seng
er M
iles
Pes
sim
istic
814.
681
2.8
919.
91,
040.
11,
343.
9-0
.2%
2.0%
2.5%
2.4%
(BIL
)B
asel
ine
814.
681
8.6
960.
41,
130.
21,
573.
40.
5%2.
8%3.
3%3.
2%
Opt
imis
tic81
4.6
861.
11,
013.
41,
201.
71,
733.
05.
7%3.
7%3.
4%3.
7%
Enp
lane
men
tsP
essi
mis
tic73
0.7
726.
881
1.2
894.
01,
085.
7-0
.5%
1.8%
2.1%
1.9%
(MIL
)B
asel
ine
730.
773
1.8
841.
695
6.3
1,23
3.0
0.2%
2.4%
2.7%
2.5%
Opt
imis
tic73
0.7
765.
588
1.5
1,01
0.7
1,34
5.0
4.8%
3.2%
2.8%
2.9%
Psg
r Car
rier M
iles
Flow
nP
essi
mis
tic7,
047.
56,
966.
17,
720.
38,
581.
510
,758
.8-1
.2%
1.5%
2.1%
2.0%
(MIL
)B
asel
ine
7,04
7.5
7,01
4.3
8,01
3.0
9,24
6.5
12,4
69.3
-0.5
%2.
2%2.
8%2.
8%
O
ptim
istic
7,04
7.5
7,40
0.5
8,47
7.8
9,85
4.0
13,7
58.0
5.0%
3.1%
2.9%
3.2%
Psg
r Car
rier D
epar
ture
sP
essi
mis
tic9,
505.
59,
367.
810
,221
.010
,910
.012
,505
.9-1
.4%
1.2%
1.5%
1.3%
(000
s)B
asel
ine
9,50
5.5
9,42
5.6
10,4
91.4
11,4
96.3
13,8
67.8
-0.8
%1.
7%2.
0%1.
8%
Opt
imis
tic9,
505.
59,
725.
611
,001
.412
,199
.115
,089
.42.
3%2.
5%2.
3%2.
2%
Nom
inal
Pas
seng
er Y
ield
Pes
sim
istic
13.9
514
.58
17.1
519
.02
25.2
54.
5%3.
5%2.
7%2.
9%
(cen
ts)
Bas
elin
e13
.95
14.5
015
.96
16.6
218
.08
3.9%
2.3%
1.4%
1.2%
Opt
imis
tic13
.95
14.5
816
.21
16.8
317
.37
4.5%
2.5%
1.4%
1.0%
TAB
LE A
-2
FAA
FORE
CAS
T O
F AV
IATI
ON
ACTI
VITY
FISC
AL Y
EARS
201
1-20
32

FAA Aerospace Forecast Fiscal Years 2012-2032
74
Hist
oric
alFO
RECA
STPE
RCEN
T AV
ERAG
E AN
NUAL
GRO
WTH
Varia
ble
Scen
ario
2011
2012
2017
2022
2032
11-1
211
-17
12-2
211
-32
Dom
estic
Avia
tion
Activ
ity
Avai
labl
e S
eat M
iles
Pes
sim
istic
693.
968
6.9
755.
083
4.8
1,02
8.2
-1.0
%1.
4%2.
0%1.
9%
(BIL
)B
asel
ine
693.
968
8.4
778.
288
7.8
1,17
1.4
-0.8
%1.
9%2.
6%2.
5%
Opt
imis
tic69
3.9
737.
982
5.7
946.
81,
294.
56.
3%2.
9%2.
5%3.
0%
Rev
enue
Pas
seng
er M
iles
Pes
sim
istic
572.
556
8.9
631.
870
1.6
866.
6-0
.6%
1.7%
2.1%
2.0%
(BIL
)B
asel
ine
572.
557
1.3
654.
975
0.6
993.
6-0
.2%
2.3%
2.8%
2.7%
Opt
imis
tic57
2.5
611.
369
1.2
796.
11,
092.
06.
8%3.
2%2.
7%3.
1%
Enp
lane
men
tsP
essi
mis
tic64
9.9
646.
271
7.8
785.
393
3.1
-0.6
%1.
7%2.
0%1.
7%
(MIL
)B
asel
ine
649.
964
9.4
741.
483
2.6
1,04
4.1
-0.1
%2.
2%2.
5%2.
3%
Opt
imis
tic64
9.9
682.
477
5.9
878.
31,
134.
75.
0%3.
0%2.
6%2.
7%
Psg
r Car
rier M
iles
Flow
nP
essi
mis
tic5,
661.
85,
582.
76,
119.
16,
727.
48,
205.
0-1
.4%
1.3%
1.9%
1.8%
(MIL
)B
asel
ine
5,66
1.8
5,60
4.0
6,29
3.8
7,13
3.9
9,29
7.2
-1.0
%1.
8%2.
4%2.
4%
O
ptim
istic
5,66
1.8
5,97
8.8
6,67
8.4
7,61
2.6
10,2
70.3
5.6%
2.8%
2.4%
2.9%
Psg
r Car
rier D
epar
ture
sP
essi
mis
tic8,
915.
38,
799.
79,
584.
210
,190
.711
,541
.9-1
.3%
1.2%
1.5%
1.2%
(000
s)B
asel
ine
8,91
5.3
8,82
8.4
9,78
5.1
10,6
48.1
12,6
23.9
-1.0
%1.
6%1.
9%1.
7%
Opt
imis
tic8,
915.
39,
136.
510
,280
.411
,319
.713
,747
.02.
5%2.
4%2.
2%2.
1%
Nom
inal
Pas
seng
er Y
ield
Pes
sim
istic
13.8
814
.42
16.7
919
.15
25.7
03.
9%3.
2%2.
9%3.
0%
(cen
ts)
Bas
elin
e13
.88
14.3
115
.90
16.5
317
.83
3.1%
2.3%
1.5%
1.2%
Opt
imis
tic13
.88
14.4
316
.39
17.1
017
.41
4.0%
2.8%
1.7%
1.1%
TAB
LE A
-3
FAA
FORE
CAS
T O
F D
OM
ESTI
C A
VIAT
ION
ACTI
VITY
FISC
AL Y
EARS
201
1-20
32

FAA Aerospace Forecast Fiscal Years 2012-2032
75
Hist
oric
alFO
RECA
STPE
RCEN
T AV
ERAG
E AN
NUAL
GRO
WTH
Varia
ble
Scen
ario
2011
2012
2017
2022
2032
11-1
211
-17
12-2
211
-32
Inte
rnat
iona
lAv
iatio
n Ac
tivity
Avai
labl
e S
eat M
iles
Pes
sim
istic
300.
030
1.7
355.
041
6.3
584.
40.
6%2.
8%3.
3%3.
2%
(BIL
)B
asel
ine
300.
030
5.9
377.
446
8.4
714.
12.
0%3.
9%4.
4%4.
2%
Opt
imis
tic30
0.0
308.
939
7.2
498.
978
5.6
3.0%
4.8%
4.9%
4.7%
Rev
enue
Pas
seng
er M
iles
Pes
sim
istic
242.
124
4.0
288.
033
8.6
477.
30.
8%2.
9%3.
3%3.
3%
(BIL
)B
asel
ine
242.
124
7.4
305.
537
9.6
579.
82.
2%4.
0%4.
4%4.
2%
Opt
imis
tic24
2.1
249.
832
2.2
405.
564
1.0
3.2%
4.9%
5.0%
4.7%
Enp
lane
men
tsP
essi
mis
tic80
.880
.693
.410
8.7
152.
6-0
.3%
2.5%
3.0%
3.1%
(MIL
)B
asel
ine
80.8
82.3
100.
212
3.7
188.
81.
9%3.
7%4.
2%4.
1%
Opt
imis
tic80
.883
.110
5.6
132.
421
0.3
2.9%
4.6%
4.8%
4.7%
Psg
r Car
rier M
iles
Flow
nP
essi
mis
tic1,
385.
71,
383.
41,
601.
21,
854.
12,
553.
8-0
.2%
2.4%
3.0%
3.0%
(MIL
)B
asel
ine
1,38
5.7
1,41
0.2
1,71
9.1
2,11
2.6
3,17
2.1
1.8%
3.7%
4.1%
4.0%
O
ptim
istic
1,38
5.7
1,42
1.7
1,79
9.4
2,24
1.4
3,48
7.7
2.6%
4.5%
4.7%
4.5%
Psg
r Car
rier D
epar
ture
sP
essi
mis
tic59
0.2
568.
163
6.8
719.
396
4.0
-3.7
%1.
3%2.
4%2.
4%
(000
s)B
asel
ine
590.
259
7.2
706.
384
8.2
1,24
3.9
1.2%
3.0%
3.6%
3.6%
Opt
imis
tic59
0.2
589.
172
1.0
879.
41,
342.
4-0
.2%
3.4%
4.1%
4.0%
Nom
inal
Pas
seng
er Y
ield
Pes
sim
istic
14.1
214
.94
16.6
818
.75
24.4
35.
8%2.
8%2.
3%2.
6%
(cen
ts)
Bas
elin
e14
.12
14.9
516
.09
16.8
018
.50
5.9%
2.2%
1.2%
1.3%
Opt
imis
tic14
.12
14.9
515
.83
16.3
117
.32
5.9%
1.9%
0.9%
1.0%
*Inc
lude
s mai
nlin
e an
d re
gion
al ca
rrie
rs.
TAB
LE A
-4
FAA
FORE
CAS
T O
F IN
TERN
ATIO
NAL
AVIA
TIO
N AC
TIVI
TY*
FISC
AL Y
EARS
201
1-20
32

FAA Aerospace Forecast Fiscal Years 2012-2032
76
APPENDIX B: FAA FORECAST ACCURACY Forecasts, by their nature, have a degree of uncertainty incorporated in them. They involve not only statistical analyses and various scientific methods, but also judgment and reliance on industry knowledge and the forecaster’s experience to incorporate industry trends not yet reflected in recent results. The FAA’s annual Aerospace Forecast is no exception. Given the volatile nature of the U.S. airline industry, it is not surprising that each year’s forecast would contain a certain degree of forecast variance. Therefore, FAA forecasters have tried to build forecast models that give a consistent and predictable pattern of results. Analysts relying on the forecasts produced by the models would then be able to adjust for the predictable variance from actual results. The table below presents an analysis of the variance from historical results for five key forecast metrics during the FY 2006-2011 forecast period. Although this brief period has experienced industry upheaval, the FAA’s forecast methodology remained consistent during this time. For this reason, inclusion of prior periods in an analysis of forecast variance might lead to inconclusive or inaccurate implications about the accuracy of FAA’s current forecast methodology. The table below contains the mean absolute percent errors for the projected values versus the actual results for U.S. carriers’ domestic operations. Each metric has five values showing the relative forecast variance by the number of years in advance the preparation of the forecast took place. For example, the “3 Years” column for ASMs shows that the mean absolute percent error was 11.6 percent for ASM forecasts prepared 3 years in advance. For the period under examination, preparation of the forecasts for FY 2006 through FY 2011 occurred in FY 2005, FY 2006, FY 2007, FY 2008, FY 2009, and FY 2010, respectively.16
16 It should be noted that the first forecasted year for each respective fiscal year is that very same year. Therefore, FY 2003’s first forecasted year is FY 2003, and the third forecasted year is FY 2005.

FAA Aerospace Forecast Fiscal Years 2012-2032
77
U.S. AIR CARRIERS DOMESTIC SCHEDULED PASSENGER ACTIVITY
FORECAST EVALUATION
Mean Absolute Percent Error (Combined FY 2006 - FY 2011)
Forecast (Forecast Variance from Actual) Variable Forecast Performed Years Prior to Actual
1 Year 2 Years 3 Years 4 Years 5 Years
ASMs 0.7% 5.6% 11.6% 16.1% 19.9% RPMs 0.9% 3.7% 7.4% 11.5% 12.2% Passenger Enplanements 0.7% 3.8% 8.1% 11.3% 12.8% Mainline Yield 4.2% 5.4% 5.9% 4.8% 8.0% IFR Aircraft Handled* 2.9% 7.8% 12.4% 15.9% 17.5% *Total - scheduled and nonscheduled commercial plus noncommercial
Presenting forecast variances from actual data in such a manner simplifies a review of longer-term trends. Typically, one would expect the variances to decrease as the forecast year is closer to the year the forecast is prepared. Presenting forecast variances in this way allows an examination of changes in the relative variances by time horizon, signaling when dramatic shifts in accuracy occur. Examination of the forecast variances reveals several items. First, all the metrics examined show declining variances as the forecast time horizon decreases, as expected. The largest variances were found in the forecasts of ASMs the variable most directly affected by exogenous events. Second, the relative divergence in forecast variances between RPMs and ASMs suggests errors in forecasting load factors. Third, the ASM forecast variance being larger than the RPM forecast variance indicates a consistent underestimation of load factors, one of the critical elements in converting passenger demand into aviation activity. All other things being equal, large variances in forecasts of load factor will lead to large variances in the long-term forecasts of aviation activity, as can been seen in the variances of the IFR aircraft handled forecasts. Furthermore, ASMs and aircraft handled are becoming increasingly difficult to forecast beyond a relatively short time horizon, as carriers often react to changing market conditions. The relatively large variances in these forecasts suggest that carriers have been permanently removing capacity by reducing flights and by changing the mix of aircraft to satisfy demand. In the short term, such capacity reductions can be identified by using advance schedule information. However, the FAA’s longer-term forecasts rely on anticipated aircraft deliveries and retirements as well as historic relationships between economic activity and capacity deployed. Given the volatile nature of many of the factors that may influence longer term ASM and aircraft handled forecasts, a simpler approach to projecting ASMs, such as RPMs divided by load factors, may improve the long run accuracy of the ASM and aircraft handled

FAA Aerospace Forecast Fiscal Years 2012-2032
78
forecasts. It should also be noted that the low variance of the mainline passenger yield relative to the other metrics is due in large part to the inclusion of FY 2011 in the sample period.

FAA Aerospace Forecast Fiscal Years 2012-2032
79
APPENDIX C: ACKNOWLEDGEMENTS This document was prepared by the Forecasts and Performance Analysis Division (APO-100), Office of Aviation Policy and Plans, under the direction of Mr. Roger D. Schaufele, Jr. The following individuals were responsible for individual subject areas: Economic Environment: Roger D. Schaufele, Jr. (202) 267-3306 Commercial Air Carriers: – Passengers Roger D. Schaufele, Jr. (202) 267-3306
Dipasis Bhadra (202) 267-9027 Katherine Lizotte (202) 267-3302
– Cargo Nick Miller (202) 267-8031 General Aviation: – Forecasts Anna Barlett (202) 267-4070 – Survey Data Anna Barlett (202) 267-4070 FAA Workload Measures: – Forecasts Roger D. Schaufele, Jr. (202) 267-3306 – Data Forecasts and Performance Analysis Division, APO-100 Unmanned Aircraft Systems: Michael Lukacs (202) 267-9641 Commercial Space: John Sloan, Commercial Space Transportation, AST-100 (202) 267-7989 Text and Table Preparation: Forecasts and Performance Analysis Division Staff Forecast Conference Planner: Linda Baranovics (202) 267-7924 APO Websites: – Forecasts/Statistical Publications http://www.faa.gov/data_statistics – APO Data System http://aspm.faa.gov Email: – APO staff first name.last [email protected]

FAA Aerospace Forecast Fiscal Years 2012-2032
80
This page has been intentionally left blank.

FAA Aerospace Forecast Fiscal Years 2012-2032
81
APPENDIX D: FORECAST TABLES

FAA Aerospace Forecast Fiscal Years 2012-2032
82
TAB
LE 1
EC
ON
OM
ICFI
SC
AL
YE
AR
201
1FI
SC
AL
YE
AR
201
2FI
SC
AL
YE
AR
201
3V
AR
IAB
LE1S
T. Q
TR.
2ND
. QTR
.3R
D Q
TR.
4TH
. QTR
.1S
T. Q
TR.
2ND
. QTR
.3R
D Q
TR.
4TH
. QTR
.1S
T. Q
TR.
2ND
. QTR
.3R
D Q
TR.
4TH
. QTR
.
Real
GDP
(Bill
ions
of 2
005$
)13
,216
.113
,227
.913
,270
.113
,309
.113
,357
.413
,438
.413
,519
.013
,580
.613
,642
.913
,690
.613
,791
.113
,887
.4S
easo
nally
Adj
uste
d A
nnua
l Rat
e0.
4%1.
3%1.
2%1.
5%2.
4%2.
4%1.
8%1.
8%1.
4%3.
0%2.
8%
Refin
ers'
Acq
uisi
tion
Cost
- Av
erag
e
(D
olla
rs)
81.5
293
.85
107.
7895
.54
96.8
199
.63
101.
5810
3.52
105.
4710
6.04
107.
6810
9.48
Sea
sona
lly A
djus
ted
Ann
ual R
ate
75.7
%73
.9%
-38.
2%5.
4%12
.2%
8.1%
7.9%
7.7%
2.2%
6.3%
6.9%
Cons
umer
Pri
ce In
dex
(198
2-84
equ
als
100)
219.
522
2.3
224.
522
5.7
226.
122
6.9
227.
422
8.6
229.
623
0.7
231.
823
3.1
Sea
sona
lly A
djus
ted
Ann
ual R
ate
5.2%
4.1%
2.0%
0.8%
1.4%
0.9%
2.1%
1.8%
1.9%
2.0%
2.1%
Sou
rce:
IHS
Glo
bal I
nsig
ht, 3
0-Y
ear F
ocus
, Thi
rd Q
uarte
r 201
1
U.S.
SHO
RT-
TER
M E
CO
NOM
IC F
OR
ECA
STS

FAA Aerospace Forecast Fiscal Years 2012-2032
83
TAB
LE 2
GR
OS
SC
ON
SU
ME
R P
RIC
ER
EFI
NE
RS
' AC
QU
ISIT
ION
CO
ST
FIS
CA
LD
OM
ES
TIC
PR
OD
UC
TIN
DE
XA
VE
RA
GE
YE
AR
(Bill
ions
200
5$)
(198
2-84
=100
)(D
olla
rs p
er b
arre
l)H
isto
rical
2000
11,1
36.4
170.
7426
.70
2005
12,5
35.9
193.
4847
.20
2006
12,8
82.8
200.
5859
.94
2007
13,1
34.5
205.
3160
.62
2008
13,2
72.6
214.
4310
1.52
2009
12,7
20.6
213.
7754
.68
2010
12,9
87.3
217.
4374
.61
2011
E13
,255
.822
2.98
94.6
7
Fore
cast
2012
13,4
73.8
227.
2410
0.38
2013
13,7
53.0
231.
2910
7.17
2014
14,1
58.7
236.
0911
0.22
2015
14,6
49.2
240.
9210
9.83
2016
15,0
99.7
246.
2211
3.58
2017
15,5
11.1
251.
3611
5.92
2018
15,8
99.2
256.
3911
7.29
2019
16,3
02.1
261.
2711
7.52
2020
16,7
23.4
265.
8911
5.34
2021
17,1
27.0
270.
7311
5.34
2022
17,5
41.9
275.
7311
5.44
2023
18,0
01.3
280.
6711
4.56
2024
18,4
76.7
285.
8911
6.34
2025
18,9
61.5
291.
3411
8.43
2026
19,4
51.4
297.
0112
0.60
2027
19,9
46.5
302.
8112
2.90
2028
20,4
44.9
308.
7812
6.04
2029
20,9
55.5
315.
0012
9.21
2030
21,4
98.7
321.
4113
2.39
2031
22,0
56.2
328.
0413
5.27
2032
22,6
14.2
334.
8913
8.18
Avg
Ann
ual G
row
th20
00-1
11.
6%2.
5%12
.2%
2011
-12
1.6%
1.9%
6.0%
2011
-21
2.6%
2.0%
2.0%
2011
-32
2.6%
2.0%
1.8%
Sou
rce:
IHS
Glo
bal I
nsig
ht, 3
0-Y
ear F
ocus
, Thi
rd Q
uarte
r 201
1
U.S.
LO
NG-T
ERM
EC
ONO
MIC
FO
REC
AST
S

FAA Aerospace Forecast Fiscal Years 2012-2032
84
TAB
LE 3
GR
OS
S D
OM
ES
TIC
PR
OD
UC
T(In
Bill
ions
of 2
005
U.S
. Dol
lars
)JA
PA
N/P
AC
IFIC
EU
RO
PE
/B
AS
IN/C
HIN
A/O
THE
RC
ALE
ND
AR
AFR
ICA
/LA
TIN
AM
ER
ICA
/A
SIA
/AU
STR
ALI
A/
YE
AR
CA
NA
DA
MID
DLE
EA
ST
ME
XIC
ON
. ZE
ALA
ND
WO
RLD
His
toric
al*
2000
1,00
0.2
16,0
58.1
2,48
3.8
9,04
6.4
39,8
05.0
2005
1,13
4.1
18,1
44.3
2,81
5.0
11,0
54.2
45,7
70.6
2006
1,16
6.1
18,9
01.6
2,96
8.6
11,6
79.9
47,6
74.6
2007
1,19
1.8
19,6
35.9
3,12
6.8
12,4
37.7
49,5
98.5
2008
1,20
0.0
19,8
72.2
3,24
6.6
12,8
13.9
50,2
94.6
2009
1,16
6.7
19,1
62.5
3,17
8.1
12,9
32.5
49,1
43.0
2010
1,20
4.2
19,6
49.1
3,35
6.7
13,8
16.2
51,1
14.2
2011
E1,
230.
420
,087
.73,
491.
314
,397
.352
,514
.8
Fore
cast
2012
1,25
3.7
20,4
10.2
3,60
9.3
15,1
18.8
53,8
83.5
2013
1,28
6.3
20,9
10.5
3,76
7.3
15,9
58.2
55,7
32.4
2014
1,32
2.4
21,4
96.9
3,94
9.4
16,8
37.6
57,9
04.5
2015
1,35
8.8
22,1
08.1
4,11
9.3
17,7
23.9
60,0
88.9
2016
1,39
4.4
22,7
02.3
4,30
2.5
18,6
27.9
62,2
27.3
2017
1,42
9.5
23,2
87.9
4,48
4.5
19,5
34.9
64,3
22.8
2018
1,46
5.8
23,8
70.6
4,67
3.8
20,4
65.1
66,4
26.0
2019
1,50
0.9
24,4
63.6
4,87
1.9
21,4
25.0
68,6
06.2
2020
1,53
4.4
25,0
71.4
5,07
5.2
22,4
16.9
70,8
67.5
2021
1,56
9.6
25,6
87.0
5,28
6.5
23,4
40.5
73,1
55.1
2022
1,60
5.5
26,3
02.8
5,50
3.0
24,4
80.8
75,4
93.3
2023
1,64
2.6
26,9
28.3
5,72
6.4
25,5
32.0
77,8
91.4
2024
1,67
9.6
27,5
58.2
5,95
7.9
26,6
08.1
80,3
43.2
2025
1,71
7.5
28,1
96.9
6,19
9.2
27,7
31.5
82,8
68.4
2026
1,75
5.9
28,8
43.1
6,45
0.2
28,8
85.2
85,4
48.0
2027
1,79
5.1
29,5
02.8
6,70
9.1
30,0
82.7
88,0
97.7
2028
1,83
5.6
30,1
71.8
6,97
6.2
31,3
09.8
90,8
00.2
2029
1,87
7.2
30,8
48.2
7,25
4.8
32,5
76.2
93,5
77.5
2030
1,92
0.1
31,5
39.1
7,54
3.3
33,8
74.3
96,4
47.7
2031
1,96
4.8
32,2
45.4
7,84
1.9
35,2
09.2
99,3
88.4
2032
2,01
1.8
32,9
61.4
8,15
0.8
36,5
70.0
102,
375.
5
Avg
Ann
ual G
row
th20
00-1
11.
9%2.
1%3.
1%4.
3%2.
6%20
11-1
21.
9%1.
6%3.
4%5.
0%2.
6%20
11-2
12.
5%2.
5%4.
2%5.
0%3.
4%20
11-3
22.
4%2.
4%4.
1%4.
5%3.
2%*S
ourc
e: IH
S G
loba
l Ins
ight
web
site
, GD
P C
ompo
nent
s Ta
bles
(Int
erim
For
ecas
t, M
onth
ly),
Rel
ease
dat
e 14
OC
T 20
11.
INTE
RNA
TIO
NAL
GD
P FO
REC
AST
S B
Y TR
AVE
L R
EGIO
N

FAA Aerospace Forecast Fiscal Years 2012-2032
85
TAB
LE 4
GR
OS
S D
OM
ES
TIC
PR
OD
UC
T(In
Bill
ions
of 2
005
U.S
. Dol
lars
)N
OR
THC
ALE
ND
AR
AM
ER
ICA
UN
ITE
DY
EA
R(N
AFT
A)
EU
RO
ZON
EK
ING
DO
MJA
PA
NC
HIN
AH
isto
rical
2000
13,0
03.4
9,38
2.9
1,97
8.6
4,26
8.6
1,41
7.2
2005
14,6
05.5
10,1
06.0
2,27
9.7
4,55
3.8
2,25
7.1
2006
15,0
16.6
10,4
32.1
2,33
9.1
4,64
6.5
2,54
3.7
2007
15,3
19.2
10,7
43.3
2,42
0.2
4,75
3.5
2,90
4.9
2008
15,2
94.5
10,7
72.8
2,39
3.5
4,69
8.0
3,18
3.7
2009
14,7
45.3
10,3
19.4
2,28
8.8
4,40
1.6
3,47
7.0
2010
15,2
14.8
10,5
00.1
2,32
9.2
4,57
8.4
3,83
6.0
2011
E15
,496
.910
,672
.32,
349.
74,
551.
24,
192.
2
Fore
cast
2012
15,7
28.0
10,7
07.9
2,37
4.2
4,67
2.4
4,53
2.9
2013
16,1
14.3
10,8
60.5
2,42
4.0
4,80
2.4
4,92
1.5
2014
16,6
85.0
11,0
65.2
2,48
4.5
4,90
1.3
5,34
1.8
2015
17,2
43.2
11,2
88.3
2,55
1.5
4,97
7.2
5,77
9.7
2016
17,7
43.9
11,4
95.3
2,61
5.8
5,03
7.0
6,23
5.7
2017
18,2
07.4
11,6
96.0
2,67
7.8
5,07
5.5
6,70
4.3
2018
18,6
52.4
11,8
93.8
2,73
9.4
5,10
3.0
7,19
5.6
2019
19,1
27.5
12,0
94.6
2,80
1.3
5,12
9.5
7,70
7.4
2020
19,6
32.2
12,2
95.0
2,86
5.8
5,15
4.3
8,23
8.9
2021
20,1
18.5
12,4
97.7
2,93
0.5
5,17
4.7
8,80
0.6
2022
20,6
33.2
12,6
99.9
2,99
3.8
5,19
3.4
9,37
4.0
2023
21,1
80.9
12,9
03.0
3,05
7.9
5,21
1.6
9,95
1.5
2024
21,7
46.9
13,1
09.3
3,12
1.8
5,22
9.9
10,5
36.7
2025
22,3
22.5
13,3
15.8
3,18
6.1
5,24
7.7
11,1
52.6
2026
22,9
06.7
13,5
25.5
3,25
2.1
5,26
5.4
11,7
87.6
2027
23,4
96.6
13,7
38.8
3,32
1.3
5,28
3.9
12,4
48.7
2028
24,0
92.4
13,9
53.1
3,39
1.4
5,30
2.8
13,1
24.5
2029
24,7
08.6
14,1
66.4
3,46
1.3
5,32
0.4
13,8
23.6
2030
25,3
62.8
14,3
81.7
3,53
4.0
5,33
6.9
14,5
37.9
2031
26,0
27.1
14,6
02.5
3,60
8.5
5,35
3.5
15,2
76.3
2032
26,6
92.8
14,8
24.9
3,68
4.3
5,36
9.8
16,0
24.3
Avg
Ann
ual G
row
th20
00-1
11.
6%1.
2%1.
6%0.
6%10
.4%
2011
-12
1.5%
0.3%
1.0%
2.7%
8.1%
2011
-21
2.6%
1.6%
2.2%
1.3%
7.7%
2011
-32
2.6%
1.6%
2.2%
0.8%
6.6%
Sou
rce:
IH
S G
loba
l Ins
ight
INTE
RNA
TIO
NAL
GD
P FO
REC
AST
S –
SELE
CTE
D A
REA
S/C
OUN
TRIE
S

FAA Aerospace Forecast Fiscal Years 2012-2032
86
FIS
CA
LR
EV
EN
UE
PA
SS
EN
GE
R E
NP
LAN
EM
EN
TS (M
illio
ns)
RE
VE
NU
E P
AS
SE
NG
ER
MIL
ES
(Bill
ions
)Y
EA
RD
OM
ES
TIC
INTE
RN
ATI
ON
AL
SY
STE
M D
OM
ES
TIC
INTE
RN
ATI
ON
AL
SY
STE
MH
isto
rical
*20
0064
1.2
56.4
697.
651
2.8
181.
869
4.6
2005
669.
567
.473
7.0
573.
219
7.2
770.
420
0666
8.4
71.6
740.
058
2.4
208.
579
0.9
2007
690.
175
.376
5.3
600.
522
1.2
821.
720
0868
0.7
78.3
759.
159
4.6
233.
882
8.5
2009
630.
873
.670
4.4
548.
622
1.3
769.
920
1063
5.2
77.4
712.
655
5.8
230.
978
6.7
2011
E64
9.9
80.8
730.
757
2.5
242.
181
4.6
Fore
cast
2012
649.
482
.373
1.8
571.
324
7.4
818.
620
1366
0.8
84.8
745.
658
3.5
256.
183
9.7
2014
673.
788
.476
2.2
594.
526
7.6
862.
120
1570
3.6
92.1
795.
762
0.2
279.
189
9.3
2016
723.
996
.182
0.0
638.
429
2.1
930.
5
2017
741.
410
0.2
841.
665
4.9
305.
596
0.4
2018
759.
110
4.4
863.
567
3.4
319.
199
2.5
2019
777.
110
8.9
886.
169
1.8
333.
31,
025.
020
2079
6.4
113.
791
0.1
711.
534
8.1
1,05
9.7
2021
814.
311
8.5
932.
973
0.8
363.
41,
094.
3
2022
832.
612
3.7
956.
375
0.6
379.
61,
130.
220
2385
2.8
129.
298
1.9
772.
339
6.4
1,16
8.6
2024
872.
913
5.0
1,00
7.9
794.
141
4.1
1,20
8.2
2025
892.
914
1.0
1,03
3.9
816.
043
2.6
1,24
8.6
2026
913.
714
7.2
1,06
0.9
839.
745
1.9
1,29
1.6
2027
934.
915
3.6
1,08
8.5
864.
347
1.5
1,33
5.8
2028
955.
916
0.1
1,11
6.0
888.
949
1.7
1,38
0.6
2029
976.
916
6.9
1,14
3.8
913.
851
2.5
1,42
6.4
2030
998.
817
4.0
1,17
2.9
939.
753
4.4
1,47
4.1
2031
1,02
1.5
181.
31,
202.
896
6.5
556.
71,
523.
220
321,
044.
118
8.8
1,23
3.0
993.
657
9.8
1,57
3.4
Avg
Ann
ual G
row
th20
00-1
10.
1%3.
3%0.
4%1.
0%2.
6%1.
5%20
11-1
2-0
.1%
1.9%
0.2%
-0.2
%2.
2%0.
5%20
11-2
12.
3%3.
9%2.
5%2.
5%4.
1%3.
0%20
11-3
22.
3%4.
1%2.
5%2.
7%4.
2%3.
2%*S
ourc
e: F
orm
s 41
and
298
-C, U
.S. D
epar
tmen
t of T
rans
porta
tion.
1 Sum
of U
.S. M
ainl
ine
and
Reg
iona
l Air
Car
riers
.
TAB
LE 5
U.S.
CO
MM
ERC
IAL
AIR
CA
RR
IER
S1
TOTA
L SC
HED
ULED
U.S
. PA
SSEN
GER
TR
AFF
IC

FAA Aerospace Forecast Fiscal Years 2012-2032
87
DO
ME
STI
CIN
TER
NA
TIO
NA
LS
YS
TEM
FIS
CA
LA
SM
sR
PM
s%
LO
AD
AS
Ms
RP
Ms
% L
OA
DA
SM
sR
PM
s%
LO
AD
YE
AR
(BIL
)(B
IL)
FAC
TOR
(BIL
)(B
IL)
FAC
TOR
(BIL
)(B
IL)
FAC
TOR
His
toric
al*
2000
726.
651
2.8
70.6
239.
318
1.8
76.0
965.
969
4.6
71.9
2005
755.
257
3.2
75.9
248.
519
7.2
79.4
1,00
3.6
770.
476
.820
0674
0.2
582.
478
.726
1.3
208.
579
.81,
001.
579
0.9
79.0
2007
752.
560
0.5
79.8
275.
922
1.2
80.2
1,02
8.4
821.
779
.920
0874
9.6
594.
679
.329
2.7
233.
879
.91,
042.
482
8.5
79.5
2009
682.
554
8.6
80.4
283.
322
1.3
78.1
965.
876
9.9
79.7
2010
680.
055
5.8
81.7
281.
223
0.9
82.1
961.
378
6.7
81.8
2011
E69
3.9
572.
582
.530
0.0
242.
180
.799
3.9
814.
682
.0
Fore
cast
2012
688.
457
1.3
83.0
305.
924
7.4
80.8
994.
381
8.6
82.3
2013
698.
758
3.5
83.5
316.
525
6.1
80.9
1,01
5.1
839.
782
.720
1471
0.0
594.
583
.733
0.8
267.
680
.91,
040.
886
2.1
82.8
2015
739.
262
0.2
83.9
344.
927
9.1
80.9
1,08
4.1
899.
383
.020
1675
9.6
638.
484
.036
0.9
292.
180
.91,
120.
593
0.5
83.0
2017
778.
265
4.9
84.2
377.
430
5.5
81.0
1,15
5.6
960.
483
.120
1879
9.2
673.
484
.339
4.0
319.
181
.01,
193.
299
2.5
83.2
2019
820.
169
1.8
84.3
411.
433
3.3
81.0
1,23
1.6
1,02
5.0
83.2
2020
842.
871
1.5
84.4
429.
734
8.1
81.0
1,27
2.5
1,05
9.7
83.3
2021
865.
073
0.8
84.5
448.
536
3.4
81.0
1,31
3.5
1,09
4.3
83.3
2022
887.
875
0.6
84.5
468.
437
9.6
81.1
1,35
6.2
1,13
0.2
83.3
2023
913.
077
2.3
84.6
488.
939
6.4
81.1
1,40
1.9
1,16
8.6
83.4
2024
938.
379
4.1
84.6
510.
741
4.1
81.1
1,44
9.0
1,20
8.2
83.4
2025
963.
881
6.0
84.7
533.
543
2.6
81.1
1,49
7.2
1,24
8.6
83.4
2026
991.
483
9.7
84.7
557.
145
1.9
81.1
1,54
8.5
1,29
1.6
83.4
2027
1,02
0.1
864.
384
.758
1.2
471.
581
.11,
601.
31,
335.
883
.420
281,
048.
988
8.9
84.7
605.
949
1.7
81.1
1,65
4.8
1,38
0.6
83.4
2029
1,07
8.0
913.
884
.863
1.5
512.
581
.21,
709.
51,
426.
483
.420
301,
108.
393
9.7
84.8
658.
353
4.4
81.2
1,76
6.6
1,47
4.1
83.4
2031
1,13
9.6
966.
584
.868
5.8
556.
781
.21,
825.
41,
523.
283
.420
321,
171.
499
3.6
84.8
714.
157
9.8
81.2
1,88
5.5
1,57
3.4
83.4
Avg
Ann
ual G
row
th20
00-1
1-0
.4%
1.0%
1.4%
2.1%
2.6%
0.6%
0.3%
1.5%
1.2%
2011
-12
-0.8
%-0
.2%
0.6%
2.0%
2.2%
0.2%
0.0%
0.5%
0.4%
2011
-21
2.2%
2.5%
0.2%
4.1%
4.1%
0.0%
2.8%
3.0%
0.2%
2011
-32
2.5%
2.7%
0.1%
4.2%
4.2%
0.0%
3.1%
3.2%
0.1%
*Sou
rce:
For
ms
41 a
nd 2
98-C
, U.S
. Dep
artm
ent o
f Tra
nspo
rtatio
n.1 S
um o
f U.S
. Mai
nlin
e an
d R
egio
nal A
ir C
arrie
rs.
TAB
LE 6
U.S.
CO
MM
ERC
IAL
AIR
CA
RR
IER
S1
SCHE
DUL
ED P
ASS
ENG
ER C
APA
CIT
Y, T
RA
FFIC
, AND
LO
AD
FA
CTO
RS

FAA Aerospace Forecast Fiscal Years 2012-2032
88
RE
VE
NU
E P
AS
SE
NG
ER
EN
PLA
NE
ME
NTS
LATI
NTO
TAL
LATI
NTO
TAL
FIS
CA
LA
TLA
NTI
CA
ME
RIC
AP
AC
IFIC
INTE
RN
ATI
ON
AL
ATL
AN
TIC
AM
ER
ICA
PA
CIF
ICIN
TER
NA
TIO
NA
LY
EA
R(M
il)(M
il)(M
il)(M
il)(B
il)(B
il)(B
il)(B
il)H
isto
rical
*20
0020
.924
.311
.256
.487
.136
.358
.418
1.8
2005
21.6
32.5
13.2
67.4
89.5
48.6
59.2
197.
220
0622
.535
.213
.971
.693
.953
.661
.120
8.5
2007
24.1
37.6
13.6
75.3
102.
257
.761
.422
1.2
2008
26.0
39.1
13.2
78.3
112.
760
.760
.423
3.8
2009
24.7
36.8
12.0
73.6
108.
957
.754
.722
1.3
2010
24.5
40.0
12.9
77.4
108.
663
.159
.223
0.9
2011
E25
.342
.013
.580
.811
1.7
66.8
63.6
242.
1
Fore
cast
2012
25.5
43.3
13.6
82.3
112.
869
.964
.624
7.4
2013
26.2
44.9
13.7
84.8
116.
573
.266
.425
6.1
2014
27.1
46.9
14.4
88.4
121.
076
.470
.126
7.6
2015
27.9
49.0
15.2
92.1
125.
480
.273
.527
9.1
2016
29.0
51.2
16.0
96.1
131.
384
.076
.829
2.1
2017
30.1
53.3
16.8
100.
213
7.6
87.9
79.9
305.
520
1831
.255
.717
.610
4.4
143.
992
.183
.131
9.1
2019
32.3
58.2
18.3
108.
915
0.2
96.8
86.3
333.
320
2033
.561
.019
.211
3.7
156.
610
1.8
89.7
348.
120
2134
.763
.820
.011
8.5
163.
510
6.9
93.0
363.
4
2022
36.0
66.9
20.8
123.
717
0.8
112.
396
.437
9.6
2023
37.2
70.2
21.7
129.
217
8.2
118.
399
.939
6.4
2024
38.6
73.8
22.6
135.
018
5.9
124.
710
3.4
414.
120
2540
.077
.523
.514
1.0
194.
113
1.4
107.
143
2.6
2026
41.4
81.4
24.4
147.
220
2.8
138.
311
0.8
451.
9
2027
42.9
85.2
25.4
153.
621
1.8
145.
211
4.5
471.
520
2844
.589
.226
.416
0.1
221.
015
2.4
118.
449
1.7
2029
46.0
93.4
27.4
166.
923
0.4
159.
912
2.3
512.
520
3047
.698
.028
.417
4.0
240.
016
8.0
126.
353
4.4
2031
49.2
102.
629
.518
1.3
250.
117
6.3
130.
355
6.7
2032
51.0
107.
330
.518
8.8
260.
718
4.7
134.
457
9.8
Avg
Ann
ual G
row
th20
00-1
11.
8%5.
1%1.
7%3.
3%2.
3%5.
7%0.
8%2.
6%20
11-1
20.
7%3.
2%0.
3%1.
9%1.
0%4.
7%1.
6%2.
2%20
11-2
13.
2%4.
3%4.
0%3.
9%3.
9%4.
8%3.
9%4.
1%20
11-3
23.
4%4.
6%4.
0%4.
1%4.
1%5.
0%3.
6%4.
2%*
Sou
rce:
For
ms
41 a
nd 2
98-C
, U.S
. Dep
artm
ent o
f Tra
nspo
rtatio
n.1 S
um o
f U.S
. Mai
nlin
e an
d R
egio
nal A
ir C
arrie
rs.
TAB
LE 7
U.S.
CO
MM
ERC
IAL
AIR
CA
RR
IER
S1
TOTA
L SC
HED
ULED
U.S
. INT
ERNA
TIO
NAL
PASS
ENG
ER T
RA
FFIC
RE
VE
NU
E P
AS
SE
NG
ER
MIL
ES

FAA Aerospace Forecast Fiscal Years 2012-2032
89
TOTA
L P
AS
SE
NG
ER
S B
Y W
OR
LD T
RA
VE
L A
RE
A (M
illio
ns)
CA
LEN
DA
RU
.S./C
AN
AD
AY
EA
RA
TLA
NTI
CLA
TIN
AM
ER
ICA
PA
CIF
ICTR
AN
SB
OR
DE
RTO
TAL
His
toric
al*
2000
53.0
40.8
26.0
20.8
140.
6
2005
49.9
44.2
25.1
19.7
139.
020
0649
.847
.125
.621
.014
3.5
2007
53.3
48.6
26.3
21.5
149.
720
0857
.149
.825
.821
.715
4.4
2009
55.0
48.0
24.4
20.2
147.
520
1055
.953
.126
.721
.815
7.5
2011
E55
.655
.728
.222
.316
1.8
Fore
cast
2012
56.5
57.5
29.3
22.7
166.
020
1358
.260
.231
.023
.417
2.7
2014
61.2
63.6
32.8
24.3
181.
920
1564
.567
.034
.525
.219
1.1
2016
67.4
70.4
36.1
26.1
199.
9
2017
70.2
73.8
37.6
26.9
208.
420
1872
.977
.339
.127
.721
7.0
2019
75.8
81.1
40.7
28.5
226.
020
2078
.985
.042
.329
.423
5.5
2021
81.9
89.0
43.9
30.2
245.
0
2022
85.0
93.2
45.6
31.1
254.
920
2388
.397
.747
.332
.026
5.3
2024
91.7
102.
349
.133
.027
6.0
2025
95.1
107.
150
.934
.028
7.2
2026
98.6
112.
252
.735
.029
8.6
2027
102.
311
7.5
54.7
36.1
310.
420
2810
5.9
122.
956
.637
.132
2.6
2029
109.
712
8.6
58.6
38.2
335.
220
3011
3.7
134.
660
.739
.434
8.4
2031
117.
814
0.9
62.8
40.6
362.
120
3212
2.0
147.
364
.941
.837
6.1
Avg
Ann
ual G
row
th20
00-1
10.
4%2.
9%0.
8%0.
6%1.
3%20
11-1
21.
7%3.
1%4.
1%1.
9%2.
6%20
11-2
13.
9%4.
8%4.
5%3.
1%4.
2%20
11-3
23.
8%4.
7%4.
1%3.
0%4.
1%*S
ourc
e: I
NS
Imm
igra
tion
Ser
vice
TAB
LE 8
U.S.
AND
FO
REI
GN
FLA
G C
AR
RIE
RS
TOTA
L PA
SSEN
GER
TR
AFF
IC T
O/F
RO
M T
HE U
NITE
D S
TATE
S

FAA Aerospace Forecast Fiscal Years 2012-2032
90
FIS
CA
LD
OM
ES
TIC
INT'
L.S
YS
TEM
DO
ME
STI
CIN
T'L.
SY
STE
MY
EA
R(S
eats
/Mile
)(S
eats
/Mile
)(S
eats
/Mile
)(M
iles)
(Mile
s)(M
iles)
His
toric
al*
2000
129.
323
0.6
145.
079
9.8
3,22
3.2
995.
7
2005
120.
421
7.1
135.
385
6.2
2,92
4.6
1,04
5.4
2006
120.
121
5.0
135.
787
1.4
2,91
1.5
1,06
8.8
2007
120.
421
6.1
136.
687
0.2
2,93
9.0
1,07
3.7
2008
120.
821
8.6
138.
287
3.5
2,98
5.2
1,09
1.4
2009
121.
821
9.0
140.
086
9.7
3,00
8.1
1,09
3.1
2010
121.
821
6.4
139.
787
5.0
2,98
3.8
1,10
4.0
2011
E12
2.6
216.
514
1.0
881.
02,
997.
41,
114.
9
Fore
cast
2012
122.
821
7.0
141.
887
9.7
3,00
4.8
1,11
8.7
2013
123.
321
7.3
142.
688
3.1
3,02
0.7
1,12
6.2
2014
123.
421
8.0
143.
188
2.4
3,02
6.3
1,13
1.1
2015
123.
521
8.4
143.
388
1.4
3,02
8.9
1,13
0.1
2016
123.
521
9.0
143.
788
1.9
3,03
8.6
1,13
4.7
2017
123.
621
9.5
144.
288
3.4
3,04
8.2
1,14
1.2
2018
123.
822
0.0
144.
788
7.1
3,05
5.5
1,14
9.3
2019
124.
022
0.5
145.
289
0.1
3,05
9.7
1,15
6.8
2020
124.
122
0.9
145.
789
3.4
3,06
1.9
1,16
4.3
2021
124.
322
1.3
146.
289
7.5
3,06
6.0
1,17
3.0
2022
124.
522
1.7
146.
790
1.5
3,06
8.8
1,18
1.9
2023
124.
622
2.0
147.
190
5.6
3,06
9.0
1,19
0.2
2024
124.
822
2.4
147.
690
9.7
3,06
8.4
1,19
8.7
2025
124.
922
2.7
148.
191
3.8
3,06
8.2
1,20
7.6
2026
125.
122
3.0
148.
591
9.0
3,06
8.8
1,21
7.4
2027
125.
222
3.4
149.
092
4.4
3,07
0.2
1,22
7.2
2028
125.
422
3.8
149.
492
9.9
3,07
1.4
1,23
7.1
2029
125.
522
4.1
149.
993
5.4
3,07
1.6
1,24
7.1
2030
125.
722
4.4
150.
394
0.8
3,07
0.5
1,25
6.8
2031
125.
822
4.8
150.
894
6.2
3,07
0.0
1,26
6.4
2032
126.
022
5.1
151.
295
1.6
3,07
1.0
1,27
6.2
*Sou
rce:
For
ms
41 a
nd 2
98-C
, U.S
. Dep
artm
ent o
f Tra
nspo
rtatio
n.1 S
um o
f U.S
. Mai
nlin
e an
d R
egio
nal A
ir C
arrie
rs.
TAB
LE 9
AV
ER
AG
E S
EA
TS P
ER
AIR
CR
AFT
MIL
EA
VE
RA
GE
PA
SS
EN
GE
R T
RIP
LE
NG
TH
U.S.
CO
MM
ERC
IAL
AIR
CA
RR
IER
S' F
OR
ECA
ST A
SSUM
PTIO
NS1
SEA
TS P
ER A
IRC
RA
FT M
ILE
AND
PA
SSEN
GER
TR
IP L
ENG
TH

FAA Aerospace Forecast Fiscal Years 2012-2032
91
RE
VE
NU
E P
AS
SE
NG
ER
EN
PLA
NE
ME
NTS
RE
VE
NU
E P
AS
SE
NG
ER
MIL
ES
FIS
CA
L(M
illio
ns)
(Bill
ions
)Y
EA
RD
OM
ES
TIC
INTE
RN
ATI
ON
AL
SY
STE
MD
OM
ES
TIC
INTE
RN
ATI
ON
AL
SY
STE
MH
isto
rical
*20
0056
1.5
53.3
614.
849
0.0
181.
067
0.9
2005
523.
164
.258
7.3
509.
619
5.8
705.
420
0651
6.2
68.1
584.
451
3.9
206.
872
0.7
2007
533.
971
.960
5.7
529.
921
9.5
749.
420
0852
1.6
74.8
596.
552
1.3
231.
975
3.3
2009
476.
871
.054
7.8
478.
222
0.0
698.
220
1047
3.6
74.7
548.
348
0.7
229.
671
0.3
2011
E48
8.6
78.3
566.
949
7.0
240.
373
7.4
Fore
cast
2012
487.
079
.956
6.9
494.
924
6.1
741.
020
1349
7.3
82.4
579.
750
6.0
254.
876
0.9
2014
506.
386
.059
2.3
514.
826
6.2
781.
020
1552
8.1
89.5
617.
653
6.2
277.
681
3.9
2016
542.
693
.563
6.1
551.
029
0.6
841.
6
2017
555.
497
.565
2.9
564.
530
4.0
868.
520
1856
8.3
101.
666
9.9
579.
931
7.5
897.
420
1958
1.4
106.
068
7.4
595.
133
1.6
926.
720
2059
5.4
110.
770
6.2
611.
334
6.4
957.
720
2160
8.4
115.
572
3.9
627.
136
1.7
988.
8
2022
621.
512
0.6
742.
164
3.2
377.
81,
021.
020
2363
6.1
126.
076
2.1
660.
939
4.5
1,05
5.4
2024
650.
713
1.7
782.
367
8.7
412.
11,
090.
920
2566
5.0
137.
780
2.7
696.
543
0.6
1,12
7.1
2026
679.
914
3.8
823.
771
5.7
449.
81,
165.
5
2027
695.
215
0.0
845.
273
5.5
469.
41,
204.
920
2871
0.2
156.
586
6.7
755.
448
9.5
1,24
4.9
2029
725.
216
3.1
888.
377
5.4
510.
21,
285.
720
3074
0.9
170.
291
1.1
796.
153
2.0
1,32
8.1
2031
757.
017
7.4
934.
481
7.6
554.
31,
371.
820
3277
3.1
184.
895
7.9
839.
257
7.3
1,41
6.5
Avg
Ann
ual G
row
th20
00-1
1-1
.3%
3.6%
-0.7
%0.
1%2.
6%0.
9%20
11-1
2-0
.3%
2.1%
0.0%
-0.4
%2.
4%0.
5%20
11-2
12.
2%4.
0%2.
5%2.
4%4.
2%3.
0%20
11-3
22.
2%4.
2%2.
5%2.
5%4.
3%3.
2%*S
ourc
e: F
orm
41,
U.S
. Dep
artm
ent o
f Tra
nspo
rtatio
n.
TAB
LE 1
0
U. S
. MA
INLI
NE A
IR C
AR
RIE
RS
SCHE
DUL
ED P
ASS
ENG
ER T
RA
FFIC

FAA Aerospace Forecast Fiscal Years 2012-2032
92
DO
ME
STI
CIN
TER
NA
TIO
NA
LS
YS
TEM
FIS
CA
LA
SM
sR
PM
s%
LO
AD
AS
Ms
RP
Ms
% L
OA
DA
SM
sR
PM
s%
LO
AD
YE
AR
(BIL
)(B
IL)
FAC
TOR
(BIL
)(B
IL)
FAC
TOR
(BIL
)(B
IL)
FAC
TOR
His
toric
al*
2000
688.
349
0.0
71.2
238.
018
1.0
76.0
926.
267
0.9
72.4
2005
665.
150
9.6
76.6
246.
319
5.8
79.5
911.
470
5.4
77.4
2006
648.
751
3.9
79.2
258.
920
6.8
79.9
907.
672
0.7
79.4
2007
659.
052
9.9
80.4
273.
421
9.5
80.3
932.
474
9.4
80.4
2008
650.
252
1.3
80.2
290.
123
1.9
80.0
940.
375
3.3
80.1
2009
587.
847
8.2
81.4
281.
522
0.0
78.2
869.
369
8.2
80.3
2010
581.
548
0.7
82.7
279.
422
9.6
82.2
860.
971
0.3
82.5
2011
E59
4.8
497.
083
.629
8.2
240.
380
.689
3.0
737.
482
.6
Fore
cast
2012
589.
849
4.9
83.9
304.
124
6.1
80.9
893.
974
1.0
82.9
2013
599.
350
6.0
84.4
314.
625
4.8
81.0
913.
976
0.9
83.3
2014
607.
951
4.8
84.7
328.
926
6.2
81.0
936.
878
1.0
83.4
2015
631.
753
6.2
84.9
342.
927
7.6
81.0
974.
581
3.9
83.5
2016
647.
755
1.0
85.1
358.
929
0.6
81.0
1,00
6.6
841.
683
.6
2017
662.
556
4.5
85.2
375.
330
4.0
81.0
1,03
7.8
868.
583
.720
1867
9.6
579.
985
.339
1.9
317.
581
.01,
071.
589
7.4
83.8
2019
696.
559
5.1
85.4
409.
233
1.6
81.0
1,10
5.7
926.
783
.820
2071
4.7
611.
385
.542
7.4
346.
481
.11,
142.
195
7.7
83.9
2021
732.
562
7.1
85.6
446.
136
1.7
81.1
1,17
8.6
988.
883
.9
2022
750.
764
3.2
85.7
465.
937
7.8
81.1
1,21
6.6
1,02
1.0
83.9
2023
770.
866
0.9
85.7
486.
539
4.5
81.1
1,25
7.3
1,05
5.4
83.9
2024
791.
167
8.7
85.8
508.
141
2.1
81.1
1,29
9.2
1,09
0.9
84.0
2025
811.
369
6.5
85.9
530.
843
0.6
81.1
1,34
2.1
1,12
7.1
84.0
2026
833.
271
5.7
85.9
554.
444
9.8
81.1
1,38
7.6
1,16
5.5
84.0
2027
855.
973
5.5
85.9
578.
446
9.4
81.1
1,43
4.3
1,20
4.9
84.0
2028
878.
675
5.4
86.0
603.
148
9.5
81.2
1,48
1.7
1,24
4.9
84.0
2029
901.
677
5.4
86.0
628.
651
0.2
81.2
1,53
0.1
1,28
5.7
84.0
2030
925.
379
6.1
86.0
655.
353
2.0
81.2
1,58
0.5
1,32
8.1
84.0
2031
949.
881
7.6
86.1
682.
655
4.3
81.2
1,63
2.5
1,37
1.8
84.0
2032
974.
683
9.2
86.1
710.
957
7.3
81.2
1,68
5.5
1,41
6.5
84.0
Avg
Ann
ual G
row
th20
00-1
1-1
.3%
0.1%
1.5%
2.1%
2.6%
0.5%
-0.3
%0.
9%1.
2%20
11-1
2-0
.8%
-0.4
%0.
4%2.
0%2.
4%0.
4%0.
1%0.
5%0.
4%20
11-2
12.
1%2.
4%0.
2%4.
1%4.
2%0.
1%2.
8%3.
0%0.
2%20
11-3
22.
4%2.
5%0.
1%4.
2%4.
3%0.
0%3.
1%3.
2%0.
1%*
Sou
rce:
For
m 4
1, U
.S. D
epar
tmen
t of T
rans
porta
tion.
TAB
LE 1
1
U.S.
MA
INLI
NE A
IR C
AR
RIE
RS
SCHE
DUL
ED P
ASS
ENG
ER C
APA
CIT
Y, T
RA
FFIC
, AND
LO
AD
FA
CTO
RS

FAA Aerospace Forecast Fiscal Years 2012-2032
93
U.S.
MA
INLI
NE A
IR C
AR
RIE
RS
FIS
CA
LY
EA
RA
TLA
NTI
CLA
TIN
AM
ER
ICA
PA
CIF
ICTO
TAL
His
toric
al*
2000
20.9
21.2
11.2
53.3
2005
21.6
29.3
13.2
64.2
2006
22.5
31.7
13.9
68.1
2007
24.1
34.2
13.6
71.9
2008
26.0
35.6
13.2
74.8
2009
24.7
34.3
12.0
71.0
2010
24.5
37.3
12.9
74.7
2011
E25
.339
.613
.478
.3
Fore
cast
2012
25.5
40.9
13.6
79.9
2013
26.2
42.5
13.7
82.4
2014
27.1
44.4
14.4
86.0
2015
27.9
46.4
15.2
89.5
2016
29.0
48.5
16.0
93.5
2017
30.1
50.6
16.8
97.5
2018
31.2
52.8
17.6
101.
620
1932
.355
.318
.310
6.0
2020
33.5
58.1
19.2
110.
720
2134
.760
.820
.011
5.5
2022
36.0
63.8
20.8
120.
620
2337
.267
.021
.712
6.0
2024
38.6
70.5
22.6
131.
720
2540
.074
.223
.513
7.7
2026
41.4
77.9
24.4
143.
8
2027
42.9
81.7
25.4
150.
020
2844
.585
.626
.415
6.5
2029
46.0
89.7
27.4
163.
120
3047
.694
.228
.417
0.2
2031
49.2
98.7
29.5
177.
420
3251
.010
3.3
30.5
184.
8
Avg
Ann
ual G
row
th20
00-1
11.
7%5.
8%1.
7%3.
6%20
11-1
20.
7%3.
4%1.
1%2.
1%20
11-2
13.
2%4.
4%4.
1%4.
0%20
11-3
23.
4%4.
7%4.
0%4.
2%*
Sou
rce:
For
m 4
1, U
.S. D
epar
tmen
t of T
rans
porta
tion.TA
BLE
12
RE
VE
NU
E P
AS
SE
NG
ER
EN
PLA
NE
ME
NTS
(MIL
)
SCHE
DUL
ED IN
TER
NATI
ONA
L PA
SSEN
GER
ENP
LANE
MEN
TS
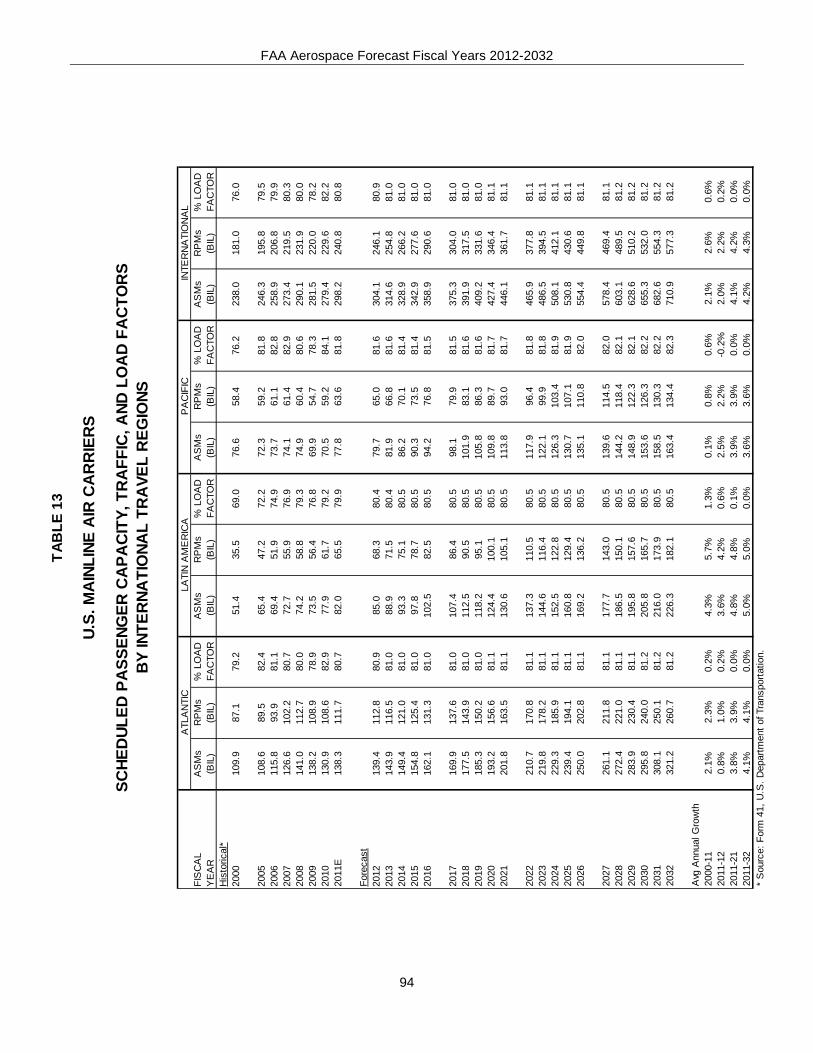
FAA Aerospace Forecast Fiscal Years 2012-2032
94
ATL
AN
TIC
LATI
N A
ME
RIC
AP
AC
IFIC
INTE
RN
ATI
ON
AL
FIS
CA
LA
SM
sR
PM
s%
LO
AD
AS
Ms
RP
Ms
% L
OA
DA
SM
sR
PM
s%
LO
AD
AS
Ms
RP
Ms
% L
OA
DY
EA
R(B
IL)
(BIL
)FA
CTO
R(B
IL)
(BIL
)FA
CTO
R(B
IL)
(BIL
)FA
CTO
R(B
IL)
(BIL
)FA
CTO
RH
isto
rical
*20
0010
9.9
87.1
79.2
51.4
35.5
69.0
76.6
58.4
76.2
238.
018
1.0
76.0
2005
108.
689
.582
.465
.447
.272
.272
.359
.281
.824
6.3
195.
879
.520
0611
5.8
93.9
81.1
69.4
51.9
74.9
73.7
61.1
82.8
258.
920
6.8
79.9
2007
126.
610
2.2
80.7
72.7
55.9
76.9
74.1
61.4
82.9
273.
421
9.5
80.3
2008
141.
011
2.7
80.0
74.2
58.8
79.3
74.9
60.4
80.6
290.
123
1.9
80.0
2009
138.
210
8.9
78.9
73.5
56.4
76.8
69.9
54.7
78.3
281.
522
0.0
78.2
2010
130.
910
8.6
82.9
77.9
61.7
79.2
70.5
59.2
84.1
279.
422
9.6
82.2
2011
E13
8.3
111.
780
.782
.065
.579
.977
.863
.681
.829
8.2
240.
880
.8
Fore
cast
2012
139.
411
2.8
80.9
85.0
68.3
80.4
79.7
65.0
81.6
304.
124
6.1
80.9
2013
143.
911
6.5
81.0
88.9
71.5
80.4
81.9
66.8
81.6
314.
625
4.8
81.0
2014
149.
412
1.0
81.0
93.3
75.1
80.5
86.2
70.1
81.4
328.
926
6.2
81.0
2015
154.
812
5.4
81.0
97.8
78.7
80.5
90.3
73.5
81.4
342.
927
7.6
81.0
2016
162.
113
1.3
81.0
102.
582
.580
.594
.276
.881
.535
8.9
290.
681
.0
2017
169.
913
7.6
81.0
107.
486
.480
.598
.179
.981
.537
5.3
304.
081
.020
1817
7.5
143.
981
.011
2.5
90.5
80.5
101.
983
.181
.639
1.9
317.
581
.020
1918
5.3
150.
281
.011
8.2
95.1
80.5
105.
886
.381
.640
9.2
331.
681
.020
2019
3.2
156.
681
.112
4.4
100.
180
.510
9.8
89.7
81.7
427.
434
6.4
81.1
2021
201.
816
3.5
81.1
130.
610
5.1
80.5
113.
893
.081
.744
6.1
361.
781
.1
2022
210.
717
0.8
81.1
137.
311
0.5
80.5
117.
996
.481
.846
5.9
377.
881
.120
2321
9.8
178.
281
.114
4.6
116.
480
.512
2.1
99.9
81.8
486.
539
4.5
81.1
2024
229.
318
5.9
81.1
152.
512
2.8
80.5
126.
310
3.4
81.9
508.
141
2.1
81.1
2025
239.
419
4.1
81.1
160.
812
9.4
80.5
130.
710
7.1
81.9
530.
843
0.6
81.1
2026
250.
020
2.8
81.1
169.
213
6.2
80.5
135.
111
0.8
82.0
554.
444
9.8
81.1
2027
261.
121
1.8
81.1
177.
714
3.0
80.5
139.
611
4.5
82.0
578.
446
9.4
81.1
2028
272.
422
1.0
81.1
186.
515
0.1
80.5
144.
211
8.4
82.1
603.
148
9.5
81.2
2029
283.
923
0.4
81.1
195.
815
7.6
80.5
148.
912
2.3
82.1
628.
651
0.2
81.2
2030
295.
824
0.0
81.2
205.
816
5.7
80.5
153.
612
6.3
82.2
655.
353
2.0
81.2
2031
308.
125
0.1
81.2
216.
017
3.9
80.5
158.
513
0.3
82.2
682.
655
4.3
81.2
2032
321.
226
0.7
81.2
226.
318
2.1
80.5
163.
413
4.4
82.3
710.
957
7.3
81.2
Avg
Ann
ual G
row
th20
00-1
12.
1%2.
3%0.
2%4.
3%5.
7%1.
3%0.
1%0.
8%0.
6%2.
1%2.
6%0.
6%20
11-1
20.
8%1.
0%0.
2%3.
6%4.
2%0.
6%2.
5%2.
2%-0
.2%
2.0%
2.2%
0.2%
2011
-21
3.8%
3.9%
0.0%
4.8%
4.8%
0.1%
3.9%
3.9%
0.0%
4.1%
4.2%
0.0%
2011
-32
4.1%
4.1%
0.0%
5.0%
5.0%
0.0%
3.6%
3.6%
0.0%
4.2%
4.3%
0.0%
* S
ourc
e: F
orm
41,
U.S
. Dep
artm
ent o
f Tra
nspo
rtatio
n.
TAB
LE 1
3
U.S.
MA
INLI
NE A
IR C
AR
RIE
RS
SCHE
DUL
ED P
ASS
ENG
ER C
APA
CIT
Y, T
RA
FFIC
, AND
LO
AD
FA
CTO
RS
BY
INTE
RNA
TIO
NAL
TRA
VEL
REG
IONS

FAA Aerospace Forecast Fiscal Years 2012-2032
95
FIS
CA
LD
OM
ES
TIC
ATL
AN
TIC
LATI
N A
ME
RIC
AP
AC
IFIC
TOTA
LS
YS
TEM
YE
AR
(Sea
ts/M
ile)
(Sea
ts/M
ile)
(Sea
ts/M
ile)
(Sea
ts/M
ile)
(Sea
ts/M
ile)
(Sea
ts/M
ile)
His
toric
al*
2000
148.
823
3.7
179.
530
7.8
236.
616
4.5
2005
150.
423
0.8
175.
527
8.7
223.
416
5.0
2006
150.
522
9.4
175.
227
4.4
221.
416
5.7
2007
150.
622
9.2
176.
227
9.6
222.
316
6.3
2008
150.
322
9.2
177.
329
2.3
224.
916
7.5
2009
151.
223
0.0
175.
829
1.3
223.
716
8.9
2010
151.
923
1.7
171.
528
7.2
220.
916
9.0
2011
E15
2.3
230.
517
2.3
282.
922
0.7
169.
9
Fore
cast
2012
152.
423
1.0
172.
828
3.7
221.
017
0.4
2013
152.
423
1.5
173.
328
4.4
221.
217
0.7
2014
152.
523
2.0
173.
828
5.2
221.
817
1.3
2015
152.
623
2.5
174.
328
5.9
222.
217
1.5
2016
152.
723
3.0
174.
828
6.7
222.
817
2.0
2017
152.
723
3.5
175.
328
7.4
223.
217
2.4
2018
152.
823
4.0
175.
828
8.2
223.
717
2.8
2019
152.
923
4.5
176.
328
8.9
224.
017
3.3
2020
153.
023
5.0
176.
828
9.7
224.
417
3.6
2021
153.
023
5.5
177.
329
0.4
224.
717
4.1
2022
153.
123
6.0
177.
829
1.2
225.
117
4.5
2023
153.
223
6.5
178.
329
1.9
225.
417
4.9
2024
153.
323
7.0
178.
829
2.7
225.
617
5.2
2025
153.
323
7.5
179.
329
3.4
225.
917
5.7
2026
153.
423
8.0
179.
829
4.2
226.
217
6.0
2027
153.
523
8.5
180.
329
4.9
226.
517
6.4
2028
153.
623
9.0
180.
829
5.7
226.
817
6.8
2029
153.
623
9.5
181.
329
6.4
227.
117
7.2
2030
153.
724
0.0
181.
829
7.2
227.
417
7.6
2031
153.
824
0.5
182.
329
7.9
227.
717
7.9
2032
153.
924
1.0
182.
829
8.7
228.
017
8.3
* S
ourc
e: F
orm
41,
U.S
. Dep
artm
ent o
f Tra
nspo
rtatio
n.
TAB
LE 1
4
INTE
RN
ATI
ON
AL
U.S.
MA
INLI
NE A
IR C
AR
RIE
R F
OR
ECA
ST A
SSUM
PTIO
NS
SEA
TS P
ER A
IRC
RA
FT M
ILE

FAA Aerospace Forecast Fiscal Years 2012-2032
96
U.S.
MA
INLI
NE A
IR C
AR
RIE
R F
OR
ECA
ST A
SSUM
PTIO
NS
AVE
RA
GE
PASS
ENG
ER T
RIP
LEN
GTH
FIS
CA
LD
OM
ES
TIC
ATL
AN
TIC
LATI
N A
ME
RIC
AP
AC
IFIC
TOTA
LS
YS
TEM
YE
AR
(Mile
s)(M
iles)
(Mile
s)(M
iles)
(Mile
s)(M
iles)
His
toric
al*
2000
872.
64,
168.
11,
675.
25,
219.
93,
397.
31,
091.
4
2005
981.
54,
133.
11,
611.
14,
466.
13,
051.
21,
201.
120
0699
5.4
4,17
5.4
1,63
7.0
4,39
0.4
3,03
7.0
1,23
3.4
2007
992.
84,
247.
81,
634.
34,
515.
13,
054.
21,
237.
220
0899
9.4
4,33
2.7
1,65
1.6
4,58
3.5
3,10
0.1
1,26
2.9
2009
1,00
3.0
4,40
2.4
1,64
5.6
4,54
9.9
3,09
7.6
1,27
4.6
2010
1,01
5.1
4,43
3.0
1,65
4.7
4,58
6.6
3,07
2.6
1,29
5.5
2011
E1,
017.
94,
414.
71,
655.
94,
706.
93,
072.
21,
301.
7
Fore
cast
2012
1,01
6.3
4,42
7.4
1,66
9.2
4,79
7.1
3,07
8.8
1,30
7.1
2013
1,01
7.6
4,44
0.3
1,68
2.7
4,89
3.3
3,09
3.2
1,31
2.6
2014
1,01
6.7
4,47
0.7
1,68
9.2
4,85
6.6
3,09
7.5
1,31
8.7
2015
1,01
5.4
4,49
9.9
1,69
5.7
4,82
2.3
3,10
0.5
1,31
7.7
2016
1,01
5.4
4,53
6.0
1,70
1.8
4,79
0.5
3,10
9.6
1,32
3.1
2017
1,01
6.4
4,57
2.7
1,70
7.7
4,76
1.4
3,11
8.2
1,33
0.3
2018
1,02
0.5
4,60
8.1
1,71
3.2
4,73
3.6
3,12
4.4
1,33
9.6
2019
1,02
3.6
4,64
2.8
1,71
8.5
4,70
6.2
3,12
7.4
1,34
8.1
2020
1,02
6.6
4,67
7.5
1,72
3.6
4,67
9.3
3,12
8.4
1,35
6.2
2021
1,03
0.7
4,71
3.0
1,72
8.3
4,65
3.5
3,13
1.3
1,36
5.9
2022
1,03
4.9
4,74
9.1
1,73
2.7
4,62
8.3
3,13
2.8
1,37
5.8
2023
1,03
9.0
4,78
4.4
1,73
6.9
4,60
3.6
3,13
1.8
1,38
4.9
2024
1,04
3.1
4,82
0.3
1,74
0.8
4,57
9.4
3,12
9.9
1,39
4.4
2025
1,04
7.3
4,85
6.9
1,74
4.5
4,55
5.4
3,12
8.4
1,40
4.2
2026
1,05
2.6
4,89
4.1
1,74
7.8
4,53
2.1
3,12
7.8
1,41
4.8
2027
1,05
8.0
4,93
1.3
1,75
0.9
4,50
9.3
3,12
8.2
1,42
5.5
2028
1,06
3.6
4,96
8.2
1,75
3.7
4,48
7.0
3,12
8.2
1,43
6.4
2029
1,06
9.3
5,00
4.9
1,75
6.3
4,46
5.0
3,12
7.4
1,44
7.3
2030
1,07
4.6
5,04
1.5
1,75
8.8
4,44
3.3
3,12
5.1
1,45
7.7
2031
1,08
0.0
5,07
8.3
1,76
1.0
4,42
2.1
3,12
3.6
1,46
8.1
2032
1,08
5.4
5,11
5.8
1,76
3.1
4,40
1.5
3,12
3.6
1,47
8.6
* S
ourc
e: F
orm
41,
U.S
. Dep
artm
ent o
f Tra
nspo
rtatio
n.
TAB
LE 1
5
INTE
RN
ATI
ON
AL

FAA Aerospace Forecast Fiscal Years 2012-2032
97
DO
ME
STI
CIN
TER
NA
TIO
NA
LS
YS
TEM
FIS
CA
LC
UR
RE
NT
$FY
201
1 $
CU
RR
EN
T $
FY 2
011
$C
UR
RE
NT
$
FY 2
011
$Y
EA
R(C
ents
)(C
ents
)(C
ents
)(C
ents
)(C
ents
)
(Cen
ts)
His
toric
al*
2000
14.0
318
.32
10.4
613
.65
13.0
617
.06
2005
11.4
513
.19
10.8
712
.53
11.2
913
.01
2006
12.3
613
.74
11.6
312
.93
12.1
513
.51
2007
12.4
513
.52
12.4
513
.53
12.4
513
.52
2008
13.1
113
.63
13.3
713
.91
13.1
913
.72
2009
11.9
512
.47
11.6
812
.18
11.8
712
.38
2010
12.8
713
.20
12.8
613
.19
12.8
713
.20
2011
E13
.59
13.5
914
.14
14.1
413
.77
13.7
7
Fore
cast
2012
14.0
113
.75
14.9
814
.70
14.3
314
.06
2013
14.2
813
.77
15.4
414
.88
14.6
714
.14
2014
14.6
213
.81
15.6
014
.74
14.9
514
.12
2015
14.9
313
.82
15.7
714
.60
15.2
214
.08
2016
15.2
813
.84
15.9
614
.45
15.5
114
.05
2017
15.5
613
.80
16.1
314
.30
15.7
613
.98
2018
15.7
013
.65
16.2
814
.16
15.9
113
.83
2019
15.8
513
.53
16.4
314
.02
16.0
613
.71
2020
15.9
613
.38
16.5
613
.89
16.1
713
.56
2021
16.0
613
.22
16.6
913
.75
16.2
913
.42
2022
16.1
613
.07
16.8
413
.61
16.4
113
.27
2023
16.2
512
.91
16.9
713
.48
16.5
213
.12
2024
16.3
812
.78
17.1
213
.35
16.6
612
.99
2025
16.5
312
.65
17.2
713
.22
16.8
112
.87
2026
16.6
412
.49
17.4
413
.09
16.9
512
.72
2027
16.7
412
.33
17.6
012
.96
17.0
812
.58
2028
16.8
612
.17
17.7
812
.84
17.2
212
.43
2029
16.9
812
.02
17.9
612
.71
17.3
712
.29
2030
17.1
211
.87
18.1
412
.59
17.5
312
.16
2031
17.2
611
.73
18.3
412
.46
17.6
912
.03
2032
17.4
011
.59
18.5
312
.34
17.8
611
.89
Avg
Ann
ual G
row
th20
00-1
1-0
.3%
-2.7
%2.
8%0.
3%0.
5%-1
.9%
2011
-12
3.1%
1.2%
5.9%
3.9%
4.1%
2.1%
2011
-21
1.7%
-0.3
%1.
7%-0
.3%
1.7%
-0.3
%20
11-3
21.
2%-0
.8%
1.3%
-0.6
%1.
2%-0
.7%
* S
ourc
e: F
orm
41,
U.S
. Dep
artm
ent o
f Tra
nspo
rtatio
n.
TAB
LE 1
6
U.S.
MA
INLI
NE A
IR C
AR
RIE
R F
OR
ECA
ST A
SSUM
PTIO
NS
PASS
ENG
ER Y
IELD
S
RE
VE
NU
E P
ER
PA
SS
EN
GE
R M
ILE

FAA Aerospace Forecast Fiscal Years 2012-2032
98
ATL
AN
TIC
LATI
N A
ME
RIC
AP
AC
IFIC
TOTA
L IN
TER
NA
TIO
NA
LFI
SC
AL
CU
RR
EN
T $
FY 2
011
$C
UR
RE
NT
$FY
201
1 $
CU
RR
EN
T $
FY 2
011
$C
UR
RE
NT
$FY
201
1 $
YE
AR
(Cen
ts)
(Cen
ts)
(Cen
ts)
(Cen
ts)
(Cen
ts)
(Cen
ts)
(Cen
ts)
(Cen
ts)
His
toric
al*
2000
9.73
12.7
113
.00
16.9
89.
9913
.04
10.4
613
.65
2005
10.7
512
.38
12.1
614
.01
10.0
411
.57
10.8
712
.53
2006
11.6
412
.94
12.6
814
.10
10.7
311
.93
11.6
312
.93
2007
12.4
613
.53
13.3
714
.52
11.6
112
.61
12.4
513
.53
2008
13.2
913
.82
14.1
914
.76
12.7
313
.24
13.3
713
.91
2009
11.2
511
.73
12.9
913
.55
11.2
011
.68
11.6
812
.18
2010
12.7
313
.05
13.4
313
.77
12.5
012
.82
12.8
613
.19
2011
E13
.48
13.4
815
.34
15.3
414
.07
14.0
714
.14
14.1
4
Fore
cast
2012
14.2
013
.93
16.3
616
.05
14.8
814
.60
14.9
814
.70
2013
14.4
713
.95
16.9
716
.36
15.4
914
.93
15.4
414
.88
2014
14.6
213
.81
17.1
416
.19
15.6
514
.78
15.6
014
.74
2015
14.7
713
.67
17.3
216
.03
15.8
114
.63
15.7
714
.60
2016
14.9
513
.53
17.5
215
.87
16.0
014
.49
15.9
614
.45
2017
15.1
013
.40
17.7
115
.71
16.1
714
.34
16.1
314
.30
2018
15.2
513
.26
17.8
815
.55
16.3
314
.20
16.2
814
.16
2019
15.3
913
.13
18.0
415
.40
16.4
714
.06
16.4
314
.02
2020
15.5
013
.00
18.1
815
.24
16.6
013
.92
16.5
613
.89
2021
15.6
312
.87
18.3
215
.09
16.7
313
.78
16.6
913
.75
2022
15.7
612
.74
18.4
814
.94
16.8
713
.64
16.8
413
.61
2023
15.8
812
.61
18.6
214
.79
17.0
013
.50
16.9
713
.48
2024
16.0
112
.49
18.7
814
.64
17.1
413
.37
17.1
213
.35
2025
16.1
512
.36
18.9
414
.50
17.2
913
.24
17.2
713
.22
2026
16.3
012
.24
19.1
214
.35
17.4
513
.10
17.4
413
.09
2027
16.4
612
.12
19.3
014
.21
17.6
212
.97
17.6
012
.96
2028
16.6
112
.00
19.4
814
.07
17.7
812
.84
17.7
812
.84
2029
16.7
811
.88
19.6
713
.93
17.9
612
.71
17.9
612
.71
2030
16.9
511
.76
19.8
713
.79
18.1
412
.59
18.1
412
.59
2031
17.1
211
.64
20.0
813
.65
18.3
312
.46
18.3
412
.46
2032
17.3
111
.52
20.2
913
.51
18.5
312
.34
18.5
312
.34
Avg
Ann
ual G
row
th20
00-1
13.
0%0.
5%1.
5%-0
.9%
3.2%
0.7%
2.8%
0.3%
2011
-12
5.3%
3.3%
6.6%
4.6%
5.8%
3.8%
5.9%
3.9%
2011
-21
1.5%
-0.5
%1.
8%-0
.2%
1.7%
-0.2
%1.
7%-0
.3%
2011
-32
1.2%
-0.7
%1.
3%-0
.6%
1.3%
-0.6
%1.
3%-0
.6%
* S
ourc
e: F
orm
41,
U.S
. Dep
artm
ent o
f Tra
nspo
rtatio
n.
TAB
LE 1
7
U.S.
MA
INLI
NE A
IR C
AR
RIE
R F
OR
ECA
ST A
SSUM
PTIO
NS
INTE
RNA
TIO
NAL
PASS
ENG
ER Y
IELD
S B
Y R
EGIO
N
RE
VE
NU
E P
ER
PA
SS
EN
GE
R M
ILE

FAA Aerospace Forecast Fiscal Years 2012-2032
99
DO
ME
STI
CIN
TER
NA
TIO
NA
LS
YS
TEM
FIS
CA
LC
UR
RE
NT
$FY
201
1 $
CU
RR
EN
T $
FY 2
011
$C
UR
RE
NT
$
FY 2
011
$Y
EA
R(C
ents
)
(Cen
ts)
(Cen
ts)
(C
ents
)(C
ents
)(C
ents
)H
isto
rical
*20
0071
.49
93.3
679
.35
103.
6373
.57
96.0
8
2005
149.
3917
2.14
157.
2618
1.21
151.
5817
4.66
2006
194.
6921
6.43
204.
6922
7.54
197.
7221
9.80
2007
194.
0121
0.88
203.
3122
0.81
196.
9021
3.85
2008
292.
6430
4.22
314.
5732
7.11
299.
7431
1.69
2009
202.
3121
1.02
208.
4121
7.38
204.
3521
3.15
2010
219.
1922
4.79
220.
0622
5.70
219.
4922
5.09
2011
E27
4.41
274.
4127
1.77
271.
7727
3.44
273.
44
Fore
cast
2012
299.
7229
4.10
296.
8429
1.27
298.
6629
3.06
2013
321.
2730
9.71
318.
1830
6.73
320.
1330
8.62
2014
333.
1231
4.62
329.
9131
1.59
331.
9431
3.51
2015
334.
6830
9.75
331.
4630
6.77
333.
5030
8.65
2016
343.
9631
1.48
340.
6530
8.49
342.
7431
0.38
2017
351.
5031
1.81
348.
1230
8.81
350.
2631
0.70
2018
356.
3730
9.92
352.
9430
6.94
355.
1130
8.83
2019
357.
9630
5.50
354.
5230
2.56
356.
7030
4.42
2020
353.
0929
6.10
349.
7029
3.25
351.
8529
5.06
2021
352.
0728
9.97
348.
6828
7.18
350.
8228
8.94
2022
352.
0728
4.72
348.
6928
1.98
350.
8328
3.71
2023
349.
9927
8.05
346.
6227
5.37
348.
7527
7.06
2024
353.
7927
5.93
350.
3927
3.28
352.
5427
4.96
2025
359.
5827
5.21
356.
1227
2.56
358.
3127
4.24
2026
365.
9927
4.76
362.
4727
2.12
364.
7027
3.79
2027
372.
8427
4.55
369.
2527
1.90
371.
5227
3.57
2028
381.
7627
5.68
378.
0927
3.02
380.
4127
4.70
2029
391.
2127
6.93
387.
4527
4.26
389.
8327
5.95
2030
400.
8027
8.05
396.
9427
5.38
399.
3827
7.07
2031
409.
7127
8.49
405.
7727
5.81
408.
2627
7.51
2032
418.
5427
8.67
414.
5127
5.99
417.
0627
7.68
Avg
Ann
ual G
row
th20
00-1
113
.0%
10.3
%11
.8%
9.2%
12.7
%10
.0%
2011
-12
9.2%
7.2%
9.2%
7.2%
9.2%
7.2%
2011
-21
2.5%
0.6%
2.5%
0.6%
2.5%
0.6%
2011
-32
2.0%
0.1%
2.0%
0.1%
2.0%
0.1%
* S
ourc
e: F
orm
41,
U.S
. Dep
artm
ent o
f Tra
nspo
rtatio
n.
TAB
LE 1
8
U.S.
MA
INLI
NE A
IR C
AR
RIE
R F
OR
ECA
ST A
SSUM
PTIO
NS
JET
FUEL
PR
ICES

FAA Aerospace Forecast Fiscal Years 2012-2032
100
ALL
-CA
RG
O C
AR
RIE
R R
TMS
P
AS
SE
NG
ER
CA
RR
IER
RTM
STO
TAL
RTM
SFI
SC
AL
(Mill
ions
)(M
illio
ns)
(Mill
ions
)Y
EA
RD
OM
ES
TIC
INT'
L.TO
TAL
DO
ME
STI
CIN
T'L.
TOTA
LD
OM
ES
TIC
INT'
L.TO
TAL
His
toric
al*
2000
10,2
83.5
7,57
3.1
17,8
56.6
4,41
5.2
7,78
4.6
12,1
99.9
14,6
98.7
15,3
57.8
30,0
56.5
2005
13,0
07.9
14,5
81.2
27,5
89.0
3,08
1.7
8,54
7.7
11,6
29.5
16,0
89.6
23,1
28.9
39,2
18.5
2006
12,4
81.2
15,4
75.2
27,9
56.4
3,22
9.4
8,48
3.5
11,7
12.8
15,7
10.5
23,9
58.7
39,6
69.2
2007
12,7
95.2
16,1
64.4
28,9
59.6
3,02
2.8
8,05
0.0
11,0
72.8
15,8
18.0
24,2
14.4
40,0
32.4
2008
12,2
57.7
15,5
87.4
27,8
45.1
2,15
2.9
9,02
7.0
11,1
79.9
14,4
10.5
24,6
14.4
39,0
25.0
2009
10,2
66.1
13,2
06.4
23,4
72.5
1,63
3.9
5,89
8.6
7,53
2.5
11,9
00.0
19,1
05.0
31,0
05.0
2010
11,2
12.3
15,9
66.6
27,1
79.0
1,62
0.9
7,12
8.0
8,74
8.9
12,8
33.2
23,0
94.6
35,9
27.9
2011
E10
,550
.717
,437
.127
,987
.81,
497.
77,
766.
29,
263.
912
,048
.425
,203
.337
,251
.7
Fore
cast
2012
10,2
77.3
18,9
06.4
29,1
83.6
1,44
5.4
8,30
2.7
9,74
8.1
11,7
22.7
27,2
09.0
38,9
31.7
2013
10,3
77.0
20,5
56.4
30,9
33.3
1,44
6.0
8,90
0.1
10,3
46.1
11,8
22.9
29,4
56.5
41,2
79.4
2014
10,9
31.5
22,4
25.9
33,3
57.4
1,50
9.1
9,57
1.9
11,0
81.0
12,4
40.6
31,9
97.8
44,4
38.4
2015
11,4
43.3
24,3
52.4
35,7
95.7
1,56
4.9
10,2
46.1
11,8
11.1
13,0
08.3
34,5
98.5
47,6
06.8
2016
11,7
61.1
26,2
36.6
37,9
97.7
1,59
3.2
10,8
80.7
12,4
73.9
13,3
54.3
37,1
17.3
50,4
71.6
2017
11,9
51.6
28,0
69.3
40,0
21.0
1,60
3.6
11,4
72.9
13,0
76.6
13,5
55.3
39,5
42.3
53,0
97.5
2018
12,0
58.0
29,9
12.9
41,9
70.8
1,60
2.4
12,0
49.1
13,6
51.5
13,6
60.4
41,9
62.0
55,6
22.4
2019
12,2
22.8
31,8
30.5
44,0
53.3
1,60
8.6
12,6
34.4
14,2
43.0
13,8
31.5
44,4
64.9
58,2
96.4
2020
12,4
48.3
33,8
18.5
46,2
66.8
1,62
2.4
13,2
26.4
14,8
48.8
14,0
70.7
47,0
44.9
61,1
15.6
2021
12,5
84.9
35,8
32.5
48,4
17.4
1,62
4.1
13,8
06.9
15,4
31.0
14,2
09.1
49,6
39.3
63,8
48.4
2022
12,7
71.9
37,9
33.2
50,7
05.2
1,63
2.0
14,3
98.8
16,0
30.8
14,4
03.9
52,3
32.1
66,7
36.0
2023
13,0
16.1
40,1
23.3
53,1
39.4
1,64
6.7
15,0
02.0
16,6
48.7
14,6
62.8
55,1
25.3
69,7
88.1
2024
13,2
77.0
42,3
94.6
55,6
71.6
1,66
2.8
15,6
12.1
17,2
75.0
14,9
39.8
58,0
06.7
72,9
46.6
2025
13,5
26.7
44,7
59.0
58,2
85.7
1,67
7.0
16,2
32.5
17,9
09.5
15,2
03.8
60,9
91.5
76,1
95.3
2026
13,7
65.5
47,2
06.8
60,9
72.4
1,68
9.3
16,8
58.3
18,5
47.6
15,4
54.8
64,0
65.2
79,5
20.0
2027
13,9
85.6
49,7
50.0
63,7
35.6
1,69
8.7
17,4
92.8
19,1
91.4
15,6
84.3
67,2
42.7
82,9
27.0
2028
14,1
88.6
52,3
77.8
66,5
66.4
1,70
5.5
18,1
30.8
19,8
36.3
15,8
94.0
70,5
08.6
86,4
02.7
2029
14,4
02.3
55,1
18.3
69,5
20.6
1,71
3.1
18,7
81.0
20,4
94.2
16,1
15.4
73,8
99.4
90,0
14.7
2030
14,6
76.1
58,0
06.1
72,6
82.2
1,72
7.3
19,4
53.5
21,1
80.8
16,4
03.4
77,4
59.6
93,8
63.0
2031
14,9
35.1
61,0
04.8
75,9
40.0
1,73
9.2
20,1
34.1
21,8
73.3
16,6
74.3
81,1
39.0
97,8
13.3
2032
15,1
58.5
64,0
87.6
79,2
46.1
1,74
6.3
20,8
12.8
22,5
59.1
16,9
04.8
84,9
00.4
101,
805.
2
Avg
Ann
ual G
row
th20
00-1
10.
2%7.
9%4.
2%-9
.4%
0.0%
-2.5
%-1
.8%
4.6%
2.0%
2011
-12
-2.6
%8.
4%4.
3%-3
.5%
6.9%
5.2%
-2.7
%8.
0%4.
5%20
11-2
11.
8%7.
5%5.
6%0.
8%5.
9%5.
2%1.
7%7.
0%5.
5%20
11-3
21.
7%6.
4%5.
1%0.
7%4.
8%4.
3%1.
6%6.
0%4.
9%*
Sou
rce:
For
m 4
1, U
.S. D
epar
tmen
t of T
rans
porta
tion.
1 Incl
udes
frei
ght/e
xpre
ss a
nd m
ail r
even
ue to
n m
iles
on m
ainl
ine
air c
arrie
rs a
nd re
gion
als/
com
mut
ers.
2 Dom
estic
figu
res
from
200
0 th
roug
h 20
02 e
xclu
de A
irbor
ne E
xpre
ss, I
nc.;
inte
rnat
iona
l fig
ures
for 2
003
and
beyo
nd in
clud
e ne
w
repo
rting
of c
ontra
ct s
ervic
e by
U.S
. car
riers
for f
orei
gn fl
ag c
arrie
rs.
3 Dom
estic
figu
res
from
200
3 an
d be
yond
incl
ude
Airb
orne
Exp
ress
. Inc
.
TAB
LE 1
9
U.S.
CO
MM
ERC
IAL
AIR
CA
RR
IER
S
AIR
CA
RG
O R
EVEN
UE T
ON
MIL
ES1,
2, 3

FAA Aerospace Forecast Fiscal Years 2012-2032
101
FIS
CA
LA
TLA
NTI
CLA
TIN
AM
ER
ICA
PA
CIF
ICO
THE
R IN
TER
NA
TIO
NA
LTO
TAL
YE
AR
(MIL
LIO
NS
)(M
ILLI
ON
S)
(MIL
LIO
NS
)(M
ILLI
ON
S)
(MIL
LIO
NS
)H
isto
rical
*20
005,
416.
81,
791.
27,
543.
81,
088.
715
,840
.5
2005
6,00
6.7
1,88
4.1
9,05
9.1
6,18
0.2
23,1
30.0
2006
6,08
4.1
2,00
4.9
9,56
4.2
6,55
5.6
24,2
08.9
2007
6,12
4.7
2,30
4.2
9,49
7.3
6,76
3.5
24,6
89.7
2008
6,41
5.4
2,33
6.3
9,05
0.0
6,61
9.8
24,4
21.5
2009
5,74
0.1
1,79
3.4
6,85
5.4
4,71
1.2
19,1
00.2
2010
6,86
5.3
1,99
0.6
8,34
8.4
5,86
0.3
23,0
64.5
2011
E7,
235.
51,
805.
89,
105.
47,
056.
525
,203
.3
Fore
cast
2012
7,60
5.8
1,99
0.7
9,91
9.9
7,69
2.6
27,2
09.0
2013
8,04
1.8
2,17
6.1
10,7
58.4
8,48
0.2
29,4
56.5
2014
8,56
4.1
2,38
6.1
11,6
61.5
9,38
6.1
31,9
97.8
2015
9,11
1.9
2,59
6.5
12,5
77.5
10,3
12.6
34,5
98.5
2016
9,63
6.5
2,79
4.7
13,4
61.3
11,2
24.7
37,1
17.3
2017
10,1
42.7
2,97
8.0
14,3
06.9
12,1
14.7
39,5
42.3
2018
10,6
47.6
3,15
5.7
15,1
49.6
13,0
09.0
41,9
62.0
2019
11,1
74.9
3,33
8.5
16,0
21.2
13,9
30.2
44,4
64.9
2020
11,7
24.5
3,52
4.3
16,9
19.9
14,8
76.1
47,0
44.9
2021
12,2
79.0
3,70
5.7
17,8
21.8
15,8
32.8
49,6
39.3
2022
12,8
61.9
3,89
7.8
18,7
61.1
16,8
11.3
52,3
32.1
2023
13,4
78.7
4,10
1.8
19,7
31.2
17,8
13.6
55,1
25.3
2024
14,1
20.7
4,31
4.9
20,7
33.3
18,8
37.8
58,0
06.7
2025
14,7
85.8
4,53
5.4
21,7
78.7
19,8
91.6
60,9
91.5
2026
15,4
74.0
4,76
3.9
22,8
59.9
20,9
67.5
64,0
65.2
2027
16,1
87.4
4,99
9.3
23,9
84.5
22,0
71.5
67,2
42.7
2028
16,9
25.4
5,24
2.4
25,1
43.7
23,1
97.2
70,5
08.6
2029
17,6
93.5
5,49
8.1
26,3
54.8
24,3
53.0
73,8
99.4
2030
18,5
09.3
5,77
2.9
27,6
30.6
25,5
46.8
77,4
59.6
2031
19,3
56.7
6,05
8.1
28,9
55.4
26,7
68.7
81,1
39.0
2032
20,2
28.1
6,35
1.4
30,3
11.9
28,0
09.0
84,9
00.4
Avg
. Ann
ual G
row
th20
00-1
12.
7%0.
1%1.
7%18
.5%
4.3%
2011
-12
5.1%
10.2
%8.
9%9.
0%8.
0%20
11-2
15.
4%7.
5%6.
9%8.
4%7.
0%20
11-3
25.
0%6.
2%5.
9%6.
8%6.
0%*
Sou
rce:
For
m 4
1, U
.S. D
epar
tmen
t of T
rans
porta
tion.
1 Incl
udes
frei
ght/e
xpre
ss a
nd m
ail r
even
ue to
n m
iles
on m
ainl
ine
air c
arrie
rs a
nd re
gion
als/
com
mut
ers.
2 Figu
res
for 2
003
and
beyo
nd in
clud
e ne
w re
porti
ng o
f con
tract
ser
vice
by U
.S. c
arrie
rs fo
r for
eign
flag
car
riers
.
TAB
LE 2
0
U.S.
CO
MM
ERC
IAL
AIR
CA
RR
IER
S
INT
ERNA
TIO
NAL
AIR
CA
RG
O R
EVEN
UE T
ON
MIL
ES B
Y R
EGIO
N1, 2

FAA Aerospace Forecast Fiscal Years 2012-2032
102
TAB
LE 2
1
CA
LEN
DA
RLA
RG
E N
AR
RO
WB
OD
YLA
RG
E W
IDE
BO
DY
LAR
GE
RE
GIO
NA
LTO
TAL
YE
AR
2 E
NG
INE
3 E
NG
INE
4 E
NG
INE
TOTA
L2
EN
GIN
E3
EN
GIN
E4
EN
GIN
ETO
TAL
JETS
JETS
JETS
His
toric
al20
003,
364
385
03,
749
424
169
120
713
4,46
226
4,48
8
2005
3,30
837
03,
345
466
2954
549
3,89
412
3,90
620
063,
302
260
3,32
846
319
4953
13,
859
393,
898
2007
3,35
429
03,
383
477
1247
536
3,91
964
3,98
320
083,
170
101
3,18
147
09
4452
33,
704
913,
795
2009
3,10
99
23,
120
447
942
498
3,61
892
3,71
020
103,
127
101
3,13
847
19
4352
33,
661
903,
751
2011
E3,
112
91
3,12
247
67
4152
43,
646
933,
739
Fore
cast
2012
3,00
49
13,
014
495
541
541
3,55
597
3,65
220
133,
011
91
3,02
151
53
4155
93,
580
102
3,68
220
143,
034
91
3,04
453
31
4157
53,
619
110
3,72
920
153,
088
91
3,09
855
50
4159
63,
694
117
3,81
120
163,
139
91
3,14
959
40
3763
13,
780
125
3,90
5
2017
3,17
16
13,
178
617
020
637
3,81
513
33,
948
2018
3,22
66
13,
233
649
013
662
3,89
513
74,
032
2019
3,29
75
13,
303
681
011
692
3,99
512
74,
122
2020
3,35
14
13,
356
708
09
717
4,07
312
74,
200
2021
3,41
94
03,
423
737
07
744
4,16
712
74,
294
2022
3,48
23
03,
485
763
05
768
4,25
312
74,
380
2023
3,56
91
03,
570
795
02
797
4,36
712
84,
495
2024
3,63
91
03,
640
821
00
821
4,46
112
84,
589
2025
3,72
40
03,
724
853
00
853
4,57
712
84,
705
2026
3,79
50
03,
795
878
00
878
4,67
312
54,
798
2027
3,87
00
03,
870
914
00
914
4,78
412
04,
904
2028
3,98
90
03,
989
939
00
939
4,92
811
55,
043
2029
4,06
00
04,
060
983
00
983
5,04
311
05,
153
2030
4,14
50
04,
145
1,02
60
01,
026
5,17
110
55,
276
2031
4,24
00
04,
240
1,06
40
01,
064
5,30
410
05,
404
2032
4,32
50
04,
325
1,10
30
01,
103
5,42
810
05,
528
Avg
Ann
ual G
row
th20
00-1
1-0
.7%
-28.
9%N
/A-1
.7%
1.1%
-25.
1%-9
.8%
-2.8
%-1
.8%
12.3
%-1
.6%
2011
-12
-3.5
%0.
0%0.
0%-3
.5%
4.0%
-28.
6%0.
0%3.
2%-2
.5%
4.3%
-2.3
%20
11-2
10.
9%-7
.8%
-100
.0%
0.9%
4.5%
-100
.0%
-16.
2%3.
6%1.
3%3.
2%1.
4%20
11-3
21.
6%-1
00.0
%-1
00.0
%1.
6%4.
1%-1
00.0
%-1
00.0
%3.
6%1.
9%0.
3%1.
9%
U.S.
MA
INLI
NE A
IR C
AR
RIE
RS
PASS
ENG
ER J
ET A
IRC
RA
FT

FAA Aerospace Forecast Fiscal Years 2012-2032
103
TAB
LE 2
2
CA
LEN
DA
RLA
RG
E N
AR
RO
WB
OD
YLA
RG
E W
IDE
BO
DY
YE
AR
2 E
NG
INE
3 E
NG
INE
4 E
NG
INE
TOTA
L2
EN
GIN
E3
EN
GIN
E4
EN
GIN
ETO
TAL
TOTA
LH
isto
rical
2000
166
332
176
674
164
158
6839
01,
064
2005
164
233
9048
724
619
375
514
1,00
120
0616
222
078
460
264
208
8055
21,
012
2007
162
162
7539
927
621
386
575
974
2008
161
143
6837
227
621
597
588
960
2009
160
104
3329
725
320
982
544
841
2010
153
104
3128
826
520
097
562
850
2011
E17
594
2729
628
120
498
583
879
Fore
cast
2012
178
9127
296
290
204
9859
288
820
1318
879
2329
029
720
710
060
489
420
1419
867
1828
331
020
710
161
890
120
1520
956
1427
933
920
510
364
792
620
1622
143
1227
635
619
910
265
793
3
2017
231
2610
267
373
194
104
671
938
2018
246
138
267
392
188
104
684
951
2019
266
75
278
411
185
105
701
979
2020
281
53
289
430
180
105
715
1,00
420
2129
43
129
844
917
610
773
21,
030
2022
308
20
310
464
171
106
741
1,05
120
2332
10
032
148
216
810
975
91,
080
2024
335
00
335
502
159
112
773
1,10
820
2534
50
034
552
315
211
579
01,
135
2026
357
00
357
541
145
118
804
1,16
1
2027
369
00
369
556
147
118
821
1,19
020
2838
10
038
156
814
712
183
61,
217
2029
391
00
391
582
149
125
856
1,24
720
3040
40
040
459
615
012
887
41,
278
2031
415
00
415
614
152
132
898
1,31
320
3242
70
042
763
115
213
591
81,
345
Avg
Ann
ual G
row
th20
00-1
10.
5%-1
0.8%
-15.
7%-7
.2%
5.0%
2.4%
3.4%
3.7%
-1.7
%20
11-1
21.
7%-3
.2%
0.0%
0.0%
3.2%
0.0%
0.0%
1.5%
1.0%
2011
-21
5.3%
-29.
1%-2
8.1%
0.1%
4.8%
-1.5
%0.
9%2.
3%1.
6%20
11-3
24.
3%-1
00.0
%-1
00.0
%1.
8%3.
9%-1
.4%
1.5%
2.2%
2.0%
U.S.
MA
INLI
NE A
IR C
AR
RIE
RS
CA
RG
O J
ET A
IRC
RA
FT

FAA Aerospace Forecast Fiscal Years 2012-2032
104
(Mill
ions
of G
allo
ns)
JET
FUE
LA
VIA
TIO
N G
AS
OLI
NE
TOTA
LFI
SC
AL
U.S
. AIR
CA
RR
IER
S1
GE
NE
RA
LA
IRG
EN
ER
AL
FUE
LY
EA
RD
OM
ES
TIC
INT'
L.TO
TAL
AV
IATI
ON
TOTA
LC
AR
RIE
RA
VIA
TIO
NTO
TAL
CO
NS
UM
ED
His
toric
al*
2000
15,0
305,
484
20,5
1397
221
,485
233
333
521
,350
2005
14,2
216,
059
20,2
811,
527
21,8
072
295
297
22,1
0420
0613
,775
6,18
619
,961
1,64
321
,603
228
328
521
,889
2007
13,8
826,
309
20,1
911,
486
21,6
762
274
276
21,9
5220
0813
,397
6,49
919
,896
1,70
621
,602
224
825
021
,852
2009
11,8
966,
033
17,9
291,
447
19,3
762
227
229
19,6
0620
1011
,973
6,29
018
,263
1,43
519
,698
222
122
319
,921
2011
E12
,036
6,54
718
,583
1,43
320
,017
221
521
720
,233
Fore
cast
2
2012
11,7
646,
579
18,3
431,
651
19,9
942
210
212
20,2
0720
1311
,763
6,70
518
,468
1,74
720
,215
220
821
020
,425
2014
11,7
786,
904
18,6
821,
836
20,5
182
207
209
20,7
2720
1512
,081
7,09
219
,173
1,91
821
,091
220
520
721
,298
2016
12,2
307,
312
19,5
431,
992
21,5
342
203
205
21,7
39
2017
12,3
447,
533
19,8
772,
058
21,9
362
203
205
22,1
4120
1812
,491
7,74
920
,240
2,13
222
,371
220
320
522
,576
2019
12,6
287,
972
20,6
002,
198
22,7
982
203
205
23,0
0320
2012
,786
8,20
320
,989
2,26
823
,257
220
320
523
,462
2021
12,9
298,
435
21,3
642,
327
23,6
912
202
204
23,8
94
2022
13,0
748,
678
21,7
522,
395
24,1
472
203
205
24,3
5120
2313
,245
8,92
622
,171
2,46
824
,638
220
420
624
,844
2024
13,4
129,
185
22,5
972,
543
25,1
402
206
208
25,3
4820
2513
,572
9,45
323
,025
2,62
425
,649
220
720
925
,858
2026
13,7
559,
725
23,4
802,
696
26,1
762
209
211
26,3
86
2027
13,9
449,
996
23,9
402,
770
26,7
102
211
213
26,9
2320
2814
,125
10,2
6824
,393
2,85
027
,244
221
421
627
,459
2029
14,3
0310
,543
24,8
462,
940
27,7
872
216
218
28,0
0420
3014
,487
10,8
2825
,315
3,03
428
,349
221
822
028
,569
2031
14,6
7711
,113
25,7
903,
130
28,9
202
220
222
29,1
4220
3214
,863
11,4
0126
,265
3,23
029
,495
222
322
529
,720
Avg
Ann
ual G
row
th20
00-1
1-2
.0%
1.6%
-0.9
%3.
6%-0
.6%
0.0%
-3.9
%-3
.9%
-0.5
%20
11-1
2-2
.3%
0.5%
-1.3
%15
.2%
-0.1
%0.
0%-2
.0%
-2.0
%-0
.1%
2011
-21
0.7%
2.6%
1.4%
5.0%
1.7%
0.0%
-0.6
%-0
.6%
1.7%
2011
-32
1.0%
2.7%
1.7%
3.9%
1.9%
0.0%
0.2%
0.2%
1.8%
* S
ourc
e: A
ir ca
rrier
jet f
uel,
Form
41,
U.S
. Dep
artm
ent o
f Tra
nspo
rtatio
n; a
ll ot
hers
, FA
A A
PO
est
imat
es.
1 Incl
udes
bot
h pa
ssen
ger (
mai
nlin
e an
d re
gion
al a
ir ca
rrier
) and
car
go c
arrie
rs.
2 Fore
cast
ass
umes
1.5
% a
nnua
l im
prov
emen
t in
AS
Ms/
Gal
lon
for U
.S. C
omm
erci
al A
ir C
arrie
r
TAB
LE 2
3
TOTA
L JE
T FU
EL A
ND A
VIA
TIO
N G
ASO
LINE
FUE
L C
ONS
UMPT
ION
U.S.
CIV
IL A
VIA
TIO
N A
IRC
RA
FT

FAA Aerospace Forecast Fiscal Years 2012-2032
105
RE
VE
NU
E P
ER
AV
ER
AG
E S
EA
TS P
ER
AIR
CR
AFT
MIL
EA
VE
RA
GE
PA
SS
EN
GE
R T
RIP
LE
NG
THFI
SC
AL
DO
ME
STI
CIN
T'L.
SY
STE
MD
OM
ES
TIC
INT'
L.S
YS
TEM
CU
RR
EN
T $
2011
$Y
EA
R(S
eats
/Mile
)(S
eats
/Mile
)(S
eats
/Mile
)(M
iles)
(Mile
s)(M
iles)
(Cen
ts)
(Cen
ts)
His
toric
al*
2000
38.4
41.8
38.5
286.
526
0.0
285.
530
.28
39.0
0
2005
48.6
52.4
48.7
434.
743
4.2
434.
719
.70
22.7
020
0649
.352
.249
.445
0.4
467.
245
0.7
19.8
422
.06
2007
49.9
54.0
50.0
451.
551
8.1
452.
919
.95
21.6
720
0852
.953
.453
.046
0.8
532.
746
2.3
21.0
421
.88
2009
55.2
52.8
55.1
456.
951
2.3
457.
817
.04
17.7
820
1056
.153
.256
.146
4.3
502.
946
5.0
15.6
416
.04
2011
E56
.453
.556
.346
8.3
530.
246
9.2
15.6
815
.68
Fore
cast
2012
56.9
53.8
56.8
470.
053
5.2
470.
916
.14
15.8
320
1357
.354
.157
.347
4.0
540.
247
5.0
16.4
415
.85
2014
57.8
54.4
57.7
476.
154
5.2
477.
116
.83
15.8
920
1558
.254
.758
.247
8.4
550.
247
9.4
17.1
915
.91
2016
58.7
55.0
58.6
482.
255
5.2
483.
317
.58
15.9
2
2017
59.1
55.3
59.1
486.
156
0.2
487.
117
.91
15.8
920
1859
.655
.659
.549
0.0
565.
249
1.0
18.0
715
.71
2019
60.1
55.9
60.0
493.
957
0.2
495.
018
.24
15.5
720
2060
.556
.260
.449
8.8
575.
249
9.9
18.3
615
.40
2021
61.0
56.5
60.9
503.
858
0.2
504.
918
.48
15.2
2
2022
61.5
56.8
61.4
508.
858
5.2
509.
918
.60
15.0
420
2361
.957
.161
.951
3.9
590.
251
5.0
18.7
014
.85
2024
62.4
57.4
62.3
519.
159
5.2
520.
218
.85
14.7
020
2562
.957
.762
.852
4.3
600.
252
5.4
19.0
214
.56
2026
63.4
58.0
63.3
530.
560
5.2
531.
619
.15
14.3
7
2027
63.9
58.3
63.8
536.
961
0.2
538.
019
.27
14.1
920
2864
.458
.664
.354
3.4
615.
254
4.4
19.4
014
.01
2029
64.9
58.9
64.8
549.
962
0.2
550.
919
.54
13.8
320
3065
.459
.265
.355
6.5
625.
255
7.5
19.7
013
.67
2031
65.9
59.5
65.8
563.
263
0.2
564.
119
.87
13.5
020
3266
.459
.866
.356
9.9
635.
257
0.9
20.0
413
.34
A
vg A
nnua
l Gro
wth
2000
-11
3.5%
2.3%
3.5%
4.6%
6.7%
4.6%
-5.8
%-8
.0%
2011
-12
0.9%
0.6%
0.9%
0.4%
0.9%
0.4%
2.9%
1.0%
2011
-21
0.8%
0.5%
0.8%
0.7%
0.9%
0.7%
1.7%
-0.3
%20
11-3
20.
8%0.
5%0.
8%0.
9%0.
9%0.
9%1.
2%-0
.8%
* S
ourc
e: F
orm
41
and
298C
, U.S
. Dep
artm
ent o
f Tra
nspo
rtatio
n.
** R
epor
ting
carri
ers.
TAB
LE 2
4
PA
SS
EN
GE
R M
ILE
**
U.S.
REG
IONA
L C
AR
RIE
R F
OR
ECA
ST A
SSUM
PTIO
NS

FAA Aerospace Forecast Fiscal Years 2012-2032
106
(In M
illio
ns)
FIS
CA
L R
EV
EN
UE
PA
SS
EN
GE
RS
RE
VE
NU
E P
AS
SE
NG
ER
MIL
ES
YE
AR
DO
ME
STI
CIN
TER
NA
TIO
NA
LS
YS
TEM
DO
ME
STI
CIN
TER
NA
TIO
NA
LS
YS
TEM
His
toric
al*
2000
79.7
3.1
82.8
22,8
2581
423
,639
2005
146.
43.
314
9.7
63,6
541,
417
65,0
7120
0615
2.2
3.5
155.
768
,532
1,63
470
,166
2007
156.
23.
415
9.6
70,5
281,
772
72,3
0020
0815
9.1
3.5
162.
673
,305
1,86
775
,172
2009
154.
02.
515
6.6
70,3
741,
304
71,6
7820
1016
1.6
2.7
164.
375
,053
1,34
776
,400
2011
E16
1.3
2.4
163.
675
,510
1,26
076
,770
Fore
cast
2012
162.
42.
416
4.8
76,3
371,
281
77,6
1820
1316
3.5
2.4
165.
977
,491
1,30
178
,792
2014
167.
42.
516
9.9
79,7
221,
345
81,0
6820
1517
5.5
2.6
178.
183
,973
1,42
385
,396
2016
181.
32.
718
3.9
87,4
051,
483
88,8
88
2017
186.
02.
718
8.7
90,4
081,
535
91,9
4320
1819
0.8
2.8
193.
693
,494
1,58
995
,083
2019
195.
72.
919
8.6
96,6
681,
645
98,3
1220
2020
1.0
3.0
204.
010
0,25
61,
704
101,
959
2021
205.
93.
020
9.0
103,
741
1,76
010
5,50
2
2022
211.
03.
121
4.1
107,
371
1,82
010
9,19
120
2321
6.6
3.2
219.
811
1,33
31,
884
113,
217
2024
222.
33.
322
5.5
115,
375
1,94
911
7,32
420
2522
7.9
3.4
231.
311
9,47
62,
016
121,
491
2026
233.
73.
423
7.2
124,
014
2,08
512
6,09
9
2027
239.
83.
524
3.3
128,
727
2,15
613
0,88
220
2824
5.7
3.6
249.
313
3,51
12,
227
135,
739
2029
251.
73.
725
5.4
138,
411
2,30
014
0,71
220
3025
8.0
3.8
261.
814
3,56
42,
377
145,
941
2031
264.
53.
926
8.4
148,
941
2,45
615
1,39
720
3227
1.0
4.0
275.
015
4,45
22,
537
156,
988
A
vg A
nnua
l Gro
wth
2000
-11
6.6%
-2.5
%6.
4%11
.5%
4.1%
11.3
%20
11-1
20.
7%0.
7%0.
7%1.
1%1.
7%1.
1%20
11-2
12.
5%2.
5%2.
5%3.
2%3.
4%3.
2%20
11-3
22.
5%2.
5%2.
5%3.
5%3.
4%3.
5%*
Sou
rce:
For
m 4
1 an
d 29
8C, U
.S. D
epar
tmen
t of T
rans
porta
tion.TA
BLE
25
U.S.
REG
IONA
L C
AR
RIE
RS
SCHE
DUL
ED P
ASS
ENG
ER T
RA
FFIC

FAA Aerospace Forecast Fiscal Years 2012-2032
107
DO
ME
STI
CIN
TER
NA
TIO
NA
LS
YS
TEM
FIS
CA
LA
SM
sR
PM
s%
LO
AD
AS
Ms
RP
Ms
% L
OA
DA
SM
sR
PM
s%
LO
AD
YE
AR
(MIL
)(M
IL)
FAC
TOR
(MIL
)(M
IL)
FAC
TOR
(MIL
)(M
IL)
FAC
TOR
His
toric
al*
2000
38,3
3222
,825
59.5
1,33
881
460
.839
,670
23,6
3959
.6
2005
90,0
2863
,654
70.7
2,21
31,
417
64.0
92,2
4065
,071
70.5
2006
91,4
5868
,532
74.9
2,38
71,
634
68.5
93,8
4570
,166
74.8
2007
93,4
5270
,528
75.5
2,55
01,
772
69.5
96,0
0272
,300
75.3
2008
99,4
6973
,305
73.7
2,63
21,
867
70.9
102,
101
75,1
7273
.620
0994
,664
70,3
7474
.31,
859
1,30
470
.296
,523
71,6
7874
.320
1098
,489
75,0
5376
.21,
857
1,34
772
.510
0,34
676
,400
76.1
2011
E99
,062
75,5
1076
.21,
802
1,26
069
.910
0,86
476
,770
76.1
Fore
cast
2012
98,5
7176
,337
77.4
1,81
91,
281
70.4
100,
391
77,6
1877
.320
1399
,353
77,4
9178
.01,
835
1,30
170
.910
1,18
978
,792
77.9
2014
102,
159
79,7
2278
.01,
884
1,34
571
.410
4,04
381
,068
77.9
2015
107,
552
83,9
7378
.11,
979
1,42
371
.910
9,53
185
,396
78.0
2016
111,
895
87,4
0578
.12,
048
1,48
372
.411
3,94
388
,888
78.0
2017
115,
688
90,4
0878
.12,
106
1,53
572
.911
7,79
491
,943
78.1
2018
119,
587
93,4
9478
.22,
165
1,58
973
.412
1,75
295
,083
78.1
2019
123,
599
96,6
6878
.22,
225
1,64
573
.912
5,82
598
,312
78.1
2020
128,
140
100,
256
78.2
2,28
91,
704
74.4
130,
429
101,
959
78.2
2021
132,
549
103,
741
78.3
2,35
01,
760
74.9
134,
899
105,
502
78.2
2022
137,
142
107,
371
78.3
2,41
31,
820
75.4
139,
555
109,
191
78.2
2023
142,
159
111,
333
78.3
2,48
21,
884
75.9
144,
641
113,
217
78.3
2024
147,
277
115,
375
78.3
2,55
11,
949
76.4
149,
828
117,
324
78.3
2025
152,
469
119,
476
78.4
2,62
12,
016
76.9
155,
090
121,
491
78.3
2026
158,
220
124,
014
78.4
2,70
22,
085
77.2
160,
921
126,
099
78.4
2027
164,
191
128,
727
78.4
2,78
52,
156
77.4
166,
976
130,
882
78.4
2028
170,
253
133,
511
78.4
2,86
82,
227
77.7
173,
122
135,
739
78.4
2029
176,
461
138,
411
78.4
2,95
32,
300
77.9
179,
414
140,
712
78.4
2030
182,
991
143,
564
78.5
3,04
72,
377
78.0
186,
038
145,
941
78.4
2031
189,
805
148,
941
78.5
3,14
42,
456
78.1
192,
950
151,
397
78.5
2032
196,
789
154,
452
78.5
3,24
32,
537
78.2
200,
033
156,
988
78.5
Avg
Ann
ual G
row
th20
00-1
19.
0%11
.5%
2.3%
2.7%
4.1%
1.3%
8.9%
11.3
%2.
3%20
11-1
2-0
.5%
1.1%
1.6%
1.0%
1.7%
0.7%
-0.5
%1.
1%1.
6%20
11-2
13.
0%3.
2%0.
3%2.
7%3.
4%0.
7%3.
0%3.
2%0.
3%20
11-3
23.
3%3.
5%0.
1%2.
8%3.
4%0.
5%3.
3%3.
5%0.
1%*
Sou
rce:
For
m 4
1 an
d 29
8C, U
.S. D
epar
tmen
t of T
rans
porta
tion.
TAB
LE 2
6
U.S.
REG
IONA
L C
AR
RIE
RS
SCHE
DUL
ED P
ASS
ENG
ER C
APA
CIT
Y, T
RA
FFIC
, AND
LO
AD
FA
CTO
RS

FAA Aerospace Forecast Fiscal Years 2012-2032
108
TAB
LE 2
7
RE
GIO
NA
L A
IRC
RA
FTA
S O
FLE
SS
TH
AN
10 T
O 1
920
TO
30
31 T
O 4
0 S
EA
TSO
VE
R 4
0 S
EA
TSTO
TAL
FLE
ET
JAN
UA
RY
19
SE
ATS
SE
ATS
SE
ATS
PR
OP
JET
TOTA
LP
RO
PJE
T**
TOTA
LN
ON
JE
TJE
TTO
TAL
His
toric
al*
2000
470
343
262
474
7454
815
549
665
11,
704
570
2,27
4
2005
449
220
9925
396
349
811,
581
1,66
21,
102
1,67
72,
779
2006
453
204
8822
492
316
871,
584
1,67
11,
056
1,67
62,
732
2007
453
172
7922
891
319
101
1,65
61,
757
1,03
31,
747
2,78
020
0845
110
768
180
2520
512
11,
730
1,85
192
71,
755
2,68
220
0946
610
365
153
2918
211
51,
722
1,83
790
21,
751
2,65
320
1044
092
8214
428
172
991,
728
1,82
785
71,
756
2,61
320
11E
481
9467
113
2113
410
51,
686
1,79
186
01,
707
2,56
7
Fore
cast
2012
457
8663
113
611
911
21,
711
1,82
383
11,
717
2,54
820
1343
084
6111
26
118
118
1,74
61,
864
805
1,75
22,
557
2014
399
8159
110
311
312
81,
806
1,93
477
71,
809
2,58
620
1537
278
5710
80
108
139
1,86
01,
999
754
1,86
02,
614
2016
327
7555
106
010
615
01,
835
1,98
571
31,
835
2,54
8
2017
317
7252
105
010
516
01,
836
1,99
670
61,
836
2,54
220
1830
769
5010
30
103
171
1,83
92,
010
700
1,83
92,
539
2019
296
6648
100
010
018
41,
832
2,01
669
41,
832
2,52
620
2028
663
4698
098
195
1,83
22,
027
688
1,83
22,
520
2021
274
6044
940
9420
51,
837
2,04
267
71,
837
2,51
4
2022
260
5742
890
8921
61,
841
2,05
766
41,
841
2,50
520
2324
854
4085
085
226
1,85
22,
078
653
1,85
22,
505
2024
237
5238
810
8123
51,
867
2,10
264
31,
867
2,51
020
2522
349
3676
076
246
1,90
52,
151
630
1,90
52,
535
2026
210
4634
720
7225
71,
959
2,21
661
91,
959
2,57
8
2027
201
4432
690
6926
62,
024
2,29
061
22,
024
2,63
620
2818
841
3065
065
276
2,09
72,
373
600
2,09
72,
697
2029
177
3928
610
6128
72,
172
2,45
959
22,
172
2,76
420
3016
536
2657
057
297
2,25
02,
547
581
2,25
02,
831
2031
155
3425
530
5330
72,
335
2,64
257
42,
335
2,90
920
3214
331
2349
049
318
2,41
62,
734
564
2,41
62,
980
Avg
Ann
ual G
row
th20
00-1
10.
2%-1
1.1%
-11.
7%-1
2.2%
-10.
8%-1
2.0%
-3.5
%11
.8%
9.6%
-6.0
%10
.5%
1.1%
2011
-12
-5.0
%-8
.5%
-6.0
%0.
0%-7
1.4%
-11.
2%6.
7%1.
5%1.
8%-3
.4%
0.6%
-0.7
%20
11-2
1-5
.5%
-4.4
%-4
.1%
-1.8
%-1
00.0
%-3
.5%
6.9%
0.9%
1.3%
-2.4
%0.
7%-0
.2%
2011
-32
-5.6
%-5
.1%
-5.0
%-3
.9%
-100
.0%
-4.7
%5.
4%1.
7%2.
0%-2
.0%
1.7%
0.7%
*Sou
rce:
The
Vel
ocity
Gro
up fo
r the
Reg
iona
l Airl
ine
Ass
ocia
tion
thro
ugh
2004
.**
Inde
pend
ence
Air
A31
9 ai
rcra
ft ar
e in
clud
ed in
Tab
le 2
0 - U
.S. M
ainl
ine
Air
Car
riers
Pas
seng
er J
et A
ircra
ft.
U.S.
REG
IONA
L C
AR
RIE
RS
PASS
ENG
ER A
IRC
RA
FT

FAA Aerospace Forecast Fiscal Years 2012-2032
109
FIXE
D W
ING
TOTA
LP
ISTO
NG
EN
ER
AL
AS
OF
SIN
GLE
MU
LTI-
TUR
BO
TUR
BO
RO
TOR
CR
AFT
EXP
ER
I-S
PO
RT
AV
IATI
ON
TOTA
LTO
TAL
DE
C. 3
1E
NG
INE
EN
GIN
ETO
TAL
PR
OP
JET
TOTA
LP
ISTO
NTU
RB
INE
TOTA
LM
EN
TAL
AIR
CR
AFT
OTH
ER
FLE
ET
PIS
TON
STU
RB
INE
SH
isto
rical
*20
0014
9,42
221
,091
170,
513
5,76
27,
001
12,7
632,
680
4,47
07,
150
20,4
07N
A6,
700
217,
533
173,
193
17,2
33
2005
148,
101
19,4
1216
7,51
37,
942
9,82
317
,765
3,03
95,
689
8,72
823
,627
170
6,45
422
4,25
717
0,55
223
,454
2006
145,
036
18,7
0816
3,74
48,
063
10,3
7918
,442
3,26
45,
895
9,15
923
,047
1,27
36,
277
221,
942
167,
008
24,3
3720
0714
7,56
919
,337
166,
906
9,51
410
,385
19,8
992,
769
6,79
89,
567
23,2
286,
066
5,94
023
1,60
616
9,67
526
,697
2008
145,
497
17,5
1516
3,01
28,
907
11,0
4219
,949
3,49
86,
378
9,87
623
,364
6,81
15,
652
228,
664
166,
510
26,3
2720
0914
0,64
916
,474
157,
123
9,05
511
,268
20,3
233,
499
6,48
59,
984
24,4
196,
547
5,48
022
3,87
616
0,62
226
,808
2010
139,
519
15,9
0015
5,41
99,
369
11,4
8420
,853
3,58
86,
514
10,1
0224
,784
6,52
85,
684
223,
370
159,
007
27,3
6720
11E
138,
560
15,8
1015
4,37
09,
430
11,7
6021
,190
3,68
56,
725
10,4
1024
,225
6,64
55,
680
222,
520
158,
055
27,9
15
Fore
cast
2012
137,
600
15,7
3515
3,33
59,
505
12,0
5021
,555
3,78
06,
940
10,7
2024
,480
6,93
05,
670
222,
690
157,
115
28,4
9520
1313
6,65
015
,660
152,
310
9,57
012
,410
21,9
803,
875
7,16
511
,040
24,8
107,
180
5,66
522
2,98
515
6,18
529
,145
2014
135,
790
15,6
1515
1,40
59,
645
12,8
3522
,480
3,97
57,
415
11,3
9025
,170
7,36
55,
655
223,
465
155,
380
29,8
9520
1513
5,01
015
,570
150,
580
9,72
013
,340
23,0
604,
075
7,67
511
,750
25,5
007,
530
5,65
022
4,07
015
4,65
530
,735
2016
134,
285
15,5
0014
9,78
59,
795
13,8
8023
,675
4,16
57,
930
12,0
9525
,835
7,69
05,
640
224,
720
153,
950
31,6
05
2017
133,
650
15,4
2514
9,07
59,
870
14,4
7024
,340
4,25
08,
180
12,4
3026
,165
7,84
55,
635
225,
490
153,
325
32,5
2020
1813
3,09
015
,340
148,
430
9,95
015
,060
25,0
104,
335
8,43
512
,770
26,5
008,
000
5,63
022
6,34
015
2,76
533
,445
2019
132,
645
15,2
6014
7,90
510
,030
15,6
5025
,680
4,42
08,
685
13,1
0526
,830
8,16
05,
625
227,
305
152,
325
34,3
6520
2013
2,33
515
,175
147,
510
10,1
2016
,265
26,3
854,
505
8,94
013
,445
27,1
608,
315
5,61
522
8,43
015
2,01
535
,325
2021
132,
125
15,0
9014
7,21
510
,205
16,9
1527
,120
4,59
09,
200
13,7
9027
,490
8,47
05,
610
229,
695
151,
805
36,3
20
2022
132,
010
15,0
1014
7,02
010
,300
17,6
2027
,920
4,68
09,
465
14,1
4527
,825
8,63
05,
605
231,
145
151,
700
37,3
8520
2313
1,97
514
,935
146,
910
10,4
0018
,370
28,7
704,
775
9,74
514
,520
28,1
558,
785
5,60
023
2,74
015
1,68
538
,515
2024
132,
015
14,8
7514
6,89
010
,515
19,1
7029
,685
4,87
510
,040
14,9
1528
,490
8,94
05,
590
234,
510
151,
765
39,7
2520
2513
2,15
014
,815
146,
965
10,6
2520
,020
30,6
454,
975
10,3
4515
,320
28,8
209,
100
5,58
523
6,43
515
1,94
040
,990
2026
132,
370
14,7
4514
7,11
510
,740
20,8
6531
,605
5,07
510
,650
15,7
2529
,150
9,25
55,
580
238,
430
152,
190
42,2
55
2027
132,
660
14,6
8014
7,34
010
,860
21,7
6032
,620
5,18
010
,965
16,1
4529
,480
9,41
05,
575
240,
570
152,
520
43,5
8520
2813
3,02
014
,610
147,
630
10,9
7522
,700
33,6
755,
285
11,2
7516
,560
29,8
159,
570
5,57
024
2,82
015
2,91
544
,950
2029
133,
470
14,5
4014
8,01
011
,090
23,6
9034
,780
5,39
011
,590
16,9
8030
,145
9,72
55,
560
245,
200
153,
400
46,3
7020
3013
4,00
014
,470
148,
470
11,2
0524
,730
35,9
355,
495
11,9
0517
,400
30,4
809,
880
5,55
524
7,72
015
3,96
547
,840
2031
134,
625
14,4
0514
9,03
011
,320
25,8
0537
,125
5,60
012
,225
17,8
2530
,810
10,0
405,
550
250,
380
154,
630
49,3
5020
3213
5,34
014
,350
149,
690
11,4
4526
,935
38,3
805,
705
12,5
5018
,255
31,1
4010
,195
5,54
525
3,20
515
5,39
550
,930
Avg
Ann
ual G
row
th20
00-1
1-0
.7%
-2.6
%-0
.9%
4.6%
4.8%
4.7%
2.9%
3.8%
3.5%
1.6%
NA
-1.5
%0.
2%-0
.8%
4.5%
2011
-12
-0.7
%-0
.5%
-0.7
%0.
8%2.
5%1.
7%2.
6%3.
2%3.
0%1.
1%4.
3%-0
.2%
0.1%
-0.6
%2.
1%20
11-2
1-0
.5%
-0.5
%-0
.5%
0.8%
3.7%
2.5%
2.2%
3.2%
2.9%
1.3%
2.5%
-0.1
%0.
3%-0
.4%
2.7%
2011
-32
-0.1
%-0
.5%
-0.1
%0.
9%4.
0%2.
9%2.
1%3.
0%2.
7%1.
2%2.
1%-0
.1%
0.6%
-0.1
%2.
9%*
Sou
rce:
200
0-20
10, F
AA
Gen
eral
Avia
tion
and
Air
Taxi
Act
ivity
(and
Avio
nics
) Sur
veys
.N
ote:
An
activ
e ai
rcra
ft is
one
that
has
a c
urre
nt re
gist
ratio
n an
d w
as fl
own
at le
ast o
ne h
our d
urin
g th
e ca
lend
ar y
ear.
TUR
BIN
E
TAB
LE 2
8
AC
TIVE
GEN
ERA
L A
VIA
TIO
N A
ND A
IR T
AXI
AIR
CR
AFT

FAA Aerospace Forecast Fiscal Years 2012-2032
110
FIXE
D W
ING
TOTA
LP
ISTO
NG
EN
ER
AL
CA
LEN
DA
RS
ING
LEM
ULT
I-TU
RB
OTU
RB
OR
OTO
RC
RA
FTE
XPE
RI-
SP
OR
TA
VIA
TIO
N
TOTA
L TO
TAL
YE
AR
EN
GIN
EE
NG
INE
TOTA
LP
RO
PJE
TTO
TAL
PIS
TON
TUR
BIN
ETO
TAL
ME
NTA
LA
IRC
RA
FTO
THE
RH
OU
RS
PIS
TON
STU
RB
INE
SH
isto
rical
*20
0018
,089
3,40
021
,489
1,98
62,
755
4,74
153
01,
661
2,19
11,
307
NA
374
30,1
0222
,019
6,40
2
2005
13,7
392,
677
16,4
162,
106
3,77
15,
877
617
2,43
93,
056
1,33
99
267
26,9
6417
,032
8,31
620
0613
,976
2,55
016
,525
2,16
24,
077
6,24
091
82,
528
3,44
61,
218
6621
127
,705
17,4
438,
767
2007
13,5
712,
686
16,2
572,
661
3,93
86,
600
704
2,54
13,
245
1,27
526
021
527
,852
16,9
629,
141
2008
12,7
462,
328
15,0
742,
457
3,60
06,
057
751
2,47
03,
222
1,15
529
320
926
,009
15,8
258,
527
2009
11,7
301,
903
13,6
342,
215
3,16
15,
376
755
2,24
83,
003
1,28
628
617
823
,763
14,3
897,
624
2010
12,1
611,
818
13,9
792,
325
3,37
55,
700
794
2,61
13,
405
1,22
631
118
124
,802
14,7
738,
311
2011
E11
,841
1,78
013
,621
2,32
43,
394
5,71
878
92,
561
3,35
01,
211
317
181
24,3
9714
,410
8,27
9
Fore
cast
2012
11,3
911,
776
13,1
672,
409
4,03
76,
445
812
2,55
03,
362
1,23
633
718
224
,728
13,9
788,
996
2013
11,0
911,
758
12,8
492,
471
4,33
06,
801
834
2,61
13,
445
1,31
535
618
324
,949
13,6
839,
413
2014
10,8
201,
744
12,5
642,
523
4,60
57,
128
858
2,67
43,
532
1,40
137
218
325
,180
13,4
229,
802
2015
10,5
941,
728
12,3
222,
554
4,86
57,
419
881
2,73
93,
620
1,46
238
818
425
,396
13,2
0410
,158
2016
10,4
091,
703
12,1
122,
591
5,10
67,
697
903
2,81
93,
722
1,52
540
418
525
,645
13,0
1510
,516
2017
10,2
851,
689
11,9
742,
624
5,32
17,
945
924
2,90
33,
827
1,59
142
118
525
,943
12,8
9810
,848
2018
10,2
051,
678
11,8
822,
657
5,55
88,
215
944
2,98
83,
932
1,62
743
818
626
,281
12,8
2711
,203
2019
10,1
501,
668
11,8
172,
685
5,77
48,
459
965
3,07
14,
036
1,66
445
518
726
,619
12,7
8211
,530
2020
10,1
251,
667
11,7
922,
704
6,00
98,
713
986
3,15
64,
142
1,70
247
318
827
,009
12,7
7711
,868
2021
10,0
921,
665
11,7
582,
723
6,25
18,
975
1,00
63,
242
4,24
81,
731
487
188
27,3
8712
,764
12,2
16
2022
10,1
241,
667
11,7
902,
745
6,51
69,
261
1,02
83,
336
4,36
41,
761
501
189
27,8
6612
,819
12,5
9720
2310
,159
1,66
811
,827
2,76
26,
802
9,56
41,
051
3,43
14,
482
1,79
151
519
028
,368
12,8
7812
,995
2024
10,2
471,
673
11,9
202,
782
7,10
29,
884
1,07
53,
531
4,60
61,
821
530
190
28,9
5112
,995
13,4
1520
2510
,391
1,67
512
,066
2,80
27,
420
10,2
221,
099
3,63
64,
736
1,85
154
419
129
,610
13,1
6513
,858
2026
10,5
451,
684
12,2
292,
822
7,72
610
,548
1,12
43,
742
4,86
61,
882
559
192
30,2
7613
,353
14,2
90
2027
10,7
081,
696
12,4
042,
841
8,04
410
,885
1,14
93,
852
5,00
11,
913
574
193
30,9
7013
,553
14,7
3720
2810
,866
1,70
912
,574
2,85
98,
381
11,2
391,
174
3,96
35,
137
1,94
459
019
331
,678
13,7
4915
,202
2029
10,9
971,
719
12,7
172,
879
8,75
311
,632
1,20
04,
076
5,27
51,
975
605
194
32,3
9813
,916
15,7
0720
3011
,145
1,72
912
,874
2,89
79,
149
12,0
461,
225
4,19
15,
416
2,00
762
119
533
,159
14,0
9916
,237
2031
11,3
001,
743
13,0
442,
912
9,55
712
,469
1,25
04,
313
5,56
32,
039
637
196
33,9
4814
,294
16,7
8220
3211
,467
1,76
013
,227
2,93
09,
987
12,9
171,
275
4,43
85,
714
2,07
165
419
734
,779
14,5
0217
,355
Avg
Ann
ual G
row
th20
00-1
1-3
.8%
-5.7
%-4
.1%
1.4%
1.9%
1.7%
3.7%
4.0%
3.9%
-0.7
%N
A-6
.4%
-1.9
%-3
.8%
2.4%
2011
-12
-3.8
%-0
.2%
-3.3
%3.
6%18
.9%
12.7
%2.
8%-0
.4%
0.4%
2.1%
6.3%
0.4%
1.4%
-3.0
%8.
7%20
11-2
1-1
.6%
-0.7
%-1
.5%
1.6%
6.3%
4.6%
2.5%
2.4%
2.4%
3.6%
4.4%
0.4%
1.2%
-1.2
%4.
0%20
11-3
2-0
.2%
-0.1
%-0
.1%
1.1%
5.3%
4.0%
2.3%
2.7%
2.6%
2.6%
3.5%
0.4%
1.7%
0.0%
3.6%
* S
ourc
e: 2
000-
2010
, FA
A G
ener
al A
viatio
n an
d A
ir Ta
xi A
ctivi
ty (a
nd A
vioni
cs) S
urve
ys.
Not
e: A
n ac
tive
airc
raft
is o
ne th
at h
as a
cur
rent
regi
stra
tion
and
was
flow
n at
leas
t one
hou
r dur
ing
the
prev
ious
cal
enda
r yea
r.
TUR
BIN
E
TAB
LE 2
9
AC
TIVE
GEN
ERA
L A
VIA
TIO
N A
ND A
IR T
AXI
HO
URS
FLO
WN
(In T
hous
ands
)

FAA Aerospace Forecast Fiscal Years 2012-2032
111
TAB
LE 3
0
RO
TOR
-TO
TAL
INS
TRU
ME
NT
AS
OF
RE
CR
EA
-S
PO
RT
AIR
LIN
EC
RA
FTG
LID
ER
TOTA
LLE
SS
RA
TED
D
EC
. 31
STU
DE
NTS
TIO
NA
LP
ILO
TP
RIV
ATE
CO
MM
ER
CIA
LTR
AN
SP
OR
TO
NLY
ON
LYP
ILO
TSA
T P
ILO
TSP
ILO
TS1
His
toric
al*
2000
93,0
6434
0N
/A25
1,56
112
1,85
814
1,59
67,
775
9,38
762
5,58
148
3,98
531
1,94
4
2005
87,2
1327
813
422
8,61
912
0,61
414
1,99
29,
518
21,3
6960
9,73
746
7,74
531
1,50
020
0684
,866
239
939
219,
233
117,
610
141,
935
10,6
9021
,597
597,
109
455,
174
309,
333
2007
84,3
3923
92,
031
211,
096
115,
127
143,
953
12,2
9021
,274
590,
349
446,
396
309,
865
2008
80,9
8925
22,
623
222,
596
124,
746
146,
838
14,6
4721
,055
613,
746
466,
908
325,
247
2009
72,2
8023
43,
248
211,
619
125,
738
144,
600
15,2
9821
,268
594,
285
449,
685
323,
495
2010
1
19,1
19 2
212
3,68
220
2,02
012
3,70
514
2,19
815
,377
21,2
7562
7,58
848
5,39
031
8,00
120
1111
8,65
722
74,
066
194,
441
120,
865
142,
511
15,2
2021
,141
617,
128
474,
617
314,
122
Fore
cast
2012
117,
340
230
4,80
019
3,00
011
9,20
014
2,50
015
,225
21,1
6561
3,46
047
0,96
031
2,55
020
1311
6,14
023
05,
550
192,
200
114,
250
143,
100
15,3
6521
,200
608,
035
464,
935
312,
100
2014
115,
050
230
5,85
019
1,30
011
8,60
014
3,70
015
,630
21,2
2061
1,58
046
7,88
031
2,30
020
1511
4,11
523
06,
150
190,
550
118,
950
144,
500
16,0
0021
,260
611,
755
467,
255
312,
950
2016
113,
335
230
6,50
018
9,80
011
9,00
014
5,20
016
,445
21,2
7561
1,78
546
6,58
531
3,85
0
2017
112,
765
230
6,85
018
9,25
011
9,05
014
5,90
016
,955
21,3
1561
2,31
546
6,41
531
4,90
020
1811
2,37
023
07,
200
188,
850
119,
200
146,
600
17,5
5021
,350
613,
350
466,
750
316,
050
2019
112,
105
230
7,60
018
8,75
011
9,45
014
7,40
018
,150
21,3
9061
5,07
546
7,67
531
7,25
020
2011
1,95
023
08,
000
188,
800
119,
750
148,
100
18,8
0021
,405
617,
035
468,
935
318,
500
2021
111,
820
225
8,40
018
9,10
012
0,15
014
8,90
019
,450
21,4
4561
9,49
047
0,59
031
9,75
0
2022
111,
860
225
8,80
018
9,60
012
0,65
014
9,80
020
,100
21,4
8062
2,51
547
2,71
532
1,15
020
2311
1,96
022
59,
200
190,
300
121,
250
150,
700
20,8
0021
,520
625,
955
475,
255
322,
650
2024
112,
225
225
9,65
019
1,25
012
2,00
015
1,60
021
,550
21,5
3563
0,03
547
8,43
532
4,20
020
2511
2,68
522
510
,100
192,
250
122,
750
152,
600
22,3
0021
,570
634,
480
481,
880
325,
850
2026
113,
230
220
10,6
0019
3,25
012
3,55
015
3,60
023
,100
21,6
1063
9,16
048
5,56
032
7,60
0
2027
113,
830
220
11,1
0019
4,30
012
4,45
015
4,70
023
,900
21,6
4564
4,14
548
9,44
532
9,40
020
2811
4,43
022
011
,600
195,
400
125,
450
155,
700
24,7
5021
,680
649,
230
493,
530
331,
250
2029
114,
965
220
12,1
5019
6,30
012
6,50
015
6,80
025
,600
21,7
0065
4,23
549
7,43
533
3,20
020
3011
5,52
022
012
,700
197,
350
127,
600
158,
000
26,4
5021
,735
659,
575
501,
575
335,
300
2031
116,
100
220
13,3
0019
8,25
012
8,80
015
9,10
027
,350
21,7
7066
4,89
050
5,79
033
7,45
020
3211
6,72
022
013
,900
199,
300
130,
100
160,
300
28,2
5021
,805
670,
595
510,
295
339,
700
Avg
Ann
ual G
row
th20
00-1
12.
2%-3
.6%
NA
-2.3
%-0
.1%
0.1%
6.3%
7.7%
-0.1
%-0
.2%
0.1%
2011
-12
-1.1
%1.
3%18
.1%
-0.7
%-1
.4%
0.0%
0.0%
0.1%
-0.6
%-0
.8%
-0.5
%20
11-2
1-0
.6%
-0.1
%7.
5%-0
.3%
-0.1
%0.
4%2.
5%0.
1%0.
0%-0
.1%
0.2%
2011
-32
-0.1
%-0
.1%
6.0%
0.1%
0.4%
0.6%
3.0%
0.1%
0.4%
0.3%
0.4%
* S
ourc
e: F
AA
U.S
. Civi
l Airm
en S
tatis
tics.
1 Inst
rum
ent r
ated
pilo
ts s
houl
d no
t be
adde
d to
oth
er c
ateg
orie
s in
der
iving
tota
l.2 In
Jul
y 20
10, t
he F
AA
issu
ed a
rule
that
incr
ease
d th
e du
ratio
n of
val
idity
for s
tude
nt p
ilot c
ertif
icat
es fo
r pilo
ts u
nder
the
age
of 4
0 fro
m 3
6 to
60
mon
ths.
Th
is re
sulte
d in
the
incr
ease
in a
ctive
stu
dent
pilo
ts to
119
,119
from
72,
280
at th
e en
d of
200
9.N
ote:
An
activ
e pi
lot i
s a
pers
on w
ith a
pilo
t cer
tific
ate
and
a va
lid m
edic
al c
ertif
icat
e.
AC
TIVE
PIL
OTS
BY
TYP
E O
F C
ERTI
FIC
ATE
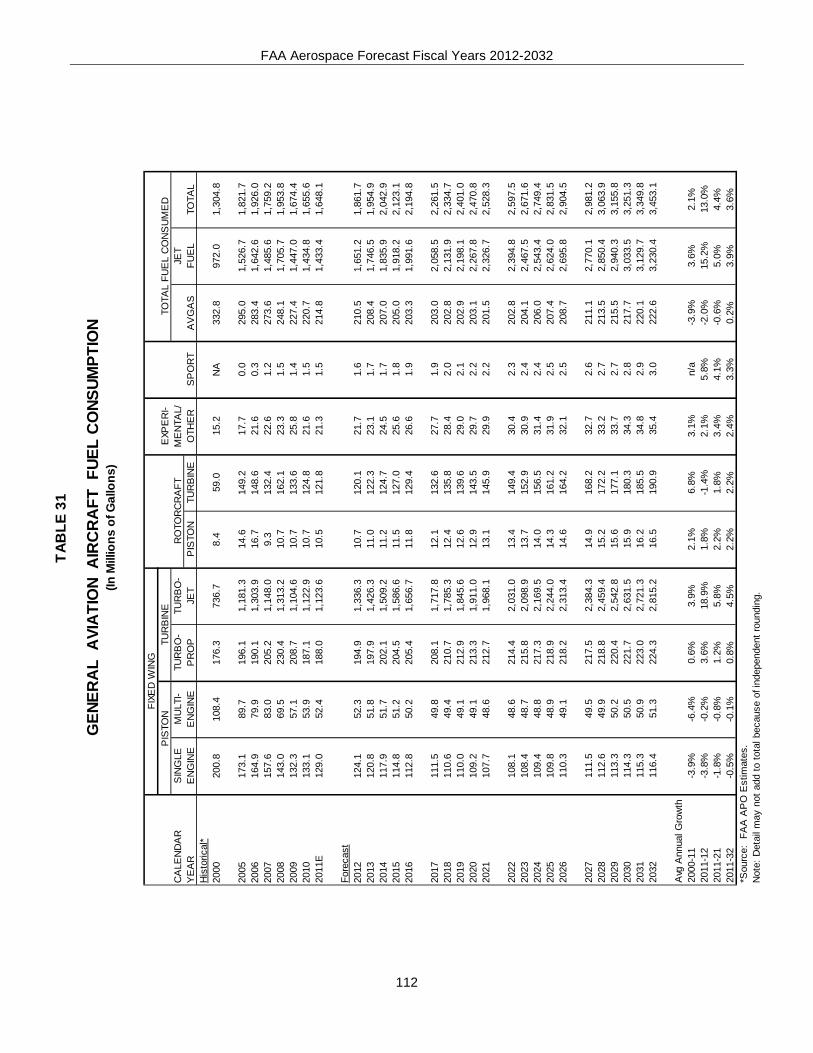
FAA Aerospace Forecast Fiscal Years 2012-2032
112
TAB
LE 3
1
(In M
illio
ns o
f Gal
lons
)
FIXE
D W
ING
PIS
TON
EXP
ER
I-C
ALE
ND
AR
SIN
GLE
MU
LTI-
TUR
BO
-TU
RB
O-
RO
TOR
CR
AFT
ME
NTA
L/JE
TY
EA
RE
NG
INE
EN
GIN
EP
RO
PJE
TP
ISTO
NTU
RB
INE
OTH
ER
SP
OR
TA
VG
AS
FUE
LTO
TAL
His
toric
al*
2000
200.
810
8.4
176.
373
6.7
8.4
59.0
15.2
NA
332.
897
2.0
1,30
4.8
2005
173.
189
.719
6.1
1,18
1.3
14.6
149.
217
.70.
029
5.0
1,52
6.7
1,82
1.7
2006
164.
979
.919
0.1
1,30
3.9
16.7
148.
621
.60.
328
3.4
1,64
2.6
1,92
6.0
2007
157.
683
.020
5.2
1,14
8.0
9.3
132.
422
.61.
227
3.6
1,48
5.6
1,75
9.2
2008
143.
069
.523
0.4
1,31
3.2
10.7
162.
123
.31.
524
8.1
1,70
5.7
1,95
3.8
2009
132.
357
.120
8.7
1,10
4.6
10.7
133.
625
.81.
422
7.4
1,44
7.0
1,67
4.4
2010
133.
153
.918
7.1
1,12
2.9
10.7
124.
821
.61.
522
0.7
1,43
4.8
1,65
5.6
2011
E12
9.0
52.4
188.
01,
123.
610
.512
1.8
21.3
1.5
214.
81,
433.
41,
648.
1
Fore
cast
2012
124.
152
.319
4.9
1,33
6.3
10.7
120.
121
.71.
621
0.5
1,65
1.2
1,86
1.7
2013
120.
851
.819
7.9
1,42
6.3
11.0
122.
323
.11.
720
8.4
1,74
6.5
1,95
4.9
2014
117.
951
.720
2.1
1,50
9.2
11.2
124.
724
.51.
720
7.0
1,83
5.9
2,04
2.9
2015
114.
851
.220
4.5
1,58
6.6
11.5
127.
025
.61.
820
5.0
1,91
8.2
2,12
3.1
2016
112.
850
.220
5.4
1,65
6.7
11.8
129.
426
.61.
920
3.3
1,99
1.6
2,19
4.8
2017
111.
549
.820
8.1
1,71
7.8
12.1
132.
627
.71.
920
3.0
2,05
8.5
2,26
1.5
2018
110.
649
.421
0.7
1,78
5.3
12.4
135.
828
.42.
020
2.8
2,13
1.9
2,33
4.7
2019
110.
049
.121
2.9
1,84
5.6
12.6
139.
629
.02.
120
2.9
2,19
8.1
2,40
1.0
2020
109.
249
.121
3.3
1,91
1.0
12.9
143.
529
.72.
220
3.1
2,26
7.8
2,47
0.8
2021
107.
748
.621
2.7
1,96
8.1
13.1
145.
929
.92.
220
1.5
2,32
6.7
2,52
8.3
2022
108.
148
.621
4.4
2,03
1.0
13.4
149.
430
.42.
320
2.8
2,39
4.8
2,59
7.5
2023
108.
448
.721
5.8
2,09
8.9
13.7
152.
930
.92.
420
4.1
2,46
7.5
2,67
1.6
2024
109.
448
.821
7.3
2,16
9.5
14.0
156.
531
.42.
420
6.0
2,54
3.4
2,74
9.4
2025
109.
848
.921
8.9
2,24
4.0
14.3
161.
231
.92.
520
7.4
2,62
4.0
2,83
1.5
2026
110.
349
.121
8.2
2,31
3.4
14.6
164.
232
.12.
520
8.7
2,69
5.8
2,90
4.5
2027
111.
549
.521
7.5
2,38
4.3
14.9
168.
232
.72.
621
1.1
2,77
0.1
2,98
1.2
2028
112.
649
.921
8.8
2,45
9.4
15.2
172.
233
.22.
721
3.5
2,85
0.4
3,06
3.9
2029
113.
350
.222
0.4
2,54
2.8
15.6
177.
133
.72.
721
5.5
2,94
0.3
3,15
5.8
2030
114.
350
.522
1.7
2,63
1.5
15.9
180.
334
.32.
821
7.7
3,03
3.5
3,25
1.3
2031
115.
350
.922
3.0
2,72
1.3
16.2
185.
534
.82.
922
0.1
3,12
9.7
3,34
9.8
2032
116.
451
.322
4.3
2,81
5.2
16.5
190.
935
.43.
022
2.6
3,23
0.4
3,45
3.1
Avg
Ann
ual G
row
th20
00-1
1-3
.9%
-6.4
%0.
6%3.
9%2.
1%6.
8%3.
1%n/
a-3
.9%
3.6%
2.1%
2011
-12
-3.8
%-0
.2%
3.6%
18.9
%1.
8%-1
.4%
2.1%
5.8%
-2.0
%15
.2%
13.0
%20
11-2
1-1
.8%
-0.8
%1.
2%5.
8%2.
2%1.
8%3.
4%4.
1%-0
.6%
5.0%
4.4%
2011
-32
-0.5
%-0
.1%
0.8%
4.5%
2.2%
2.2%
2.4%
3.3%
0.2%
3.9%
3.6%
*Sou
rce:
FA
A A
PO
Est
imat
es.
Not
e: D
etai
l may
not
add
to to
tal b
ecau
se o
f ind
epen
dent
roun
ding
.
TOTA
L FU
EL
CO
NS
UM
ED
TUR
BIN
E
GEN
ERA
L A
VIA
TIO
N A
IRC
RA
FT F
UEL
CO
NSUM
PTIO
N

FAA Aerospace Forecast Fiscal Years 2012-2032
113
TAB
LE 3
2
(In T
hous
ands
)
FIS
CA
LA
IRA
IR T
AXI
/G
EN
ER
AL
AV
IATI
ON
MIL
ITA
RY
NU
MB
ER
OF
TOW
ER
SY
EA
RC
AR
RIE
RC
OM
MU
TER
ITIN
ER
AN
TLO
CA
LTO
TAL
ITIN
ER
AN
TLO
CA
LTO
TAL
TOTA
LFA
AC
ON
TRA
CT
His
toric
al*
2000
15,1
58.7
10,7
60.5
22,8
44.1
17,0
34.4
39,8
78.5
1,43
9.8
1,44
8.2
2,88
8.0
68,6
85.7
266
192
2005
13,5
33.6
12,5
50.5
19,3
03.2
14,8
43.6
34,1
46.8
1,41
4.5
1,44
9.2
2,86
3.7
63,0
94.6
264
229
2006
13,2
56.3
11,9
67.6
18,7
07.1
14,3
65.4
33,0
72.5
1,35
8.4
1,41
7.3
2,77
5.7
61,0
72.1
263
231
2007
13,6
11.2
11,6
67.3
18,5
75.2
14,5
56.8
33,1
32.0
1,31
3.9
1,40
5.7
2,71
9.5
61,1
30.0
264
235
2008
13,7
80.1
11,0
32.1
17,4
92.7
14,0
81.2
31,5
73.8
1,28
5.0
1,24
5.6
2,53
0.6
58,9
16.6
264
239
2009
12,8
36.4
9,52
0.8
15,5
71.1
12,4
48.0
28,0
19.0
1,30
5.2
1,28
0.4
2,58
5.5
52,9
61.7
264
244
2010
12,6
57.6
9,41
0.4
14,8
63.9
11,7
16.3
26,5
80.1
1,30
9.0
1,29
7.9
2,60
6.9
51,2
55.0
264
244
2011
E12
,866
.09,
278.
514
,527
.911
,437
.025
,964
.91,
319.
01,
311.
32,
630.
350
,739
.826
424
8
Fore
cast
2012
12,8
87.3
9,21
7.2
14,2
35.6
11,1
55.6
25,3
91.2
1,31
9.0
1,31
1.3
2,63
0.3
50,1
26.0
264
248
2013
13,1
80.5
9,34
9.2
14,2
90.8
11,2
08.9
25,4
99.7
1,31
9.0
1,31
1.3
2,63
0.3
50,6
59.6
264
248
2014
13,5
47.8
9,54
9.9
14,3
47.6
11,2
62.6
25,6
10.2
1,31
8.9
1,31
1.3
2,63
0.2
51,3
38.1
264
248
2015
13,9
24.2
9,74
5.6
14,4
03.9
11,3
16.8
25,7
20.7
1,31
8.9
1,31
1.3
2,63
0.2
52,0
20.7
264
248
2016
14,2
86.7
9,93
5.1
14,4
60.7
11,3
71.4
25,8
32.1
1,31
8.9
1,31
1.3
2,63
0.2
52,6
84.1
264
248
2017
14,5
65.3
10,0
87.1
14,5
18.0
11,4
26.5
25,9
44.5
1,31
8.9
1,31
1.3
2,63
0.2
53,2
27.0
264
248
2018
14,8
49.6
10,2
42.4
14,5
75.8
11,4
82.2
26,0
58.0
1,31
8.9
1,31
1.3
2,63
0.1
53,7
80.1
264
248
2019
15,1
37.8
10,3
97.6
14,6
34.2
11,5
38.5
26,1
72.7
1,31
8.8
1,31
1.2
2,63
0.1
54,3
38.2
264
248
2020
15,4
32.3
10,5
56.1
14,6
93.1
11,5
95.2
26,2
88.3
1,31
8.8
1,31
1.2
2,63
0.1
54,9
06.7
264
248
2021
15,7
33.3
10,7
17.9
14,7
52.5
11,6
52.5
26,4
05.0
1,31
8.8
1,31
1.2
2,63
0.0
55,4
86.3
264
248
2022
16,0
37.1
10,8
83.1
14,8
12.5
11,7
10.4
26,5
22.9
1,31
8.8
1,31
1.2
2,63
0.0
56,0
73.1
264
248
2023
16,3
47.8
11,0
51.8
14,8
73.0
11,7
68.9
26,6
41.9
1,31
8.8
1,31
1.2
2,63
0.0
56,6
71.4
264
248
2024
16,6
65.6
11,2
24.1
14,9
34.0
11,8
27.9
26,7
61.9
1,31
8.8
1,31
1.2
2,63
0.0
57,2
81.6
264
248
2025
16,9
90.8
11,4
00.0
14,9
95.7
11,8
87.5
26,8
83.2
1,31
8.7
1,31
1.2
2,62
9.9
57,9
03.9
264
248
2026
17,3
23.5
11,5
79.7
15,0
57.9
11,9
47.6
27,0
05.5
1,31
8.7
1,31
1.2
2,62
9.9
58,5
38.6
264
248
2027
17,6
63.9
11,7
63.3
15,1
20.7
12,0
08.4
27,1
29.1
1,31
8.7
1,31
1.2
2,62
9.9
59,1
86.1
264
248
2028
18,0
12.2
11,9
50.8
15,1
84.1
12,0
69.8
27,2
53.9
1,31
8.7
1,31
1.2
2,62
9.9
59,8
46.8
264
248
2029
18,3
68.7
12,1
42.3
15,2
48.2
12,1
31.8
27,3
80.0
1,31
8.7
1,31
1.2
2,62
9.8
60,5
20.8
264
248
2030
18,7
33.6
12,3
38.0
15,3
12.8
12,1
94.4
27,5
07.2
1,31
8.6
1,31
1.2
2,62
9.8
61,2
08.6
264
248
2031
19,1
07.1
12,5
38.0
15,3
78.0
12,2
57.6
27,6
35.6
1,31
8.6
1,31
1.2
2,62
9.8
61,9
10.5
264
248
2032
19,4
89.7
12,7
42.3
15,4
43.9
12,3
21.5
27,7
65.4
1,31
8.6
1,31
1.1
2,62
9.8
62,6
27.2
264
248
Avg
Ann
ual G
row
th20
00-1
1-1
.5%
-1.3
%-4
.0%
-3.6
%-3
.8%
-0.8
%-0
.9%
-0.8
%-2
.7%
2011
-12
0.2%
-0.7
%-2
.0%
-2.5
%-2
.2%
0.0%
0.0%
0.0%
-1.2
%20
11-2
12.
0%1.
5%0.
2%0.
2%0.
2%0.
0%0.
0%0.
0%0.
9%20
11-3
22.
0%1.
5%0.
3%0.
4%0.
3%0.
0%0.
0%0.
0%1.
0%*
Sou
rce:
FA
A A
ir Tr
affic
Act
ivity
.
TOTA
L C
OM
BIN
ED A
IRC
RA
FT O
PER
ATI
ONS
AT
AIR
POR
TS
WIT
H F
AA
AND
CO
NTR
AC
T TR
AFF
IC C
ONT
RO
L SE
RVI
CE
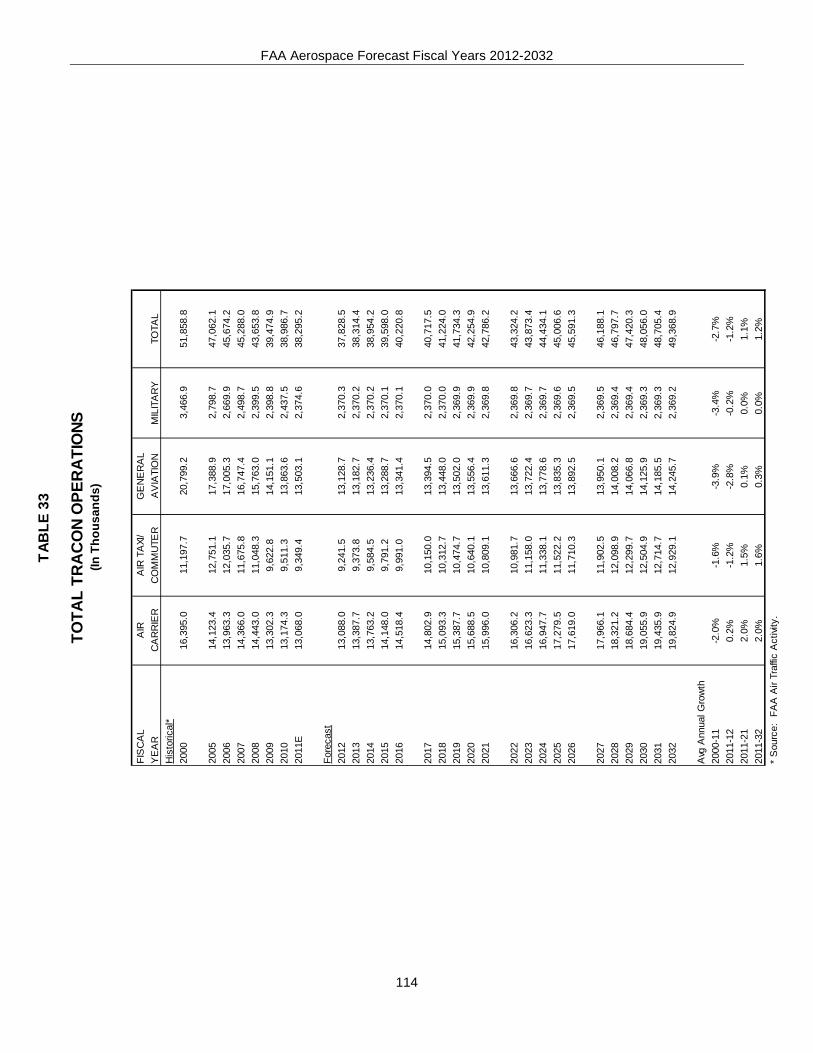
FAA Aerospace Forecast Fiscal Years 2012-2032
114
TAB
LE 3
3
(In T
hous
ands
)
FIS
CA
LA
IRA
IR T
AXI
/G
EN
ER
AL
YE
AR
CA
RR
IER
CO
MM
UTE
RA
VIA
TIO
NM
ILIT
AR
YTO
TAL
His
toric
al*
2000
16,3
95.0
11,1
97.7
20,7
99.2
3,46
6.9
51,8
58.8
2005
14,1
23.4
12,7
51.1
17,3
88.9
2,79
8.7
47,0
62.1
2006
13,9
63.3
12,0
35.7
17,0
05.3
2,66
9.9
45,6
74.2
2007
14,3
66.0
11,6
75.8
16,7
47.4
2,49
8.7
45,2
88.0
2008
14,4
43.0
11,0
48.3
15,7
63.0
2,39
9.5
43,6
53.8
2009
13,3
02.3
9,62
2.8
14,1
51.1
2,39
8.8
39,4
74.9
2010
13,1
74.3
9,51
1.3
13,8
63.6
2,43
7.5
38,9
86.7
2011
E13
,068
.09,
349.
413
,503
.12,
374.
638
,295
.2
Fore
cast
2012
13,0
88.0
9,24
1.5
13,1
28.7
2,37
0.3
37,8
28.5
2013
13,3
87.7
9,37
3.8
13,1
82.7
2,37
0.2
38,3
14.4
2014
13,7
63.2
9,58
4.5
13,2
36.4
2,37
0.2
38,9
54.2
2015
14,1
48.0
9,79
1.2
13,2
88.7
2,37
0.1
39,5
98.0
2016
14,5
18.4
9,99
1.0
13,3
41.4
2,37
0.1
40,2
20.8
2017
14,8
02.9
10,1
50.0
13,3
94.5
2,37
0.0
40,7
17.5
2018
15,0
93.3
10,3
12.7
13,4
48.0
2,37
0.0
41,2
24.0
2019
15,3
87.7
10,4
74.7
13,5
02.0
2,36
9.9
41,7
34.3
2020
15,6
88.5
10,6
40.1
13,5
56.4
2,36
9.9
42,2
54.9
2021
15,9
96.0
10,8
09.1
13,6
11.3
2,36
9.8
42,7
86.2
2022
16,3
06.2
10,9
81.7
13,6
66.6
2,36
9.8
43,3
24.2
2023
16,6
23.3
11,1
58.0
13,7
22.4
2,36
9.7
43,8
73.4
2024
16,9
47.7
11,3
38.1
13,7
78.6
2,36
9.7
44,4
34.1
2025
17,2
79.5
11,5
22.2
13,8
35.3
2,36
9.6
45,0
06.6
2026
17,6
19.0
11,7
10.3
13,8
92.5
2,36
9.5
45,5
91.3
2027
17,9
66.1
11,9
02.5
13,9
50.1
2,36
9.5
46,1
88.1
2028
18,3
21.2
12,0
98.9
14,0
08.2
2,36
9.4
46,7
97.7
2029
18,6
84.4
12,2
99.7
14,0
66.8
2,36
9.4
47,4
20.3
2030
19,0
55.9
12,5
04.9
14,1
25.9
2,36
9.3
48,0
56.0
2031
19,4
35.9
12,7
14.7
14,1
85.5
2,36
9.3
48,7
05.4
2032
19,8
24.9
12,9
29.1
14,2
45.7
2,36
9.2
49,3
68.9
Avg
Ann
ual G
row
th20
00-1
1-2
.0%
-1.6
%-3
.9%
-3.4
%-2
.7%
2011
-12
0.2%
-1.2
%-2
.8%
-0.2
%-1
.2%
2011
-21
2.0%
1.5%
0.1%
0.0%
1.1%
2011
-32
2.0%
1.6%
0.3%
0.0%
1.2%
* S
ourc
e: F
AA
Air
Traf
fic A
ctivi
ty.
TOTA
L TR
AC
ON
OPE
RA
TIO
NS

FAA Aerospace Forecast Fiscal Years 2012-2032
115
TAB
LE 3
4
(In T
hous
ands
)
IFR
AIR
CR
AFT
HA
ND
LED
FIS
CA
LA
IRA
IR T
AXI
/G
EN
ER
AL
YE
AR
CA
RR
IER
CO
MM
UTE
RA
VIA
TIO
NM
ILIT
AR
Y
TO
TAL
His
toric
al*
2000
24,9
87.0
8,10
0.9
8,74
4.3
4,19
2.5
46,0
24.8
2005
25,0
04.6
10,0
53.9
8,36
7.7
4,05
2.0
47,4
78.1
2006
24,3
94.5
9,43
6.7
8,19
7.0
4,14
9.7
46,1
77.8
2007
25,0
06.2
9,65
2.9
8,29
4.3
3,80
3.3
46,7
56.7
2008
23,8
95.3
10,1
79.0
7,67
0.7
3,64
9.2
45,3
94.1
2009
22,4
06.8
8,56
1.8
6,33
1.8
2,99
3.0
40,2
93.5
2010
22,3
41.5
8,62
3.8
6,55
0.3
2,98
2.2
40,4
97.8
2011
E23
,431
.79,
010.
46,
557.
32,
227.
641
,227
.1
Fore
cast
2012
23,5
39.4
8,94
4.8
6,46
8.3
2,22
7.6
41,1
80.0
2013
24,2
18.4
9,10
8.6
6,48
3.0
2,22
7.6
42,0
37.6
2014
24,9
70.5
9,29
8.9
6,54
2.4
2,22
7.6
43,0
39.3
2015
25,8
15.1
9,50
9.8
6,61
1.1
2,22
7.6
44,1
63.6
2016
26,6
10.7
9,73
1.9
6,68
5.6
2,22
7.6
45,2
55.8
2017
27,2
81.6
9,90
6.1
6,72
7.8
2,22
7.6
46,1
43.1
2018
27,9
49.6
10,0
75.0
6,77
2.3
2,22
7.6
47,0
24.6
2019
28,6
36.0
10,2
47.0
6,81
6.4
2,22
7.6
47,9
27.0
2020
29,3
29.3
10,4
24.6
6,86
3.4
2,22
7.6
48,8
44.8
2021
30,0
42.4
10,6
16.6
6,91
4.2
2,22
7.6
49,8
00.8
2022
30,7
65.2
10,8
08.8
6,96
5.9
2,22
7.6
50,7
67.5
2023
31,5
10.0
11,0
05.8
7,02
0.8
2,22
7.6
51,7
64.3
2024
32,2
75.0
11,2
06.9
7,07
9.3
2,22
7.6
52,7
88.8
2025
33,0
60.2
11,4
15.5
7,14
1.5
2,22
7.6
53,8
44.7
2026
33,8
67.8
11,6
28.8
7,20
7.5
2,22
7.6
54,9
31.7
2027
34,6
99.2
11,8
47.2
7,27
7.7
2,22
7.6
56,0
51.8
2028
35,5
48.8
12,0
77.0
7,35
2.1
2,22
7.6
57,2
05.5
2029
36,4
23.5
12,3
12.4
7,43
0.9
2,22
7.6
58,3
94.5
2030
37,3
24.0
12,5
53.7
7,51
4.3
2,22
7.6
59,6
19.6
2031
38,2
51.3
12,8
01.0
7,60
2.5
2,22
7.6
60,8
82.5
2032
39,2
06.3
13,0
54.7
7,69
5.7
2,22
7.6
62,1
84.3
Avg
Ann
ual G
row
th20
00-1
1-0
.6%
1.0%
-2.6
%-5
.6%
-1.0
%20
11-1
20.
5%-0
.7%
-1.4
%0.
0%-0
.1%
2011
-21
2.5%
1.7%
0.5%
0.0%
1.9%
2011
-32
2.5%
1.8%
0.8%
0.0%
2.0%
* S
ourc
e: F
AA
Air
Traf
fic A
ctivi
ty.IF
R A
IRC
RA
FT H
AND
LED
AT
FA
A E
N R
OUT
E T
RA
FFIC
CO
NTR
OL
CEN
TER
S